Phenotypic taxonomy and metabolite profiling in microbial drug discovery
24
REVIEW NPR www.rsc.org/npr Phenotypic taxonomy and metabolite profiling in microbial drug discovery Thomas O. Larsen, Jørn Smedsgaard, Kristian F. Nielsen, Michael E. Hansen and Jens C. Frisvad Center for Microbial Biotechnology, BioCentrum, Technical University of Denmark, DK-2800, Kgs. Lyngby, Denmark Received (in Cambridge, UK) 30th September 2005 First published as an Advance Article on the web 7th November 2005 Covering: up to October 2005 Microorganisms and in particular actinomycetes and microfungi are known to produce a vast number of bioactive secondary metabolites. For industrially important fungal genera such as Penicillium and Aspergillus the production of these compounds has been demonstrated to be very consistent at the species level. This means that direct metabolite profiling techniques such as direct injection mass spectrometry or NMR can easily be used for chemotyping/ metabolomics of strains from both culture collections and natural samples using modern informatics tools. In this review we discuss chemotyping/metabolomics as part of intelligent screening and highlight how it can be used for identification and classification of filamentous fungi and for the discovery of novel compounds when used in combination with modern methods for dereplication. In our opinion such approaches will be important for future effective drug discovery strategies, especially for dereplication of culture collections in order to avoid redundancy in the selection of species. This will maximize the chemical diversity of the microbial natural product libraries that can be generated from fungal collections. 1. The potential of microbial natural products in drug discovery 1.1 Antibiotics 2. Microbial biodiversity 2.1 Marine microorganisms 2.2 Terrestrial and insecticidal microorganisms 2.3 Non-culturable organisms 2.4 Molecular genetics and metabolic engineering 3. Chemotaxonomy and chemo-consistency 3.1 Fungal species specific production of profiles of NPs 3.2 Chemo-consistency 3.3 Phylogeny and classification: is production of natural products homoplastic? Thomas O. Larsen was born in Slagelse, Denmark in 1963. He studied chemical engineering at the Technical University of Denmark (DTU) with focus on organic chemistry and microbiology. After a job at Danisco A/S working on aroma synthesis he returned to DTU to study fungal volatile production, supervised by Professor Jens C. Frisvad and received his PhD in 1994. After this he joined the Marine Chemistry Group at the University of Copenhagen, headed by Reader Carsten Christophersen where he was trained as a classical natural product chemist. In 2001 he stayed for seven months with Dr Nigel Perry, Crop & Food Research, University of Otago, Dunedin, New Zealand. Currently he holds a position as associate professor at BioCentrum-DTU, at the Center for Microbial Biotechnology (CMB). Jørn Smedsgaard was born just outside Copenhagen, Denmark, in 1959. He studied at the DTU focusing on analytical chemistry. After a master’s project focusing on enzyme kinetics studied by NMR in 1986, JS took a detour around a commercial environmental analytical lab, before he set out to establish a mass spectrometry facility at the Agricultural University as a research assistance. In 1991 he returned to DTU to set-up a mass spectrometric facility at the Department of Biotechnology (now BioCentrum) and at the same time given the opportunity to do a PhD study supervised by Professor Jens Frisvad. JS received a PhD degree in 1996 for a chemotaxonomic study of Penicillium species by direct infusion mass spectrometry. Currently JS holds a position as associate professor at BioCentrum-DTUand is acting manager for the analytic metabolite profiling facility. Thomas O. Larsen Jørn Smedsgaard 3.4 Microbial physiology 4. The chemotaxonomy based drug discovery process 5. Morphology based strain selection—image analysis 6. Strategies and methodologies for metabolite profiling and target analysis 6.1 Chemical profiling—TLC 6.2 Direct infusion electrospray mass spectrometry 6.3 Target analysis and dereplication by MS 6.4 Chemical image analysis—UV spectral analysis 6.5 Dereplication and partial identification of NPs by UV-based techniques 6.6 Metabolite fingerprinting, profiling and target analysis by NMR DOI: 10.1039/b404943h 672 Nat. Prod. Rep. , 2005, 22 , 672–695 This journal is © The Royal Society of Chemistry 2005
-
Upload
independent -
Category
Documents
-
view
0 -
download
0
Transcript of Phenotypic taxonomy and metabolite profiling in microbial drug discovery

R E V I E W
NPR
ww
w.rsc.o
rg/n
pr
Phenotypic taxonomy and metabolite profiling in microbialdrug discovery
Thomas O. Larsen, Jørn Smedsgaard, Kristian F. Nielsen, Michael E. Hansen andJens C. FrisvadCenter for Microbial Biotechnology, BioCentrum, Technical University of Denmark, DK-2800,Kgs. Lyngby, Denmark
Received (in Cambridge, UK) 30th September 2005First published as an Advance Article on the web 7th November 2005
Covering: up to October 2005
Microorganisms and in particular actinomycetes and microfungi are known to produce a vast number of bioactivesecondary metabolites. For industrially important fungal genera such as Penicillium and Aspergillus the production ofthese compounds has been demonstrated to be very consistent at the species level. This means that direct metaboliteprofiling techniques such as direct injection mass spectrometry or NMR can easily be used for chemotyping/metabolomics of strains from both culture collections and natural samples using modern informatics tools. In thisreview we discuss chemotyping/metabolomics as part of intelligent screening and highlight how it can be used foridentification and classification of filamentous fungi and for the discovery of novel compounds when used incombination with modern methods for dereplication. In our opinion such approaches will be important for futureeffective drug discovery strategies, especially for dereplication of culture collections in order to avoid redundancy inthe selection of species. This will maximize the chemical diversity of the microbial natural product libraries that canbe generated from fungal collections.
1. The potential of microbial natural products in drugdiscovery
1.1 Antibiotics2. Microbial biodiversity2.1 Marine microorganisms2.2 Terrestrial and insecticidal microorganisms2.3 Non-culturable organisms2.4 Molecular genetics and metabolic engineering3. Chemotaxonomy and chemo-consistency3.1 Fungal species specific production of profiles of NPs3.2 Chemo-consistency3.3 Phylogeny and classification: is production of natural
products homoplastic?
Thomas O. Larsen was born in Slagelse, Denmark in 1963. He studied chemical engineering at the Technical University of Denmark(DTU) with focus on organic chemistry and microbiology. After a job at Danisco A/S working on aroma synthesis he returned to DTUto study fungal volatile production, supervised by Professor Jens C. Frisvad and received his PhD in 1994. After this he joined the MarineChemistry Group at the University of Copenhagen, headed by Reader Carsten Christophersen where he was trained as a classical naturalproduct chemist. In 2001 he stayed for seven months with Dr Nigel Perry, Crop & Food Research, University of Otago, Dunedin, NewZealand. Currently he holds a position as associate professor at BioCentrum-DTU, at the Center for Microbial Biotechnology (CMB).
Jørn Smedsgaard was born just outside Copenhagen, Denmark, in 1959. He studied at the DTU focusing on analytical chemistry. Aftera master’s project focusing on enzyme kinetics studied by NMR in 1986, JS took a detour around a commercial environmental analyticallab, before he set out to establish a mass spectrometry facility at the Agricultural University as a research assistance. In 1991 he returnedto DTU to set-up a mass spectrometric facility at the Department of Biotechnology (now BioCentrum) and at the same time given theopportunity to do a PhD study supervised by Professor Jens Frisvad. JS received a PhD degree in 1996 for a chemotaxonomic study ofPenicillium species by direct infusion mass spectrometry. Currently JS holds a position as associate professor at BioCentrum-DTU andis acting manager for the analytic metabolite profiling facility.
Thomas O. Larsen Jørn Smedsgaard
3.4 Microbial physiology4. The chemotaxonomy based drug discovery process5. Morphology based strain selection—image analysis6. Strategies and methodologies for metabolite profiling
and target analysis6.1 Chemical profiling—TLC6.2 Direct infusion electrospray mass spectrometry6.3 Target analysis and dereplication by MS6.4 Chemical image analysis—UV spectral analysis6.5 Dereplication and partial identification of NPs by
UV-based techniques6.6 Metabolite fingerprinting, profiling and target
analysis by NMR
DOI:
10.1
039/
b40
4943
h
6 7 2 N a t . P r o d . R e p . , 2 0 0 5 , 2 2 , 6 7 2 – 6 9 5 T h i s j o u r n a l i s © T h e R o y a l S o c i e t y o f C h e m i s t r y 2 0 0 5

Kristian F. Nielsen was born just outside Copenhagen, Denmark in 1972. He studied chemical and biotech engineering at the DTU withfocus on analytical chemistry and microbiology. In collaboration with the Danish Building Research Institute he studied fungal growthand mycotoxin production in water damaged buildings, supervised by Ulf Thrane and Suzanne Gravesen and received his PhD in 2001.In 2004 he was awarded the research price of the Society of Mycotoxin Research for his PhD work. After holding a position as associateresearch professor at BioCentrum-DTU, he has just joined Neurosearch A/S.
Michael E. Hansen was born in Nykøbing Falster, Denmark in 1970. He received an MSc degree in engineering from the Department ofInformatics and Mathematical Modelling at DTU, Kgs. Lyngby, in 1998 and a PhD degree in mathematics and statistics from the DTUin 2004. He then joined CMB as an assistant research professor. His current research interests include developing statistical methods forthe analysis, data mining and data fusion of data extracted from microbiological organisms used within biotechnological applications,e.g. metabolite profiling, drug discovery and biosystematics.
Jens C. Frisvad was born in Kgs. Lyngby, Denmark in 1952. He studied chemical engineering at the DTU with focus on organic chemistryand mycology. He received his PhD in 1982 and defended his dr. techn. thesis on “Secondary metabolites and species concepts inPenicillium and Aspergillus” in 1998. He became a full professor in Industrial Mycology at Biocentrum-DTU in 2001. In 1994 he stayedfor six months with Professor Martha Christensen, Department of Botany, University of Wyoming, Laramie to study Penicillium andAspergillus and has been visiting Dr Robert A. Samson, Centraalbureau voor Schimmelcultures, Utrecht, the Netherlands, extensivelyto collaborate on mycology and taxonomy.
Kristian F. Nielsen Michael E. Hansen Jens C. Frisvad
7. Conclusions and future perspectives8. Acknowledgements9. References
1. The potential of microbial natural products in drug discovery
Microbial natural products (NPs, or secondary metabolites)have played a pivotal role as sources for drug lead compoundsduring the last century. However, in order for natural productchemistry to continue to be competitive with purely syntheticbased discovery methods, natural product research needs tocontinually improve the efficiency of the selection, screening,dereplication, isolation and structure elucidation processes.1,2
The main intention of this review is to discuss how taxonomy andinformation on biodiversity can be used for selection of talentedmicrobial strains to be included in a screening programme andhow this together with the use of spectroscopic methods incombination with chemoinformatics can be used as part of aneffective dereplication strategy. In this review we use the termsnatural products or secondary metabolites (but not the termsspecific metabolites or idiolites). We occasionally use the broaderterm extrolites, which comprise any metabolite that is outwardsdirected in an ecological sense (they could be extracellular orin the cell wall of the organism). Extrolites can be secondarymetabolites, accumulated acids, extracellular enzymes etc.3
NPs are produced by all organisms but are mostly knownfrom plants, insects, fungi, algae and prokaryotes. All ofthese organisms coexist in ecosystems and interact with eachother in various ways in which chemistry plays a major role.Williams et al.4 proposed that all secondary metabolites servethe producing organisms by improving their survival fitness—“by acting at specific receptors in competing organisms”. On thecontrary to primary metabolites that are common in all livingcells and are involved in the formation of biomass and generationof energy, secondary metabolites are often only produced by oneor few species.
Many NPs are biologically active and have been used byman for thousands of years as traditional medicines and as
natural poisons. However, it was not until the discovery ofpenicillin G 1 from a Penicillium species about 80 years agothat fungi, actinomycetes and other microorganisms suddenlybecame a hunting ground for novel drug leads.5 Hence manypharmaceutical companies were motivated to start samplingand screening large collections of microorganisms especiallyfor antibiotics. About 20 years after the discovery of penicillinseveral other antibacterial agents such as cephalosporin C 2,chlortetracycline 3, chloramphenicol 4, and erythromycin 5had been discovered.1,6 It has been estimated that drugs thattrace their heritage to secondary metabolites have more thandoubled the lifespan of human beings.7 Apart from the use ofantibiotics to combat bacterial infectious diseases this spansheterogeneous fields such as the use of fungal NPs as immuno-suppressants during organ transplantations (cyclosporine 6), asaids for neurological diseases (asperlicin), for fungal infections(semisynthetic lead compounds derived from echinocandin B9),1 for cardiovascular and metabolic diseases (natural statincompounds such as lovastatin 7 and pravastatin 8 and syntheticanalogue compounds such as the major selling synthetic statinscrestor 10 and lipitor 11).1
For the past 10–20 years there has been a tendency in drug dis-covery programmes to favour programmes using combinatorialchemistry for generation of chemical diversity.1,8,9 The majorreason for this has been the tremendous development of highthroughput screens based on molecular targets in combinationwith automated instrument systems, robot technologies etc.However, apparently there is a growing opinion, at least amongmany natural product chemists, that combinatorial chemistryhas failed to supplant NPs as the primary source of broadchemical diversity.1,8,9 One argument is based on the fact thatthe number of new active substances has been declining duringthe last 20 years,9 and the fact that a significant number ofthe top 35 worldwide selling drugs in the years 2000–2003are natural product derived compounds (e.g. lipitor and othersynthetic antilipidemic statins).1 On the other hand combinato-rial chemistry has achieved significant success in more specificdiscovery programs used to generate focused libraries centered
N a t . P r o d . R e p . , 2 0 0 5 , 2 2 , 6 7 2 – 6 9 5 6 7 3

on core structures with desired activities, rather than findingthese from an initial lead compound. More attention is nowplaced on the quality and diversity of combinatorial libraries,and provided a starting point, such as a natural product scaffoldis available, it is clear that combinatorial chemistry is sufficientlyadvanced to accomplish parallel synthesis.10 A major advantageof using natural products as drug leads is their often extremelycomplex structure, making a total synthesis, and the synthesis oftheir analogues, a daunting task, even when cost and yield arenot important.7 Structurally natural products are more likelyto be rich in stereochemistry, concatenated polycyclic ringsand reactive functional groups, than structures generated bycombinatorial chemistry. For example it is doubtful that theb-lactam ring of the penicillins would have been discoveredby synthetic chemists just making molecules at random.11 Inaddition to the great chemical diversity produced in Nature,there are several other good reasons to choose a natural productbased drug discovery strategy. First of all it makes a lot of senseto choose NPs since such compounds have “a biological history”selected by Nature during the evolution to serve a function inspecific biological systems like binding to proteins.8,12 In otherwords NPs that are biologically active in assays are generallysmall molecules with drug-like properties such as being capableof being absorbed and metabolised by the human body. Atthe same time Nature almost always produces chiral moleculesand with the tendency of shifting towards the patenting andmarketing of chiral drugs, NPs have the natural advantage ofbeing enantiomeric.6
1.1 Antibiotics
Even though more than 30 000 diseases are clinically describedtoday less than one-third of these can be treated symptomaticallyand even a fewer can be cured.13 Hence there is an urgentneed for new therapeutic agents, with infectious disease controlas a striking example. The increasing occurrence of multi-resistant pathogenic strains has limited the effect of traditionalantimicrobial treatment, and it has created a global concernthat we may soon be facing a post-antibiotic era with reducedcapabilities to combat microbes.
One very promising new approach for antibiotics is based onthe fact that bacterial colonization and pathogenesis is facilitatedby the ability of the bacteria to communicate and thereby coordi-nate the behaviour of the entire population. Population activitysuch as biofilm formation is coordinated by simple communica-tion systems which in many Gram-negative bacteria is based onhomoserine lactone (HSL) signals, which have been described innumerous pathogens.14 HSL systems are referred to as quorumsensing (QS) systems, i.e. they express target genes in relation tothe quorum size (or density) of the population. In most knowncases QS systems control expression of virulence factors suchas biofilm formation by Pseudomonas aeruginosa in the lungs ofcystic fibrosis patients.15 A screening strategy aiming at inhibi-tion of QS is therefore not targeting bacterial growth but insteadat blocking the coordination of bacterial population activity.This means that a quorum sensing inhibiting (QSI) drug is notgenerating a selective pressure on the bacteria, and it is therefore
6 7 4 N a t . P r o d . R e p . , 2 0 0 5 , 2 2 , 6 7 2 – 6 9 5

unlikely that bacteria will develop resistance towards a given QSIcompound. Several natural quorum sensing inhibitors have beendescribed within the past ca. 10 years some of the latest being thetwo well known mycotoxins patulin and penicillic acid.16 Becausethe P. aeruginosa genome has now been fully sequenced, DNAmicroarray technologies are being used in order to study theeffects of potential new QSI hits at the transcriptional level.16
Altogether the increasing information on microbial pathogengenomes as well as the completion of the Human GenomeProject will provide thousands of disease related targets to beused in future screening for novel drug leads.13
2. Microbial biodiversity
A major potential of NPs is the fact that many natural productresources are largely unexplored, and many environmentalsamples for isolation of interesting microorganisms have oftenbeen collected without a defined strategy.17–19 Diverse habitatsare tropical forests soils, the deep sea,20,21 sites of extreme tem-perature, salinity or pH, since such habitats often generate novelmicroorganisms and therefore provide the potential for novelmetabolic pathways and compounds.13 However, at the sametime temperate ecosystems should not be excluded especiallyif novel isolation strategies such as metagenome cloning (seebelow) is used. Among others the cyclosporins and penicillinswere isolated from fungi collected in temperate regions.13 Evencold regions can be rich in fungal diversity leading to a highhit-rate of novel psychrophilic or psychrotolerant species.22,23
A number of these species have recently been investigated andfound to produce several bioactive cyclic peptides.24–26 Thesefindings support the hypothesis that fungi from colder climatesmay be just as chemically prolific (and perhaps just as diverse)as those from tropical climates, the latter which are muchmore often cited as targets for biodiversity sought in screeningprograms. In general we find that only relatively few speciesappear to be dominant in a certain habitat, leading to theisolation of high numbers of strains of the same species. Forfungi this is often referred to as the associated funga.27
2.1 Marine microorganisms
With more than 70% of the planet’s surface covered by waterthe oceans are probably the most promising habitat to explorefor novel microbial biodiversity. It has been estimated that thebiological diversity in marine ecosystems, such as the deep seafloor, is higher than in tropical rain forests.17,28–30 Since the1970’s more than 15 000 NPs have been isolated from marinemicrobes, algae and invertebrates. It seems clear that manymicroorganisms such as actinomycetes and fungi are washedfrom the shore or blown by the air into the sea.31 On the otherhand specific populations of e.g. marine adapted actinomycetessuch as Salinospora and Marinophilus have been discoveredand described recently.31 Many such organisms produce marineNPs that possess unique structural features as compared toterrestrial metabolites. Marine NPs often include a myriadof functional groups, which more than make up for some oftheir disadvantages. A major problem is that many promisingbioactive marine compounds can only be isolated in extreme lowyields, because many source organisms are difficult to culture bystandard fermentation procedures. This is because some of thesecompounds are only produced as a result of symbiosis betweene.g. an invertebrate and a microorganism.32 The advances inmolecular genetics are expected to have a great impact on marinenatural product chemistry as cloning of polyketides (PKS)or nonribosomal peptide synthetases from “difficult sources”into more amendable bacterial hosts potentially can give anunlimited supply of target compounds.32–34
2.2 Terrestrial and insecticidal microorganisms
Hawksworth35,36 has estimated that approximately 1.5 millionfungal species are present on Earth. Out of this number it is
suggested that around 100 000 valid species have been describedimplying that only about 7% of the world’s fungi have beendescribed today. Hawksworth and Rossman37 speculated whereto find all the undescribed species and suggested that many ofthem are likely to be; 1) fungi in tropical forests, and in particularendophytes that can be isolated in enormous numbers; 2) fungi inunexplored habitats such as insects; and 3) lost or hidden species,of which many isolates previously were considered a singlespecies but when studied by modern molecular or biochemicalmethods, prove to comprise several biological species.
Fungi and particularly endophytes indeed are a very promis-ing source of novel biological active compounds as reviewed bySchulz et al.,38 who found a large hit-rate of novel compoundsamong the approx. 6500 endophytic fungi that they screened forbiological activities. The pharmaceutical potential of endophyticfungi was truly verified with the finding of the taxol 12 producingendophytic fungus Taxomyces andreanae.39,40
The potential of finding new microorganisms associated withinsects seems to be immense as illustrated by the discovery ofover 200 new species of yeasts from a total of 650 isolatesfrom the guts of beetles.36 It has been estimated that up to30 million species of insects exists.41 Fungi have existed andcoevolved with insects some millions of years, and much longerthan with mammals,42,43 so from an evolutionary point of view,it seems likely that a major part of the fungal biologically activemetabolites are part of the ecological and in particular chemicaldefence system directed towards insects.44 Fungi are generallymore nutritious than plant tissue, due to higher levels of proteins,making them potentially desirable sources of foods for predatoryinsects.43 Thus predation has without doubt been one of theselective forces shaping the chemical defence systems in fungi.44
Evidence for this has been several studies on fungal sclerotiumproducing species of Aspergillus which have demonstrated thatthese compartments contain a variety of sclerotial compoundsthat cause feeding deterrence or have insecticidal effects.45–47
There are many examples of hidden species suddenly being“discovered” especially within taxonomically well studied gen-era such as Penicillium, Aspergillus and Fusarium. One recentexample is the description of the two new species P. tulipae and P.radicicola within the series Corymbifera among the terverticillatePenicillia. Both these species produce different profiles ofsecondary metabolites than the other members of the series:P. hirsutum, P. albocoremium, P. allii, P. hordei and P. venetum.48
Another important aspect concerning hidden species is the foodsafety issue of mycotoxin production. Thus the description ofnovel species closely related to already known ones might clarifyinconsistent literature information about mycotoxin production.This has clearly been the case for P. roqueforti from whichthe two new species P. carneum and P. paneum have recentlybeen described among others based on their ability to producesecondary metabolites.49–51 Importantly, only the latter twospecies can produce the mycotoxin patulin, whereas P. roqueforti,applied as a starter culture in food production, will not. The issueof hidden species in combination with the often very difficult taskfor mycologists to identify a given fungal culture to the specieslevel has meant that the literature is full of data on misidentifiedspecies. When chemistry is also reported this leads to erroneouspostulates about metabolite production as described in detail in
N a t . P r o d . R e p . , 2 0 0 5 , 2 2 , 6 7 2 – 6 9 5 6 7 5

the next section. Because of these problems many researchershave, in our opinion, come to the wrong conclusion of rejectingthe usability of metabolites for chemotyping.52
2.3 Non-culturable organisms
The fact that many microorganisms have not been discoveredso far is a major challenge for future research since only littleeffort has been addressed to the isolation and cultivation oforganisms difficult to culture. The optimal conditions for growthand secondary metabolite production vary a lot from species tospecies. Beside the general factors such as carbon, nitrogen, tracemetals, temperature, aeration, time of cultivation (see section3.4), some microorganisms may require stimulation by signalmolecules from other organisms in order to grow even whenprovided with the proper nutrients. Thus the addition of factorssuch as pyruvate, cyclic AMP and homoserine lactones haveall been demonstrated to increase the generation of greaternumbers of microorganisms.13 A second approach to increasethe diversity is the use of oligotrophic isolation media, such asthe use of seawater based media for marine organisms,31 allowingonly growth of a selected group of strains and at the same timeinhibiting the majority of the natural population.53
An alternative approach to access unculturable organisms,and in particularly prokaryotic species, is to access their DNAdirectly by cloning the metagenome.54–56 Isolated DNA is ligatedinto bacterial artificial chromosome (BAC) vectors, which arelow copy plasmids that can contain relatively large DNA inserts.The BAC vectors are then subsequently transformed into hostmicroorganisms such as E. coli. The resulting clones can thenbe screened for biological activity or alternatively be probedfor sequences of interest. This approach is expected to become apowerful resource in the future from which new chemical entitiescan be accessed for lead discovery.57
2.4 Molecular genetics and metabolic engineering
The genes coding for many natural products and in particularpolyketide synthethase (PKS) genes are modular and producemultifunctional enzymes. This has lead to new possibilities todiversify unnatural microbial NPs since it is now possible toshuffle genes around within these clusters, or even to includegenes from other pathways, thereby generating hybrid enzymescapable of synthesizing an unlimited set of new moleculesthat are difficult to make by traditional chemical methods.58–60
Polyketides such as the important compounds erythromycinand lovastatin have been manipulated with great success.61 Inorder to fully explore the potential of genetic engineering forindustrial strain development methods such as comparisonof genomic microarrays, transcription profiles and metabolicprofiles are now being used to guide yield improvement. Geneticengineering and modification of targeted pathways will withoutdoubt be very important in future work for construction ofnovel pathways and NPs.62–63 Alternatively to directed geneticmodifications novel non-natural products can also be achievedmore randomly from hybrid organisms generated by cell fusiontechniques.64
3. Chemotaxonomy and chemo-consistency
“The production of antibiotic substances by microorganisms is nota property characteristic of specific groups of organisms or evenof given species within such groups, but of a few selected strainswithin a given species”.65
“Thus, the search for novel secondary metabolites from fungibelonging to the group Nodulisporium appears to be a randomwalk in a random forest, at least once one has covered the morecommon metabolites produced by the genus”.66
“Production of similar metabolic products does not provide anadequate basis for recognition of a new taxon”.67
3.1 Fungal species specific production of profiles of NPs
When reading the three citations above, it seems to be a hopelesstask to use chemotaxonomy in the classification of filamentousfungi. Opinions on the species specificity of NPs are diverse.Some biologists claim that metabolite production is strainspecific,65,68 some biologists claim that a few NPs may be speciesspecific, but that most of them are strain specific,66 and yet otherbiologists claim that most if not all NPs are species specific andeven essential features of anyone species.69 However, in plantsNPs appear to be species specific, yet individual NPs oftenoccur among widely different species that are not phylogenet-ically related according to DNA sequence data.70 In the fungichemotaxonomy based on NPs is an extremely effective andscientifically well-founded part of fungal taxonomy, even thoughit is only used extensively in the Lichens,71 and few selectedfungal genera such as the Penicillium, Aspergillus, and Fusariumand their perfect states.72–75 The application of chemotaxonomybased on NPs in other ascomycetous fungal genera such asXylaria and Hypoxylon also give very good results,76 and ingeneral NPs have always clarified and greatly improved fungalclassifications, when included in revisions of species of differentgenera in both ascomycetous and basidiomycetous fungi.72
It is important to emphasize that species in Penicillium,Aspergillus, Fusarium, Xylaria, Hypoxylon etc. are identifiable,at least for experts, using traditional micromorphological andmacromorphological characters. Species identified based onsuch features have later been shown to produce consistent pro-files of NPs. The reason for species specificity has occasionallybeen questioned and is often based on compilation of bothcorrectly identified and misidentified producers of particularcompounds. It is well known that species in Penicillium andAspergillus may be difficult to identify,77–79 and misidentificationsare unfortunately very common.75,80 One example is cyclopi-azonic acid 13, cyclopiamide 14 and cyclopiamine 15, whichwere originally reported from (and named after) P. cyclopium.However, the original producer was actually a P. griseofulvum.80
Another well known example is the producer of viridicatumtoxin16, which was first identified as P. viridicatum,81 hence the name,later as P. expansum,82 and finally it was realized that the isolatewas representing a new species P. aethiopicum.75,83 In this casethe misidentification was understandable as the new species was“hidden” at the time of isolation and structure elucidation ofviridicatumtoxin, but the name of the compound is misleadingnow.
6 7 6 N a t . P r o d . R e p . , 2 0 0 5 , 2 2 , 6 7 2 – 6 9 5

In traditional identifications secondary metabolites have onlybeen used indirectly via the colour of diffusible pigments, odourof cultures, the KOH test, filter paper methods etc.3,76,78 With theadvent of separation methods such as thin-layer chromatogra-phy (TLC), high performance liquid chromatography (HPLC),and gas chromatography (GC), and advanced detectors it is nowpossible to identify the individual NPs (see section 6).
The genus Penicillium has been particularly well studied con-cerning NPs. This genus contains more than 225 accepted speciesof which 166 belong to the ascomycete genus Eupenicillium and59 belong to the phylogenetically unrelated ascomycete genusTalaromyces.84 Species of Talaromyces and their anamorphicstates in Penicillium subgenus Biverticillium produce metabolitebiosynthetic families such as mitorubrins 17, rubratoxins 18,glauconic acids 19, rugulosins 20, luteoskyrins 21, and cy-clochlorotines 22 in species specific combinations,85 whereas Eu-penicillium species and associated anamorphs in the subgeneraAspergilloides, Furcatum and Penicillium produce different ex-trolite families in different species specific combinations.75,83,86,87
In the Penicillium species examined so far all species produceda large number of already known or not yet structurally char-acterised NPs.75 The profile of biosynthetic families of NPs isalways species specific, while individual metabolite biosyntheticfamilies have been found in both phylogenetically closely relatedand distantly related species. For example, the series Urticicolaein Penicillium subgenus Penicilllium section Penicillium containsthree species, all characterized by very short phialides. Thesespecies produce cyclopiazonic acid 13 and patulin 23 in common,but else they produce different combinations of NPs.
3.2 Chemo-consistency
Usually the rather high number of biosynthetic families ofNPs detectable in each species is sufficient to unequivocallyclassify strains into species in Penicillium and Aspergillus, despitean occasional lack of phenotypical expression of one or twometabolites. Most often the NPs characteristic of any onespecies are consistently expressed. For example of 85 isolates
of Penicillium expansum examined, 83 produced patulin 23,85 produced chaetoglobosin A 24, 85 produced roquefortineC 25, 85 produced communesins 26 and 73 produced citrinin27.88 Likewise a pronounced chemoconsistency was found in P.crustosum.89 It is important to emphasize that chemotaxonomyneeds to be based on profiles of NPs rather than the individualNPs, as those individual metabolites may in some cases beabsent because of mutations in regulatory or other importantgenes in the gene clusters responsible for their accumulation.90
Some of the early claims that antibiotic production may bestrain specific,65,91–93 were probably based on the use of few orsuboptimal production media and quantitative rather than qual-itative differences. At suboptimal conditions, different strainsmay produce widely different amounts of NPs, while at optimalconditions, extrolite production is much more consistent.75,83,94
Of 241 strains of the P. chrysogenum series, 24 did not producedetectable penicillin G 1.95 Results of Brundidge et al.96 alsoindicated that penicillin production may be less than consistent.However, reexamination of such strains on other media mayshow that all strains of P. chrysogenum produce penicillin. Inthe closely related species P. nalgiovense, all strains examinedproduced penicillin.97 In E. nidulans, most strains producedpenicillin,98,99 but strains of mating type F did not producepenicillin and the strains apparently lacked the whole penicillingene cluster.100 However, these type F strains have never beenexamined since, and they may also represent other species inthe genus Emericella, which are not necessarily all producers ofpenicillin. Again only examination for the presence of genes ofthe penicillin pathway in these non-producing isolates will tellus if the genes for a whole pathway may be lost completely insome strains of a species.
Mycophenolic acid 28 was cited as being produced by mostisolates (12/15) of P. brevicompactum by Clutterbuck et al.101
and furthermore the Raistrick phenols (2,4-dihydroxy-6-(2-oxopropyl, benzoic acid)) 29 were produced by 14/15 isolatesof strains in the P. brevicompactum series (now series Olsonii insection Coronata of Penicillium subgenus Penicillium). The onestrain producing neither mycophenolic acid nor the Raistrickphenols was P. aurantiogriseum var. poznaniense, now regardedto be a synonym of P. aurantiogriseum in series Viridicata.3
The two strains claimed not to produce mycophenolic acid byClutterbuck et al.,101 the ex type cultures of P. stoloniferum (nowP. brevicompactum) and P. biourgeianum (now P. bialowiezense)have later been shown to produce large amounts of mycophe-nolic acid.75 Thus in fact the production of mycophenolic acidand the Raistrick phenols was entirely consistent. Later Frisvadand Filtenborg examined 124 strains of P. brevicompactum and
N a t . P r o d . R e p . , 2 0 0 5 , 2 2 , 6 7 2 – 6 9 5 6 7 7

P. bialowiezense, at that time both included in P. brevicompactum,and found that all 124 strains produced both mycophenolicacid and Raistrick phenols.83 It was later realized that while P.brevicompactum produced brevianamide A 30, P. bialowiezensenever did, but instead produced quinolactacin A 31.75 However,both species produce mycophenolic acid, the Raistrick phenolsand asperphenamate 32 consistently.75,86
Several factors may influence the production of NPs by manystrains of a species. 1) All the strains have to be correctlyidentified, using other identification features than NPs in ordernot to make a circular argument. 2) Some NPs are only producedunder certain environmental conditions and if all trace metals,phosphate and other medium factors are present in certainranges of concentrations, thus several good media need to betried out. 3) The seeding medium may influence the productionof NPs in the final production medium (the prehistory of theinoculum). 4) The strain needs to be in good condition and notdeteriorated because of repeated transfer etc. 5) Accumulationof carbon dioxide may inhibit metabolite production, 6) Theextraction solvent may also influence the success of detectionof the particular extrolite. 7) An appropriate analytical chemicalmethod is needed in order ensure that data are correct. However,genetic factors also play a major role. Often a single pointmutation in a regulatory gene is sufficient to make an isolatea non-producer of a metabolite, for which it has the remaininggenetic apparatus. In other cases genes may be silent for otherreasons, so the metabolite is not expressed.
The best known examples of non-production of expected NPsis absence of aflatoxin accumulation in some strains of A. flavusand absence of ochratoxin A 33 accumulation in some strainsof P. verrucosum and most strains of A. niger (only 6% positive).While some NPs, such as kojic acid 34 and aspergillic acid 35,are consistently produced by all strains examined of A. flavus,aflatoxin B1 36 is only produced by a certain proportion ofall strains. For example the culture ex type of A. flavus doesnot produce aflatoxins. On the other hand there have beenindications that in so-called non-aflatoxin producing strains, aminority of conidia (single spore inoculations) may give rise tocolonies producing aflatoxin anyway.102 It has been shown thatwhile aflatoxin has never been detected in A. oryzae, which isthe domesticated form of A. flavus, and A. sojae which is thedomesticated form of A. parasiticus, a major part of the genesneeded for aflatoxin production are present in A. oryzae andA. sojae strains.103–110 So apparently a major part of the genesrequired for aflatoxin B1 biosynthesis is present in all strainsof A. flavus, A. parasiticus and their domesticated forms, butthey are not expressed because of silent or defective genes in thegene cluster responsible for aflatoxin production. The endeavour
to use many different culture conditions have not resulted indetection of aflatoxin in any strain of A. oryzae or A. sojae.111
3.3 Phylogeny and classification: is production of naturalproducts homoplastic?
Results from Frisvad et al.75 show that natural series of speciesoften contain species that share several NPs, while some othersare only produced by a certain number of the species in the series.In the series Viridicata of Penicillium subgenus Penicillium seriesViridicata, xanthomegnin 37, viomellein 38, vioxanthin 39 andother minor compounds of this naphthoquinone biosyntheticfamily is produced by five of the nine species known,112 andcould thus either have been lost during evolution in the fourremaining species or gained several times. A search for partsof the genes or gene cluster in the non-producing strains willshow which hypothesis is correct, but this can only be donewhen all the genes involved in xanthomegnin biosynthesis havebeen sequenced. However, production of xanthomegnin by somequite unrelated species of Penicillium from subgenus Furcatumsection Divaricatum series Janthinella such as P. janthinellumand P. mariaecrucis,87 Aspergillus section Circumdati,73 andthe very distantly related genus Trichophyton shows that thesenaphthoquinones have evolved several times.113–115
In a study of species in Aspergillus section Fumigati and therelated teleomorphic genus Neosartorya it was shown that aphylogeny based on partial b-tubulin and hydrophobin genesequences was not at all congruent with phylogenies suggestby morphology or NPs.116 Thus functional characters suchas profiles of NPs, morphology and physiology are effectivein classifications of fungi, but are maybe less well suited forphylogenetic analysis because of many homoplasies or even
6 7 8 N a t . P r o d . R e p . , 2 0 0 5 , 2 2 , 6 7 2 – 6 9 5

analogies in such functional characters. Some examples will begiven below.
Griseofulvin 40 was one of the first antifungal NPs foundin filamentous fungi. This chlorine containing polyketide isproduced by several ascomycetous species, some of them closelyrelated, others very distantly related (Table 1). Griseofulvin pro-duction appears to be very consistent in all the species that havebeen examined systematically so far.75 According to Table 1, thegriseofulvin biosynthetic capability has been developed at least13 independent times during evolution. All known species ofKhuskia and its anamorphic state Nigrospora have been reportedto produce griseofulvin, so this is apparently a monophyleticcharacter of the genus. In contrast griseofulvin production hasbeen developed 9 independent times in Penicillium, and thusthis character is highly polyphyletic (Table 1). However, it isnot known whether the four species in series Lanosa and thefour species in series Canescentia that produce griseofulvin, arethose that are most closely related according to a single ormulti-gene phylogeny. In Aspergillus, griseofulvin productionappears to be rare, as it has only been reported in A. lanosus,but in no other species in series Flavi of Aspergillus and itsPetromyces teleomorph.121 The production of griseofulvin byMemnoniella echinata is also autapomorphic, i.e. not sharedwith phylogenetically closely related species, no other speciesof Memnoniella or the closely related Stachybotrys produce thispolyketide.134,135 One strain of Phomopsis has also been reportedto produce griseofulvin.120
Mycophenolic acid 28 is a strongly immunosuppressive extro-lite and is used for organ transplantations and for treatment ofautoimmune diseases (as the drug formulation mycophenolicacid mofetil).136 It is also an antibacterial, antifungal andantiviral compound.136 Mycophenolic acid is produced by fivePenicillia, one Aspergillus, one Byssochlamys and one Septoriaspecies (Table 2). Mycophenolic acid is thus produced by two
out of three species in series Olsonii, two out of three speciesin series Roqueforti, but furthermore by 4 individual species indifferent genera (Table 2). According to b-tubulin sequencingand phylogenetic analysis P. roqueforti and P. carneum, bothproducing mycophenolic acid are more closely related to eachother than to P. paneum, the only species in series Roquefortinot producing mycophenolic acid, and likewise P. bialowiezenseand P. brevicompactum, both producing mycophenolic acid aremore closely related to each other than to P. olsonii, the onlyspecies not producing mycophenolic acid in series Olsonii.137
Despite this concurrence within the two series of Penicillium,mycophenolic acid biosynthesis seems to have been inventedat least 6 times during evolution (Table 2). Most strains ofPenicillium roqueforti produce mycophenolic acid,137 althoughEngel et al. claimed the production of mycophenolic acidby this species was strain specific.68 However, as mentionedabove P. roqueforti has been shown to be consisting of threedifferent species P. carneum, P. paneum and P. roqueforti.3,49
P. carneum consistently produces mycophenolic acid,49 whereassome strains of P. roqueforti may be non-producers. Again thiscould be a result of mutations in some of the genes coding formycophenolic acid in P. roqueforti or finding an optimal mediumfor phenotypic expression of the metabolite.
In some fungal series, such as series Urticicolae in Penicillium,several NPs are common for all species (Table 3). For example allknown members of this series produce patulin 23, cyclopiazonicacid 13 and possibly penicillin G 1. On the other handgriseofulvin 40 has only been found in P. griseofulvum andP. dipodomyicola, while fulvic acid 41 has been detected in P.griseofulvum and the new species in the series. In a cladisticsense griseofulvin and fulvic acid are incongruent. In the seriesViridicata of Penicillium the production of verrucosidin 42,xanthomegnins 37, viridicatins 43, puberulins 44, terrestric acid45 is neither consistent with the b-tubulin sequence based phy-logeny nor are the many NPs produced congruently. Sequencingand comparison of the gene and nucleotide sequences of geneclusters for these NPs will eventually help finding out whetherthe genes are inherited, horizontally transferred or have evolvedseveral times during evolution. In addition P. dipodomyicolaproduces four new kinds of alkaloids and four new polyketidederived extrolite types. The new species in the series produce
Table 1 Taxonomic placement of griseofulvin 40 producers
Species Subgenus Section Series Order References
Khuskia oryzae — — — Trichospaerialesa 117,118Khuskia sacchari — — — Trichospaerialesa 118Nigrospora musae — — — Trichospaerialesa 117Nigrospora sphaerica — — — Trichospaerialesa 117Memnoniella echinata — — — Sordarialesb 119Phomopsis sp. — — — Diaporthalesc 120Aspergillus lanosus Circumdati Flavi — Eurotialesd 121P. nodulum Aspergilloides Aspergilloides Implicata Eurotialesd This reportP. aethiopicum Penicillium Chrysogena Aethiopica Eurotialesd 83P. persicinum Penicillium Chrysogena Persicina Eurotialesd 122P. coprophilum Penicillium Penicillium Claviformia Eurotialesd 83P. dipodomyicola Penicillium Penicillium Urticicolae Eurotialesd 83P. griseofulvum Penicillium Penicillium Urticicolae Eurotialesd 123,124,125P. sclerotigenum Penicillium Penicillium Expansa Eurotialesd 126P. jamesonlandense Furcatum Ramosum Lanosa Eurotialesd 23P. lanosum Furcatum Ramosum Lanosa Eurotialesd 87P. raistrickii Furcatum Ramosum Lanosa Eurotialesd 127,128P. soppii Furcatum Ramosum Lanosa Eurotialesd 129P. janczewskii Furcatum Eladia Canescentia Eurotialesd 125,130P. murcianum Furcatum Eladia Canescentia Eurotialesd This reportP. nigricans Furcatum Eladia Canescentia Eurotialesd 124,128,131P. nodusitatum Furcatum Eladia Canescentia Eurotialesd This reportP. yarmokense Furcatum Eladia Canescentia Eurotialesd This report
a Sordariaceae, Sordariomycetidae, Ascomycetes. b Chaetosphariaceae, Sordariomycetidae, Ascomycetes. c Valsaceae, Sordariomycetidae, As-comycetes. d Trichocomaceae, Eurotiomycetidae, Ascomycetes. Unsubstantiated reports, misidentified or reidentified culture: Aspergillus versicolor,132
Penicillium albidum,127 P. brunneostoloniferum (=P. brevicompactum),131 P. concentricum;128 P. kapuscinskii,133 P. melinii,128 P. raciborskii,133 P.verrucosum var. corymbiferum,128 reidentified to P. aethiopicum,75 P. viridicatum,81 reidentified to P. aethiopicum,80 P. viridicyclopium (=P. cyclopium).131
N a t . P r o d . R e p . , 2 0 0 5 , 2 2 , 6 7 2 – 6 9 5 6 7 9

Table 2 Taxonomic placement of mycophenolic acid 28 producers
Subgenus Section Series Order References
Aspergillus unilateralis Fumigati Fumigati — Eurotialesa This reportByssochlamys nivea — — — Eurotialesa 139Penicillium bialowiezensc Penicillium Coronatum Olsonii Eurotialesa 75P. brevicompactumd Penicillium Coronatum Olsonii Eurotialesa 140–143P. fagie Furcatum Furcatum — Eurotialesa 87P. carneum Penicillium Roqueforti Roqueforti Eurotialesa 83P. roqueforti Penicillium Roqueforti Roqueforti Eurotialesa 68,138,144Septoria nodorum — — — Mycosphaerellalesb 145
a Trichocomaceae, Eurotiomycetidae, Ascomycetes. b Mycospaerellaceae, Dothideomycetidae, Ascomycetes. c Including the synonym P. biourgeianum.d Including the synonyms P. hagemii, P. griseo-brunneum, P. patris-mei, P. scabrum, P. stoloniferum. e Including the synonym P. caerulescens.Unsubstantiated reports or misidentified culture: P. aurantiogriseum,146 P. canescens,146 P. carneolutescens,147 was a P. brevicompactum,80 P. expansum,146
P. meleagrinum,148 P. olivicolor,146 P. paxilli,146 P. rugulosum,146 P. viridicatum.146,149
Table 3 Production of NPs by species in Penicillium section Penicillium series Urticicolae
Species PatulinFulvicacid Griseofulvin
Cyclopiazonicacid
RoquefortineC Cyclopiamine Penicillin Cyclopiamide Asteltoxin
P. griseofulvum + + + + + + + + −P. dipodomyicola + − + + − − ? − −New species + + − + − − ? − +
15 different groups of chromophore groups, previously seen inno other or few other Penicillium species. The three species inUrticicolae also produce many volatile NPs.75,150
Chaetoglobosins are cytotoxic mycotoxins that have also beenconsidered as drugs.151–153 Chaetoglobosin A 24 is active againstthe gastric ulcer involved bacterium Helicobacter pylori andchaetoglobosin K has been suggested for use in combinationwith other drugs in the treatment of RAS-induced cancers.154–156
The chaetoglobosins are both phytotoxic and antifungal.157–160
These very active compounds are produced by an array of verydifferent species, that are not phylogenetically closely related(Table 4). The chaetoglobosins thus seem to have evolved atleast 7 independent times.
An overview of Penicillium subgenus Penicillium shows thatall series contain species that have specific profiles of NPs.75
There is a tendency that many NPs are common to severalmembers of a series, so that each series is polythetic,161 andin addition have autapomorphic NPs for each species. Buteven these autapomorphic NPs in one series may occur as anautapomorphy in another series. As an example brevianamideA 30 is produced only by two species in subgenus Penicillium:P. brevicompactum in series Olsonii and P. viridicatum
Table 4 Taxonomic placement of chaetoglobosin 24 producers
Subgenus Section Series Order References
Calonectria morganii — — — Hypocrealesa 158Cylindrocladium floridanum — — — Hypocrealesa 157Chaetomium cochlioides — — — Sordarialesb 167C. globosum — — — Sordarialesb 168,169C. mollipileum — — — Sordarialesb 167,170C. rectum — — — Sordarialesb 167,170C. subaffine — — — Sordarialesb 171,172Diplodia macrospora — — — Dothidialesc 173Discosia sp. — — — ? (Ascomycetes) 174Phomopsis lepstromiformis — — — Diaporthalesd 175Phomopsis sp. — — — Diaporthalesd 120Penicillium discolor Penicillium Viridicata Solita Eurotialese 176P. expansum Penicillium Penicillium Expansa Eurotialese 83,88,177P. marinum Penicillium Penicillium Expansa Eurotialese 75,178,179
a Nectriaceae, Sordariomycetidae, Ascomycetes. b Chaetomiaceae, Sordariomycetidae, Ascomycetes. c Botryospaeriaceae, Sordariomycetidae, As-comycetes. d Valcaceae, Sordariomycetidae, Ascomycetes. e Trichocomaceae, Eurotiomycetidae, Ascomycetes.
6 8 0 N a t . P r o d . R e p . , 2 0 0 5 , 2 2 , 6 7 2 – 6 9 5

in the phylogenetically unrelated series Viridicata.75,137
Brevianamide A has not been found in any other microorganismyet.
The accumulation of this anti-insecticidal extrolite162 in theconidiophores of P. brevicompactum163,164 has given rise to the hy-pothesis that brevianamide A may deter fungivorous arthropodsfrom consuming the penicillus.44 Since brevianamide A is alsoaccumulated in the conidiophores of P. viridicatum, the sameis probably the case for the latter fungus also. One hypothesiscould be that brevianamide A has evolved twice, even in theserather closely related species, based on a strong interactionwith the environment, i.e. selection at the species level. Analternative second hypothesis could be that brevianamide Agenes are present in all 58 species, but have been lost in 56species, based on loss of genes, gene silencing or mutations inthe biosynthetic genes for brevianamide A. A third hypothesiscould be that the whole gene cluster for brevianamide A has beenhorizontally transferred from one species to another. Based onthe distributions of NPs in both phylogenetically closely andunrelated species, it is most probable that these metabolites haveevolved several times during evolution. The second hypothesiswould require an unrealistically large genome in all fungi, asmost NPs are so widespread in several orders of fungi, thatall fungal species should have all extrolite genes inherited fromtheir ancestors if the hypothesis was correct. The tryptophanderived extrolite paxillin 46, for example, is produced via agene cluster of 17 genes (ca. 50 000 nucleotides in all),165 andthis gene cluster is not much larger or smaller than othergene clusters for NPs,166 and with the very large number ofNPs known in Penicillium subgenus Penicillium there is simplynot space for all these gene clusters in any fungal genome.Horizontal gene transfer of such large gene clusters is alsoquite improbable. For present the hypothesis that NPs have beeninvented several times during evolution and that ecology has amajor impact on the profiles of NPs seen in filamentous fungiseems most probable. If this is shown to be true, intelligentscreening for these compounds should be based on ecologyand systematics rather than on phylogeny based on householdgenes. Thus it is recommended to emphasize biodiversity at thespecies level and explore many different habitats, including asearch for new species. Chemical stimulation by co-occurringspecies in the actual habitat is also a natural consequenceof this ecologically based approach. Phylogenetic relatednessmay, or may not, indicate that the same NPs are producedand will not give any ecological hints on stimulation of NPproduction.
3.4 Microbial physiology
It is well known that medium composition and culture con-ditions have great impact on growth and the production ofsecondary metabolites.42,66,94,180,181 The physiology of secondarymetabolism has often been neglected and still few of the regula-tory features of secondary metabolism have been elucidated.182
Thus depending on the diversity of the microorganisms tobe studied it may be necessary to use several media andgrowth conditions, both during initial morphologically basedinvestigations and later when “talented” strains are to beinvestigated (see Fig. 1) for their full metabolic potential usinga one strain many compounds approach as suggested by Bodeet al.183
Fig. 1 The chemotaxonomy based screening approach. Step 1) Culturesfrom either natural samples or in-house collections are cultivated ona few media used for macro- and micromorphological identificationpurposes. Representative strains of the different species are selectedby either experts or by automated image analysis methods.196 Step2) Extracts are made by micro-extraction of only a few agar plugsfrom one fungal culture and all metabolites in the extract are analysedsimultaneously (step 3) using e.g. direct injection mass spectrometry(DiMS). Mass profiles of the extracts are clustered using chemometricmethods in order to select representative chemotypes.52 Step 4) Therelatively few strains per species that have now been selected are grownon a larger number of media in order to generate conditions that willallow the expression of as broad a range of secondary metabolites aspossible for a given strain, according to the one strain many compounds(OSMAC) philosophy.183 Step 5) Extracts from the best media conditionscan now be separated into microtiter plates generating natural productcompound libraries. At the same time UV and MS data are obtainedallowing compound dereplication of hits from bioassays (step 6) usingcomparison of UV and MS spectra with databases. Step 7) Activecompounds are isolated and structure elucidated to generate noveldrug candidates (step 8), altogether at a high-rate, allowing search forfurther similar but novel compounds by comparison of spectral data toinformation in databases using chemoinformatic tools (see section 6.5).
If possible it is very beneficial to know the genus beinginvestigated as the general optimal media for good metaboliteproduction changes.66,184 For example YES and CYA are ingeneral excellent media for metabolite production for Penicilliumand Aspergillus, whereas they work very poorly for Rhizopus.185
This is also the case for Penicillium sub-genus Biverticillium(teleomorph Talaromyces), where MEA and OAT give manymore metabolites than other media.181
For initial identification/pre-selection studies solid substratesin Petri dishes are standard. This ensures easy assessment ofcontaminations of what were supposed to be pure cultures,something which can be difficult to control on media likerice and maize,186,187 which on the other hand often givegood sporulation and metabolite production. Point inoculatedcultures furthermore have the advantage that mycelia at differentages are present and thus both intermediates and end-productscan be extracted from the edge and the center respectively usinge.g. the agar-plug-technique.184
N a t . P r o d . R e p . , 2 0 0 5 , 2 2 , 6 7 2 – 6 9 5 6 8 1

Different and relatively easy to control conditions to in-vestigate in a discovery programme include growing culturesat both solid and liquid conditions, incubation at two ormore temperatures, incubation at two or more shaker speeds,incubation for at least two different time periods, media withat least two different pH levels, choosing carbon and nitrogensources at different concentrations, high- or low phosphatecontent, adding trace minerals etc.13 Authors like Hesseltine188–190
Gloer45 and Nielsen et al.181 strongly argue in favour of usingsolid substrate fermentations in studies of fungal metabolitessince fungi, unlike other microorganisms, typically grow innature on solid substrates such as wood, roots, leaves of plants,and drier parts of animals such as fecal material that is low inmoisture.
As mentioned earlier others argue that the production ofsome metabolites demand very specific “stimuli” e.g. certainprecursors or “triggers” often present in the natural environmentof the given fungus. This comes from the philosophy that mostspecies are capable of inhabiting several environments as theywould otherwise be too dependent on just one environment, andthat a species will need a certain chemical profile in each of theseenvironments. This calls for complementing general screeningmedia with e.g. macerated plant tissue media for plant pathogensand endophytes as recently illustrated by the stimulation ofsome novel fungal phenolic metabolites using plant tissuemedia.191,192
Finally, some believe and argue that all metabolites can beexpressed in liquid culture by varying carbohydrate compo-sition, nitrogen source, oxygen tension, pH, redox potential,water activity, as the right conditions will produce intra-cellular conditions that will trigger production of a certainmetabolite. Thus liquid conditions have been shown to bevery successful in Fusarium.193 Often metabolites associatedto spore or sclerotia formation are produced under solidconditions whereas the production of others are enhancedunder liquid conditions. This was demonstrated for P. solitumwhere alkaloids such as viridicatol and cyclopenol analogueswhere produced in relatively high amounts on semi-solid mediaeither still or absorbed in lightweight expanded Clay aggregates(LECA), whereas the often targeted compactin polyketides werethe most dominant compounds produced under submergedconditions.181
4. The chemotaxonomy based drug discovery process
As argued above the chemical diversity and the resources ofNPs are immense and nowhere near fully exploited. Combinedwith the fact that fungi (and probably also other types ofmicroorganisms) produce very species specific profiles of NP’sthat can be used as efficient tools to select one (or a few)representative strain(s) for biological testing, and with therevolution in molecular genomics several new strategies for aNPs based drug discovery programme are being opened:
-Knowing the biodiversity and ecology;-Using a metabolite profiling approach;-Targeting certain ecological niches;-Using a genome based approach.There are several other steps to deal with when running a
natural product discovery programme. According to Cordell194
these key steps can be summarized: (i) collection, selection andcultivation of organisms; (ii) extraction and biological evalua-tion; (iii) dereplication; (iv) isolation and structure elucidationof metabolites; (v) biological evaluation; and (vi) informationmanagement.
With the large numbers of already known microbial (approx.50 000) and plant (approx. 600 000) metabolites,195 one of themajor challenges in modern natural product discovery is todetect already known and trivial compounds rapidly, a processknown as dereplication. However, in our opinion dereplication(or avoiding redundancy) can be implemented in several steps of
the discovery process. This relies on information managementand data mining of the enormous amounts of biological,chromatographic and spectroscopic data generated and whichhas become a bottleneck in modern drug discovery. To optimizethe drug discovery process dereplication should be implementedat an early stage, where the cultures of a given microbialcollection (culture collection or natural samples) are selectedfor extraction and biological evaluation. Traditionally, microbialstrains have been selected based on morphology, rather than onmore powerful approaches such as automated image analysis ofpure cultures,196 phenotypic characters including production ofsecondary metabolite profiles or based on genotyping.13,197 Onereason for the large redundancy in isolation of already knowncompounds in screening programs is due to the redundancy inselection and screening of multiple strains of the same speciesalready studied by others.
It is therefore very relevant to develop an array of simpleanalytical methods and combine these methods with informat-ics, to select representative and promising strains to screenrapidly in a bioassay. As will be discussed in detail below, thesemethods are based on efficient use of MS, UV and NMR datain combination with modern informatics tools to characterizethe nature of mixtures of compounds, in crude extracts. Whensome representative chemotypic strains have been selected, thentheir metabolic potential should be investigated using multiplegrowth conditions as discussed in section 3.4 and argued byBode et al.183
Having found both some promising strains and their optimalgrowth conditions for metabolite production, natural productcompound libraries (NPLs) can be prepared using an integratedsetup for analysis and automated micro-fractionation into e.g.microtiter plates.16,198 Such NPLs can then be screened in variousbioassays and when hits have been generated these can be cor-related to spectroscopic data and again to databases,199 in orderto dereplicate, thus avoiding the finding of trivial compounds asearly as possible. Subsequently, potential novel compounds canbe isolated on a larger scale and their structure elucidated. Inthe case of new compounds more analogues can be generatedeither by combinatorial or traditional chemistry. Alternativelyan overall screening for new but similar compounds may beaccomplished by an automated UV-guided search discussed inmore detail in section (6).
The overall combined approach using integrated analyticaland informatics techniques were recently presented as anintelligent screening strategy by Smedsgaard and Nielsen.52 Inthis review we also include image analysis of fungal cultures,other direct profiling techniques and the concept of naturalproduct libraries (NPLs) as part of a slightly modified intelligentscreening system as illustrated in Fig. 1.
5. Morphology based strain selection—image analysis
In many cases manual inspection by expert microbiologistsor mycologists of a strain collection could obviously lead tothe dischargement of at least some of these strains based onhigh morphological similarities. However, dereplication basedon macromorphological phenotypic characters can also beautomated. Using a special camera system, colours as theyappear from the surface of the fungal cultures, can be mappedinto discrete arrays of pixel values representing a digital image.Images (micro and/or macro) have to be acquired under totallystandardised conditions with a colour and geometry calibratedcamera set up, so that absolute colour measurements andcomparison can be made. The camera system consists of anintegrating sphere (a so called Ulbricht sphere) combined with aphotometrically calibrated camera system based on the 3-CCDcolour camera. The sphere has a diameter of 36 cm. The inside ofthe sphere is covered with a faint titanium dioxide paint to createoptimum light conditions. Light is then brought into the systemthrough light diodes inside the sphere, giving the sample diffuse
6 8 2 N a t . P r o d . R e p . , 2 0 0 5 , 2 2 , 6 7 2 – 6 9 5

and homogeneous illumination. In a standard camera system thespectral resolution of an image is normally 8 bits/pixel for eachcolour-channel. This camera system is capable of generatingimages with a higher spectral resolution for each colour-channel.The pixel resolution is 32-bit RGB i.e. a bit depth of 232 =4 294 967 296 per channel and the full pixel resolution is used inthe retrieval process.
Based on the above image acquisition procedure, it hasbeen shown, that image analysis of fungal cultures can beused to identify isolates within certain terverticillate Penicilliumspecies.200 In addition, results from DNA fingerprinting wererecently compared with the results obtained from the imageanalysis.196,201 The objective of this study was to investigate ifimage analysis could support or maybe serve as a substitute forsubjective phenotyping methods and to substantiate the DNAfingerprinting of P. commune isolates; one of the most difficultspecies to identify within this genus. Fig. 2 illustrates the diversityof the cultures in appearance.
The figure shows four different clones of the P. communeafter digitization. Although the principles described in Hansenet al.,196 and Dorge et al.200 were slightly different, the overallscenario of the methods were the same. First of all the obtainedimages contain a large amount of information. To reduce thecomputational complexity, the regions of interest (ROI) haveto be detected before further analysis can be done;202 thatis detection of the Petri dish, followed by the colonies andinoculation points. After having detected the ROI’s, featurescan be extracted from the images. The features used are basedon calibrated (RGB) colour measurements extracted from eachof the pixels inside the colonies. Even though colours (colourintensities) constitute the most important factor for the humanvisual system of identification,203 spatial distribution is alsoimportant for the perception and understanding of a scene.Different isolates may have the same global content of pixelshaving certain colours, but the spatial relation of the pixelsdetermines how we identify them. Therefore textual informationhas to be extracted as well.
Based on the colour and textural features, statistical modelscan be created for each of the images representing an isolate.201
Using these models distances can be calculated in such a way,that the distances between visually similar cultures are low,whereas the distances between visually different cultures arehigh. This comparison enables the possibility of making queriesin a database containing visual (phenotypic) information, asillustrated in Fig. 3. Based on the visual information obtainedfrom an “unknown” isolate it is possible to calculate distances toknown isolates in the database. Through different classificationmethods, such as e.g. the nearest neighbour classification rule, itis possible to assign species information to the unknown sample.The studies showed that it was possible to obtain a “leave-one-out” cross-validation identification rate of approximately93–98% when compared with the identification results basedon DNA fingerprinting. The method described by Hansen andCarstensen201 has additionally been validated on small-sporedAlternaria species proving to have a good performance whencompared to the traditional identification methods.204
6. Strategies and methodologies for metabolite profiling andtarget analysis
Rapid profiling techniques have been desired for many years,which ultimately may determine all metabolites produced by amicroorganism. In the current age of ‘omics this quest is now apart of what is known as the metabolomics,205,206 which aims todetect all small metabolites in a cell or organism. In generalterms these techniques are segregated into: fingerprinting,footprinting, profiling or target analysis. Fingerprinting aims toget a “chemical picture” of the sample where the signals cannotnecessarily be used to detect/identify specific metabolites anddepends strongly on the technique used. Profiling techniquesrequire that signals in the profile (e.g. peaks in a chromatogram)can be assigned to a specific metabolite whether it is of knownstructure or not. Finally, target analysis aims to determineand quantify specific metabolites. Fingerprinting, profiling ortarget analysis can be performed by e.g. TLC screening,184 bymass-profiling using direct infusion ESI-MS,207 by NMR,208,209
or more by doing elaborate profiling and target analysis,using hyphenated analytical methodologies e.g. GC-MS(-MS),
Fig. 2 Example of four Petri dishes after digitization. All isolates are different clones of Penicillium commune.
N a t . P r o d . R e p . , 2 0 0 5 , 2 2 , 6 7 2 – 6 9 5 6 8 3

Fig. 3 Statistical models are generated based on visual information from the cultures. Using these models distances can be calculated in such a way,that visually similar cultures have small distances, whereas the visually different cultures have large distances. This comparison enables the possibilityof making queries in a database containing visual (phenotypic) information. Through different classification methods it is possible to assign class(species, mutant, etc.) information to the unknown sample. Reprinted from Pattern Recognition, 37, Michael Edberg Hansen and Jens MichaelCarstensen, Density-based retrieval from high-similarity image databases, pp. 2155–2164, Copyright (2004), with permission from Elsevier.
LC-UV(spectrometric), LC-MS(-MS), LC-NMR and othercombinations. All these approaches are relevant in NPdiscovery.
Most analytical approaches begin with preparation of cultureextracts, which can be anything from simple to daunting.Screening fungal cultures can be done in a high through-put screening manner by adapting a rapid plug extractionprocedure.210 However, extraction is (like cultivation) not trivialand consideration should be given to discrimination betweenmetabolites due to extraction procedure and to ensure that thesample matrix does not interfere with the subsequent analyses.
The following sections introduce a few of the methodologiesused for metabolite profiling in NP searches in microbes. Thereader is referred to text books and original literature fordetail on how the analytical work and procedures are carriedout.
6.1 Chemical profiling—TLC
The easiest profiling technique to study fungal natural productin extracts are the agar-plug-TLC technique developed morethan 20 years ago by Filtenborg and Frisvad,211 and Filtenborget al.,212 which allow rapid and simple profiling (fingerprinting)of metabolites almost directly from cultures. By this simpletechnique metabolites are extracted “on the fly” by placing adrop of solvent on the small mycelium plug cut from the culture,where after the plug is placed on a TLC plate with the wettedside down for a few seconds and then removed. The plate iseluted and visualized under UV light by fluorescence or afterselective spraying. While the method may seem primitive, it hasproved efficient for classification, identification and metabolitedetection even under primitive conditions.213 Also, the TLCtechnique may be very useful for a first cultural dereplicationmethod in combination with morphological inspection of cul-tures on fieldtrips collecting new biodiversity. One standardTLC plate can accommodate up to 20 extracts/cultures elutedin two solvent systems, giving a very visual representationof the chemistry. The information is similar in structure butnot as detailed as obtained from HPLC analysis as discussedlater.
6.2 Direct infusion electrospray mass spectrometry
With the arrival of electrospray ionization mass spectrometry(ESI-MS) and the associated techniques about 15 years agothe scientific community obtained a marvellous tool for studiesof NPs and other bio-molecules. ESI-MS has the advantageof being a soft and sensitive ionization technique which canbe optimized to produce mainly protonated or sodiated ions(assuming positive ESI) from a very broad range of NPs.207 Tak-ing advantage of limited fragmentation in ESI-MS Smedsgaardand Frisvad207 developed a rapid fingerprinting technique wheremass profiles are determined by infusing crude fungal extractdirectly into the electrospray source. Later both Julian et al.214
and Higgs et al.215 used similar approaches as rapid methods todifferentiate and estimate the presence of secondary metabolitesin microbial extracts. The advantages of fingerprinting bydirect infusion mass spectrometry (DiMS) are: fingerprints canbe made within minutes; metabolite and chemical structureinformation can be predicted/extracted; data can easily bestored in databases;216 and data processing is relative easy toautomate.217–218 However, a warning note: infusing complexsamples with many components directly into ESI-MS may leadto serious discrimination due to what is known as matrix effects.These matrix effects can discriminate the spectra so that metabo-lites (or co-extracted media components e.g. PEG and TWEEN)may “steal” all charges thereby suppressing other metabolites.Keeping the concentration within a suitable range, using nano-ESI techniques and selected solvent compositions can reducethese effects. As shown in the following examples mass profilescan, despite these problems, be used through chemometricmethods to classify the samples (fungi) thus grouping the strainsbased on their chemical similarities (NP-profile). As fungalspecies normally produce stable and often quite unique profilesof secondary metabolites, as discussed in the previous section,these mass profiles contain species-specific information.
This was demonstrated almost 10 years ago by Smedsgaardand Frisvad in a study of a large group of fungal species (43species on two media, approx. 293 strains).219 They found thatmore than 80% of these species could be classified into chemicalclasses from the mass profiles which corresponded to speciesas determined by classical phenotypic identification. Storingthese spectra in the normal mass spectra library included in
6 8 4 N a t . P r o d . R e p . , 2 0 0 5 , 2 2 , 6 7 2 – 6 9 5

the instrument software many species could be identified semi-automatically.216 These findings have been confirmed in a recentstudy now including 57 species and about 500 strains on twocultivation media.218
Examples of accurate mass profile fingerprints from directinfusion ESI-MS analyses of extracts from three different, butrelated species of Penicillium (associated to dung) are shown inFig. 4 (see Smedsgaard et al.218 for experimental details). As canbe seen, they share similarities such as an intense ion at m/z468.25, as well as differences e.g. only two of the species haveions at m/z 448.19.
Fig. 4 Mass profile (fingerprint) from direct infusion of crude extractfrom three different Penicillium species as described by Smedsgaardet al.218
These mass profiles contain species specific informationas discussed in the previous sections and can be used forclassification/identification. To illustrate this, 72 DiMS massprofiles (including the three showed in Fig. 4) from strains of the8 major Penicillium species associated to dung (from the seriesClaviformia and Urticicolae) and two outliers were classified bycluster analysis as shown by the dendrogram in Fig. 5a. Theclassification was done by a binning technique: the ions in eachspectrum were binned into m/z 0.5 wide bins; empty bins areremoved from the analysis. The (bin, ion-count) pairs was sortedaccording to the ion count in each (bin, ion-count) and the N = 50bins with the largest ion count are used to represent each sample.The bins are given a score according to the ion-count in that bin.The result is a bin-score vector calculated from each spectrum.Within each of the class (species) some ions are present in allthe isolates, others may be present in only a few, and thereforeonly bins with a score lying within a certain interval are used.From these selected bins (after they are centered and scaled)the distances are calculated between all samples and clusteredusing WPGMA (weighted average distance) linkage giving thedendrogram shown in Fig. 5a, a more detailed discussion can befound in Hansen and Smedsgaard,217 and Smedsgaard et al.218
Fig. 5 Upper (a). Classification of the 7 species in Penicillium seriesClaviformia and two outliers (P. formosanum and P. atramentosum) basedon cluster analysis of the raw mass profiles from direct infusion ESImass spectrometry of crude extract.218 The DiMS classification point tothe same species groups as classification based on partial beta-tubulinsequences (lower, b) see Samson et al.137 Strains marked with * areincluded in both analyses.
The chemical classification based mass profile fingerprintingshown in Fig. 5a point to the same groups as cladification basedon partial b-tubulin sequencing.137 These classes have also beenconfirmed by classical phenotypic classification by experts.69
This confirms that NPs are closely linked to species, henceselecting one or a few single isolates within each group rather
N a t . P r o d . R e p . , 2 0 0 5 , 2 2 , 6 7 2 – 6 9 5 6 8 5

than all isolates for further studies will give maximal chemicaldiversity in a screening programme.
As mentioned above, direct infusion ESI-MS can be optimizedto produce mostly protonated and sodiated molecular ions frommany different chemical compounds. Using the more recenthigh resolution and high accuracy mass spectrometers eachion seen in these spectra is likely to represent one or just afew metabolites and the chemical structure can with sufficientaccuracy be limited to only a few formulae. However, to obtainthe best possible accuracy an internal mass reference is needed.Since most dung associated Penicillia will produce roquefortineC 25 with a [M + H]+ at m/z 390.193, easily seen in positivemass profiles, the accurate protonated mass of this compoundcan be used to correct the mass scale of the bottom spectrum inFig. 4 to get the accurate spectrum from P. coprophilum shownin Fig. 6.
Fig. 6 Mass profile (fingerprint) of P. coprophilum (IBT 21517)cultivated on YES after the mass scale have been corrected using theaccurate mass of roquefortine C as internal reference. 37 ions above 3%base peak intensity are listed in Table 5.
Above 3% of the base peak intensity we find 37 ions, ofthese 19 correspond to the formula of metabolites known to beproduced by P. coprophilum, most within a few ppm (Table 5).
Five significant unknown ions are included, however thesecorrespond most likely to three metabolites as the differencebetween m/z 417.1798 and 418.1843 ions correspond closely tothe difference between 12C and 13C in both mass and intensity.
Looking closer at the griseofulvin group of ions around m/z350–358, as shown in Fig. 7 bottom spectrum, a series of ionpatterns corresponding to one chlorine atom can be seen. If wecalculate the ion pattern for dehydro-griseofulvin shown at thetop of Fig. 7 and griseofulvin in the middle of Fig. 7 we can seea good match. However, the intensity of m/z 355.0599 is higherthan expected indicating the presence of another metabolitein this peak. One could speculate that dihydro-griseofulvin 47might also be present accounting for the 357 peak.
To validate the findings indicated by the mass profiles in Fig. 7,the same sample was analyzed by LC-UV-accurate MS andnarrow ion traces were extracted for all these ions shown inFig. 7. As the mass spectrometer was overloaded profiles forboth 12C and 13C were extracted. Multi-plate channel detectors(MCP) with time to digital conversion (TDC), a commonlyused detector in a TOF mass spectrometer suffers from deadtime which in case of saturation will give too low mass values,as seen in the following section. Therefore, the mass tracesshown in Fig. 8 are all made ±0.01 Da e−1 except in caseof serious overload where the trace window is extending toinclude lower masses. Looking at the traces correspondingto the mass of the 13C isotopes of dehydro-griseofulvin andgriseofulvin, chromatographic peaks about 0.2 minutes apartcan easily be seen in traces from both chlorine isotopes. The areafor the two chlorine traces corresponds nicely to the expectednatural occurrence and there is about three times more dehydro-griseofulvin than griseofulvin. These finding can be confirmedby looking at the UV spectra.
Table 5 37 ions are found above 3% base peak height in Fig. 5. Of these can 19 ions be assigned to metabolites known to be produced by P.coprophilum within a few ppm mass accuracy. Roquefortine C was used as natural occurring internal mass reference. Five significant unassigned ionsare included, X1–X5, see text
Metabolite Formula Ion Calculated Measured
Dehydro-dechloro-griseofulvin C17H16O6 H+ 317.1025 317.102113C-dehydro-dechloro-griseofulvin 13CC16H16O6 H+ 318.1058 318.1072Dechloro-griseofulvin C17H18O6 H+ 319.1181 319.1184Dehydro-dechloro-griseofulvin C17H16O6 Na+ 339.0845 339.0846Dechloro-griseofulvin C17H18O6 Na+ 341.1001 341.100635Cl-dehydro-griseofulvin C17H15O6
35Cl H+ 351.0635 351.062735Cl–13C-dehydro-griseofulvin 13CC16H15O6
35Cl H+ 352.0669 352.066737Cl-dehydro-griseofulvin or C17H15O6
37Cl H+ 353.0606 353.063035Cl-griseofulvin C17H17O6
35Cl H+ 353.079237Cl-13C-dehydro-griseofulvin 13CC16H15O6
37Cl H+ 354.0639 354.066335Cl-13C-griseofulvin 13CC16H17O6
35Cl H+ 354.082535Cl-13C-griseofulvin C17H17O6
35Cl H+ 355.0762 355.059937Cl-13C-griseofulvin 13CC16H17O6
37Cl H+ 356.0796 356.063435Cl-dehydro-griseofulvin C17H15O6
35Cl Na+ 373.0455 373.045635Cl-griseofulvin C17H17O6
35Cl Na+ 375.0611 375.0466X1 389.0195Roquefortine C C22H23N5O2 H+ 390.1930 390.1930X2 417.1798X3 418.1843Meleagrin C23H23N5O4 H+ 434.1828 434.1838Meleagrin 13CC22H23N5O4 435.1862 435.1876X4 436.1991X5 437.2033Oxaline C24H25N5O4 H+ 448.1985 448.1955Oxaline 13CC23H25N5O4 H+ 449.2018 449.2027Cyclopiamine H+ 468.246913C-cyclopiamine H+ 469.2549
6 8 6 N a t . P r o d . R e p . , 2 0 0 5 , 2 2 , 6 7 2 – 6 9 5

Fig. 7 Prediction of metabolite production from the mass profile ofP. coprophilum (IBT 21517). Shown at the bottom is a small sectionof the full mass profile from Fig. 6. The ions found in this part ofthe spectrum correspond closely to spectra calculated for protonateddehydro-griseofulvin and protonated griseofulvin.
The formula of the unknown ions shown in Table 5 can bepredicted under the assumption that only carbon, hydrogen,oxygen and nitrogen are present and given a mass accuracy. Themass accuracy can in this case be predicted from the known ions,in this case about 5 ppm. If we furthermore assume that 417 isthe 12C isotope and 418 is the 13C isotope (require that exactlyone 13C is present) we can calculate all possible formulae. Theresults are shown in Table 6. Only two formulae fit within thelimits for both ions: C23H23N5O3, C25H25N2O4 assuming thatthese ions are protonated we need to subtract a proton to get thereal formula. The first of these formulae will then have an evennumber of hydrogens which is not possible with an odd numberof nitrogens, hence the second formula is the most likely. Severaldatabases may help getting a candidate for this formula, see next
Table 6 Calculating the elemental composition of the unknown X2and X3 ions from Table 5. Mass accuracy 5.0 ppm, double bondequivalent min = −0.5, max = 50.0 considering both odd and evenelectron ions. Search limits 12C < 500; H < 1000; N < 7; O < 13. Firstsearch X2 of m/z 417.1798 assuming all 12C carbons: 481 formulae wereevaluated with 3 results within limits. Second search X3 of m/z 418.1843requiring one 13C: 4536 formulae were evaluated with 5 results withinlimits
Mass Calc. mass mDa ppm DBE Formula
417.1798 417.1801 −0.2 −0.6 15.0 C23H23N5O3
417.1788 1.1 2.6 10.0 C22H27NO7
417.1814 −1.6 −3.8 14.5 C25H25N2O4
418.1843 418.1848 −0.5 −1.1 14.5 13C12C24H25N2O4
418.1834 0.9 2.1 15.0 13C12C22H23N5O3
418.1853 −1.0 −2.3 2.0 13C12C10H27N7O10
418.1861 −1.8 −4.3 19.5 13C12C25H21N6
section. A similar analysis can be done for the unknown ion pairX4 and X5 ion pair and m/z 436 and 437 respectively.
6.3 Target analysis and dereplication by MS
Effective dereplication methodologies should aim to ensure thatisolation, structure elucidation and pharmacological investiga-tions are focused on novel compounds. In this scenario, massspectrometry and especially high resolution mass spectrometryis the core technology for dereplication used in combinationwith databases such as Antibase, and MarinLit.199,214,220–224 It canbe argued whether dereplication should be done before or aftera bio-assay step (see overview Fig. 1).
The key issue in dereplication is to assign the ions tochromatographic peaks in the LC-MS spectrum correctly, a taskthat can vary from being very easy to impossible. In positivemode alkaloids usually ionize well and amides reasonably well,whereas sugars and other polyols ionise very poorly. Carboxylicacids have a reputation of ionizing poorly in positive mode,however this is not always the case, although it is certainlytrue for phenolics and aromatic carboxylic acids.225 Even smallstructural changes between molecules can induce significantchanges in response factors, a good example of this scenariois the type A and B trichothecenes. The keto group in theType B (presumably tautomerisation into a triol), are poorlydetected using ESI+, however very good ionization is seenwhen using ESI−, whereas the opposite is the case for thetype A ones. Therefore it may be advantageous to use on-line positive/negative ionisation during the chromatographicrun. Ion-traps and quadrupole instruments can easily do thiswhereas TOF instruments have problems doing this and stillrun in accurate mass mode. Moreover buffering of the solventsystem is even more restricted using polarity switching so fortrace analysis or for very dirty samples it is still advantageous torun the samples in separate runs with different solvent systems.
It should be noted that the ions formed in both positiveand negative mode are even-electron ions compared to classicpositive electron impact ionization (EI+) mass spectrometry(MS) where odd-electron ions are formed. This means that thefragmentation mechanisms are fundamentally different.
ESI+ is the most versatile ionization mode and when workingwith low resolution data a deconvolution analysis of the data fileis the fastest. However, this is not possible using the full accuracyof modern TOF instruments as no commercial software canhandle this at the moment. In this case the approach is to: i)obtain a background subtracted average spectrum of the peakof interest; ii) deconvolute all the ions from this spectrum tomake sure that they are not coming from co-eluting compounds.The spectrum is first investigated for the presence of A + 2 andA + 4 ions, showing chlorine, bromine, and many (>3) sulfuratoms just as known from classic EI+ mass spectrometry. Thedeconvoluted mass spectrum is then assessed for ions seen inTable 7, this means in practice jumps of 22 (H+ to Na+), 5 (NH4
+
to Na+), 63 (H+ to Na+ + CH3CN), 18 (loss of water), 36 (lossof 2 waters) and other jumps calculated from Table 7. Spectrashould also be examined for dimers [2M + H]+ and [2M + Na]+,which for some compounds can be even more predominant thanthe monomeric ions. Acids can exchange H+ to Na+ by a simpleion exchange mechanism and subsequent adduct formation withNa+ gives [M–H + 2Na]+, which very strongly indicates that thetarget compound is a carboxylic acid.
Sodium adduct ions are very stable compared with bothprotonated and ammoniated ions and we have found thatidentification of the sodium adduct ion(s) is very important fora confident molecular mass determination. To make it easierto find the sodiated adduct ion(s) it is advantageous to useion-source CID fragmentation as pseudo MS/MS, as it willenhance their abundance along with fragment ions whereasthe relative abundance of the protonated and ammoniated ionswill decrease. This is done by using two “simultaneous” scan
N a t . P r o d . R e p . , 2 0 0 5 , 2 2 , 6 7 2 – 6 9 5 6 8 7

Table 7 Common ions observed during LC-MS analyses of small moleculesa
Positive Negative
Common adducts [M + H]+, [M + NH4]+, [M + Na]+ [M + CH3CN + H]+, [M +CH3CN + Na]+, [M + K]+
[M − H]−, [M + HCOO]−, [M +CH3COO]−
Less common adducts [M–H + 2Na]+ [M − 2H + Na]−, [M + Na − 2H+ CH3COOH]−
Common fragments [M + H − H20]+, [M + H − 2(H2O)]+, [M + H − 3(H2O)]+, [M +H − CO2]+
[M − H − CO2]−
Less common fragments [M + H − CH4O]+, [M + H–CH3COOH]+, [Fragment + NH3]+
[Fragment + CH3CN]+
Polymeric ions [2M + H]+, [2M + NH4]+, [2M + Na]+ [2M − H]−
a (<1500 Da).
Fig. 8 Confirmation of some of the findings shown in Fig. 7 using narrow ion traces (±0.01 Da except in two chromatograms) from accurate LC-MSanalysis of the same sample. The detector was overloaded for some of the ions (the 12C isotopes of dehydro-griseofulvin and griseofulvin) giving toolow mass values due to the detector dead time error. The two peaks marked with an X are due to the high intensity error.
functions where one is set with a very low potential differencebetween the two skimmers in the ion-source and one with a highpotential difference. The deconvoluted mass spectra from thetwo scan functions are then compared.
As seen in Table 7 fragment ions with adducts of acetonitrileand NH3 occasionally occur, however, we have rarely if everseen fragments with sodium adducts, although they can beformed in an ion-trap.226 In ion-source CID, small moleculesare fragmented much more vigorously than larger molecules asthe kinetic energy (potential difference between skimmers) is thesame, meaning that the velocity is proportional to the squareroot of the potential difference between the skimmers, e.g. atm/z 150 Da ion will get double the velocity of a m/z 600 ionand thus be fragmented much more.
Except for scientists working with specific groups of com-pounds not ionizing very well in positive mode, positive ion-ization data will usually be available, and ESI− will in manycases just be used to confirm what is suspected from positivemode unless “no ionization” was obtained by ESI+. Neverthelessit is always safest to have a molecular mass assigned fromanalysis using both polarities indicating the same molecularweight (see for example data for chaetoviridin A 48 in Fig. 9).Usually ESI− generated spectra are far simpler to analyse thanESI+ spectra. When using ESI− [M − H]− or an adduct withformate and/or acetate can be detected, depending on whichof the acids is present in the solvent. These acid adducts cansome times be so predominant that the deprotonated ions are notdetected.
6 8 8 N a t . P r o d . R e p . , 2 0 0 5 , 2 2 , 6 7 2 – 6 9 5
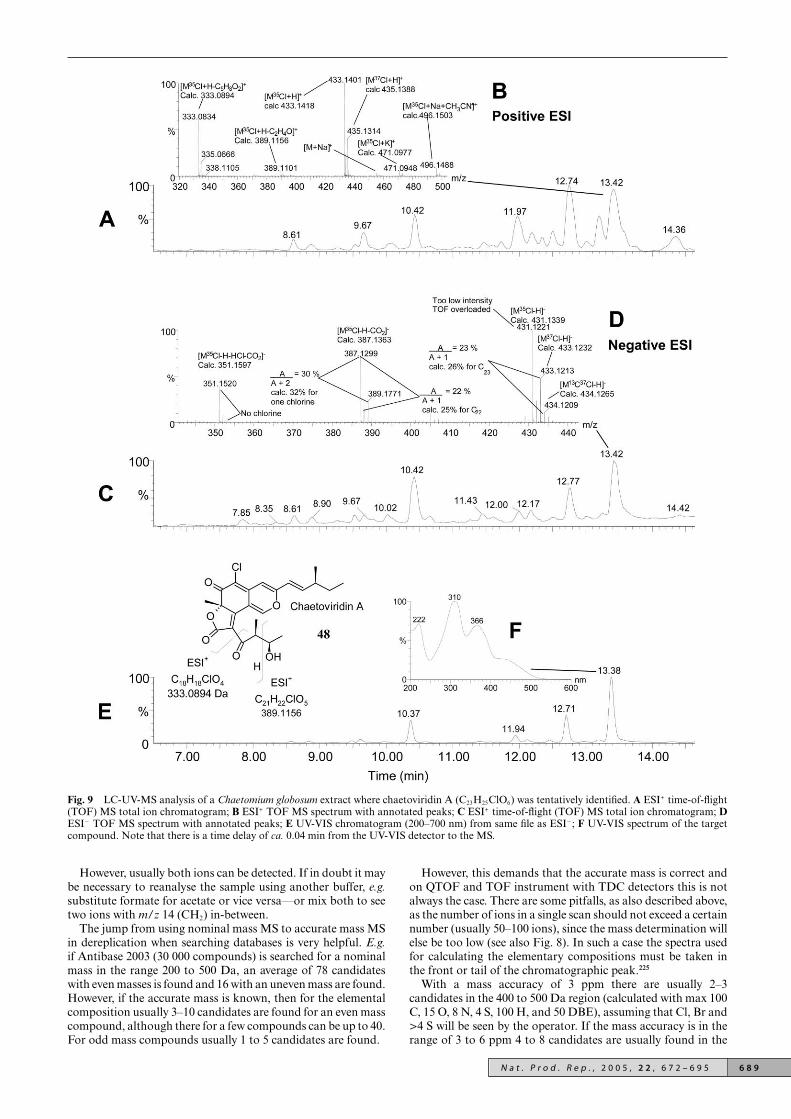
Fig. 9 LC-UV-MS analysis of a Chaetomium globosum extract where chaetoviridin A (C23H25ClO6) was tentatively identified. A ESI+ time-of-flight(TOF) MS total ion chromatogram; B ESI+ TOF MS spectrum with annotated peaks; C ESI+ time-of-flight (TOF) MS total ion chromatogram; DESI− TOF MS spectrum with annotated peaks; E UV-VIS chromatogram (200–700 nm) from same file as ESI−; F UV-VIS spectrum of the targetcompound. Note that there is a time delay of ca. 0.04 min from the UV-VIS detector to the MS.
However, usually both ions can be detected. If in doubt it maybe necessary to reanalyse the sample using another buffer, e.g.substitute formate for acetate or vice versa—or mix both to seetwo ions with m/z 14 (CH2) in-between.
The jump from using nominal mass MS to accurate mass MSin dereplication when searching databases is very helpful. E.g.if Antibase 2003 (30 000 compounds) is searched for a nominalmass in the range 200 to 500 Da, an average of 78 candidateswith even masses is found and 16 with an uneven mass are found.However, if the accurate mass is known, then for the elementalcomposition usually 3–10 candidates are found for an even masscompound, although there for a few compounds can be up to 40.For odd mass compounds usually 1 to 5 candidates are found.
However, this demands that the accurate mass is correct andon QTOF and TOF instrument with TDC detectors this is notalways the case. There are some pitfalls, as also described above,as the number of ions in a single scan should not exceed a certainnumber (usually 50–100 ions), since the mass determination willelse be too low (see also Fig. 8). In such a case the spectra usedfor calculating the elementary compositions must be taken inthe front or tail of the chromatographic peak.225
With a mass accuracy of 3 ppm there are usually 2–3candidates in the 400 to 500 Da region (calculated with max 100C, 15 O, 8 N, 4 S, 100 H, and 50 DBE), assuming that Cl, Br and>4 S will be seen by the operator. If the mass accuracy is in therange of 3 to 6 ppm 4 to 8 candidates are usually found in the
N a t . P r o d . R e p . , 2 0 0 5 , 2 2 , 6 7 2 – 6 9 5 6 8 9

400 to 500 Da region. To validate the elemental compositionor narrow down the number of candidates, the elementalcomposition should be calculated for all the adducts, dimeric,and fragment ions which can be unambiguously assigned asdemonstrated by Nielsen and Smedsgaard.225 Subsequently orintegrated in the latter process isotope ratios of A, A + 1, A +2, A + 3, etc. can be investigated further e.g. eliminating sulfurand removing candidates where the A and A + 1 ratios does notsupport the number of calculated carbon atoms. In this processit is vital to know if there are interfering co-eluting compoundswhich may affect the measured isotope pattern. It is also vital toknow how accurate the MS in use shows the true isotope pattern,which can easily be checked on some known compounds.
The final step in the dereplication process is to search eitherthe candidate(s) from the elementary composition calculationsor the molecular mass in appropriate databases, i.e. Antibase,MARINLIT , NAPRALERT , and Dictionary of Natural Prod-ucts. The hit(s) from the database search are then matchedagainst the UV-VIS data from the target peak (see next section),which usually can eliminate many candidates. After that theretention on the chromatographic system can be assessed andusually many very polar/apolar compounds can be eliminatedbased on such comparisons. The ionization efficiency in positiveversus negative mode and relative UV-VIS also gives some validinformation. E.g. amines will always ionize well so if a verysmall peak is seen in positive mode whereas large peaks are seenin negative and/or UV then the compound is not an alkaloid.Finally the fragments obtained by in-source fragmentationand/or data-depended MS/MS can be evaluated against theremaining structures.
6.4 Chemical image analysis—UV spectral analysis
With the advancement of HPLC and UPLC as well as muchmore stable and better columns for high resolution separation,combined with fast UV diode array detectors it has becomeeasy to acquire the UV spectrum of practically every singlecomponent from an extract. Consequently the UV spectrumhas turned into being one of the most readily accessible piecesof information related to structure of NPs why there is increasedinterest in exploiting its usefulness.227
However, the chromatographic data matrix can also be viewedas a landscape with the retention time being the first dimension,the spectrum the second, and finally the detected values the third.These topographic landscapes can be compared automaticallyusing techniques from image analysis. However, it is crucialto correct for different artefacts due to differences in theinstrumental acquisition procedure from analysis to analysis.Some of the most important artefacts include baseline driftsand shifts in retention time. Baseline correction is done throughsubtraction of an estimated baseline, wavelength by wavelength.The baseline drift can be regarded as a nonlinear function, butmost often segments are detected from which the baseline isestimated by partially linear interpolation.
In order to compensate for the minor shifts in retention time,it is necessary to align the chromatograms. All methods are moreor less derivatives of the same basis; to warp the time axis of achromatogram in order to obtain the best match to a referencechromatogram. An early attempt of developing a retentiontime warping algorithm was made by Wang and Isenhour.228
Since then, improvements have been made based on differentoptimization criteria.229–231 But the probably most efficient wayto do aligning is through the correlation optimized warping(COW) technique, using all the trace information available.232,233
Although time consuming, COW has proven to be the methodthat gives the best results.234 Whereas the aligning algorithmsfocus on solving the problem of shifts in the retention time byoptimizing the trace profiles, spectral shape information canbe added to the different aligning concepts.235 In addition, thesimilarity between two HPLC matrices Xi and Xj is evaluated
in two steps: 1) The similarity between the UV-spectra where Xi
has peaks, and 2) the similarity between the UV-spectra where Xj
has peaks. The peaks were found as the mean absorbance valuefrom each aligned spectrum, followed by a smothering using asimple mean filtering over a window of 9 UV-spectra. This wasfound to be both fast and sufficient to remove the small spikesthat could be present; however, other filtering techniques couldbe applied if needed.236 The principle of the method is based onevaluating the spectral information present in the HPLC datamatrices, and the algorithm consists of two parts:
1) Calculation of a local similarity, followed by2) calculation of a global similarity between the HPLC data
matrices.For two chromatographic data matrices a vector of locally
aligned full spectral similarities is calculated along the retentiontime axis. The vector depicts the evaluation of the alikenessbetween two fungal extracts based upon eluted compoundsand corresponding UV-absorbance spectra. By comparing co-eluting components by their UV-spectra across samples, in-formation about the (dis)similarity between actual compoundscould be examined. The similarity was evaluated as a “distance”between the observed UV-spectra. Based on these spectraclassification of the samples can be made.204,235
One of the major advantages of applying the method is thatthe chemical diversity can be calculated by selecting only a fewinput parameters involved in the process. 1) Which part of thechromatograms and which spectral range to include, 2) performa simple baseline correction, 3) align the chromatograms bywarping, 4) scale the chromatograms and finally 5) calculatethe similarity. Therefore, the method removes the bias fromcomparisons and makes reproducibility possible between datafiles made at different periods. Most algorithms used for warpingmainly rely on chromatographic traces, and problems may occurwhen several compounds are eluting within a short period oftime. By using the full UV-spectral information in the aligning,the algorithm aligns peaks having the same UV-spectrum.
6.5 Dereplication and partial identification of NPs byUV-based techniques
Apart from exact structural formulae structural databases usu-ally also contain physical chemical data including UV maximaand minima characteristics of the included compounds. Todayonly few organic chemists rely on UV as a primary tool forstructural elucidation, one reason being that the absorptionfrequencies of the C–C, C–H and isolated C=C groups cannotbe observed in the easily accessible region of the UV spectrum.However, many natural products such as polyketides andalkaloids derived from aromatic amino acids have characteristicUV spectra (Fig. 10) due to their polyunsaturated nature. Inaddition many such NPs often have one or more carbonyl groupsas part of ketone, carboxylic acid, ester or amide functionalgroups.
One early report using a UV based library for dereplicationof mycotoxins is the work by Frisvad and Thrane,237 whoused characteristic UV spectra of 187 mycotoxins and othersecondary metabolites for chemotaxonomy and food safetystudies.
Nielsen and Smedsgaard extended this fungal metabolitedatabase to 474 metabolites now also including MS spectraldata.225 Other research groups have developed similar in-houseHPLC-UV-VIS databases for dereplication purposes.238 ThusFiedler et al.239 used their database containing approx. 750 UVspectra to investigate a set of 600 marine actinomycete strainsfor production of both a number of known antibiotics but alsoas an approach to discover possible new metabolites. SimilarlyLarsen et al. used a knowledge based UV-guided approachfor detection and isolation of novel alkaloid compounds fromfungal extracts.240–242 In order to systematise and keep trackof data and structural knowledge related to UV-spectra of
6 9 0 N a t . P r o d . R e p . , 2 0 0 5 , 2 2 , 6 7 2 – 6 9 5

Fig. 10 Six similar but still slightly different and characteristic UV spectra of fungal alkaloids (anacine 49, verrucine A 50, alantrypinone 51, lapatinA 52, sclerotigenin 53 and auranthine 54) that can be used for targeting of both known and new (but similar) natural products by X-hitting.235,243
both known and possible new fungal metabolites Hansen et al.recently developed a new algorithm called X-hitting to be usedin combination with a learning-based database.235 In X-hittingalready known metabolites are tracked by the feature cross-hitting, whereas potential new metabolites are indicated by thenew-hitting feature of X-hitting. The algorithm behind X-hittingcompares the shape between two spectra and returns a similarityindex describing how statistically similar the two spectra are. Inorder to capture information about the actual shape of eachof the profiles at different scales (coarser or finer details), alinear combination of the correlation between higher orderderivatives are used. A main criterium being retaining relationsbetween “neighboring” values in spectra and in addition, thatthe algorithm has to be fast to compute. By using derivatives suchrelationships can be incorporated by measuring the differencesand the positions of topologies and extreme points. Finallyfiltering techniques are applied to the derivatives in order toreduce the sensitivity to potential noise fragments in the spectra.Regarding the drug discovery process the great potential ofcross-hitting is its ability to support the choice of the optimalorganism for production of a given natural product. This is
the case both in de-screening of strains producing mycotoxins,but maybe even more important also for the tracking of newspecies producing a desired compound (in this scenario a newdrug lead). In this way cross-hitting of known compoundscan be applied for new-hitting of organisms. Very often acertain compound is produced as a minor metabolite by onespecies (under certain conditions), while it appears as one ofthe major metabolites produced by another completely differentspecies.
The scope of the new-hitting feature of “X-hitting” is inscenarios where a new lead such as a quinazoline (anacine 49,verrucine 50, alantrypinone 51, lapatin A 52) or a benzodi-azepine (sclerotigenin 53, auranthine 54) (Fig. 10) have alreadybeen discovered by bio-guided screening. Due to the very similarstructure of these two types of compounds (Fig. 10), that bothincorporate anthranilic acid, they have very distinct and similarchromophore systems, and can easily be tracked down from largedata sets of HPLC Diode array data by X-hitting.235 Thus usingthe cross-hitting feature of X-hitting we can easily detect manyof the known quinazolines and benzodiazepines (unpublisheddata) produced by Penicillium and Aspergillus.
N a t . P r o d . R e p . , 2 0 0 5 , 2 2 , 6 7 2 – 6 9 5 6 9 1

Recently, Larsen et al. demonstrated the potential of new-hitting by finding the two novel quinazolines lapatin A (52) andB.243 Isolation of some new benzodiazepines by our group usingnew-hitting is in progress, where the use of sclerotigenin as targetUV-spectrum gives several hits in an extract of Aspergillus janus.We predict that new-hitting will be a powerful alternative tofinding/generating new leads by traditional organic synthesis orby combinatorial chemistry methodologies.
6.6 Metabolite fingerprinting, profiling and target analysis byNMR
Traditionally NMR has been used for structural elucidation ofpure compounds or relatively simple mixtures of compoundsgenerated from e.g. organic synthesis. The recent combinationof high-performance liquid chromatography interfaced to NMRhas eliminated the need to purify a compound before analysis.NMR spectra can either be recorded in continuous or stoppedflow. Furthermore the output from an HPLC can be split intotwo pathways, one for NMR analysis and the other for MS,increasing the sensitivity by using a solid phase extraction (SPE)step between the HPLC column and the NMR spectrometer.209
Thus several papers report the characterisation of numerousnatural products directly from complex mixtures using LC-NMR.244–247 When combined with computer assisted softwareprograms for structural elucidation,248,249 the task of identifyingboth known and new NPs by NMR have surely become a mucheasier task within the last 5–10 years.
More recently the analysis of complex mixtures and biofluidswith the purpose of categorizing large numbers of individualspectra by NMR spectroscopy by computational methods hasbecome an increasing application. This covers areas such asdisease diagnosis, quality control of foods such as citrus juices,edible/olive oils, wine/beer.208,250,251 Even though it is still achallenge, metabolite fingerprinting by NMR is considered afast, convenient, and effective tool for discriminating betweengroups of related samples just based on a comparison onthe distribution of intensity in the NMR rather than on theassignment of the individual signals.209
To our knowledge no attempts have been made to use e.g.1H NMR spectra as part of a microbial drug discovery processusing e.g. 1H NMR spectra with the purpose of clustering dataof microbial extracts into chemotypes in a similar way as directMS profiling has been used.207 On the other hand NMR hasbeen extensively used in plant metabolomics where some arguethat the metabolome is a fundamentally important biochemicalmanifestation of the genome, each extract defining a metabolicphenotype that forms the basis for discriminating between plantsof different genotypes.209 These are altogether arguments thatare in very good agreement with the major conclusions drawnin this review. In our opinion the potential for using NMR ofcrude extracts as part of a microbial drug discovery process islargely untapped even though issues such as stringent control ofsample preparation, with precise control of the pH, and precisetemperature control during acquisition need to be addressed.
7. Conclusions and future perspectives
With the genomic revolution the need for new pharmaceuticalleads is enormous. Since there are still many unexploredresources in Nature, the potential for finding new organisms andthereby new metabolic pathways is also enormous. Thereforenatural products still have a very important role to playin the drug discovery process, especially due to their oftenvery complex and chiral nature. A large proportion of newleads/scaffolds in the future can therefore be expected to beNPs and natural product chemistry should therefore not beconsidered a competing discipline to combinatorial chemistry.Instead a combination of the two disciplines seems to be theright track to follow in the search for valuable new drugs.
In this review we have argued that microbial organisms, andat least eukaryotic filamentous fungi, are very consistent in theirproduction of secondary metabolites at the species level whencultured under standardized conditions. In other words strainsof different species represent different chemotypes, whereasstrains of the same species represent the same chemotype. Wehave shown that these differences and similarities can easilybe analyzed for using direct analytical profiling techniquessuch as DI-HRMS in combination with modern chemoinfor-matics tools. This might not be the case for other organismssuch as Actinomycetes where horizontal gene transfer couldbe a pronounced event leading to potential transferring ofbiosynthetic pathways. Recent studies on the new marine genusSalinospora, however, showed a clear correlation between speciesand classes of compounds produced, indicating a large degreeof chemoconsistency also within these types of organisms.31
Additional types of organisms, including several genera andspecies need to be studied in order to prove our hypothesis thatsecondary metabolites in most cases will be very consistentlyproduced at the species level also in other microorganisms thanfilamentous fungi.
We have argued that instead of including many identicalstrains with the same chemotypes in a drug discovery screen-ing process, the effort should instead be addressed on theinvestigation of much fewer talented strains under multipleculture conditions for optimization of secondary metaboliteproduction in order to fully explore the secondary metabolitepotential of a given organism. Also a combined taxonomicand thereby ecological knowledge about a given species willpoint towards investigation of relevant stimulation studies suchas the stimulation of fungal metabolite production by addingplant extracts or by co-cultivation of relevant natural co-existingorganisms.
A chemical based drug discovery approach is not only impor-tant in the process of dereplicating of culture collections, butalso in the dereplication of single compounds using hyphenatedanalytical techniques interphasing LC with MS, NMR andUV. The importance of high resolution MS in this contextis of course substantial, with the possibility of using accuratemasses for suggesting molecular formulae that can be searchedin various databases. However, the fact that many biologicalactive NPs contain conjugated systems and thereby more orless specific UV-chromophores could also be applied as animportant aid not only in the dereplication process both alsofor the search and discovery of novel bioactives with similarstructural features as already known bioactives. The differentspectroscopic information that can be gained from MS, NMRand UV complement each other and are all expected to play andimportant role in future chemoinformatics based drug discoveryapproaches.
8. Acknowledgements
The authors wish to acknowledge the support from The DanishResearch Councils for the Program for Predictive Biotechnology(2000–2004) (Grant No. 9901295) and the IVC Center forMicrobial Biotechnology (2004–2008) (Grant No. 46–00–0005),during which many of the ideas, methodologies, and resultspresented here were generated.
9. References
1 M. S. Butler, J. Nat. Prod., 2004, 67, 2141.2 M. S. Butler, Nat. Prod. Rep., 2005, 22, 162.3 J. C. Frisvad and R. A. Samson, Stud. Mycol., 2004, 49, 1.4 D. H. Williams, M. J. Stone, P. R. Hauck and S. K. Rahman, J. Nat.
Prod., 1989, 52, 1189.5 A. L. Demain, Appl. Microbiol. Biotechnol., 1999, 52, 455.6 W. R. Strohl, Drug Discovery Today, 2000, 5, 39.7 G. L. Verdine, Nature, 1996, 384s, 11.8 L. Muller-Kuhrt, Nat. Biotechnol., 2003, 21, 602.
6 9 2 N a t . P r o d . R e p . , 2 0 0 5 , 2 2 , 6 7 2 – 6 9 5

9 D. J. Newman, G. M. Cragg and K. M. Snader, J. Nat. Prod., 2003,66, 1022.
10 A. Ganesan, Curr. Opin. Biotechnol., 2004, 15, 584.11 G. A. Petsko, Nature, 1996, 384s, 7.12 L. J. Nisbet and M. Moore, Curr. Opin. Biotechnol., 1997, 8, 708.13 V. Knight, J. J. Sanglier, D. DiTullio, S. Braccili, P. Bonner, J. Waters,
D. Hughes and L. Zhang, Appl. Microbiol. Biotechnol., 2003, 62,446.
14 J. W. Costerton, P. S. Stewart and E. P. Greenberg, Science, 1999,284, 1318.
15 D. G. Davies, M. R. Parsek, J. P. Pearson, B. H. Iglewski, J. W.Costerton and E. P. Greenberg, Science, 1998, 280, 295.
16 T. B. Rasmussen, M. E. Skindersø, T. Bjarnsholt, R. K. Phipps, K. B.Christensen, J. B. Andersen, B. Koch, T. O. Larsen, M. Hentzer, N.Høiby and M. Givskov, Microbiology, 2005, 151, 1325.
17 A. T. Bull, J. E. M. Stach, A. C. Ward and M. Goodfellow, Antonievan Leeuwenhoek, 2005, 87, 65.
18 A. T. Bull, A. C. Ward and M. Goodfellow, Microbiol. Mol. Biol.Rev., 2000, 64, 573.
19 G. M. Muller, G. F. Bills and M. S. Foster, Biodiversity ofFungi. Inventory and Monitoring Methods, Elsevier Academic Press,Amsterdam, 2004, 777 pp.
20 M. Jaspars and L. Lawton, Curr. Opin. Drug Discovery Dev., 1998,1, 77.
21 J. Blunt, B. R. Copp, M. H. G. Munro, P. T. Northcote and M. R.Prinsep, Nat. Prod. Rep., 2005, 22, 15.
22 J. C. Frisvad, in Innovative Roles of Biological Resource Centers, ed.M. M. Watanabe, K. Suzuki and T. Seki, Japan Society for CultureCollections & World Federation for Culture Collections, Tsukuba,2004, p. 165.
23 J. C. Frisvad, T. O. Larsen, P. W. Dalsgaard, K. A. Seifert, G. Louis-Seize, E. K. Lyhne, B. B. Jarvis, J. C. Fettinger and D. P. Overy,Int. J. Syst. Evol. Microbiol., 2005, in press.
24 P. W. Dalsgaard, T. O. Larsen and C. Christophersen, J. Nat. Prod.,2004, 67, 878.
25 P. W. Dalsgaard, J. W. Blunt, M. H. G. Munro, T. O. Larsen and C.Christophersen, J. Nat. Prod., 2004, 67, 1950.
26 P. W. Dalsgaard, T. O. Larsen and C. Christophersen, J. Antibiot.,2005, 58, 141.
27 O. Filtenborg, J. C. Frisvad and U. Thrane, Int. J. Food Microbiol.,1996, 33, 85.
28 B. Haefner, Drug Discovery Today, 2003, 8, 536.29 J. E. M. Stach and A. T. Bull, Antonie van Leeuwenhoek, 2005, 87,
3.30 U. Holler, A. D. Wright, G. F. Matthee, G. M. Konig, S. Draeger,
H.-J. Aust and B. Schulz, Mycol. Res., 2000, 104, 1354.31 P. R. Jensen, T. J. Mincer, P. G. Willaims and W. Fenical, Antonie
van Leeuwenhoek, 2005, 87, 43.32 C. E. Salomon, N. A. Magarey and D. H. Sherman, Nat. Prod. Rep.,
2004, 21, 105.33 E. W. Schmidt, J. T. Nelson, D. A. Ratsko, S. Sudek, J. A. Eisen,
M. G. Haygood and J. Ravel, Proc. Natl. Acad. Sci. U. S. A., 2005,102, 7315.
34 P. F. Long, W. C. Dunlap, C. N. Battershill and M. Jaspars,ChemBioChem, 2005, 6, 1760.
35 D. L. Hawksworth, Mycol. Res., 1991, 95, 641.36 D. L. Hawksworth, Stud. Mycol., 2004, 50, 9.37 D. L. Hawksworth and A. Y. Rossman, Phytopathology, 1997, 87,
888.38 B. Schulz, C. Boyle, S. Draeger, A.-K. Rommert and K. Krohn,
Mycol. Res., 2002, 106, 996.39 A. Stierle, G. Stobel and D. Stierle, Science, 1993, 260, 214.40 A. Stierle and G. Stobel, J. Nat. Prod., 1995, 58, 1315.41 R. Verpoorte, Drug Discovery Today, 1998, 3, 232–238.42 P. F. Dowd, J. D. Miller and R. Greenhalgh, Mycologia, 1989, 81,
646.43 P. F. Dowd, in Handbook of Applied Mycology, Vol. 5: Mycotoxins in
Ecological Systems, ed. D. Bhatnagar, E. B. Lillehøj and D. J. Arora,Marcel Dekker, New York, 1992, p. 333.
44 D. T. Wicklow, in: Coevolution of Fungi with Plants and Animals, ed.K. A. Pirozynski and D. L. Hawksworth, Academic Press, London,1998, p. 173.
45 J. Gloer, Can. J. Bot., 1995s1, 73, 1265.46 Y. Zhang, C. Li, D. C. Swenson, J. B. Gloer, D. T. Wicklow and P. F.
Dowd, Org. Lett., 2003, 5, 773.47 C. Li, J. B. Gloer, D. T. Wicklow and P. F. Dowd, J. Nat. Prod.,
2005, 68, 319.48 D. P. Overy and J. C. Frisvad, Syst. Appl. Microbiol., 2003, 26, 631.49 M. Boysen, P. Skouboe, J. C. Frisvad and L. Rossen, Microbiology,
1996, 142, 541.50 K. Karlshøj and T. O. Larsen, J. Agric. Food Chem., 2005, 53, 708.
51 K. F. Nielsen, P. W. Dalsgaard, J. Smedsgaard and T. O. Larsen,J. Agric. Food Chem., 2005, 53, 2908.
52 J. Smedsgaard and J. Nielsen, J. Exp. Bot., 2005, 56, 273.53 K. Zengler, G. Toledo, M. Rappe, J. Elkins, E. J. Mathur, J. M. Short
and M. Keller, Proc. Natl. Acad. Sci. U. S. A., 2002, 99, 15681.54 M. S. Osburne, T. H. Grossman, P. R. August and I. A. MacNeil,
Am. Soc. Microbiol. News, 2000, 7, 411.55 J. Handelsman, M. R. Rondon, S. F. Brady, J. Clardy and R. M.
Goodman, Chem. Biol., 1998, 5, 245.56 D. Cowan, Q. Meyer, W. Stafford, S. Muyanga, R. Cameron and P.
Wittwer, Trends Biotechnol., 23, 321.57 N. Peric-Concha and P. F. Long, Drug Discovery Today, 2003, 8,
1078.58 J. Kennedy and C. R. Hutchinson, Nat. Biotechnol., 1999, 17, 538.59 B. S. Moore, J. A. Kalaitzis and L. Xiang, Antonie van Leeuwenhoek,
2005, 87, 49.60 J. Staunton and K. J. Weissman, Nat. Prod. Rep., 2001, 18, 380.61 B. A. Pfeifer and C. Khosla, Microbiol. Mol. Biol. Rev., 2001, 65,
106.62 J. Nielsen, Curr. Opin. Microbiol., 1998, 1, 330.63 J. Nielsen, Appl. Microbiol. Biotechnol., 2001, 55, 263.64 S. Kosemura, Tetrahedron, 2003, 59, 5055.65 S. A. Waksman and E. Bugie, Proc. Natl. Acad. Sci. U. S. A., 1943,
29, 282.66 R. L. Monaghan, J. D. Polishook, V. J. Pecore, G. F. Bills, M. Nallin-
Olmstead and S. L. Streicher, Can. J. Bot., 1995, 73s1, 925, ISBN87-88584-44-5.
67 A. Ciegler, D. I. Fennell, D. A. Sansing, R. W. Detroy and G. A.Bennett, Appl. Microbiol., 1973, 26, 271.
68 G. Engel, K. E. von Milczewskii, D. Prokopek and M. Teuber, Appl.Environ. Microbiol., 1982, 43, 1034.
69 J. C. Frisvad, Dr. Tech. Dissertation, Technical University ofDenmark, 1998.
70 M. Wink, Phytochemistry, 2003, 64, 3.71 H. T. Lumbsch, in Chemical Fungal Taxonomy, ed. J. C. Frisvad,
P. D. Bridge and D. K. Arora, Marcel Dekker, New York, 1998, p.345.
72 J. C. Frisvad, U. Thrane and O. Filtenborg, in Chemical FungalTaxonomy, ed. J. C. Frisvad, J. C., P. D. Bridge and D. K. Arora,Marcel Dekker, New York, 1998, p. 289.
73 J. C. Frisvad, J. M. Frank, J. A. M. Houbraken, A. F. A. Kuijpersand R. A. Samson, Stud. Mycol., 2004, 50, 23.
74 R. A. Samson, J. A. M. Houbraken, A. F. A. Kuijpers, J. M. Frankand J. C. Frisvad, Stud. Mycol., 2004, 50, 4561.
75 J. C. Frisvad, J. Smedsgard, T. O. Larsen and R. A. Samson, Stud.Mycol., 2004, 49, 201.
76 V. Hellwig, Y.-M. Ju, J. D. Rogers, Fournier and M. Stadler, Mycol.Prog., 2005, 4, 39.
77 C. Thom, The Penicillia, Williams and Wilkins, Baltimore, MD,1930.
78 K. B. Raper and C. Thom, A Manual of the Penicillia, Williams andWilkins, Baltimore, MD, 1949.
79 K. B. Raper and D. I. Fennell, The genus Aspergillus, Williams andWilkins, Baltimore, MD, 1965.
80 J. C. Frisvad, Arch. Environ. Contam. Toxicol., 1989, 18, 331.81 R. D. Hutchinson, P. S. Steyn and S. J. van Rensburg, Toxicol. Appl.
Pharmacol., 1973, 24, 507.82 A. E. de Jesus, W. E. Hull, P. S. Steyn, F. R. van Heerden and R.
Vleggaar, J. Chem. Soc., Chem. Commun., 1982, 16, 902.83 J. C. Frisvad and O. Filtenborg, Mycologia, 1989, 81, 836.84 J. I. Pitt, R. A. Samson and J. C. Frisvad, in Integration of Modern
Taxonomic Methods for Penicillium and Aspergillus Classification,ed. R. A. Samson, and J. I. Pitt, Harwood Academic Publishers,Amsterdam, 2000, p. 9.
85 J. C. Frisvad, O. Filtenborg, R. A. Samson and A. C. Stolk, Antonievan Leeuwenhoek, 1990, 57, 179.
86 J. C. Frisvad and O. Filtenborg, in Modern Concepts in Penicilliumand Aspergillus Classification, ed. R. A. Samson, and J. I. Pitt,Plenum Press, New York, 1990, p. 373.
87 J. C. Frisvad and O. Filtenborg, in Modern Concepts in Penicilliumand Aspergillus Classification, ed. R. A. Samson, and J. I. Pitt,Plenum Press, New York, 1990, p. 159.
88 B. Andersen, J. Smedsgaard and J. C. Frisvad, J. Agric. Food Chem.,2004, 52, 2421.
89 S. Sonjak, J. C. Frisvad and N. Gunde-Cimerman, FEMS Microbiol.Ecol., 2005, 53, 51.
90 J. F. Makins, G. Holt and K. D. MacDonald, J. Gen. Microbiol.,1983, 116, 3027.
91 S. A. Waksman and E. S. Hornung, Mycologia, 1943, 35, 47–65.92 S. A. Waksman and A. Schatz, Proc. Natl. Acad. Sci. U. S. A., 1943,
29, 74.
N a t . P r o d . R e p . , 2 0 0 5 , 2 2 , 6 7 2 – 6 9 5 6 9 3

93 S. A. Waksman, E. S. Hornung and E. L. Spencer, J. Bacteriol.,1943, 45, 47.
94 O. Filtenborg, J. C. Frisvad and U. Thrane, in Modern Conceptsin Penicillium and Aspergillus Classification, ed. R. A. Samson andJ. I. Pitt, Plenum Press, New York, 1990, p. 433.
95 K. B. Raper, D. F. Alexander and R. D. Coghill, J. Bacteriol., 1944,48, 639.
96 S. P. Brundidge, F. C. A. Gaeta, D. J. Hook, C. Jr. Sapino, R. P.Elander and R. B. Morin, J. Antibiot., 1980, 33, 1348.
97 S. J. Andersen and J. C. Frisvad, Lett. Appl. Microbiol., 1994, 19,486.
98 E. L. Dulaney, Mycologia, 1947, 39, 570.99 D. S. Cole, G. Holt and K. D. MacDonald, J. Gen. Microbiol., 1976,
96, 423.100 A. P. MacCabe, M. B. R. Riach, S. E. Unkles and J. R. Kinghorn,
EMBO J., 1990, 9, 279.101 P. W. Clutterbuck, A. E. Oxford, H. Raistrick and G. Smith,
Biochem. J., 1932, 24, 1441.102 J. Jacquet and A. Tantaoui-Eleraki, Ann. Nutr. Aliment., 1977, 31,
563.103 P.-K. Chang, D. Bhatnagar, T. E. Cleveland and J. W. Bennett, Appl.
Environ. Microbiol., 1995, 61, 40.104 M. A. Klich, P.-K. Chang, E. J. Mullaney, D. Bhatnagar and T. E.
Cleveland, Appl. Microbiol. Biotechnol., 1995, 44, 439.105 K. Kusumoto, K. Mori, H. Nogata, H. Ohta and M. Manabe,
J. Ferment. Bioeng., 1996, 82, 161.106 K. Kusumoto, K. Yabe, Y. Nagata and H. Ohta, FEMS Microbiol.
Lett., 1998, 169, 303.107 K. Kusumoto, Y. Nogata and H. Ohta, Curr. Genet., 2000, 37, 104.108 A. J. Watson, L. J. Fuller, D. J. Jeens and D. B. Archer, Appl. Environ.
Microbiol., 1999, 65, 307.109 K. Matsushima, P.-K. Chang, J. Yu, D. Bhatnagar and T. E.
Cleveland, Appl. Microbiol. Biotechnol., 2001, 55, 585.110 K. Matsushima, K. Yashiro, Y. Hanya, K. Abe, K. Yabe and T.
Hamasaki, Appl. Microbiol. Biotechnol., 2001, 55, 771.111 T. Takahashi, P.-K. Chang, K. Matsushima, J. Yu, K. Abe,
D. Bhatnagar, T. E. Cleveland and Y. Koyama, Appl. Environ.Microbiol., 2002, 68, 3737.
112 F. Lund and J. C. Frisvad, Mycol. Res., 1994, 98, 481.113 F. Blank, W. C. Day and G. Just, J. Invest. Dermatol., 1963, 40, 133.114 J. G. Wirth, T. E. Beesley and S. R. Anand, Phytochemistry, 1965,
4, 505.115 A. S. Ng, G. Just and F. Blank, Can. J. Chem., 1969, 47, 1223.116 D. A. Geiser, J. C. Frisvad and J. W. Taylor, Mycologia, 1998, 90,
832.117 K. Furuya, R. Emokita and M. Shirasaka, Ann. Sankyo Res. Lab.,
1967, 19, 91.118 D. Broadbent, H. G. Hemming and G. McGowern, Trans. Br.
Mycol. Soc., 1974, 62, 625.119 B. B. Jarvis, W. G. Sorenson, E.-L. Hintikka, M. Nikulin, Y. Zhou,
J. Jiang, S. Wang, S. F. Hinkley, R. A. Etzel and D. G. Dearbom,Appl. Environ. Microbiol., 1998, 64, 3620.
120 M. Namikoshi, H. Kobayashi, T. Yoshimoto, S. Meguro and K.Akano, Chem. Pharm. Bull., 2000, 48, 1452.
121 J. C. Frisvad and R. A. Samson, Stud. Mycol., 2000, 45, 201.122 L. Wang, H.-B. Zhou, J. C. Frisvad and R. A. Samson, Antonie van
Leeuwenhoek, 2004, 86, 173.123 A. E. Oxford, H. Raistrick and P. Simonart, Biochem. J., 1939, 33,
240.124 E. G. Jeffreys, P. W. Brian, H. G. Hemming and D. Lowe, J. Gen.
Microbiol., 1953, 9, 314.125 P. W. Brian, P. J. Curtis and H. G. Hemming, Trans. Br. Mycol. Soc.,
1949, 32, 30.126 S. M. Clarke and M. McKenzie, Nature, 1967, 213, 504.127 P. W. Brian, P. J. Curtis and H. G. Hemming, Trans. Br. Mycol. Soc.,
1955, 38, 305.128 L. Leistner and C. Eckardt, Fleischwirtschaft, 1979, 59, 1892.129 M. Christensen, J. C. Frisvad and D. I. Tuthill, Mycol. Res., 1998,
103, 527.130 J. MacMillan, Chem. Ind. (London), 1951, 719.131 K. Udagawa and S. Abe, J. Antibiot., 1961, 14, 215.132 D. Kingston, P. Chen and J. R. Vercellotti, Phytochemistry, 1976,
15, 1037.133 P. W. Brian, Trans. Br. Mycol. Soc., 1960, 43, 1.134 B. Andersen, K. F. Nielsen and B. B. Jarvis, Mycologia, 2002, 94,
392.135 B. Andersen, K. F. Nielsen, U. Thrane, T. Szaro, J. W. Taylor and
B. B. Jarvis, Mycologia, 2003, 95, 1227.136 R. Bentley, Chem. Rev., 2000, 100, 3801.137 R. A. Samson, K. A. Seifert, A. F. A. Kuijpers, J. A. M. Houbraken
and J. C. Frisvad, Stud. Mycol., 2004, 49, 175.
138 P. Lafont, J.-P. Debeaupuis, M. Gaillardin and J. Payen, Appl.Environ. Microbiol., 1979, 37, 365.
139 O. Puel, S. Tadrist, P. Galtier, I. P. Oswald and M. Delaforgem,Appl. Environ. Microbiol., 2005, 71, 550.
140 R. Gosio, Rivista Igiene Sanita Publica Ann., 1896, 7, 825.141 C. L. Alsberg and O. F. Black, U.S. Dept. Agric. Bur. Plant Industry
Bull., 1913, 270, 1.142 A. E. Oxford and H. Raistrick, Biochem. J., 1933, 27, 1176.143 A. E. Oxford and H. Raistrick, Biochem. J., 1933, 27, 1473.144 J. C. Frisvad and O. Filtenborg, Appl. Environ. Microbiol., 1983, 46,
1301.145 M. Devys, J. F. Bousquet, A. Kollman and M. Barbier, Phytochem-
istry, 1980, 19, 2221.146 N. G. Vinokurova, N. E. Ivanushkina, G. A. Kochina, M. U.
Arinbasarov and S. M. Ozerskaya, Appl. Biochem. Microbiol., 2005,41, 83.
147 Y. Fujimoto, M. Kamiya, H. Tsunoda, K. Ohtsubo and T. Tatsuno,Chem. Pharm. Bull., 1980, 28, 1062.
148 M. Umeda, T. Yamashita, M. Saito, S. Sekita, C. Takahashi, K.Yoshihira, S. Natori, H. Kurata and S. Udagawa, Jpn. J. Exp. Med.,1974, 44, 83.
149 H. S. Burton, Br. J. Exp. Pathol., 1949, 30, 151–158.150 T. O. Larsen and J. C. Frisvad, Mycol. Res., 1995, 99, 1153.151 M. Umeda, K. Ohtsubo, M. Saito, S. Sekita, K. Yoshihira, S. Natori,
S. Udagawa, F. Sakabe and H. Kurata, Experientia, 1975, 15, 435.152 J. P. Springer, J. Clardy, J. M. Wells, R. J. Cole, J. W. Kirksey, R. D.
Macfarlane and D. F. Torgerson, Tetrahedron Lett., 1976, 17, 1355.153 D. Vesely, D. Vesela and R. Jelınek, Mycopathologia, 1995, 132, 31.154 J. Namgoong, S. Yeon, N. Paak, Y. Kim, C. Kim and K. Kim, Sanop
Misaengmul Hakhoechi, 1998, 26, 137.155 A. Tikoo, H. Cutler, S. H. Lo, L. B. Chen and H. Maruta, Cancer J.,
1999, 5, 293.156 A. Tikoo, R. Shakri, L. Conolly, Y. Hirokawa, T. Shishido, B.
Bowers, L. Ye, K. Kohama, R. J. Simpson and H. Maruta, Cancer J.,2000, 6, 162.
157 A. Ichihara, K. Katayama, H. Teshima, H. Oikawa and S. Saka-mura, Biosci., Biotechnol., Biochem., 1996, 60, 360.
158 C. Von Wallbrunn, H. Luftmann, K. Bergander and F. Meinhardt,J. Gen. Appl. Microbiol., 2001, 47, 33.
159 Y. Amemiya, A. Kondo, K. Hirano, T. Hirukawa and T. Kato, ChibaDaigaku Engeigakubu Gakujutsu Hokoku, 1994, 48, 13.
160 J. G. Kang, K. K. Kim and K. Y. Kang, Agric. Chem. Biotechnol.(Engl. Ed.), 1999, 42, 146.
161 P. H. A. Sneath and R. R. Sokal, in Numerical taxonomy,W. H. Freeman and Co., San Francisco, 1973.
162 R. R. M. Paterson, S. M. J. Simmonds and W. M. Blaney,J. Invertebr. Path., 1987, 50, 124.
163 B. A. Bird, A. T. Remaley and I. M. Campbell, Appl. Environ.Microbiol., 1981, 42, 521.
164 B. A. Bird and I. M. Campbell, Appl. Environ. Microbiol., 1982, 43,345.
165 C. Young, L. McMillan, E. Telfer and B. Scott, Mol. Microbiol.,2001, 39, 754.
166 N. P. Keller and T. M. Hohn, Fungal Genet. Biol., 1997, 21, 17.167 S. Udagawa, T. Muroi, H. Kurata, S. Sekita, K. Yoshihira, S. Natori
and M. Umeda, Can. J. Microbiol., 1979, 26, 170.168 S. Sekita, K. Yoshihira, S. Natori, S. Udagawa, F. Sakabe, H. Kurata
and M. Umeda, Chem. Pharm. Bull., 1982, 30, 1609.169 S. Sekita, K. Yoshihira, S. Natori and H. Kuwano, Chem. Pharm.
Bull., 1982, 30, 1618.170 S. Sekita, K. Yoshihira, S. Natori, S. Udagawa, T. Muroi, Y.
Sugiyama, H. Kurata and M. Umeda, Can. J. Microbiol., 1981,27, 766.
171 H. Oikawa, Y. Murakami and A. Ichihara, Tetrahedron Lett., 1991,32, 4533.
172 K. Koyoma, K. Takahashi, S. Natori and S. Udagawa, Proc. Jpn.Assoc. Mycotoxicol., 1991, 33, 40.
173 C. Spondlin and C. Tamm, Helv. Chim. Acta, 1988, 71, 1881.174 R. Donoso, A. Rivera-Sagredo, J. A. Hueso-Rodriguez and S. W.
Elson, Nat. Prod. Lett., 1997, 10, 49.175 O. Convert, A. Jellal, I. Correira, F. Dardoize, L. Menguy and J. C.
Cherton, Analysis, 1994, 22, 217.176 J. C. Frisvad, R. A. Samson, B. Rassing, M. I. van der Horst, F. T. J.
van Rijn and J. Stark, Antonie van Leeuwenhoek, 1997, 72, 119.177 T. O. Larsen, J. C. Frisvad, G. Ravn and T. Skaaning, Food Addit.
Contam., 1998, 15, 671.178 A. Numata, C. Takahashi, Y. Ito, K. Minoura, T. Yamada, C.
Matsusa and K. Nomoto, J. Chem. Soc.,Perkin Trans. 1, 1995, 239.179 C. Iwamoto, T. Yamada, Y. Ito, K. Monoura and A. Numata,
Tetrahedron, 2001, 57, 2997.180 G. F. Bills, Can. J. Bot., 1995, 73s1, 33.
6 9 4 N a t . P r o d . R e p . , 2 0 0 5 , 2 2 , 6 7 2 – 6 9 5

181 K. F. Nielsen, T. O. Larsen and J. C. Frisvad, J. Antibiot., 2004, 57,29.
182 A. L. Demain, Int. Microbiol., 1998, 1, 259.183 H. B. Bode, B. Bethe, R. Hofs and A. Zeeck, ChemBioChem, 2002,
3, 619.184 K. F. Nielsen, J. Smedsgaard, T. O. Larsen, F. Lund, U. Thrane
and J. C. Frisvad, in Fungal Biotechnology in Agricultural, Food, andEnvironmental Applications, ed. D. K. Arora, New York, MarcelDekker, 2003, p. 19.
185 J. Jennessen, K. F. Nielsen, J. Houbraken, J. Schnurer, E. K. Lyhne,J. C. Frisvad and R. A. Samson, J. Agric. Food Chem., 2005, 53,1833.
186 D. Wild, G. Toth and H. U. Humpf, J. Agric. Food Chem., 2002, 50,3999.
187 B. B. Jarvis, in Mycotoxins and Phytoalexins, ed. R. P. Sharma andD. K. Salunkhe, CRC Press, Boca Raton, 1990, 361.
188 C. W. Hesseltine, Process Biochem. (Oxford, U. K.), 1977, 12, 29.189 C. W. Hesseltine, Process Biochem. (Oxford, U. K.), 1997, 32, 24.190 C. W. Hesseltine, J. Ind. Microbiol. Biotechnol., 1999, 22, 482.191 D. P. Overy and J. W. Blunt, J. Nat. Prod., 2004, 67, 1850.192 D. P. Overy, C. H. Zidorn, B. O. Petersen, J. Ø. Duus, P. W.
Dalsgaard, T. O. Larsen and R. K. Phipps, Tetrahedron Lett., 2005,46, 3225.
193 D. R. Lauren, A. Ashley, B. A. Blackwell, R. Greenhalgh, J. D.Miller and G. A. Neish, J. Agric. Food Chem., 1987, 35, 884.
194 G. A. Cordell, Phytochemistry, 2000, 55, 463.195 J. Berdy, J. Antibiot., 2005, 58, 1.196 M. E. Hansen, F. Lund and J. M. Carstensen, J. Microbiol. Methods,
2003, 52, 221.197 R. D. Firn and C. G. Jones, Mol. Microbiol., 2000, 37, 989.198 S. A. S. Mapari, K. F. Nielsen, T. O. Larsen, J. C. Frisvad, A. S.
Meyer and U. Thrane, Curr. Opin. Biotechnol., 2005, 16, 1.199 G. A. Cordell and Y. G. Shin, Pure Appl. Chem., 1999, 71, 1089.200 T. Dorge, J. M. Carstensen and J. C. Frisvad, J. Microbiol. Methods,
2000, 41, 121.201 M. E. Hansen and J. M. Carstensen, Pattern Recognition, 2004, 37,
2155.202 M. Sonka, V. Hlavac and R. Boyle, in Image Processing, Analysis
and Machine Vision, 2nd ed., Chapman & Hall, California, 1998.203 M. S. Landy and N. Graham, The Visual Neurosciences, 2004, 1106.204 B. Andersen, M. E. Hansen and J. Smedsgaard, Phytopathology,
2005, 95, 1021.205 O. Fiehn, Comp. Funct. Genomics, 2001, 2, 155.206 L. W. Sumner, P. Mendes and R. A. Dixon, Phytochemistry, 2003,
62, 817.207 J. Smedsgaard and J. C. Frisvad, J. Microbiol. Methods, 1996, 25, 5.208 G. P. Pierens, M. E. Palframan, C. J. Tranter and A. R. Carrol,
Magn. Reson. Chem., 2005, 43, 359.209 P. Krishnan, N. J. Kruger and R. G. Ratcliffe, J. Exp. Bot., 2005,
56, 255.210 J. Smedsgaard, J. Chromatogr., A, 1997, 760, 264.211 O. Filtenborg and J. C. Frisvad, Lebensm. Wiss. Technol., 1980, 13,
128.212 O. Filtenborg, J. C. Frisvad and A. Svendsen, Appl. Environ.
Microbiol., 1983, 45, 581.213 K. Singh, J. C. Frisvad, U. Thrane and S. B. Mathur, in An Illustrated
Manual on Identification of Some Seed-borne Aspergilli, Fusaria,Penicillia and their Mycotoxins, Danish Government Institute ofSeed Pathology for The Developing Countries, Denmark, 1991.
214 R. K. Julian, Jr., R. E. Higgs, J. D. Gygi and M. D. Hilton, Anal.Chem., 1998, 70, 3249.
215 R. E. Higgs, J. A. Zahn, J. D. Gygi and M. D. Hilton, Appl. Environ.Microbiol., 2001, 67, 371.
216 J. Smedsgaard, Biochem. Syst. Ecol., 1997, 25, 65.217 M. E. Hansen and J. Smedsgaard, J. Am. Soc. Mass Spectrom.,
2004, 15, 1173.218 J. Smedsgaard, M. E. Hansen and J. C. Frisvad, Stud. Mycol., 2004,
49, 243.219 J. Smedsgaard and J. C. Frisvad, Biochem. Syst. Ecol., 1997, 25, 51.220 H. L. Constant and C. W. Beecher, Nat. Prod. Lett., 1995, 6, 193.221 D. G. Corley and R. C. Durley, J. Nat. Prod., 1994, 57, 1484.222 N. Shingematsu, J. Mass Spectrom. Soc. Jpn., 1997, 45, 295.223 P. Waridel, K. Ndjoko, K. R. Hobby, H. J. Major and K.
Hostettmann, Analysis, 2000, 28, 895.224 G. R. Eldridge, H. C. Vervoort, C. M. Lee, P. A. Cremin, C. T.
Williams, S. M. Hart, M. G. Goering, M. O’Niel-Johnson and L.Zeng, Anal. Chem., 2002, 74, 3963.
225 K. F. Nielsen and J. Smedsgaard, J. Chromatogr., A, 2003, 1002,111.
226 A. Fredenhagen, C. Derrien and E. Gassmann, J. Nat. Prod., 2005,68, 385.
227 F. VanMiddlesworth and R. J. P. Cannall, in Methods in Biotechnol-ogy, Vol 4: Natural Products Isolation, ed. R. J. P. Cannall, HumanaPress Inc., Totowa, NJ, 1998, p. 1.
228 C. P. Wang and T. L. Isenhour, Anal. Chem., 1987, 59, 649.229 A. J. Round, M. I. Aguilar and T. W. Hearn, J. Chromatogr., A,
1994, 661, 61.230 D. Bylund, R. Danielsson, G. Malmquist and K. E. Markides,
J. Chromatogr., A., 2002, 961, 237.231 G. Malmquist and R. Danielsson, J. Chromatogr., A., 1994, 687, 81.232 N.-P. V. Nielsen, J. M. Carstensen and J. Smedsgaard, J. Chro-
matogr., A., 1998, 805, 17.233 N.-P. V. Nielsen, J. Smedsgaard and J. C. Frisvad, Anal. Chem.,
1999, 71, 727.234 V. Pravdova, B. Walczak and D. L. Massart, Anal. Chim. Acta, 2002,
456, 77.235 M. E. Hansen, J. Smedsgaard and T. O. Larsen, Anal. Chem., 2005,
77, 6805.236 P. H. C. Eilers, Anal. Chem., 2003, 75, 3631.237 J. C. Frisvad and U. Thrane, J. Chromatogr., 1987, 404, 195.238 H.-P. Fiedler, Nat. Prod. Lett., 1993, 2, 119.239 H.-P. Fiedler, C. Bruntner, A. T. Bull, A. C. Ward, M. Goodfellow,
O. Potterat, C. Puder and G. Mihm, Antonie van Leeuwenhoek, 2005,87, 37.
240 T. O. Larsen, K. Frydenvang, J. C. Frisvad and C. Christophersen,J. Nat. Prod., 1998, 61, 1154.
241 T. O. Larsen, H. Franzyk and S. R. Jensen, J. Nat. Prod., 1999, 62,1578.
242 T. O. Larsen, K. Frydenvang and J. C. Frisvad, Biochem. Syst. Ecol.,2000, 28, 881.
243 T. O. Larsen, B. O. Petersen, D. Sørensen, J. Ø. Duus, J. C. Frisvadand M. E. Hansen, J. Nat. Prod., 2005, 68, 871.
244 S. C. Bobzin, S. Yang and T. P. Kasten, J. Chromatogr., B, 748,259.
245 O. Corcoran and M. Spraul, Drug Discovery Today, 2003, 8,624.
246 S. H. Hansen, A. G. Jensen, C. Cornett, I. Bjørnsdottir, S. Taylor,B. Wright and I. D. Wilson, Anal. Chem., 1999, 71, 5235.
247 L. Wolfender, S. Rodriguez and K. Hostettman, J. Chromatogr., A,1998, 794, 299.
248 C. Steinbeck, Nat. Prod. Rep., 2004, 21, 512.249 M. E. Elyashberg, K. A. Blinov, A. J. Williams, E. R. Martirosian
and S. G. Molodtsov, J. Nat. Prod., 2002, 65, 693–703.250 W. El-Deredy, NMR Biomed., 1997, 10, 99.251 J. C. Lindon, E. Holmes and J. K. Nicholson, Prog. Nucl. Magn.
Reson. Spectrosc., 2001, 39, 1.
N a t . P r o d . R e p . , 2 0 0 5 , 2 2 , 6 7 2 – 6 9 5 6 9 5