What Do Music Preferences Reveal About Personality? - OSF
12
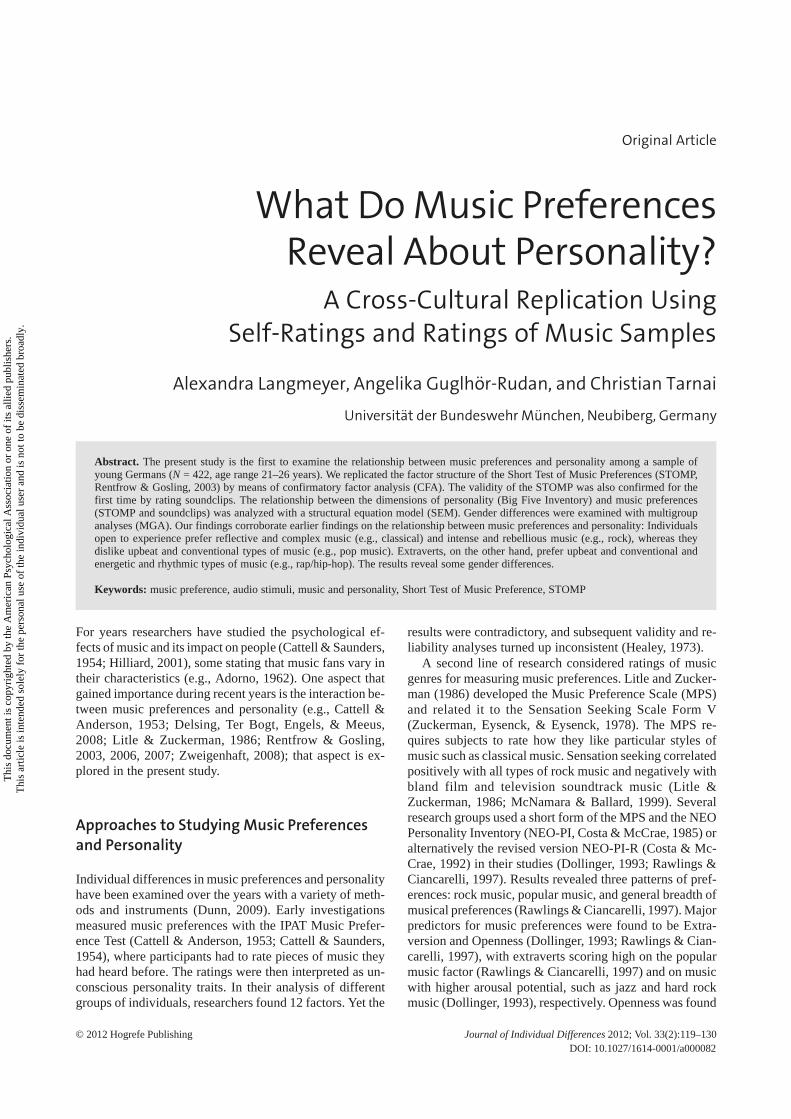
Original Article What Do Music Preferences Reveal About Personality? A Cross-Cultural Replication Using Self-Ratings and Ratings of Music Samples Alexandra Langmeyer, Angelika Guglhör-Rudan, and Christian Tarnai Universität der Bundeswehr München, Neubiberg, Germany Abstract. The present study is the first to examine the relationship between music preferences and personality among a sample of young Germans (N = 422, age range 21–26 years). We replicated the factor structure of the Short Test of Music Preferences (STOMP, Rentfrow & Gosling, 2003) by means of confirmatory factor analysis (CFA). The validity of the STOMP was also confirmed for the first time by rating soundclips. The relationship between the dimensions of personality (Big Five Inventory) and music preferences (STOMP and soundclips) was analyzed with a structural equation model (SEM). Gender differences were examined with multigroup analyses (MGA). Our findings corroborate earlier findings on the relationship between music preferences and personality: Individuals open to experience prefer reflective and complex music (e.g., classical) and intense and rebellious music (e.g., rock), whereas they dislike upbeat and conventional types of music (e.g., pop music). Extraverts, on the other hand, prefer upbeat and conventional and energetic and rhythmic types of music (e.g., rap/hip-hop). The results reveal some gender differences. Keywords: music preference, audio stimuli, music and personality, Short Test of Music Preference, STOMP For years researchers have studied the psychological ef- fects of music and its impact on people (Cattell & Saunders, 1954; Hilliard, 2001), some stating that music fans vary in their characteristics (e.g., Adorno, 1962). One aspect that gained importance during recent years is the interaction be- tween music preferences and personality (e.g., Cattell & Anderson, 1953; Delsing, Ter Bogt, Engels, & Meeus, 2008; Litle & Zuckerman, 1986; Rentfrow & Gosling, 2003, 2006, 2007; Zweigenhaft, 2008); that aspect is ex- plored in the present study. Approaches to Studying Music Preferences and Personality Individual differences in music preferences and personality have been examined over the years with a variety of meth- ods and instruments (Dunn, 2009). Early investigations measured music preferences with the IPAT Music Prefer- ence Test (Cattell & Anderson, 1953; Cattell & Saunders, 1954), where participants had to rate pieces of music they had heard before. The ratings were then interpreted as un- conscious personality traits. In their analysis of different groups of individuals, researchers found 12 factors. Yet the results were contradictory, and subsequent validity and re- liability analyses turned up inconsistent (Healey, 1973). A second line of research considered ratings of music genres for measuring music preferences. Litle and Zucker- man (1986) developed the Music Preference Scale (MPS) and related it to the Sensation Seeking Scale Form V (Zuckerman, Eysenck, & Eysenck, 1978). The MPS re- quires subjects to rate how they like particular styles of music such as classical music. Sensation seeking correlated positively with all types of rock music and negatively with bland film and television soundtrack music (Litle & Zuckerman, 1986; McNamara & Ballard, 1999). Several research groups used a short form of the MPS and the NEO Personality Inventory (NEO-PI, Costa & McCrae, 1985) or alternatively the revised version NEO-PI-R (Costa & Mc- Crae, 1992) in their studies (Dollinger, 1993; Rawlings & Ciancarelli, 1997). Results revealed three patterns of pref- erences: rock music, popular music, and general breadth of musical preferences (Rawlings & Ciancarelli, 1997). Major predictors for music preferences were found to be Extra- version and Openness (Dollinger, 1993; Rawlings & Cian- carelli, 1997), with extraverts scoring high on the popular music factor (Rawlings & Ciancarelli, 1997) and on music with higher arousal potential, such as jazz and hard rock music (Dollinger, 1993), respectively. Openness was found DOI: 10.1027/1614-0001/a000082 © 2012 Hogrefe Publishing Journal of Individual Differences 2012; Vol. 33(2):119–130 This document is copyrighted by the American Psychological Association or one of its allied publishers. This article is intended solely for the personal use of the individual user and is not to be disseminated broadly.
-
Upload
khangminh22 -
Category
Documents
-
view
0 -
download
0
Transcript of What Do Music Preferences Reveal About Personality? - OSF
Original Article
A. Langmeyer et al.: Music Preference and PersonalityJournal of Individual Differences 2012; Vol. 33(2):119–130© 2012 Hogrefe Publishing
What Do Music PreferencesReveal About Personality?
A Cross-Cultural Replication UsingSelf-Ratings and Ratings of Music Samples
Alexandra Langmeyer, Angelika Guglhör-Rudan, and Christian Tarnai
Universität der Bundeswehr München, Neubiberg, Germany
Abstract. The present study is the first to examine the relationship between music preferences and personality among a sample ofyoung Germans (N = 422, age range 21–26 years). We replicated the factor structure of the Short Test of Music Preferences (STOMP,Rentfrow & Gosling, 2003) by means of confirmatory factor analysis (CFA). The validity of the STOMP was also confirmed for thefirst time by rating soundclips. The relationship between the dimensions of personality (Big Five Inventory) and music preferences(STOMP and soundclips) was analyzed with a structural equation model (SEM). Gender differences were examined with multigroupanalyses (MGA). Our findings corroborate earlier findings on the relationship between music preferences and personality: Individualsopen to experience prefer reflective and complex music (e.g., classical) and intense and rebellious music (e.g., rock), whereas theydislike upbeat and conventional types of music (e.g., pop music). Extraverts, on the other hand, prefer upbeat and conventional andenergetic and rhythmic types of music (e.g., rap/hip-hop). The results reveal some gender differences.
Keywords: music preference, audio stimuli, music and personality, Short Test of Music Preference, STOMP
For years researchers have studied the psychological ef-fects of music and its impact on people (Cattell & Saunders,1954; Hilliard, 2001), some stating that music fans vary intheir characteristics (e.g., Adorno, 1962). One aspect thatgained importance during recent years is the interaction be-tween music preferences and personality (e.g., Cattell &Anderson, 1953; Delsing, Ter Bogt, Engels, & Meeus,2008; Litle & Zuckerman, 1986; Rentfrow & Gosling,2003, 2006, 2007; Zweigenhaft, 2008); that aspect is ex-plored in the present study.
Approaches to Studying Music Preferencesand Personality
Individual differences in music preferences and personalityhave been examined over the years with a variety of meth-ods and instruments (Dunn, 2009). Early investigationsmeasured music preferences with the IPAT Music Prefer-ence Test (Cattell & Anderson, 1953; Cattell & Saunders,1954), where participants had to rate pieces of music theyhad heard before. The ratings were then interpreted as un-conscious personality traits. In their analysis of differentgroups of individuals, researchers found 12 factors. Yet the
results were contradictory, and subsequent validity and re-liability analyses turned up inconsistent (Healey, 1973).
A second line of research considered ratings of musicgenres for measuring music preferences. Litle and Zucker-man (1986) developed the Music Preference Scale (MPS)and related it to the Sensation Seeking Scale Form V(Zuckerman, Eysenck, & Eysenck, 1978). The MPS re-quires subjects to rate how they like particular styles ofmusic such as classical music. Sensation seeking correlatedpositively with all types of rock music and negatively withbland film and television soundtrack music (Litle &Zuckerman, 1986; McNamara & Ballard, 1999). Severalresearch groups used a short form of the MPS and the NEOPersonality Inventory (NEO-PI, Costa & McCrae, 1985) oralternatively the revised version NEO-PI-R (Costa & Mc-Crae, 1992) in their studies (Dollinger, 1993; Rawlings &Ciancarelli, 1997). Results revealed three patterns of pref-erences: rock music, popular music, and general breadth ofmusical preferences (Rawlings & Ciancarelli, 1997). Majorpredictors for music preferences were found to be Extra-version and Openness (Dollinger, 1993; Rawlings & Cian-carelli, 1997), with extraverts scoring high on the popularmusic factor (Rawlings & Ciancarelli, 1997) and on musicwith higher arousal potential, such as jazz and hard rockmusic (Dollinger, 1993), respectively. Openness was found
DOI: 10.1027/1614-0001/a000082© 2012 Hogrefe Publishing Journal of Individual Differences 2012; Vol. 33(2):119–130
This
doc
umen
t is c
opyr
ight
ed b
y th
e A
mer
ican
Psy
chol
ogic
al A
ssoc
iatio
n or
one
of i
ts a
llied
pub
lishe
rs.
This
arti
cle
is in
tend
ed so
lely
for t
he p
erso
nal u
se o
f the
indi
vidu
al u
ser a
nd is
not
to b
e di
ssem
inat
ed b
road
ly.
to be positively correlated with the factors breadth of pref-erences and rock music (Rawlings & Ciancarelli, 1997),and with new age, classic, jazz, reggae, folk-ethnic, andsoul music (Dollinger, 1993). As in previous studies(Daoussis & McKelvie, 1986; Litle & Zuckerman, 1986),the Extraversion facet “excitement seeking” was found tobe connected with preferring hard rock (Dollinger, 1993;Rawlings & Ciancarelli, 1997).
In other studies the design was extended by adding rat-ings of soundclips to the MPS (Rawlings, Hodge, Sherr, &Dempsey, 1995; Rawlings, Twomey, Burns, & Morris,1998). Personality was measured by the Eysenck Person-ality Inventory (EPI; Eysenck & Eysenck, 1976). The mu-sic excerpts turned up similar results as with the MPS. Psy-choticism (tough-mindedness) and Extraversion were pos-itively correlated with liking hard rock music andnegatively with liking electronic, religious, and soundtrackmusic.
In sum, the personality dimensions Psychoticism, Open-ness, and Extraversion, particularly Sensation Seeking,were deemed the strongest predictors of music preferences.
Studies About Personality and MusicPreferences Using STOMP
The first comprehensive measure of music preferences, theShort Test of Music Preferences (STOMP; Rentfrow &Gosling, 2003), has been applied in research since 2003.Out of 14 overall rated music genres, four general dimen-sions were identified using exploratory and confirmatoryfactor analyses:– Reflective & Complex (R&C; covering blues, jazz, clas-
sical, and folk music)– Intense & Rebellious (I&R; rock, alternative, heavy met-
al music)– Upbeat & Conventional (U&C; country, sound tracks,
religious, and pop music)– Energetic & Rhythmic (E&R; rap/hip-hop, soul/funk,
electronic/dance music).
Only one study measuring music preferences with theSTOMP (Dunn, de Ruther, & Bouwhuis, 2011) did not con-firm the factor structure. Consequently, a six-factor solu-tion or, alternatively, a different four-factor solution wassuggested. However, the composition of the I&R dimen-sion has remained consistent.
Several researchers (Delsing et al., 2008; George, Stick-le, Rachid, & Wopnford, 2007; Rentfrow & Gosling, 2003;Zweigenhaft, 2008) investigated the correlation betweenthese main dimensions of music preferences and the BigFive personality factors. Delsing and colleagues (2008)presented two substudies, one of them being a longitudinalstudy, and the research by Rentfrow and Gosling (2003)contained six different substudies.
Rentfrow and Gosling (2003) as well as George and col-
leagues (2007) measured personality using the Big Five In-ventory (BFI, John & Srivastava, 1999). Zweigenhaft (2008)applied the NEO-PI, Delsing and colleagues (2008) assessedpersonality with a Dutch adaptation of 30 adjective Big Fivefactor markers selected from Goldberg (1992). To measuremusic preferences, Rentfrow and Gosling (2003) and Zwei-genhaft (2008) used the STOMP. Delsing and colleagues(2008) preferred the Musical Preference Questionnaire(MPQ, Sikkema, 1999), which is similar to the STOMP, ex-cept that styles of folk, country, blues, and soundtracks werenot included. Contrary to the STOMP, the music preferencecategories were Elite (R&C), Rock (I&R), Pop/Dance(U&C), and Urban (E&R). George and colleagues (2007)used a list of 30 different types of music, which contained thegenres of the four STOMP dimensions, among others. Acomparison of correlations found in these four studies isshown in Table 5 (results). In sum, all studies found positivecorrelations between R&C and Openness, ranging from r =.17 (Delsing et al., 2008) to r = .44 (Rentfrow & Gosling,2003). Openness was also found to be related, albeit weaker,to I&R, ranging from r = .13 (George et al., 2007) up to r =.22 (Delsing et al., 2008). For U&C, divergent findings werereported concerning its relationship to Extraversion and Con-scientiousness. Whereas all other studies report weak corre-lations with Extraversion, Delsing and colleagues failed tofind such relationships. On the contrary, similar to Rentfrowand Gosling (2003), they found connections to Agreeable-ness, which in turn are not reported by Zweigenhaft (2008)or by George and colleagues (2007). The factor E&R waspositively correlated with Extraversion in all studies, exceptby George and colleagues (2007).
All things considered, Openness is by far the best pre-dictor for music preferences. The second strong predictoris Extraversion. However, the varying results might be dueto the different methods applied.
Measuring Music Preferences by AudioStimuli
As previously stated, early research measured music pref-erences using audio stimuli (e.g., IPAT Music PreferenceTest; Cattell & Anderson, 1953). In recent research, how-ever, measuring music preferences by means of rated musicgenres has become a common and widespread method.Measuring music by audio stimuli has become highly top-ical again because of genre labels being somewhat subjec-tive: Every participant might have a different understand-ing of these genres. Given that genres activate stereotypesassociated with traits, individuals’ ratings of genres may bebiased (Rentfrow, Goldberg, & Levitin, 2011). Moreover,genre labels might not be able to fully describe someone’smusic preference. If someone likes one kind of music froma special genre this does not mean that he or she likes allother kinds of music from this genre (Dunn, 2009). In thelatest studies different methods have been established to
120 A. Langmeyer et al.: Music Preference and Personality
Journal of Individual Differences 2012; Vol. 33(2):119–130 © 2012 Hogrefe Publishing
This
doc
umen
t is c
opyr
ight
ed b
y th
e A
mer
ican
Psy
chol
ogic
al A
ssoc
iatio
n or
one
of i
ts a
llied
pub
lishe
rs.
This
arti
cle
is in
tend
ed so
lely
for t
he p
erso
nal u
se o
f the
indi
vidu
al u
ser a
nd is
not
to b
e di
ssem
inat
ed b
road
ly.
measure music preferences without genres (Rentfrow et al.,2011). In one of the methods, participants are asked to rateselected music excerpts (Dunn, 2009; Rentfrow et al.,2011). Using this approach in three independent studies,Rentfrow and colleagues (2011) found five latent underly-ing factors in music preferences:– Mellow (e.g., pop or soft rock),– Unpretentious (e.g., country or rock ’n’ roll),– Sophisticated (e.g., classical or jazz),– Intense (e.g., heavy metal or rock), and– Contemporary (e.g., rap and electronica).
These are by and large comparable to those found in stud-ies with the STOMP. In his study, Dunn (2009) extractednine music preferences components and found them to berelated to personality. The strongest connection was thatreported in the previous studies between the Extraversionfacet “excitement-seeking” and rap music. This studyalso showed that music clips familiar to participants wererated higher than unfamiliar music clips. Another ap-proach assesses music preferences by measuring listen-ing behavior. Dunn and colleagues (2011) used this meth-od as well as the STOMP and the NEO-PI-R to analyzeparticipants’ listening behavior in the course of a mini-mum 3-month period. It was found that the duration oflistening to a certain music type was positively correlatedto the reported music preferences for the same genre.Correlations varied between r = .11 (alternative) and r =.43 (dance). It is noteworthy that overlapping correlationsbetween different genres occurred as well. Moreover,with respect to personality there are different results formusic preferences (STOMP) and listening behavior (du-ration). Only two comparable correlations were found:Neuroticism related to classical music and Openness tojazz music. Considering music preferences there are ad-ditional correlations between Extraversion and pop,dance, and rap. However, regarding listening behaviorthere are also correlations between Extraversion and re-ligious music as well as between Agreeableness andsoundtracks (Dunn et al., 2011).
Gender Differences in Music Preferencesand Personality
No studies have yet considered gender differences in therelationship between music preferences and personality, al-though a few report gender differences in music preferenc-es. For example, George and colleagues (2007) found menprefer rebellious music, i.e., heavy metal or punk music,and women like easy listening music, i.e., pop or countrymusic. Colley (2008) and Zweigenhaft (2008) showed thatwomen rated pop music more favorably; Zweigenhaft(2008) revealed that they also like punk music more thanmen. Similarly, Dunn (2009) found gender differences inall nine music preferences components. The underlying
factor structure of music preferences also does not have tobe necessarily the same (Colley, 2008). Dunn and col-leagues (2011) report no gender effects concerning theamount of music listened to. However, because gender dif-ferences must be assumed in personality traits (Feingold,1994) and gender differences may occur regarding the kindof music listened to, gender effects should be investigatedin further research.
Research Questions
Most of the reported studies have been performed in theUnited States and in The Netherlands (Delsing et al., 2008;Dunn et al., 2011). Although Rawlings, Vidal, and Furn-ham (2000) provided evidence that there are few crosscul-tural differences in the association between music prefer-ences and personality, one cannot generalize these findingsacross countries (see Delsing et al., 2008). Therefore, thecurrent study investigates whether music preferences canbe validly measured with the STOMP in Germany, andwhether personality is a predictor for music preferences inGermany as well.
Contrary to the majority of studies, our investigation ad-ditionally analyzes whether ratings of soundfiles differfrom STOMP ratings. Taking into account the difficultiesof rating music genres, a similar pattern would be a goodvalidation of the STOMP in Germany. Gender differencesin music preferences can be assumed but have not beentested in relation to personality before.
Altogether, the following four research questions havebeen considered:– Is it possible to replicate the factor structure of the
STOMP with German data?– Is it possible to validate the STOMP by soundclips? Or
is there a difference between rating music genres vs. lis-tening to soundclips?
– Is there a relationship between the dimensions of per-sonality and the music preferences in the German sam-ple? If so, is it the anticipated relationship?
– Are there gender differences regarding the factor struc-ture of the STOMP and regarding the relationship be-tween personality and music preferences?
Methods
Sample
In 2007 and 2008, 422 students at the Universität der Bun-deswehr München (72.3% male) completed an online ques-tionnaire. The age of the participants ranged from 21 to 26years. In order to avoid age effects as reported in previousstudies (e.g., Delsing et al., 2008; George et al., 2007;Zweigenhaft, 2008), we intentionally sampled a narrowage range for this study.
A. Langmeyer et al.: Music Preference and Personality 121
© 2012 Hogrefe Publishing Journal of Individual Differences 2012; Vol. 33(2):119–130
This
doc
umen
t is c
opyr
ight
ed b
y th
e A
mer
ican
Psy
chol
ogic
al A
ssoc
iatio
n or
one
of i
ts a
llied
pub
lishe
rs.
This
arti
cle
is in
tend
ed so
lely
for t
he p
erso
nal u
se o
f the
indi
vidu
al u
ser a
nd is
not
to b
e di
ssem
inat
ed b
road
ly.
Instruments
The present study was part of a larger study examining therelationships between personality, vocational interests, lei-sure, and study preferences. In that context, a slightly modi-fied version of the 14-item STOMP (Rentfrow & Gosling,2003) was used. As mentioned above, the STOMP includesfour dimensions: Reflective & Complex (R&C), Intense &Rebellious (I&R), Upbeat & Conventional (U&C), and En-ergetic & Rhythmic (E&R). For item wording and scale com-position see Table 1. Due to low popularity of religious musicand differences in the context and meaning of folk and coun-try music in Germany, these original categories were replacedby the more common German genres “Popular German Mu-sic” (PGM, “Populäre Volksmusik”) and “New GermanWave” (NGW, “Neue Deutsche Welle”). After rating one’spreference for each genre on a 7-point Likert-type scale (–3 =I dislike very much; +3 = I like very much), the participantshad to rate the following four soundclips including severalshort excerpts of pieces of music using the same type of re-sponse scale. The four soundfiles are composed as suggestedby Rentfrow (2004) based on a former version of his home-page and therefore reflect the four dimensions of the STOMP:– Reflective & Complex: “Ride” (Nick Drake), “Fantasy
and Fugue in C minor, BWV 906” (composed by JohannSebastian Bach, performed by Glenn Gould), “Stella byStarlight” (Herbie Hancock), “40 Days and 40 Nights”(Muddy Waters), “Time Out” (Dave Brubeck Quartet)
– Intense & Rebellious: “Bullet with Butterfly Wings”(Smashing Pumpkins) “Voodoo Child” (Jimi Hendrix),“Fight Song” (Marilyn Manson), “Angel of Death”(Slayer), “Money” (Pink Floyd), “Verse Chorus Verse”(Nirvana)
– Upbeat & Conventional: “Tell me that I’m Dreaming”(Backstreet Boys), “Come, Now is the Time to Worship”(WOW Worship), “Ready to Run” (Dixie Chicks), “I’ma Slave (4 U)” (Britney Spears)
– Energetic & Rhythmic: “It Takes Two” (Rob Base and DJEZ Rock), “In-Flux” (DJ Shadow), “The Next Episode”(Dr. Dre featuring Nate Dogg and Snoop Dogg), “Pick Upthe Pieces” (Average White Band), “Roll it Up” (CrystalMethod), “Everything is Everything” (Lauryn Hill)
To assess personality, we used a shortened 20-item versionof the German 42-item version (Lang, Lüdtke, & Asen-dorpf, 2001) of the Big Five Inventory (BFI, John & Sris-tava, 1999). Each personality dimension consists of fouritems, which were rated (“I see myself as someone who. . .”) on a 5-point Likert-type scale (–2 = very inapplicable;+2 = very applicable). 16 items from the original GermanBFI (Lang et al., 2001) were selected based on analyses ofour working group (Schmolck, 2004). Two items weremodified for each of the dimensions Agreeableness andNeuroticism. For the wording see Table 3 in which the orig-inally selected items are numbered according to Table 1 inLang and colleagues (2001).
Analyses
A structural equation model (SEM) was estimated (AMOS19.0) for the first research question. We used the generalizedleast square (GLS) fit function to estimate the model param-eters. Goodness of fit was assessed with the χ² test and select-ed global fit indices (see Hu & Bentler, 1999). The assump-tion of multivariate normal distributed data was tested. Incase of nonnormal data, the χ² test for the assessment of mod-el fit is known to overly reject models of acceptable fit.Hence, bootstrap analyses were performed (Bollen & Stine,1993), and the normed χ² measure (χ²normed; Jöreskog, 1969)was considered. Recommendations of what can be consid-ered sufficient model fit vary between χ²normed < 2 andχ²normed < 5 (Bollen & Long, 1993). Three types of global fitindices were applied: the comparative fit index (CFI; Bentler,1990; cutoff ≤ .95), the root mean square error of approxima-tion (RMSEA; Steiger, 1989; cutoff = .06), which is particu-larly recommended for personality studies (Raykov, 1998),and the standardized root mean square residual (SRMR;Jöreskog & Sörbom, 1981; cutoff = .11). A critical α of .05was assumed in all of our analyses.
We estimated a confirmatory factor analysis (CFA) in-cluding the four latent music variables and the related threeor alternatively four music items per dimension to validatethe original structure of the STOMP. A multigroup analysis(MGA) was performed with regard to research questionfour. In the first step, the measurement weights were con-strained, in following steps each of the remaining free pa-rameters. Goodness of fit was assessed with the overall χ².For each step of equality constraints, the nested χ² differ-ence test and the global fit indices were considered. Be-cause a model does not imperatively have to be refusedconsidering a significant χ² difference (Cheung & Rens-vold, 2002; Little, 1997), the same cutoff criteria as citedabove held good for the global fit indices.
In the next step, descriptive statistics are reported in-cluding reliabilities of the STOMP scales for better com-parability to the results of previous studies. For this reason,we calculated averages of scales (SPSS 19.0).
For the second research question, we calculated bivari-ate correlations of averages of STOMP dimensions withthe soundfiles. Furthermore, the STOMP CFA model wasextended with the ratings of the soundfiles as additionalmanifest variables for the latent music dimensions. To con-trol for gender effects, an MGA was performed.
To address the third research question, we first tested theBig Five personality model with a CFA. Next, we calculat-ed descriptive statistics and computed mean scores for thepersonality dimensions. These five mean scores of person-ality were correlated with the STOMP mean scores andwith the four soundfiles. Then, a comprehensive SEM wasdefined, including the Big Five personality dimensions,modeled in the exogenous measurement model, and thefour STOMP dimensions, modeled in the endogenous mea-surement model (see Figure 1). The STOMP dimensions
122 A. Langmeyer et al.: Music Preference and Personality
Journal of Individual Differences 2012; Vol. 33(2):119–130 © 2012 Hogrefe Publishing
This
doc
umen
t is c
opyr
ight
ed b
y th
e A
mer
ican
Psy
chol
ogic
al A
ssoc
iatio
n or
one
of i
ts a
llied
pub
lishe
rs.
This
arti
cle
is in
tend
ed so
lely
for t
he p
erso
nal u
se o
f the
indi
vidu
al u
ser a
nd is
not
to b
e di
ssem
inat
ed b
road
ly.
were estimated using both the particular STOMP items andthe corresponding soundfiles, according to the CFA modelfor research question two. In the structural model, all pathswere estimated. No error correlations were allowed. How-ever, correlations between Extraversion and Neuroticismand between I&R and U&C were allowed. To address re-search question four, again, a MGA model was estimated.
Results
Factor Structure of the STOMP
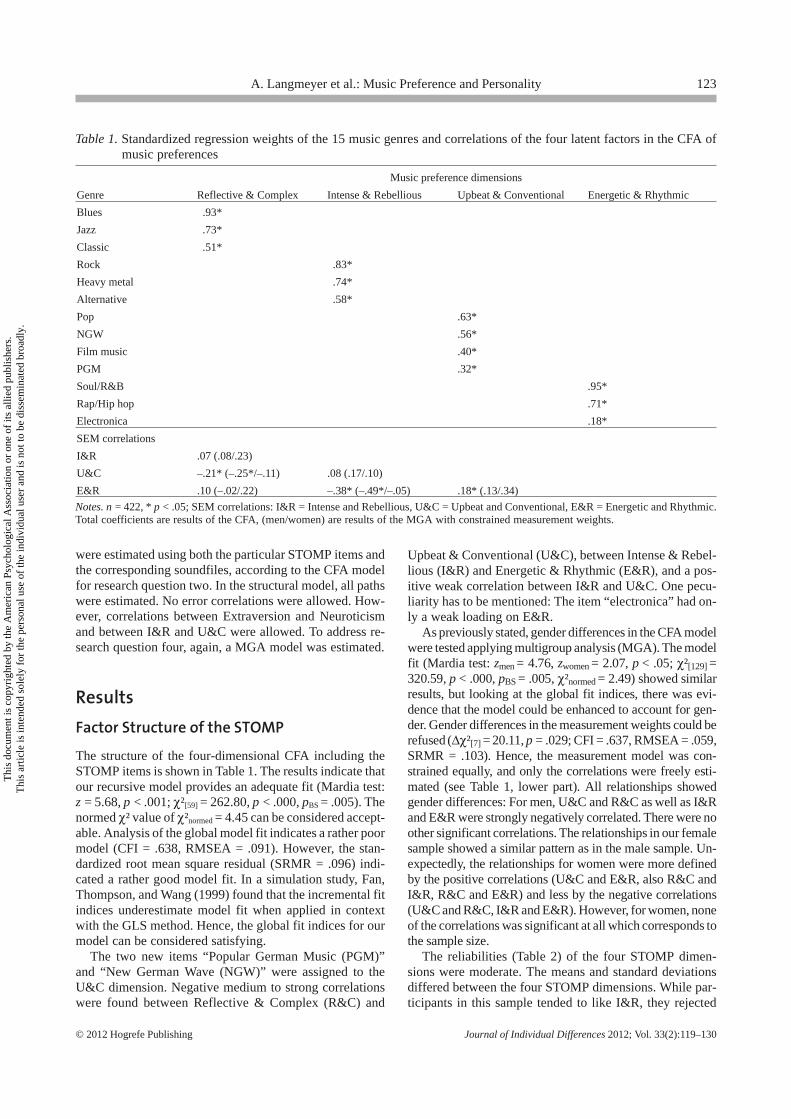
The structure of the four-dimensional CFA including theSTOMP items is shown in Table 1. The results indicate thatour recursive model provides an adequate fit (Mardia test:z = 5.68, p < .001; χ²[59] = 262.80, p < .000, pBS = .005). Thenormed χ² value of χ²normed = 4.45 can be considered accept-able. Analysis of the global model fit indicates a rather poormodel (CFI = .638, RMSEA = .091). However, the stan-dardized root mean square residual (SRMR = .096) indi-cated a rather good model fit. In a simulation study, Fan,Thompson, and Wang (1999) found that the incremental fitindices underestimate model fit when applied in contextwith the GLS method. Hence, the global fit indices for ourmodel can be considered satisfying.
The two new items “Popular German Music (PGM)”and “New German Wave (NGW)” were assigned to theU&C dimension. Negative medium to strong correlationswere found between Reflective & Complex (R&C) and
Upbeat & Conventional (U&C), between Intense & Rebel-lious (I&R) and Energetic & Rhythmic (E&R), and a pos-itive weak correlation between I&R and U&C. One pecu-liarity has to be mentioned: The item “electronica” had on-ly a weak loading on E&R.
As previously stated, gender differences in the CFA modelwere tested applying multigroup analysis (MGA). The modelfit (Mardia test: zmen = 4.76, zwomen = 2.07, p < .05; χ²[129] =320.59, p < .000, pBS = .005, χ²normed = 2.49) showed similarresults, but looking at the global fit indices, there was evi-dence that the model could be enhanced to account for gen-der. Gender differences in the measurement weights could berefused (Δχ²[7] = 20.11, p = .029; CFI = .637, RMSEA = .059,SRMR = .103). Hence, the measurement model was con-strained equally, and only the correlations were freely esti-mated (see Table 1, lower part). All relationships showedgender differences: For men, U&C and R&C as well as I&Rand E&R were strongly negatively correlated. There were noother significant correlations. The relationships in our femalesample showed a similar pattern as in the male sample. Un-expectedly, the relationships for women were more definedby the positive correlations (U&C and E&R, also R&C andI&R, R&C and E&R) and less by the negative correlations(U&C and R&C, I&R and E&R). However, for women, noneof the correlations was significant at all which corresponds tothe sample size.
The reliabilities (Table 2) of the four STOMP dimen-sions were moderate. The means and standard deviationsdiffered between the four STOMP dimensions. While par-ticipants in this sample tended to like I&R, they rejected
Table 1. Standardized regression weights of the 15 music genres and correlations of the four latent factors in the CFA ofmusic preferences
Music preference dimensions
Genre Reflective & Complex Intense & Rebellious Upbeat & Conventional Energetic & Rhythmic
Blues .93*
Jazz .73*
Classic .51*
Rock .83*
Heavy metal .74*
Alternative .58*
Pop .63*
NGW .56*
Film music .40*
PGM .32*
Soul/R&B .95*
Rap/Hip hop .71*
Electronica .18*
SEM correlations
I&R .07 (.08/.23)
U&C –.21* (–.25*/–.11) .08 (.17/.10)
E&R .10 (–.02/.22) –.38* (–.49*/–.05) .18* (.13/.34)
Notes. n = 422, * p < .05; SEM correlations: I&R = Intense and Rebellious, U&C = Upbeat and Conventional, E&R = Energetic and Rhythmic.Total coefficients are results of the CFA, (men/women) are results of the MGA with constrained measurement weights.
A. Langmeyer et al.: Music Preference and Personality 123
© 2012 Hogrefe Publishing Journal of Individual Differences 2012; Vol. 33(2):119–130
This
doc
umen
t is c
opyr
ight
ed b
y th
e A
mer
ican
Psy
chol
ogic
al A
ssoc
iatio
n or
one
of i
ts a
llied
pub
lishe
rs.
This
arti
cle
is in
tend
ed so
lely
for t
he p
erso
nal u
se o
f the
indi
vidu
al u
ser a
nd is
not
to b
e di
ssem
inat
ed b
road
ly.
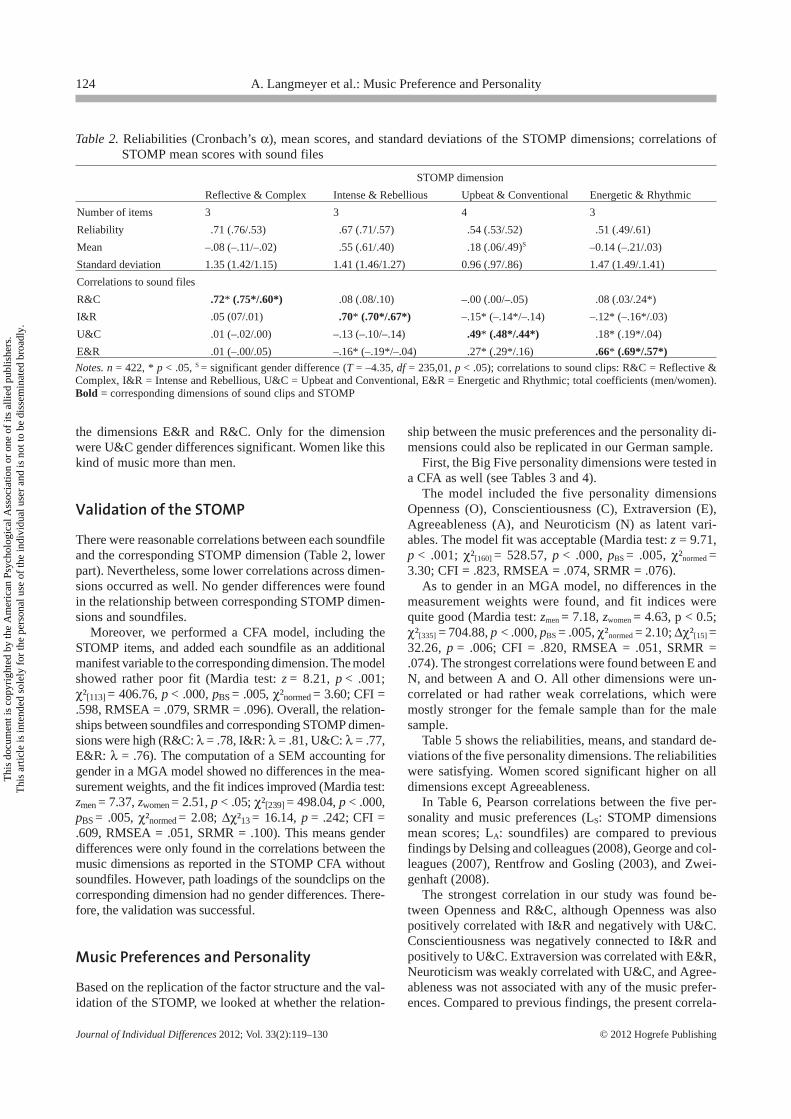
the dimensions E&R and R&C. Only for the dimensionwere U&C gender differences significant. Women like thiskind of music more than men.
Validation of the STOMP
There were reasonable correlations between each soundfileand the corresponding STOMP dimension (Table 2, lowerpart). Nevertheless, some lower correlations across dimen-sions occurred as well. No gender differences were foundin the relationship between corresponding STOMP dimen-sions and soundfiles.
Moreover, we performed a CFA model, including theSTOMP items, and added each soundfile as an additionalmanifest variable to the corresponding dimension. The modelshowed rather poor fit (Mardia test: z = 8.21, p < .001;χ²[113] = 406.76, p < .000, pBS = .005, χ²normed = 3.60; CFI =.598, RMSEA = .079, SRMR = .096). Overall, the relation-ships between soundfiles and corresponding STOMP dimen-sions were high (R&C: λ = .78, I&R: λ = .81, U&C: λ = .77,E&R: λ = .76). The computation of a SEM accounting forgender in a MGA model showed no differences in the mea-surement weights, and the fit indices improved (Mardia test:zmen = 7.37, zwomen = 2.51, p < .05; χ²[239] = 498.04, p < .000,pBS = .005, χ²normed = 2.08; Δχ²13 = 16.14, p = .242; CFI =.609, RMSEA = .051, SRMR = .100). This means genderdifferences were only found in the correlations between themusic dimensions as reported in the STOMP CFA withoutsoundfiles. However, path loadings of the soundclips on thecorresponding dimension had no gender differences. There-fore, the validation was successful.
Music Preferences and Personality
Based on the replication of the factor structure and the val-idation of the STOMP, we looked at whether the relation-
ship between the music preferences and the personality di-mensions could also be replicated in our German sample.
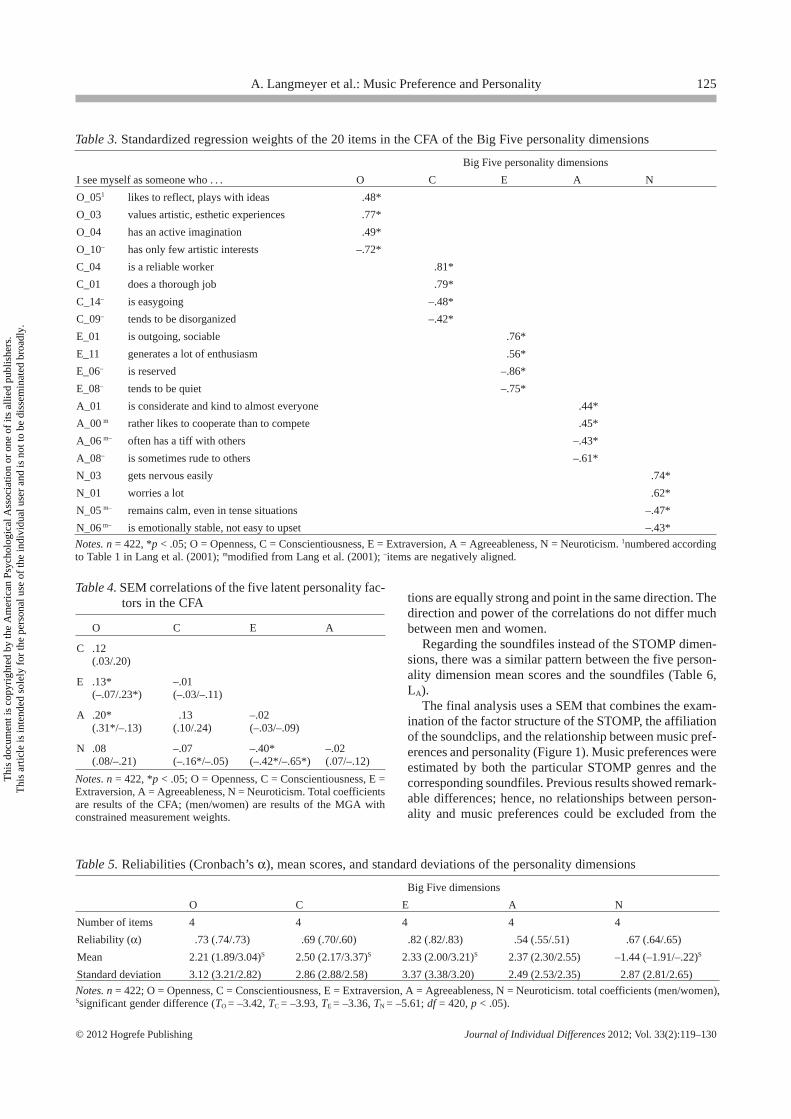
First, the Big Five personality dimensions were tested ina CFA as well (see Tables 3 and 4).
The model included the five personality dimensionsOpenness (O), Conscientiousness (C), Extraversion (E),Agreeableness (A), and Neuroticism (N) as latent vari-ables. The model fit was acceptable (Mardia test: z = 9.71,p < .001; χ²[160] = 528.57, p < .000, pBS = .005, χ²normed =3.30; CFI = .823, RMSEA = .074, SRMR = .076).
As to gender in an MGA model, no differences in themeasurement weights were found, and fit indices werequite good (Mardia test: zmen = 7.18, zwomen = 4.63, p < 0.5;χ²[335] = 704.88, p < .000, pBS = .005, χ²normed = 2.10; Δχ²[15] =32.26, p = .006; CFI = .820, RMSEA = .051, SRMR =.074). The strongest correlations were found between E andN, and between A and O. All other dimensions were un-correlated or had rather weak correlations, which weremostly stronger for the female sample than for the malesample.
Table 5 shows the reliabilities, means, and standard de-viations of the five personality dimensions. The reliabilitieswere satisfying. Women scored significant higher on alldimensions except Agreeableness.
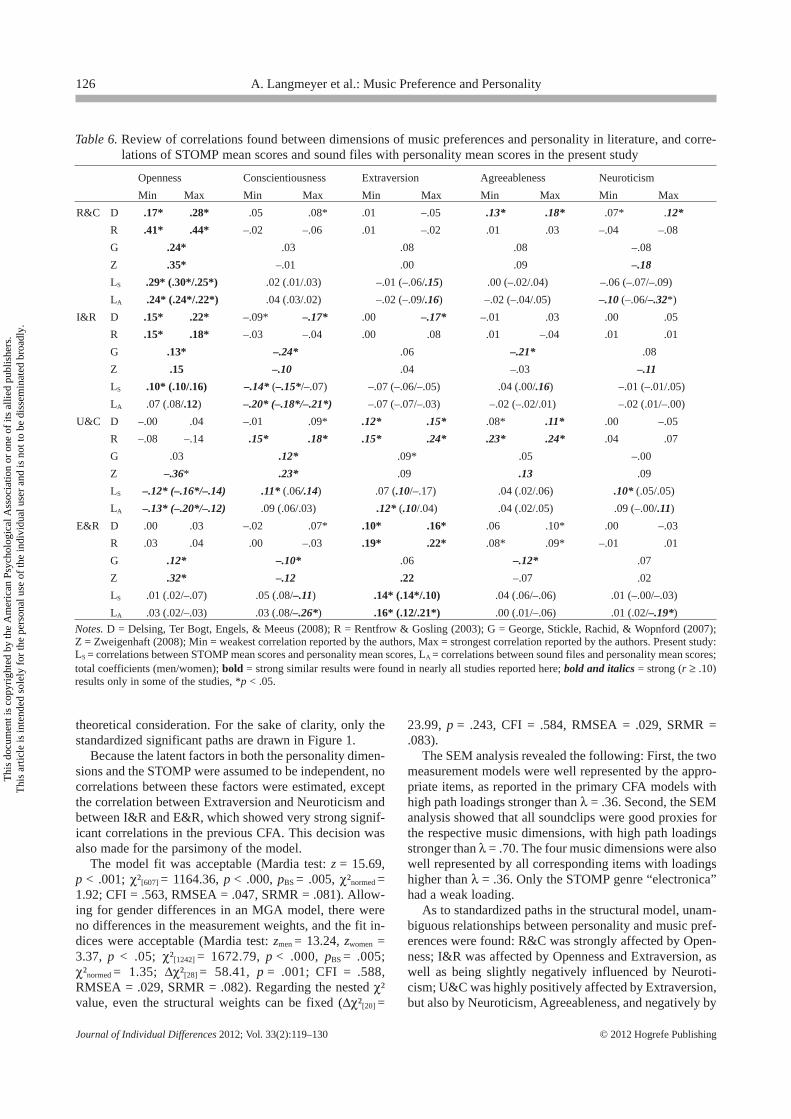
In Table 6, Pearson correlations between the five per-sonality and music preferences (LS: STOMP dimensionsmean scores; LA: soundfiles) are compared to previousfindings by Delsing and colleagues (2008), George and col-leagues (2007), Rentfrow and Gosling (2003), and Zwei-genhaft (2008).
The strongest correlation in our study was found be-tween Openness and R&C, although Openness was alsopositively correlated with I&R and negatively with U&C.Conscientiousness was negatively connected to I&R andpositively to U&C. Extraversion was correlated with E&R,Neuroticism was weakly correlated with U&C, and Agree-ableness was not associated with any of the music prefer-ences. Compared to previous findings, the present correla-
Table 2. Reliabilities (Cronbach’s α), mean scores, and standard deviations of the STOMP dimensions; correlations ofSTOMP mean scores with sound files
STOMP dimension
Reflective & Complex Intense & Rebellious Upbeat & Conventional Energetic & Rhythmic
Number of items 3 3 4 3
Reliability .71 (.76/.53) .67 (.71/.57) .54 (.53/.52) .51 (.49/.61)
Mean –.08 (–.11/–.02) .55 (.61/.40) .18 (.06/.49)S –0.14 (–.21/.03)
Standard deviation 1.35 (1.42/1.15) 1.41 (1.46/1.27) 0.96 (.97/.86) 1.47 (1.49/.1.41)
Correlations to sound files
R&C .72* (.75*/.60*) .08 (.08/.10) –.00 (.00/–.05) .08 (.03/.24*)
I&R .05 (07/.01) .70* (.70*/.67*) –.15* (–.14*/–.14) –.12* (–.16*/.03)
U&C .01 (–.02/.00) –.13 (–.10/–.14) .49* (.48*/.44*) .18* (.19*/.04)
E&R .01 (–.00/.05) –.16* (–.19*/–.04) .27* (.29*/.16) .66* (.69*/.57*)Notes. n = 422, * p < .05, S = significant gender difference (T = –4.35, df = 235,01, p < .05); correlations to sound clips: R&C = Reflective &Complex, I&R = Intense and Rebellious, U&C = Upbeat and Conventional, E&R = Energetic and Rhythmic; total coefficients (men/women).Bold = corresponding dimensions of sound clips and STOMP
124 A. Langmeyer et al.: Music Preference and Personality
Journal of Individual Differences 2012; Vol. 33(2):119–130 © 2012 Hogrefe Publishing
This
doc
umen
t is c
opyr
ight
ed b
y th
e A
mer
ican
Psy
chol
ogic
al A
ssoc
iatio
n or
one
of i
ts a
llied
pub
lishe
rs.
This
arti
cle
is in
tend
ed so
lely
for t
he p
erso
nal u
se o
f the
indi
vidu
al u
ser a
nd is
not
to b
e di
ssem
inat
ed b
road
ly.
tions are equally strong and point in the same direction. Thedirection and power of the correlations do not differ muchbetween men and women.
Regarding the soundfiles instead of the STOMP dimen-sions, there was a similar pattern between the five person-ality dimension mean scores and the soundfiles (Table 6,LA).
The final analysis uses a SEM that combines the exam-ination of the factor structure of the STOMP, the affiliationof the soundclips, and the relationship between music pref-erences and personality (Figure 1). Music preferences wereestimated by both the particular STOMP genres and thecorresponding soundfiles. Previous results showed remark-able differences; hence, no relationships between person-ality and music preferences could be excluded from the
Table 3. Standardized regression weights of the 20 items in the CFA of the Big Five personality dimensions
Big Five personality dimensions
I see myself as someone who . . . O C E A N
O_051 likes to reflect, plays with ideas .48*
O_03 values artistic, esthetic experiences .77*
O_04 has an active imagination .49*
O_10– has only few artistic interests –.72*
C_04 is a reliable worker .81*
C_01 does a thorough job .79*
C_14– is easygoing –.48*
C_09– tends to be disorganized –.42*
E_01 is outgoing, sociable .76*
E_11 generates a lot of enthusiasm .56*
E_06– is reserved –.86*
E_08– tends to be quiet –.75*
A_01 is considerate and kind to almost everyone .44*
A_00 m rather likes to cooperate than to compete .45*
A_06 m– often has a tiff with others –.43*
A_08– is sometimes rude to others –.61*
N_03 gets nervous easily .74*
N_01 worries a lot .62*
N_05 m– remains calm, even in tense situations –.47*
N_06 m– is emotionally stable, not easy to upset –.43*
Notes. n = 422, *p < .05; O = Openness, C = Conscientiousness, E = Extraversion, A = Agreeableness, N = Neuroticism. 1numbered accordingto Table 1 in Lang et al. (2001); mmodified from Lang et al. (2001); –items are negatively aligned.
Table 4. SEM correlations of the five latent personality fac-tors in the CFA
O C E A
C .12(.03/.20)
E .13*(–.07/.23*)
–.01(–.03/–.11)
A .20*(.31*/–.13)
.13(.10/.24)
–.02(–.03/–.09)
N .08(.08/–.21)
–.07(–.16*/–.05)
–.40*(–.42*/–.65*)
–.02(.07/–.12)
Notes. n = 422, *p < .05; O = Openness, C = Conscientiousness, E =Extraversion, A = Agreeableness, N = Neuroticism. Total coefficientsare results of the CFA; (men/women) are results of the MGA withconstrained measurement weights.
Table 5. Reliabilities (Cronbach’s α), mean scores, and standard deviations of the personality dimensions
Big Five dimensions
O C E A N
Number of items 4 4 4 4 4
Reliability (α) .73 (.74/.73) .69 (.70/.60) .82 (.82/.83) .54 (.55/.51) .67 (.64/.65)
Mean 2.21 (1.89/3.04)S 2.50 (2.17/3.37)S 2.33 (2.00/3.21)S 2.37 (2.30/2.55) –1.44 (–1.91/–.22)S
Standard deviation 3.12 (3.21/2.82) 2.86 (2.88/2.58) 3.37 (3.38/3.20) 2.49 (2.53/2.35) 2.87 (2.81/2.65)
Notes. n = 422; O = Openness, C = Conscientiousness, E = Extraversion, A = Agreeableness, N = Neuroticism. total coefficients (men/women),Ssignificant gender difference (TO = –3.42, TC = –3.93, TE = –3.36, TN = –5.61; df = 420, p < .05).
A. Langmeyer et al.: Music Preference and Personality 125
© 2012 Hogrefe Publishing Journal of Individual Differences 2012; Vol. 33(2):119–130
This
doc
umen
t is c
opyr
ight
ed b
y th
e A
mer
ican
Psy
chol
ogic
al A
ssoc
iatio
n or
one
of i
ts a
llied
pub
lishe
rs.
This
arti
cle
is in
tend
ed so
lely
for t
he p
erso
nal u
se o
f the
indi
vidu
al u
ser a
nd is
not
to b
e di
ssem
inat
ed b
road
ly.
theoretical consideration. For the sake of clarity, only thestandardized significant paths are drawn in Figure 1.
Because the latent factors in both the personality dimen-sions and the STOMP were assumed to be independent, nocorrelations between these factors were estimated, exceptthe correlation between Extraversion and Neuroticism andbetween I&R and E&R, which showed very strong signif-icant correlations in the previous CFA. This decision wasalso made for the parsimony of the model.
The model fit was acceptable (Mardia test: z = 15.69,p < .001; χ²[607] = 1164.36, p < .000, pBS = .005, χ²normed =1.92; CFI = .563, RMSEA = .047, SRMR = .081). Allow-ing for gender differences in an MGA model, there wereno differences in the measurement weights, and the fit in-dices were acceptable (Mardia test: zmen = 13.24, zwomen =3.37, p < .05; χ²[1242] = 1672.79, p < .000, pBS = .005;χ²normed = 1.35; Δχ²[28] = 58.41, p = .001; CFI = .588,RMSEA = .029, SRMR = .082). Regarding the nested χ²value, even the structural weights can be fixed (Δχ²[20] =
23.99, p = .243, CFI = .584, RMSEA = .029, SRMR =.083).
The SEM analysis revealed the following: First, the twomeasurement models were well represented by the appro-priate items, as reported in the primary CFA models withhigh path loadings stronger than λ = .36. Second, the SEManalysis showed that all soundclips were good proxies forthe respective music dimensions, with high path loadingsstronger than λ = .70. The four music dimensions were alsowell represented by all corresponding items with loadingshigher than λ = .36. Only the STOMP genre “electronica”had a weak loading.
As to standardized paths in the structural model, unam-biguous relationships between personality and music pref-erences were found: R&C was strongly affected by Open-ness; I&R was affected by Openness and Extraversion, aswell as being slightly negatively influenced by Neuroti-cism; U&C was highly positively affected by Extraversion,but also by Neuroticism, Agreeableness, and negatively by
Table 6. Review of correlations found between dimensions of music preferences and personality in literature, and corre-lations of STOMP mean scores and sound files with personality mean scores in the present study
Openness Conscientiousness Extraversion Agreeableness Neuroticism
Min Max Min Max Min Max Min Max Min Max
R&C D .17* .28* .05 .08* .01 –.05 .13* .18* .07* .12*
R .41* .44* –.02 –.06 .01 –.02 .01 .03 –.04 –.08
G .24* .03 .08 .08 –.08
Z .35* –.01 .00 .09 –.18
LS .29* (.30*/.25*) .02 (.01/.03) –.01 (–.06/.15) .00 (–.02/.04) –.06 (–.07/–.09)
LA .24* (.24*/.22*) .04 (.03/.02) –.02 (–.09/.16) –.02 (–.04/.05) –.10 (–.06/–.32*)
I&R D .15* .22* –.09* –.17* .00 –.17* –.01 .03 .00 .05
R .15* .18* –.03 –.04 .00 .08 .01 –.04 .01 .01
G .13* –.24* .06 –.21* .08
Z .15 –.10 .04 –.03 –.11
LS .10* (.10/.16) –.14* (–.15*/–.07) –.07 (–.06/–.05) .04 (.00/.16) –.01 (–.01/.05)
LA .07 (.08/.12) –.20* (–.18*/–.21*) –.07 (–.07/–.03) –.02 (–.02/.01) –.02 (.01/–.00)
U&C D –.00 .04 –.01 .09* .12* .15* .08* .11* .00 –.05
R –.08 –.14 .15* .18* .15* .24* .23* .24* .04 .07
G .03 .12* .09* .05 –.00
Z –.36* .23* .09 .13 .09
LS –.12* (–.16*/–.14) .11* (.06/.14) .07 (.10/–.17) .04 (.02/.06) .10* (.05/.05)
LA –.13* (–.20*/–.12) .09 (.06/.03) .12* (.10/.04) .04 (.02/.05) .09 (–.00/.11)
E&R D .00 .03 –.02 .07* .10* .16* .06 .10* .00 –.03
R .03 .04 .00 –.03 .19* .22* .08* .09* –.01 .01
G .12* –.10* .06 –.12* .07
Z .32* –.12 .22 –.07 .02
LS .01 (.02/–.07) .05 (.08/–.11) .14* (.14*/.10) .04 (.06/–.06) .01 (–.00/–.03)
LA .03 (.02/–.03) .03 (.08/–.26*) .16* (.12/.21*) .00 (.01/–.06) .01 (.02/–.19*)
Notes. D = Delsing, Ter Bogt, Engels, & Meeus (2008); R = Rentfrow & Gosling (2003); G = George, Stickle, Rachid, & Wopnford (2007);Z = Zweigenhaft (2008); Min = weakest correlation reported by the authors, Max = strongest correlation reported by the authors. Present study:LS = correlations between STOMP mean scores and personality mean scores, LA = correlations between sound files and personality mean scores;total coefficients (men/women); bold = strong similar results were found in nearly all studies reported here; bold and italics = strong (r ≥ .10)results only in some of the studies, *p < .05.
126 A. Langmeyer et al.: Music Preference and Personality
Journal of Individual Differences 2012; Vol. 33(2):119–130 © 2012 Hogrefe Publishing
This
doc
umen
t is c
opyr
ight
ed b
y th
e A
mer
ican
Psy
chol
ogic
al A
ssoc
iatio
n or
one
of i
ts a
llied
pub
lishe
rs.
This
arti
cle
is in
tend
ed so
lely
for t
he p
erso
nal u
se o
f the
indi
vidu
al u
ser a
nd is
not
to b
e di
ssem
inat
ed b
road
ly.
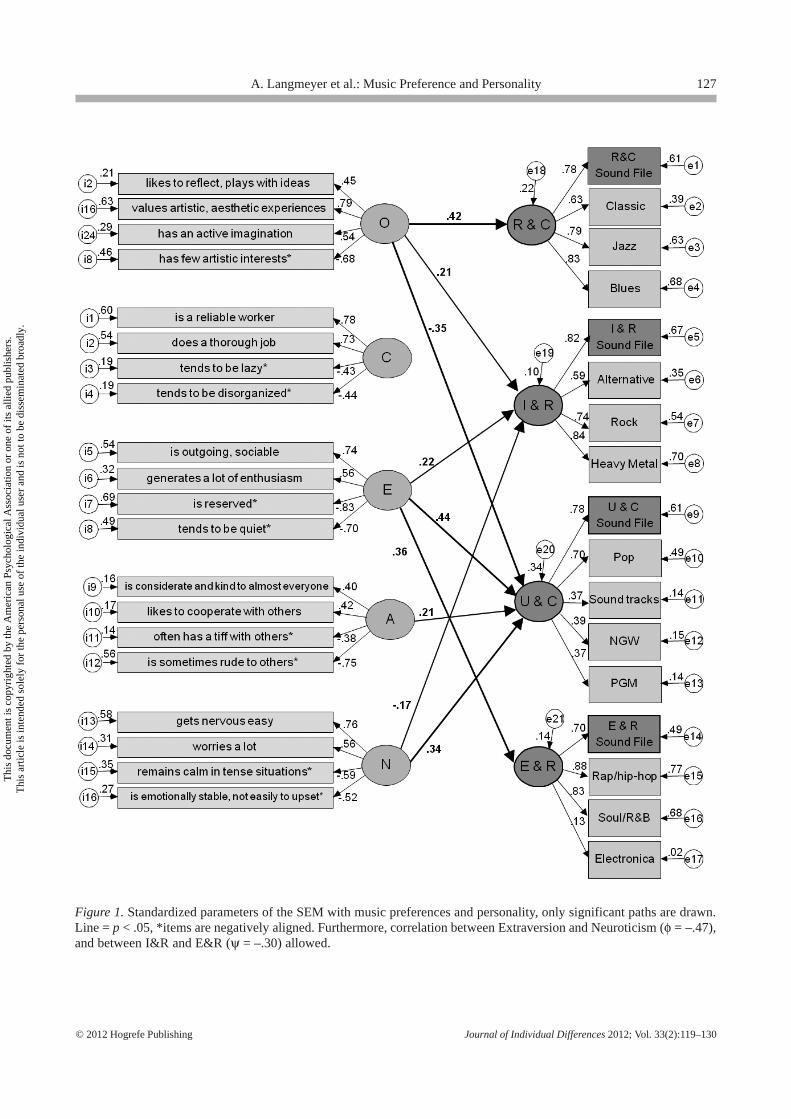
Figure 1. Standardized parameters of the SEM with music preferences and personality, only significant paths are drawn.Line = p < .05, *items are negatively aligned. Furthermore, correlation between Extraversion and Neuroticism (φ = –.47),and between I&R and E&R (ψ = –.30) allowed.
A. Langmeyer et al.: Music Preference and Personality 127
© 2012 Hogrefe Publishing Journal of Individual Differences 2012; Vol. 33(2):119–130
This
doc
umen
t is c
opyr
ight
ed b
y th
e A
mer
ican
Psy
chol
ogic
al A
ssoc
iatio
n or
one
of i
ts a
llied
pub
lishe
rs.
This
arti
cle
is in
tend
ed so
lely
for t
he p
erso
nal u
se o
f the
indi
vidu
al u
ser a
nd is
not
to b
e di
ssem
inat
ed b
road
ly.
Openness; E&R was positively influenced by Extraversion.In other words, Openness, Extraversion, and Neuroticismtogether were connected to all music styles, Agreeablenessonly to U&C. Specifically, Openness had a strong positiveeffect on liking R&C, disliking U&C, and a medium effecton liking I&R. Conscientiousness had no effect on likingor disliking of any kind of music. Extraversion had a strongpositive effect on liking U&C and E&R, and also a mediumpositive effect on liking I&R. Agreeableness affected onlythe liking of U&C. Neuroticism had a strong effect on lik-ing U&C and a weak effect on disliking I&R.
Furthermore, a strong, negative correlation was found asassumed between Extraversion and Neuroticism (φ = –.47),and between I&R and E&R (ψ = –.30).
The patterns of these results are quite similar to whatresulted from the bivariate analyses, although they arestronger and the weak paths from Conscientiousness toU&C vanished; Extraversion had a new medium connec-tion to I&R, a now stronger path to U&C and to E&R;Neuroticism had a new negative path to I&R and a strongerpositive path to U&C.
Discussion
We were able to replicate the factor structure of the ShortTest of Music Preferences (STOMP, Rentfrow & Gosling,2003) with a German sample in a CFA model. We foundgender differences in the structural model: Men are char-acterized by mutually exclusive ratings of music genres,whereas women emphasize similarities. Strong negativecorrelations between Intense & Rebellious (I&R) and En-ergetic & Rhythmic (E&R) were also found by Delsing andcolleagues (2008), and strong positive correlations betweenUpbeat & Conventional (U&C) and E&R – as also oc-curred especially in our female sample – were found byother studies (Delsing et al., 2008; Rentfrow & Gosling,2003).
The present study was the first to validate the STOMPby rating audio samples. Correlations of averages betweenSTOMP factors and corresponding soundfiles were strongoverall. This corresponds to the findings of Dunn and col-leagues (2011), who found relations were weaker overall;however, they measured duration of listening instead ofpreferences for soundfiles. In our study, the weakest corre-lation was between U&C and the corresponding soundfile.The U&C dimensions “Popular German Music” and “NewGerman Wave” were added to the STOMP, although theoriginal soundfile did not include those two genres. More-over, a further CFA model containing the soundfiles con-firmed the validity as well.
We also addressed the relationship between personalitydimensions and music preferences. We estimated a SEMincluding the music preferences, measured by correspond-ing soundfiles and STOMP items, as well as the Big Fivepersonality dimensions, measured by the corresponding
personality items. A consistent pattern of associations be-tween music preferences and personality emerged. Themost important findings were that the more open to expe-riences individuals were, the more they preferred Reflec-tive & Complex (R&C; e.g., classical music) and I&R (e.g.,rock music), and the less they liked U&C music. The moreextraverted individuals were, the more they preferred U&Ctypes of music (e.g., pop-music), E&R music (e.g., rap/hip-hop) as well as I&R (e.g., rock music). This study alsorevealed that the more neurotic individuals were, the lesslikely they were to enjoy I&R music, but rather preferredU&C. It was further found that Agreeableness only affect-ed ratings of U&C music, while Conscientiousness did nothave an influence on music preferences. How can thesedifferences be explained? The examination of complextypes of music might be rather special for young people. Ifyou are open to new experiences, you may also be open tonew and complex music experiences. This means you donot necessarily listen to complex music regularly, but thatyou might report liking it because it is new and unknownto you. If you like I&R music, you might be an energeticextravert and open to fervid music experiences, yet not neu-rotic. If you like U&C music, you might also be an ener-getic extravert, yet also agreeable (in contrast to somebodywho likes I&R) and neurotic. If you like E&R, you mightbe extraverted, perhaps also sociable and therefore mightlike music heard in clubs and at parties. All in all, the resultspoint out that personality traits and music preferences arecongruent.
Comparable SEM models including personality dimen-sions and music preferences have not been reported else-where. Therefore, we compared the correlations computedbased on mean scores to previous findings (Table 5), whichshowed by and large similar patterns and correlations as inprevious studies (Delsing et al., 2008; George et al., 2007;Rentfrow & Gosling, 2003; Zweigenhaft, 2008). In accor-dance with these studies, correlation analyses as well as theSEM analysis showed that the personality dimensionsOpenness and Extraversion are the best predictors of musicpreferences. Further, on the basis of the STOMP dimen-sions as well as on the soundfiles the present study alsoreplicated the finding that Openness is positively correlatedto R&C and I&R music, and also that Extraversion is pos-itively related to E&R types of music. Moreover, Rentfrowand Gosling’s (2003) and Zweigenhaft’s (2008) findingthat Openness is negatively associated with U&C was rep-licated, as well as that Conscientiousness is negatively cor-related with I&R (see Delsing et al., 2008; George et al.,2007; Zweigenhaft, 2008) and weak correlated with U&C(see Rentfrow & Gosling, 2003; George et al., 2007; Zwei-genhaft, 2008) as most other studies report. Further, theresult of Rentfrow and Gosling (2003) and Delsing and col-leagues (2008) that Extraversion is correlated with U&Cwas confirmed in the male sample and by means of ratingsoundfiles. Audio stimuli ratings revealed comparable cor-relations to personality traits as the STOMP ratings. Theseresults differ from the findings of Dunn and colleagues
128 A. Langmeyer et al.: Music Preference and Personality
Journal of Individual Differences 2012; Vol. 33(2):119–130 © 2012 Hogrefe Publishing
This
doc
umen
t is c
opyr
ight
ed b
y th
e A
mer
ican
Psy
chol
ogic
al A
ssoc
iatio
n or
one
of i
ts a
llied
pub
lishe
rs.
This
arti
cle
is in
tend
ed so
lely
for t
he p
erso
nal u
se o
f the
indi
vidu
al u
ser a
nd is
not
to b
e di
ssem
inat
ed b
road
ly.
(2011), which compared the relationship of music prefer-ences and personality to the relationship of music behaviorand personality.
All in all, the results of the studies from the United Statesand The Netherlands regarding the factor structure of theSTOMP dimensions as well as the correlations betweenmusic preferences and personality also apply to the Germansample.
Although the results of the present study were generallyconsistent with those of Rentfrow and Gosling (2003),George and colleagues (2007), Delsing and Colleagues(2008), and Zweigenhaft (2008), it still has some limita-tions. The first is that the analyses are based on cross-sec-tional data, so that no causal conclusions could be made. Itis therefore possible that personality influences music pref-erences. Yet, according to self-expression theory (Rentfrow& Gosling, 2007), it is also just as likely that music prefer-ences can influence personality. Furthermore, similar tomost previous studies, nearly all reported correlations arerather weak, as discussed by Dunn and colleagues (2011).This lead us to speculate that personality is not the onlypredictor of music preferences. Potential other predictorsof music preferences may be differences in knowledge ofmusic (e.g., knowing how to play an instrument), perceivedtempo and loudness as reported by Kantor-Martynuska(2009), or why and how people listen to music in their ev-eryday lives (use of music; Chamorro-Premuzic & Furn-ham, 2007; Chamorro-Premuzic, Swami, Furnham, &Maakip, 2009; Getz, Chamorro-Premuzic, Roy, & Dev-roop, 2011).
A further limitation is, though intended, that the sampleof the present study was restricted to only young studentsand disproportional in gender size. It is very likely that therelationship between personality and music preferences isdetermined by other personal indicators, such as age andpersonal background. For example, someone who likes rapmusic and is 20 years old might have a different personalityfrom somebody who is 60 years old and (still) a fan of rapmusic. In future research an expanded and differentiatedsample would be preferable to help generalize findings.
References
Adorno, T. W. (1962). Einleitung in die Musiksoziologie. 12 theo-retische Vorlesungen [Introduction to sociology of music].Frankfurt a.M.: Suhrkamp.
Bentler, P. M. (1990). Comparative fit indexes in structural mod-els. Psychological Bulletin, 107, 238–246.
Bollen, K., & Long, J. (1993). Introduction. In K. Bollen & J.Long (Eds.), Testing structural equation models (pp. 1–9).Newbury Park: Sage.
Bollen, K., & Stine, R. (1993). Bootstrapping goodness-of-fitmeasures in structural equation models. In K. Bollen & J. Long(Eds.), Testing structural equation models (pp. 111–135).Newbury Park: Sage.
Cattell, R. B., & Anderson, J. C. (1953). IPAT Music PreferenceTest of Personality, Form A & B. Champaign, IL: IPAT (Insti-tute for Personality and Ability Testing).
Cattell, R. B., & Saunders, D. R. (1954). Musical preferences andpersonality diagnosis: A factorization of 120 themes. TheJournal of Social Psychology, 39, 3–24.
Chamorro-Prezmuzic, T., & Furnham, A. (2007). Personality andmusic: Can traits explain how people use music in everydaylife? British Journal of Psychology, 98, 175–185.
Chamorro-Prezmuzic, T., Swami, V., Furnham, A., & Maakip, I.(2009). The Big Five Personality Traits and uses of music: Areplication in Malaysia using structural equation modeling.Journal of Individual Differences, 30, 20–27.
Cheung, G. W., & Rensvold, R. B. (2002). Evaluating goodness-of-fit indexes for testing measurement invariance. StructuralEquation Modeling, 9, 233–255.
Colley, A. (2008). Young people’s musical taste: Relationshipwith gender and gender-related traits. Journal of Applied So-cial Psychology, 38, 2039–2055.
Costa, P. T., & McCrae, R. R. (1985). The NEO Personality In-ventory manual. Odessa, FL: Psychological Assessment Re-sources.
Costa, P. T., & McCrae, R. R. (1992). The Revised NEO Person-ality Inventory manual. Odessa, FL: Psychological Assess-ment Resources.
Daoussis, L., & McKelvie, S. J. (1986). Musical preferences andeffects of music on a reading comprehension test for extravertsand introverts. Perceptual and Motor Skills, 62, 283–289.
Delsing, M. J., Ter Bogt, T. F. M., Engels, R. C., & Meeus, W. H.(2008). Adolescents’ music preferences and personality char-acteristics. European Journal of Personality, 22, 109–130.
Dollinger, S. J. (1993). Personality and music preference: Extra-version and excitement seeking or openness to experience?Psychology of Music, 21, 73–77.
Dunn, P. G. (2009). Music preferences based on audio featuresand its relation to personality. In Proceedings of the 7th Trien-nial Conference of European Society for the Cognitive Scienc-es of Music (ESCOM 2009) Jyväskylä, Finland (pp. 83–92).Retrieved from http://urn.fi/URN:NBN:fi:jyu-2009411243
Dunn, P. G., de Ruyter, B., & Bouwhuis, D. G. (2011). Toward abetter understanding of the relation between music preference,listening behavior, and personality. Psychology of Music. Ad-vance online publication. doi 10.1177/0305735610388897
Eysenck, H. J., & Eysenck, S. B. G. (1976). Psychoticism as adimension of personality. London, UK: Hodder and Stough-ton.
Fan, X., Thompson, B., & Wang, L. (1999). Effects of samplesize, estimation methods, and model specification on structuralequation modeling fit indexes. Structural Equation Modeling,6, 56–83.
Feingold, A. (1994). Gender differences in personality: A meta-analysis. Psychological Bulletin, 116, 429–456.
George, D., Stickle, K., Rachid, F., & Wopnford, A. (2007). Theassociation between types of music enjoyed and cognitive, be-havioral, and personality factors of those who listen. Psycho-musicology, 19, 32–56.
Getz, L. M., Chamorro-Premuzic, T., Roy, M., & Devroop, K.(2011). The relationship between affect, uses of music, andmusic preferences in a sample of South African adolescents.Psychology of Music. Advance online publication. doi10.1177/0305735610381818
A. Langmeyer et al.: Music Preference and Personality 129
© 2012 Hogrefe Publishing Journal of Individual Differences 2012; Vol. 33(2):119–130
This
doc
umen
t is c
opyr
ight
ed b
y th
e A
mer
ican
Psy
chol
ogic
al A
ssoc
iatio
n or
one
of i
ts a
llied
pub
lishe
rs.
This
arti
cle
is in
tend
ed so
lely
for t
he p
erso
nal u
se o
f the
indi
vidu
al u
ser a
nd is
not
to b
e di
ssem
inat
ed b
road
ly.
Goldberg, L. R. (1992). The development of markers for the Big-Five factor structure. Psychological Assessment, 4, 26–42.
Healey, B. J. (1973). Pilot study on the applicability of the MusicPreference Test of Personality. Journal of Music Therapy, 10,36–45.
Hilliard, R. E. (2001). The use of cognitive-behavioral music ther-apy in the treatment of women with eating disorders. MusicTherapy Perspectives, 19, 109–113.
Hu, L., & Bentler, P. M. (1999). Cutoff criteria for fit indexes incovariance structure analysis: Conventional criteria versusnew alternatives. Structural Equation Modeling, 6, 1–55.
John, O. P., & Srivastava, S. (1999). The Big Five trait taxonomy:History, measurement, and theoretical perspectives. In L. A.Pervin, & O. P. John (Eds.), Handbook of personality: Theoryand research (2nd ed., pp. 102–138). New York: Guilford.
Jöreskog, K. G. (1969). A general approach to confirmatory max-imum likelihood factor analysis. Psychometrika, 34, 183–202.
Jöreskog, K. G., & Sörbom, D. (1981). LISREL VI: Analysis oflinear structural relationships by the method of maximum like-lihood, instrumental variables, and least squares methods.Lincolnwood, IL: Scientific Software.
Kantor-Martynuska, J. (2009). The listener’s temperament andperceived tempo and loudness of music. European Journal ofPersonality, 23, 655–673.
Lang, F. R., Lüdtke, O., & Asendorpf, J. B. (2001). Testgüte undpsychometrische Äquivalenz der deutschen Version des BigFive Inventory (BFI) bei jungen, mittelalten und alten Erwach-senen [Validity and psychometric equivalence of the Germanversion of the Big Five Inventory in young, middle-aged andold adults]. Diagnostica, 47, 111–121.
Litle, P., & Zuckerman, M. (1986). Sensation seeking and musicpreferences. Personality and Individual Differences, 7,575–578.
Little, T. D. (1997). Mean and Covariance Structures (MACS).Analyses of cross-cultural data: Practical and theoretical is-sues. Multivariate Behavioral Research, 32, 53–76.
McNamara, L., & Ballard, M. E. (1999). Resting arousal, sensa-tion seeking, and music preference. Genetic, Social, & GeneralPsychology Monographs, 125, 229–250.
Rawlings, D., & Ciancarelli, V. (1997). Music preference and thefive-factor model of the NEO Personality Inventory. Psychol-ogy of Music, 25, 120–132.
Rawlings, D., Hodge, M., Sherr, D., & Dempsey, A. (1995).Toughmindedness and preferences for musical excerpts, cate-gories, and triads. Psychology of Music, 23, 63–80.
Rawlings, D., Twomey, F., Burns, E., & Morris, S. (1998). Per-sonality, creativity, and esthetic preference: Comparing psy-chotism, sensation seeking, schizotypy, and openness to expe-rience. Empirical Studies of the Arts, 16, 153–178.
Rawlings, D., Vidal, N., & Furnham, A. (2000). Personality and es-thetic preferences in Spain and England: Two studies relating sen-
sation seeking and openness to experience to liking for paintingsand music. European Journal of Personality, 14, 553–576.
Raykov, T. (1998). On the use of confirmatory factor analysis inpersonality research. Personality and Individual Differences,24, 291–293.
Rentfrow, P. J. (2004). music files [file]. Retrieved fromhttp://web.mac.com/jrentfrow/iWeb/Dr.%20Peter%20Jason%20Rentfrow/PJR%20Main.html
Rentfrow, P. J., Goldberg, L. R., & Levitin, D. J. (2011). Thestructure of musical preferences: A five-factor model. Journalof Personality and Social Psychology, 100, 1139–1157.
Rentfrow, P. J., & Gosling, S. D. (2003). The do re mi’s of everydaylife: The structure and personality correlates of music preferences.Journal of Personality and Social Psychology, 84, 1236–1256.
Rentfrow, P. J., & Gosling, S. D. (2006). Message in a ballad. Therole of music preferences in interpersonal perception. Psycho-logical Science, 17, 236–242.
Rentfrow, P. J., & Gosling, S. D. (2007). The content and validityof music-genre stereotypes among college students. Psychol-ogy of Music, 35, 306–326.
Schmolck, P. (2004). ESF-Projekt WT04. Beschreibung der ein-gesetzten Instrumente und individuelle Testergebnisse. Unver-öffentlichter Projektbericht [ESF-Project WT04. Descriptionof applied instruments. Unpublished project report]. Neubi-berg: Universität der Bundeswehr München.
Sikkema, P. (1999). Jongeren 890 – 990: Een generatie waar omgevochten wordt [Youth 890–990: A generation that is beingfought for]. Amsterdam: Interview-NSS.
Steiger, J. H. (1989). EzPATH: A supplementary module for SYS-TAT and SYGRAPH. Evanston, IL: SYSTAT.
Zuckerman, M., Eysenck, S., & Eysenck, H. J. (1978). Sensationseeking in England and America:Cross- cultural age and sex com-parisons. Journal of Consulting and Clinical Psychology, 46,139–149.
Zweigenhaft, R. L. (2008). A do re mi encore. A closer look atthe personality correlates of music preferences. Journal of In-dividual Differences, 29, 45–55.
Accepted for publication: October 11, 2011
Alexandra Langmeyer
Universität der Bundeswehr MünchenFakultät für PädagogikWerner-Heisenberg-Weg 3985577 NeubibergGermanyE-mail [email protected],[email protected]
130 A. Langmeyer et al.: Music Preference and Personality
Journal of Individual Differences 2012; Vol. 33(2):119–130 © 2012 Hogrefe Publishing
This
doc
umen
t is c
opyr
ight
ed b
y th
e A
mer
ican
Psy
chol
ogic
al A
ssoc
iatio
n or
one
of i
ts a
llied
pub
lishe
rs.
This
arti
cle
is in
tend
ed so
lely
for t
he p
erso
nal u
se o
f the
indi
vidu
al u
ser a
nd is
not
to b
e di
ssem
inat
ed b
road
ly.