difference score reliabilities - OSF
38
DIFFERENCE SCORE RELIABILITIES 1 Difference score reliabilities within the RIAS-2 and WISC-V Ryan L. Farmer Oklahoma State University Samuel Y. Kim Texas Woman’s University Author Note This is a preprint. The final, peer reviewed manuscript is in press at Psychology in the Schools. This document will be updated once a digital object identifier has been issued. Ryan L. Farmer, School of Teaching, Learning, & Educational Sciences, Oklahoma State University. Samuel Y. Kim, Department of Psychology and Philosophy, Texas Woman’s University. The authors would like to thank Sarah Brown for her work on this project. The authors declare no conflicts of interest. Correspondence concerning this article should be addressed to Ryan Farmer, School of Teaching, Learning, & Educational Sciences, Oklahoma State University, Stillwater, OK. E- mail: [email protected].
-
Upload
khangminh22 -
Category
Documents
-
view
0 -
download
0
Transcript of difference score reliabilities - OSF

DIFFERENCE SCORE RELIABILITIES 1
Difference score reliabilities within the RIAS-2 and WISC-V
Ryan L. Farmer
Oklahoma State University
Samuel Y. Kim
Texas Woman’s University
Author Note
This is a preprint. The final, peer reviewed manuscript is in press at Psychology in the
Schools. This document will be updated once a digital object identifier has been issued.
Ryan L. Farmer, School of Teaching, Learning, & Educational Sciences, Oklahoma State
University. Samuel Y. Kim, Department of Psychology and Philosophy, Texas Woman’s
University.
The authors would like to thank Sarah Brown for her work on this project. The authors
declare no conflicts of interest.
Correspondence concerning this article should be addressed to Ryan Farmer, School of
Teaching, Learning, & Educational Sciences, Oklahoma State University, Stillwater, OK. E-
mail: [email protected].

DIFFERENCE SCORE RELIABILITIES 2
Abstract
Many prominent intelligence tests (e.g., WISC-V & RIAS-2) offer methods for computing
subtest- and composite-level difference scores. This current study uses data provided in the
technical manual of the Wechsler Intelligence Scale for Children, Fifth Edition (WISC-V) and
Reynolds Intellectual Abilities Scale, Second Edition (RIAS-2) to calculate reliability
coefficients for difference scores. Subtest-level difference score reliabilities range from 0.59 to
0.99 for the RIAS-2 and from 0.53 to 0.87 for the WISC-V. Composite-level difference score
reliabilities range from 0.23 to 0.95 for the RIAS-2 and from 0.36 to 0.87 for the WISC-V, with
the exception of the FSIQ > GAI comparison, which resulted in a reliability of 0.00. Emphasis is
placed on comparisons recommended by test publishers and a discussion of minimum
requirements for interpretation of differences scores is provided.
Keywords: intelligence test; difference score; reliability; evidence based assessment

DIFFERENCE SCORE RELIABILITIES 3
Difference score reliabilities within the RIAS-2 and WISC-V
Despite the enduring use of cognitive measures, researchers continue to debate how they
should be interpreted (Fiorello, Flanagan, & Hale, 2014; Fiorello et al., 2007; McGill,
Dombrowski, & Canivez, 2018; Watkins, 2000). While several researchers have argued that
interpretation should be isolated to the general intelligence composite (Canivez, 2013;
Dombrowski, 2015; J. H. Kranzler & Floyd, 2013), alternative interpretive frameworks
emphasize more specific cognitive abilities (e.g., Comprehension Knowledge) and how they
compare to other specific cognitive abilities (e.g., Fiorello et al., 2014; Flanagan & Alfonso,
2017; Flanagan, Ortiz, & Alfonso, 2013; Kaufman, Raiford, & Coalson, 2015). The latter
perspective has long been a significant component of the Intelligent Testing (Kaufman, 1979)
approach to interpretation (cf. Sattler, 2018), which has intuitive and social appeal (Bray, Kehle,
& Hintze, 1998) and continues to have both implicit or explicit endorsement by test authors (e.g.,
Reynolds & Kamphaus, 2015a; Wechsler, 2014a). Regarding the latter point, several test
manuals (e.g., Reynolds & Kamphaus, 2015b, pp. 51-52; Wechsler, 2014b, pp. 62-76) provide
interpretive instructions that mirror the contemporary intelligent testing framework (Kaufman et
al., 2015). Moreover, test authors provide dedicated worksheets as part of their record forms for
the calculation of differences between specific cognitive ability composites and between
subtests. Likely due to a constellation of these factors, as much as 65% and 33% of instructors
teach students to interpret comparisons between composite scores and between subtests,
respectively (Lockwood & Farmer, 2019). It is then no surprise that practitioners report
interpreting score comparisons in practice (Benson et al., 2019; Kranzler et al., 2020; Sotelo‐
Dynega & Dixon, 2014).
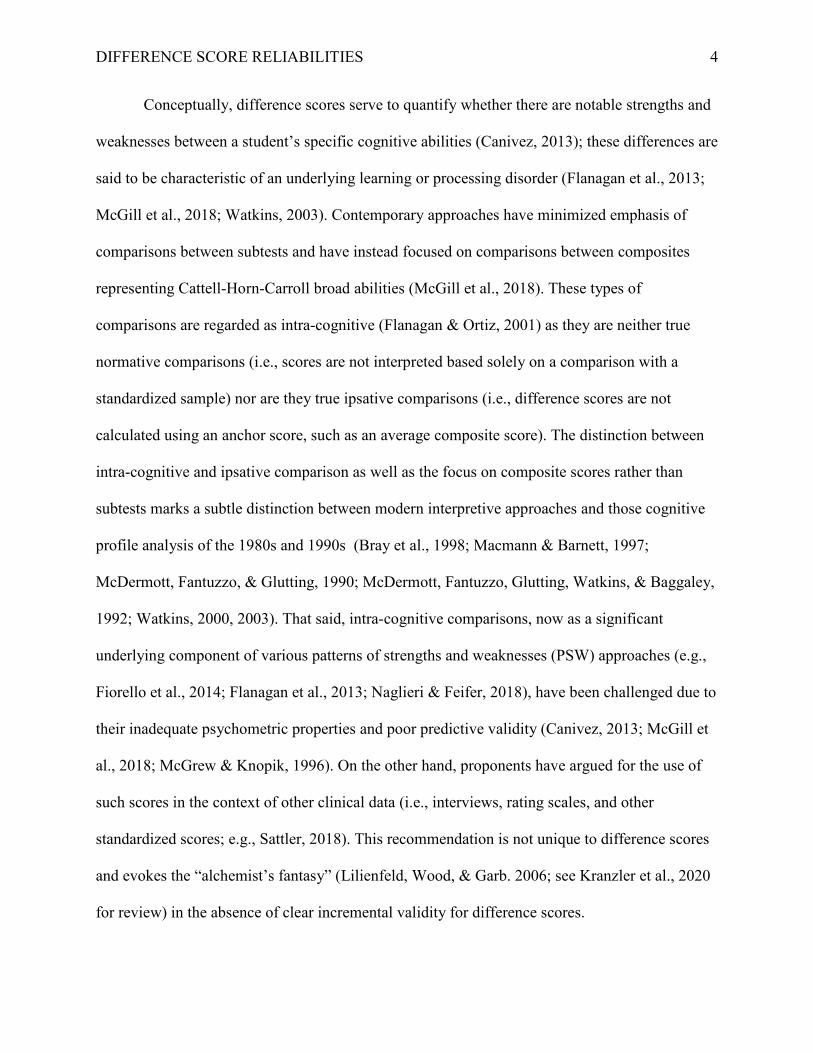
DIFFERENCE SCORE RELIABILITIES 4
Conceptually, difference scores serve to quantify whether there are notable strengths and
weaknesses between a student’s specific cognitive abilities (Canivez, 2013); these differences are
said to be characteristic of an underlying learning or processing disorder (Flanagan et al., 2013;
McGill et al., 2018; Watkins, 2003). Contemporary approaches have minimized emphasis of
comparisons between subtests and have instead focused on comparisons between composites
representing Cattell-Horn-Carroll broad abilities (McGill et al., 2018). These types of
comparisons are regarded as intra-cognitive (Flanagan & Ortiz, 2001) as they are neither true
normative comparisons (i.e., scores are not interpreted based solely on a comparison with a
standardized sample) nor are they true ipsative comparisons (i.e., difference scores are not
calculated using an anchor score, such as an average composite score). The distinction between
intra-cognitive and ipsative comparison as well as the focus on composite scores rather than
subtests marks a subtle distinction between modern interpretive approaches and those cognitive
profile analysis of the 1980s and 1990s (Bray et al., 1998; Macmann & Barnett, 1997;
McDermott, Fantuzzo, & Glutting, 1990; McDermott, Fantuzzo, Glutting, Watkins, & Baggaley,
1992; Watkins, 2000, 2003). That said, intra-cognitive comparisons, now as a significant
underlying component of various patterns of strengths and weaknesses (PSW) approaches (e.g.,
Fiorello et al., 2014; Flanagan et al., 2013; Naglieri & Feifer, 2018), have been challenged due to
their inadequate psychometric properties and poor predictive validity (Canivez, 2013; McGill et
al., 2018; McGrew & Knopik, 1996). On the other hand, proponents have argued for the use of
such scores in the context of other clinical data (i.e., interviews, rating scales, and other
standardized scores; e.g., Sattler, 2018). This recommendation is not unique to difference scores
and evokes the “alchemist’s fantasy” (Lilienfeld, Wood, & Garb. 2006; see Kranzler et al., 2020
for review) in the absence of clear incremental validity for difference scores.

DIFFERENCE SCORE RELIABILITIES 5
Often, the first step in establishing that a score is useful is to evaluate whether it is
reliable at a single time point; this basic expectation is included in ethical and professional
guidelines (American Educational Research Association [AERA], APA, & National Council on
Measurement in Education [NCME], 2014; American Psychological Association [APA], 2010;
Hunsley & Mash, 2018; National Association of School Psychologists [NASP], 2010). However,
to adequately explore what is “good enough” (Hunsley & Mash, 2018) reliability, both reliability
and its implications for practice must be discussed. Reliability is conceptually defined as “…the
degree to which scores are free from errors of measurement” (Price, 2016, p. 203) and is defined
as the ratio of true score variance to observed score variance (Nunnally & Bernstein, 1994, p.
212). We will explore this issue primarily in relation to internal consistency reliability (ICR;
Cronbach, 1947; R. M. Thorndike & Thorndike-Christ, 2010). In school psychology, the most
salient uses of reliability are the confidence intervals generated to help describe scores from
various instruments. As such, observing the impact of adequate and inadequate reliability on
obtained test scores can be done by reviewing the widths of the confidence intervals for those
scores. Confidence interval widths (CI widths) are the range between the confidence limits. For
confidence intervals that are already generated, users of these instruments can take the difference
between the upper-bound confidence limit and the lower-bound confidence limit. For example, a
standard score of 100 (m = 100, sd = 15) with reliability of 0.90, the 95% confidence interval
ranges between 91 and 109; 109 – 91 results in a CI width of 18 points. The standard deviation
and reliability of the score, as well as the desired confidence level (e.g., 95%, 90%, 68%) all play
an integral role in the calculation of confidence intervals. The importance of reliability on
obtained scores can be seen through its impact on CI widths at various levels of (Schneider,
2014). Figure 1 represents such a comparison, with reliability coefficients ranging between 0.70

DIFFERENCE SCORE RELIABILITIES 6
and 1.00 on the x-axis, CI width along the y-axis, and then separate lines representing common
confidence levels, from 68% through 99%. Points along each path indicate the calculated CI
width at 0.70, 0.80, and 0.90 reliability; the standard deviation is held constant at 15 for all
calculations.
Figure 1. Confidence interval widths as a function of reliability coefficient and confidence level
when standard deviation is held constant at 15.
Given these data, the relationship between a particular confidence level (e.g., 95%) curve to
gauge the degree of uncertainty associated with each level of reliability. This is especially
informative when considering high-stakes clinical decisions such as classification and diagnosis.

DIFFERENCE SCORE RELIABILITIES 7
Experts have argued that to use an instrument for clinical purposes, its ICR, typically calculated
using Cronbach’s Alpha (α; Cronbach, 1951), should be equal to or higher than 0.90 (e.g., Aiken
& Groth-Marnat, 2005; Nunnally & Bernstein, 1994). The justification for such a high standard
can be understood when considering that lower reliability levels can lead to large confidence
intervals. Clinical decisions often rest, in part, on the distinction between an observed score and a
cut-score, and small differences in the observed score can greatly influence the decisions to be
made. In clinical practice, it is difficult to accept any degree of uncertainty, and so the argument
is that a reliability estimate of 0.90—and ideally, of 0.95—should be the minimum acceptable
standard (Aiken & Groth-Marnat, 2005; Nunnally & Bernstein, 1994). Even when requiring a
reliability estimate of 0.90 or 0.95, the 95% CI widths are ~19 points and ~13 points,
respectively. Thus, even with a small change in level of reliability (i.e., from 0.95 to 0.90, the
risk of false positives and negatives do increase noticeably.
Depending upon the purpose of the assessment, a practitioner may be more or less
comfortable with uncertainty—and thus more or less willing to rely on a wider or narrower CI
width. Hunsley and Mash (2018) developed a tripartite model recognizing that a single guideline
(e.g., instruments used for clinical decision making should have an internal consistency
reliability of 0.90; Nunnally & Bernstein, 1994) fails to recognize the variety of reasons for
which a clinician may be using a test score; see table 1. For instance, it would be inaccurate to
suggest that the same level of certainty is necessary when (a) making a diagnosis of specific
learning disability (SLD) and when (b) assessing digits correct per minute during treatment. SLD
relies on test scores (e.g., achievement test scores) that are obtained at a fixed point in time while
digits correct per minute relies on measurement repeated over time. Moreover, the stakes of
making an error across these uses are different; making a change to educational placement or

DIFFERENCE SCORE RELIABILITIES 8
diagnosis can be complex where as the modification of treatment is a simpler procedure. As a
result, it may be reasonable to make a decision about treatment response when the CI width is
large, but it would be challenging to justify making a diagnosis given such uncertain data.
What Makes a Difference Score Reliable?
As with any score from a psychological instrument, difference scores are clinically useful
when they provide meaningful, reliable information that aids in the decision-making process
(AERA, APA, & NCME, 2014; Hunsley & Mash, 2018). Before interpreting a difference score,
practitioners should first consider the reliability of the information provided by the score as well
as its usefulness in guiding a decision. Any intelligence test score used in the diagnostic or
educational classification decision-making process should have the smallest CI width possible.
As such, the 0.90 criteria first established by Nunnally and Bernstein (1994) and more recently
described as “excellent” by Hunsley and Mash (2018) will be used in the current study.
However, given that test publishers do not provide the standard deviation and reliability of all
scores—especially difference scores—from their instruments, estimating an appropriate CI width
for difference scores is challenging
As difference scores are typically established through a simple-difference procedure (i.e.,
subtracting one score from another), the errors of both scores (i.e., the contrast scores) will have
a cumulative effect (Glass, Ryan, & Charter, 2010; McGill et al., 2018). Two essential
components of a good difference score are (1) high contrast score reliability and (2) low-to-
moderate intercorrelation between the contrasted scores. To illustrate, two contrast scores with
reliability 0.94 and 0.95 will result in a difference score reliability of 0.91 when their correlation
is 0.30. However, the difference score reliability will be 0.35 when their correlation is 0.90, far
below the 0.90 threshold for clinical decision making. Conversely, when contrast score

DIFFERENCE SCORE RELIABILITIES 9
reliabilities are low (e.g., 0.20) to moderate (e.g., 0.40), the difference score reliability
approaches 0.00. Conceptually, variability within all intelligence test scores stem from (a)
general intelligence, (b) specific cognitive abilities, and (c) error (Carroll, 1993); when the
simple-difference between comparison scores are calculated, the sources or portions of variance
that are removed cannot be controlled for, ultimately resulting in a score that has greater error
than either of its parts. Thus, if practitioners continue to use difference scores, they should have
access and be aware of the reliabilities of these scores, and likely interpret them in light of their
CI (Charter & Feldt, 2009).
Interpreting CI Width of Difference Scores
Charter (1999) and Charter and Feldt (2009) argued for the interpretation of difference
scores based on their confidence intervals, and suggest there are four distinct possibilities and
recommended outcomes. These types are depicted in figure 2 with a hypothetical CI width of 12
and difference scores selected for clarity.
DIFFERENCE SCORE RELIABILITIES 10
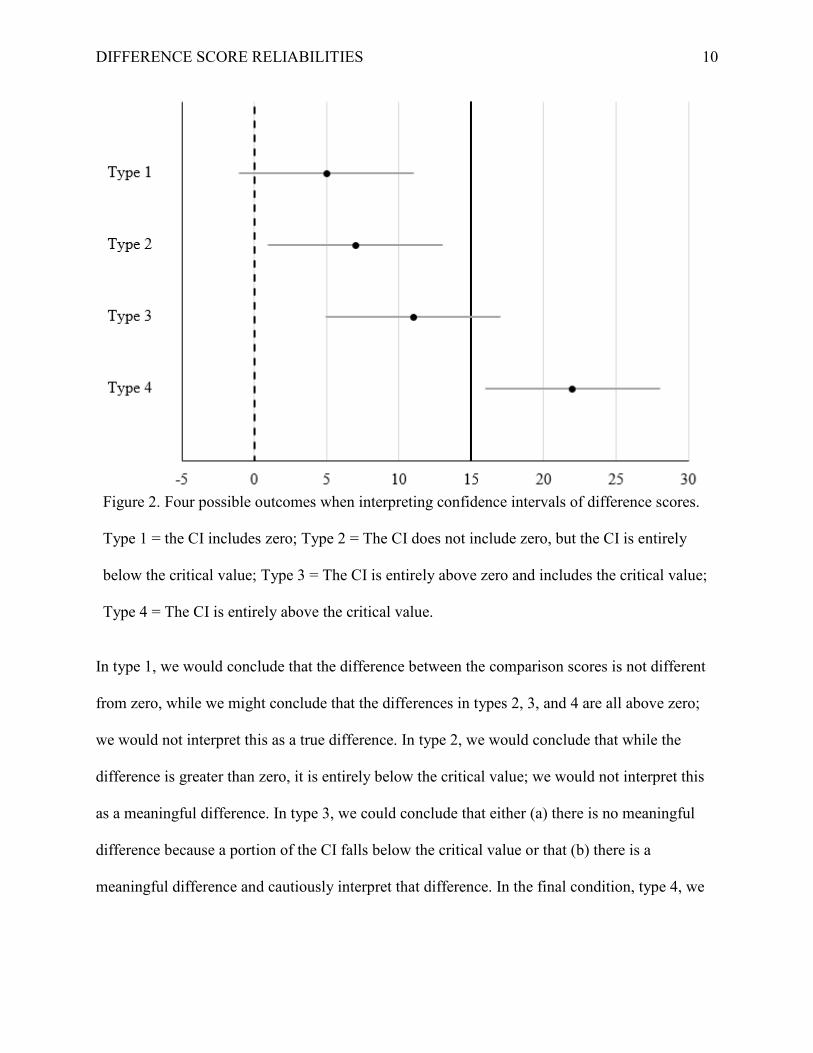
Figure 2. Four possible outcomes when interpreting confidence intervals of difference scores.
Type 1 = the CI includes zero; Type 2 = The CI does not include zero, but the CI is entirely
below the critical value; Type 3 = The CI is entirely above zero and includes the critical value;
Type 4 = The CI is entirely above the critical value.
In type 1, we would conclude that the difference between the comparison scores is not different
from zero, while we might conclude that the differences in types 2, 3, and 4 are all above zero;
we would not interpret this as a true difference. In type 2, we would conclude that while the
difference is greater than zero, it is entirely below the critical value; we would not interpret this
as a meaningful difference. In type 3, we could conclude that either (a) there is no meaningful
difference because a portion of the CI falls below the critical value or that (b) there is a
meaningful difference and cautiously interpret that difference. In the final condition, type 4, we

DIFFERENCE SCORE RELIABILITIES 11
would conclude that the difference is entirely above the critical value and interpretation is
warranted.
Difference Score Reliability to Date
The issue of poor difference score reliability in making clinical decisions is not a new
problem facing the field (e.g., Brown & Ryan, 2004; Charter, 2001, 2002; Charter & Feldt, 2009;
Glass et al., 2010; Glass, Ryan, Charter, & Bartels, 2009; Ryan & Brown, 2005). Difference
score reliability coefficients were calculated for subtest and composite comparisons available
from the Wechsler Adult Intelligence Scales, Third Edition (WAIS-III; Wechsler, 1997a) across
two studies (Brown & Ryan, 2004; Charter, 2001). Charter (2001) used data available from the
technical manual and found that only a small fraction (i.e., 12%) of potential subtest comparisons
had difference score reliability coefficients ≥ 0.80, with coefficients ranging between 0.44 and
0.85. The majority (i.e., 84%) of composite level comparisons (e.g., Verbal IQ > Performance IQ
across all ages) had difference score reliability coefficients ≥ 0.80, with coefficients ranging
between 0.77 and 0.88; however, none met the .90 criteria.
Brown and Ryan (2004) accessed a clinical sample of men from a substance abuse
disorders program and computed split-half reliability coefficients for difference scores stemming
from subtests and composites for the total sample. Brown and Ryan found similarly small
fraction (i.e., 13%) of potential subtest comparisons had difference score reliability coefficients ≥
0.80, with coefficients ranging between 0.34 and 0.85. Two of the four composite score
comparisons had difference score reliability coefficients ≥ 0.80, with coefficients ranging
between 0.79 and 0.87. These data were largely consistent with the data from the technical
manual (Charter, 2001).

DIFFERENCE SCORE RELIABILITIES 12
Similarly, Charter (2002) calculated difference score reliabilities for the Wechsler
Memory Scale, Third Edition (Wechsler, 1997b), using data available from the technical manual,
and found another small fraction (i.e., 18%) of composite score comparisons had difference score
reliability coefficients ≥ 0.80, with coefficients ranging between 0.00 and 0.87. Ryan and Brown
(2005) completed a similar analysis for the Wechsler Abbreviated Scales of Intelligence
(Wechsler, 1999) using data from the technical manual. Ryan and Brown found that nine of the
12 (75%) potential subtest comparisons and 21 of the 22 (95%) of potential composite
comparisons had difference score reliability coefficients ≥ 0.80. The subtest-level difference
score reliability coefficients ranged from 0.59 to 0.85, and the composite-level difference score
reliability coefficients ranged from 0.78 to 0.91. Despite this noticeable improvement in
reliability coefficients, only two potential composite comparisons met the 0.90 criteria for
clinical decision-making.
More recently, Glass and colleagues (Glass et al., 2010; Glass et al., 2009) computed
difference score reliability coefficients using the technical manuals for the Wechsler Intelligence
Scale for Children, Fourth Edition (Wechsler, 2003) and the Wechsler Adult Intelligence Scale,
Fourth Edition (WAIS-IV; Wechsler, 2008). Glass et al. (2010) found that 36% (i.e., 24 of the
66) of the potential WAIS-IV subtest comparisons and all 39 of the potential composite
comparisons had difference score reliability coefficients ≥ 0.80. Moreover, the VCI > PRI
comparison score reliability coefficient met the 0.90 criteria at four different age ranges, but
failed to do so across all ages. On the WISC-IV, however, only 8% (i.e., five of the 66) of the
potential subtest comparisons had difference score reliability coefficients ≥ 0.80, with scores
ranging between 0.50 and 0.82. Glass et al. (2009) found that 91% (i.e., 33 of the 36) potential
WISC-IV composite comparisons had difference score reliability coefficients ≥ 0.80; however,
DIFFERENCE SCORE RELIABILITIES 13
no composite or subtest comparison resulted in a reliability coefficient that met the 0.90 criteria
for clinical decision-making.
The research to date has shown that a majority of difference scores stemming from
composites had reliability coefficients ≥ 0.80, but very few met the 0.90 criteria. Those that did
meet the 0.90 criteria failed to meet it consistently across all age ranges. Difference scores
stemming from subtest comparisons frequently had reliability coefficients below the 0.80
criteria, and never met the 0.90 criteria for any age range. However, difference score reliability
analyses have not been conducted for the recent editions of popular intelligence tests
(e.g.,Wechsler, 2014a), and the research has extensively assessed instruments from the Wechsler
series. The purpose of this manuscript is to extend previous research by computing difference
score reliabilities for available scores on the WISC-V (Wechsler, 2014a) and to extend this
analysis to another popular test, the Reynolds Intellectual Assessment Scale, Second Edition
(RIAS-2; Reynolds & Kamphaus, 2015a). Additionally, emphasis will be placed on those
difference scores that are specifically indicated for interpretation by test manuals and protocols.
Methods
All analyses are based on archival data obtained from the supporting materials of the
RIAS-2 (Reynolds & Kamphaus, 2015a) and the WISC-V (Wechsler, 2014c; Wechsler, Raiford,
& Holdnack, 2014a, 2014b). The formula for difference score reliability (see R. L. Thorndike &
Hagen, 1969) requires a reliability estimate of each of the scores to be compared as well as the
correlation between those two scores. All test score reliabilities and intercorrelations were
double-coded by the author and a research assistant. The agreement found for all coded variables
was 99%, and disagreements were corrected by retrieving data from the respective test manual
until 100% agreement was established. Reliabilities were computed across all available age-

DIFFERENCE SCORE RELIABILITIES 14
ranges. Internal review board approval to code and analyze the archival data was obtained from
the first author’s university. No data were excluded and all analyses and measures are reported.
Measures
The RIAS-2 (Reynolds & Kamphaus, 2015a) is an intelligence test consisting of eight
subtests. The standardization sample included 2,154 individuals across ages 3 to 94; the sample
was stratified based upon the 2012 United States Census. For the RIAS-2 (Reynolds &
Kamphaus, 2015a), the internal consistency reliabilities are Cronbach’s (1951) coefficient alpha
calculated based on the standardization sample, and were retrieved from the RIAS-2 (Reynolds
& Kamphaus, 2015a) manual tables 5.1 and 5.2; intercorrelations were retrieved from tables N.1
through N.5. The following RIAS-2 subtests were included in the analysis: Guess What (GWH),
Verbal Reasoning (VRZ), Odd-Item Out (OIO), Verbal Memory (VRM), Nonverbal Memory
(VRM), Speeded Naming Task (SNT), and Speeded Picture Search (SPS); subtest reliability
coefficients ranged between 0.80 and 0.99 across all age ranges. The following RIAS-2
composites were included: Verbal Intelligence Index (VIX), Nonverbal Intelligence Index (NIX),
Composite Memory Index (CMX), Speeded Processing Index (SPI), and Composite Intelligence
Index (CIX). Composite reliability coefficients ranged between 0.86 and 0.97. The RIAS-2
(Reynolds & Kamphaus, 2015a) reports subtest and composite reliability according to nine
distinct age-ranges (see Supplemental Table 1) and reports subtest and composite
intercorrelations according to four age-ranges (i.e., 3 to 5, 6 to 17, 18 to 30, and 31 to 94). As a
result, some age-ranges have differing boundaries (i.e., at age-ranges 3 to 6, 15 to 18, and 25 to
34). When overlap occurred between age-ranges, reliabilities were calculated using both
available intercorrelations and reported as a range. Difference score reliability coefficients were
calculated for the total standardization sample and at each age-range.

DIFFERENCE SCORE RELIABILITIES 15
The WISC-V (Wechsler, 2014a) is an intelligence test consisting of 16 subtests. The
standardization sample included 2,200 children between the ages of 6 and 16 years; the sample
was stratified based upon the 2012 United States Census. For the WISC-V (Wechsler, 2014a),
the internal consistency reliabilities are split-half coefficients calculated based on the
standardization sample, and were retrieved from the WISC-V Technical and Interpretive Manual
(Wechsler et al., 2014a), table 4.1; intercorrelations were retrieved from the WISC-V Technical
and Interpretive Manual Supplement (Wechsler et al., 2014b), tables G.1 through G.21. Primary
subtests—that is, the core 16 subtests necessary for calculating the Full Scale IQ (FSIQ), primary
second-order composites (e.g. Verbal Comprehension Index), and pseudo-composites—were
included in the analysis. Process scores—those scores, such as Block Design No Time Bonus,
that can be calculated from portions of subtests—and non-primary subtests, such as Naming
Speed Literacy, Naming Speed Quantity, Immediate Symbol Translation, Delayed Symbol
Translation, and Recognition Symbol Translation were not included in the analysis. Similarly,
the second-order and pseudo-composites were included while Naming Speed, Symbol
Translation, and Storage and Retrieval composites were excluded. The following WISC-V
subtests were included in the analysis: Similarities (SI), Vocabulary (VO), Information (IN),
Comprehension (CO), Block Design (BD), Visual Puzzles (VP), Matrix Reasoning (MR), Figure
weights (FW), Picture Completion (PC), Arithmetic (AR), Digit Span (DS), Picture Span (PS),
Letter Number Sequences (LN), Coding (CD), Symbol Search (SS), and Cancellation (CA);
subtest reliability coefficients ranged between .67 to .96. The following WISC-V composites
were included in the analysis: Verbal Comprehension Index (VCI), Visual Spatial Index (VSI),
Fluid Reasoning Index (FRI), Working Memory Index (WMI), Processing Speed Index (PSI),
Quantitative Reasoning Index (QRI), Auditory Working Memory Index (AWMI), Nonverbal
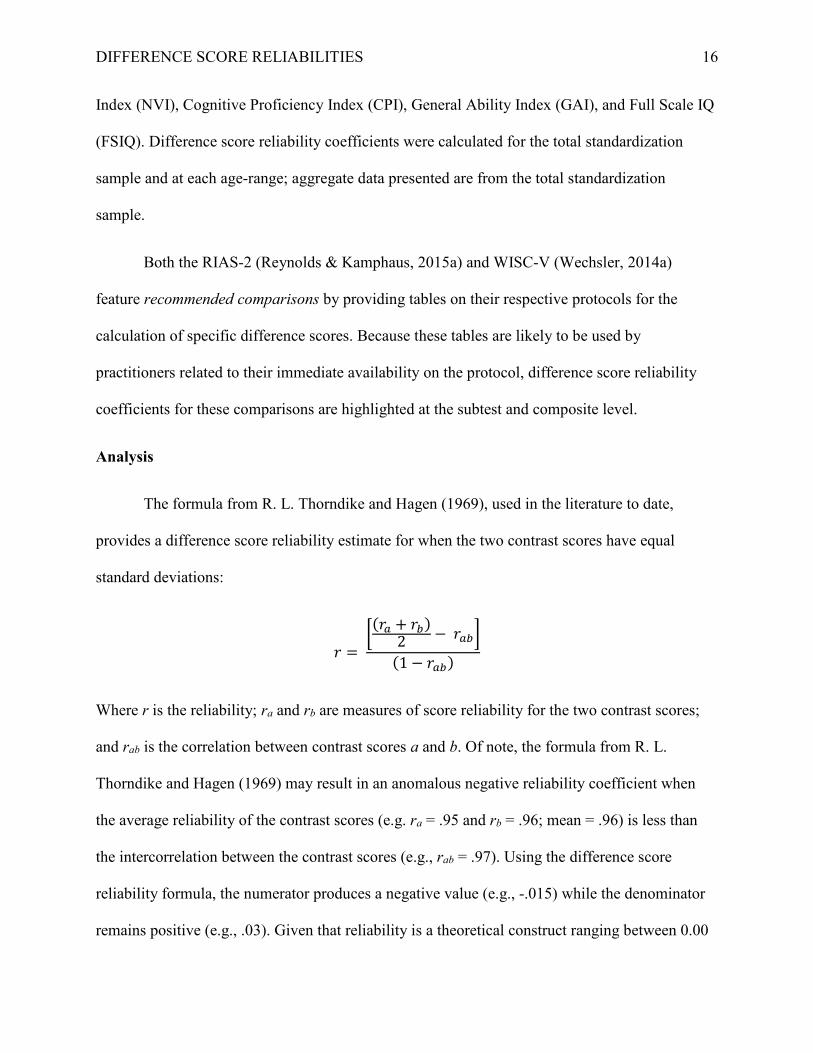
DIFFERENCE SCORE RELIABILITIES 16
Index (NVI), Cognitive Proficiency Index (CPI), General Ability Index (GAI), and Full Scale IQ
(FSIQ). Difference score reliability coefficients were calculated for the total standardization
sample and at each age-range; aggregate data presented are from the total standardization
sample.
Both the RIAS-2 (Reynolds & Kamphaus, 2015a) and WISC-V (Wechsler, 2014a)
feature recommended comparisons by providing tables on their respective protocols for the
calculation of specific difference scores. Because these tables are likely to be used by
practitioners related to their immediate availability on the protocol, difference score reliability
coefficients for these comparisons are highlighted at the subtest and composite level.
Analysis
The formula from R. L. Thorndike and Hagen (1969), used in the literature to date,
provides a difference score reliability estimate for when the two contrast scores have equal
standard deviations:
𝑟𝑟 = �(𝑟𝑟𝑎𝑎 + 𝑟𝑟𝑏𝑏)
2 − 𝑟𝑟𝑎𝑎𝑏𝑏�
(1 − 𝑟𝑟𝑎𝑎𝑏𝑏)
Where r is the reliability; ra and rb are measures of score reliability for the two contrast scores;
and rab is the correlation between contrast scores a and b. Of note, the formula from R. L.
Thorndike and Hagen (1969) may result in an anomalous negative reliability coefficient when
the average reliability of the contrast scores (e.g. ra = .95 and rb = .96; mean = .96) is less than
the intercorrelation between the contrast scores (e.g., rab = .97). Using the difference score
reliability formula, the numerator produces a negative value (e.g., -.015) while the denominator
remains positive (e.g., .03). Given that reliability is a theoretical construct ranging between 0.00

DIFFERENCE SCORE RELIABILITIES 17
and 1.00, all such computed reliability coefficients were recorded as 0.00. In addition to
calculating the reliability of each difference score, the CI width of each type of difference score
was calculated using the formula from Schneider (2014):
𝐶𝐶𝐶𝐶 𝑊𝑊𝑊𝑊𝑊𝑊𝑊𝑊ℎ = 2𝑧𝑧𝐶𝐶𝐶𝐶%𝜎𝜎𝑥𝑥�𝑟𝑟𝑥𝑥𝑥𝑥 − 𝑟𝑟𝑥𝑥𝑥𝑥2
where zCI% is the z-score associated with the desired confidence level (e.g., the zCI% for 95% CI is
1.96), σx is the standard deviation of the observed score, and rxx is the reliability of the difference
score. In order to better understand the practical impact of the reliabilities obtained, we
calculated the 95% CI widths of the average RIAS-2 and WISC-V (a) subtest difference score,
(b) recommended subtest difference score, (c) composite difference score, and (d) recommended
composite difference score. However, because neither the RIAS-2 (Reynolds & Kamphaus,
2015a) nor the WISC-V (Wechsler, 2014a) test authors provide psychometric properties for
these score types and we do not have standardization data to perform these calculations, we are
uncertain of the standard deviations that should be used in the formula. To compensate with this,
we provide 95% CI widths at standard deviations of 3, 10, and 15 to reflect the standard
deviations from which these scores are derived.
Results
Subtest-Level Comparisons
Subtest difference score reliability coefficients for the RIAS-2 (Reynolds & Kamphaus,
2015a) subtest difference scores are displayed in Table 2. The RIAS-2 subtest difference score
reliability coefficients ranged between 0.59 and 0.99 (median = 0.85; mean = 0.81; SD = 0.10),
with the GWH > VRZ comparison at the low-end and SNT > SPS comparison at the high-end of
the range. Of the 28 potential comparisons, 15 had reliability coefficients between 0.80 and 0.90,

DIFFERENCE SCORE RELIABILITIES 18
and three had reliability coefficients of 0.90 or higher. Only three comparisons, VRM > SNT,
VRM > SPS, and SNT > SPS, met the 0.90 criteria for all age-ranges while 10 comparisons met
the 0.80 criteria for all age-ranges. Fifteen comparisons did not meet the 0.80 criteria.
Subtest difference score reliability coefficients for the WISC-V (Wechsler, 2014a)
subtest difference scores are displayed in Table 3. The WISC-V subtest difference score
reliability coefficients ranged between 0.53 and .87 (median = 0.77; mean = 0.77; SD = .06),
with the VC > IN comparison at the low-end and FW > CA at the high-end of the range. Of the
120 potential comparisons, 32 had reliability coefficients between 0.80 and 0.90, and none had
reliability coefficients of 0.90 or higher. Only five met the 0.80 criteria for all-age ranges, while
the remaining 115 comparisons did not meet the 0.80 criteria for all age-ranges.
Recommended Comparisons. The RIAS-2 (Reynolds & Kamphaus, 2015a) protocol
provides space for calculating four subtest comparisons: (1) GWH > VRZ, (2) OIO > WHM, (3)
VRM > NVM, and (4) SNT > SPS. Reliability coefficients for these data ranged between 0.59
and 0.99 (median = 0.76; mean = 0.78; SD = 0.18) and are displayed in boldface in Table 2. Of
these four recommended comparisons, only VRM > NVM and SNT > SPS met the 0.80 criteria
for the total sample, and only SNT > SPS met the 0.90 reliability criteria at each age-range.
The WISC-V (Wechsler, 2014a) protocol provides space for calculating eight subtest-to-
subtest comparisons: (1) SI > VC, (2) BD > VP, (3) MR > FW, (4) DS > PS, (5) CD > SS, (6)
FW > AR, (7) DS > LN, and (8) CA > SS. Reliability coefficients for these data ranged between
0.56 and 0.84 (median = 0.70; mean = 0.70; SD = 0.10) are displayed in boldface in Table 3. Of
these eight recommended comparisons, only MR > FW and FW > AR met the 0.80 criteria for
the total sample; no recommended comparisons met the 0.90 or 0.80 criteria at each age-range.

DIFFERENCE SCORE RELIABILITIES 19
Composite-Level Comparisons
Composite score reliabilities for the RIAS-2 (Reynolds & Kamphaus, 2015a) are
displayed in Table 4. The RIAS-2 composite difference score reliability coefficients ranged
between 0.23 and 0.95 (median = 0.80; mean = 0.75, SD = 0.26), with the NIX > CIX
comparison at the low-end and the CIX > SPI comparison at the high-end of the range. Of the 10
potential comparisons, one had a reliability coefficient between 0.80 and 0.90, and four had
reliability coefficients of 0.90 or higher.
Composite score reliabilities for the WISC-V (Wechsler, 2014a) are displayed in Table 5.
The WISC-V composite difference score reliability coefficients ranged between 0.00 and 0.87
(median = 0.81, mean = 0.75, SD = 0.16), with the FSIQ > GAI comparison at the low-end and
the PSI > QRI comparison at the high-end of the range. Of the 55 potential comparisons, 31 had
reliability coefficients between 0.80 and 0.90, and none had a reliability coefficient of 0.90 or
higher. Seventeen met the 0.80 criteria at all age-ranges.
Recommended Comparisons. The RIAS-2 (Reynolds & Kamphaus, 2015a) protocol
provides space for calculating eight composite comparisons: (1) VIX > NIX, (2) VIX > CMX,
(3) VIX > SPI, (4) NIX > CMX, (5) NIX > SPI, (6) CMX > SPI, (7) CIX > CMX, and (8) CIX >
SPI. Reliability coefficients for these data ranged between 0.79 and 0.95 (median = 0.86; mean =
0.86; SD = 0.08) and are displayed in boldface in Table 4. Of the eight recommended
comparisons, one met only the 0.80 criteria while four had a reliability coefficient of 0.90 or
higher. All four that met the 0.90 criteria did so at all age-ranges. Of interest, only those
comparisons that included the SPI met the 0.90 criteria.

DIFFERENCE SCORE RELIABILITIES 20
The WISC-V (Wechsler, 2014a) protocol provides space for calculating 13 composite
comparisons: (1) GAI > FSIQ, (2) GAI > CPI, (3) WMI > AWMI, (4) VCI > VSI, (5) VCI >
FRI, (6) VCI > WMI, (7) VCI > PSI, (8) VSI > FRI, (9) VSI > WMI, (10) VSI > PSI, (11) FRI >
WMI, (12) FRI > PSI, (13) WMI > PSI. Reliability coefficients for these data ranged between
0.00 and 0.86 including the FSIQ and GAI comparison, and 0.80 and 0.86 (median = 0.84; mean
= 0.83; SD = 0.012); these data are displayed in boldface in Table 5. Of these 13 comparisons,
11 meet the 0.80 criteria while none meet the 0.90 criteria. Of those 11, only six (54%) meet the
0.80 criteria at all age-ranges.
95% CI Widths
The 95% CI widths for the average difference score by type are provided in table 6.
When the standard deviation of the difference scores was held at 3, CI widths ranged between
4.08 to 5.39 (median = 4.91; SD = 0.42). The average CI widths for WISC-V subtests, which are
scaled scores, were 4.95 overall and 5.39 for recommended subtest comparisons. When the
standard deviation of the scores was held at 10, CI widths ranged between 13.60 and 17.96
(median = 16.37; SD = 2.11). The average CI widths for RIAS-2 subtests, which are T scores,
were 15.38 overall and 16.24 for recommended subtest comparisons. Finally, when the standard
deviation of the difference scores was held at 15, CI widths ranged between 20.40 and 26.95
(median = 24.55, SD = 2.11). The average CI widths for the RIAS-2 composites were 25.46
overall and 20.40 for recommended composite comparisons. Moreover, the average CI widths
for the WISC-V composites were 25.46 overall and 22.09 for recommended composite
comparisons.
Discussion

DIFFERENCE SCORE RELIABILITIES 21
Guidelines regarding the clinical interpretation of psychological instruments have
emphasized the need for measures to first be reliable, then valid and useful (APA, 2010; Beidas
et al., 2015; Hunsley & Mash, 2018; NASP, 2010). While there is no standard for minimum
reliability, we contend that when making high-stakes decisions (e.g., educational placement),
only data with excellent reliability (i.e., r ≥ 0.90) are appropriate. The reason for this is that
systematic and random error do not carry useful information, and thus measurement errors
should be minimized as much as possible (cf. signal detection theory; see McFall & Treat, 1999)
when those data contribute to decisions that have long-term impact on the lives of children.
Difference scores available from prominent intelligence tests are often used during the decision-
making process often function as a sign of disorder or guide the interpretation of test scores used
in educational classification and diagnosis. Despite authors’ providing guidance on how
difference scores might be interpreted and their use on test protocols (e.g., Reynolds &
Kamphaus, 2015a; Wechsler et al., 2014a), test authors typically do not publish psychometric
data, such as reliability estimates, of difference scores. That said, results of previous research
have largely found that difference scores have lower reliability than desired for high-stakes
decision making (Brown & Ryan, 2004; Charter, 2001; Charter, 2002; Glass et al., 2010; Glass,
Charter, Ryan, & Bartels, 2009; Ryan & Brown, 2005).
At the subtest level, data from this analysis of the WISC-V and RIAS-2 were largely
consistent with recommendations that subtest-level analysis be avoided in practice. Only one of
the recommended comparisons—SNT > SPS from the RIAS-2—from either test met guidelines
for clinical interpretation across all age ranges. At the composite level, only four of the
recommended comparisons—all from the RIAS-2—available from either test met guidelines for
clinical interpretation across all age ranges. Despite these few exceptions, the findings from this
DIFFERENCE SCORE RELIABILITIES 22
analysis are generally consistent with the prior literature on the reliability of discrepancy scores.
As such, practitioners would need to be cautious when using intra-cognitive difference scores.
When reviewing the CI widths of difference scores, as noted in all cases, the CI width was larger
than the standard deviation used in the formula.
Given the average CI width and the rules offered by Charter (1999) and Charter and Feldt
(2009), the findings from this analysis support the view that high-stakes clinical decisions,
including diagnostic or educational classification determinations, should not typically be
informed by difference scores (Canivez, 2013; McGill, Styck, Palomares, & Hass, 2016).
Moreover, subtest and composite discrepancies are not always adequately reliable, and further
support research that indicates that convergence between component parts is an unnecessary
criterion for interpreting composite scores (Canivez, 2013; McGill, 2016; Schneider & Roman,
2018). At best, clinicians would need to engage in cautious use of composite-level difference
scores and forgo the interpretation of subtest-level difference scores for clinical decision-making.
Finally, the contention that difference scores may be useful in the context of other data (e.g.,
Sattler, 2018) has not been empirically substantiated, and the reliability of such scores may
render them nondiagnostic. Thus, using difference scores may result in a dilution effect in which
diagnostic data are given less weight (Nisbett, Zukier, & Lemley, 1981).
Limitations & Future Research
This analysis of the WISC-V (Wechsler, 2014a) and RIAS-2 (Reynolds & Kamphaus,
2015a) uses established procedures to evaluate reliability coefficients of difference scores.
However, the study is not without limitations. This study does not seek to investigate the
reliability of profiles of score differences as often used in more nuanced cognitive profile
analysis, though the stability of profiles has been investigated by others (e.g., Livingston,

DIFFERENCE SCORE RELIABILITIES 23
Jennings, Reynolds, & Gray, 2003). Additionally, while this study may speak to the whether
individual difference scores are tenable, the reliability of composites generated through the
aggregation of multiple instruments was not investigated (e.g., Flanagan, Ortiz, & Alfonso,
2015). As difference scores are generated between composites stemming from score from
multiple instruments (Benson et al., 2019; Flanagan et al., 2013; John H Kranzler, Benson, &
Floyd, 2016). Finally, it is highly unlikely that the actual reliability of the FSIQ-to-GAI
difference score was 0.00, and theoretically untenable that they were < 0.00; these estimates
should be considered lower-bound reliability coefficients. This is generally true for all
computations in this analysis.
Conclusion
As school psychologists, bringing data to the multidisciplinary team and advocating for
their needs is an essential part of the profession. When that data is unreliable, there is a higher
risk for data to suggest a false positive or false negative, potentially misinforming IEP teams
during the decision making process. Due to inconsistencies across age ranges and across tests,
the necessity to individually calculate the confidence interval of each difference score (Charter,
1999; Charter & Feldt, 2009), and the poor diagnostic and treatment utility offered by profile
analysis methods in general (Canivez, 2013; John H Kranzler, Floyd, Benson, Zaboski, &
Thibodaux, 2016; McGill, 2018; McGill et al., 2018; McGill et al., 2016; Miciak, Fletcher,
Stuebing, Vaughn, & Tolar, 2014; Watkins, 2003), clinicians will likely make more reliable
clinical decisions if they avoid the use of difference scores. That said, difference scores, when
used, should be interpreted with caution and only under the circumstances prescribed by Charter
and colleagues (1999; 2009). Finally, given the questionable reliability of these methods, school

DIFFERENCE SCORE RELIABILITIES 24
psychology faculty should reevaluate whether teaching graduate students these interpretive
strategies is consistent with evidence-based assessment practices.
References
Aiken, L. R., & Groth-Marnat, G. (2005). Psychological testing and assessment (12 ed.).
Needham Heights, M.A.: Allyn & Bacon.
American Educational Research Association, American Psychological Association, & National
Council on Measurement in Education. (2014). Standards for educational and
psychological testing. Washington, D. C.: American Educational Research Association.
American Psychological Association. (2010). Ethical principles of psychologists and code of
conduct. Retrieved from https://www.apa.org/ethics/code/.
Beidas, R. S., Stewart, R. E., Walsh, L., Lucas, S., Downey, M. M., Jackson, K., . . . Mandell, D.
S. (2015). Free, brief, and validated: Standardized instruments for low-resource mental
health settings. Cognitive and Behavioral Practice, 22(1), 5-19.
https://doi.org/10.1016/j.cbpra.2014.02.002
Benson, N. F., Maki, K. E., Floyd, R. G., Eckert, T. L., Kranzler, J. H., & Fefer, S. A. (2019). A
national survey of school psychologists' practices in identifying specific learning
disabilities. School psychology (Washington, DC). https://doi.org/10.1037/spq0000344
Bray, M. A., Kehle, T. J., & Hintze, J. M. (1998). Profile analysis with the Wechsler Scales:
Why does it persist? School Psychology International, 19(3), 209-220.
https://doi.org/10.1177/0143034398193002

DIFFERENCE SCORE RELIABILITIES 25
Brown, K. I., & Ryan, J. J. (2004). Reliabilities of the WAIS–III for Discrepancy Scores:
Generalization to a Clinical Sample. Psychological reports, 95(3), 914-916.
https://doi.org/10.2466/pr0.95.3.914-916
Canivez, G. L. (2013). Psychometric versus actuarial interpretation of intelligence and related
aptitude batteries. In D. H. Saklofske, C. R. Reynolds, & V. L. Schwean (Eds.), The
Oxford handbook of child psychological assessment (pp. 84-112). New York, NY:
Oxford University Press. https://doi.org/10.1093/oxfordhb/9780199796304.013.0004
Carroll, J. B. (1993). Human cognitive abilities: A survey of factor-analytic studies: Cambridge:
Cambridge University Press. https://doi.org/10.1017/CBO9780511571312
Charter, R. A. (1999). Testing for true score differences using the confidence interval method.
Psychological Reports, 85(3), 808-808. https://doi.org/10.2466/pr0.1999.85.3.808
Charter, R. A. (2001). Discrepancy Scores of Reliabilities of the WAIS–III. Psychological
reports, 89(2), 453-456. https://doi.org/10.2466/pr0.2001.89.2.453
Charter, R. A. (2002). Reliability of the WMS–III Discrepancy Comparisons. Perceptual and
motor skills, 94(2), 387-390. https://doi.org/10.2466/pms.2002.94.2.387
Charter, R. A., & Feldt, L. S. (2009). A comprehensive approach to the interpretation of
difference scores. Applied neuropsychology, 16(1), 23-30.
https://doi.org/10.1080/09084280802644110
Cronbach, L. J. (1947). Test “reliability”: Its meaning and determination. Psychometrika, 12(1),
1-16. https://doi.org/10.1007/BF02289289
Cronbach, L. J. (1951). Coefficient alpha and the internal structure of tests. psychometrika,
16(3), 297-334. https://doi.org/10.1007/BF02310555

DIFFERENCE SCORE RELIABILITIES 26
Dombrowski, S. C. (2015). Psychoeducational Assessment and Report Writing. New York, NY:
Springer. https://doi.org/10.1007/978-1-4939-1911-6
Fiorello, C. A., Flanagan, D. P., & Hale, J. B. (2014). The Utility of the Pattern of Strengths and
Weaknesses Approach. Learning Disabilties, 20. https://doi.org/10.18666/LDMJ-2014-
V20-I1-5154
Fiorello, C. A., Hale, J. B., Holdnack, J. A., Kavanagh, J. A., Terrell, J., & Long, L. (2007).
Interpreting Intelligence Test Results for Children with Disabilities: Is Global
Intelligence Relevant? Applied Neuropsychology, 14(1), 2-12.
doi:10.1080/09084280701280338
Flanagan, D. P., & Alfonso, V. C. (2017). Essentials of WISC-V assessment. Hoboken, N.J.: John
Wiley & Sons.
Flanagan, D. P., & Ortiz, S. O. (2001). Essentials of cross-battery assessment. New York: John
Wiley & Sons.
Flanagan, D. P., Ortiz, S. O., & Alfonso, V. C. (2013). Essentials of cross-battery assessment
Hoboken, N.J.: John Wiley & Sons.
Flanagan, D. P., Ortiz, S. O., & Alfonso, V. C. (2015). Cross-Battery Assessment Software
System (X-BASS). Hoboken, NJ: John Wiley & Sons.
Glass, L. A., Ryan, J. J., & Charter, R. A. (2010). Discrepancy score reliabilities in the WAIS-IV
standardization sample. Journal of Psychoeducational Assessment, 28(3), 201-208.
https://doi.org/10.1177/0734282909346710
Glass, L. A., Ryan, J. J., Charter, R. A., & Bartels, J. M. (2009). Discrepancy score reliabilities
in the WISC-IV standardization sample. Journal of Psychoeducational Assessment,
27(2), 138-144. https://doi.org/10.1177/0734282908325158

DIFFERENCE SCORE RELIABILITIES 27
Hunsley, J., & Mash, E. J. (2018). A guide to assessments that work (2 ed.). Oxford University
Press. https://doi.org/10.1093/med-psych/9780190492243.001.0001
Kaufman, A. S. (1979). Intelligent testing with the WISC-R. New York: Wiley.
Kaufman, A. S., Raiford, S. E., & Coalson, D. L. (2015). Intelligent testing with the WISC-V.
Hoboken, N.J.: John Wiley & Sons.
Kranzler, J. H., Benson, N., & Floyd, R. G. (2016). Intellectual assessment of children and youth
in the United States of America: Past, present, and future. International Journal of School
& Educational Psychology, 4(4), 276-282.
https://doi.org/10.1080/21683603.2016.1166759
Kranzler, J. H., & Floyd, R. G. (2013). Assessing intelligence in children and adolescents: A
practical guide. New York: Guilford Press.
Kranzler, J. H., Floyd, R. G., Benson, N., Zaboski, B., & Thibodaux, L. (2016). Cross-Battery
Assessment pattern of strengths and weaknesses approach to the identification of specific
learning disorders: Evidence-based practice or pseudoscience? International Journal of
School & Educational Psychology, 4(3), 146-157.
Kranzler, J. H., Maki, K. E., Benson, N. F., Eckert, T. L., Floyd, R. G., & Fefer, S. A. (2020).
How do school psychologists interpret intelligence tests for the identification of specific
learning disabilities? Contemporary School Psychology. https://doi.org/10.1007/s40688-
020-00274-0
Lilienfeld, S. O., Wood, J. M., & Garb, H. N. (2006). Why questionable psychological tests
remain popular. The Scientific Review of Alternative Medicine, 10, 6-15.
Livingston, R. B., Jennings, E., Reynolds, C. R., & Gray, R. M. (2003). Multivariate analyses of
the profile stability of intelligence tests: High for IQs, low to very low for subtest

DIFFERENCE SCORE RELIABILITIES 28
analyses. Archives of Clinical Neuropsychology, 18(5), 487-507.
https://doi.org/10.1016/S0887-6177(02)00147-6
Lockwood, A. B., & Farmer, R. L. (2019). The cognitive assessment course: Two decades later.
Psychology in the Schools, 57, 265-283. https://doi.org/10.1002/pits.22298
Macmann, G. M., & Barnett, D. W. (1997). Myth of the master detective: Reliability of
interpretations for Kaufman's" intelligent testing" approach to the WISC–III. School
Psychology Quarterly, 12(3), 197. https://doi.org/10.1037/h0088959
McDermott, P. A., Fantuzzo, J. W., & Glutting, J. J. (1990). Just say no to subtest analysis: A
critique on Wechsler theory and practice. Journal of Psychoeducational Assessment, 8(3),
290-302. https://doi.org/10.1177/073428299000800307
McDermott, P. A., Fantuzzo, J. W., Glutting, J. J., Watkins, M. W., & Baggaley, A. R. (1992).
Illusions of meaning in the ipsative assessment of children's ability. The Journal of
Special Education, 25(4), 504-526. https://doi.org/10.1177/002246699202500407
McFall, R. M., & Treat, T. A. (1999). Quantifying the information value of clinical assessments
with signal detection theory. Annual review of psychology, 50(1), 215-241.
https://doi.org/10.1146/annurev.psych.50.1.215
McGill, R. J. (2016). Invalidating the full scale IQ score in the presence of significant factor
score variability: clinical acumen or clinical illusion. Archives of Assessment Psychology,
6(1), 49-79.
McGill, R. J. (2018). Confronting the base rate problem: more ups and downs for cognitive
scatter analysis. Contemporary School Psychology, 22(3), 384-393.
https://doi.org/10.1007/s40688-017-0168-4

DIFFERENCE SCORE RELIABILITIES 29
McGill, R. J., Dombrowski, S. C., & Canivez, G. L. (2018). Cognitive profile analysis in school
psychology: History, issues, and continued concerns. Journal of school psychology, 71,
108-121. https://doi.org/10.1016/j.jsp.2018.10.007
McGill, R. J., Styck, K. M., Palomares, R. S., & Hass, M. R. (2016). Critical issues in specific
learning disability identification: What we need to know about the PSW model. Learning
Disability Quarterly, 39(3), 159-170. https://doi.org/10.1177/0731948715618504
McGrew, K. S., & Knopik, S. N. (1996). The relationship between intra-cognitive scatter on the
Woodcock-Johnson Psycho-Educational Battery-Revised and school achievement.
Journal of School Psychology, 34(4), 351-364. https://doi.org/10.1016/S0022-
4405(96)00021-0
Miciak, J., Fletcher, J. M., Stuebing, K. K., Vaughn, S., & Tolar, T. D. (2014). Patterns of
cognitive strengths and weaknesses: Identification rates, agreement, and validity for
learning disabilities identification. School Psychology Quarterly, 29(1), 21.
https://doi.org/10.1037/spq0000037
Naglieri, J., & Feifer, S. (2018). Pattern of strengths and weaknesses made easy: The discrepancy
consistency method. Essentials of specific learning disability identification, 431-474.
National Association of School Psychologists. (2010). Principles for professional ethics.
Retrieved from https://www.nasponline.org/standards-and-certification/professional-
ethics.
Nisbett, R. E., Zukier, H., & Lemley, R. E. (1981). The dilution effect: Nondiagnostic
information weakens the implications of diagnostic information. Cognitive Psychology,
13, 248-277.

DIFFERENCE SCORE RELIABILITIES 30
Nunnally, J. C., & Bernstein, L. H. (1994). Psychometric theory (3rd ed.). New York: McGraw-
Hill.
Price, L. R. (2016). Psychometric methods: Theory into practice. New York, NY: Guilford
Publishing.
Reynolds, C. R., & Kamphaus, R. W. (2015a). Reynolds intellectual assessment scales (2nd ed.).
Lutz, FL: PAR.
Reynolds, C. R., & Kamphaus, R. W. (2015b). Reynolds Intellectual Assessment Scales, Second
Edition: Professional manual. Lutz, FL: PAR.
Ryan, J. J., & Brown, K. I. (2005). Enhancing the clinical utility of the WASI: Reliabilities of
discrepancy scores and supplemental tables for profile analysis. Journal of
Psychoeducational Assessment, 23(2), 140-145.
https://doi.org/10.1177/073428290502300203
Sattler, J. M. (2018). Assessment of children: Cognitive foundations and applications (6 ed.). La
Mesa, CA: Sattler Publishing.
Schneider, W. J. (2014). Reliability coefficients are for squares. Confidence interval widths tell it
to you straight. Retrieved from
https://assessingpsyche.wordpress.com/2014/01/16/reliability-is-for-squares/
Schneider, W. J., & Roman, Z. (2018). Fine-Tuning Cross-Battery Assessment Procedures: After
Follow-Up Testing, Use All Valid Scores, Cohesive or Not. Journal of
Psychoeducational Assessment, 36(1), 34-54. https://doi.org/10.1177/0734282917722861
Sotelo‐Dynega, M., & Dixon, S. G. (2014). Cognitive assessment practices: A survey of school
psychologists. Psychology in the Schools, 51(10), 1031-1045.
https://doi.org/10.1002/pits.21802
DIFFERENCE SCORE RELIABILITIES 31
Styck, K. M., Beaujean, A. A., & Watkins, M. W. (2019). Profile reliability of cognitive ability
subscores in a referred sample. Archives of Scientific Psychology, 7, 119-128.
https://doi.org/10.1037/arc0000064
Thorndike, R. L., & Hagen, E. (1969). Measurement and evaluation in psychology and education
(3 ed.). New York: Wiley.
Thorndike, R. M., & Thorndike-Christ, T. M. (2010). Measurement and evaluation in
psychology and education (8 ed.). Boston, MA: Pearson.
Watkins, M. W. (2000). Cognitive profile analysis: A shared professional myth. School
Psychology Quarterly, 15, 465-479. https://doi.org/10.1037/h0088802
Watkins, M. W. (2003). IQ subtest analysis: Clinical acumen or clinical illusion? The Scientific
Review of Mental Health Practice: Objective Investigations of Controversial and
Unorthodox Claims in Clinical Psychology, Psychiatry, and Social Work.
Wechsler, D. (1997a). Wechsler Adult Intelligence Scales, Third Edition administration and
scoring manual. San Antonio, TX: The Psychological Corporation.
Wechsler, D. (1997b). Wechsler memory scale, third edition. . San Antonio, TX: The
Psychological Corporation.
Wechsler, D. (1999). Wechsler abbreviated scale of intelligence. San Antonio, TX: The
Psychological Corporation. https://doi.org/10.1037/t15170-000
Wechsler, D. (2003). Wechsler intelligence scale for children–Fourth Edition (WISC-IV). San
Antonio, TX: The Psychological Corporation. https://doi.org/10.1037/t15174-000
Wechsler, D. (2008). Wechsler adult intelligence scale–Fourth Edition (WAIS–IV). San Antonio,
TX: NCS Pearson, https://doi.org/10.1037/t15169-000

DIFFERENCE SCORE RELIABILITIES 32
Wechsler, D. (2014a). Wechsler intelligence scale for children–Fifth Edition (WISC-V).
Bloomington, MN: Pearson.
Wechsler, D. (2014b). WISC-V administration and scoring manual. Bloomington, MN: Pearson.
Wechsler, D. (2014c). WISC-V administration and scoring manual supplement. Bloomington,
MN: Pearson.
Wechsler, D., Raiford, S. E., & Holdnack, J. A. (2014a). WISC-V technical and interpretive
manual. Bloomington, MN: Pearson.
Wechsler, D., Raiford, S. E., & Holdnack, J. A. (2014b). WISC-V technical and interpretive
manual supplement: Special group validity studies with other measure and additional
tables. . Retrieved from http://downloads.pearsonclinical.com/images/Assets/WISC-
V/WISC-V-Tech-Manual-Supplement.pdf.

Table 1.
Hunsley and Mash’s Tripartite Model for ICR Reliability
Rating Reliability Criteria 95% CI Width with SD = 15
Adequate 0.70 to 0.79 32.21 to 26.95
Good 0.80 to 0.89 26.30 to 19.50
Excellent ≥ 0.90 ≤ 18.59
Criteria adapted from J. Hunsley & E. J. Mash (2019). CI Width = confidence interval
width; SD = standard deviation.

Table 2. RIAS-2 Subtest Discrepancy Score Reliabilities
Subtest 1 2 3 4 5 6 7 1. Guess What 2. Verbal Reasoning 0.59 3. Odd-Item Out 0.69 0.69 4. What's Missing 0.70 0.74 0.68 5. Verbal Memory 0.85 0.81 0.83 0.87 6. Nonverbal Memory 0.74 0.76 0.65 0.67 0.84 7. Speeded Naming Task 0.89 0.89 0.87 0.88 0.96 0.86 8. Speeded Picture Search 0.89 0.87 0.84 0.88 0.96 0.87 0.99 Note. Comparisons that can be calculated directly via the test record are shown in boldface.

Table 3. WISC-V Subtest Discrepancy Score Reliabilities
Subtest 1 2 3 4 5 6 7 8 9 10 11 12 13 14 15 1. Similarities 2. Vocabulary 0.59 3. Information 0.61 0.53 4. Comprehension 0.63 0.63 0.65 5. Block Design 0.73 0.73 0.72 0.73 6. Visual Puzzles 0.77 0.76 0.76 0.77 0.66 7. Matrix Reasoning 0.76 0.76 0.75 0.75 0.73 0.77 8. Figure Weights 0.82 0.81 0.81 0.81 0.79 0.83 0.82 9. Picture Completion 0.75 0.74 0.74 0.74 0.75 0.77 0.77 0.83 10. Arithmetic 0.75 0.76 0.73 0.75 0.76 0.81 0.79 0.84 0.79 11. Digit Span 0.79 0.80 0.79 0.78 0.78 0.83 0.80 0.87 0.80 0.79 12. Picture Span 0.77 0.77 0.77 0.75 0.76 0.80 0.77 0.84 0.77 0.78 0.76 13. Letter-Number Seq. 0.74 0.74 0.74 0.73 0.76 0.80 0.76 0.83 0.77 0.74 0.67 0.72 14. Coding 0.80 0.80 0.80 0.77 0.75 0.82 0.80 0.85 0.78 0.80 0.81 0.78 0.77 15. Symbol Search 0.78 0.79 0.77 0.76 0.73 0.79 0.77 0.84 0.77 0.79 0.79 0.77 0.77 0.56 16. Cancellation 0.83 0.83 0.82 0.80 0.79 0.83 0.82 0.87 0.80 0.84 0.85 0.82 0.82 0.74 0.72
Note. Seq = Sequencing. Comparisons that can be calculated directly via the test record are shown in boldface.

Table 4. RIAS-2 Composite Discrepancy Score Reliabilities
Subtest 1 2 3 4 1. Verbal Intelligence Index 2. Nonverbal Intelligence Index 0.79 3. Composite Memory Index 0.80 0.79 4. Speeded Processing Index 0.94 0.93 0.92 5. Composite Intelligence Index 0.32 0.23 0.79 0.95
Note. Comparisons that can be calculated directly via the test record are shown in boldface.

Table 5. WISC-V Composite Discrepancy Score Reliabilities
Subtest 1 2 3 4 5 6 7 8 9 10 1. Verbal Comprehension Index 2. Visual Spatial Index 0.80 3. Fluid Reasoning Index 0.82 0.80 4. Working Memory Index 0.83 0.84 0.84 5. Processing Speed index 0.86 0.84 0.86 0.84 6. Quantitative Reasoning Index 0.65 0.74 0.66 0.79 0.83 7. Auditory Working Memory Index 0.82 0.83 0.67 0.84 0.87 0.85 8. Nonverbal Index 0.83 0.85 0.84 0.53 0.85 0.77 0.83 9. Cognitive Proficiency Index 0.81 0.57 0.60 0.77 0.80 0.86 0.74 0.73 10. General Ability Index 0.54 0.71 0.58 0.85 0.87 0.76 0.85 0.59 0.86 11. Full Scale IQ 0.85 0.84 0.86 0.58 0.44 0.76 0.79 0.36 0.77 0.00
Note. Comparisons that can be calculated directly via the test record are shown in boldface.

Table 6. 95% CI Widths for Average Discrepancy Scores by Type Standard Deviation
Discrepancy Score Type Average r 3 10 15 RIAS-2 subtests 0.81 4.61 15.38 23.07 RIAS-2 subtests, Rec. 0.78 4.87 16.24 24.36 WISC-V subtests 0.77 4.95 16.50 24.74 WISC-V subtests, Rec. 0.70 5.39 17.96 26.95 RIAS-2 composites 0.75 5.09 16.97 25.46 RIAS-2 composites, Rec. 0.86 4.08 13.60 20.40 WISC-V composites 0.75 5.09 16.97 25.46 WISC-V composites, Rec 0.83 4.42 14.72 22.09 Note. CI = confidence interval. r = computed discrepancy score reliability. Rec. = publisher recommended comparisons.


![Una Limosna [orch] SCORE](https://static.fdokumen.com/doc/165x107/631e9c1925add517740b2033/una-limosna-orch-score.jpg)