Very mild disease phenotype of congenic CftrTgH(neoim)Hgu cystic fibrosis mice
Upload
independentCategory
view
2download
0
lmmunogenet ics (1995) 4 l : 301-311 O Springer-Verlag 1995
Separation of multiple genes controlling the T-cell proliferative responseto lL-2 and anti-CD3 using recombinant congenic strains
Rc:crred: 2 December 1994
{bstract T lymphocytes of the strain BALB/cHeA exhibita low proliferative response to IL-2 and a high responseto the anti-CD3 monoclonal antibodies, while the strainSTS/A lymphocyte response to these stimuli is the opposite.We analyzed the genetic basis of this strain difference,using a novel genetic tool: the recombinant congenic strains(RCS). Twenty BALB/c-c-STS/Dem (CcS/Dem) RCS wereused, each containing a different random set of approxi-mately l2.5Vo of the genes from STS and the remainderfrom BALB/c. Consequently, the genes participating in themultigenic control of a phenotypic difference betweenBALB/c and STS become separated into different CcSstrains where they can be studied individually. The straindistribution patterns of the proliferative responses to IL-2and anti-CD3 in the CcS strains are different, showing thatdifferent genes are involved. The large differences betweenindividual CcS strains in response to IL-2 or anti-CD3indicate that both reactions are controlled by a limitednumber of genes with a relatively large effect. The highproliferative response to IL-2 is a dominant characteristic.It is not caused by a larger major cell subset size, nor by ahigher level of IL-2R expression. The response to anti-CD3is known to be controlled by polymorphism in Fcy receptor2 (Fcgr2) and the CcS strains carrying the low responderf-cer2 allele indeed responded weakly. However, as these.:rains do respond to immobilized anti-CD3, while the STS.trJrn does not, and as some CcS strains with the BALB/callc'lc,ri Icqr2 are also low responders, additional gene(s)of the STS \rrain strongly depress the anti-CD3 response. Ina backcros. berween the high responder and the lowresponder srrains CcS-9 and CcS-ll, one of these unknowngenes was mapped to the chromosome l0 near Dl)MitI4.The CcS mouse srrains which carry the SZS alleles of senes
M. Lipoldovii (E) . M. Kosaiovd . A. Zajftov|. V. HoliiM. KrulovriInstitute of Molecular Genetics. Academy of Sciences of the CzechRepublic, Flemingovo n6m.2, 166 37 prague 6, Czech Republic
A. A. M. Hart. P. DemantDivision of Molecular Genetics and Division of Radiotherapy,The Netherlands Cancer Institute, Amsterdam, The Netherlinds
Marie Lipoldov6 . Marcela Kosaiovd . Alena Zajicov{Vladimir Hol6il . Augustinus A. M. HartMagdal6na Krulov6 . Peter Demant
controlling the proliferative response to IL-2 and anti-CD3allow the future mapping, cloning, and functional analysisof these genes and the study of their biological effects invivo.
Intruduction
The immune response is a complex process which can bebroken down into several stages: recognition of antigen,signal transmission, and mounting of the effector reactions.The antigen-induced activation of T lymphocytes is acomplex process (Jenkins and Johnson 1993; Wegeneret a1. 1992) resulting in changes in the expression of atleast 100 genes (Ullman et al. 1990). T cells can beactivated to produce cytokines and cytokine receptorswhich drive proliferation and differentiation, as well ascell surface and intracellular molecules involved in effectorfunctions. One of the major events in T-lymphocyteactivation is the induction of the expression of IL-2 andits receptor, which allows autocrine stimulation of prolif-eration (Miyajima et al. 1992:- Minami et al. 1993).
Mouse strains differ considerably in their ability torespond to antigenic challenge. Some of these differencesare caused by a single gene, others are polygenicallyregulated. Mouse strains with impairment in the immuneresponse have proven invaluable tools for addressing abroad spectrum of immunological problems (Todd et al.1991 ; Wicker et al. 19921, Peterson et al. 1992., Malek et al.1989; Lipoldov6 et al. 1992). However, in cases whereseveral nonlinked loci are responsible for the strain differ-ences, the mapping of these genes may be difficult, evenusing the recombinant inbred strains (Klein and Taylor1985; Roberts et al. 1993).
Therefore, a special tool has been developed for geneticanalysis of multigenically-controlled complex biologicalprocesses: the recombinant congenic strains [(RCS) (De-mant and Hart 1986; Demant et al. 1989; Demant 1992)1. Aseries of RCS comprises about 20 homozygous strains, allproduced by inbreeding from the second backcross genera-

302
tion of two inbred strains, one of which serves as a parentalbackground strain and the other as a parental donor strain.Each RC strain of the series contains a different, random,set of about 12.57o genes from the parental donor strain andabott 81.57o genes of the parental background strain. Thedonor gene sets of individual RCS overlap in approximatelyl.5%o of genes. The RCS system has been used to analyzethe multigenic control of susceptibility to colon and lungtumors (Moen et al. l99l1, Moen et al. 19921' Fijneman et al.1994) and susceptibility to radiation-induced apoptosis inthymus (Mori and co-workers, in press). In this paper wedescribe the application of the RCS for analysis of thegenes controlling lymphocyte proliferation induced by IL-2and anti-CD3, and the mapping of the genetic control ofproliferative response after anti-CD3 stimulation.
Matedals and methods
Mice
Mice of strains BALB/cHeA (BALB/c), STS/A (STS) and recombinantcongenic strains of the BALB-c-STS/Dem (CcS/Dem) series, 8 to22 weeks old, were fiom the breeding colony of P Demant. Thegenetic composition of these RCS has been described in detail (GrooteI al. 1992; Groot and co-workers, in press). The experiments describedin this paper were carried out over the course of several years andrepeated with mice from several separate shipments with essentiallythe same result. When used for these experiments, the strains of theCcS/Dem series were in the generation 17-30 of inbreeding, and hencehighly homozygous (Groot and co-workers, in press).
IL-2
Human recombinant lL-Z (sp. act. 18x 100 IE/mg) was obtained fromEuroCetus Benelux B. V. (Amsterdam).
Antibodies
The monoclonal antibody (mAb) KT3 (Tomonari 1988) recognizingthe mouse CD3 complex (Huang and Crispe 1993) was obtained fromK. Tomonari (MRC Clinical Research Centre, Harrow, U. K.). Hybri-doma PC 6l (Lowenthal et al. 1985) which served as a source of mAbanti-o, chain of the IL-2R was provided by M. Nabholz (Swiss Institutefor Experimental Cancer Research, Epalinges s/Lausanne, Switzer-land). Anti-CD4 monoclonal antibodies H129-19 and anti-CD8 mAb53-6.7 have been described (Pierres et al. 1984: Ledbetter andHerzenberg 7979).
Lymp hocy te p ro life ration as s ay
Spleen cells (10s cells per well) were stimulated with IL-2 or anti-CD3mAb at several concentrations in 96-well tissue culture plates (Nunc,Roskilde, Denmark) in RPMI 1640 medium supplemented with 10Vaheat-inactivated fetal calf serum (FCS), 5x10 s M 2-ME, 25 mMHEPES buffer, and antibiotics (100 units/ml penicillin, 100 pg/mlsfeptomycin). All reagents were from Sigma (St. Louis, MO). Anti-CD3 stimulation was tested with both the soluble and immobilizedantibody. Anti-CD3 was immobilized by incubation in phosphatebuffered saline (PBS) at 37 oC for I h, followed by t h incubation at4 oC, and removal of the remaining soluble antibody by 3 x washingwith PBS. In some experiments spleen cells were grown in the serum-free medium AIM V (Gibco BRL, Venna, Austria). [:H]thymidine[(Institute for Research, Development and Utilization of Radioiso-
M. Lipoldovd et al.: Genetic dissection of proliferative response to IL-2 and anti-CD3
A negative control
250 U/ml
1000 U/ml
CcS/Dem strain
Fig. 1A-C Comparison of proliferative response to IL-2 in CcS/Demseries with respect to BALB/cHeA. Scattergram of A unstimulatedspleen cell cultures and of B proliferative response to IL-2 inconcentration 250 units/ml and C 1000 units/ml. Data summarize 30experiments; only those in which strain BALB/c r'r as used are included.Each value represents the mean of triplicate cultures in counts per minof CcS/Dem strain divided by the value obtained in the sameexperiment by the background strain BALB/cHeA. The mean valueof [:H]thymidine incorporation by BALB/c was A 904, B 5481, and Cl59ll cpm. The following strain abbreviations are used: 1-20, CcS -strain 1-20
topes, Prague, Czech Republic) (0.5 pCi/well)l was added into thecultures for the last 6 h of the 72 h incubation period. Medium RPMI1640 supplemented with FCS from Sigma yielded the lowest back-ground value and all data presented in the paper were obtained withthis FCS. However, no differences in the strain distribution pattern ofproliferation after lL-2 or anti-CD3 stimulation were seen, using FCSfrom two other sources: Bioveta (Ivanovice na Han6, Czech Republic)and SEBAK GmbH (Aidenbach, Germany), or the serum-free mediumAIM V (data not shown).
c
C)
J
oEo.o
@o
EO
aiJ(!
CL
o.cpF
F
T
t ^
€re:
t
tE
F
f
c
- E^-€^-t
1 2 3 4 5 6 7 8 9 1 0 1 1 1 2 1 3
M. Lipoldovd et al.: Genetic dissection of proliferative response to IL-2 and anti-cD3
Table 1 Percentage increase in proliferative response to IL-2 withrespect to BALB/cHeA. Percentage of increase in J:FI1,1.rtrn O'n"incorporation in various CcS strains and hybrids as compared withBALB/c. The 95Vo confidence interval is shown in brackets. The mean
values of BALB/c l3H]thymidine uptake was 904,4605,5481, 8542,15 911, and 27 628 cpm when spleen cell cultures were stimulated by 0,125, 250,500, 1000, and 2000 units/ml IL-2, respectively
303
Strain lL-2 doses
125 units/ml 250 units/ml 500 units/ml 1000 units/ml 2000 units/ml
12496388t238
t40-J5
/ 5
8),1000
783034
-11l6-9
t877380
l8435683
1
9124-317lt22020-5
245242t7-6
5
21568t a
I32365E
a
t
105-39476
100
-122I362l
1
1
a
42126264
I2345
9\
l t l
l .1 l1 . :l Jl 5l 6t 7l 81 920STSFr (BALB x 7)Fr (7 x BALB)
5 r -8 / l2 tE r - l l /3 .1 )2 r- l3l2l)
-3 t-23t20)J t-17/10)
12 (-s2/-30)ll (-2/27)
-65 (-72/-55)46 (27t6e)
-r9 (-3510)-34 (45/-22)
s (-9/22)-32 (44/-19)-37 (48/-23)
4 (-t0/r9)9 (43/n2)
-4 (-2'7t25)-37 (-s0/-22)-28 (-39l-1s)-38 (-s0/-22)101 (67/142)-1r (-29/10)-r2 (-31/10)
(-12/r'7)(6t64)
(14/61)(26/99)
(-rst12)(-19/11)(79/13s)
( - \ ) t_)) r(28/70)
(-rs/32)(-'7 /32)
(-r3/17)(-26/s)
(0/48)( l 8/s7)
(-37 /134)(-r8/40)(-2st16)(-1'7 /14)(-16130)(r60/216)(29t103)(0/108
(2/36)(1s/78)(32/86)(46/130)(-6/23)(-e/32)(gsl1s6)
(-46t-12)(48/97)(.-9/40)(0/43)(3t39)
(-2Ut3)(1 /51 )
(31/7s)(-26/116)(-10/s4)(-2s/16)(-t0/24)(.-t3/34)(r62/279)(34/t1r)(38/r22)
(-2t30)(20/86)(31/e4)(s0/r37)(-2t29)(14168)
(l 10/r 7s)(-49t*r7)(s2/r02)
(-12/3s)(2/46)
(-s/28)(-t6/20)(-r8/21)(s4lr05)
(-32/ts2)(3/11)
(-29/e)(-U36)
(-27 /r3)(13/24s)(38/117)(42/128)
9 (-s/26)47 (18/83)7r (44/103)93 (s4/143)ls (0t32)ss (28/88)
140 (109/175)-31 (46t-12)84 (60/113)31 (s/64)33 (11/59)16 (0/3s)20 (0/44)-7 (-24/13)98 (72tr29)46 (-24/184)37 (s/80)
-20 (-36/0)20 (2/42)4 (23/18)
148 (106/198)83 (46tr30)
lo4 (61/158)
(-7 /24)(t3/74)(35/e l )(3 l /108)(3/37)
(371100)(89/148)
(42/-6)(46/9s)(ro/72)(r2/61)(0/35)
(r4/64)(-36/4)(69tr24)
(-25/t77)(20/106)
(-38/-3)(-2/34)
(-23/19)('73/ts0)(38/1 l 8)(39/r23)
406165T966
r16-26683734t636
:2195435 /
J3l4-4
r087476
IL-2 production assay
Spleen cells from individually tested mice were incubated in 96-welltissue culture plates (Nunc) in a concentration of 0.5x100 cells/ml incomplete RPMI 1640 medium alone or in the presence of 1.5 pg/mlanti-CD3 mAb. After 4 h, 24 h, 48 h, or 72 h of incubarion, the\upematants were harvested and tested for the ability to support thecrosrh of Il-2-dependent T-cell line CTLL-2 (Gillis et al. i97g). Inhriet. . l (X) ul of CTLL-2 cel l suspension (5x10+ cel ls/ml) wererncubarcd uith equal volumes of serially diluted supernatants, andcell prolileration \\as derermined b1. adding 0.5 pCi of [:H]thymidine/uell tbr rhe lasr 6 h of the l-l h incubation oeriod.
Preparation of cell subpopulations
Highly purified T- or B-cell populations were obtained by combining.eparation techniques of nylon wool adherence (Julius et al. 1973) and:Jnnins (Wysocki and Sato 1978) as described previously [Holli et al.-'\: The purity of the resulting cell population was controlled byF.\('S-an analvsis. using anti-Ig (Sigma) and and anti-CD3 (Tomonaril9ss , lor B rnd T cells, respectively. Within the limits of the method,ssenrlu\rt\. th('populations appeared to be pure. In a biological assayfor the pre'ence of antigen presenting cells (ApC) the CD3* celliprepared br rhi. merhod did not respond by proliferation to concana-val in A or anri-CD-l.
I rnm unofl uo re scence analy s i t
Flu.orescence staining was performed on ice in 50 pl containing 6x10scells and a predetermined amount of primary antibody in pBScontaining 2.5Vo motse serum and 0. l7r NaN:. primary antibodieswere labeled with fluorescein isothiocyanate FITC. In some experi_ments a fluoresceinated secondary antibody was used. Staining with asecondary antibody was performed in a similar manner after the cellswere washed. All analyses were performed by using a FACSTAR cellsorter (Becton Dickinson, Mountain View. CA).
Geno4,ping of simple sequence length polymorphisms (SSLp) by pCR
PCR genotyping was performed as described (Groot et al. 1992), usinethe primers from Research Genetics (Huntsville, FL). Briefly. amplil{tl{iol of DNA was performed wirh an MJ Research Thermil CyclerPTC 100 Model 96 (MJ Research, Waterrown, MA) in a volume of10 pl with 20 ng DNA, 0.23 gM of forward primer y[32p] ATp end-labeled with T4 polynucleotide kinase (New England Biolabs, Schwal-bach, Germany), 0.23 pM of reverse primer, 200 trrM of each dNTp and0.04 units 7'a4 polymerase (GIBCO, Grand Island, Ny) in a 96-wellU-bottom microtiter plate (FALCON, Oxford, UK) with I cycle of3 min at 94oC and 30 cycles of 30 sec at94oC, I min at 55bC and1 min at 72'C and I cycle of 1 min at 55 "C, 3 min at72 oC, and I minat 23 "C. Each PCR product was mixed with 30 pl of loading bufferand elecffophoresed in 6% acrylamide gels for 2-2.5h at 50 W. Gelswere wrapped in Saran Wrap (Dow Chemical Co., Midland, MI) andexposed to X-ray film X-format AR (Kodak, Weesp, The Netherlands)tor 1.5-24 hours at -70 "C.
Statistical analysis
An analysis of variance with repeated measurements (with theCompound Symmetry model for the within-animal covariance ma-trix) was performed, using the logarithm of counts as dependentvariable; strains, experiments, and gender as between animal factors;IL-2 or anti-CD3 dose as within-animal factor; and age as covariate.Calculations were done, using the statistical package BMDp-pC90(BMDP Statistical Sofrware Manual): program 2V for significancetests (the Greenhouse-Geisser correction was used for the calculationof the P-values where appropriate), program 5V for estimation of theeffects (using the REML method), and program DM for the plots.Evaluation of linkage was performed after logarithmic transformitionof counts to obtain normal distribution by analvsis of variance(Advanced ANOVA, NCSS), using the genotype and sex as fixedfactors and the experiment as random factor.

304 M. Lipoldovd et al.: Genetic dissection of proliferative response to IL-2 and anti-CD3
negative controlAResults
Prolifurative response to IL-2
Pilot experiments revealed that the strain BALB/cHeAexhibits a low proliferative response to IL-2, whereas the
strain STS/A shows a high response to this stimulus. Theresponses of BALB/c, STS, and the twenty CcS/Dem RC
strains were tested at five different concentrations of IL-2.
A total of 506 male and female mice, 8 to 22 weeks old,
were used. The results are given in Table 1 and Figure l. In
this Table and Figure the data observed in the RC strainsand STS are related to the mean value observed in theBALB/c mice in each experiment. The mean c. p. m. valueswith BALB/c lymphocytes were 904 (0 units/ml IL-2)'
4605 ,lr25 units/ml), 5481 (250 units/ml), 8542 (500
units/ml), 15911 (1000 units/ml), and 27 628 (2000 unitsiml). Without stimulation, the strains CcS-9 and STS have
higher levels of l3H]thymidine incorporation comparedwi th BALB/c, whi le s t ra ins CcS-6, -8, -11, -13, -14, -18,-19, and -20 have lower levels (P <0.0001).
For all IL-2 doses the strains CcS-2, -3, -4, -7, -9, and-15 have increased levels of stimulation with respect to the
strain BALB/c (P <0.0001). The highest response was
observed in RC strains CcS-7, CcS-9, and CcS-15. TheIL-2dose-effect curves of strains CcS-6, -15, and -17, and thedonor strain STS/A markedly and significantly deviate inshape from the general pattern observed in other strains.STS/A has a higher response to the lower concentrations ofIL-2, whereas CcS-6, -15, and -7J are relatively weaklystimulated in the lower dose region but respond better in thehigher dose region (see Table 1). Comparison of theresponse of males and females revealed no significantdifference in overall level (P = 0.49), but the shape of theIL-2 dose-effect curve differed between males and females(P <0.0001), females being more stimulated in the lowerdose region. No effect of age within the period of 8 to
22 weeks on the proliferative response was found (P = 0.74).The strain differences appear to hold over a wide range
of IL-z concentrations as well as cell concentrations: in
tests of the strains BALBic, STS, CcS-9, and CcS-lI in
several concentrations ranging from 0.125x100 to 2x10⁶cells/ml andIL-2 ranging from 125 units/ml to 2000 units/ml, the strain STS was the high responder, the strain BALB/
c low, and the strains CcS-9 and CcS-11 were intermediate(data not shown).
If the differences in IL-2 response between BALB/c and
STS were controlled by an additive effect of a very largenumber of nonlinked loci, each CcS strain would likelyreceive at least some of them from the donor strain, andhence most or all CcS strains would exhibit a similar,intermediate response. However, the large differences inproliferative response between individual CcS strains andthe number of high- and low-responder strains suggest that
a limited number of genes with a major effect is involved in
the controlling of Il-2-stimulated proliferation. The highlyresponding strain CcS-7 was selected for further investiga-tion. The proliferative response of Fr hybrids between
O O
^ o Ea : r i - i =^ i = l t r
o A o _- 3
C)d]J
Eo.o
c(6
a
Eo-oidl<(Eo-
o
€.E-cF
-(D
7) F1(TXBALB)
1000 U/ml
Fl(BALgxT) F1(TXBALB)
strain
Fig. 2A-C Comparison of proliferative response to IL-2 in Frhybrids between BALB/c and CcS-7 and their parents' Scattergramof A unstimulated spleen cell cultures and of B proliferative responseto IL-2 in concentration 250 units/ml, and C 1000 units/ml. Each valuerepresents the mean of triplicate cultures in counts per min divided bythe value obtained in the same experiment by the background strainBALB/c. The mean value of [3H]thymidine incorporation by BALB/cwas A 655, B 4339, C 15543 cPm
BALB/c and CcS-7 to IL-z exhibited increased levels of
stimulation with respect to BALB/c (Table l; Fig. 2)'
indicating that the allele causing a high proliferative
response io IL-2 in this strain is dominant.
Analysis of cell subpopulations by flow cytometry
To establish whether the higher response toIL-z reflects the
size of one of the major T-cell subpopulations or the
preexisting expression of the IL-2 teceptor, freshly ob-
tained spleen cells from high (STS, CcS-4, -7)- and low
-^ = a a
; - i ; 1 ;

C c S - 1
M. Lipoldov6 et al.: Genetic dissection of proliferative response to IL-2 and anti-CD3
BALB/CHEA STS/A C c S - 4
ti)r !0r
FLUORESCENCE INTENSITY
305
I!
Ez
--:
F4Jt'l
!6o
(BALB/c, CcS-1, -12)-responder strains were analyzed byFACS. No significant differences with respect to thefrequency of CD3+, CD4+, and CDS* subsets were found(Fig. 3). No CD25+ cells were detected before IL-2stimulation. and after stimulation the expression of CD25was very low. with no differences between high- and low-responder strains (data not shown).
Response to IL-2 by purified cell subpopulations
The proliferative response to lL-2 by unseparated spleencells, enriched T cells or B cells was compared. Figure 4documents that the strain differences observed between theproliferative response of the total spleen cell populationreflect the differences between the response of CD3+populations.
Strain dffirences in prolferative responseto soluble anti-CD3 mAb
The proliferative response to anti-CD3 mAb was analyzedin 234 males and females (Table 2; Fig. 5). The epitoperecognized by this mAb is present in all strains of CcS/Demseries, and the frequency of CD3+ cells is similar both inintermediate- and high-responder strains BALB/cHeA,CcS-l, and CcS-4 and low responders STS/A, CcS-7, and
Fig. 3 Flow cytometric analysis of freshly obtained mouse spleencells. Cells from strains representing low (BALB/c, CcS-1, -12) andhigh (STS/A, CcS-4, -7) responders to IL-2 were stained with FITC-conjugated antibodies as described in Materials and methods. Cellnumber versus fluorescence intensitv is shown
CcS-12 (Fig. 3). The strain differences in response to anti-
CD3 stimulation have been reproducible in a number ofseparate experiments for a period of more than 2 years. Thehigher response of the strains BALB/c, CcS-9, and CcS-15,as compared with the low-responder strain STS wasdetectable in cell concentrations ranging from 0.25 x 100to 1x l0o (data not shown).
The absence of a functional CD32 (Fcgr2) receptor inhumans has been reported to be associated with the inabilityto proliferate after anti-CD3 stimulation (Tax et al. 1983).The background strain BALB/c shows a higher response toanti-CD3 mAb, whereas donor strain STS exhibits lowresponse; this finding corresponds with the presence offunctional CD32 antigen in BALB/cHeA and its absence inSTS/A (Hibbs et al. 1985). Therefore, we tested whetherthis was the only factor determining the genetic differencesin anti-CD3 response. Genetic typing indicated that theSTS/A allele of Fcgr2 prodtcing nonfunctional CD32 ispresent also in CcS-7, -11, and -12 (Groot and co-workers,in press). These three CcS strains were indeed very lowresponders, as expected. However, the 17 CcS strains withthe functional Fcgr2 allele still exhibit large differences in
C c S - 7 CcS - 12

M. Lipoldovd et al.: Genetic dissection of proliferative response to IL-2 and anti-CD3
A negative control
0.375 ug/ml
0u r a i z s 4 5 6 7 8 9 1 0 1 1 1 2 1 3 1 4 1 5 1 6 1 7 1 8 1 9 2 0
CcS/Dem strain
Fig. SA-C Comparison of the proliferative response to anti-CD3mAb in the CcS/Dem series with respect to STS/A. A Scattergram of[:H]thymidine incorporation of nonstimulated spleen cell cultures andB the proliferative response to anti-CD3 mAb in concentrations of0.375 pglml and C 1.5 pg/ml, representing data from all experimenrsin which strain STS/A was used. Each value reDresents the mean oftriplicate cultures in cpm of CcS/Dem RCS d-ivided by the valueobtained for the response of donor strain STS/A in the same experi-ment. The mean value of pHlthym'd'ne incorporation by STS/A was A1498, B 2023, and C 2643 cpm. Abbreviations used in this Figure:1-20, CcS - strains 1-20
markedly and significantly deviate in shape from thepattern observed in the other strains (P < 0.0001:Table 2). CcS-1, -5, -9, and -10 show a better response incomparison with BALB/c in higher concentrations of anti-CD3, CcS-4 exhibits a higher increase in proliferativeresponse in an intermediate-rather than in a high-doseregion, whereas the donor strain STS, which is a lowresponder, responds relatively better to low doses of anti-CD3 than in the hieh-dose repion.
spleen cel ls
a-U)E
a
id.:<(Eo
o=,=E
hr
coo
o_
o.Eo
;i
E_cF
I
B cel ls (CD3-lg')
U/ml tL-z
Fig. 4A-C Comparison of proliferative response to A IL-2 by spleencells, B enriched T cells (CD3+, Ig-) and C B cells (CD3 , Ig+). T andB cells were obtained as described in Materials and methods. Resultsrepresent arithmetic means t SD of triplicate determinations in onerepresentative experiment. Seven independent experiments gave simi-lar results
their ability to respond by proliferation (P <0.0001).CcS-4, -5, and -9, exhibit a higher proliferative responsethan BALB/cHeA, CcS-6, -8, -13, -18, and -20, showdecreased levels of stimulation with respect to BALB/cHeA for all anti-CD3 doses, and CcS-8, CcS-18, andCcS-20 (as well as CcS-ll and CsS-12) are even lowerresponders than the donor strain STS/A. These data demon-strate that besides Fcgr2 several other genes having a largeeffect are involved in the control of the anti-CD3-stimu-lated response.
Analysis of variance indicated that the CD3-dose-effectcurves of strains CcS-I, -4, -5, -9, and -10, and STS/A
T cells (CD3- lg-)
c l
l
Bo
G
^-- r ^ ^ l ^
I
l
to
a ^ a- ; - ^ - i :
a t " t :
^ : ! E t - t =
r t ! ^ e - p . -
^ = - i + ; - l + - - G G . = - l
* a E
M. Lipoldovri et a1.: Genetic dissection of proliferative response to IL-2 and anti-CD3
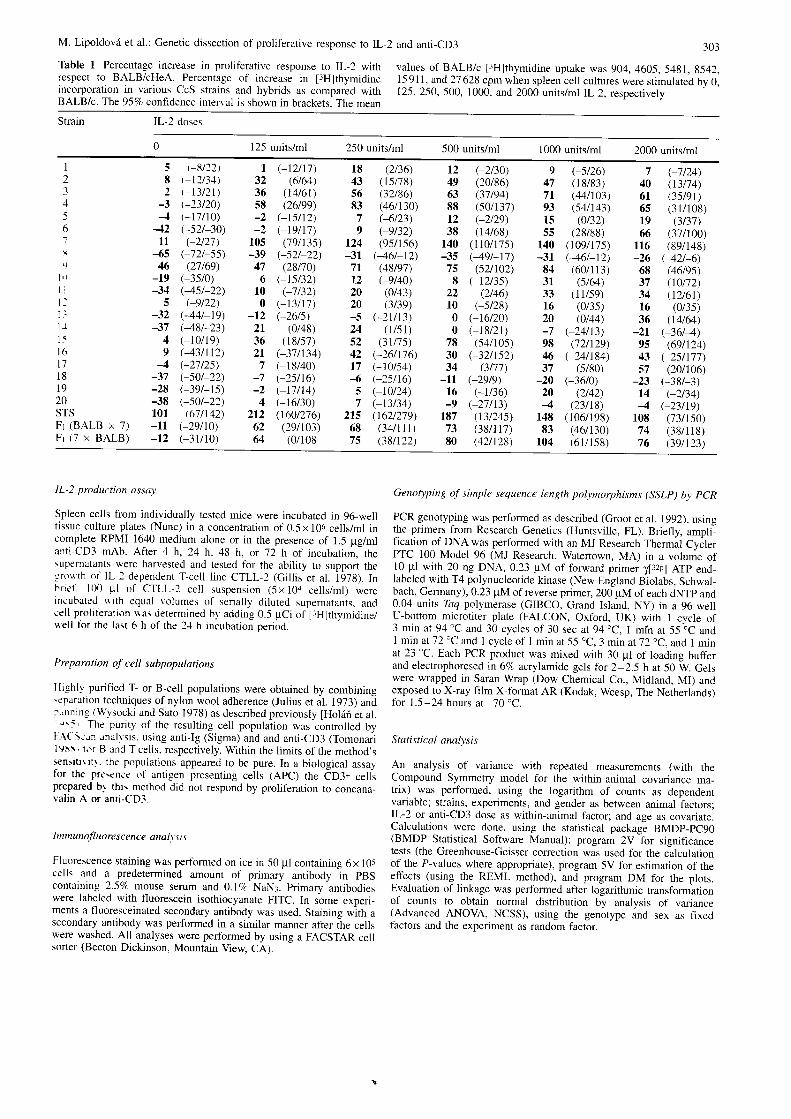
Table 2 Percentage increase in proliferative response to anti-CD3mAb with respect to BALB/cHeA. Percentage of increase in
[,rH]thymidine incorporation in various CcS strains as compared withBALB/c. The 957a confidence interval is shown in brackets. The mean
values of BALB/c l3H]thymidine uptake was 115'7, 1875,3389, 5030,6966, and 10235 cpm when spleen cell cultures were stimulated by 0,0.092,0.315, 1.5, 6, and 24 1tg/ml anti-CD3 mAb, respectively
30'7
Strain Anti-CD3-concentration
0.92 ytglml 0.375 pg/ml 1.5 pg/ml 6 gg/ml 24 1tg/ml
I234
ol
l0 e)8t69)6 ( -33/68)
J ( -35/41)7 t-31174)
-18 (40/12)17 (45t-r9)4 (-3st37)
-65 (-19t4r)18 (-ts/64)
-30 (-56/13)-36 (-s6l-s)-2 (-28/34)
40 (-sgl-r3)-sl (-69t-23)-0 (-30/41)14 (-32/94)-s (44t61)
-s4 (-'72/-2s)45 (-64/-16)45 (46/-12)42 (3/95)
26 (-r1t94)4 (-39151)e (-26t62)
20 (-26t96)11 (-19153)
49 (-66/-22)-2s (48/9)J6 (-86/-59)47 (s/105)
-r2 (45t41)47 (-64/-22)-34 (-s2/-9)46 (-62/-21)-22 (-50/22)
2 (-28t46)-10 (47ts3)
| (40/72)-s7 (-74/-30)-3e (-60/-'7)47 (-67t-rs)
| (-26/38)
35 (-12/101)-r4 (45t36)28 (-13/90)78 (9/t9t)65 (201128)
44 (-63l-15)4r (-60/-14)-83 (-e0t,72)136 (69t229)49 (-1t142)
-s3 (-68/-30)-s0 (-64/-32)49 (-6st-26)4 (40t4'7)13 (-20t62)
-13 (49t63)26 (-25/114)
46 (-6'7/*r28)-33 (-5610)46 (-66t-r3)J3 (44t4)
s8 (3n43)-24 (-s2/19)34 (-9/99)
100 (22t221)72 (2sil38)
-48 (-66t-2r)-s3 (-68/-3r)-90 (-94t-83)199 ( l l5 /318)s9 (-11158)
-s7 (-1U-3'7)-64 (-14t-st)-s4 (-68t-34)
s (-33l6s)3 (-2'7t47)
-3 (43t63)28 (-24t1r9)
-60 (-1st-3s)-36 (-58/-3)46 (18/4s)-28 (48/-2)
63 (5/r50)-3 (-39ts2)3s (-8/101)
155 (s6l318)r04 (47tr8r)-s0 (-67/-24)-61 (-73t44)-9r (-94/-8s)284 (r76/436)99 (23/223)
-68 (-78t-s2)-7r (-19t-6t)-56 (-'70/-37)
6 (-32t67)4 (-33/36)3 (-38t76)
14 (-32/95)-s6 (-73t-28):36 (-58/-3)-67 (-:79/47)-sl (-64/-34)
94 (26tr99)-s (40/49)37 (*7t103)98 (2t/224)
r20 (s9/203)40 (-6U-9)-6r (-13/43)-92 (-9st-87)278 (t '7U427)118 (3st2s3)-7r (-81/-58)-16 (-82/-61)-6s (-76t-s0)
8 (-31169)r7 (-r7t68)22 (-27/rO8)3 (-38/76)
-s9 (-74/-33)-29 (-s4/7)Jr (-82/-54)-63 (-13t-s0)
6
9l 0l ll ll - ll - tl 5l 6t 11 8l 920STS
P ro life rativ e re sponse to immobilized anti- C D 3
The strain STS is a low responder to both soluble andimmobilized anti-CD3. However, the strains CcS-7, CcS-11. and CcS-12, which share with STS the nonfunctionalFcgr2 allele and are low responders to soluble anti-CD3,are high responders to immobilized anti-CD3 (Fig. 6). Thisshows that the Fcgr2 allele is not the only genetic factorresponsible for the low responsiveness of the STS strain.
Low proliftrative response to anti-CD3 is accompanied bydecreased synthesis of IL-2
Supernatants obtained after anti-CD3 stimulation of spleencells of low (STS, CcS-I1)- and high (BALB/c, CcS-5,CcS-9)-responder strains were tested for the presence ofIL-2. The levels of IL-2 correlated with the proliferativeresponse of the strains tested: spleen cells of STS did notproduce detectable IL-2, the supernatants of CcS-I1 con-tained either very low or undetectable levels, and BALB/c,CcS-5, and CcS-9 produced intermediate or high amountsof IL-2 (Fig. 7).
Mapping the genes controlling anti-CD3 prolferativeresponse
As the first step of identification of genes controlling the'differences in anti-CD3-proliferative response, we per-formed a mapping experiment in a cross between a high-responder RC strain (CcS-9) and a low-responder RC strain
(CcS-11). The two strains differ at the Fcgr2 locus, butprobably also at additional loci controlling the anti-CD3response. A backcross CcS-11 x (CcS-11 x CcS-9)Fr wasprepared. The individual backcross mice were tested for theproliferative response at different concentrations of anti-CD3, and their DNA was typed for the genetic markers atwhich the two CcS strains differ. A large difference wasfound between the heterozygotes and homozygotes at theFcgr2 locus (P <0.00001), the latter being low responders.In addition, considerable phenotypic heterogeneity wasobserved between mice heterozygous at the Fcgr2 locus.The effects of the genotype at other markers located on 12different chromosomes in this group which comprised 82mice are summarized in Table 3. The multilocus analysis ofvariance indicates a significant effect of the genotype at theD10Mit14 locus on chromosome 10 (P = 0.002) andsuggested the possible involvement of two other regions,on chromosomes 16 and 17. These latter two, however, donot reach the required significance level, and hence need tobe tested in additional crosses.
Discussion
Lymphocyte activation has been extensively studied and isknown to involve coordinated transcriptional activation of alarge array of genes (Ullman et al. 1990). T-cell-prolifera-tive reactions to stimulationby IL-2 and anti-CD3 simulatedifferent stages of the antigen-induced T-cell activation(Ullman et al. 1990), and they apparently employ signal-ling pathways with at least partly distinct elements (Down-
308
negative control
1.5pg/ml
BALB STSr CcS-s
I soluble E immobilized
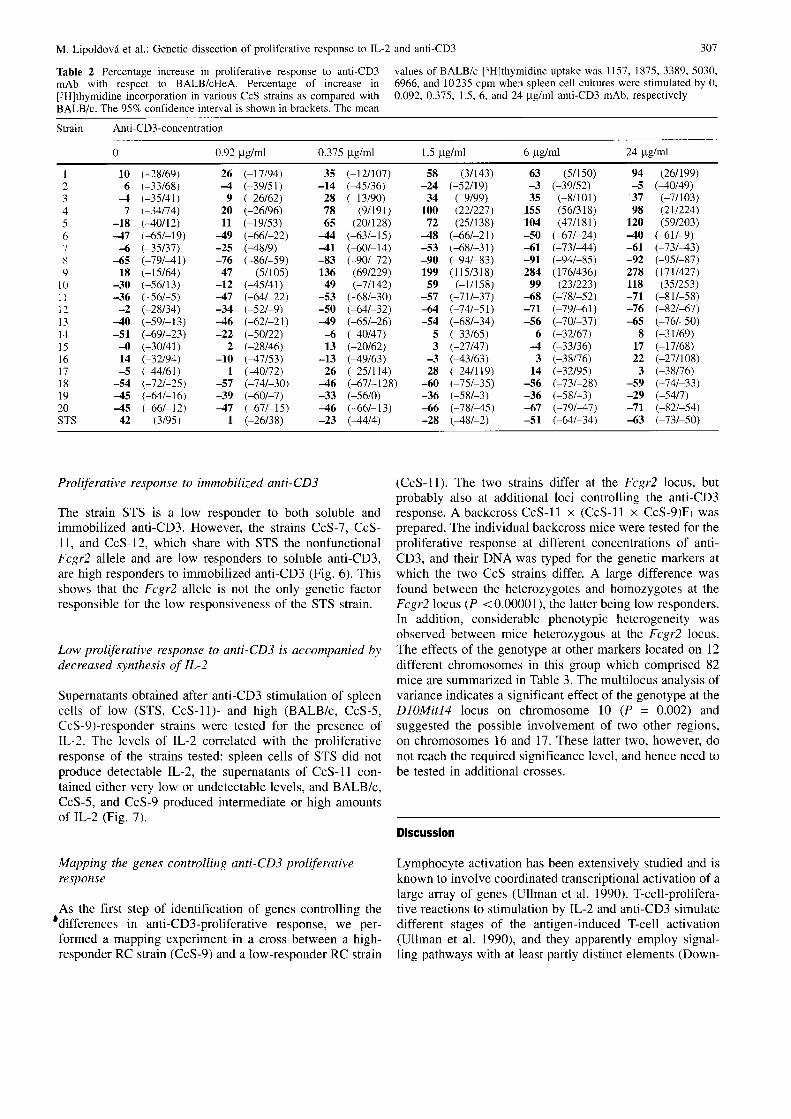
Fig. 6A, B Comparison of proliferative response to soluble andimmobilized anti-CD3. A Non-stimulated cells. B 1.5 pg/ml anti-CD3 was used for stimulation in solution. as well as for immobiliza-tion. Spleen cell proliferation was tested as described in Materials andmethods. An asterisk indicates the strains with the S7"S allele of Fcpr2.Seven independent experiments gave similar results
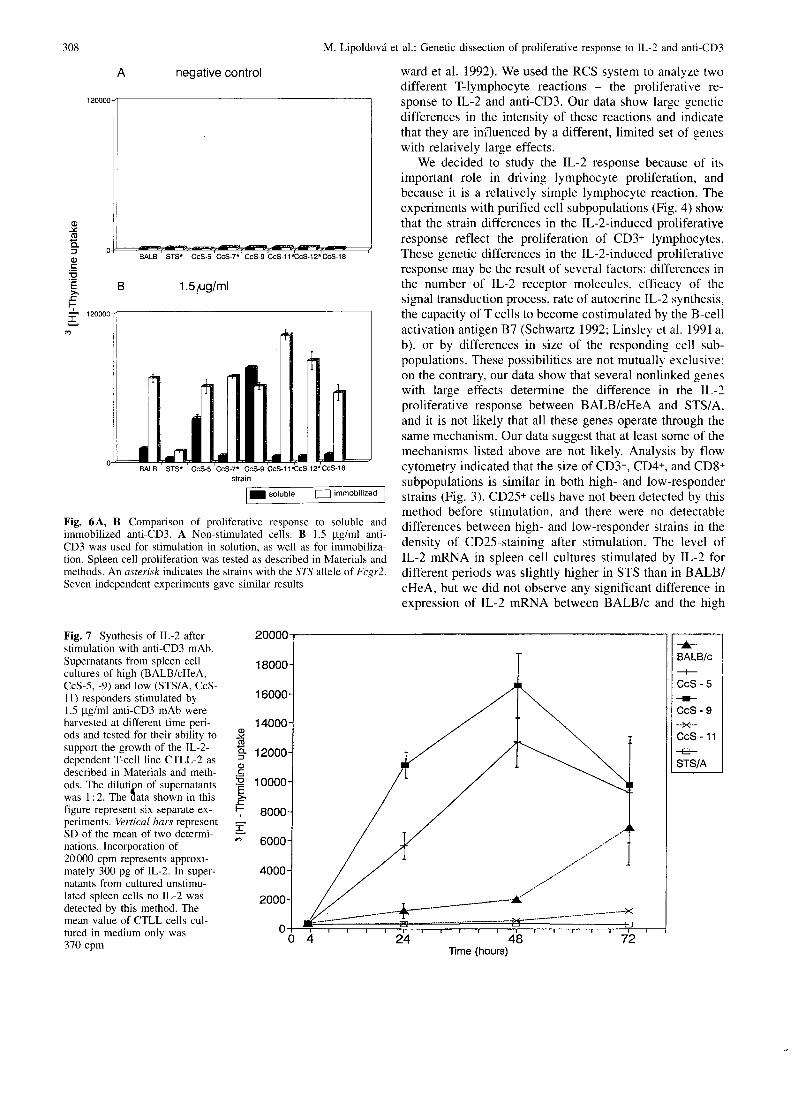
Fig. 7 Synthesis of IL-2 afterstimulation with anti-CD3 mAb.Supematants from spleen cellcultures of high (BALB/cHeA,CcS-5, -9) and low (STS/A, CcS-l1) responders stimulated by1.5 ptg/ml anti-CD3 mAb wereharvested at different time peri-ods and tested for their ability tosupport the growth of the IL-2-dependent T-cell line CTLL-2 asdescribed in Materials and meth-ods. The di lut ion oI suoernatantswas I :2. The tata shown in thisfigure represent six separate ex-periments. Ve rt ic al bcrs represenlSD o[ the mean of two determi-nations. Incorporation of20000 cpm represents approxi-mately 300 pg of IL-2. In super-natants from cultured unstimu-lated spleen cells no IL-2 wasdetected by this method. Themean value of CTLL cells cul-tured in medium only was370 com
M. Lipoldovii et al.: Genetic dissection of proliferative response to IL-2 and anti-CD3
ward et al. 1992). We used the RCS system to analyze twodifferent T-lymphocyte reactions - the proliferative re-sponse to IL-2 and anti-CD3. Our data show large geneticdifferences in the intensity of these reactions and indicatethat they are iniluenced by a different, limited set of geneswith relatively large effects.
We decided to study the IL-Z response because of itsimportant role in driving lymphocyte proliferation, andbecause it is a relatively simple lymphocyte reaction. Theexperiments with purified cell subpopulations (Fig. 4) showthat the strain differences in the Il-2-induced proliferativeresponse reflect the proliferation of CD3+ lymphocytes.These genetic differences in the Il-2-induced proliferativeresponse may be the result of several factors: differences inthe number of lL-2 receptor molecules. efficacy of thesignal transduction process, rate of autocrine IL-2 synthesis,the capacity of T cells to become costimulated by the B-cellactivation antigen 87 (Schwartz 1992, Linslel ' et al. 1991a,b), or by differences in size of the responding cell sub-populations. These possibilities are not mutuallr exclusive;on the contrary, our data show that several nonlinked geneswith large effects determine the difference in the IL-2proliferative response between BALB/cHeA and STS/A.and it is not likely that all these genes operate through thesame mechanism. Our data suggest that at least some of themechanisms listed above are not likely. Analysis by flowcytometry indicated that the size of CD3+, CD4+, and CD8+subpopulations is similar in both high- and low-responderstrains (Fig. 3). CD25+ cells have not been detected by thismethod before stimulation. and there were no detectabledifferences between high- and low-responder strains in thedensity of CD25-staining after stimulation. The level ofIL-2 mRNA in spleen cell cultures stimulated by IL-2 fordifferent periods was slightly higher in STS than in BALB/cHeA, but we did not observe any significant difference inexpression of IL-2 mRNA between BALB/c and the high
0)J
=o='=
F
I
o
x
o - 1
o
o - r'-c
l--
r
Time (hours)

M. Lipoldovri et al.: Genetic dissection of proliferative response to IL-2 and anti-CD3
Tabfe 3 Linkage analysis ofanti-CD3 response in Fcgr2 heterozygousCcS-l l x (CcS-9 x CcS-l)Fr backcross mice
Chromosome Locus P-value
sharing the same Fcgr2 allele, are low responders to solubleanti-CD3, but high responders to immobilized anti-CD3.Moreover, several CcS/Dem strains are even higher respon-ders than BALB/c, indicating that they received from thelow-responder parent STS a gene enhancing the anti-CD3-stimulated response.
The proliferation induced by anti-CD3 mAb differedsignificantly in Th1 and Th2 cell lines (Gajewski et al.1990; Wang et al. 1993) and the regulatory role of the CD4molecule (Tamura et al. 1990) and cytokines (de WaalMalefyt et al. 1993) in this response was described. Asthe strain distribution pattern (Fig. 5; Table 2) and dose-response curves (Table 2) also indicate that anti-CD3-induced proliferation is controlled by more than one gene,the low anti-CD3 proliferative response in different CcS/Dem strains may be the result of different mechanisms. Thestrain distribution patterns of IL-2- and anti-CD3-inducedproliferative responses are different (Figs. l, 5; Tables l, 2),indicating that distinct sets of controlling genes are in-volved. However, some parts of the signalling pathway ofthese reactions could overlap (Downward et al. 1992). Inaddition, stimulation by anti-CD3 in our experiments isfollowed by synthesis of IL-2, high anti-CD3-respondersbeing higher producers of this cytokine than low-responderstrains (Fig. 7). Genes which determine the Il-2-responsecould thus influence the anti-CD3 response as well. Indeed,high anti-CD3-responders CcS-4, -9 also show a highproliferative response to IL-2, but the strains CcS-l, -5,-10, and BALB/c exhibit a high proliferative response toanti-CD3, whereas their response to IL-2 is low (Tables 1,2). It is likely that anti-CD3-stimulated T cells of thesestrains produce an amount of IL-z high enough to induce ahigh proliferative response in spleen cell cultures thatexhibit a low response to direct stimulation by IL-2. Themapping of the genes controlling the IL-2 and anti-CD3response will ultimately reveal whether some of theminfl uence both responses.
The strain differences observed in this study cannot besimply explained by differences in the microbiologicalstatus of the strains: strains located in the same roomexhibited differences in their response to IL-2 and anti-CD3, which were consistent for a period of more than2 years. A remarkable feature of the present data is theextent of genetic variation influencing the activation ofT cells between two inbred strains, BALB/c and STS.Although neither of these strains is immunodeficient, ourresults show that a number of genes influencing the twoT-cell activation mechanisms tested exhibit allelic variationwith considerable functional effects. So far, very little isknown about the extent of the polymorphism of the genescontrolling quantitative variation in the immune response inhumans or in experimental animals, but our data suggestthat it is likely to be extensive. The impact of this type ofvariation on various immunological reactions (resistance toinfection, autoimmunity, capacity to reject or accept allo-geneic transplant, inducibility of tolerance) is not known.However, identification of the genes involved in the mousewill make it possible to search for the homologous genes inthe human.
309
3
4
5
6
7
N. S.
N. S.N. S.
N. S.
N. S .
N. S .N. S .N. S .N. S .N. S .
N. S .
0.002N. S .
N. S.N. S.N. S.N. S.
N. S .
0.050N. S .
0.052N. S .N. S .
N. S .
responders CcS-7, -9, -15, and (BALB x CcS-7)Fr (datanot shown). This indicates that the interstrain differences inthe IL-2 response are not due to a pre-existing antigenicstimulation in some CcS/Dem strains but not in others. IL-2stimulates activated T cells, mediates augmentation ofnatural killer cells. and induces the growth of B cells andsome cell subsets of nonlymphoid origin (Minami et al.1993). The CcS/Dem strains that carry the SIS alleles ofthese genes on BALB/c background may be suitable toolsfor defining and analyzing the mechanisms of their actionin vitro and in vivo. Polymorphism in the proliferativeresponse to anti-CD3 mAb has been described both inhumans (Tax et al. 1983) and in mice (Hibbs et al. 1985).It has been attributed to the effect of polymorphism of theFcy receptor 2 (Fcgr2) on the function of monocytes/macrophages (Hibbs et al. 1985), and spleen monocyteswere also required for anti-CD3-induced proliferation inour experiments (data not shown). The parental strain STScarrying the Fcgr2 allele producing a nonfunctional CD32molecule and three other CcS/Dem strains that received theFcgr2 allele from STS are low responders, as expected.Nevertheless, there must be at least one other gene with aconsiderable influence on this response as well, because thestrains CcS/Dem-6, -8, -13, -18, and -20 carrying theBALB/c Fcgr2 allele are low responders. Evidence for anadditional gene controlling the anti-CD3 response is pro-vided by experiments with immobilized antibody. STS is alow responder, but the strains CcS-7, CcS-11, and CcS-12,
D3Mit I I
DlMit7DlMn2_l
D5Mit24
D6Mit42
D7Mit7DTMitl4D7Mit54D7Nds2D7Nds5
D9Mit15
DlqMitl4D10Mit46
D1]MitBD11Mit26DllNds9Dl l Nds I8
Dl2Mit37
D16Mit7Dl6Mit34
Dl7Mit38D17Mit42D17Mit120
D19Mit16
l l
t o
12
16
t 7
l 9
3 1 0
References
BMDP Statistical Software Manual, Vol. 1 and 2. University ofCalifornia Press, Berkeley, CA, USA
De Waal Malefyt, R., Figdor, C. G., Huijbens, R., Mohan-Pererson, S.,Bennett, B., Culpepper, J., Dang, W., Zurawski, G., and de Vries,J. E. Effect of IL-13 on phenotype, cytokine production, and
M. Lipoldovd et al.: Genetic dissection of proliferative response to IL-2 and anti-CD3
Lowenthal, J. W., Corth6sy, P., Tougne, C., Lees, R., MacDonald, H. R.,and Nabholz, M. High and 1ow affinity IL-2 receptors: analysis byIL-2 dissociation rate and reactivity with monoclonal anti-receptorantibody PC61. J Immunol 1J5; 3988-3994, 1985
Malek, T. R., Shevach, E. M., and Danis, K. M. Activation ofT lymphocytes through the Ly-6 pathway is defective in A strainmice. -/ Immunol 113: 439-445. 1989
The separation of these genes in individual mouse RC cytotoxic function of human monocyres. J Intmunol l5l:strains makes it possible to study their functions and will ^ 6370-6381' 1993
enable us to map them to specifii chromosomal segmenrs. ""T:ij;"t;,f::";:k;::::ifi,it,'fi;?i?;l'?r# cancer - newThe CcS/Dem RCS series is suitable for this study, because D#;;;:p. and Harr, A. A. M. Recombinant congenic srrains: a newthe two parental inbred strains, BALB/c and STS, differ tool for analyzing genetic traits determined by more rhan one gene.considerably in both responses. In addition, the CcS/Dem _ Immunogenetics 24: 416-422, 1986RC strains were geneticaiy characterized for more than 320 otTilt:-t,oomen, L. c. J. M.' and oudshoom-snoek' M. Geneti$ of
markers dirrering between rhe strains BALB;-;; sfi ;ll-1#:Tllfl',1'3;:":Tfi"$:#?T"i*":ifrt:l$':'ir;;'(Groot and co-workers, in press). Thus, in each CcS/Dem Downward, J., Graves, J- and Cantrell, D. The regulation and functronstrain, we were able to define with considerable precision of p2lras in Tcells. Immunol Today 13:89-92, 1992those segments of its genome which originate from Funglan, R. J. A'' Ophoff, R. A.' Hart. A. A. M., and Demant, P.
BALB/c and those inherited from SrS/A rh'i; r"critui", f;:3_"iTt:L,TilXlll?j;#,,'$: l;il"j,;llept'�bilitv in the
the future mapping of those genes responsible for the Gajewski, T. F., Schell, S. G., and Fitch. F. W. Evidence implicatingobserved phenotypic differences, using the strategy pre- utilization of different T cell receptor-associated signaling path-viously applied to analysis of susceptibility to colon tumors ^...yuY: by THI and TH2 clones. -/ Intntunol 111: 4110-4120, 1990
(Moen ei al. 1992) and to radiation-induced Gillis' M', Ferm, M. M.' ou, w., and Smith. K. A. T-cell growth factor:
thymus (Mori and co-workers, in press). tr":"oJnilt 'r-,m:::lli}:':;;;:i#liffi;;';ii"'i*""i'iv}"iu.,iiui'vexperiment involving a backcross between the high- and Groot, P. C., Moen, C. J. A., Dietrich, W., Store. J. P.. Lander, E. S.,low-responder RC strains to anti-CD3 stimulation CcS-9 and Demant, P. The recombinant congenic strains tbr analysis of
and CcS-lI, a significant association between .the
Fcgr2 ingt*""tt
traits: genetic composition' FASEB J 6: 1816-2835,
genotype and responsiveness was found, indicating consis- C.ooi,-p. C., Moen, C. J. A., Hart, A. A. M., Snoek, M., and Demant. ptency of the mapping with the earlier data (Tax et al. 1983; Recombinanr congenic srrains: generic composition. 1n M. F. LlonHibbs et al. 1985). In addition, a novel locus influencing the and A. G. Searle (eds.): Genetic uariants and Strains of theproliferative response to the CD3 antibody rur -upp.Jto u !!:,:*,
Mouse, Third Edition, oxford University Press, ox-
iegion on chromosome 10, close to Dl(iMft\4.1{:"1:r:t #::Vlp5leurt, p M., and McKenzie, r. F. c. rhe mouse Ly_r7of the low-responder RC strains do not carry an SZS allete locus identifies a polymorphism of the Fc receptor. Immunose-atthe Fcgr2 or the Dl1Mitl4locus (CcS-2, -6, -8, -18, -20), netics 22: 33s-348, 1985they are likely to carry low-responder alleles at other loci Holii, .V., Lipoldovri, M., Tak6d, M., Cernd, J., Vancatovd, A.,controlling the anti-cD3 respbnse. These loci can be :t"*tu'
D', veselskj' L', and Haiek, M' Establishment and
mapped in appropriare crosses or these RC ';;'. ;;";; ;:::ii'J.','r?i:: ,{, ^,;;n:i:::;:'lil':;rll"ducing an antigen
data show that the sensitivity of the RCS approach com- Huang. L. and Crispe. N. Superantigen-driven peripheral deletion ofbined with the mult i locus mapping analysis al lows the .Tcel ls. J Immunol l5l :1844* 1851. 1993
identification of multiple chromosomal regions involved Jenkrns. M. K. and Johnson. J. G. Molecules involved in T-cell
in the control or the anti-cD3 response, -a p."u"uiy ."" r,,,;::^,iil::tl;$:li ?,':l{fr::;'"*.ili 11t;'.?f,'o -",n"0 ,".also be applied to other immunological phenomena.
t:,t';i;r::";ilg'::Xt ji6?is-de"rived murine lymphocytes.
Acknowledgments The authors thank Mrs. Helena Havelkovd for Klein, G. O. and Taylor, B. A. Possible localization of genes unlinkedexpert technical assistance, Dr. K. Tomonari (MRC Clinical Research to the H-2 complex that control NK activity of BXD recombinantCentre, Harrow, U. K.), Dr. M. Nabholz (Swiss lnstitute for Experi- inbred strains. 1n E. Skamene (ed.): Genetic Control of Hostmental Cancer Research, Epalinges s/Lausanne, Switzerland.;, and Dr. Resistance to Infection and Malignancy, pp.757-162, Alan R.J. Borst (The Netherlands bancer Institute. Amsterdam. The Nether- Liss' Inc., New York, 1985lands) for anti-CD3 (Tomonari 1988), anti-CD25 (Lowenthal et al. Ledbetter, J. A. and Herzenberg, L. A. Xenogeneic monoclonal1985), and for FlTC-labelled anti-CD4 (Pierres et al. 1984) and anti- antibodies to mouse lymphoid differentiation antigens. ImmunolCD8 (Ledbetter and Herzenberg 1919) mAb, respectively. We also Rev 47: 63-90'1919thank Dr. J. Borst for many usJful suggestions duiing this work. We Linsley_, P. S., Brady, W, Grosmaire, L., Aruffo. A.. Damle, N. K., andthank Dr. A. Hekman for advice during the experiments and prepara- Ledbener, J. A. Binding of the B cell activation antigen 87 totion of the manuscript. We appreciatJ the discussions wlth proi. L. CD28 costimulates T cell proliferation and interleukin 2 mRNAAarden and Dr. H. Spits, and we thank Prof. A. Kruisbeek and Dr. P accumulation. J Exp Med 173:'721-730, 1991Ivanyi for critical reading of the manuscript. This work was supported Linsley, P S., Brady, W., Umes, M., Grosmaire, L. S., Damle, N. K.,by grant 55 26'7 of the Grant Agency of ihe Czech Academy-of Sci- and Ledbetter, J. A. CTLA-4 is a second receptor for the B cellences and by grant 310/9310211 of the Grant Agency of the Czech activation antigen B7.. J Ex4Med 174: 561-569,1991Republic to M. L. and grant of the Europein -ommunity nr. Lipoldov6, M., Zajbov6, A., Stddra, J., and Hol5n, V. ExogenousSCOI*CT890213 to P. D.
' interleukin-2 abrogate's differences in the proliferative responses toT cell mitogens among inbred strains of mice. Cell Immunol142: 177 -185. 1992

M. Lipoldovri et al.: Genetic dissection of prolif'erative response to IL-2 and anti-CD3
Minami. Y., Kono, T., Miyazaki, T., and Taniguchi, T. The IL-2receptor complex: its structure functions. and target genes. AnnuRev Immuno l 1 l : 245 267 .1993
Miyajima, A., Kitamura, T.. Harada. N.. Yokota. T., and Arai, K.-LCytokine receptors and signal transduction. Annu Rev Immunol10 :295 -331 .1992
Moen, C. J. A. , van der \a lk. \ l - A. . Snoek, M., van Zutphen, L. F. M.,von Deimling. O.. Han. A. A. M.. and Demant, P. The recombinantcongenic strains: a no\el _senetic tool applied to the study ofcolontumor der elopmc'nt in the mouse. Mammalian Genome I : 211 -221 ,t 9 9 l
Moen. C. J. A. . Snrrk. \1. . Han, A. A. M., and Demant, P. Scc-1, ano\el .(rlr)n .ancer susceptibility gene in the mouse: linkage toCD-l- l , l , r - l -1. Pgp- l ) on chromosome 2. Oncogene 7:563-566,I 9e:
\ l r rn. \ . . Olumoro. M., van der Valk, M. A. , Imai , S. , Haga, S. , Esaki ,h . Han. A. A. M., and Demant, P Genetic dissection of.r\'cpribility to radiation-induced apoptosis of thymocytes andic'tcction of Rapop l: a novel susceptibiiity gene. Genomics, inf rc ' rr
Pctc'r\()n. V. M., Madonna, G. S., and Vogel, S. N. Differentialmlelopoietic responsiveness of BALB/c (Itys) and CD2 (Ityr)mice to lipopolysaccharide administration and Salmonella typhi-murium infection. Infect Immun 60: 1315-1384, 1992
Pierres, A., Naquet, P, van Agthoven, A., Bekkhoucha, F., Denizot, F.,Mishal, 2., Schmitrverhulst, A. M., and Pierres, M. A rat anti-mouse T4 monoclonal antibody (H129.19) inhibits the proliferationof la-reactive T-cell clones and delineates two phenotypicallydistinct (T4 + Lyt-2,3- and T4-Lyt-2,3+) subsets among anri-lacytolyt ic Tcel l clones. J Immunol 132:2776,2782,1984
Roberts. M.. Mock, B. A., and Blackwell, J. M. Mapping of genescontrolling Leishmania major infection in CXS recombinant inbredmice. Eur J Immunogenet 20: 349-362,1993
Sch*anz. R. H. Costimulation of T lymphocytes: The role of CD28,CTLA-4, and B7/BB I in interleukin-2 production and immunother-apy. Cell 71: 1065-1068, 1992
Tamura, T., Mizuguchi, J., and Nariuchi, H. Regulatory role of CD4lL3T4 molecules in IL-2 production by affecting intracellular Ca2+concenffation of T cell clone stimulated with soluble anti-CD3.J Immunol 145: '78-84. 1990
Tax, W. J. M., Willems, H. W., Reekers, P. P. M., Capel, P. J. A., andKoene, R. A. P. Polymorphism in mitogenic effect of IgGlmonoclonal antibodies against T3 antigen on human T cells.Nature 301: 445-447. 1983
Todd, J. A., Aitman, T. J., Cornall, R. J., Ghosh, S., Hall, J. R. S.,Hearne, C. M., Knight, A. M., Love, J. M., McAleer, M. A., Prins,J.-B., Rodrigues, N., Lathrop, M., Pressey, A., Delarato, N. H.,Peterson, L. B., and Wickers L. S. Genetic analysis of autoimmunetype 1 diabetes mell i tus in mice. Nature 351: 542,547,l99l
Tomonari, K. A rat antibody against a structure functionally related tothe mouse T-cell receptor/T3 complex. Immunogenetics 28:4 5 5 - 4 5 8 . 1 9 8 8
Ullman, K. S., Northrop, J. P, Verweij, C. L., and Crabtree, G. R.Transmission of signals from the T lymphocyte antigen receptor tothe genes responsible for cell proliferation and immune function:the missing link. Annu Rev Immunol 8: 421 -452, 1990
Wang, R., Murphy, K. M., Loh, D. Y., Weaver, C., and Russell, J. H.Differential activation of antigen-stimulated suicide and cytokineproduction pathways in CD4* T cells is regulated by the antigen-presenting cell. J Immunol 150: 3832-3842,1993
Wegener, A.-M. K., Letoumer, F., Hoeveler, A., Brocker, T., Luton, F.,and Malisen, B. The T cell receptor/complex is composed of atleast two autonomous transduction modules. Cell 68: 83-95,1992
Wicker, L. S., Appel, M. C., Dotta, F., Pressey, A., Miller, B. J.,Delarato, N. H., Fischer, P A., Boltz Jr., R. C., and Peterson, L. B.Autoimmune syndromes in major histocompatibility complex(MHC) congenic strains of nonobese diabetic (NOD) mice. TheNOD MHC is dominant for insulitis and cyclophosphamide-induced diabetes. J Exp Med 176: 61 -17, 1992
Wysocki, L. J. and Sato, V. L. Panning for lymphocytes: a method forcell selection. Proc Natl Acad Sci USA 75: 2844-2848, 1918
311
Copyright © 2022 FDOKUMEN