Diallel analysis for fruit traits among tomato recombinant inbred lines derived 21 from an...
85
Appl Hort ISSN 0972-1045 THE SOCIETY FOR ADVANCEMENT OF HORTICULTURE Journal of Vol. 12, No. 1, January-June, 2010
-
Upload
independent -
Category
Documents
-
view
1 -
download
0
Transcript of Diallel analysis for fruit traits among tomato recombinant inbred lines derived 21 from an...
Appl Hort
ISSN 0972-1045
THE SOCIETY FOR ADVANCEMENT OF HORTICULTURE
Journal of
Vol. 12, No. 1, January-June, 2010
Specimen Copy: Not for sale
JOURNAL OF APPLIED HORTICULTUREVol. 12, No. 1, January-June, 2010
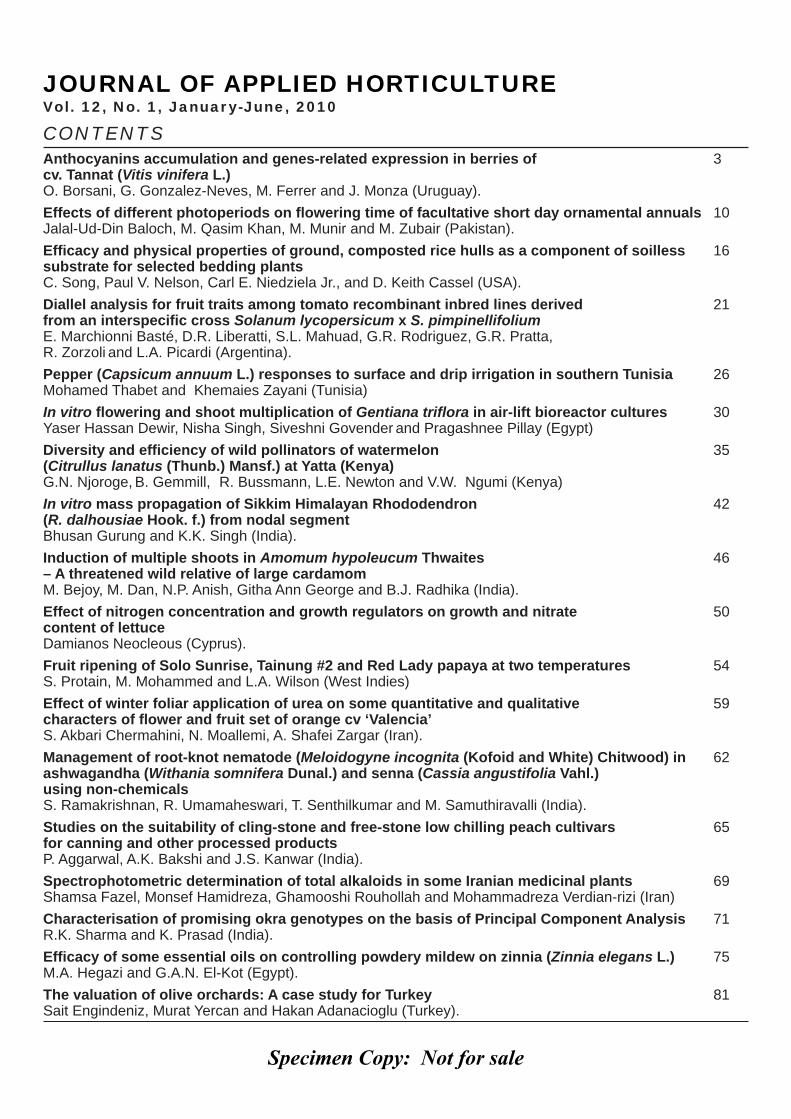
CONTENTSAnthocyanins accumulation and genes-related expression in berries of 3cv. Tannat (Vitis vinifera L.) O. Borsani, G. Gonzalez-Neves, M. Ferrer and J. Monza (Uruguay).Effects of different photoperiods on fl owering time of facultative short day ornamental annuals 10Jalal-Ud-Din Baloch, M. Qasim Khan, M. Munir and M. Zubair (Pakistan).Effi cacy and physical properties of ground, composted rice hulls as a component of soilless 16 substrate for selected bedding plants C. Song, Paul V. Nelson, Carl E. Niedziela Jr., and D. Keith Cassel (USA).Diallel analysis for fruit traits among tomato recombinant inbred lines derived 21from an interspecifi c cross Solanum lycopersicum x S. pimpinellifolium E. Marchionni Basté, D.R. Liberatti, S.L. Mahuad, G.R. Rodriguez, G.R. Pratta, R. Zorzoli and L.A. Picardi (Argentina).Pepper (Capsicum annuum L.) responses to surface and drip irrigation in southern Tunisia 26Mohamed Thabet and Khemaies Zayani (Tunisia)In vitro fl owering and shoot multiplication of Gentiana trifl ora in air-lift bioreactor cultures 30Yaser Hassan Dewir, Nisha Singh, Siveshni Govender and Pragashnee Pillay (Egypt)Diversity and effi ciency of wild pollinators of watermelon 35(Citrullus lanatus (Thunb.) Mansf.) at Yatta (Kenya) G.N. Njoroge, B. Gemmill, R. Bussmann, L.E. Newton and V.W. Ngumi (Kenya)In vitro mass propagation of Sikkim Himalayan Rhododendron 42(R. dalhousiae Hook. f.) from nodal segment Bhusan Gurung and K.K. Singh (India).Induction of multiple shoots in Amomum hypoleucum Thwaites 46– A threatened wild relative of large cardamom M. Bejoy, M. Dan, N.P. Anish, Githa Ann George and B.J. Radhika (India).Effect of nitrogen concentration and growth regulators on growth and nitrate 50content of lettuce Damianos Neocleous (Cyprus).Fruit ripening of Solo Sunrise, Tainung #2 and Red Lady papaya at two temperatures 54S. Protain, M. Mohammed and L.A. Wilson (West Indies)Effect of winter foliar application of urea on some quantitative and qualitative 59characters of fl ower and fruit set of orange cv ‘Valencia’ S. Akbari Chermahini, N. Moallemi, A. Shafei Zargar (Iran).Management of root-knot nematode (Meloidogyne incognita (Kofoid and White) Chitwood) in 62ashwagandha (Withania somnifera Dunal.) and senna (Cassia angustifolia Vahl.) using non-chemicalsS. Ramakrishnan, R. Umamaheswari, T. Senthilkumar and M. Samuthiravalli (India).Studies on the suitability of cling-stone and free-stone low chilling peach cultivars 65for canning and other processed products P. Aggarwal, A.K. Bakshi and J.S. Kanwar (India).Spectrophotometric determination of total alkaloids in some Iranian medicinal plants 69Shamsa Fazel, Monsef Hamidreza, Ghamooshi Rouhollah and Mohammadreza Verdian-rizi (Iran)Characterisation of promising okra genotypes on the basis of Principal Component Analysis 71R.K. Sharma and K. Prasad (India).Effi cacy of some essential oils on controlling powdery mildew on zinnia (Zinnia elegans L.) 75M.A. Hegazi and G.A.N. El-Kot (Egypt).The valuation of olive orchards: A case study for Turkey 81Sait Engindeniz, Murat Yercan and Hakan Adanacioglu (Turkey).
Specimen Copy: Not for sale
Forthcoming Papers
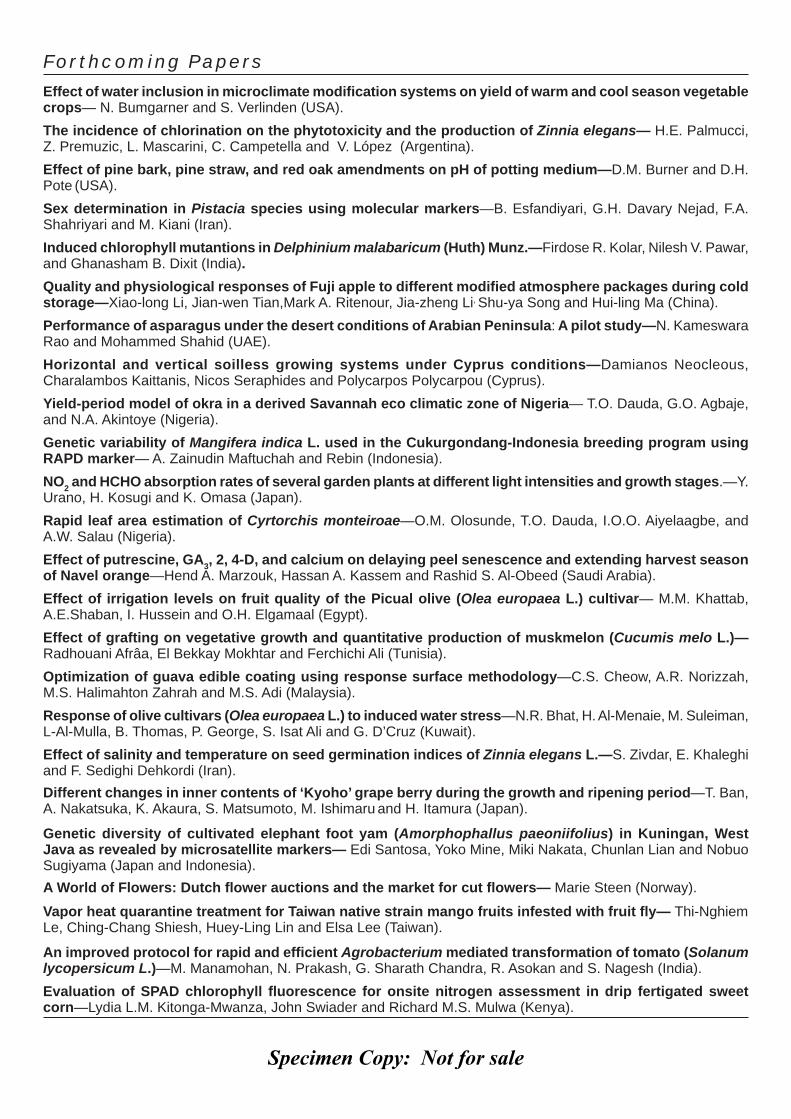
Effect of water inclusion in microclimate modifi cation systems on yield of warm and cool season vegetable crops— N. Bumgarner and S. Verlinden (USA).The incidence of chlorination on the phytotoxicity and the production of Zinnia elegans— H.E. Palmucci, Z. Premuzic, L. Mascarini, C. Campetella and V. López (Argentina).Effect of pine bark, pine straw, and red oak amendments on pH of potting medium—D.M. Burner and D.H. Pote (USA).Sex determination in Pistacia species using molecular markers—B. Esfandiyari, G.H. Davary Nejad, F.A. Shahriyari and M. Kiani (Iran).Induced chlorophyll mutantions in Delphinium malabaricum (Huth) Munz.—Firdose R. Kolar, Nilesh V. Pawar, and Ghanasham B. Dixit (India).Quality and physiological responses of Fuji apple to different modifi ed atmosphere packages during cold storage—Xiao-long Li, Jian-wen Tian,Mark A. Ritenour, Jia-zheng Li, Shu-ya Song and Hui-ling Ma (China).Performance of asparagus under the desert conditions of Arabian Peninsula: A pilot study—N. Kameswara Rao and Mohammed Shahid (UAE).Horizontal and vertical soilless growing systems under Cyprus conditions—Damianos Neocleous, Charalambos Kaittanis, Nicos Seraphides and Polycarpos Polycarpou (Cyprus).Yield-period model of okra in a derived Savannah eco climatic zone of Nigeria— T.O. Dauda, G.O. Agbaje, and N.A. Akintoye (Nigeria).Genetic variability of Mangifera indica L. used in the Cukurgondang-Indonesia breeding program using RAPD marker— A. Zainudin Maftuchah and Rebin (Indonesia).NO2 and HCHO absorption rates of several garden plants at different light intensities and growth stages.—Y. Urano, H. Kosugi and K. Omasa (Japan).Rapid leaf area estimation of Cyrtorchis monteiroae—O.M. Olosunde, T.O. Dauda, I.O.O. Aiyelaagbe, and A.W. Salau (Nigeria).Effect of putrescine, GA3, 2, 4-D, and calcium on delaying peel senescence and extending harvest season of Navel orange—Hend A. Marzouk, Hassan A. Kassem and Rashid S. Al-Obeed (Saudi Arabia).Effect of irrigation levels on fruit quality of the Picual olive (Olea europaea L.) cultivar— M.M. Khattab, A.E.Shaban, I. Hussein and O.H. Elgamaal (Egypt).Effect of grafting on vegetative growth and quantitative production of muskmelon (Cucumis melo L.)—Radhouani Afrâa, El Bekkay Mokhtar and Ferchichi Ali (Tunisia).Optimization of guava edible coating using response surface methodology—C.S. Cheow, A.R. Norizzah, M.S. Halimahton Zahrah and M.S. Adi (Malaysia).Response of olive cultivars (Olea europaea L.) to induced water stress—N.R. Bhat, H. Al-Menaie, M. Suleiman, L-Al-Mulla, B. Thomas, P. George, S. Isat Ali and G. D’Cruz (Kuwait).Effect of salinity and temperature on seed germination indices of Zinnia elegans L.—S. Zivdar, E. Khaleghi and F. Sedighi Dehkordi (Iran).Different changes in inner contents of ‘Kyoho’ grape berry during the growth and ripening period—T. Ban, A. Nakatsuka, K. Akaura, S. Matsumoto, M. Ishimaru and H. Itamura (Japan).
Genetic diversity of cultivated elephant foot yam (Amorphophallus paeoniifolius) in Kuningan, West Java as revealed by microsatellite markers— Edi Santosa, Yoko Mine, Miki Nakata, Chunlan Lian and Nobuo Sugiyama (Japan and Indonesia).A World of Flowers: Dutch fl ower auctions and the market for cut fl owers— Marie Steen (Norway).
Vapor heat quarantine treatment for Taiwan native strain mango fruits infested with fruit fl y— Thi-Nghiem Le, Ching-Chang Shiesh, Huey-Ling Lin and Elsa Lee (Taiwan).
An improved protocol for rapid and effi cient Agrobacterium mediated transformation of tomato (Solanum lycopersicum L.)—M. Manamohan, N. Prakash, G. Sharath Chandra, R. Asokan and S. Nagesh (India).Evaluation of SPAD chlorophyll fl uorescence for onsite nitrogen assessment in drip fertigated sweet corn—Lydia L.M. Kitonga-Mwanza, John Swiader and Richard M.S. Mulwa (Kenya).
Specimen Copy: Not for sale
Journal of Applied Horticulture, 12(1): 3-9, January-June, 2010
Anthocyanins accumulation and genes-related expression in berries of cv. Tannat (Vitis vinifera L.)
O. Borsani1*, G. Gonzalez-Neves2,3, M. Ferrer2 and J. Monza1
1Laboratorios de Bioquímica and 2Viticultura – Enología, Facultad de Agronomía, Avda. Garzón 780 CP 12900. Montevideo, Uruguay, 3Instituto Nacional de Vitivinicultura, Dr. Pouey 463. Las Piedras, Uruguay. *E-mail: [email protected]
Abstract
Anthocyanins accumulation and gene expression in berries of Vitis vinifera L. cv. Tannat trained in Lyre system was investigated. Expression of genes involved in anthocyanins biosynthetic pathway as chalcone synthase (CHS), fl avonoid 3-hydroxylase (F3H), dihydrofl avonol 4- reductase (DFR), and UDP-glucose fl avonoid-3-O- glucosyl transferase (UFGT) was examined. On the other hand, the infl uence of plant architecture, Lyre and vertical shoot positioned (VSP) trellis systems, on anthocyanins accumulation and gene expression was also analyzed. Final contents of total anthocyanins were not affected by trellis systems but varied in two years with different water defi cit imposition period. However, the individual profi le of the genes and anthocyanidins modifi ed according to the moment of water defi cit imposition (veraison or harvest) and by the trellis systems (Lyre or VSP). Analysis of gene expression in Lyre along the berry development period showed that low leaf water potentials after veraison cause an earlier and greater induction compared with expression in a year with low leaf water potential at harvest. At harvest, the hydric defi cit induced an increase in the expression of CHS, F3H and DFR genes and a higher total anthocyanins content. The study revealed that plant architecture affect the expression of anthocyanins related gene in berries possibly by modifying the canopy microclimate.
Key words: Anthocyanins, anthocyanidins, berries, hydric defi cit, Lyre, plant architecture, raisin, transcripts profi le, Tannat, veraison, Vitis vinifera L.
Introduction Polyphenols are the main components involved in the colouration of grapes and provide the gustative characteristics. Given the inquisitiveness of humans and the importance of wine colour, fl avour, and astringency, the management of phenolic compounds is becoming important (Conde et al., 2007). Phenolic compounds of the grape are divided in fl avonoids and non- fl avonoids groups. Flavonoids include the anthocyanins that are responsible for the characteristic red, blue, and purple colour of plant tissues. Anthocyanins play an important role in plant reproduction and also in protection from different stresses, including photo-oxidative stress (Winkel-Shirley, 2002).
In grapes, the berry skin accumulates anthocyanins and the relative abundance is determined by the cultivars and also strongly infl uenced by the environmental conditions under which the vines are cultivated (Keller et al., 2004; 2005). Drought, temperature and light are the main factors affecting the anthocyanins biosynthesis in grape fruits (Spayd et al., 2002; Castellarin et al., 2007a). The expression of the anthocyanin biosynthetic genes is induced by low temperature and repressed by high temperature in various plant species (Dela et al., 2003; Lo Piero et al., 2005; Ubi et al., 2006).
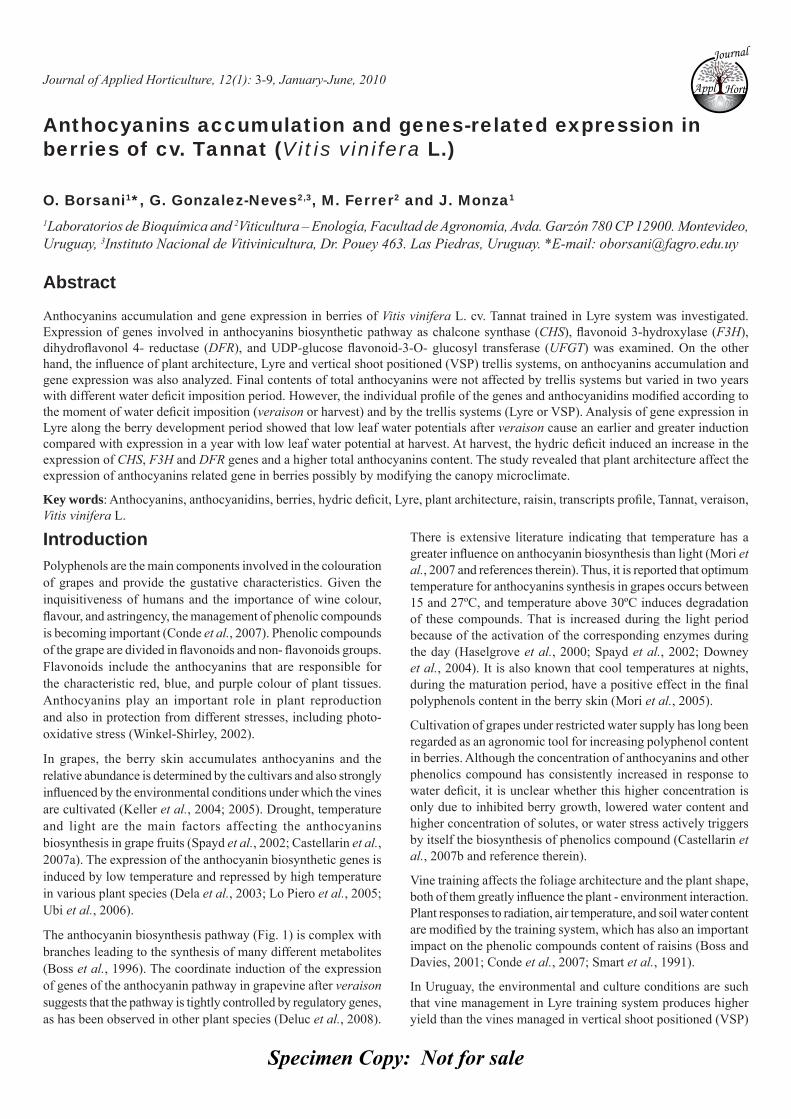
The anthocyanin biosynthesis pathway (Fig. 1) is complex with branches leading to the synthesis of many different metabolites (Boss et al., 1996). The coordinate induction of the expression of genes of the anthocyanin pathway in grapevine after veraison suggests that the pathway is tightly controlled by regulatory genes, as has been observed in other plant species (Deluc et al., 2008).
There is extensive literature indicating that temperature has a greater infl uence on anthocyanin biosynthesis than light (Mori et al., 2007 and references therein). Thus, it is reported that optimum temperature for anthocyanins synthesis in grapes occurs between 15 and 27ºC, and temperature above 30ºC induces degradation of these compounds. That is increased during the light period because of the activation of the corresponding enzymes during the day (Haselgrove et al., 2000; Spayd et al., 2002; Downey et al., 2004). It is also known that cool temperatures at nights, during the maturation period, have a positive effect in the fi nal polyphenols content in the berry skin (Mori et al., 2005).
Cultivation of grapes under restricted water supply has long been regarded as an agronomic tool for increasing polyphenol content in berries. Although the concentration of anthocyanins and other phenolics compound has consistently increased in response to water defi cit, it is unclear whether this higher concentration is only due to inhibited berry growth, lowered water content and higher concentration of solutes, or water stress actively triggers by itself the biosynthesis of phenolics compound (Castellarin et al., 2007b and reference therein).
Vine training affects the foliage architecture and the plant shape, both of them greatly infl uence the plant - environment interaction. Plant responses to radiation, air temperature, and soil water content are modifi ed by the training system, which has also an important impact on the phenolic compounds content of raisins (Boss and Davies, 2001; Conde et al., 2007; Smart et al., 1991).
In Uruguay, the environmental and culture conditions are such that vine management in Lyre training system produces higher yield than the vines managed in vertical shoot positioned (VSP)
Journal
Appl
Specimen Copy: Not for sale
trellis system, without decrease in the enological quality of the berries (González-Neves, 2005). Berries of Tannat, the main black - red Vitis vinifera in Uruguay, have higher total anthocyanins content than Cabernet Sauvignon and Merlot (González-Neves et al., 2004, 2007).
In the present investigation, fruit anthocyanins accumulation in grapevine (V. vinifera L) cv. Tannat and the expression of anthocyanins biosynthesis-related genes in a vineyard trained in Lyre and VSP system was studied.
Material and methodsField plots and physiological measurements: Field experiments were conducted in commercial vineyards localized in the main viticulture region (Canelones; 34º 35´ S, 56º 15´ W; Uruguay), with a climatic condition classifi ed as ISA1IHA4 IFA2 (climate moderated drougth, template warm. Vineyards of V. vinifera cv. Tannat were trained in Lyre and VSP trellis systems, the agronomic information about the vineyards is shown in Table 1.
Leaf water potential (LWP) was monitored by pressure chamber technique (Scholander et al., 1965). Twenty adult, fresh and healthy leaves around the raisin (10 from east side, 10 from west side) were selected to perform the water potential measurements at fl owering, veraison and harvest period. Measurements conducted at sunrise were scored as basal water potential.
Phenological stages scored from bud break were performed as proposed by Eichhorn and Lorenz (1977).
Grape samples: Samples of berries were taken from veraison until the harvest time, using the method described by Carbonneau et al. (1991), and sampling fractions of bunches in the middle zone of the spurs. Each fraction of the bunch had 3 to 5 berries randomly selected from the upper and lower parts of bunches, until 250 berries were collected. Samples were taken twice from each vineyard.
Fresh grape analysis: The harvest took place at the “technological maturity”, according to the relationships between sugars, total acidity and pH, that were analysed according to O.I.V. (2007).
Berries were weighed and crushed in a mortar in order to remove the skins, seeds and pulp. The skins and seeds were rinsed and separated from the pulp, dried afterwards with fi lter paper and weighed. Skins were frozen and kept at -80°C until their analyses.
Grape extract analysis: In order to determine the total content of anthocyanins, macerations at pH 1 were carried out according to the methodology proposed by Glories and Augustin (1993). The anthocyanins contents of the grape extracts were determined according to Ribéreau-Gayon and Stonestreet (1965), and were calculated according to González-Neves (2005). All measurements were performed twice.
Anthocyanins profi les: The frozen skins from the samples of grapes were macerated in a 12% (v/v) ethanol pH 3.2 solution. The volume of the solution was calculated according to González-Neves (2005), in a ratio 1:1 to the volume of the must. Macerations were carried out using the skins of 50 berries, with two replications per sample of grapes.
The anthocyanins contents of the extracts were determined by HPLC according to Revilla et al. (2001). The extracts were previously fi ltered with a 0.45 μm membrane. A chromatographic system equipped with two pumps (Waters 510 and 515), a Rheodyne 7725i injector, a detector UV-VIS (Waters model 490E) with measurements at 313 and 530 nm, and a C18 column (Phenomenex Luna) (150 x 4.6 mm) of 5 μm (Waters Corp. USA) was used. Gradient conditions were carried out using two solvents. Solvent A: water-formic acid (90:10), solvent B: methanol-water-formic acid (45:45:10). Flow: 0.8 mL/min. Gradient: 35 to 95% of solvent B in 20 min, 95 to 100% of solvent B in 5 min, and isocratic with 100% of solvent B during 5 min.
Anthocyanins were identifi ed taking into account the retention time of each peak and their relationship with the peak corresponding to malvidin-3-glucoside. The concentration of the 3-glucosides of delphinidin, cyanidin, malvidin, petunidin and peonidin were calculated considering a calibration curve with malvidin-3- glucoside chloride (Extrasynthèse, France).
Gene expression analysis: A subsample of berries from the same sampling for anthocyanins analysis was used for extracting the
Age (years) Rootstock Distance (m) Density (plants ha-1) Trellis system Training
19 SO4 3.20 x 0.90 3472 Lyre Cordon Royat
21 SO4 2.30 x 1.25 3478 VSP Cordon Royat
Table 1. Characterstics of selected vineyards
Fig. 1. A simplifi ed diagram of anthocyanin biosynthesis pathway. Arrowheads indicate the gene coding for the enzymes analyzed in this study.
4 Anthocyanins accumulation and genes-related expression in berries of cv. Tannat (Vitis vinifera L.)
Specimen Copy: Not for sale
RNA. Total RNA was extracted from berry skin following the procedure described by Chang et al. (1993). Ten μg of total RNA extracted from different sampling dates were resolved in agarose (1.2 % w/v) under denaturing conditions and then transferred to a nylon membrane (Hybond N+). Gene expression was analyzed by RNA blot analysis using 32P-ATP labeling (Amersham Pharmacia) of cDNA sequence from fl avonoid 3-hydroxylase (F3H), chalcone synthase (CHS), dihydrofl avonol reductase (DFR), and UDP-glucoflavonoid 3-o-glucosyl transferase (UFGT) (Sparvoli et al., 1994).
Filters were exposed to X-ray fi lm and the images were scanned in order to perform the image analysis (Image J 1.39 analysis software free access in http://rsb.info.ncb.gov/ij/). Relative expression was plotted using the comparison with the expression of a constitutive expressed gene (accession number BN000705; Bogs et al., 2005).
Statistical analyses: Differences between the treatments were tested for signifi cance using the Statgraphics Plus package 4.1 (Statgraphics Corp., USA) and SAS/Stat Software Release 8.2 (S.A.S. Corp., USA). Means were separated by Tukey test.
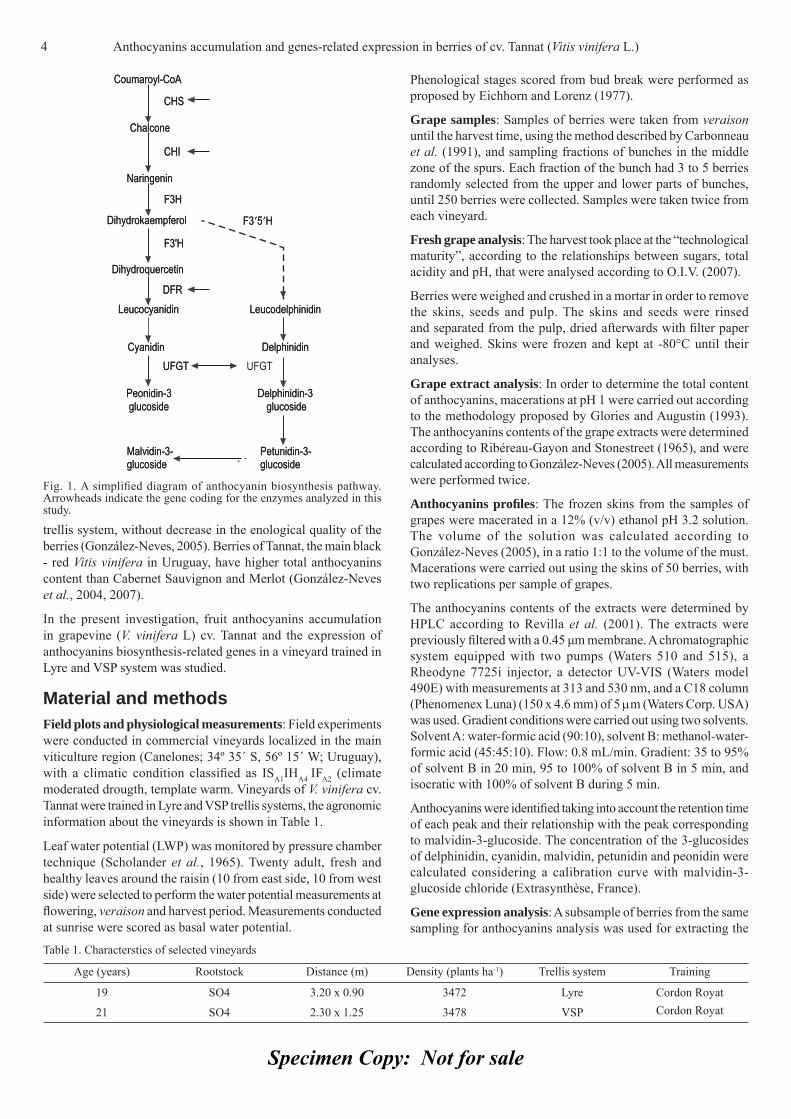
Results Anthocyanins accumulation and individual anthocyanidins profi le in Lyre: When total anthocyanins content of grape extracts at pH 1 were compared in two years analyzed, a difference at harvest date was observed (Fig. 2A). The evolution of the contents of the main individual anthocyanidins was quantifi ed by HPLC in the extracts (pH 3.2) from the skins (Fig. 2 B and C). The main anthocyanidins in the two years was the malvidin-3-glucoside, which reached at the same relative amount 28 DAV. The relative amount of malvidin in the year 1 was signifi cantly higher than year 2 between 7 and 21 DAV (Fig. 2 B).
In general trisubstituted molecules (delphinidin, petunidin and malvidin) were predominant over the bisubstituted molecules (peonidin and cyanidin) (Fig. 2 C). In year 1 the relative content of malvidin increased during the ripening process, whereas the relative contents of the cyanidins and peonidins decreased in the same period (Fig. 2 B and C). During the year 2 a decrease of malvidin was detected from 21 to 35 DAV, and in the same period an increase of delphinidin was observed (Fig. 2 B and C).
Leaf water potential and anthocyanins-related gene expression: Values lower than -1 MPa in leaf water potential (LWP) were detected in the vineyards during verasion and near harvest periods in the year 1 and 2 respectively (Fig 3).
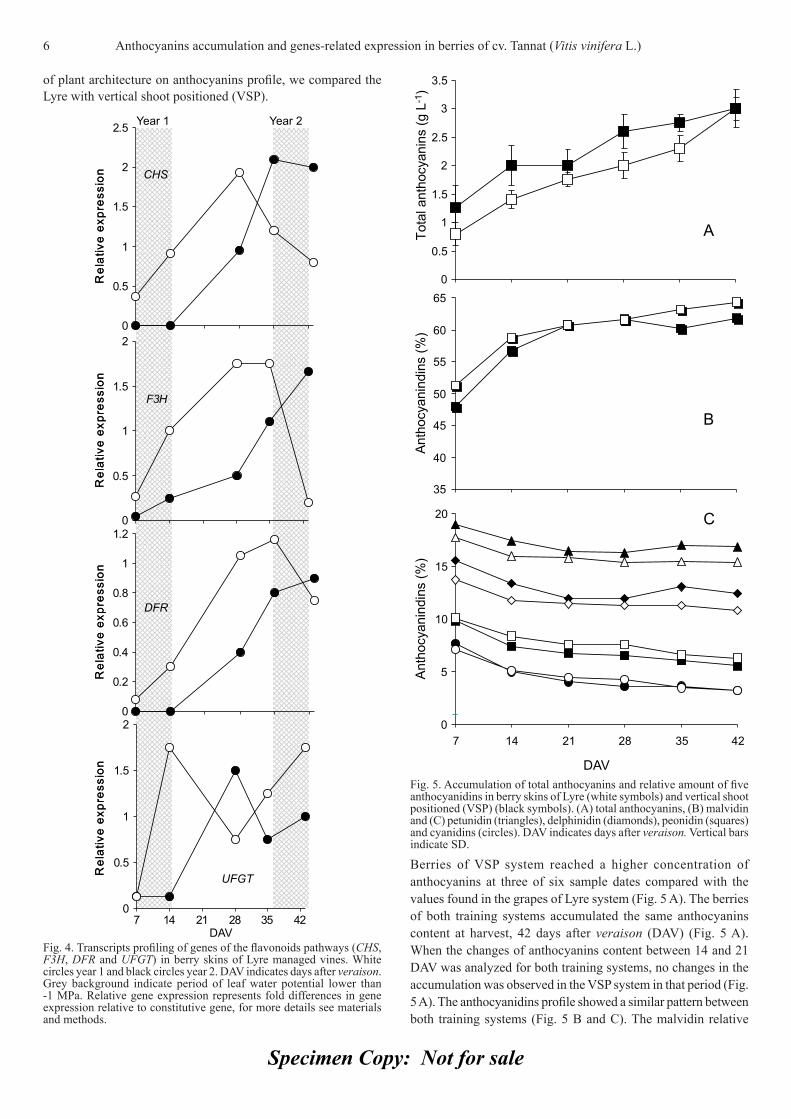
Analysis of gene expression was performed in order to analyze the relationship between the genes expression of anthocyanins pathway and the low leaf water potential. When levels of transcripts of the four genes studied were compared in two years, one of them with hydric defi cit during veraison (year 1) and the other with hydric defi cit during harvest (year 2), a great difference in the expression profi les was observed (Fig. 4).
The low LWP in year 1 during the veraison induced an earlier expression of all genes studied (Fig. 4). However, in year 2, low LWP during the last days of berries ripening process, near the harvest time, was related with a higher expression of CHS, F3H
and DFR in the last sampling date compared with the same date of year 1 (Fig. 4).
In case of the UFGT, the expression pattern was the same in both years but a delay of 15 days was observed when no hydric defi cit occurred during the veraison.
Anthocyanins accumulation and individual anthocyanidins profi le in two trellis systems: In order to analyze the infl uence
Fig. 2. Accumulation of total anthocyanins and relative amount of fi ve anthocyanidins in berry of Lyre vines. White symbols year 1 and black symbol year 2. (A) total anthocyanins, (B) malvidin and (C) petunidin (triangles), delphinidin (diamonds), peonidin (squares) and cyanidins (circles). DAV indicates days after veraison. Vertical bars indicate SD.
Fig. 3. Leaf water potential (LWP) in three stage of berry development (fl owering-fruit setting, veraison and harvest) in Lyre managed vine. White bars year 1 and black bars year 2. Asterisk indicates differential signifi cance P ≤ 0.05.
**
Anthocyanins accumulation and genes-related expression in berries of cv. Tannat (Vitis vinifera L.) 5
Specimen Copy: Not for sale
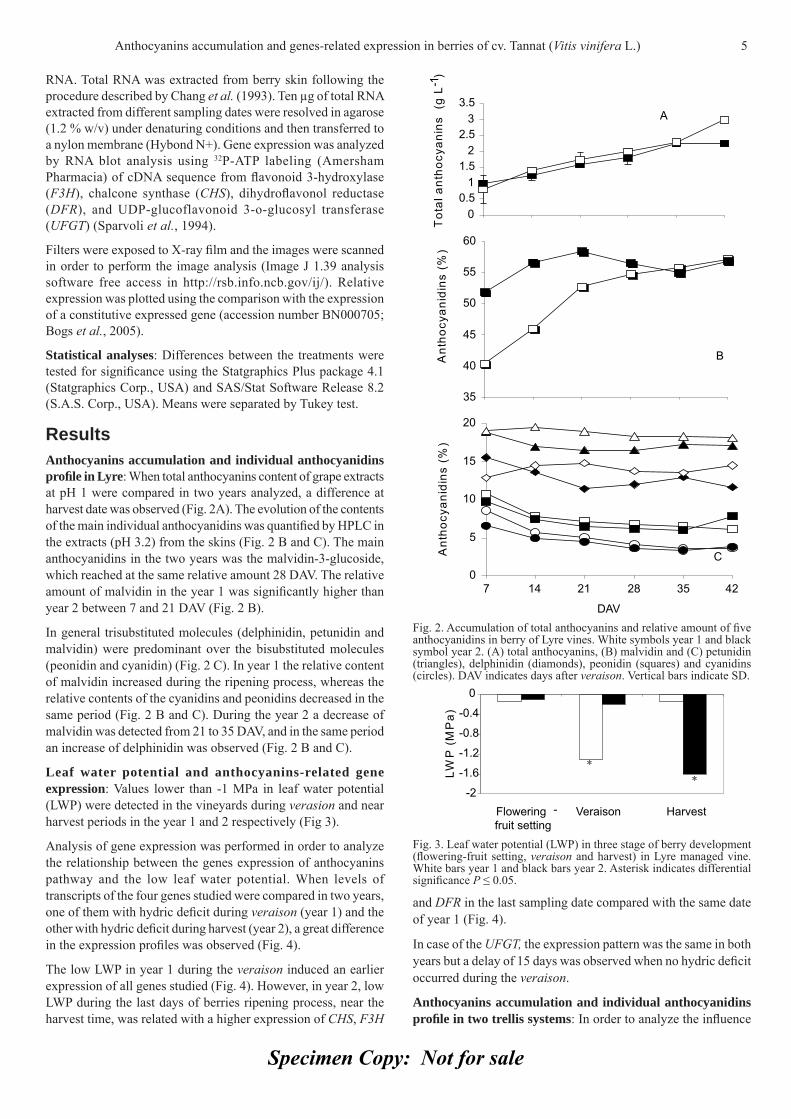
Berries of VSP system reached a higher concentration of anthocyanins at three of six sample dates compared with the values found in the grapes of Lyre system (Fig. 5 A). The berries of both training systems accumulated the same anthocyanins content at harvest, 42 days after veraison (DAV) (Fig. 5 A). When the changes of anthocyanins content between 14 and 21 DAV was analyzed for both training systems, no changes in the accumulation was observed in the VSP system in that period (Fig. 5 A). The anthocyanidins profi le showed a similar pattern between both training systems (Fig. 5 B and C). The malvidin relative
Fig. 5. Accumulation of total anthocyanins and relative amount of fi ve anthocyanidins in berry skins of Lyre (white symbols) and vertical shoot positioned (VSP) (black symbols). (A) total anthocyanins, (B) malvidin and (C) petunidin (triangles), delphinidin (diamonds), peonidin (squares) and cyanidins (circles). DAV indicates days after veraison. Vertical bars indicate SD.
Fig. 4. Transcripts profi ling of genes of the fl avonoids pathways (CHS, F3H, DFR and UFGT) in berry skins of Lyre managed vines. White circles year 1 and black circles year 2. DAV indicates days after veraison. Grey background indicate period of leaf water potential lower than -1 MPa. Relative gene expression represents fold differences in gene expression relative to constitutive gene, for more details see materials and methods.
6 Anthocyanins accumulation and genes-related expression in berries of cv. Tannat (Vitis vinifera L.)
of plant architecture on anthocyanins profi le, we compared the Lyre with vertical shoot positioned (VSP).
Specimen Copy: Not for sale
content in 35 and 42 days was related negatively with petunidin and delphinidin relative contents in both training systems (Fig. 5B and C).
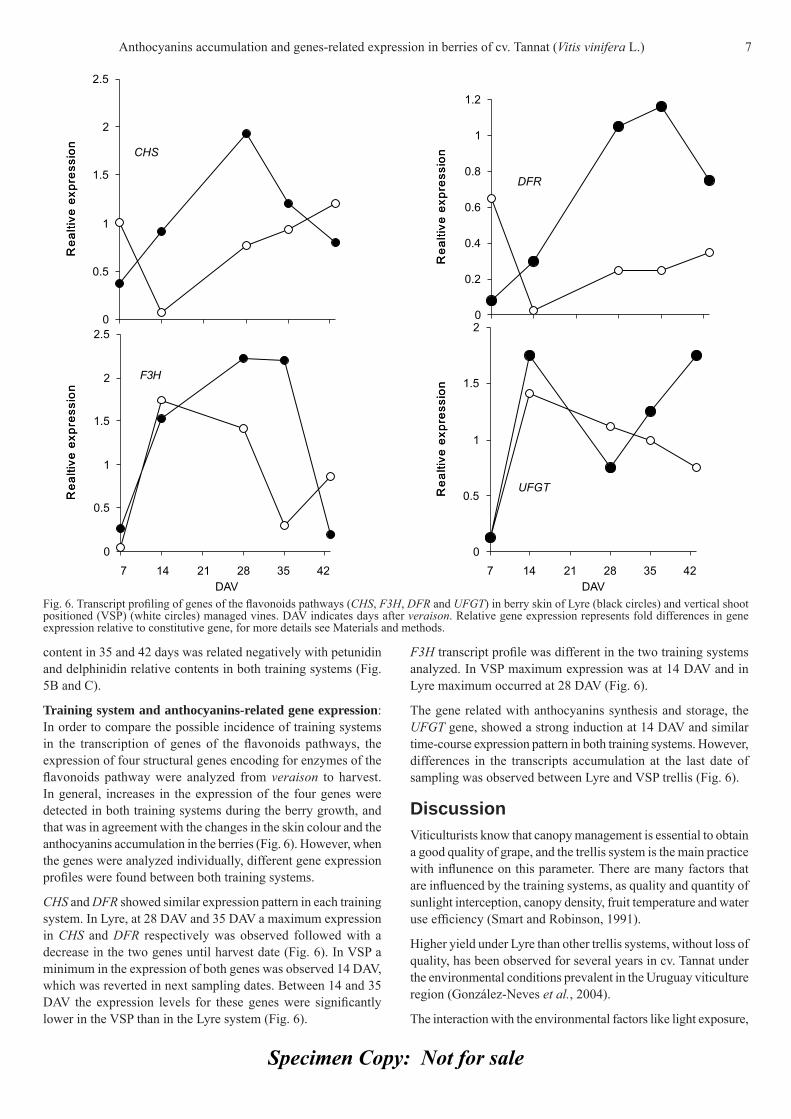
Training system and anthocyanins-related gene expression: In order to compare the possible incidence of training systems in the transcription of genes of the fl avonoids pathways, the expression of four structural genes encoding for enzymes of the fl avonoids pathway were analyzed from veraison to harvest. In general, increases in the expression of the four genes were detected in both training systems during the berry growth, and that was in agreement with the changes in the skin colour and the anthocyanins accumulation in the berries (Fig. 6). However, when the genes were analyzed individually, different gene expression profi les were found between both training systems.
CHS and DFR showed similar expression pattern in each training system. In Lyre, at 28 DAV and 35 DAV a maximum expression in CHS and DFR respectively was observed followed with a decrease in the two genes until harvest date (Fig. 6). In VSP a minimum in the expression of both genes was observed 14 DAV, which was reverted in next sampling dates. Between 14 and 35 DAV the expression levels for these genes were signifi cantly lower in the VSP than in the Lyre system (Fig. 6).
F3H transcript profi le was different in the two training systems analyzed. In VSP maximum expression was at 14 DAV and in Lyre maximum occurred at 28 DAV (Fig. 6).
The gene related with anthocyanins synthesis and storage, the UFGT gene, showed a strong induction at 14 DAV and similar time-course expression pattern in both training systems. However, differences in the transcripts accumulation at the last date of sampling was observed between Lyre and VSP trellis (Fig. 6).
Discussion Viticulturists know that canopy management is essential to obtain a good quality of grape, and the trellis system is the main practice with infl unence on this parameter. There are many factors that are infl uenced by the training systems, as quality and quantity of sunlight interception, canopy density, fruit temperature and water use effi ciency (Smart and Robinson, 1991).
Higher yield under Lyre than other trellis systems, without loss of quality, has been observed for several years in cv. Tannat under the environmental conditions prevalent in the Uruguay viticulture region (González-Neves et al., 2004).
The interaction with the environmental factors like light exposure,
Fig. 6. Transcript profi ling of genes of the fl avonoids pathways (CHS, F3H, DFR and UFGT) in berry skin of Lyre (black circles) and vertical shoot positioned (VSP) (white circles) managed vines. DAV indicates days after veraison. Relative gene expression represents fold differences in gene expression relative to constitutive gene, for more details see Materials and methods.
Anthocyanins accumulation and genes-related expression in berries of cv. Tannat (Vitis vinifera L.) 7
Specimen Copy: Not for sale
the water use availability, and temperature defi nes the ultimate composition of anthocyanins of the fruit. Many environmental factors affect the gene expression in the berry however the water defi cit during the berry ripening process is one the most important factor. There are three stages of the vine growth and development when drought could considerably affect the berry size and composition; these are at fl owering, at veraison and at harvest time (Keller et al., 2005; Ojeda, 2005; Roby et al., 2004).
Our study showed that total anthocyanins of berries of Tannat vines managed in Lyre were similar in both years of the study during the ripening process, but the content was different at harvest (Fig. 2 A). In the year 2 a hydric defi cit around harvest time (Fig. 3) could explain the higher anthocyanins content in this year than to year 1 (Fig. 2 A).
It has been reported that water defi cit stimulates hydroxylation and methoxylation of the fl avonoid B-ring, accelerates particularly tri-substitued anthocyanins biosynthesis, and also promotes the conversion of hydroxylated anthocyanins into their methoxylated derivatives (Castellarin et al., 2007b). The same study indicated similar consequences as results of early and late water defi cits, in transient expression pattern that favours trisubstitued anthocyanins accumulation. However, the malvidin proportions found in Tannat refl ects more the early hydric defi cit noted in the vines in the year 1, whereas petunidin and delphinidin proportions were increased in the grapes obtained in year 2 when the hydric defi cit occurred near the harvest (Fig. 2 B).
Taking in account the data obtained under hydric defi cit period (veraison or harvest) we could propose that a period of water defi cit close to veraison induce prematurely the expression of the genes involved in the anthocyanins pathways with the results of accumulation of these compounds in the berries (Fig. 2 and 4). Similar results were obtained when a fi eld experimental trail was carried out with two dates of water stress. In that study an early water defi cit accelerated sugar accumulation and the onset of anthocyanin synthesis after veraison (Casterllarin et al., 2007a).
On the other hand, when hydric defi cit period was close to harvest, a higher gene expression in the last stage of berry development was found with the exception of UFGT (Fig. 4). Our results indicate the gene expression profi le is affected by the hydric defi cit period, what could explain the increased accumulation of anthocyanins in the fi rst weeks after verasion and at harvest date. The water defi cit occurring in two different berry growth periods (veraison and harvest) modifi ed the expression profi le of the studied genes in Lyre training system. Water defi cit at veraison induces an earlier and higher expression of CHS, F3H, DFR, and UFGT genes than in years with a water defi cit at harvest.
In Uruguay, periods of high temperature during the summer are common, then the temperature must be considered when studying berry metabolism. On the other hand, it has been reported that anthocyanins accumulation is inhibited in the skins of black - red grapes in hot regions (Haselgrove et al., 2000; Spayd et al., 2002; Downey et al., 2004). We think that possibly a high temperature period (above 35º C) 14 DAV (data not shown) could be the cause of the different behavior between VSP and Lyres vines in anthocyanins accumulation.
Lyre training system could have higher capacity to maintain the
thermal homeostasis of the raisin, which is refl ected in a lower variation of the slope for the anthocyanins accumulation during ripening (Fig. 5).
A recent study has shown that CHS, DFR and UFGT expression are negatively affected by high temperatures and provided defi nitive evidence of anthocyanins loss in the skin of grape berries due to high temperature (Mori et al., 2007).
Individual analysis of the transcription of four genes in Lyre training and VSP trellis systems evidences a higher expression at 14 DAV of CHS, DFR and UFGT in Lyre (Fig. 6). Canopy architecture in VSP could be responsible of the higher raisin temperatures and inhibit of the anthocyanins pathway gene transcription mentioned above (Fig. 6). However, this explanation could not be applied to the F3H gene expression, since it showed similar level to Lyre (Fig. 6). A change in the gene expression pattern in different training systems is evidenced by the analysis of expression of fl avonoid pathway CHR, F3H, DFR and UFGT (Fig. 6).
Previous studies that monitored the temperature inside and outside of the Merlot showed lower values in Lyre compared with VSP trellis system (Ferrer, 2007), which related with the major anthocyanin accumulation found in the berries of Lyre (González-Neves, 2005).
Apart from the effect of temperature and light on anthocyanin accumulation, recent research also shows some shift in anthocyanin composition with temperature. The results indicate that in warm-climate the fruits would tend to have a higher proportion of malvidin, petunidin and delphinidin coumaroyl derivatives, while in cool-climate and shaded fruits would have more non-acylated glucosides and acetyl-glucosides of peonidin and cyanidin (Spayd et al., 2002). Our results showed that in both year and in both training systems the individual anthocyanidins profi le in berries of cv. Tannat was similar to those found in vines cultivated in warm-climate.
A future work related with raisin microclimate training system-dependence and gene expression will be useful to improve the understanding of environmental signals which determine the polyphenols content in the grapes.
Acknowledgments The authors thank Establecimiento Juanicó, Viñas Varela-Zarranz for kindly providing the vineyards for the study. This study was funded by FCE_8054. Authors want to dedicate this manuscript to Ing. Agr. Julio Omar Borsani Estevez (1934-2006) and Dr. Maria Fernanda Agius Guadalupe (1972-2005) for their invaluable collaboration and permanent encouragement for maintaining the excellence of the work.
ReferencesBogs, J., M.O. Downey, J.S. Harvey, A.R. Ashton, G.J. Tanner and S.P.
Robinson, 2005. Proanthocyanidin synthesis and expression of genes encoding leucoanthocyanidin reductase and anthocyanidin reductase in developing grape berries and grapevine leaves. Plant Physiol., 139: 652-663.
Boss P.K. and C. Davies, 2001. Molecular biology of sugar and anthocyanin accumulation in grape berries. In: Molecular Biology and Biotechnology of the Grapevine. (eds.). K.A. Roubelakis-Angelakis, Kluwer Academic Publishers, Dordrecht, The Netherlands. pp 1-33.
8 Anthocyanins accumulation and genes-related expression in berries of cv. Tannat (Vitis vinifera L.)

Specimen Copy: Not for sale
Boss, P., C. Davies and S. Robinson, 1996. Analysis of the expression of anthocyanin pathway genes in developing Vitis vinifera L. cv. Shiraz grape berries and the implication for pathway regulation. Plant Physiol., 111: 1059-1066.
Carbonneau, A., A.Moueix, N. Leclair and J. Renoux, 1991. Proposition d’une méthode de prélèvement de raisins à partir de l’analyse de l’hétérogéneité de maturation sur un cep. Bull. de l’OIV 727/728 679-690
Castellarin, S., M. Matthews, G. Di Gaspero and G. Gambeta, 2007a. Water deficit accelerate ripening and induce changes in gene expression regulating fl avonoid biosynthesis in grape berries. Planta, 227: 101-112.
Castellarin, S., A. Pfeiffer, P. Sivilotti, M. Degan, E. Peterlunger and G. Di Gaspero, 2007b. Transcriptional regulation of anthocyanin biosynthesis in ripening fruits of grapevine under seasonal water defi cit. Plant Cell Environ., 30: 1381-1399.
Chang, S., J. Puryear and J. Canrey, 1993. A simple method for isolating RNA from pine tree. Plant Mol. Biol. Rep., 11: 113-116.
Conde, C., P. Silva, N .Fontes, A. Díaz, R. Tavarez, M. Sousa, A. Agasse, S. Delrrot and H. Gerós, 2007. Biochemical change throughout grape berry development and fruit and wine quality. Food, 1: 1-22.
Dela, G., E. Or, R. Ovadia, A. Nissin – Levi, D. Weiss and M. Oren-Shamir, 2003. Changes in anthocyanin concentration and composition in Jaguar rose fl owers due to transient high temperature conditions. Plant Sci.,164: 333-340.
Deluc, L., J. Bogs, A.R. Walker, T. Ferrier, A. Decendit, J.M. Merillon, S.P. Robinson and F. Barrieu, 2008. The transcription factor VvMYB5b contributes to the regulation of anthocyanin and proanthocyanidin biosynthesis in developing grape berries. Plant Physiol., 147: 2041-2053.
Downey, M.O., J.S. Harvey and S.P. Robinson, 2004.The effect of bunch shading on berries development and fl avonoid accumulation in Shiraz grapes. Austral. J. Grape Wine Res., 10: 55-73.
Eichorn, K.W. and D.H. Lorenz, 1977. Phänologishche enwicklungsstadien der rebe. Nachrichtenbl. Dtsch. Pfl anzenschutzdienstes (Braunschweig), 29: 119-120.
Ferrer, M. 2007. Etude du climat des régions viticoles de l’Uruguay, des variations climatiques et de l’interaction apportée par le microclimat et l’écophysiologie des systèmes de conduite Espalier et Lyre sur Merlot. Ph.D. Diss., Ecole Nationale Supérieure Agronomique – Université de Montpellier II -France 2007. 360pp.
Glories, Y. and M. Augustin, 1993. Maturité phénolique du raisin, conséquences technologiques: application aux millésimes 1991 et 1992. C.R. Colloque Journée Techn. CIVB, Bordeaux pp. 56-61.
González-Neves, G., D. Charamelo, J. Balado, L. Barreiro, R. Bochicchio, G. Gatto, G. Gil, A. Tessore, A. Carbonneau and M. Moutounet, 2004. Phenolic potential of Tannat, Cabernet-Sauvignon and Merlot grapes and their correspondence with wine composition. Anal. Chim. Acta, 513: 191-196.
González Neves, G., 2005. Etude de la composition polyphénolique des raisins et de vins des cépages Merlot, Cabernet sauvignon et Tannat provenant de vignes conduites en lyre et en espalier dans le sud de l’Uruguay. Ph.D. Diss. ENSA Montpellier, 2005. 279pp.
González-Neves, G., J. Franco, L. Barreiro, G. Gil, M. Moutounet and A. Carbonneau, 2007. Varietal differentiation of Tannat, Cabernet sauvignon and Merlot grapes and wines according to their anthocyanic composition. Eur. Food Res. Tech., 225: 111-117.
Haselgrove, L., D. Botting, R.Van Heeswijck, P. B. Hoj, P. R. Dry, C. Ford and P. Iland, 2000. Canopy microclimate and berry composition: the effect of bunch exposure on the phenolic composition of Vitis vinifera L cv. Shiraz grape berries. Aust. J. Grape Wine Res., 6: 141-149.
Keller, M., L.J. Mills, R.L. Wample and S.E. Spayd, 2004. Crop load management in “Concord” grapes using different pruning techniques. Amer. J. Enol. and Vitcult., 55: 35-49.
Keller, M., L.J. Mills, R.L. Wample and S.E. Spayd, 2005. Cluster thinning effects on three defi cit- irrigated Vitis vinifera cultivars. Amer. J. Enol. Viticult., 56: 91-103.
Lo Piero, A.R., I. Puglisi, P. Rapisarda and G. Petrone, 2005. Anthocyanins accumulation and related gene expression in red orange fruit induced by low temperature storage. J. Agr. Food Chem., 53: 9083-9088.
Mori, K., N. Goto-Yamamotom, M. Kitayama and K. Hasizume, 2007. Loss of anthocyanins in red-wine grape under high temperature. J. Exp. Bot., 58: 1935-1945.
Mori, K., H. Saito, N. Goto-Yamamoto, M. Kitayama, S. Kobayashi, S. Sugaya, H. Gemma and K. Hashizume, 2005. Effects of abscisic acid treatment and night temperatures on anthocyanin composition in Pinot noir grapes. Vitis, 44: 161-165.
O.I.V., 2007. Récueil des méthodes internationales d’analyse des vins et des moûts. Offi ce International de la Vigne et du Vin. Paris, France.
Ojeda, H., N. Carrillo, L. Deis, B. Tisseyre, M. Heywang and A. Carbonneau, 2005. Precision viticulture and water status II: quantitative and qualitative performance of different within fi eld zones, defi ned from water potential mapping. C.R. XIV GESCO, 2: 741-748.
Revilla E., E. García-Beneytez, F. Cabello, G. Marti-Ortega and J.M. Ryan, 2001. Value of high-performance liquid chromatographic analysis of anthocyanins in the differentiation of red grape cultivars and red wines made from them. J. Chroma., 915: 53-60.
Ribereau-Gayon, P. and E. Stonestreet, 1965. Le dosage des anthocyanes dans le vins rouges. Bull. Soc. Chim., 9: 26-49.
Roby, G., J.F. Harbertson, D.A. Adams and M.A. Matthews, 2004. Berry size and vine water defi cits as factors in winegrape composition: anthocyanins and tannins. Aust. J. Grape Wine Res., 10: 100-107.
Scholander, P.F., H.T. Hammel, E.D. Bradstreet and E.A. Hemmingsen, 1965. Sap pressure in vascular plants. Science, 148: 339-346.
Smart, R.E. and M.D. Robinson, 1991. Sunlight into Wine: A Handbook for Winegrape Canopy Management. Winetitles, Adelaida, Australia.
Sparvoli, F., C. Martin, A. Scienza, G. Gavazzi and C. Tonelli, 1994. Cloning and molecular analysis of structural genes involved in fl avonoid and stilbene biosynttheis in grape (Vitis vinifera L.). Plant Mol. Biol., 24: 743-755.
Spayd, S.E., J.M. Tarara, D.L. Mee and J. C. Ferguson, 2002. Separation of sunlight and temperature effects on the composition of Vitis vinifera cv. Merlot berries. Amer. J. Enol. Viticult., 53: 171-182.
Ubi. V.W., C. Honda, H. Bessho, S. Kondo, M. Wada, S. Kobayashi and T. Moriguchi, 2006. Expression analysis of anthocyanin biosynthetic genes in apple skin: effect of UV-B and temperature. Plant Sci., 170: 571-578.
Winkel-Shirley, B. 2002. Biosynthesis of fl avonoids and effects of stress. Curr. Opin. Plant Biol., 5: 218-23.
Anthocyanins accumulation and genes-related expression in berries of cv. Tannat (Vitis vinifera L.) 9
Specimen Copy: Not for sale
Journal of Applied Horticulture, 12(1): 10-15, January-June, 2010
Effects of different photoperiods on fl owering time of facultative short day ornamental annuals
Jalal-Ud-Din Baloch*, M. Qasim Khan, M. Munir1 and M. Zubair2
Faculty of Agriculture, Gomal University, Dera Ismail Khan, Pakistan; 1School of Plant Sciences, The University of Reading, Reading, UK; 2University College of Agriculture, Bahauddin Zakariya University, Multan, Pakistan. *E-mail: [email protected]
AbstractAn experiment was carried out to study fl owering response of six facultative short day plants (zinnia cv. Lilliput, sunfl ower cv. Elf, French marigold cv. Orange Gate, African marigold cv. Crush, cockscomb cv. Bombay and cosmos cv. Sonata Pink) under four distinct controlled photoperiods (8, 11, 14 and 17 h d-1). A curvilinear facultative response was observed in almost all cultivars studied. zinnia, sunfl ower, French marigold, African marigold, cockscomb and cosmos took minimum time to fl ower when grown under 8 h d-1 photoperiods however it was signifi cantly (P<0.05) increased when photoperiod was increased to 17 h d-1. These fi ndings revealed plant scheduling prospect that is, the fl owering time of facultative SDPs grown under long day photoperiod can be extended in order to continue supply of these plants in the market.
Key words: Ornamental annuals, short day plants, fl owering, photoperiod, facultative short day plants
IntroductionFlowering is the end result of physiological processes, biochemical sequences, and gene action, with the whole system responding to the infl uence of environmental stimuli (photoperiod, temperature) and the passage of time (Zheng et al., 2006). After attaining a certain size (completing the ‘juvenile’ phase), plants enter into the ‘reproductive’ phase (initiation and development of fl owering). Evans (1969) referred to fl owering as the inductive processes occurring in the leaf (O’Neil, 1992), mediated by the photoreceptor (phytochrome) that leads to the initiation of fl oral development (McDaniel et al., 1992) at the meristem (evocation). It is also believed that flowering is induced by a stimulus (fl origen), which is produced within the leaf (Chailakhyan, 1936) but this hormone has not yet been identifi ed (Turck et al., 2008). When the apical meristem of the plant is differentiated for fl owering, its fate becomes irreversible (Bernier, 1988), although fl ower or infl orescence reversion to vegetative growth can also occur spontaneously in some species. This condition can be caused if plants are transferred to certain specifi c photoperiod or temperature regimes, which favour vegetative development (Battey and Lyndon, 1990).
Many fl owering plants use a photoreceptor protein, such as phytochrome or cryptochrome, to sense seasonal changes in day length (photoperiod), which they take as signals to fl ower (Weller and Kendrick, 2008). The photoperiodic response of fl owering is generally categorised into three main groups: short-day plants (SDPs) in which fl owering is induced by longer nights; long-day plants (LDPs) where shorter nights promote fl owering; and day-neutral plants (DNPs) in which fl ower are produced irrespective to day length. SDPs and LDPs can be further classified as qualitative or obligate (species that require a specifi c minimum or maximum photoperiod for fl owering) and quantitative or facultative (fl owering process is hastened by a specifi c minimum or maximum photoperiod). It is in fact, the night length rather than
day length that controls fl owering, so fl owering in a long day (LD) plant is triggered by a short night (which, of course, also means a long day). Conversely, short day (SD) plants will fl ower when nights get longer than a critical length. This can be observed by using night breaks. For example, a short day plant (long night) will not fl ower if a pulse (5 minutes) of artifi cial light is shone on the plant during the middle of the night. This generally does not occur from natural light such as moonlight, lightning, fi re fl ies, etc, since the light from these sources is not suffi ciently strong to trigger the response (Thomas and Vince-Prue, 1997). Keeping in view the importance of photoperiod on fl ower induction an expeiment was desgined to determine the fl owering response of six facultative SDPs to four photoperiods under the sub-tropical environmental conditions.
Materials and methodsThe experiment was conducted in Agricultural Research Institute, Dera Ismail Khan, Pakistan, during the year 2005. Seeds of facultative SDPs such as zinnia (Zinnia elegans L.) cv. Lilliput, sunfl ower (Helianthus annuus L.) cv. Elf, French marigold (Tagetes patula L.) cv. Orange Gate, African marigold (Tagetes erecta L.) cv. Crush, cockscomb (Celosia cristata L.) cv. Bombay, cosmos (Cosmos bipinnatus Cav.) cv. Sonata Pink were sown on 1st of March 2005 into module trays containing locally prepared leaf mould compost. Seed trays were kept at room temperature at night and they were moved out during the day (08:00–16:00h) under partially shaded area. After 70% seed germination, six replicates of each cultivar were shifted to the respective photoperiod chamber. Plants remained outside the photoperiod chambers for 8h (from 08:00 to 16:00h) where they were exposed to natural daylight and temperature (Table 1). At 16:00h each day, all plants were moved into the photoperiod chambers where they remained until 08:00h the following morning. Photoperiod within each of the chambers was extended
Journal
Appl
Specimen Copy: Not for sale
by two 60Watt tungsten light bulbs and one 18Watt warm white fl orescent long-life bulb (Philips, Holland) fi xed above one metre height from the trolleys providing a light intensity (Photosynthetic Photon Flux Density, PPFD) of 7mmol m-2 s-1. In all photoperiod chambers, the lamps were switched on automatically at 16:00h for a duration dependents on the day length required (8, 11, 14, 17 h d-1). These chambers were continuously ventilated with the help of micro exhaust fan (Fan-0051, SUPERMICRO® USA) with an average air speed of 0.2 m s-1 over the plants when inside
the chambers, to minimize any temperature increase due to heat from the lamps.
Temperature and solar radiation were measured in the weather station situated one kilometer away from the research venue. Temperature was recorded with the help of Hygrothermograph (NovaLynx Corporation, USA) while solar radiation was estimated using solarimeters (Casella Measurement, UK). Plants were potted into 9 cm pots containing leaf mould compost and river sand (3:1 v/v) after 6 leaves emerged. Plants were irrigated by hand and a nutrient solution [(Premium Liquid Plant Food and Fertilizer (NPK: 8-8-8); Nelson Products Inc. USA)] was applied twice a week.
Plants in each treatment were observed daily until flower opening (corolla fully opened). Number of days to fl owering from emergence were recorded at harvest and the data were analysed using GenStat-8 (Lawes Agricultural Trust, Rothamsted Experimental Station, U.K. and VSN International Ltd. U.K.).
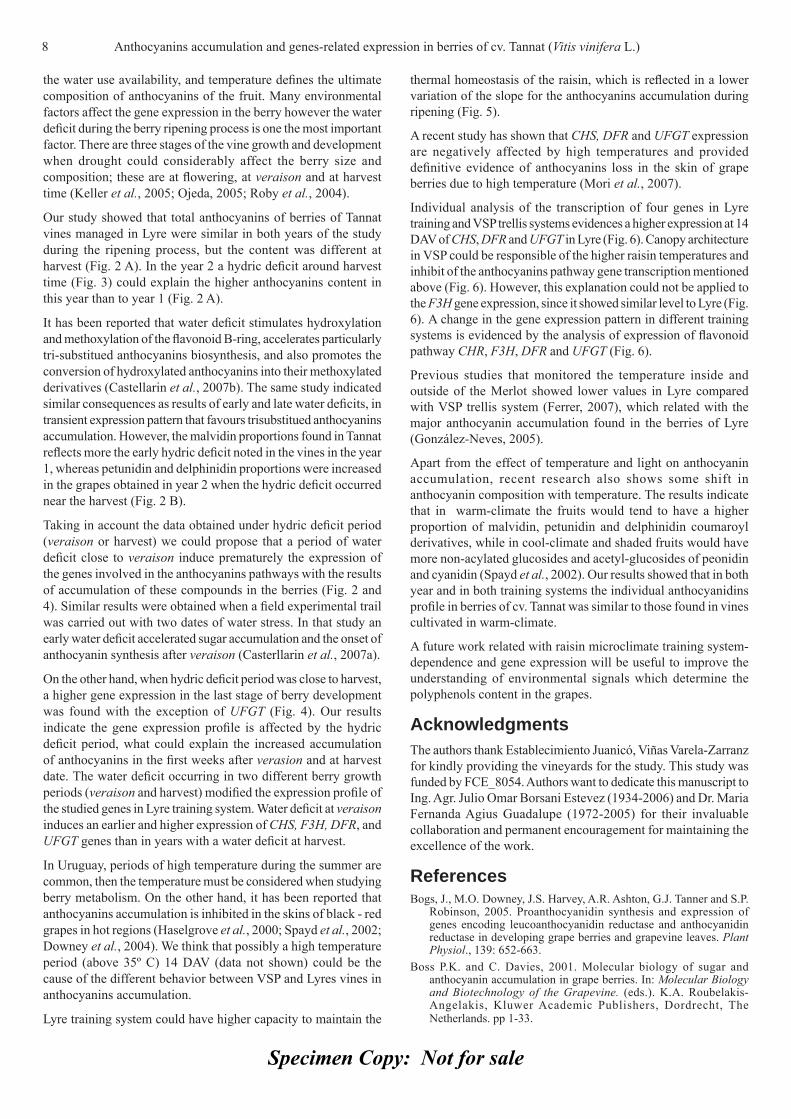
Fig. 1. Effect of different photoperiods on fl owering time of (A) Zinnia cv. Lilliput, (B) Sunfl ower cv. Elf, (C) French marigold cv. Orange Gate, (D) African marigold cv. Crush, (E) Cockscomb cv. Bombay and (F) Cosmos cv. Sonata Pink. Each point represents the mean of 6 replicates. Vertical bars on data points (where larger than the points) represent the standard error within replicates whereas SED vertical bar showing standard error of difference among means.
Table 1. Environmental details of the experimentGrowth Period
Diurnal temperature (°C) Daily light integral
08:00-16:00MJ m-2 d-1
Maximum Minimum Average
March 2005 26.19 13.29 19.74 8.43April 2005 32.87 15.73 24.30 9.45May 2005 36.39 20.35 28.37 9.40June 2005 42.27 30.70 36.48 9.99July 2005 36.77 25.68 31.23 9.42
Effects of different photoperiods on fl owering time of facultative short day ornamental annuals 11

Specimen Copy: Not for sale
ResultsTime to fl owering in SDPs such as zinnia cv. Lilliput, sunfl ower cv. Elf, French marigold cv. Orange Gate, African marigold cv. Crush, cockscomb cv. Bombay and cosmos cv. Sonata Pink increased signifi cantly (P<0.05) with increase in photoperiod. Plants received maximum duration of light took maximum time to fl ower whereas it was decreased signifi cantly under minimum photoperiod treatments.
It was observed that zinnia cv. Lilliput (Fig. 1A) flowered 16 days earlier under SD i.e. 8 h d-1 photoperiod (64 days) as compared to LD i.e. 17 h d-1 photoperiod (80 days) followed by 14 h d-1 photoperiod (78 days) and 11 h d-1 photoperiod (70 days). Similarly, sunfl ower cv. Elf (Fig. 1B) bloomed 15 days earlier under 8 h d-1 photoperiod (64 days) compared to 17 h d-1 photoperiod (79 days) while plants grown in 14 and 11 h d-1 photoperiod fl owered after 69 and 75 days, respectively. French
marigold cv. Orange Gate (Fig. 1C) fl owered 10 days early under 8 h d-1 photoperiod (59 days) as compared to 17 h d-1 photoperiod (69 days) followed by 14 and 11 h d-1 photoperiod i.e. 64 and 62 days, respectively. Similarly, African marigold cv. Crush (Fig. 1D) grown under 8 h d-1 photoperiod (60 days) fl owered 11 days earlier than the 17 h d-1 photoperiod (71 days). Plants of same cultivar took 70 and 63 days to fl ower when grown under 14 and 11 h d-1 photoperiod. Cockscomb cv. Bombay (Fig. 1E) fl owered 14 days earlier when grown under 8 h d-1 photoperiod (87 days) as compared to 17 h d-1 photoperiod (101 days) followed by 95 days in 14 h d-1 photoperiod and 92 days in 11 h d-1 photoperiod. Similarly, cosmos cv. Sonata Pink (Fig. 1F) when grown under 8 h d-1 photoperiod fl owered 29 days earlier (55 day) as compared to 17 h d-1 photoperiod (83 days) whereas plants grown under 14 and 11 h d-1 photoperiod bloomed after 73 and 63 days from emergence, respectively.
Data from facultative SDPs were analysed using the following
Fig. 2. Effect of different photoperiods on rate of progress to fl owering (1/f) of (A) Zinnia cv. Lilliput, (B) Sunfl ower cv. Elf, (C) French marigold cv. Orange Gate, (D) African marigold cv. Crush, (E) Cockscomb cv. Bombay and (F) Cosmos cv. Sonata Pink. Each point represents the mean of 6 replicates. Vertical bars on data points (where larger than the points) represent the standard error within replicates.
12 Effects of different photoperiods on fl owering time of facultative short day ornamental annuals
Specimen Copy: Not for sale
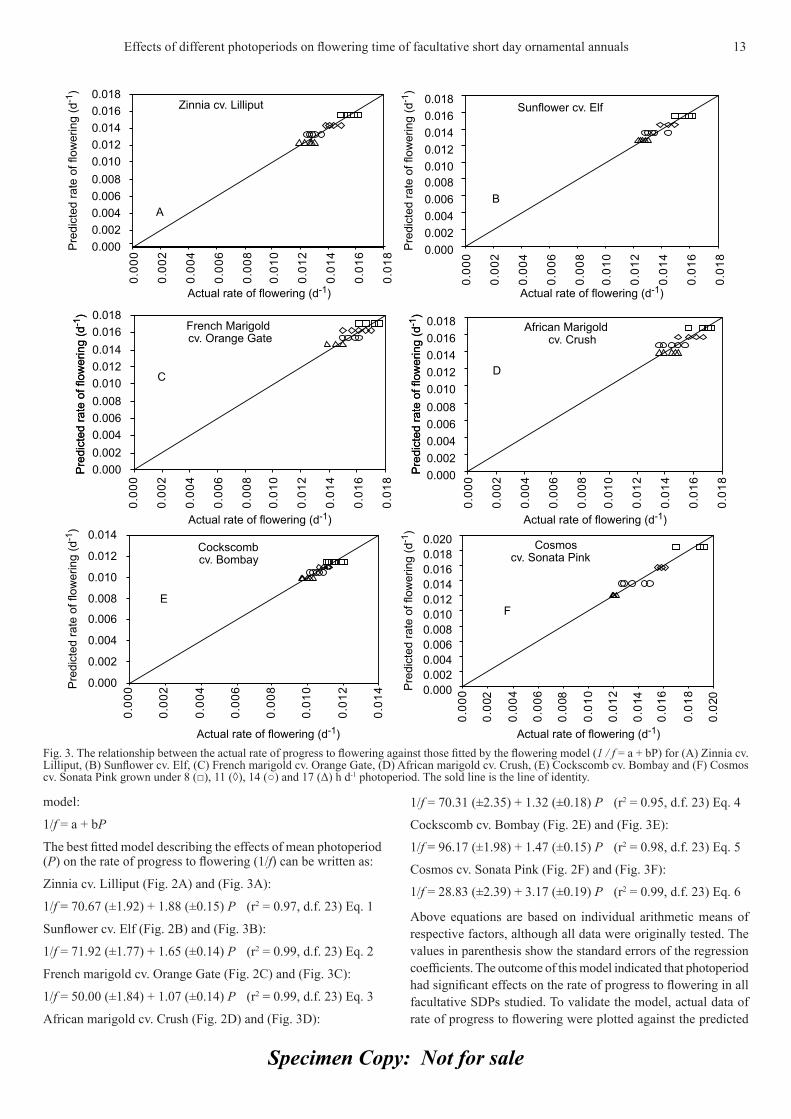
model:
1/f = a + bP
The best fi tted model describing the effects of mean photoperiod (P) on the rate of progress to fl owering (1/f) can be written as:
Zinnia cv. Lilliput (Fig. 2A) and (Fig. 3A):
1/f = 70.67 (±1.92) + 1.88 (±0.15) P (r2 = 0.97, d.f. 23) Eq. 1
Sunfl ower cv. Elf (Fig. 2B) and (Fig. 3B):
1/f = 71.92 (±1.77) + 1.65 (±0.14) P (r2 = 0.99, d.f. 23) Eq. 2
French marigold cv. Orange Gate (Fig. 2C) and (Fig. 3C):
1/f = 50.00 (±1.84) + 1.07 (±0.14) P (r2 = 0.99, d.f. 23) Eq. 3
African marigold cv. Crush (Fig. 2D) and (Fig. 3D):
1/f = 70.31 (±2.35) + 1.32 (±0.18) P (r2 = 0.95, d.f. 23) Eq. 4
Cockscomb cv. Bombay (Fig. 2E) and (Fig. 3E):
1/f = 96.17 (±1.98) + 1.47 (±0.15) P (r2 = 0.98, d.f. 23) Eq. 5
Cosmos cv. Sonata Pink (Fig. 2F) and (Fig. 3F):
1/f = 28.83 (±2.39) + 3.17 (±0.19) P (r2 = 0.99, d.f. 23) Eq. 6
Above equations are based on individual arithmetic means of respective factors, although all data were originally tested. The values in parenthesis show the standard errors of the regression coeffi cients. The outcome of this model indicated that photoperiod had signifi cant effects on the rate of progress to fl owering in all facultative SDPs studied. To validate the model, actual data of rate of progress to fl owering were plotted against the predicted
Fig. 3. The relationship between the actual rate of progress to fl owering against those fi tted by the fl owering model (1 / f = a + bP) for (A) Zinnia cv. Lilliput, (B) Sunfl ower cv. Elf, (C) French marigold cv. Orange Gate, (D) African marigold cv. Crush, (E) Cockscomb cv. Bombay and (F) Cosmos cv. Sonata Pink grown under 8 (□), 11 (◊), 14 (○) and 17 (Δ) h d-1 photoperiod. The sold line is the line of identity.
Effects of different photoperiods on fl owering time of facultative short day ornamental annuals 13
Specimen Copy: Not for sale
ones in order to develop a fi tted relationship. Almost all values were successfully plotted near the line of identity which also showed that the photoperiod had a signifi cant effect on the rate of progress to fl owering.
DiscussionA facultative SD photoperiodic response of zinnia cv. Lilliput, sunfl ower cv. Elf, French marigold cv. Orange Gate, African marigold cv. Crush, cockscomb cv. Bombay and cosmos cv. Sonata Pink was observed during present investigation. These results are in line with the fi ndings of Erwin and Warner (2002) who reported that fl owering was hastened by SD photoperiod in SDPs. Present study indicated that fl owering was hastened up to 16 (zinnia), 15 (sunfl ower), 10 days (French marigold), 11 (African marigold), 14 (cockscomb) and 29 days (cosmos) under SD environment (8 h d-1). The response of SDPs observed in present study is supporting the fact that most SDPs are of tropical or sub-tropical origin (Summerfi eld et al., 1997). Studies have been carried out previously to support this evidence in zinnia (Young et al., 2003), sunfl ower (Young et al., 2003; Yañez et al., 2004), French and African marigold (Tsukamoto et al., 1968, 1971), cockscomb (Kanellos and Pearson, 2000; Young et al., 2003; Goto and Muraoka, 2008) and cosmos (Warner, 2006).
SDPs grown under inductive environment (8 h d-1 photoperiod) induced fl owering earlier than those grown above this. The reason of early fl owering under inductive environment is due to the stimulation of fl oral genes which are involved in the transition of fl owering (phase change) that encode photoreceptors such as phytochrome (perceives red (660nm) and far-red (730nm) light) and the cryptochromes (perceives UV-A and blue light). It is reported in Arabidopsis that the phytochromes A and B in conjunction with the cryptochromes 1 and 2 are involved in the photoperiodic response (Mouradov et al., 2002). Therefore, any ascending alteration in photoperiod (in SDPs) from the optimum one affects plants’ perception of light and can delay phase change from juvenile to fl owering. However, in general, far-red and blue light promote fl owering in Arabidopsis whereas red light inhibits fl owering (Lin, 2000).
The transduction of the light signals involves a complex web of interactions between photoreceptors and their corresponding interacting proteins. In term of fl oral induction, perception of photoperiod appears to be one of the most important transducers of the plant’s environment. An important mechanism used by the plants phytochromes and cryptochromes is to communicate photoperiod activity which involves the entrainment of the circadian rhythms, a self-reinforcing endogenous clock that allows light/dark coordinated gene expression. Mizoguchi et al. (2005) reported that GIGANTEA (GI) gene regulates circadian rhythms and acts earlier in the hierarchy than CO and FT and suggested that GI acts between the circadian oscillator and CO to promote fl owering by increasing CO and FT mRNA abundance.
These studies established an understanding that different genes control fl owering process and these genes are evoked when a leaf is fated to respond to the inductive photoperiod, the leaf exports fl oral stimulus towards apex. In most cases, when the photoperiod becomes non-inductive (17 h d-1, in present study), the leaf stops exporting signal. The important developmental event in leaf formation, as far as photoperiodic induction is concerned, appears
to be the commitment of a leaf to develop the capacity to respond to the inductive photoperiod (McDaniel, 1996). In present study, it is revealed that after completing the juvenile phase (attaining a specifi c leaf numbers), the competent leaf (newly developed one) responded to the inductive photoperiod (short day-length) and induced fl oral signal toward apex to produce fl ower that is why an early fl owering response was observed under inductive photoperiod environment in SDPs.
It can be concluded from the fi ndings of present research that fl owering time in zinnia, sunfl ower, French marigold, African marigold, cockscomb and cosmos can be prolonged under 17 h d-1 non-inductive environment to facilitate continuous supply of these plants in the market and to enhance their fl ower display period. However, these SDPs can be subjected to SD inductive environment (8 h d-1) if an early fl owering is required. These fl oweres can also be grown under non-inductive environment during juvenile phase to improve their quality for marketing viewpoint. The outcome of present study indicated a possibility of year-round production of these fl owers, which will eventually increase the income of ornamental growers.
ReferencesBattey, N.H. and R.F. Lyndon, 1990. Reversion of fl owering. Bot. Rev.,
56: 162-189.Bernier, G. 1988. The control of fl oral evocation and morphogenesis.
Annu. Rev. Plant Physiol. Plant Mol. Biol., 39: 175-219.Chailakhyan, M.K. 1936. On the hormonal theory of plant development.
Dorkl. Acad. Sci., U.S.S.R., 12: 443-447.Erwin, J.E. and R.M. Warner, 2002. Determination of photoperiodic
response group and effect of supplemental irradiance on fl owering of several bedding plant species. Acta Hort., 580: 95-99.
Evans, L.T. 1969. The Induction of Flowering. Melbourne: MacMillan, Australia.
Goto, T. and Y. Muraoka, 2008. Effect of plug transplant age and photoperiod treatment at seedling stage on cut fl ower quality of Celosia cristata L. Acta Hort., 782: 201-206.
Kanellos, E.A.G. and S. Pearson, 2000. Environmental regulation of fl owering and growth of Cosmos atrosanguineus (Hook.) Voss. Sci. Hort., 83: 265-274.
Lin, C. 2000. Photoreceptors and regulation of fl owering time. Plant Physiol., 123: 39-50.
McDaniel, C.N. 1996. Developmental physiology of fl oral initiation in Nicotiana tabacum L. J. Expt. Bot., 47: 465-475.
McDaniel, C.N., S.R. Singer and S.M.E. Smith, 1992. Developmental states associated with the fl oral transition. Develop. Biol., 153: 59-69.
Mizoguchi, T., L. Wright, S. Fujiwara, F. Cremer, K. Lee, H. Onouchi, A. Mouradov, S. Fowler, H. Kamada, J. Putterill and G. Coupland, 2005. Distinct roles of GIGANTEA in promoting fl owering and regulating circadian rhythms in Arabidopsis. Plant Cell, 17: 2255-2270.
Mouradov, A., F. Cremer and G. Coupland, 2002. Control of fl owering time interacting pathways as a basis for diversity. Plant Cell, 14: 111-130.
O’Neil, 1992. The photoperiodic control of fl owering: Progress toward the understanding of the mechanism of induction. Photochem. Photobiol., 56: 789-801.
Summerfi eld, R.J., R.H. Ellis, P.Q. Craufurd, Q. Aiming, E.H. Roberts and T.R. Wheeler, 1997. Environmental and genetic regulation of fl owering of tropical annual crops. Euphytica, 96: 83-91.
Thomas, B. and D. Vince-Prue, 1997. Photoperiodism in Plants. Academic Press, London, U.K.
14 Effects of different photoperiods on fl owering time of facultative short day ornamental annuals
Specimen Copy: Not for sale
Tsukamoto, Y., H. Imanishi and H. Yahara, 1968. Studies on the fl owering of marigold: I. Photoperiodic response and its differences among strains. Engei Gakkai Zasshi, 37: 231-239.
Tsukamoto, Y., H. Imanishi and H. Yahara, 1971. Studies on the fl owering of marigold: II. Interactions among day-length, temperature, light intensity and plant regulators. Engei Gakkai Zasshi, 40: 401-406.
Turck, F., F. Fornara and G. Coupland, 2008. Regulation and identity of Florigen: FLOWERING LOCUS T moves center stage. Annu. Rev. Plant Biol., 59: 573-594.
Warner, R.M. 2006. Using limited inductive photoperiod for scheduling Cosmos bipinnatus and Tagetes tenuifolia. Acta Hort., 711: 267-272.
Weller, J.L. and R.E. Kendrick, 2008. Photomorphogenesis and photoperiodism in plants. In: Photobiology, the Science of Life and Light. Björn, L.O. (Ed.), 2nd Edition, Springer, New York, U.S.A. pp: 417-463.
Yañez, P., H. Ohno and K. Ohkawa, 2004. Effect of photoperiod on fl owering and growth of ornamental sunfl ower cultivars. Environ. Cont. Biol., 42: 287-293.
Young, J.B., J.S. Kuehny and P.C. Branch, 2003. Scheduling of Gladiolus, Celosia, Helianthus and Zinnia. Acta Hort., 624: 373-378
Zheng, Z.L., Z. Yang, J.C. Jang and J.D. Metzger, 2006. Phytochromes A1 and B1 have distinct functions in the photoperiodic control of fl owering in the obligate long-day plant Nicotiana sylvestris. Plant Cell Environ., 29: 1673-1685.
Effects of different photoperiods on fl owering time of facultative short day ornamental annuals 15

Specimen Copy: Not for sale
Journal of Applied Horticulture, 12(1): 16-20, January-June, 2010
Effi cacy and physical properties of ground, composted rice hulls as a component of soilless substrate for selected bedding plants
C.Y. Songa, Paul V. Nelsonb*, Carl E. Niedziela Jr.c, and D. Keith Casseld
aKorea National College of Agriculture and Fisheries, 11 Dongwhari Bongdam Hwasunsi Kyonggido, R.O. Korea 445-890, bDepartment of Horticultural Science, North Carolina State University, Raleigh, NC 27695-7609, cDepartment of Biology, Elon University, Elon, NC 27244, d Department of Soil Science, North Carolina State University, Raleigh, NC 27695-7619. *E-mail: [email protected]
AbstractGround, composted rice hulls were combined as a root substrate component with peat moss and coir at fi ve rice hulls percentages (0, 25, 50, 75, and 100) in a factorial design. Seventy-fi ve percent of the rice hull particles were 0.51 to 1.40 mm and 90% of the particles were 0.51 to 2.00 mm. In physical property evaluations, increasing the percentage of rice hulls in both the peat moss and coir series of substrates increased the dry bulk density and airspace at container capacity; however, as air space increased, container capacity and available water decreased. In the fi rst two of three plant growth experiments, Impatiens walleriana Hook. f. ‘Super Elfi n White’ was grown in 288 cell plug trays. In the third experiment, Verbena hybrida Voss. ‘Romance Deep Rose’ was grown in 48 cell bedding plant fl ats. Due to problems with high pH in the coir, only the peat moss growth results were reported. Overall, growth was best in 25% rice hulls plus 75% peat moss. Rice hulls increased substrate Ca2+ and Mg2+ in both the peat moss and coir. Adding rice hulls to the substrate increased K+ in peat and decreased K+ in coir. There was no effect of rice hulls on substrate NO3
- -N, NH4+-N, and PO4-P in the substrate
solution. Ground, composted rice hulls are a potential alternative component of soilless substrate for plugs and bedding plants.
Key words: Rice hulls, root substrate, soilless, root media, Impatiens walleriana, Verbena hybrida,
IntroductionRice hulls were fi rst investigated as a potential replacement for soil or sand in soil-based substrates (Einert, 1972; 1973), then as a potential replacement for perlite in soilless substrates (Evans and Gachukia, 2004, 2007; Papfotiou et al., 2001). Evans and Gachukia (2007) reported that rice hulls had a greater porosity than perlite. Conversely, Papfotiou et al. (2001) found replacement of perlite with rice hulls in a substrate decreased total porosity.
Papfotiou et al. (2001) replaced 50 or 100% of the perlite with rice hulls in a 1 peat : 1 perlite (v/v) substrate resulting in similar or slightly reduced growth in several plant species. Marianthi (2006) successfully replaced perlite with fresh rice hulls in a 7 peat moss : 3 perlite (v/v) substrate for the production of Pinus halepensis M. seedlings.
Composted rice hulls have a higher dry bulk density and container capacity than fresh rice hulls (Kang et al., 2004). Composting also eliminates plant growth inhibitory chemicals, such as organic acids (Lee et al., 2000). Composted rice hulls have a higher pH, EC, N content, and available P content than fresh rice hulls (Kang et al., 2004). Growth of petunia was better in the root substrate amended with 30 to 60% composted rice hulls than with 0, 15, or 75% composted rice hulls (Song et al., 1996). Laiche and Nash (1990) reported that 50 or 100% substitution of pine bark with composted rice hulls in the root substrate of several woody landscape species provided favourable growth. However, the dolomitic lime amendment had to be reduced or eliminated to compensate for innate Ca2+ and Mg2+ levels in the rice hulls.
Grinding has also been used to decrease the total porosity and air-fi lled space and increase the container capacity of rice hulls (Choi et al., 1999). Sambo et al. (2008) determined that fresh rice hulls ground to pass through 1 and 2 mm diameter screens were closest to peat moss in physical properties. However, the ground rice hulls had more total and easily available water and a heavier bulk density than peat moss.
In this study, rice hulls were composted to eliminate toxic substances and viable seed, and ground to develop a fi ner aeration component than whole rice hulls that would be appropriate for plug substrates. The effects of replacing either peat moss or coir with increasing levels of composted, ground rice hulls on substrate physical properties and plant growth were tested.
Materials and methodsOn 23 August, 1 m3 of rice hulls was combined in a Twister 1 Batch Mixer Model 12101 (Bouldin & Lawson, McMinnville, TN) with 2.5, 5, and 10 kg of Gorang commercial compost promoter (Biwang Co., Seoul, South Korea), urea, and wheat bran, respectively. The mixture was then saturated with water and covered with polyethylene fi lm. After 10 d, when the material had an internal temperature of 70-75 °C, it was turned. After 10 more days, the material was turned again. The pile remained in the fi eld under the polyethylene cover until removed as needed for each experiment.
Composted rice hulls moistened to 30% water content by weight were ground using a hammer mill (model 10 BLHM, The C.S.
Journal
Appl
Specimen Copy: Not for sale
Bell Co., Tiffi n, OH) to pass through a 6.35 mm screen. Three 100 g samples of the ground compost were sieved for 5 min in a Ro-Tap Testing Sieve Shaker Model B (Tyler Industrial Products, Mentor, OH). The sieve fractions of >2.00, 2.00-1.41, 1.40-1.01, 1.00-0.72, 0.71-0.51, 0.50-0.25, and <0.25 mm averaged 2, 15, 36, 28, 11, 6, and 2 %, respectively, by weight of the total samples.
Ten root substrate formulations were prepared for each experiment using the ground, composted rice hulls at 30% moisture by weight and either sphagnum peat moss or coir at 67% moisture. In the peat moss and coir treatment series, rice hulls replaced peat moss or coir at volume percentages of 0, 25, 50, 75, or 100.
Substrate physical properties: Columns, 15 cm in height, constructed from 7.7 cm i.d. polyvinylchloride (PVC) pipe were used to determine the physical properties of the ten substrates. Each column was attached to a fl at acrylic base plate. A 9.0 mm hole was drilled in the center of each base to provide drainage. A porous, fi berglass mat was placed over the drainage hole of each column. The tare weight of each empty column, including fi berglass mat, was determined. To facilitate fi lling each column, an extension was made by taping an additional PVC ring 4 cm in height to the top of each column. Each column with extension was fi lled loosely with substrate and dropped on a laboratory bench from a height of 15 cm three times to compact the substrate. The extension was removed and the substrate remaining above the top of each 15-cm column was cut free with the sawing action of a fi ne chrome wire. Three replicated columns were fi lled with each substrate as described.
One complete replication of all ten substrate formulation treatments in this experiment (ten packed columns) was placed in an empty tank at a time. Water was added incrementally to the bottom of the tank over a two hour period until the water level reached the surface of the packed columns. As water entered the base of each column, air within the substrate was displaced upward and expelled from the top of the column. A rubber stopper was weighed and then inserted into the hole in the base of the column. The column of saturated substrate, always maintained in a vertical orientation, was removed from the water and weighed. After subtracting the weight of the stopper and empty column, the net weight of saturated substrate was recorded as weight A. The stopper was removed from the base, the top of the column was loosely covered with plastic tape to prevent evaporation, and gravitational water allowed to drain. The columns drained for 24 h; however, container capacity was reached within 1 h and drainage beyond 1 h was negligible. After 24 h, the column, with its substrate at container capacity, was weighed. The weight of the column was subtracted and the net weight of the substrate at container capacity was recorded as weight B. The substrate was then transferred quantitatively to a ring on the porous plate of a pressure outfl ow chamber (Klute 1986), rewetted, and a pressure head of -300 cm water (-30 kPa) applied. The water content of the latter sample after it drained to equilibrium in the pressure chamber was taken to be the lower limit of available water. The ring plus substrate was weighed, the weight of the ring was subtracted, and the net weight of substrate at -30kPa was recorded as weight C. The substrate was then quantitatively transferred to an oven, dried at 105 °C for 24 h, and weighed (weight D).
Equation 1: Db = D / (Ht 7.7 7.7 π) / 4
Where, Db = dry bulk density (g.cm-3); D = weight of substrate after oven drying at 105 °C for 24 h (g); Ht = height of column (cm); and π = 3.14.
Equation 2: CC = (100 Db) [(B – D) / D] Where, CC = container capacity in a 15-cm tall column (% by volume); Db = bulk density (g.cm-3); B = weight of substrate at container capacity (g); and D = weight of substrate after oven drying at 105 °C for 24 h (g).
Equation 3: LLAW = (100 Db) [(C – D) / D]Where, LLAW = lower limit of plant available water (% by volume); Db = bulk density (g.cm3); C = weight of substrate at -30 kPa; and D = weight of substrate after oven drying at 105 °C for 24 h (g).
Equation 4: AW = (CC – LLAW) Where, AW = Available water between CC and -30kPa (% by volume); CC = container capacity (% by volume); and LLAW = lower limit of plant available water (% by volume).
Equation 5: AS = (100 X Db) [(A – B) / D]Where, AS = Air space at CC (% by volume); Db = bulk density (g.cm-3); A= Weight of saturated substrate (g); B = weight of substrate at CC (g); and D = weight of substrate after oven drying at 105 °C for 24 h (g).
Plant efficacy tests for the ten substrates occurred in three experiments. In these experiments, substrates were irrigated at each irrigation to approximately 20% leaching with tap water. The night/day greenhouse temperatures were set at 21/24 °C.
Expt. 1 – First plug experiment: All ten substrates were amended with dolomitic limestone at 7 g L-1. Seeds of I. walleriana ‘Super Elfi n White’ were planted into 288-cell square (2.0 x 2.0 cm x 3.5 cm deep) Landmark (Landmark Plastic Corp., Akron, OH) plug fl ats cut down to 100 cells on 16 Dec. Fertilizer applications of 20N:4.4P:16.6K at 50 mg L-1 N at each irrigation began when the cotyledons separated and increased to 100 mg L-1 N when the fi rst true leaves appeared. A destructive harvest of plants was made on 20 January when plant height and shoot dry weight were recorded.
Expt. 2 – Second plug experiment: Substrates were amended with dolomitic limestone at 4.5 g L-1 in the 100% rice hull treatment and four treatments containing peat moss and 3.5 g L-1 in the four treatments containing coir to correct for the high pH levels observed in Expt. 1. Seeds of I. walleriana ‘Super Elfi n White’ were planted into 288-cell square Landmark plug fl ats cut down to 100 cells on 1 February. The protocols for fertilizer application were the same as in Expt. 1. A destructive harvest of plants was made on 3 March. Plant height and shoot fresh weight were recorded.
Expt. 3 – Verbena growth experiment: Substrates were amended with dolomitic limestone at 4.5 g L-1 in the 100% rice hull treatment and three treatments containing peat moss and 3.5 g L-1 in the three treatments containing coir as in Expt. 2. Plug seedlings of V. hybrida ‘Romance Deep Rose’ from C. Raker & Sons, Inc. (Litchfi eld, MI) were transplanted on 31 January into 48-cell (4.4 x 6.7 x 5.7 cm deep) bedding plant fl ats. Weekly fertilizer applications of 20N:4.4P:16.6K at 200 mg L-1 N began on 3 February. The date when 75% of the plants in each fl at were in
Effi cacy and physical properties of ground, composted rice hulls as a component of soilless substrate 17

Specimen Copy: Not for sale
fl ower was recorded. A destructive harvest of plants was made on 19 March. Plant height and shoot fresh weight were recorded.
Analytical methods: Substrate solution was extracted at each destructive harvest by squeezing the plug cells. The root substrate extracts were analyzed for pH, EC, NO3
--N, NH4+-N, PO4
3--P, K+, Ca2+, and Mg2+ as follows: A pH/conductivity/TDS/temperature meter (Extech Instruments, Model 695, Waltham, MA) was used for pH and soluble salts (EC) determination. Colorimetric analysis was employed for NO3
--N (Cataldo et al., 1975), NH4+-N
(Chaney and Marbach, 1962), PO43--P concentrations under 10 μg
mL-1 (Murphy and Riley, 1962), and PO43--P concentrations above
10 μg mL-1 (Chapman and Pratt, 1961) in a Lambda 3 UV/VIS spectrophotometer (Perkin and Elmer, Norwalk, CT). Atomic absorption spectroscopy was used for K+, Ca2+, and Mg2+ analyses (AAnalyst 100 atomic absorption spectrometer, Perkin Elmer, Norwalk, CT)
Experimental design and statistical analysis: A factorial arrangement of two substrate series (peat moss and coir) and fi ve rice hull rates (0, 25, 50, 75, and 100%) in a randomized complete block design with three blocks (30 experimental units in total) was employed for the physical properties determination and for the three plant experiments. In Expts. 1 and 2, experimental units consisted of one 100-cell fl at of plants. In Expt. 3, experimental units consisted of one 48-cell fl at of plants. Data were subjected to analysis of variance using SAS 9.1 (Statistical Analysis System, SAS Institute, Cary, NC). Means were separated using a protected LSD. Values for dependent variables with signifi cant analysis of variances were regressed by substrate additives using the PROC GLM procedure to determine the best-fi t linear and quadratic models. Terms of the model were based on a comparison of F values at α =0.05.
Results and discussionPhysical properties: Physical property data for the substrates are presented in Table 1. The main effect of rice hull percentage on Db and AS was signifi cant, but the interactive effects of substrate series by rice hull percentage were not signifi cant. As rice hull
proportion increased, Db and AS increased linearly. This is not a desirable trait for Db because increased substrate weight results in increased shipping costs for formulators and growers. The increased AS at 25% rice hulls (20.7% by volume) was desirable. Higher AS percentages would pose a problem because it is not needed and comes at the expense of plant available water. The main effect of series was not signifi cant for Db but was for AS, where the mean AS values were 32.7% for peat and 39.0% for coir. There were interactive effects of substrate series and rice hulls on CC and AW. Both components of water declined as the percentage of rice hulls increased and were lower in the coir series than in the peat moss series. Thus, the slope was more negative in the peat moss series.
Growers desire maximum available water to reduce frequency of watering, particularly in the market channel. Even though 75% of the ground rice hulls in this study were in the 0.51 to1.40 mm particle size range, their main impact on peat moss and coir was an increase in AS at the expense of CC and AW due to the addition of large particles. Unlike fi nely ground rice hulls, which have physical properties similar to peat moss (Sambo et al., 2008), coarsely ground rice hulls increased aeration in the substrates similar to perlite.
Growth: Substrate pH levels in Expt. 1 were signifi cantly affected by substrate series but not by rice hull percentage or the interaction of series by rice hulls. The mean pH levels were 6.7 for peat moss and 7.0 for coir. There was a signifi cant interactive effect of series and rice hull percentage in Expts. 2 and 3 (Table 2). While the pH levels in the peat moss series in each experiment were acceptable, they were too high for the coir series, particularly in the 0 to 50% rice hull treatments in the latter two experiments. Since the high pH levels in the coir series would confound interpretation, only the peat moss series was used for growth evaluation.
Shoot dry weight in Expt.1 was greatest in the 25 and 50% rice hulls treatments while height was highest in the 0, 25, and 50% rice hulls treatments (Table 3). Overall, the 25 and 50% rice hulls rates resulted in maximum Impatiens growth. In Expt. 2, shoot fresh weight was maximized in the 0 and 25% rice hulls treatments
Table 1. Effect of the volume proportion of rice hulls in a peat moss and a coir replacement series of treatments on mean bulk density, container capacity, plant available water and air space in a 15-cm tall column
Rice hulls(%)
Bulk density (g cm-3)
Container capacity (% by volume) Plant available water (% by volume) Air space (% by volume)Peat Coir Peat Coir
0 0.079 76.30 67.68 56.89 46.24 7.725 0.102 68.75 58.27 48.97 39.38 20.750 0.115 54.55 46.97 38.31 31.11 40.175 0.135 40.57 36.94 28.17 23.98 50.8100 0.134 24.45 24.45 15.68 15.68 59.9
LSD0.05z 0.010 3.85 3.85 7.6
Lineary <0.0001 <0.0001 <0.0001 <0.0001 <0.0001 <0.0001Quadratic 0.0044 0.0126 0.3157 0.1069 0.7135 0.1353
a 0.0847 81.4 68.4 59.2 46.6 8.97b0x 0.000568 -0.556 -0.431 -0.426 -0.306 0.538b1x
2 - - - - - -r2 0.8 0.98 0.98 0.98 0.97 0.88
CV 9 5 5 5 7 20ZLSD values for bulk density and air space are for comparing between rice hull contents. LSD values for container capacity and plant available water are for comparing substrate series for a given rice hull content or rice hull contents for a given substrate series. yThe equation coeffi cients for either the linear (y = a + b0x) or quadratic (y = a + b0 x + b1x
2) regression models are provided for whichever model had the lowest signifi cant Pr>F. The coeffi cient of determination (r2) and coeffi cient of variation (CV) were calculated for the best fi t model (n = 3). The regression models for bulk density and air space combined data from both substrate series (coir or sphagnum peat moss) since the substrate series x rice hull rate interaction was not signifi cant for these two dependent variables.
18 Effi cacy and physical properties of ground, composted rice hulls as a component of soilless substrate
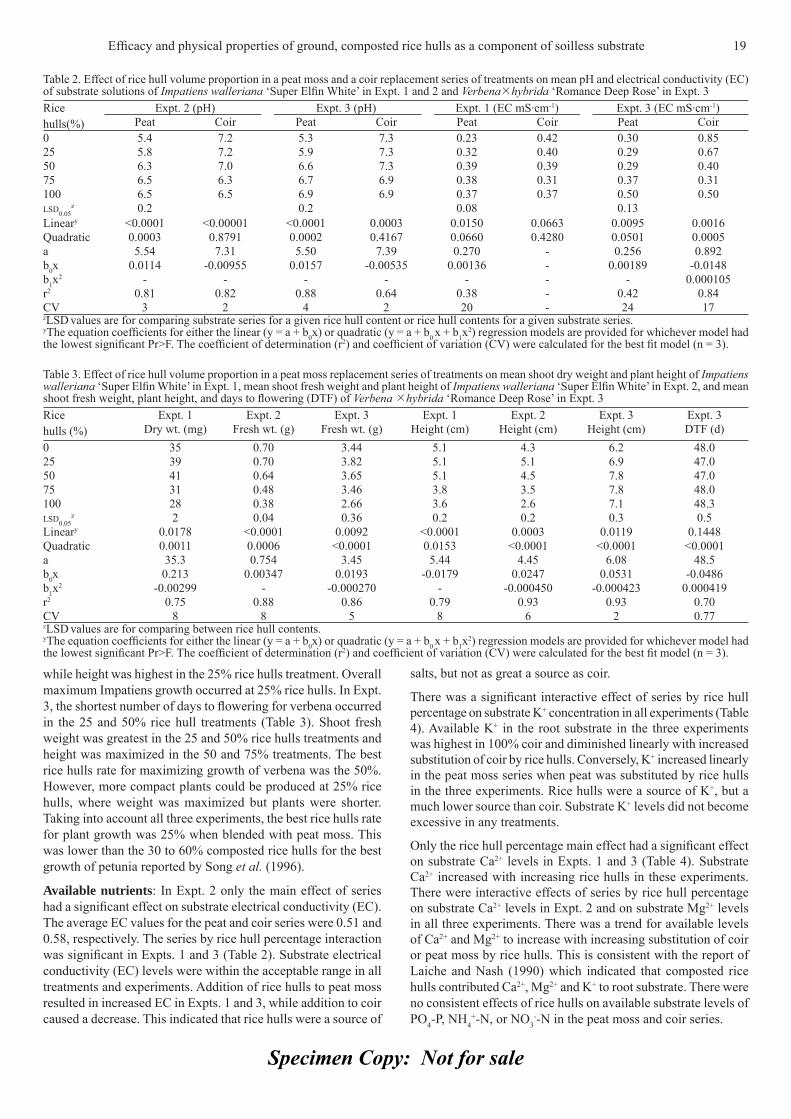
Specimen Copy: Not for sale
while height was highest in the 25% rice hulls treatment. Overall maximum Impatiens growth occurred at 25% rice hulls. In Expt. 3, the shortest number of days to fl owering for verbena occurred in the 25 and 50% rice hull treatments (Table 3). Shoot fresh weight was greatest in the 25 and 50% rice hulls treatments and height was maximized in the 50 and 75% treatments. The best rice hulls rate for maximizing growth of verbena was the 50%. However, more compact plants could be produced at 25% rice hulls, where weight was maximized but plants were shorter. Taking into account all three experiments, the best rice hulls rate for plant growth was 25% when blended with peat moss. This was lower than the 30 to 60% composted rice hulls for the best growth of petunia reported by Song et al. (1996).
Available nutrients: In Expt. 2 only the main effect of series had a signifi cant effect on substrate electrical conductivity (EC). The average EC values for the peat and coir series were 0.51 and 0.58, respectively. The series by rice hull percentage interaction was signifi cant in Expts. 1 and 3 (Table 2). Substrate electrical conductivity (EC) levels were within the acceptable range in all treatments and experiments. Addition of rice hulls to peat moss resulted in increased EC in Expts. 1 and 3, while addition to coir caused a decrease. This indicated that rice hulls were a source of
salts, but not as great a source as coir.
There was a signifi cant interactive effect of series by rice hull percentage on substrate K+ concentration in all experiments (Table 4). Available K+ in the root substrate in the three experiments was highest in 100% coir and diminished linearly with increased substitution of coir by rice hulls. Conversely, K+ increased linearly in the peat moss series when peat was substituted by rice hulls in the three experiments. Rice hulls were a source of K+, but a much lower source than coir. Substrate K+ levels did not become excessive in any treatments.
Only the rice hull percentage main effect had a signifi cant effect on substrate Ca2+ levels in Expts. 1 and 3 (Table 4). Substrate Ca2+ increased with increasing rice hulls in these experiments. There were interactive effects of series by rice hull percentage on substrate Ca2+ levels in Expt. 2 and on substrate Mg2+ levels in all three experiments. There was a trend for available levels of Ca2+ and Mg2+ to increase with increasing substitution of coir or peat moss by rice hulls. This is consistent with the report of Laiche and Nash (1990) which indicated that composted rice hulls contributed Ca2+, Mg2+ and K+ to root substrate. There were no consistent effects of rice hulls on available substrate levels of PO4-P, NH4
+-N, or NO3--N in the peat moss and coir series.
Table 2. Effect of rice hull volume proportion in a peat moss and a coir replacement series of treatments on mean pH and electrical conductivity (EC) of substrate solutions of Impatiens walleriana ‘Super Elfi n White’ in Expt. 1 and 2 and Verbena hybrida ‘Romance Deep Rose’ in Expt. 3Rice hulls(%)
Expt. 2 (pH) Expt. 3 (pH) Expt. 1 (EC mS·cm-1) Expt. 3 (EC mS·cm-1)Peat Coir Peat Coir Peat Coir Peat Coir
0 5.4 7.2 5.3 7.3 0.23 0.42 0.30 0.8525 5.8 7.2 5.9 7.3 0.32 0.40 0.29 0.6750 6.3 7.0 6.6 7.3 0.39 0.39 0.29 0.4075 6.5 6.3 6.7 6.9 0.38 0.31 0.37 0.31100 6.5 6.5 6.9 6.9 0.37 0.37 0.50 0.50LSD0.05
z 0.2 0.2 0.08 0.13Lineary <0.0001 <0.00001 <0.0001 0.0003 0.0150 0.0663 0.0095 0.0016Quadratic 0.0003 0.8791 0.0002 0.4167 0.0660 0.4280 0.0501 0.0005a 5.54 7.31 5.50 7.39 0.270 - 0.256 0.892b0x 0.0114 -0.00955 0.0157 -0.00535 0.00136 - 0.00189 -0.0148b1x
2 - - - - - - - 0.000105r2 0.81 0.82 0.88 0.64 0.38 - 0.42 0.84CV 3 2 4 2 20 - 24 17ZLSD values are for comparing substrate series for a given rice hull content or rice hull contents for a given substrate series. yThe equation coeffi cients for either the linear (y = a + b0x) or quadratic (y = a + b0 x + b1x
2) regression models are provided for whichever model had the lowest signifi cant Pr>F. The coeffi cient of determination (r2) and coeffi cient of variation (CV) were calculated for the best fi t model (n = 3).
Table 3. Effect of rice hull volume proportion in a peat moss replacement series of treatments on mean shoot dry weight and plant height of Impatiens walleriana ‘Super Elfi n White’ in Expt. 1, mean shoot fresh weight and plant height of Impatiens walleriana ‘Super Elfi n White’ in Expt. 2, and mean shoot fresh weight, plant height, and days to fl owering (DTF) of Verbena hybrida ‘Romance Deep Rose’ in Expt. 3Rice hulls (%)
Expt. 1 Expt. 2 Expt. 3 Expt. 1 Expt. 2 Expt. 3 Expt. 3Dry wt. (mg) Fresh wt. (g) Fresh wt. (g) Height (cm) Height (cm) Height (cm) DTF (d)
0 35 0.70 3.44 5.1 4.3 6.2 48.025 39 0.70 3.82 5.1 5.1 6.9 47.050 41 0.64 3.65 5.1 4.5 7.8 47.075 31 0.48 3.46 3.8 3.5 7.8 48.0100 28 0.38 2.66 3.6 2.6 7.1 48.3LSD0.05
z 2 0.04 0.36 0.2 0.2 0.3 0.5Lineary 0.0178 <0.0001 0.0092 <0.0001 0.0003 0.0119 0.1448Quadratic 0.0011 0.0006 <0.0001 0.0153 <0.0001 <0.0001 <0.0001a 35.3 0.754 3.45 5.44 4.45 6.08 48.5b0x 0.213 0.00347 0.0193 -0.0179 0.0247 0.0531 -0.0486b1x
2 -0.00299 - -0.000270 - -0.000450 -0.000423 0.000419r2 0.75 0.88 0.86 0.79 0.93 0.93 0.70CV 8 8 5 8 6 2 0.77ZLSD values are for comparing between rice hull contents. yThe equation coeffi cients for either the linear (y = a + b0x) or quadratic (y = a + b0 x + b1x
2) regression models are provided for whichever model had the lowest signifi cant Pr>F. The coeffi cient of determination (r2) and coeffi cient of variation (CV) were calculated for the best fi t model (n = 3).
Effi cacy and physical properties of ground, composted rice hulls as a component of soilless substrate 19
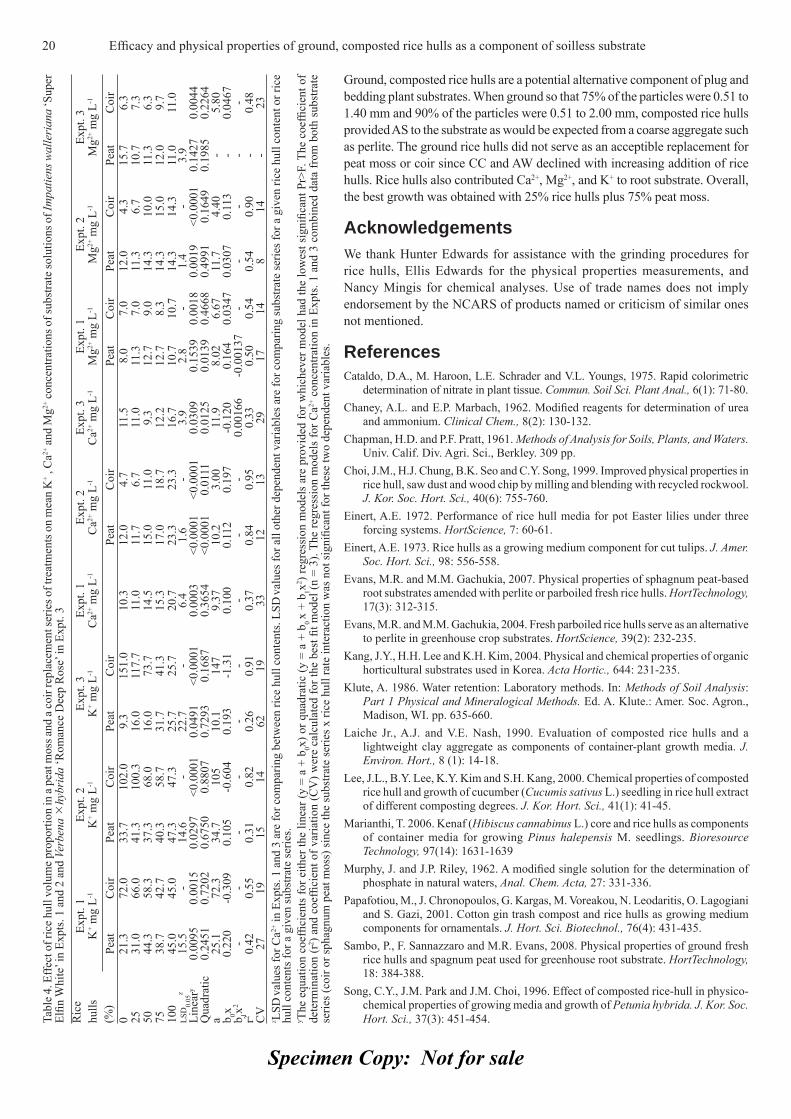
Specimen Copy: Not for sale
Ground, composted rice hulls are a potential alternative component of plug and bedding plant substrates. When ground so that 75% of the particles were 0.51 to 1.40 mm and 90% of the particles were 0.51 to 2.00 mm, composted rice hulls provided AS to the substrate as would be expected from a coarse aggregate such as perlite. The ground rice hulls did not serve as an acceptible replacement for peat moss or coir since CC and AW declined with increasing addition of rice hulls. Rice hulls also contributed Ca2+, Mg2+, and K+ to root substrate. Overall, the best growth was obtained with 25% rice hulls plus 75% peat moss.
AcknowledgementsWe thank Hunter Edwards for assistance with the grinding procedures for rice hulls, Ellis Edwards for the physical properties measurements, and Nancy Mingis for chemical analyses. Use of trade names does not imply endorsement by the NCARS of products named or criticism of similar ones not mentioned.
ReferencesCataldo, D.A., M. Haroon, L.E. Schrader and V.L. Youngs, 1975. Rapid colorimetric
determination of nitrate in plant tissue. Commun. Soil Sci. Plant Anal., 6(1): 71-80.Chaney, A.L. and E.P. Marbach, 1962. Modifi ed reagents for determination of urea
and ammonium. Clinical Chem., 8(2): 130-132.Chapman, H.D. and P.F. Pratt, 1961. Methods of Analysis for Soils, Plants, and Waters.
Univ. Calif. Div. Agri. Sci., Berkley. 309 pp. Choi, J.M., H.J. Chung, B.K. Seo and C.Y. Song, 1999. Improved physical properties in
rice hull, saw dust and wood chip by milling and blending with recycled rockwool. J. Kor. Soc. Hort. Sci., 40(6): 755-760.
Einert, A.E. 1972. Performance of rice hull media for pot Easter lilies under three forcing systems. HortScience, 7: 60-61.
Einert, A.E. 1973. Rice hulls as a growing medium component for cut tulips. J. Amer. Soc. Hort. Sci., 98: 556-558.
Evans, M.R. and M.M. Gachukia, 2007. Physical properties of sphagnum peat-based root substrates amended with perlite or parboiled fresh rice hulls. HortTechnology, 17(3): 312-315.
Evans, M.R. and M.M. Gachukia, 2004. Fresh parboiled rice hulls serve as an alternative to perlite in greenhouse crop substrates. HortScience, 39(2): 232-235.
Kang, J.Y., H.H. Lee and K.H. Kim, 2004. Physical and chemical properties of organic horticultural substrates used in Korea. Acta Hortic., 644: 231-235.
Klute, A. 1986. Water retention: Laboratory methods. In: Methods of Soil Analysis: Part 1 Physical and Mineralogical Methods. Ed. A. Klute.: Amer. Soc. Agron., Madison, WI. pp. 635-660.
Laiche Jr., A.J. and V.E. Nash, 1990. Evaluation of composted rice hulls and a lightweight clay aggregate as components of container-plant growth media. J. Environ. Hort., 8 (1): 14-18.
Lee, J.L., B.Y. Lee, K.Y. Kim and S.H. Kang, 2000. Chemical properties of composted rice hull and growth of cucumber (Cucumis sativus L.) seedling in rice hull extract of different composting degrees. J. Kor. Hort. Sci., 41(1): 41-45.
Marianthi, T. 2006. Kenaf (Hibiscus cannabinus L.) core and rice hulls as components of container media for growing Pinus halepensis M. seedlings. Bioresource Technology, 97(14): 1631-1639
Murphy, J. and J.P. Riley, 1962. A modifi ed single solution for the determination of phosphate in natural waters, Anal. Chem. Acta, 27: 331-336.
Papafotiou, M., J. Chronopoulos, G. Kargas, M. Voreakou, N. Leodaritis, O. Lagogiani and S. Gazi, 2001. Cotton gin trash compost and rice hulls as growing medium components for ornamentals. J. Hort. Sci. Biotechnol., 76(4): 431-435.
Sambo, P., F. Sannazzaro and M.R. Evans, 2008. Physical properties of ground fresh rice hulls and spagnum peat used for greenhouse root substrate. HortTechnology, 18: 384-388.
Song, C.Y., J.M. Park and J.M. Choi, 1996. Effect of composted rice-hull in physico-chemical properties of growing media and growth of Petunia hybrida. J. Kor. Soc. Hort. Sci., 37(3): 451-454.Ta
ble 4
. Effe
ct o
f ric
e hul
l vol
ume p
ropo
rtion
in a
peat
mos
s and
a co
ir re
plac
emen
t ser
ies o
f tre
atm
ents
on
mea
n K
+ , C
a2+ an
d M
g2+ co
ncen
tratio
ns o
f sub
stra
te so
lutio
ns o
f Im
patie
ns w
alle
rian
a ‘S
uper
Elfi n
Whi
te’ i
n Ex
pts.
1 an
d 2
and
Verb
ena
hybr
ida
‘Rom
ance
Dee
p R
ose’
in E
xpt.
3R
ice
hulls
(%)
Expt
. 1Ex
pt. 2
Expt
. 3Ex
pt. 1
Expt
. 2Ex
pt. 3
Expt
. 1Ex
pt. 2
Expt
. 3K
+ mg
L-1K
+ mg
L-1K
+ mg
L-1C
a2+ m
g L-1
Ca2+
mg
L-1C
a2+ m
g L-1
Mg2+
mg
L-1M
g2+ m
g L-1
Mg2+
mg
L-1
Peat
Coi
rPe
atC
oir
Peat
Coi
rPe
atC
oir
Peat
Coi
rPe
atC
oir
Peat
Coi
r0
21.3
72.0
33.7
102.
09.
315
1.0
10.3
12.0
4.7
11.5
8.0
7.0
12.0
4.3
15.7
6.3
2531
.066
.041
.310
0.3
16.0
117.
711
.011
.76.
711
.011
.37.
011
.36.
710
.77.
350
44.3
58.3
37.3
68.0
16.0
73.7
14.5
15.0
11.0
9.3
12.7
9.0
14.3
10.0
11.3
6.3
7538
.742
.740
.358
.731
.741
.315
.317
.018
.712
.212
.78.
314
.315
.012
.09.
710
045
.045
.047
.347
.325
.725
.720
.723
.323
.316
.710
.710
.714
.314
.311
.011
.0LS
D0.
05z
15.5
-14
.6-
22.7
-6.
41.
6-
3.9
2.8
-1.
4-
3.9
Line
ary
0.00
950.
0015
0.02
97<0
.000
10.
0491
<0.0
001
0.00
03<0
.000
1<0
.000
10.
0309
0.15
390.
0018
0.00
19<0
.000
10.
1427
0.00
44Q
uadr
atic
0.24
510.
7202
0.67
500.
8807
0.72
930.
1687
0.36
54<0
.000
10.
0111
0.01
250.
0139
0.46
680.
4991
0.16
490.
1985
0.22
64a
25.1
72.3
34.7
105
10.1
147
9.37
10.2
3.00
11.9
8.02
6.67
11.7
4.40
-5.
80b 0x
0.22
0-0
.309
0.10
5-0
.604
0.19
3-1
.31
0.10
00.
112
0.19
7-0
.120
0.16
40.
0347
0.03
070.
113
-0.
0467
b 1x2
--
--
--
--
-0.
0016
6-0
.001
37-
--
--
r20.
420.
550.
310.
820.
260.
910.
370.
840.
950.
330.
500.
540.
540.
90-
0.48
CV
2719
1514
6219
3312
1329
1714
814
-23
Z LSD
valu
es fo
r Ca2+
in E
xpts
. 1 a
nd 3
are
for c
ompa
ring
betw
een
rice
hull
cont
ents
. LSD
valu
es fo
r all
othe
r dep
ende
nt v
aria
bles
are
for c
ompa
ring
subs
trate
serie
s for
a g
iven
rice
hul
l con
tent
or r
ice
hull
cont
ents
for a
giv
en su
bstra
te se
ries.
y The
equ
atio
n co
effi c
ient
s fo
r eith
er th
e lin
ear (
y =
a +
b 0x) o
r qua
drat
ic (y
= a
+ b
0 x
+ b 1x
2 ) re
gres
sion
mod
els
are
prov
ided
for w
hich
ever
mod
el h
ad th
e lo
wes
t sig
nifi c
ant P
r>F.
The
coe
ffi ci
ent o
f de
term
inat
ion
(r2 )
and
coeffi c
ient
of v
aria
tion
(CV
) wer
e ca
lcul
ated
for t
he b
est fi
t m
odel
(n =
3).
The
regr
essi
on m
odel
s fo
r Ca2+
con
cent
ratio
n in
Exp
ts. 1
and
3 c
ombi
ned
data
from
bot
h su
bstra
te
serie
s (co
ir or
spha
gnum
pea
t mos
s) si
nce
the
subs
trate
serie
s x ri
ce h
ull r
ate
inte
ract
ion
was
not
sign
ifi ca
nt fo
r the
se tw
o de
pend
ent v
aria
bles
.
20 Effi cacy and physical properties of ground, composted rice hulls as a component of soilless substrate
Specimen Copy: Not for sale
Journal of Applied Horticulture, 12(1): 21-25, January-June, 2010
Diallel analysis for fruit traits among tomato recombinant inbred lines derived from an interspecifi c cross Solanum lycopersicum x S. pimpinellifolium
E. Marchionni Basté*, D.R. Liberatti, S.L. Mahuad1, G.R. Rodriguez#, G.R. Pratta, R. Zorzoli2 and L. A. Picardi2
CONICET, Cátedra de Genética, Facultad de Ciencias Agrarias UNR, CC 14 S2125ZAA, Zavalla, Argentina. 1 FONCyT, Cátedra de Genética, Facultad de Ciencias Agrarias UNR, CC 14 S2125ZAA, Zavalla, Argentina. 2 CIUNR, Cátedra de Genética, Facultad de Ciencias Agrarias UNR, Zavalla, Argentina. # Present address: Department of Horticulture and Crop Science, The Ohio State University/OARDC, Wooster, OH 44691, USA. *E-mail: [email protected]
AbstractFive recombinant inbred lines, generated from a single interspecifi c cross S. lycopersicum x S. pimpinellifolium, were crossed in a complete diallel combination without reciprocal. Fruit quality traits were analyzed according to Griffi ng (1956), method 2, model 1 (fi xed effects). Signifi cant general and specifi c combining ability (GCA and SCA) effects were found for all traits. Weight, refl ectance percentage, chroma index, fi rmness, soluble solids content, pH and titratable acidity presented SCA values greater than GCA values, indicating nonadditive effects. Both additive and nonadditive effects were signifi cant in determining diameter and shape. Positive unidirectional dominance was found for shape, shelf life and chroma index, while negative unidirectional dominance was involved in the expression of weight, diameter, height, refl ectance percentage and fi rmness. Bidirectional dominance was found for soluble solids content, pH and titratable acidity. In spite of being a genetic pool generated from a single interspecifi c cross, high levels of genotypic and phenotypic variability was found among the fi fteen genotypes for important agronomic traits. Both additive and nonadditive effects were important in the genetic determination of these traits.
Key words: Plant breeding, diallel analysis, combining ability, Solanum lycopersicum, recombinant inbred lines
IntroductionIn most of tomato (Solanum lycopersicum) breeding programs, emphasis is given to increase yield relegating important traits as fruit quality (size, shape, color, and fl avour) and postharvest attributes (fi rmness and shelf life). Quality is given by organoleptic characteristics, those that can be perceived by all senses (fl avour, aroma, colour and texture). The genetic uniformity of the cultivated species is due to the high selection pressure applied to achieve the desired phenotype, decreasing the possibilities of a successful breeding program. In this way, a plateau has been reached that limits the increase of the fruit quality and postharvest characters (Kannenberg and Falk, 1993).
The interest for the wild species has increased in order to extend the genetic variability, in view of the fact that they present organoleptic characteristics demanded by the international market. By interespecifi c crossing (hybridization), it is possible to transfers this characteristics to cultivated species and generate a genetic variability owed to the heterotics effect caused by the interactions among divergent genotypes (Rick, 1976). Lecomte et al. (2004); Monforte et al. (2001); Rousseaux et al. (2005) pointed out that wild germplasm contributes to an increase in internal fruit quality but they reduce fruit weight.
Despite the advances of “molecular breeding”, classical quantitative genetics remains useful in practical tomato improvement. Thus, estimation of genetic parameters such as heterosis and combining ability gives inferences about the
predominant action of the genes, indicates the appropriate selection strategy to be applied in the breeding program and allows the identifi cation of the best parents. Diallel mating designs provide useful genetic information, such as general combining ability (GCA) and specifi c combining ability (SCA), to devise appropriate breeding and selection strategies. Griffi ng method (1956) partitions the genetic variability into additive component (estimated by GCA) and non additive component (estimated by SCA). The diallel analysis helps specifi cally to choose the most promising segregant populations for selection.
Pratta et al. (1996) evaluating postharvest characteristics in cultivated and wild genotypes, selected the wild accession LA722 of S. pimpinellifolium as the high postharvest value. This wild species presents fruits with small size and low weight, but with high nutritional quality and, in natural conditions, preserves organoleptic qualities for a larger period of time than the commercial ones. Pratta et al. (2003) analyzed productive traits such as fruit weight, diameter, height and shelf life in a diallel design among domestic, exotic and mutant germplasms. They found that the most promising hybrid for breeding all traits simultaneously was the F1 between the cultivar Caimanta and the accession LA722 of S. pimpinellifolium, since it had the largest differences in allele frequencies and the greatest genetic divergence. Based on these results, Rodriguez et al. (2006a) carried out a selection for fruit weight and shelf life in a F2 generation from a cross between the cultivar Caimanta and the accession LA722 obtaining 17 RILs (Recombinant Inbred
Journal
Appl
E. Marchionni Basté, D.R. Liberatti and S.L. Mahuad equally contribute to this work.
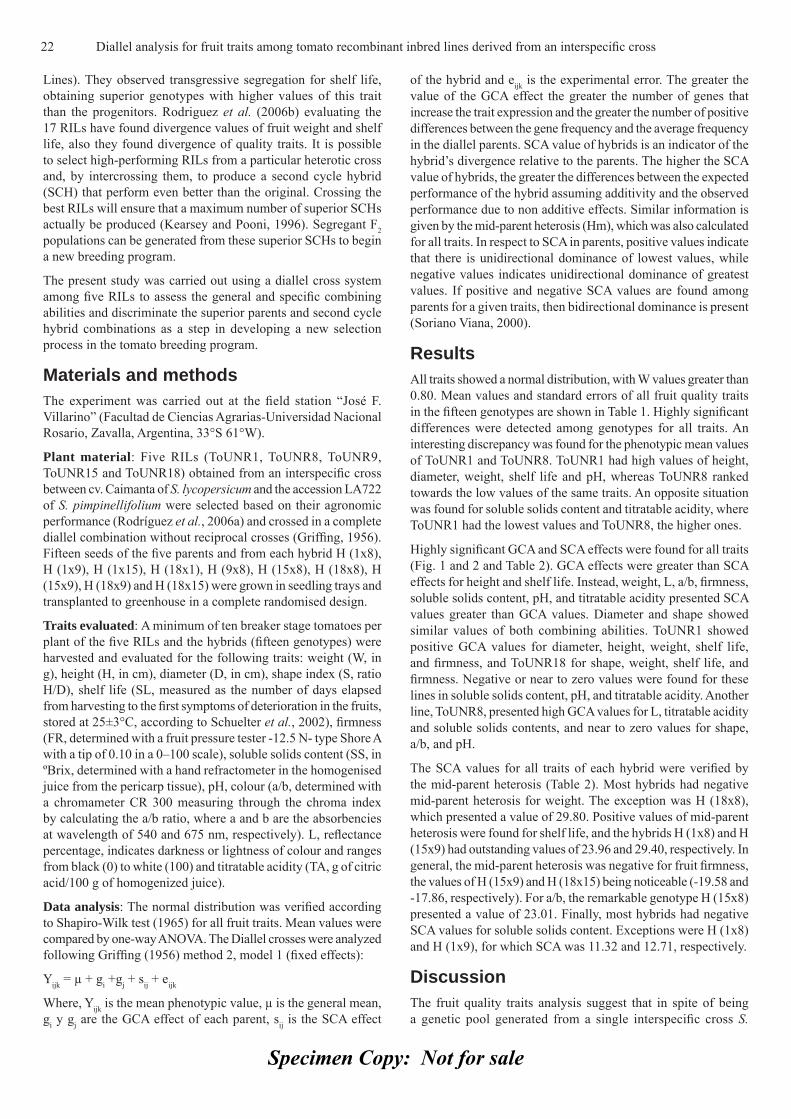
Specimen Copy: Not for sale
Lines). They observed transgressive segregation for shelf life, obtaining superior genotypes with higher values of this trait than the progenitors. Rodriguez et al. (2006b) evaluating the 17 RILs have found divergence values of fruit weight and shelf life, also they found divergence of quality traits. It is possible to select high-performing RILs from a particular heterotic cross and, by intercrossing them, to produce a second cycle hybrid (SCH) that perform even better than the original. Crossing the best RILs will ensure that a maximum number of superior SCHs actually be produced (Kearsey and Pooni, 1996). Segregant F2 populations can be generated from these superior SCHs to begin a new breeding program.
The present study was carried out using a diallel cross system among fi ve RILs to assess the general and specifi c combining abilities and discriminate the superior parents and second cycle hybrid combinations as a step in developing a new selection process in the tomato breeding program.
Materials and methodsThe experiment was carried out at the fi eld station “José F. Villarino” (Facultad de Ciencias Agrarias-Universidad Nacional Rosario, Zavalla, Argentina, 33°S 61°W).
Plant material: Five RILs (ToUNR1, ToUNR8, ToUNR9, ToUNR15 and ToUNR18) obtained from an interspecifi c cross between cv. Caimanta of S. lycopersicum and the accession LA722 of S. pimpinellifolium were selected based on their agronomic performance (Rodríguez et al., 2006a) and crossed in a complete diallel combination without reciprocal crosses (Griffi ng, 1956). Fifteen seeds of the fi ve parents and from each hybrid H (1x8), H (1x9), H (1x15), H (18x1), H (9x8), H (15x8), H (18x8), H (15x9), H (18x9) and H (18x15) were grown in seedling trays and transplanted to greenhouse in a complete randomised design.
Traits evaluated: A minimum of ten breaker stage tomatoes per plant of the fi ve RILs and the hybrids (fi fteen genotypes) were harvested and evaluated for the following traits: weight (W, in g), height (H, in cm), diameter (D, in cm), shape index (S, ratio H/D), shelf life (SL, measured as the number of days elapsed from harvesting to the fi rst symptoms of deterioration in the fruits, stored at 25±3°C, according to Schuelter et al., 2002), fi rmness (FR, determined with a fruit pressure tester -12.5 N- type Shore A with a tip of 0.10 in a 0–100 scale), soluble solids content (SS, in ºBrix, determined with a hand refractometer in the homogenised juice from the pericarp tissue), pH, colour (a/b, determined with a chromameter CR 300 measuring through the chroma index by calculating the a/b ratio, where a and b are the absorbencies at wavelength of 540 and 675 nm, respectively). L, refl ectance percentage, indicates darkness or lightness of colour and ranges from black (0) to white (100) and titratable acidity (TA, g of citric acid/100 g of homogenized juice).
Data analysis: The normal distribution was verifi ed according to Shapiro-Wilk test (1965) for all fruit traits. Mean values were compared by one-way ANOVA. The Diallel crosses were analyzed following Griffi ng (1956) method 2, model 1 (fi xed effects):
Yijk = μ + gi +gj + sij + eijk
Where, Yijk is the mean phenotypic value, μ is the general mean, gi y gj are the GCA effect of each parent, sij is the SCA effect
of the hybrid and eijk is the experimental error. The greater the value of the GCA effect the greater the number of genes that increase the trait expression and the greater the number of positive differences between the gene frequency and the average frequency in the diallel parents. SCA value of hybrids is an indicator of the hybrid’s divergence relative to the parents. The higher the SCA value of hybrids, the greater the differences between the expected performance of the hybrid assuming additivity and the observed performance due to non additive effects. Similar information is given by the mid-parent heterosis (Hm), which was also calculated for all traits. In respect to SCA in parents, positive values indicate that there is unidirectional dominance of lowest values, while negative values indicates unidirectional dominance of greatest values. If positive and negative SCA values are found among parents for a given traits, then bidirectional dominance is present (Soriano Viana, 2000).
ResultsAll traits showed a normal distribution, with W values greater than 0.80. Mean values and standard errors of all fruit quality traits in the fi fteen genotypes are shown in Table 1. Highly signifi cant differences were detected among genotypes for all traits. An interesting discrepancy was found for the phenotypic mean values of ToUNR1 and ToUNR8. ToUNR1 had high values of height, diameter, weight, shelf life and pH, whereas ToUNR8 ranked towards the low values of the same traits. An opposite situation was found for soluble solids content and titratable acidity, where ToUNR1 had the lowest values and ToUNR8, the higher ones.
Highly signifi cant GCA and SCA effects were found for all traits (Fig. 1 and 2 and Table 2). GCA effects were greater than SCA effects for height and shelf life. Instead, weight, L, a/b, fi rmness, soluble solids content, pH, and titratable acidity presented SCA values greater than GCA values. Diameter and shape showed similar values of both combining abilities. ToUNR1 showed positive GCA values for diameter, height, weight, shelf life, and fi rmness, and ToUNR18 for shape, weight, shelf life, and fi rmness. Negative or near to zero values were found for these lines in soluble solids content, pH, and titratable acidity. Another line, ToUNR8, presented high GCA values for L, titratable acidity and soluble solids contents, and near to zero values for shape, a/b, and pH.
The SCA values for all traits of each hybrid were verifi ed by the mid-parent heterosis (Table 2). Most hybrids had negative mid-parent heterosis for weight. The exception was H (18x8), which presented a value of 29.80. Positive values of mid-parent heterosis were found for shelf life, and the hybrids H (1x8) and H (15x9) had outstanding values of 23.96 and 29.40, respectively. In general, the mid-parent heterosis was negative for fruit fi rmness, the values of H (15x9) and H (18x15) being noticeable (-19.58 and -17.86, respectively). For a/b, the remarkable genotype H (15x8) presented a value of 23.01. Finally, most hybrids had negative SCA values for soluble solids content. Exceptions were H (1x8) and H (1x9), for which SCA was 11.32 and 12.71, respectively.
DiscussionThe fruit quality traits analysis suggest that in spite of being a genetic pool generated from a single interspecifi c cross S.
22 Diallel analysis for fruit traits among tomato recombinant inbred lines derived from an interspecifi c cross

Specimen Copy: Not for sale
lycopersicum x S. pimpinellifolium (‘Caimanta’ x LA722), there exist high levels of genetic variability among the fi fteen genotypes. Recombination and/or genomic rearrangements occurring during the selfi ng for obtaining and stabilizing the lines could be the causes of such a genetic variability. Rodríguez et al. (2006b) analyzed 17 RILs (that included the fi ve ones evaluated in this work) and also found high genetic variability, suggesting that these genotypes constitute a new source of variability for use in breeding programs.
High signifi cant values of GCA and SCA indicate that both additive and nonadditive gene actions affect the expression of the traits. Additive gene action was important for determining height and shelf life since GCA effects were greater than SCA effects. Instead, weight, L, a/b, fi rmness, soluble solids content, pH and titratable acidity presented SCA values greater than GCA values, indicating that nonadditive effects have the greatest contribution in controlling these traits. Garg et al. (2008) found the similar genetic control for fi rmness, pH, and titratable acidity in different tomato genotypes. Dhatt et al. (2004) have also reported the importance
of nonadditive effects in the genetic control of fruit fi rmness. In contrast, Chadha et al. (2002), Das et al (1988) and Rodriguez et al. (2004) reported additive effects in the expression of fruit weight. These discrepancies could be explained by differences in gene frequencies among the populations studied in each research. In the present one, original experimental lines obtained in a novel breeding program were analyzed whereas in the others, plant material included more divergent germplasm such as mutant and exotic genotypes. Pratta et al. (2003) and Zorzoli et al. (2000) also found predominance of additive effects in the genetic control of weight and nonadditive effects for shelf life, when analyzing the parents of the single cross from which the RILs were derived. These results agree with the above mentioned authors but not with the present results. Hence differences in genetic frequencies could not be proposed to explain these discrepancies, so that the previously mentioned recombination and/or genomic rearrangements could account for them. Finally, both additive and nonadditive effects were important in determining the expression of diameter and shape.
Table 1. Mean value and standard error of fruit quality traits in tomato
Genotype D H S W SL L a/b FR SS pH TA
ToUNR1 3.55 ± 0.06 2.85 ± 0.09 0.81 ± 0.02 21.66 ± 1.35 24.79 ± 1.18 39.81 ± 1.68 1.04 ± 0.15 54.17 ± 7.06 5.54 ± 0.25 4.96 ± 0.05 0.32 ± 0.02ToUNR8 1.58 ± 0.06 1.42 ± 0.04 0.90 ± 0.01 2.34 ± 0.21 17.98 ± 0.62 40.42 ± 1.37 1.14 ± 0.11 54.55 ± 4.68 9.30 ± 0.66 4.51 ± 0.09 0.65 ± 0.02ToUNR9 1.83 ± 0.06 1.63 ± 0.04 0.89 ± 0.01 3.81 ± 0.32 18.70 ± 0.43 37.09 ± 0.40 1.37 ± 0.05 53.39 ± 3.38 7.04 ± 0.18 4.35 ± 0.05 0.79 ± 0.04ToUNR15 2.84 ± 0.09 2.22 ± 0.07 0.79 ± 0.02 11.59 ± 1.04 14.41 ± 1.49 38.81 ± 1.66 1.12 ± 0.16 54.32 ± 4.52 7.91 ± 0.34 4.61 ± 0.11 0.44 ± 0.03ToUNR18 2.83 ± 0.06 2.77 ± 0.07 0.97 ± 0.02 13.72 ± 0.72 21.11 ± 1.20 36.54 ± 1.54 1.15 ± 0.10 52.47 ± 4.51 7.69 ± 0.26 4.72 ± 0.07 0.37 ± 0.03H (1x8) 2.21 ± 0.05 1.90 ± 0.03 0.88 ± 0.01 5.80 ± 0.23 26.51 ± 1.24 35.39 ± 0.94 1.18 ± 0.06 47.15 ± 4.68 8.26 ± 0.24 4.50 ± 0.07 0.59 ± 0.05H (1x9) 2.17 ± 0.03 2.02 ± 0.02 0.94 ± 0.02 5.81 ± 0.02 24.60 ± 1.27 37.82 ± 1.04 1.19 ± 0.07 55.71 ± 6.88 7.09 ± 0.21 4.65 ± 0.11 0.39 ± 0.05H (1x15) 2.40 ± 0.07 2.09 ± 0.07 0.89 ± 0.01 7.31 ± 0.05 21.93 ± 1.40 37.96 ± 1.14 1.25 ± 0.09 45.53 ± 7.40 5.49 ± 0.44 4.49 ± 0.09 0.42 ± 0.06H (18x1) 2.59 ± 0.11 2.59 ± 0.09 1.02 ± 0.02 10.62 ± 0.99 23.08 ± 1.80 37.11 ± 1.00 1.15 ± 0.12 54.85 ± 7.72 6.48 ± 0.34 4.54 ± 0.08 0.44 ± 0.07H (9x8) 1.8 ± 0.04 1.67 ± 0.07 0.93 ± 0.02 3.36 ± 0.26 18.77 ± 0.93 38.09 ± 1.04 1.27 ± 0.08 48.89 ± 6.27 8.09 ± 0.87 4.42 ± 0.08 0.55 ± 0.08H (15x8) 1.84 ± 0.04 1.64 ± 0.04 0.89 ± 0.01 3.50 ± 0.22 15.47 ± 0.75 37.46 ± 0.58 1.39 ± 0.07 52.39 ± 5.12 6.89 ± 0.36 4.62 ± 0.11 0.55 ± 0.04H (18x8) 2.57 ± 0.05 2.47 ± 0.06 0.97 ± 0.02 10.42 ± 0.66 20.58 ± 1.06 36.99 ± 0.68 1.23 ± 0.11 44.87 ± 7.07 7.31 ± 0.27 4.74 ± 0.10 0.33 ± 0.02H (15x9) 2.36 ± 0.04 2.11 ± 0.03 0.91 ± 0.01 7.37 ± 0.32 21.42 ± 0.84 36.29 ± 0.99 1.24 ± 0.12 43.31 ± 8.33 7.20 ± 0.22 4.50 ± 0.09 0.55 ± 0.04H (18x9) 1.96 ± 0.05 1.89 ± 0.05 0.98 ± 0.01 4.62 ± 0.31 20.67 ± 0.98 36.86 ± 1.13 1.26 ± 0.10 49.00 ± 7.13 7.23 ± 1.52 4.62 ± 0.08 0.40 ± 0.07H (18x15) 2.63 ± 0.08 2.41 ± 0.09 0.92 ± 0.03 10.64 ± 0.95 14.68 ± 0.88 37.39 ± 1.27 1.19 ± 0.17 43.86 ± 8.44 7.35 ± 0.53 4.65 ± 0.18 0.46 ± 0.03
F 70.80*** 50.17*** 14.52*** 61.90*** 10.78*** 37.13*** 21.14*** 14.35*** 28.51*** 23.90*** 79.11***
***P<0.0001
Table 2. Mid-parent heterosis (Hm) and specifi c combinatory ability (SCA) of fruit quality traits in tomato hybrids
Genotype D H S W SL L a/b FR SS pH TAHm SCA Hm SCA Hm SCA Hm SCA Hm SCA Hm SCA Hm SCA Hm SCA Hm SCA Hm SCA Hm SCA
H (1x8) -13.80 -0.12 -11.00 -0.14 2.92 -0.01 -51.70 -2.74 23.96 3.40 -11.78 -2.99 8.26 0.02 -13.27 -4.63 11.32 0.94 -4.96 -0.13 21.65 0.11H (1x9) -19.30 -0.22 -9.80 -0.08 10.60 0.04 -54.40 -2.87 13.13 0.74 -1.64 0.23 -1.24 -0.02 3.59 3.74 12.71 0.55 -0.11 0.07 -29.73 -0.11H (1x15) -24.90 -0.41 -17.50 -0.26 11.25 0.04 -56.00 -4.69 11.90 1.00 -3.43 -0.13 15.74 0.09 -16.07 -5.02 -18.36 -0.92 -6.16 -0.17 10.53 0.00H (18x1) -18.80 -0.29 -7.80 -0.07 14.60 0.08 -39.90 -3.06 0.57 -0.54 -2.79 -0.22 5.02 0.02 2.87 3.76 -2.04 -0.07 -6.20 -0.19 27.54 0.09H (9x8) 5.50 0.11 9.50 0.11 3.91 0.00 9.30 1.10 2.34 -1.03 -1.72 0.38 1.19 -0.01 -9.41 -1.77 -0.98 0.01 -0.22 -0.04 -23.61 -0.07H (15x8) -16.70 -0.27 -9.90 -0.17 5.32 0.02 -49.70 -2.06 -4.48 -1.39 -5.44 -0.75 23.01 0.16 -3.76 3.15 -19.93 -1.05 1.32 0.07 0.92 0.01H (18x8) 16.50 0.39 17.90 0.35 3.74 0.01 29.80 3.20 5.30 1.01 -3.87 -0.47 7.40 0.30 -16.15 -4.91 -13.95 -0.78 2.71 0.12 -35.29 -0.14H (15x9) 1.10 0.20 9.60 0.24 8.30 0.03 -4.28 1.70 29.40 3.76 -4.37 -1.13 -4.00 -0.04 -19.58 -6.11 -3.68 0.04 0.45 0.01 -10.57 -0.01H (18x9) -15.90 -0.27 -14.10 -29.00 5.38 0.01 -47.30 -2.76 3.84 0.31 0.12 0.19 0.00 0.00 -7.43 -0.96 -1.83 -0.08 1.87 0.06 -31.03 -0.09H (18x15) -7.20 -0.03 -3.40 -0.02 4.54 0.00 -15.90 -0.06 -17.34 -2.75 -0.76 0.23 4.85 0.00 -17.86 -4.68 -5.77 0.18 -0.32 0.00 13.58 0.06
Diallel analysis for fruit traits among tomato recombinant inbred lines derived from an interspecifi c cross 23
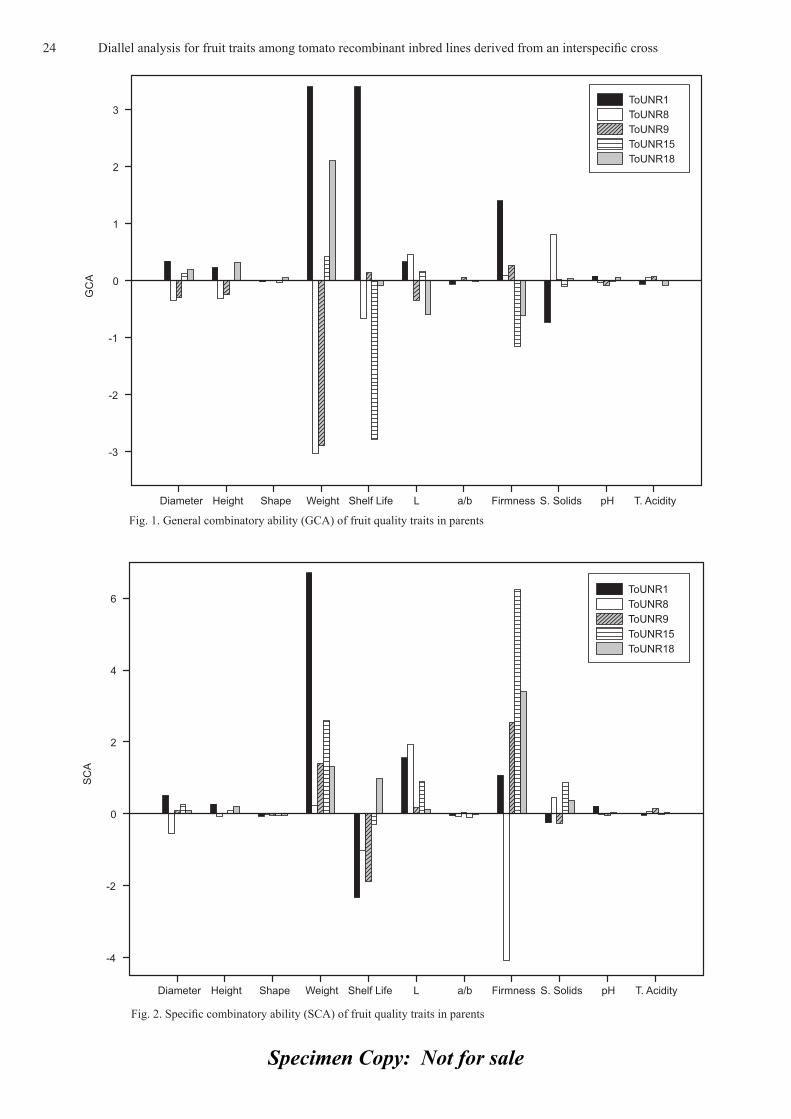
Specimen Copy: Not for sale
Fig. 2. Specifi c combinatory ability (SCA) of fruit quality traits in parents
Fig. 1. General combinatory ability (GCA) of fruit quality traits in parents
24 Diallel analysis for fruit traits among tomato recombinant inbred lines derived from an interspecifi c cross
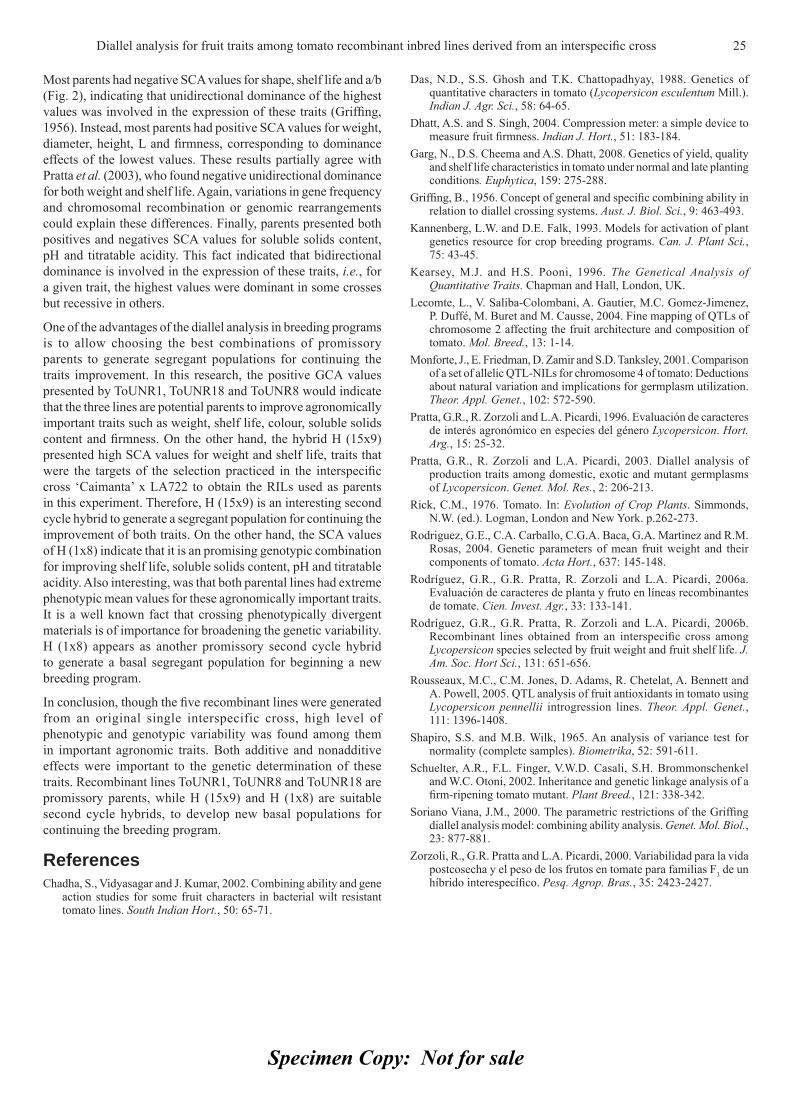
Specimen Copy: Not for sale
Most parents had negative SCA values for shape, shelf life and a/b (Fig. 2), indicating that unidirectional dominance of the highest values was involved in the expression of these traits (Griffi ng, 1956). Instead, most parents had positive SCA values for weight, diameter, height, L and fi rmness, corresponding to dominance effects of the lowest values. These results partially agree with Pratta et al. (2003), who found negative unidirectional dominance for both weight and shelf life. Again, variations in gene frequency and chromosomal recombination or genomic rearrangements could explain these differences. Finally, parents presented both positives and negatives SCA values for soluble solids content, pH and titratable acidity. This fact indicated that bidirectional dominance is involved in the expression of these traits, i.e., for a given trait, the highest values were dominant in some crosses but recessive in others.
One of the advantages of the diallel analysis in breeding programs is to allow choosing the best combinations of promissory parents to generate segregant populations for continuing the traits improvement. In this research, the positive GCA values presented by ToUNR1, ToUNR18 and ToUNR8 would indicate that the three lines are potential parents to improve agronomically important traits such as weight, shelf life, colour, soluble solids content and fi rmness. On the other hand, the hybrid H (15x9) presented high SCA values for weight and shelf life, traits that were the targets of the selection practiced in the interspecifi c cross ‘Caimanta’ x LA722 to obtain the RILs used as parents in this experiment. Therefore, H (15x9) is an interesting second cycle hybrid to generate a segregant population for continuing the improvement of both traits. On the other hand, the SCA values of H (1x8) indicate that it is an promising genotypic combination for improving shelf life, soluble solids content, pH and titratable acidity. Also interesting, was that both parental lines had extreme phenotypic mean values for these agronomically important traits. It is a well known fact that crossing phenotypically divergent materials is of importance for broadening the genetic variability. H (1x8) appears as another promissory second cycle hybrid to generate a basal segregant population for beginning a new breeding program.
In conclusion, though the fi ve recombinant lines were generated from an original single interspecific cross, high level of phenotypic and genotypic variability was found among them in important agronomic traits. Both additive and nonadditive effects were important to the genetic determination of these traits. Recombinant lines ToUNR1, ToUNR8 and ToUNR18 are promissory parents, while H (15x9) and H (1x8) are suitable second cycle hybrids, to develop new basal populations for continuing the breeding program.
ReferencesChadha, S., Vidyasagar and J. Kumar, 2002. Combining ability and gene
action studies for some fruit characters in bacterial wilt resistant tomato lines. South Indian Hort., 50: 65-71.
Das, N.D., S.S. Ghosh and T.K. Chattopadhyay, 1988. Genetics of quantitative characters in tomato (Lycopersicon esculentum Mill.). Indian J. Agr. Sci., 58: 64-65.
Dhatt, A.S. and S. Singh, 2004. Compression meter: a simple device to measure fruit fi rmness. Indian J. Hort., 51: 183-184.
Garg, N., D.S. Cheema and A.S. Dhatt, 2008. Genetics of yield, quality and shelf life characteristics in tomato under normal and late planting conditions. Euphytica, 159: 275-288.
Griffi ng, B., 1956. Concept of general and specifi c combining ability in relation to diallel crossing systems. Aust. J. Biol. Sci., 9: 463-493.
Kannenberg, L.W. and D.E. Falk, 1993. Models for activation of plant genetics resource for crop breeding programs. Can. J. Plant Sci., 75: 43-45.
Kearsey, M.J. and H.S. Pooni, 1996. The Genetical Analysis of Quantitative Traits. Chapman and Hall, London, UK.
Lecomte, L., V. Saliba-Colombani, A. Gautier, M.C. Gomez-Jimenez, P. Duffé, M. Buret and M. Causse, 2004. Fine mapping of QTLs of chromosome 2 affecting the fruit architecture and composition of tomato. Mol. Breed., 13: 1-14.
Monforte, J., E. Friedman, D. Zamir and S.D. Tanksley, 2001. Comparison of a set of allelic QTL-NILs for chromosome 4 of tomato: Deductions about natural variation and implications for germplasm utilization. Theor. Appl. Genet., 102: 572-590.
Pratta, G.R., R. Zorzoli and L.A. Picardi, 1996. Evaluación de caracteres de interés agronómico en especies del género Lycopersicon. Hort. Arg., 15: 25-32.
Pratta, G.R., R. Zorzoli and L.A. Picardi, 2003. Diallel analysis of production traits among domestic, exotic and mutant germplasms of Lycopersicon. Genet. Mol. Res., 2: 206-213.
Rick, C.M., 1976. Tomato. In: Evolution of Crop Plants. Simmonds, N.W. (ed.). Logman, London and New York. p.262-273.
Rodriguez, G.E., C.A. Carballo, C.G.A. Baca, G.A. Martinez and R.M. Rosas, 2004. Genetic parameters of mean fruit weight and their components of tomato. Acta Hort., 637: 145-148.
Rodríguez, G.R., G.R. Pratta, R. Zorzoli and L.A. Picardi, 2006a. Evaluación de caracteres de planta y fruto en líneas recombinantes de tomate. Cien. Invest. Agr., 33: 133-141.
Rodríguez, G.R., G.R. Pratta, R. Zorzoli and L.A. Picardi, 2006b. Recombinant lines obtained from an interspecifi c cross among Lycopersicon species selected by fruit weight and fruit shelf life. J. Am. Soc. Hort Sci., 131: 651-656.
Rousseaux, M.C., C.M. Jones, D. Adams, R. Chetelat, A. Bennett and A. Powell, 2005. QTL analysis of fruit antioxidants in tomato using Lycopersicon pennellii introgression lines. Theor. Appl. Genet., 111: 1396-1408.
Shapiro, S.S. and M.B. Wilk, 1965. An analysis of variance test for normality (complete samples). Biometrika, 52: 591-611.
Schuelter, A.R., F.L. Finger, V.W.D. Casali, S.H. Brommonschenkel and W.C. Otoni, 2002. Inheritance and genetic linkage analysis of a fi rm-ripening tomato mutant. Plant Breed., 121: 338-342.
Soriano Viana, J.M., 2000. The parametric restrictions of the Griffi ng diallel analysis model: combining ability analysis. Genet. Mol. Biol., 23: 877-881.
Zorzoli, R., G.R. Pratta and L.A. Picardi, 2000. Variabilidad para la vida postcosecha y el peso de los frutos en tomate para familias F3 de un híbrido interespecífi co. Pesq. Agrop. Bras., 35: 2423-2427.
Diallel analysis for fruit traits among tomato recombinant inbred lines derived from an interspecifi c cross 25
Specimen Copy: Not for sale
Journal of Applied Horticulture, 12(1): 26-29, January-June, 2010
Pepper (Capsicum annuum L.) responses to surface and drip irrigation in southern Tunisia
Mohamed Thabet* and Khemaies Zayani1
Institut des Régions Arides, 4119 Médenine, Tunisie. 1Institut Supérieur des Sciences et Technologie de l’Environnement BP 1003, Hammam-Lif 2050, Tunisie. *E-mail: [email protected]
AbstractField experiments were performed to study the impact of two different irrigation systems (surface drip and surface) on water use effi ciency and yield components of a pepper crop (Capsicum annum. L). Irrigation scheduling was carried out based on estimated crop evapotranspiration (ETc) using crop coeffi cients for pepper and reference evapotranspiration ETo calculated using the Penman-Monteith equation (Allen et al., 1998). The crop received total water needs computed according to Veirmeiren and Jobling (1983) procedure for surface drip irrigation. Border irrigation was scheduled by Cropwat model (Smith, 1992). Experimental plots were irrigated simultaneously during the appropriate duration for each one and received the same nutrients (N, P, and K) ratio. Comparison was made on fruit number per plant, fruit weight, fruit weight by harvest and yield per unit surface. The results showed that compared with surface irrigation, drip irrigation presented a signifi cant difference in total fruit yield and water use during cropping season (May to September). With drip irrigation, average yield was 19.73 kg m-2 which was 68% greater than that irrigated with surface irrigation (11.90 kg m-2). Applied water volume by unit production (m3/kg) was 0.38 for drip and 1.05 for border, respectively. Drip irrigation increased fresh pepper fruit yield with a reduction of 60% in water use compared to traditional surface irrigation.
Key words: Arid, drip irrigation, border irrigation, yield, Capsicum annum.L, water use.
IntroductionIn near future, the main constraint to agricultural development of arid and semi arid areas will be the availability of water resources rather than soils. Under these conditions of limited water resources, crop production must be maintained at expense of minimum inputs but aiming at achieving maximum incomes. In order to achieve that goal, improvement of irrigation water use effi ciency is necessary which has increased the search for technology with improved water use effi ciency.
In Tunisia, where rainfall is erratic and water demand increase steadily, a national water saving strategy for an efficient management of available water resource was undertaken with following objectives: safeguarding water resources to meet necessary needs for different uses; minimizing water losses; improving water use effi ciency especially in agriculture which use 80% of total resources.
In the arid southern part of the country, where water resources are fi nite, irrigated agriculture is dominated by traditional methods of surface irrigation (Thabet et al., 1999) which causes large percolation losses and restrains the increase in production due to soil frequent drought at irrigation intervals and poor irrigation management. In these conditions, drip irrigation, in which water is applied directly to the roots zone of plants by different ways (orifi ces, emitters, porous tubing, or perforate pipe) and operated under low pressure (Spellman, 2008). This can help in conserving water by reducing evaporation and deep percolation, if well managed (Tanji and Hanson, 1990). Advantage of surface drip irrigation are the ease of installation, inspection, changing and cleaning emitters. It also permits the possibility of checking soil surface wetting patterns and measuring individual dripper discharge rates.
In order to conserve precious water resources and maximize plant performance, farmers are incited to use this method for a subsidy which can reach 60 % of irrigation materials cost.
The main objective of this study was to evaluate the effects of surface drip and surface irrigation on yield components of pepper which is a widely cropped vegetable in summer and used as condiment in North Africa countries. Major studied factors during irrigation season were gas exchange, water consumption, crop yield and soil salinity.
Materials and methods The experiments were carried out in the experimental fi eld of Aridoculture and Oases Laboratory in the Institute of Arid Regions (33°3′ N, 10°3′E). Climate is typically Mediterranean with dry and hot summers and precipitations irregularly distributed throughout the year. The soil at the study site is loamy sand and almost fl at. Major soil characteristics of trial plots are summarised in Table 1. One month old seedlings of a local green pepper cultivar were transplanted in 60x50 cm spacing for border irrigation and in 100x50 cm for surface trickle irrigation. Borders were 2 m wide and 8 m in length, while the drip lines length was 20 m where drippers were spaced out at 50 cm (Fig.1).
Irrigation water characteristics are given in Table 2. It was applied from a well by a pump in drip irrigated plots and by gravity from the basin for borders. A drip irrigation system was used, with 4L/h PVC emitters. Irrigation frequency was three days for each trial. It was chosen to be the nearest of farmer’s practices.
Soil water content data were collected from each experimental plot, once a week one day after irrigation. It was calculated by gravimetric method for surface irrigation where three samples
Journal
Appl
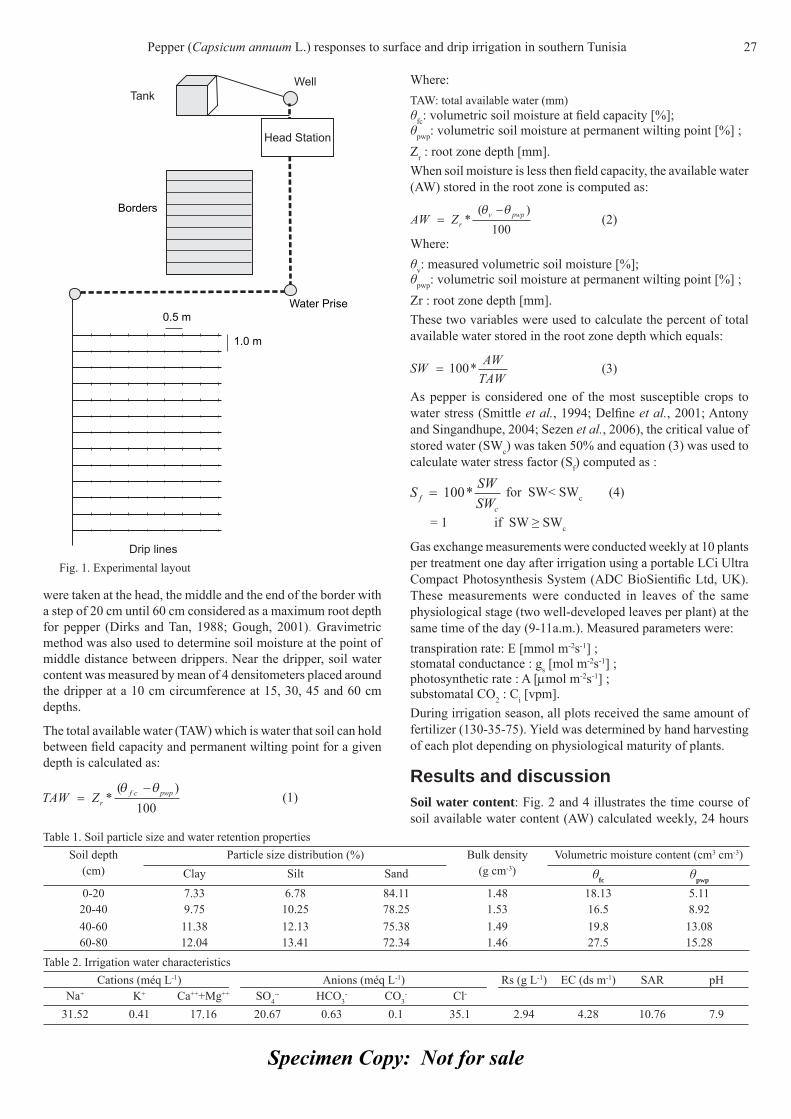
Specimen Copy: Not for sale
were taken at the head, the middle and the end of the border with a step of 20 cm until 60 cm considered as a maximum root depth for pepper (Dirks and Tan, 1988; Gough, 2001). Gravimetric method was also used to determine soil moisture at the point of middle distance between drippers. Near the dripper, soil water content was measured by mean of 4 densitometers placed around the dripper at a 10 cm circumference at 15, 30, 45 and 60 cm depths.
The total available water (TAW) which is water that soil can hold between fi eld capacity and permanent wilting point for a given depth is calculated as:
(1)
Where:TAW: total available water (mm)θfc: volumetric soil moisture at fi eld capacity [%];θpwp: volumetric soil moisture at permanent wilting point [%] ;Zr : root zone depth [mm].When soil moisture is less then fi eld capacity, the available water (AW) stored in the root zone is computed as:
(2)
Where:θv: measured volumetric soil moisture [%];θpwp: volumetric soil moisture at permanent wilting point [%] ;Zr : root zone depth [mm].These two variables were used to calculate the percent of total available water stored in the root zone depth which equals: (3)
As pepper is considered one of the most susceptible crops to water stress (Smittle et al., 1994; Delfi ne et al., 2001; Antony and Singandhupe, 2004; Sezen et al., 2006), the critical value of stored water (SWc) was taken 50% and equation (3) was used to calculate water stress factor (Sf) computed as :
for SW< SWc (4)
= 1 if SW ≥ SWc
Gas exchange measurements were conducted weekly at 10 plants per treatment one day after irrigation using a portable LCi Ultra Compact Photosynthesis System (ADC BioSientifi c Ltd, UK). These measurements were conducted in leaves of the same physiological stage (two well-developed leaves per plant) at the same time of the day (9-11a.m.). Measured parameters were:transpiration rate: E [mmol m-2s-1] ;stomatal conductance : gs [mol m-2s-1] ;photosynthetic rate : A [μmol m-2s-1] ;substomatal CO2 : Ci [vpm].During irrigation season, all plots received the same amount of fertilizer (130-35-75). Yield was determined by hand harvesting of each plot depending on physiological maturity of plants.
Results and discussionSoil water content: Fig. 2 and 4 illustrates the time course of soil available water content (AW) calculated weekly, 24 hours
Table 1. Soil particle size and water retention propertiesSoil depth
(cm)Particle size distribution (%) Bulk density
(g cm-3)Volumetric moisture content (cm3 cm-3)
Clay Silt Sand θfc θpwp
0-20 7.33 6.78 84.11 1.48 18.13 5.1120-40 9.75 10.25 78.25 1.53 16.5 8.9240-60 11.38 12.13 75.38 1.49 19.8 13.0860-80 12.04 13.41 72.34 1.46 27.5 15.28
Table 2. Irrigation water characteristicsCations (méq L-1) Anions (méq L-1) Rs (g L-1) EC (ds m-1) SAR pH
Na+ K+ Ca+++Mg++ SO4-- HCO3
- CO3- Cl-
31.52 0.41 17.16 20.67 0.63 0.1 35.1 2.94 4.28 10.76 7.9
TAW Zrf c pwp= *
( )θ θ100
AW Zrv pwp= *
( )θ θ100
SW AWTAW
= 100*
S SWSWf
c
= 100*
Fig. 1. Experimental layout
Pepper (Capsicum annuum L.) responses to surface and drip irrigation in southern Tunisia 27
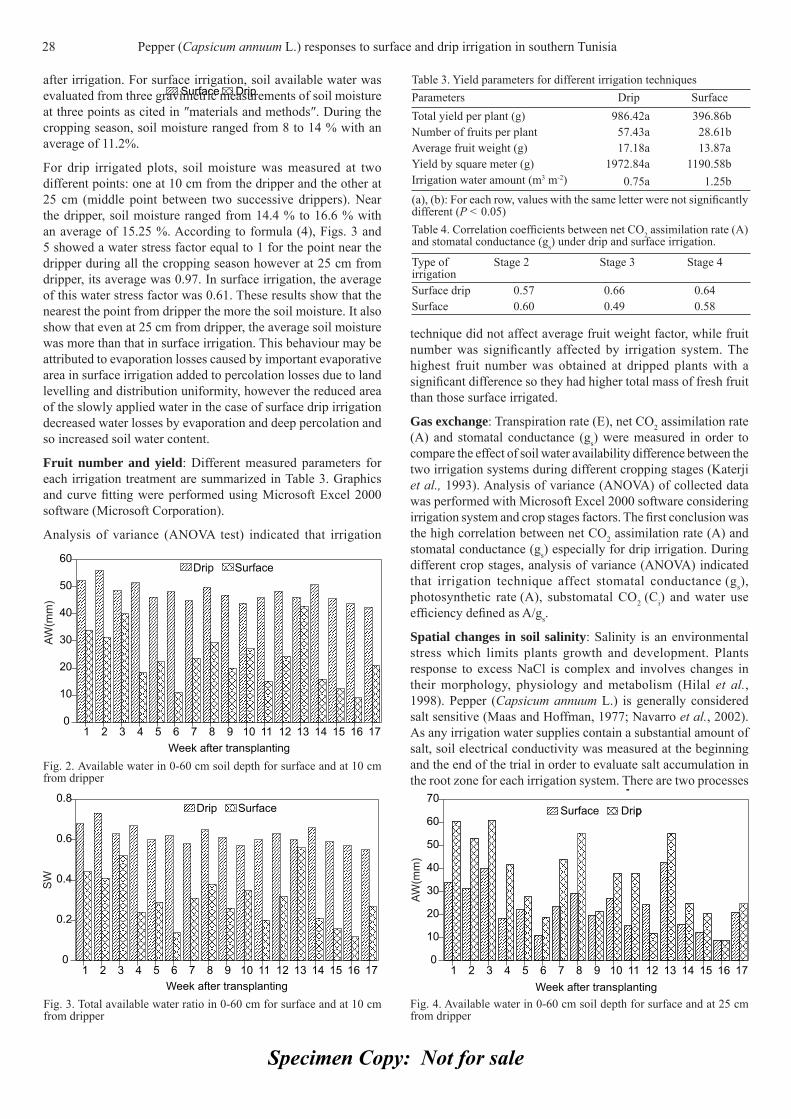
Specimen Copy: Not for sale
after irrigation. For surface irrigation, soil available water was evaluated from three gravimetric measurements of soil moisture at three points as cited in ″materials and methods″. During the cropping season, soil moisture ranged from 8 to 14 % with an average of 11.2%.
For drip irrigated plots, soil moisture was measured at two different points: one at 10 cm from the dripper and the other at 25 cm (middle point between two successive drippers). Near the dripper, soil moisture ranged from 14.4 % to 16.6 % with an average of 15.25 %. According to formula (4), Figs. 3 and 5 showed a water stress factor equal to 1 for the point near the dripper during all the cropping season however at 25 cm from dripper, its average was 0.97. In surface irrigation, the average of this water stress factor was 0.61. These results show that the nearest the point from dripper the more the soil moisture. It also show that even at 25 cm from dripper, the average soil moisture was more than that in surface irrigation. This behaviour may be attributed to evaporation losses caused by important evaporative area in surface irrigation added to percolation losses due to land levelling and distribution uniformity, however the reduced area of the slowly applied water in the case of surface drip irrigation decreased water losses by evaporation and deep percolation and so increased soil water content.
Fruit number and yield: Different measured parameters for each irrigation treatment are summarized in Table 3. Graphics and curve fi tting were performed using Microsoft Excel 2000 software (Microsoft Corporation).
Analysis of variance (ANOVA test) indicated that irrigation
technique did not affect average fruit weight factor, while fruit number was signifi cantly affected by irrigation system. The highest fruit number was obtained at dripped plants with a signifi cant difference so they had higher total mass of fresh fruit than those surface irrigated.
Gas exchange: Transpiration rate (E), net CO2 assimilation rate (A) and stomatal conductance (gs) were measured in order to compare the effect of soil water availability difference between the two irrigation systems during different cropping stages (Katerji et al., 1993). Analysis of variance (ANOVA) of collected data was performed with Microsoft Excel 2000 software considering irrigation system and crop stages factors. The fi rst conclusion was the high correlation between net CO2 assimilation rate (A) and stomatal conductance (gs) especially for drip irrigation. During different crop stages, analysis of variance (ANOVA) indicated that irrigation technique affect stomatal conductance (gs), photosynthetic rate (A), substomatal CO2 (Ci) and water use effi ciency defi ned as A/gs.
Spatial changes in soil salinity: Salinity is an environmental stress which limits plants growth and development. Plants response to excess NaCl is complex and involves changes in their morphology, physiology and metabolism (Hilal et al., 1998). Pepper (Capsicum annuum L.) is generally considered salt sensitive (Maas and Hoffman, 1977; Navarro et al., 2002). As any irrigation water supplies contain a substantial amount of salt, soil electrical conductivity was measured at the beginning and the end of the trial in order to evaluate salt accumulation in the root zone for each irrigation system. There are two processes
Table 3. Yield parameters for different irrigation techniquesParameters Drip SurfaceTotal yield per plant (g) 986.42a 396.86bNumber of fruits per plant 57.43a 28.61bAverage fruit weight (g) 17.18a 13.87aYield by square meter (g) 1972.84a 1190.58bIrrigation water amount (m3 m-2) 0.75a 1.25b(a), (b): For each row, values with the same letter were not signifi cantly different (P < 0.05)Table 4. Correlation coeffi cients between net CO2 assimilation rate (A) and stomatal conductance (gs) under drip and surface irrigation.
Type of irrigation
Stage 2 Stage 3 Stage 4
Surface drip 0.57 0.66 0.64Surface 0.60 0.49 0.58
Fig. 2. Available water in 0-60 cm soil depth for surface and at 10 cm from dripper
Fig. 3. Total available water ratio in 0-60 cm for surface and at 10 cm from dripper
Fig. 4. Available water in 0-60 cm soil depth for surface and at 25 cm from dripper
28 Pepper (Capsicum annuum L.) responses to surface and drip irrigation in southern Tunisia
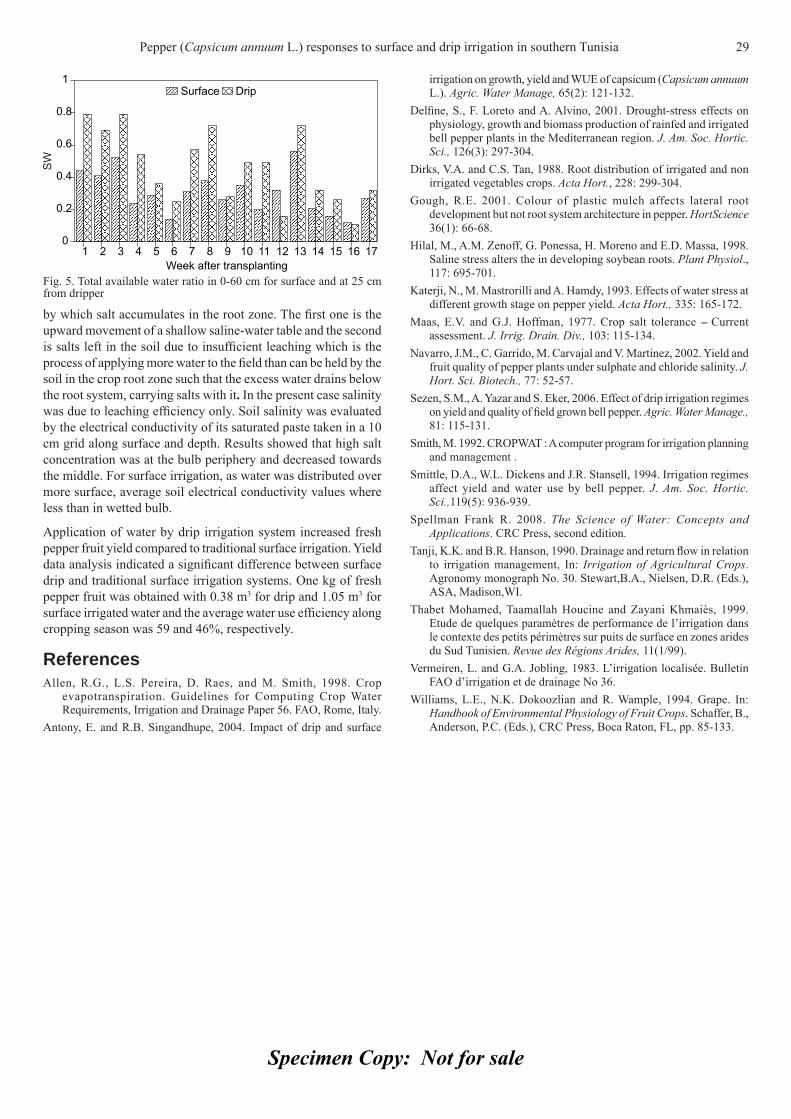
Specimen Copy: Not for sale
by which salt accumulates in the root zone. The fi rst one is the upward movement of a shallow saline-water table and the second is salts left in the soil due to insuffi cient leaching which is the process of applying more water to the fi eld than can be held by the soil in the crop root zone such that the excess water drains below the root system, carrying salts with it. In the present case salinity was due to leaching effi ciency only. Soil salinity was evaluated by the electrical conductivity of its saturated paste taken in a 10 cm grid along surface and depth. Results showed that high salt concentration was at the bulb periphery and decreased towards the middle. For surface irrigation, as water was distributed over more surface, average soil electrical conductivity values where less than in wetted bulb.
Application of water by drip irrigation system increased fresh pepper fruit yield compared to traditional surface irrigation. Yield data analysis indicated a signifi cant difference between surface drip and traditional surface irrigation systems. One kg of fresh pepper fruit was obtained with 0.38 m3 for drip and 1.05 m3 for surface irrigated water and the average water use effi ciency along cropping season was 59 and 46%, respectively.
ReferencesAllen, R.G., L.S. Pereira, D. Raes, and M. Smith, 1998. Crop
evapotranspiration. Guidelines for Computing Crop Water Requirements, Irrigation and Drainage Paper 56. FAO, Rome, Italy.
Antony, E. and R.B. Singandhupe, 2004. Impact of drip and surface
irrigation on growth, yield and WUE of capsicum (Capsicum annuum L.). Agric. Water Manage, 65(2): 121-132.
Delfi ne, S., F. Loreto and A. Alvino, 2001. Drought-stress effects on physiology, growth and biomass production of rainfed and irrigated bell pepper plants in the Mediterranean region. J. Am. Soc. Hortic. Sci., 126(3): 297-304.
Dirks, V.A. and C.S. Tan, 1988. Root distribution of irrigated and non irrigated vegetables crops. Acta Hort., 228: 299-304.
Gough, R.E. 2001. Colour of plastic mulch affects lateral root development but not root system architecture in pepper. HortScience 36(1): 66-68.
Hilal, M., A.M. Zenoff, G. Ponessa, H. Moreno and E.D. Massa, 1998. Saline stress alters the in developing soybean roots. Plant Physiol., 117: 695-701.
Katerji, N., M. Mastrorilli and A. Hamdy, 1993. Effects of water stress at different growth stage on pepper yield. Acta Hort., 335: 165-172.
Maas, E.V. and G.J. Hoffman, 1977. Crop salt tolerance -- Current assessment. J. Irrig. Drain. Div., 103: 115-134.
Navarro, J.M., C. Garrido, M. Carvajal and V. Martinez, 2002. Yield and fruit quality of pepper plants under sulphate and chloride salinity. J. Hort. Sci. Biotech., 77: 52-57.
Sezen, S.M., A. Yazar and S. Eker, 2006. Effect of drip irrigation regimes on yield and quality of fi eld grown bell pepper. Agric. Water Manage., 81: 115-131.
Smith, M. 1992. CROPWAT : A computer program for irrigation planning and management .
Smittle, D.A., W.L. Dickens and J.R. Stansell, 1994. Irrigation regimes affect yield and water use by bell pepper. J. Am. Soc. Hortic. Sci.,119(5): 936-939.
Spellman Frank R. 2008. The Science of Water: Concepts and Applications. CRC Press, second edition.
Tanji, K.K. and B.R. Hanson, 1990. Drainage and return fl ow in relation to irrigation management, In: Irrigation of Agricultural Crops. Agronomy monograph No. 30. Stewart,B.A., Nielsen, D.R. (Eds.), ASA, Madison,WI.
Thabet Mohamed, Taamallah Houcine and Zayani Khmaiès, 1999. Etude de quelques paramètres de performance de l’irrigation dans le contexte des petits périmètres sur puits de surface en zones arides du Sud Tunisien. Revue des Régions Arides, 11(1/99).
Vermeiren, L. and G.A. Jobling, 1983. L’irrigation localisée. Bulletin FAO d’irrigation et de drainage No 36.
Williams, L.E., N.K. Dokoozlian and R. Wample, 1994. Grape. In: Handbook of Environmental Physiology of Fruit Crops. Schaffer, B., Anderson, P.C. (Eds.), CRC Press, Boca Raton, FL, pp. 85-133.
Fig. 5. Total available water ratio in 0-60 cm for surface and at 25 cm from dripper
Pepper (Capsicum annuum L.) responses to surface and drip irrigation in southern Tunisia 29
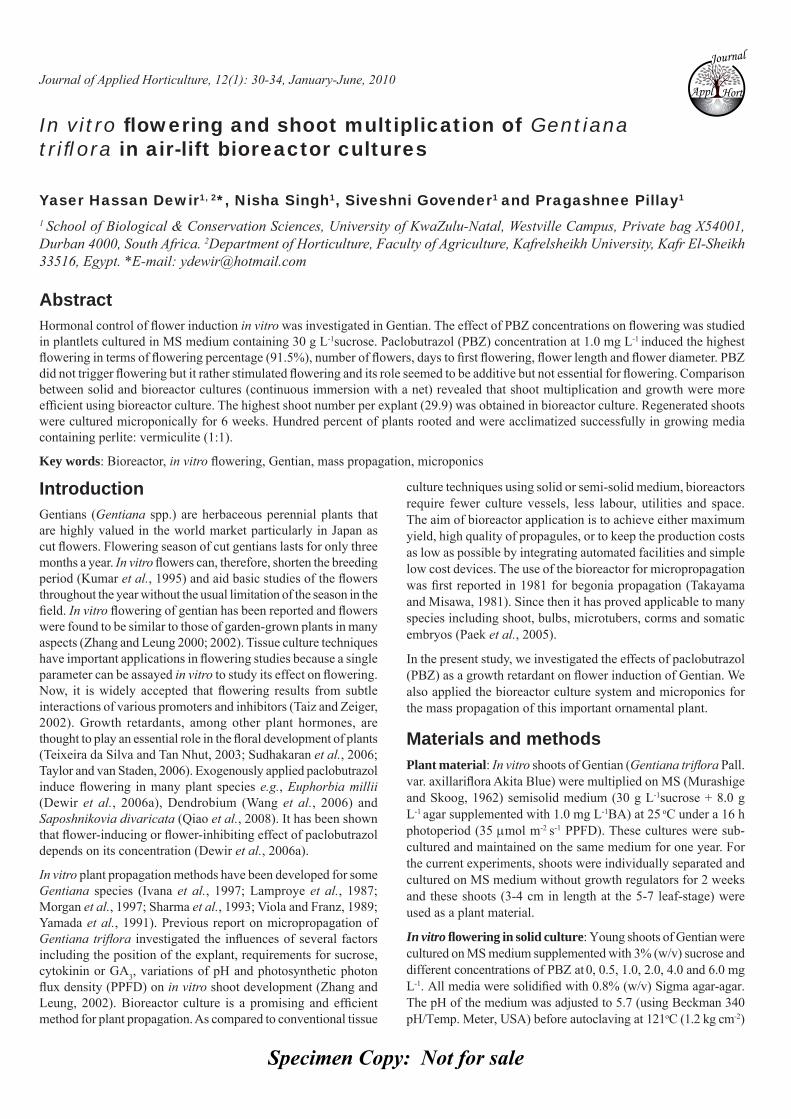
Specimen Copy: Not for sale
Journal of Applied Horticulture, 12(1): 30-34, January-June, 2010
In vitro fl owering and shoot multiplication of Gentiana trifl ora in air-lift bioreactor cultures
Yaser Hassan Dewir1, 2*, Nisha Singh1, Siveshni Govender1 and Pragashnee Pillay1
1 School of Biological & Conservation Sciences, University of KwaZulu-Natal, Westville Campus, Private bag X54001, Durban 4000, South Africa. 2Department of Horticulture, Faculty of Agriculture, Kafrelsheikh University, Kafr El-Sheikh 33516, Egypt. *E-mail: [email protected]
Abstract Hormonal control of fl ower induction in vitro was investigated in Gentian. The effect of PBZ concentrations on fl owering was studied in plantlets cultured in MS medium containing 30 g L-1sucrose. Paclobutrazol (PBZ) concentration at 1.0 mg L-1 induced the highest fl owering in terms of fl owering percentage (91.5%), number of fl owers, days to fi rst fl owering, fl ower length and fl ower diameter. PBZ did not trigger fl owering but it rather stimulated fl owering and its role seemed to be additive but not essential for fl owering. Comparison between solid and bioreactor cultures (continuous immersion with a net) revealed that shoot multiplication and growth were more effi cient using bioreactor culture. The highest shoot number per explant (29.9) was obtained in bioreactor culture. Regenerated shoots were cultured microponically for 6 weeks. Hundred percent of plants rooted and were acclimatized successfully in growing media containing perlite: vermiculite (1:1).
Key words: Bioreactor, in vitro fl owering, Gentian, mass propagation, microponics
Introduction Gentians (Gentiana spp.) are herbaceous perennial plants that are highly valued in the world market particularly in Japan as cut fl owers. Flowering season of cut gentians lasts for only three months a year. In vitro fl owers can, therefore, shorten the breeding period (Kumar et al., 1995) and aid basic studies of the fl owers throughout the year without the usual limitation of the season in the fi eld. In vitro fl owering of gentian has been reported and fl owers were found to be similar to those of garden-grown plants in many aspects (Zhang and Leung 2000; 2002). Tissue culture techniques have important applications in fl owering studies because a single parameter can be assayed in vitro to study its effect on fl owering. Now, it is widely accepted that fl owering results from subtle interactions of various promoters and inhibitors (Taiz and Zeiger, 2002). Growth retardants, among other plant hormones, are thought to play an essential role in the fl oral development of plants (Teixeira da Silva and Tan Nhut, 2003; Sudhakaran et al., 2006; Taylor and van Staden, 2006). Exogenously applied paclobutrazol induce fl owering in many plant species e.g., Euphorbia millii (Dewir et al., 2006a), Dendrobium (Wang et al., 2006) and Saposhnikovia divaricata (Qiao et al., 2008). It has been shown that fl ower-inducing or fl ower-inhibiting effect of paclobutrazol depends on its concentration (Dewir et al., 2006a).
In vitro plant propagation methods have been developed for some Gentiana species (Ivana et al., 1997; Lamproye et al., 1987; Morgan et al., 1997; Sharma et al., 1993; Viola and Franz, 1989; Yamada et al., 1991). Previous report on micropropagation of Gentiana trifl ora investigated the infl uences of several factors including the position of the explant, requirements for sucrose, cytokinin or GA3, variations of pH and photosynthetic photon fl ux density (PPFD) on in vitro shoot development (Zhang and Leung, 2002). Bioreactor culture is a promising and effi cient method for plant propagation. As compared to conventional tissue
culture techniques using solid or semi-solid medium, bioreactors require fewer culture vessels, less labour, utilities and space. The aim of bioreactor application is to achieve either maximum yield, high quality of propagules, or to keep the production costs as low as possible by integrating automated facilities and simple low cost devices. The use of the bioreactor for micropropagation was fi rst reported in 1981 for begonia propagation (Takayama and Misawa, 1981). Since then it has proved applicable to many species including shoot, bulbs, microtubers, corms and somatic embryos (Paek et al., 2005).
In the present study, we investigated the effects of paclobutrazol (PBZ) as a growth retardant on fl ower induction of Gentian. We also applied the bioreactor culture system and microponics for the mass propagation of this important ornamental plant.
Materials and methodsPlant material: In vitro shoots of Gentian (Gentiana trifl ora Pall. var. axillarifl ora Akita Blue) were multiplied on MS (Murashige and Skoog, 1962) semisolid medium (30 g L-1sucrose + 8.0 g L-1 agar supplemented with 1.0 mg L-1BA) at 25 oC under a 16 h photoperiod (35 μmol m-2 s-1 PPFD). These cultures were sub-cultured and maintained on the same medium for one year. For the current experiments, shoots were individually separated and cultured on MS medium without growth regulators for 2 weeks and these shoots (3-4 cm in length at the 5-7 leaf-stage) were used as a plant material.
In vitro fl owering in solid culture: Young shoots of Gentian were cultured on MS medium supplemented with 3% (w/v) sucrose and different concentrations of PBZ at 0, 0.5, 1.0, 2.0, 4.0 and 6.0 mg L-1. All media were solidifi ed with 0.8% (w/v) Sigma agar-agar. The pH of the medium was adjusted to 5.7 (using Beckman 340 pH/Temp. Meter, USA) before autoclaving at 121oC (1.2 kg cm-2)
Journal
Appl
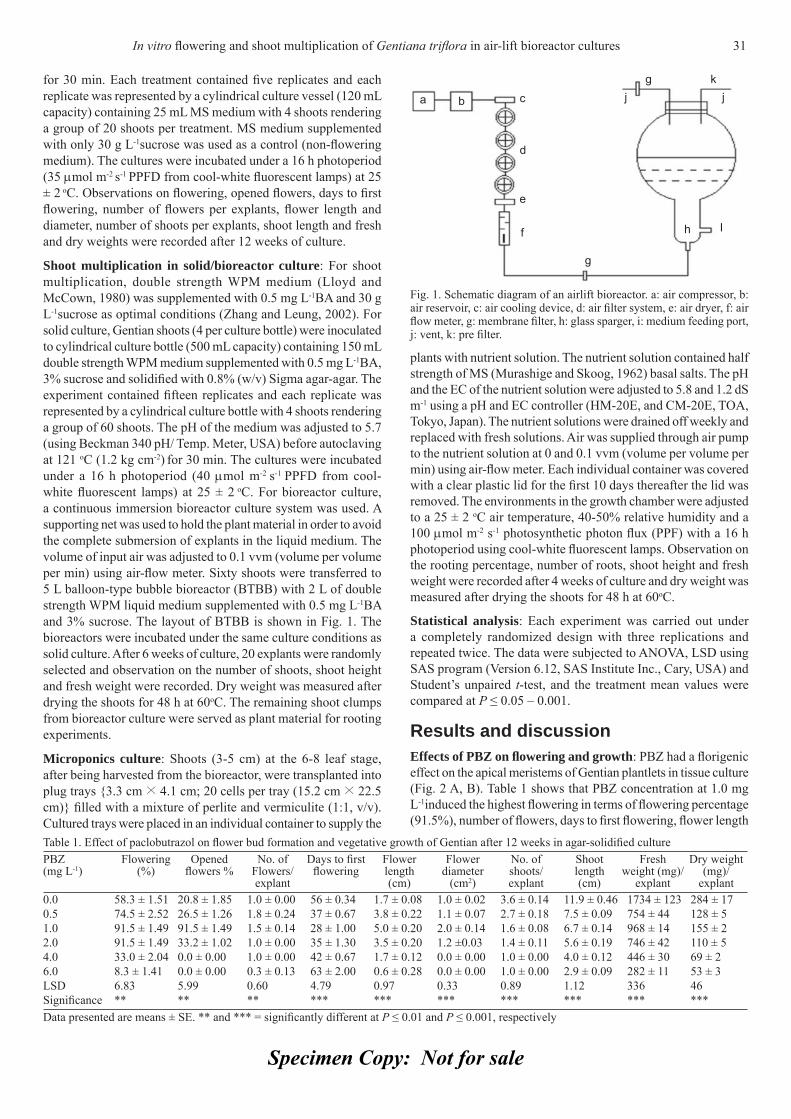
Specimen Copy: Not for sale
for 30 min. Each treatment contained fi ve replicates and each replicate was represented by a cylindrical culture vessel (120 mL capacity) containing 25 mL MS medium with 4 shoots rendering a group of 20 shoots per treatment. MS medium supplemented with only 30 g L-1sucrose was used as a control (non-fl owering medium). The cultures were incubated under a 16 h photoperiod (35 μmol m-2 s-1 PPFD from cool-white fl uorescent lamps) at 25 ± 2 oC. Observations on fl owering, opened fl owers, days to fi rst fl owering, number of fl owers per explants, fl ower length and diameter, number of shoots per explants, shoot length and fresh and dry weights were recorded after 12 weeks of culture.
Shoot multiplication in solid/bioreactor culture: For shoot multiplication, double strength WPM medium (Lloyd and McCown, 1980) was supplemented with 0.5 mg L-1BA and 30 g L-1sucrose as optimal conditions (Zhang and Leung, 2002). For solid culture, Gentian shoots (4 per culture bottle) were inoculated to cylindrical culture bottle (500 mL capacity) containing 150 mL double strength WPM medium supplemented with 0.5 mg L-1BA, 3% sucrose and solidifi ed with 0.8% (w/v) Sigma agar-agar. The experiment contained fi fteen replicates and each replicate was represented by a cylindrical culture bottle with 4 shoots rendering a group of 60 shoots. The pH of the medium was adjusted to 5.7 (using Beckman 340 pH/ Temp. Meter, USA) before autoclaving at 121 oC (1.2 kg cm-2) for 30 min. The cultures were incubated under a 16 h photoperiod (40 μmol m-2 s-1 PPFD from cool-white fl uorescent lamps) at 25 ± 2 oC. For bioreactor culture, a continuous immersion bioreactor culture system was used. A supporting net was used to hold the plant material in order to avoid the complete submersion of explants in the liquid medium. The volume of input air was adjusted to 0.1 vvm (volume per volume per min) using air-fl ow meter. Sixty shoots were transferred to 5 L balloon-type bubble bioreactor (BTBB) with 2 L of double strength WPM liquid medium supplemented with 0.5 mg L-1BA and 3% sucrose. The layout of BTBB is shown in Fig. 1. The bioreactors were incubated under the same culture conditions as solid culture. After 6 weeks of culture, 20 explants were randomly selected and observation on the number of shoots, shoot height and fresh weight were recorded. Dry weight was measured after drying the shoots for 48 h at 60oC. The remaining shoot clumps from bioreactor culture were served as plant material for rooting experiments.
Microponics culture: Shoots (3-5 cm) at the 6-8 leaf stage, after being harvested from the bioreactor, were transplanted into plug trays {3.3 cm × 4.1 cm; 20 cells per tray (15.2 cm × 22.5 cm)} fi lled with a mixture of perlite and vermiculite (1:1, v/v). Cultured trays were placed in an individual container to supply the
plants with nutrient solution. The nutrient solution contained half strength of MS (Murashige and Skoog, 1962) basal salts. The pH and the EC of the nutrient solution were adjusted to 5.8 and 1.2 dS m-1 using a pH and EC controller (HM-20E, and CM-20E, TOA, Tokyo, Japan). The nutrient solutions were drained off weekly and replaced with fresh solutions. Air was supplied through air pump to the nutrient solution at 0 and 0.1 vvm (volume per volume per min) using air-fl ow meter. Each individual container was covered with a clear plastic lid for the fi rst 10 days thereafter the lid was removed. The environments in the growth chamber were adjusted to a 25 ± 2 oC air temperature, 40-50% relative humidity and a 100 μmol m-2 s-1 photosynthetic photon fl ux (PPF) with a 16 h photoperiod using cool-white fl uorescent lamps. Observation on the rooting percentage, number of roots, shoot height and fresh weight were recorded after 4 weeks of culture and dry weight was measured after drying the shoots for 48 h at 60oC.
Statistical analysis: Each experiment was carried out under a completely randomized design with three replications and repeated twice. The data were subjected to ANOVA, LSD using SAS program (Version 6.12, SAS Institute Inc., Cary, USA) and Student’s unpaired t-test, and the treatment mean values were compared at P ≤ 0.05 – 0.001.
Results and discussion Effects of PBZ on fl owering and growth: PBZ had a fl origenic effect on the apical meristems of Gentian plantlets in tissue culture (Fig. 2 A, B). Table 1 shows that PBZ concentration at 1.0 mg L-1induced the highest fl owering in terms of fl owering percentage (91.5%), number of fl owers, days to fi rst fl owering, fl ower length
Table 1. Effect of paclobutrazol on fl ower bud formation and vegetative growth of Gentian after 12 weeks in agar-solidifi ed culturePBZ (mg L-1)
Flowering (%)
Opened fl owers %
No. of Flowers/ explant
Days to fi rst fl owering
Flower length (cm)
Flower diameter
(cm2)
No. of shoots/ explant
Shoot length(cm)
Fresh weight (mg)/
explant
Dry weight (mg)/
explant0.0 58.3 ± 1.51 20.8 ± 1.85 1.0 ± 0.00 56 ± 0.34 1.7 ± 0.08 1.0 ± 0.02 3.6 ± 0.14 11.9 ± 0.46 1734 ± 123 284 ± 170.5 74.5 ± 2.52 26.5 ± 1.26 1.8 ± 0.24 37 ± 0.67 3.8 ± 0.22 1.1 ± 0.07 2.7 ± 0.18 7.5 ± 0.09 754 ± 44 128 ± 51.0 91.5 ± 1.49 91.5 ± 1.49 1.5 ± 0.14 28 ± 1.00 5.0 ± 0.20 2.0 ± 0.14 1.6 ± 0.08 6.7 ± 0.14 968 ± 14 155 ± 22.0 91.5 ± 1.49 33.2 ± 1.02 1.0 ± 0.00 35 ± 1.30 3.5 ± 0.20 1.2 ±0.03 1.4 ± 0.11 5.6 ± 0.19 746 ± 42 110 ± 54.0 33.0 ± 2.04 0.0 ± 0.00 1.0 ± 0.00 42 ± 0.67 1.7 ± 0.12 0.0 ± 0.00 1.0 ± 0.00 4.0 ± 0.12 446 ± 30 69 ± 26.0 8.3 ± 1.41 0.0 ± 0.00 0.3 ± 0.13 63 ± 2.00 0.6 ± 0.28 0.0 ± 0.00 1.0 ± 0.00 2.9 ± 0.09 282 ± 11 53 ± 3LSD 6.83 5.99 0.60 4.79 0.97 0.33 0.89 1.12 336 46 Signifi cance ** ** ** *** *** *** *** *** *** ***Data presented are means ± SE. ** and *** = signifi cantly different at P ≤ 0.01 and P ≤ 0.001, respectively
Fig. 1. Schematic diagram of an airlift bioreactor. a: air compressor, b: air reservoir, c: air cooling device, d: air fi lter system, e: air dryer, f: air fl ow meter, g: membrane fi lter, h: glass sparger, i: medium feeding port, j: vent, k: pre fi lter.
In vitro fl owering and shoot multiplication of Gentiana trifl ora in air-lift bioreactor cultures 31
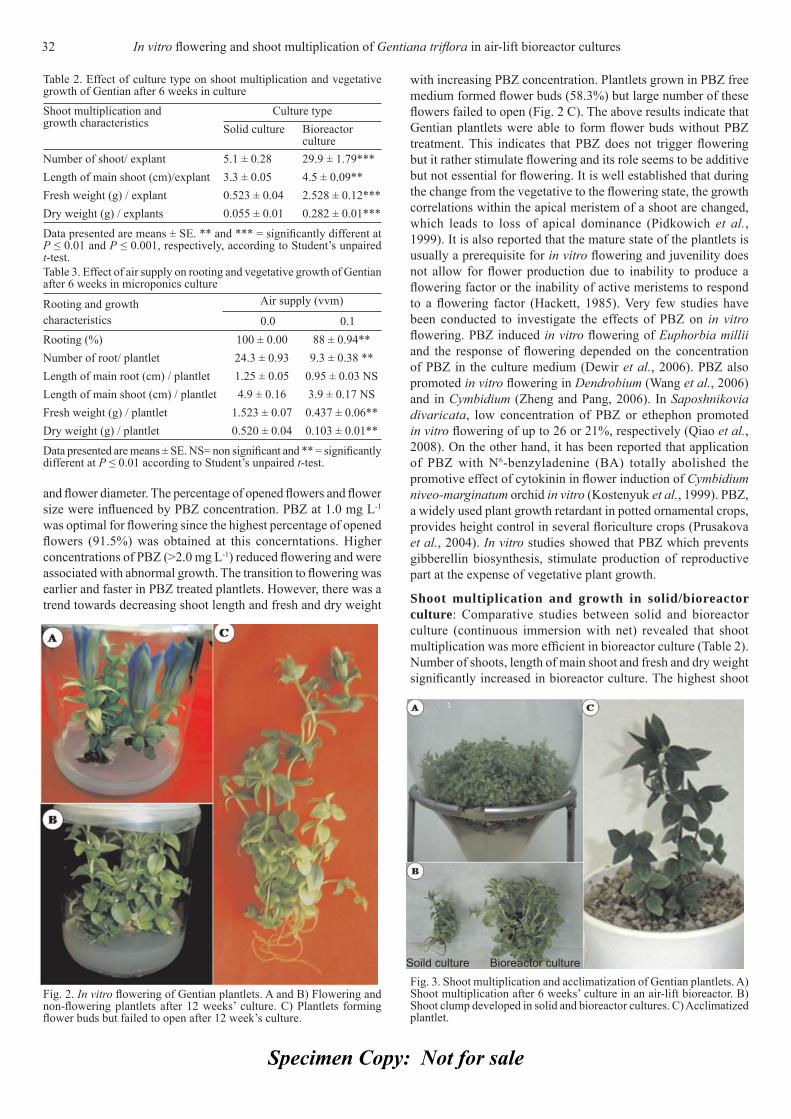
Specimen Copy: Not for sale
and fl ower diameter. The percentage of opened fl owers and fl ower size were infl uenced by PBZ concentration. PBZ at 1.0 mg L-1
was optimal for fl owering since the highest percentage of opened fl owers (91.5%) was obtained at this concerntations. Higher concentrations of PBZ (>2.0 mg L-1) reduced fl owering and were associated with abnormal growth. The transition to fl owering was earlier and faster in PBZ treated plantlets. However, there was a trend towards decreasing shoot length and fresh and dry weight
with increasing PBZ concentration. Plantlets grown in PBZ free medium formed fl ower buds (58.3%) but large number of these fl owers failed to open (Fig. 2 C). The above results indicate that Gentian plantlets were able to form fl ower buds without PBZ treatment. This indicates that PBZ does not trigger fl owering but it rather stimulate fl owering and its role seems to be additive but not essential for fl owering. It is well established that during the change from the vegetative to the fl owering state, the growth correlations within the apical meristem of a shoot are changed, which leads to loss of apical dominance (Pidkowich et al., 1999). It is also reported that the mature state of the plantlets is usually a prerequisite for in vitro fl owering and juvenility does not allow for fl ower production due to inability to produce a fl owering factor or the inability of active meristems to respond to a fl owering factor (Hackett, 1985). Very few studies have been conducted to investigate the effects of PBZ on in vitro fl owering. PBZ induced in vitro fl owering of Euphorbia millii and the response of fl owering depended on the concentration of PBZ in the culture medium (Dewir et al., 2006). PBZ also promoted in vitro fl owering in Dendrobium (Wang et al., 2006) and in Cymbidium (Zheng and Pang, 2006). In Saposhnikovia divaricata, low concentration of PBZ or ethephon promoted in vitro fl owering of up to 26 or 21%, respectively (Qiao et al., 2008). On the other hand, it has been reported that application of PBZ with N6-benzyladenine (BA) totally abolished the promotive effect of cytokinin in fl ower induction of Cymbidium niveo-marginatum orchid in vitro (Kostenyuk et al., 1999). PBZ, a widely used plant growth retardant in potted ornamental crops, provides height control in several fl oriculture crops (Prusakova et al., 2004). In vitro studies showed that PBZ which prevents gibberellin biosynthesis, stimulate production of reproductive part at the expense of vegetative plant growth.
Shoot multiplication and growth in solid/bioreactor culture: Comparative studies between solid and bioreactor culture (continuous immersion with net) revealed that shoot multiplication was more effi cient in bioreactor culture (Table 2). Number of shoots, length of main shoot and fresh and dry weight signifi cantly increased in bioreactor culture. The highest shoot
Table 2. Effect of culture type on shoot multiplication and vegetative growth of Gentian after 6 weeks in culture
Shoot multiplication and growth characteristics
Culture typeSolid culture Bioreactor
cultureNumber of shoot/ explant 5.1 ± 0.28 29.9 ± 1.79***Length of main shoot (cm)/explant 3.3 ± 0.05 4.5 ± 0.09**Fresh weight (g) / explant 0.523 ± 0.04 2.528 ± 0.12***Dry weight (g) / explants 0.055 ± 0.01 0.282 ± 0.01***
Data presented are means ± SE. ** and *** = signifi cantly different at P ≤ 0.01 and P ≤ 0.001, respectively, according to Student’s unpaired t-test.Table 3. Effect of air supply on rooting and vegetative growth of Gentian after 6 weeks in microponics culture
Rooting and growth characteristics
Air supply (vvm)
0.0 0.1Rooting (%) 100 ± 0.00 88 ± 0.94**Number of root/ plantlet 24.3 ± 0.93 9.3 ± 0.38 **Length of main root (cm) / plantlet 1.25 ± 0.05 0.95 ± 0.03 NSLength of main shoot (cm) / plantlet 4.9 ± 0.16 3.9 ± 0.17 NSFresh weight (g) / plantlet 1.523 ± 0.07 0.437 ± 0.06**Dry weight (g) / plantlet 0.520 ± 0.04 0.103 ± 0.01**
Data presented are means ± SE. NS= non signifi cant and ** = signifi cantly different at P ≤ 0.01 according to Student’s unpaired t-test.
Fig. 3. Shoot multiplication and acclimatization of Gentian plantlets. A) Shoot multiplication after 6 weeks’ culture in an air-lift bioreactor. B) Shoot clump developed in solid and bioreactor cultures. C) Acclimatized plantlet.
Fig. 2. In vitro fl owering of Gentian plantlets. A and B) Flowering and non-fl owering plantlets after 12 weeks’ culture. C) Plantlets forming fl ower buds but failed to open after 12 week’s culture.
32 In vitro fl owering and shoot multiplication of Gentiana trifl ora in air-lift bioreactor cultures
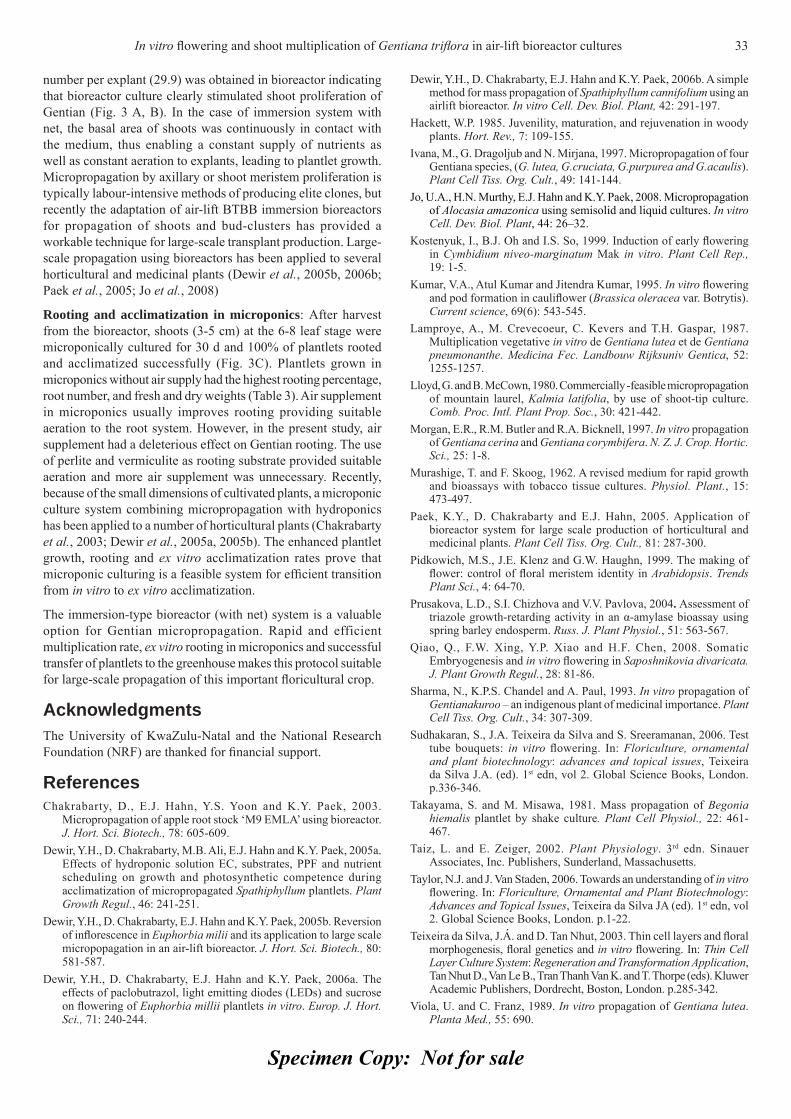
Specimen Copy: Not for sale
number per explant (29.9) was obtained in bioreactor indicating that bioreactor culture clearly stimulated shoot proliferation of Gentian (Fig. 3 A, B). In the case of immersion system with net, the basal area of shoots was continuously in contact with the medium, thus enabling a constant supply of nutrients as well as constant aeration to explants, leading to plantlet growth. Micropropagation by axillary or shoot meristem proliferation is typically labour-intensive methods of producing elite clones, but recently the adaptation of air-lift BTBB immersion bioreactors for propagation of shoots and bud-clusters has provided a workable technique for large-scale transplant production. Large-scale propagation using bioreactors has been applied to several horticultural and medicinal plants (Dewir et al., 2005b, 2006b; Paek et al., 2005; Jo et al., 2008)
Rooting and acclimatization in microponics: After harvest from the bioreactor, shoots (3-5 cm) at the 6-8 leaf stage were microponically cultured for 30 d and 100% of plantlets rooted and acclimatized successfully (Fig. 3C). Plantlets grown in microponics without air supply had the highest rooting percentage, root number, and fresh and dry weights (Table 3). Air supplement in microponics usually improves rooting providing suitable aeration to the root system. However, in the present study, air supplement had a deleterious effect on Gentian rooting. The use of perlite and vermiculite as rooting substrate provided suitable aeration and more air supplement was unnecessary. Recently, because of the small dimensions of cultivated plants, a microponic culture system combining micropropagation with hydroponics has been applied to a number of horticultural plants (Chakrabarty et al., 2003; Dewir et al., 2005a, 2005b). The enhanced plantlet growth, rooting and ex vitro acclimatization rates prove that microponic culturing is a feasible system for effi cient transition from in vitro to ex vitro acclimatization.
The immersion-type bioreactor (with net) system is a valuable option for Gentian micropropagation. Rapid and efficient multiplication rate, ex vitro rooting in microponics and successful transfer of plantlets to the greenhouse makes this protocol suitable for large-scale propagation of this important fl oricultural crop.
AcknowledgmentsThe University of KwaZulu-Natal and the National Research Foundation (NRF) are thanked for fi nancial support.
ReferencesChakrabarty, D., E.J. Hahn, Y.S. Yoon and K.Y. Paek, 2003.
Micropropagation of apple root stock ‘M9 EMLA’ using bioreactor. J. Hort. Sci. Biotech., 78: 605-609.
Dewir, Y.H., D. Chakrabarty, M.B. Ali, E.J. Hahn and K.Y. Paek, 2005a. Effects of hydroponic solution EC, substrates, PPF and nutrient scheduling on growth and photosynthetic competence during acclimatization of micropropagated Spathiphyllum plantlets. Plant Growth Regul., 46: 241-251.
Dewir, Y.H., D. Chakrabarty, E.J. Hahn and K.Y. Paek, 2005b. Reversion of infl orescence in Euphorbia milii and its application to large scale micropopagation in an air-lift bioreactor. J. Hort. Sci. Biotech., 80: 581-587.
Dewir, Y.H., D. Chakrabarty, E.J. Hahn and K.Y. Paek, 2006a. The effects of paclobutrazol, light emitting diodes (LEDs) and sucrose on fl owering of Euphorbia millii plantlets in vitro. Europ. J. Hort. Sci., 71: 240-244.
Dewir, Y.H., D. Chakrabarty, E.J. Hahn and K.Y. Paek, 2006b. A simple method for mass propagation of Spathiphyllum cannifolium using an airlift bioreactor. In vitro Cell. Dev. Biol. Plant, 42: 291-197.
Hackett, W.P. 1985. Juvenility, maturation, and rejuvenation in woody plants. Hort. Rev., 7: 109-155.
Ivana, M., G. Dragoljub and N. Mirjana, 1997. Micropropagation of four Gentiana species, (G. lutea, G.cruciata, G.purpurea and G.acaulis). Plant Cell Tiss. Org. Cult., 49: 141-144.
Jo, U.A., H.N. Murthy, E.J. Hahn and K.Y. Paek, 2008. Micropropagation of Alocasia amazonica using semisolid and liquid cultures. In vitro Cell. Dev. Biol. Plant, 44: 26–32.
Kostenyuk, I., B.J. Oh and I.S. So, 1999. Induction of early fl owering in Cymbidium niveo-marginatum Mak in vitro. Plant Cell Rep., 19: 1-5.
Kumar, V.A., Atul Kumar and Jitendra Kumar, 1995. In vitro fl owering and pod formation in caulifl ower (Brassica oleracea var. Botrytis). Current science, 69(6): 543-545.
Lamproye, A., M. Crevecoeur, C. Kevers and T.H. Gaspar, 1987. Multiplication vegetative in vitro de Gentiana lutea et de Gentiana pneumonanthe. Medicina Fec. Landbouw Rijksuniv Gentica, 52: 1255-1257.
Lloyd, G. and B. McCown, 1980. Commercially -feasible micropropagation of mountain laurel, Kalmia latifolia, by use of shoot-tip culture. Comb. Proc. Intl. Plant Prop. Soc., 30: 421-442.
Morgan, E.R., R.M. Butler and R.A. Bicknell, 1997. In vitro propagation of Gentiana cerina and Gentiana corymbifera. N. Z. J. Crop. Hortic. Sci., 25: 1-8.
Murashige, T. and F. Skoog, 1962. A revised medium for rapid growth and bioassays with tobacco tissue cultures. Physiol. Plant., 15: 473-497.
Paek, K.Y., D. Chakrabarty and E.J. Hahn, 2005. Application of bioreactor system for large scale production of horticultural and medicinal plants. Plant Cell Tiss. Org. Cult., 81: 287-300.
Pidkowich, M.S., J.E. Klenz and G.W. Haughn, 1999. The making of fl ower: control of fl oral meristem identity in Arabidopsis. Trends Plant Sci., 4: 64-70.
Prusakova, L.D., S.I. Chizhova and V.V. Pavlova, 2004. Assessment of triazole growth-retarding activity in an α-amylase bioassay using spring barley endosperm. Russ. J. Plant Physiol., 51: 563-567.
Qiao, Q., F.W. Xing, Y.P. Xiao and H.F. Chen, 2008. Somatic Embryogenesis and in vitro fl owering in Saposhnikovia divaricata. J. Plant Growth Regul., 28: 81-86.
Sharma, N., K.P.S. Chandel and A. Paul, 1993. In vitro propagation of Gentianakuroo – an indigenous plant of medicinal importance. Plant Cell Tiss. Org. Cult., 34: 307-309.
Sudhakaran, S., J.A. Teixeira da Silva and S. Sreeramanan, 2006. Test tube bouquets: in vitro fl owering. In: Floriculture, ornamental and plant biotechnology: advances and topical issues, Teixeira da Silva J.A. (ed). 1st edn, vol 2. Global Science Books, London. p.336-346.
Takayama, S. and M. Misawa, 1981. Mass propagation of Begonia hiemalis plantlet by shake culture. Plant Cell Physiol., 22: 461- 467.
Taiz, L. and E. Zeiger, 2002. Plant Physiology. 3rd edn. Sinauer Associates, Inc. Publishers, Sunderland, Massachusetts.
Taylor, N.J. and J. Van Staden, 2006. Towards an understanding of in vitro fl owering. In: Floriculture, Ornamental and Plant Biotechnology: Advances and Topical Issues, Teixeira da Silva JA (ed). 1st edn, vol 2. Global Science Books, London. p.1-22.
Teixeira da Silva, J.Á. and D. Tan Nhut, 2003. Thin cell layers and fl oral morphogenesis, fl oral genetics and in vitro fl owering. In: Thin Cell Layer Culture System: Regeneration and Transformation Application, Tan Nhut D., Van Le B., Tran Thanh Van K. and T. Thorpe (eds). Kluwer Academic Publishers, Dordrecht, Boston, London. p.285-342.
Viola, U. and C. Franz, 1989. In vitro propagation of Gentiana lutea. Planta Med., 55: 690.
In vitro fl owering and shoot multiplication of Gentiana trifl ora in air-lift bioreactor cultures 33
Specimen Copy: Not for sale
Wang, Z.H., H.Y. Tu and Q.S. Ye, 2006. Rapid propagation and in vitro fl owering of Dendrobium moniliforme (L.) Sw. Plant Physiol. Commun., 6: 1142-1143.
Yamada, Y., Y. Shoyama, I. Nishioka, H. Kohda, A. Namera and T. Okamot, 1991. Clonal micropropagation of Gentiana scabra Bunge var. buergeri Maxim, and examination of the homogeneity concerning the gentiopicroside content. Chemi. Pharm. Bull., 39: 204-206.
Zhang, Z. and D.W.M. Leung, 2000. A comparison of in vitro and in vivo fl owers in Gentian. Plant Cell Tiss. Org. Cult., 63: 223-226.
Zhang, Z. and D.W.M. Leung, 2002. Factors infl uencing the growth of micropropagated shoots and in vitro fl owering of gentian. Plant Growth Regul., 36: 245-251.
Zheng, L.M. and J.L. Pang, 2006. In vitro fl owering of cultures from a hybrid of Cymbidium goeringii and C. hybridium. J. Plant Physiol. Mol. Biol., 32: 320-324.
34 In vitro fl owering and shoot multiplication of Gentiana trifl ora in air-lift bioreactor cultures
Specimen Copy: Not for sale
Journal of Applied Horticulture, 12(1): 35-41, January-June, 2010
Diversity and effi ciency of wild pollinators of watermelon (Citrullus lanatus (Thunb.) Mansf.) at Yatta (Kenya)
G.N. Njoroge1*, B. Gemmill2, R. Bussmann3, L.E. Newton4 and V.M. Ngumi1
1Jomo Kenyatta University of Agriculture and Technology, Botany Department, P.O. Box 62000 Nairobi, Kenya. 2 Food and Agriculture Organization of the United Nations, Viale delle Terme di Caracalla, 00100 Rome, Italy. 3 Economic Botany, Missouri Botanical Garden, P.O. Box 299, St. Louis, MO 63166-0299, USA. 4Kenyatta University, Botany, P.O. Box 43844, Nairobi, Kenya. *E-mail: [email protected].
Abstract
Citrullus lanatus (Thunb.) Mansf. (Watermelon) is an important crop plant in Kenya. Being monoecious, watermelon is entirely dependent upon pollination services usually by insects for production. Although the centre of origin for this plant is thought to be tropical Africa, essentially not much has been studied of its pollination requirements in this region. The current study investigated the identity of the wild pollinators of watermelon, their behaviour and relative pollination effi ciencies at Yatta, a farm near Thika (Eastern Province). The main pollinator for this crop was found to be the honey bee, Apis mellifera but three wild species of Lasioglossum were found as important pollinators. These wild bees have a signifi cantly higher (P< 0.0001) pollen deposition on stigmas of watermelon than honeybees. One of the Lasioglossum (Ctenonomia) sp. 4 deposited on average three times as much pollen as the honeybee. At about the time of stigmatic receptivity, the number of visits by this species to female fl owers increases until it equals visits to male fl owers irrespective of number of fl owers per plot. This behavioural pattern coupled with the high pollen deposition potential makes Lasioglossum (Ctenonomia) sp. 4 a superior candidate as an alternatively managed pollinator for watermelon. Knowing that visitation occurs mostly in the morning, and that fl owers last only for one day, spraying can be done in the later hours of the day when the pollinators have virtually stopped foraging on the fl owers. In view of the reported pollinator decline globally, the wild pollinator species reported in this study warrant further investigation on their nesting biology and potential for domestication.
Key words: Native pollinators, watermelon, visitation patterns, pollen deposition
IntroductionThe global research, conservation and agricultural communities are increasingly recognising that pollinator diversity and effectiveness is critical to the health of agricultural ecosystems. The contribution made to plants’ reproductive success by pollination is determined in part by the pollinators foraging behaviour. Many insect visitors forage on the fl oral resources presented to them by the plant but only a few are good pollinators. Information on actual or potential role of individual pollinator species is necessary to compare the potential value of different pollinator species as candidates for introduction as managed pollinators (Corbet et al., 1991). The most effi cient pollinator will carry and deposit plenty of pollen on stigmas as it moves from fl ower to fl ower (Kearns and Inuoye, 1993).
The consequences of pollinators visiting a plant can be expressed by either direct or indirect measure of pollinator effectiveness. The indirect methods include visitation rates and time of visitation while pollen load deposition by a single visit to virgin stigmas is a direct measure among others (Spears, 1983; Inouye and Pyke, 1988; Stubbs and Drummond, 1999; Dag and Kammer, 2001).
Pollinator effectiveness will of course be related to the timing of visits. If an insect arrives at a fl ower to take nectar before pollen is presented, or forages after pollen is shed or stigmas have ceased to be receptive, they will not be contributing to reproductive success.
Thus for a pollinator dependent plant such as the watermelon, the temporal pattern of pollinator visitation becomes signifi cant in determining important or effective pollinators. Although the visitation patterns of honeybee on watermelon have been studied (Njoroge et al., 2004; Gikungu, 2006; Kasina, 2007; Karanja, 2010), it is important to compare these visitation rates with those of other important indigenous pollinators as an indicator of relative importance.
For crops that are dependent on insect vectors such as pollinators, managed honey bee colonies are often used to provide pollination services in developed countries or those with a strong apiculture development. In developing countries such as Kenya, however, where most horticultural crops, until recently, have been grown in biodiverse smallholder systems, there is no tradition of providing pollination services, and pollination deficits have not been recognised as a constraint in productivity. This changing scenerio in horticultural sector is intensifying and expanding, resulting in greater uniformity in crop fi elds, greater fragmentation of natural habitats, and greater use of agrochemicals. The challenge, for agroecosystems under development in Kenya, is to identify means of conserving and managing natural pollination services, as a much needed basis for pollination needs. Supplementation by managed honeybee populations may effectively be combined with the natural system, with both providing an effective insurance against risks of disease, agricultural chemicals, and inclement weather impacts on diverse pollinator species.
Journal
Appl
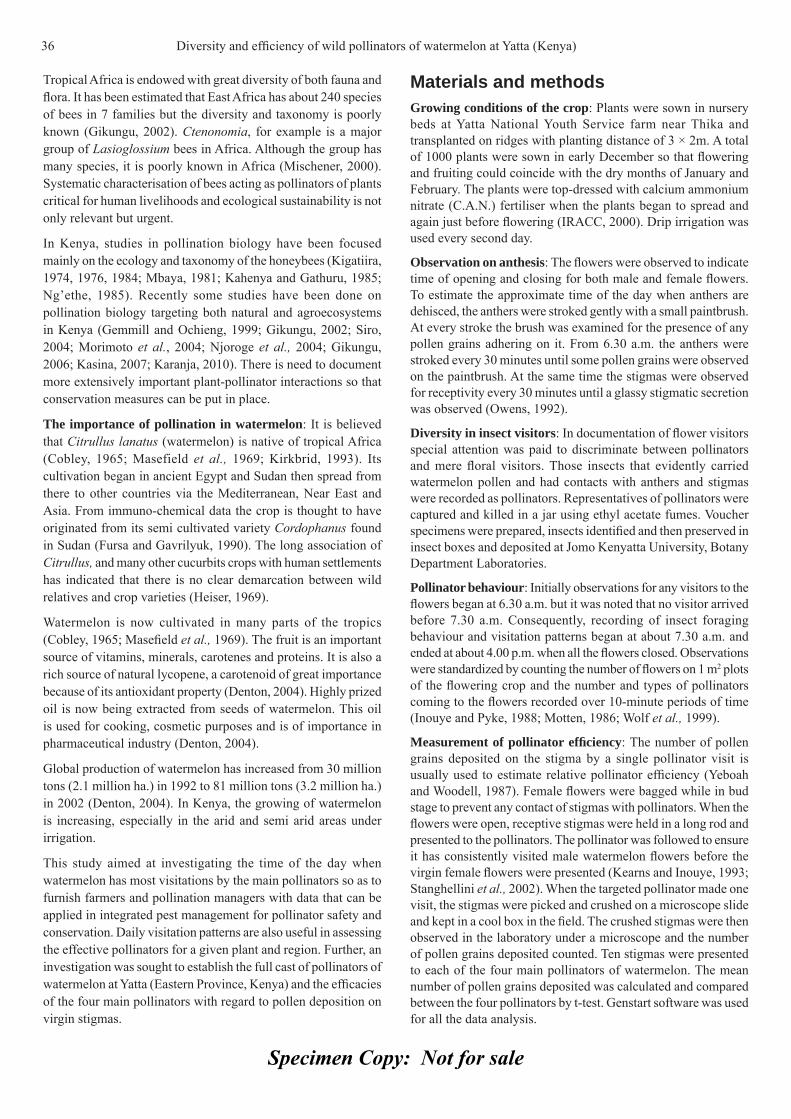
Specimen Copy: Not for sale
Tropical Africa is endowed with great diversity of both fauna and fl ora. It has been estimated that East Africa has about 240 species of bees in 7 families but the diversity and taxonomy is poorly known (Gikungu, 2002). Ctenonomia, for example is a major group of Lasioglossium bees in Africa. Although the group has many species, it is poorly known in Africa (Mischener, 2000). Systematic characterisation of bees acting as pollinators of plants critical for human livelihoods and ecological sustainability is not only relevant but urgent.
In Kenya, studies in pollination biology have been focused mainly on the ecology and taxonomy of the honeybees (Kigatiira, 1974, 1976, 1984; Mbaya, 1981; Kahenya and Gathuru, 1985; Ng’ethe, 1985). Recently some studies have been done on pollination biology targeting both natural and agroecosystems in Kenya (Gemmill and Ochieng, 1999; Gikungu, 2002; Siro, 2004; Morimoto et al., 2004; Njoroge et al., 2004; Gikungu, 2006; Kasina, 2007; Karanja, 2010). There is need to document more extensively important plant-pollinator interactions so that conservation measures can be put in place.
The importance of pollination in watermelon: It is believed that Citrullus lanatus (watermelon) is native of tropical Africa (Cobley, 1965; Masefield et al., 1969; Kirkbrid, 1993). Its cultivation began in ancient Egypt and Sudan then spread from there to other countries via the Mediterranean, Near East and Asia. From immuno-chemical data the crop is thought to have originated from its semi cultivated variety Cordophanus found in Sudan (Fursa and Gavrilyuk, 1990). The long association of Citrullus, and many other cucurbits crops with human settlements has indicated that there is no clear demarcation between wild relatives and crop varieties (Heiser, 1969).
Watermelon is now cultivated in many parts of the tropics (Cobley, 1965; Masefi eld et al., 1969). The fruit is an important source of vitamins, minerals, carotenes and proteins. It is also a rich source of natural lycopene, a carotenoid of great importance because of its antioxidant property (Denton, 2004). Highly prized oil is now being extracted from seeds of watermelon. This oil is used for cooking, cosmetic purposes and is of importance in pharmaceutical industry (Denton, 2004).
Global production of watermelon has increased from 30 million tons (2.1 million ha.) in 1992 to 81 million tons (3.2 million ha.) in 2002 (Denton, 2004). In Kenya, the growing of watermelon is increasing, especially in the arid and semi arid areas under irrigation.
This study aimed at investigating the time of the day when watermelon has most visitations by the main pollinators so as to furnish farmers and pollination managers with data that can be applied in integrated pest management for pollinator safety and conservation. Daily visitation patterns are also useful in assessing the effective pollinators for a given plant and region. Further, an investigation was sought to establish the full cast of pollinators of watermelon at Yatta (Eastern Province, Kenya) and the effi cacies of the four main pollinators with regard to pollen deposition on virgin stigmas.
Materials and methodsGrowing conditions of the crop: Plants were sown in nursery beds at Yatta National Youth Service farm near Thika and transplanted on ridges with planting distance of 3 × 2m. A total of 1000 plants were sown in early December so that fl owering and fruiting could coincide with the dry months of January and February. The plants were top-dressed with calcium ammonium nitrate (C.A.N.) fertiliser when the plants began to spread and again just before fl owering (IRACC, 2000). Drip irrigation was used every second day.
Observation on anthesis: The fl owers were observed to indicate time of opening and closing for both male and female fl owers. To estimate the approximate time of the day when anthers are dehisced, the anthers were stroked gently with a small paintbrush. At every stroke the brush was examined for the presence of any pollen grains adhering on it. From 6.30 a.m. the anthers were stroked every 30 minutes until some pollen grains were observed on the paintbrush. At the same time the stigmas were observed for receptivity every 30 minutes until a glassy stigmatic secretion was observed (Owens, 1992).
Diversity in insect visitors: In documentation of fl ower visitors special attention was paid to discriminate between pollinators and mere fl oral visitors. Those insects that evidently carried watermelon pollen and had contacts with anthers and stigmas were recorded as pollinators. Representatives of pollinators were captured and killed in a jar using ethyl acetate fumes. Voucher specimens were prepared, insects identifi ed and then preserved in insect boxes and deposited at Jomo Kenyatta University, Botany Department Laboratories.
Pollinator behaviour: Initially observations for any visitors to the fl owers began at 6.30 a.m. but it was noted that no visitor arrived before 7.30 a.m. Consequently, recording of insect foraging behaviour and visitation patterns began at about 7.30 a.m. and ended at about 4.00 p.m. when all the fl owers closed. Observations were standardized by counting the number of fl owers on 1 m2 plots of the fl owering crop and the number and types of pollinators coming to the fl owers recorded over 10-minute periods of time (Inouye and Pyke, 1988; Motten, 1986; Wolf et al., 1999).
Measurement of pollinator effi ciency: The number of pollen grains deposited on the stigma by a single pollinator visit is usually used to estimate relative pollinator effi ciency (Yeboah and Woodell, 1987). Female fl owers were bagged while in bud stage to prevent any contact of stigmas with pollinators. When the fl owers were open, receptive stigmas were held in a long rod and presented to the pollinators. The pollinator was followed to ensure it has consistently visited male watermelon fl owers before the virgin female fl owers were presented (Kearns and Inouye, 1993; Stanghellini et al., 2002). When the targeted pollinator made one visit, the stigmas were picked and crushed on a microscope slide and kept in a cool box in the fi eld. The crushed stigmas were then observed in the laboratory under a microscope and the number of pollen grains deposited counted. Ten stigmas were presented to each of the four main pollinators of watermelon. The mean number of pollen grains deposited was calculated and compared between the four pollinators by t-test. Genstart software was used for all the data analysis.
36 Diversity and effi ciency of wild pollinators of watermelon at Yatta (Kenya)
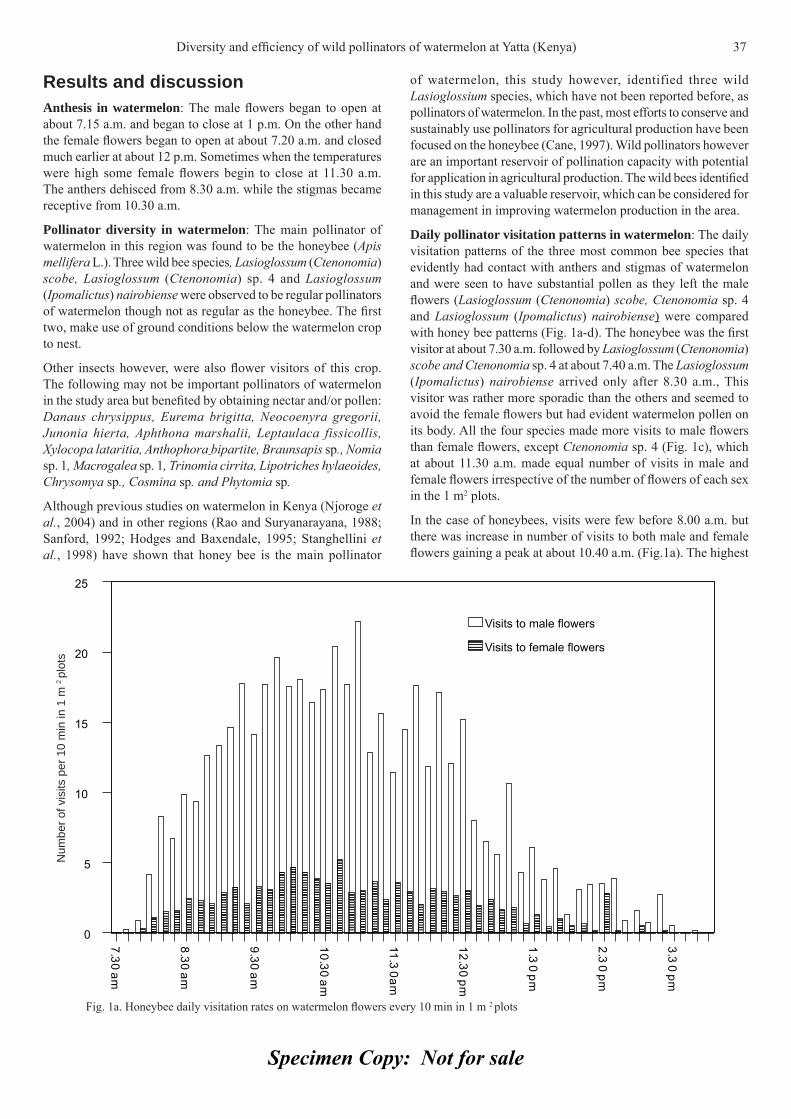
Specimen Copy: Not for sale
Results and discussionAnthesis in watermelon: The male fl owers began to open at about 7.15 a.m. and began to close at 1 p.m. On the other hand the female fl owers began to open at about 7.20 a.m. and closed much earlier at about 12 p.m. Sometimes when the temperatures were high some female fl owers begin to close at 11.30 a.m. The anthers dehisced from 8.30 a.m. while the stigmas became receptive from 10.30 a.m.
Pollinator diversity in watermelon: The main pollinator of watermelon in this region was found to be the honeybee (Apis mellifera L.). Three wild bee species, Lasioglossum (Ctenonomia) scobe, Lasioglossum (Ctenonomia) sp. 4 and Lasioglossum (Ipomalictus) nairobiense were observed to be regular pollinators of watermelon though not as regular as the honeybee. The fi rst two, make use of ground conditions below the watermelon crop to nest.
Other insects however, were also fl ower visitors of this crop. The following may not be important pollinators of watermelon in the study area but benefi ted by obtaining nectar and/or pollen: Danaus chrysippus, Eurema brigitta, Neocoenyra gregorii, Junonia hierta, Aphthona marshalii, Leptaulaca fissicollis, Xylocopa lataritia, Anthophora bipartite, Braunsapis sp., Nomia sp. 1, Macrogalea sp. 1, Trinomia cirrita, Lipotriches hylaeoides, Chrysomya sp., Cosmina sp. and Phytomia sp.
Although previous studies on watermelon in Kenya (Njoroge et al., 2004) and in other regions (Rao and Suryanarayana, 1988; Sanford, 1992; Hodges and Baxendale, 1995; Stanghellini et al., 1998) have shown that honey bee is the main pollinator
of watermelon, this study however, identified three wild Lasioglossium species, which have not been reported before, as pollinators of watermelon. In the past, most efforts to conserve and sustainably use pollinators for agricultural production have been focused on the honeybee (Cane, 1997). Wild pollinators however are an important reservoir of pollination capacity with potential for application in agricultural production. The wild bees identifi ed in this study are a valuable reservoir, which can be considered for management in improving watermelon production in the area.
Daily pollinator visitation patterns in watermelon: The daily visitation patterns of the three most common bee species that evidently had contact with anthers and stigmas of watermelon and were seen to have substantial pollen as they left the male fl owers (Lasioglossum (Ctenonomia) scobe, Ctenonomia sp. 4 and Lasioglossum (Ipomalictus) nairobiense) were compared with honey bee patterns (Fig. 1a-d). The honeybee was the fi rst visitor at about 7.30 a.m. followed by Lasioglossum (Ctenonomia) scobe and Ctenonomia sp. 4 at about 7.40 a.m. The Lasioglossum (Ipomalictus) nairobiense arrived only after 8.30 a.m., This visitor was rather more sporadic than the others and seemed to avoid the female fl owers but had evident watermelon pollen on its body. All the four species made more visits to male fl owers than female fl owers, except Ctenonomia sp. 4 (Fig. 1c), which at about 11.30 a.m. made equal number of visits in male and female fl owers irrespective of the number of fl owers of each sex in the 1 m2 plots.
In the case of honeybees, visits were few before 8.00 a.m. but there was increase in number of visits to both male and female fl owers gaining a peak at about 10.40 a.m. (Fig.1a). The highest
Fig. 1a. Honeybee daily visitation rates on watermelon fl owers every 10 min in 1 m 2 plots
Diversity and effi ciency of wild pollinators of watermelon at Yatta (Kenya) 37N
umbe
r of v
isits
per
10
min
in 1
m 2
plot
s
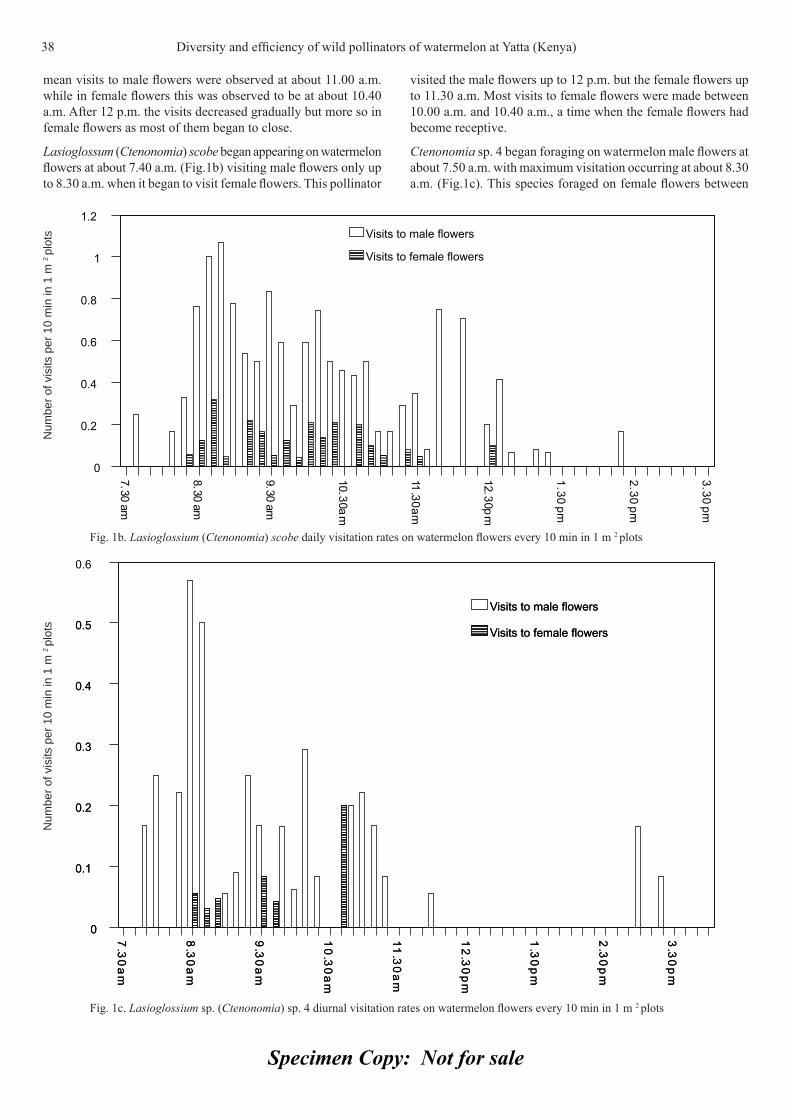
Specimen Copy: Not for sale
mean visits to male fl owers were observed at about 11.00 a.m. while in female fl owers this was observed to be at about 10.40 a.m. After 12 p.m. the visits decreased gradually but more so in female fl owers as most of them began to close.
Lasioglossum (Ctenonomia) scobe began appearing on watermelon fl owers at about 7.40 a.m. (Fig.1b) visiting male fl owers only up to 8.30 a.m. when it began to visit female fl owers. This pollinator
visited the male fl owers up to 12 p.m. but the female fl owers up to 11.30 a.m. Most visits to female fl owers were made between 10.00 a.m. and 10.40 a.m., a time when the female fl owers had become receptive.
Ctenonomia sp. 4 began foraging on watermelon male fl owers at about 7.50 a.m. with maximum visitation occurring at about 8.30 a.m. (Fig.1c). This species foraged on female fl owers between
Fig. 1b. Lasioglossium (Ctenonomia) scobe daily visitation rates on watermelon fl owers every 10 min in 1 m 2 plots
Fig. 1c. Lasioglossium sp. (Ctenonomia) sp. 4 diurnal visitation rates on watermelon fl owers every 10 min in 1 m 2 plots
38 Diversity and effi ciency of wild pollinators of watermelon at Yatta (Kenya) N
umbe
r of v
isits
per
10
min
in 1
m 2
plot
sN
umbe
r of v
isits
per
10
min
in 1
m 2
plot
s
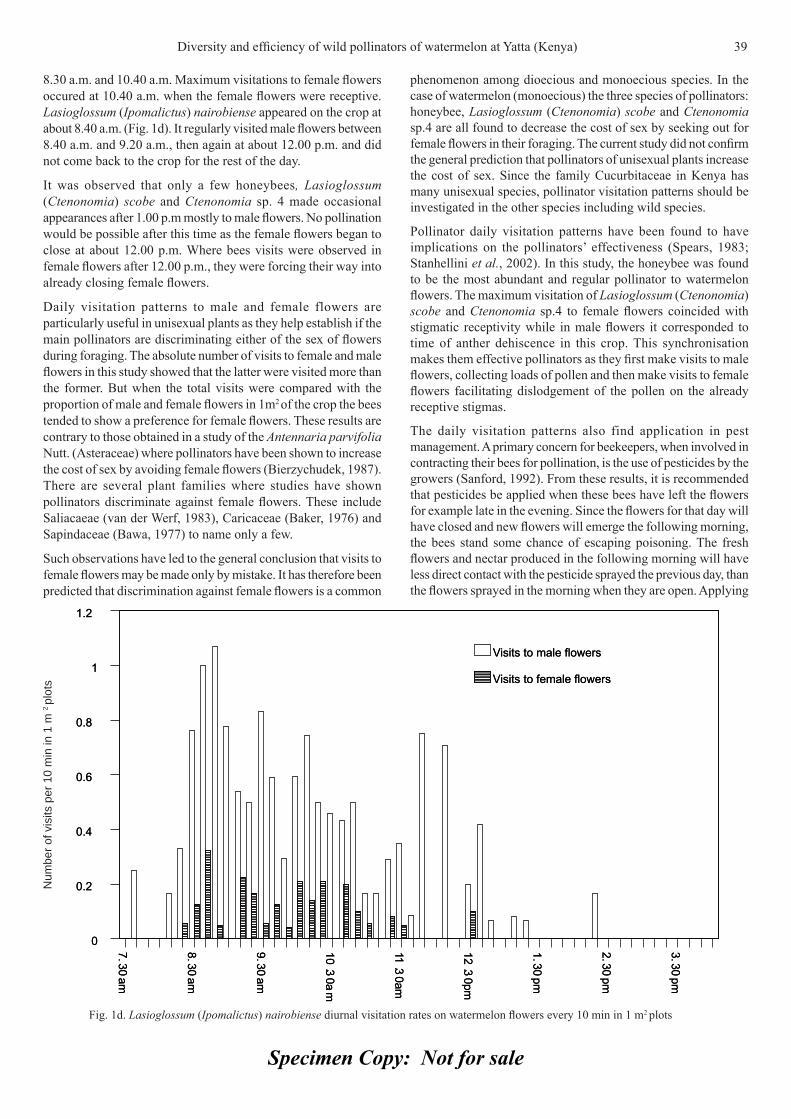
Specimen Copy: Not for sale
8.30 a.m. and 10.40 a.m. Maximum visitations to female fl owers occured at 10.40 a.m. when the female fl owers were receptive. Lasioglossum (Ipomalictus) nairobiense appeared on the crop at about 8.40 a.m. (Fig. 1d). It regularly visited male fl owers between 8.40 a.m. and 9.20 a.m., then again at about 12.00 p.m. and did not come back to the crop for the rest of the day.
It was observed that only a few honeybees, Lasioglossum (Ctenonomia) scobe and Ctenonomia sp. 4 made occasional appearances after 1.00 p.m mostly to male fl owers. No pollination would be possible after this time as the female fl owers began to close at about 12.00 p.m. Where bees visits were observed in female fl owers after 12.00 p.m., they were forcing their way into already closing female fl owers.
Daily visitation patterns to male and female flowers are particularly useful in unisexual plants as they help establish if the main pollinators are discriminating either of the sex of fl owers during foraging. The absolute number of visits to female and male fl owers in this study showed that the latter were visited more than the former. But when the total visits were compared with the proportion of male and female fl owers in 1m2 of the crop the bees tended to show a preference for female fl owers. These results are contrary to those obtained in a study of the Antennaria parvifolia Nutt. (Asteraceae) where pollinators have been shown to increase the cost of sex by avoiding female fl owers (Bierzychudek, 1987). There are several plant families where studies have shown pollinators discriminate against female fl owers. These include Saliacaeae (van der Werf, 1983), Caricaceae (Baker, 1976) and Sapindaceae (Bawa, 1977) to name only a few.
Such observations have led to the general conclusion that visits to female fl owers may be made only by mistake. It has therefore been predicted that discrimination against female fl owers is a common
phenomenon among dioecious and monoecious species. In the case of watermelon (monoecious) the three species of pollinators: honeybee, Lasioglossum (Ctenonomia) scobe and Ctenonomia sp.4 are all found to decrease the cost of sex by seeking out for female fl owers in their foraging. The current study did not confi rm the general prediction that pollinators of unisexual plants increase the cost of sex. Since the family Cucurbitaceae in Kenya has many unisexual species, pollinator visitation patterns should be investigated in the other species including wild species.
Pollinator daily visitation patterns have been found to have implications on the pollinators’ effectiveness (Spears, 1983; Stanhellini et al., 2002). In this study, the honeybee was found to be the most abundant and regular pollinator to watermelon fl owers. The maximum visitation of Lasioglossum (Ctenonomia) scobe and Ctenonomia sp.4 to female fl owers coincided with stigmatic receptivity while in male fl owers it corresponded to time of anther dehiscence in this crop. This synchronisation makes them effective pollinators as they fi rst make visits to male fl owers, collecting loads of pollen and then make visits to female fl owers facilitating dislodgement of the pollen on the already receptive stigmas.
The daily visitation patterns also find application in pest management. A primary concern for beekeepers, when involved in contracting their bees for pollination, is the use of pesticides by the growers (Sanford, 1992). From these results, it is recommended that pesticides be applied when these bees have left the fl owers for example late in the evening. Since the fl owers for that day will have closed and new fl owers will emerge the following morning, the bees stand some chance of escaping poisoning. The fresh fl owers and nectar produced in the following morning will have less direct contact with the pesticide sprayed the previous day, than the fl owers sprayed in the morning when they are open. Applying
Fig. 1d. Lasioglossum (Ipomalictus) nairobiense diurnal visitation rates on watermelon fl owers every 10 min in 1 m2 plots
Diversity and effi ciency of wild pollinators of watermelon at Yatta (Kenya) 39N
umbe
r of v
isits
per
10
min
in 1
m 2
plot
s
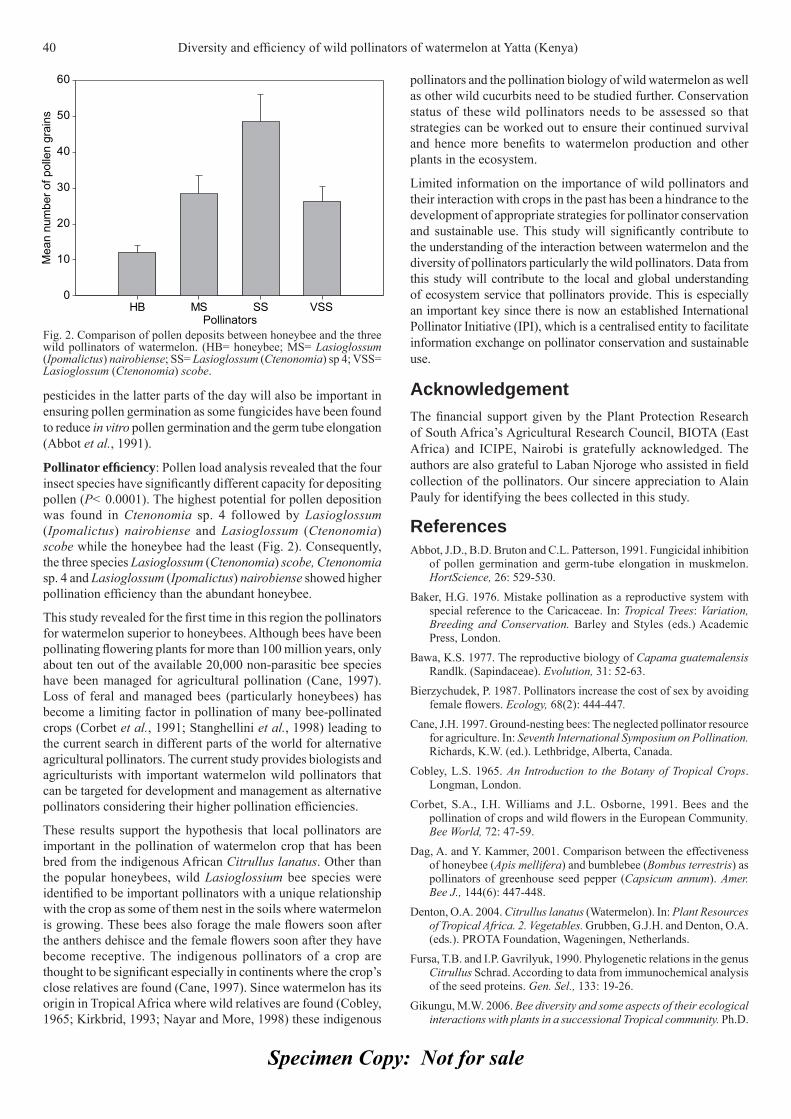
Specimen Copy: Not for sale
pesticides in the latter parts of the day will also be important in ensuring pollen germination as some fungicides have been found to reduce in vitro pollen germination and the germ tube elongation (Abbot et al., 1991).
Pollinator effi ciency: Pollen load analysis revealed that the four insect species have signifi cantly different capacity for depositing pollen (P< 0.0001). The highest potential for pollen deposition was found in Ctenonomia sp. 4 followed by Lasioglossum (Ipomalictus) nairobiense and Lasioglossum (Ctenonomia) scobe while the honeybee had the least (Fig. 2). Consequently, the three species Lasioglossum (Ctenonomia) scobe, Ctenonomia sp. 4 and Lasioglossum (Ipomalictus) nairobiense showed higher pollination effi ciency than the abundant honeybee.
This study revealed for the fi rst time in this region the pollinators for watermelon superior to honeybees. Although bees have been pollinating fl owering plants for more than 100 million years, only about ten out of the available 20,000 non-parasitic bee species have been managed for agricultural pollination (Cane, 1997). Loss of feral and managed bees (particularly honeybees) has become a limiting factor in pollination of many bee-pollinated crops (Corbet et al., 1991; Stanghellini et al., 1998) leading to the current search in different parts of the world for alternative agricultural pollinators. The current study provides biologists and agriculturists with important watermelon wild pollinators that can be targeted for development and management as alternative pollinators considering their higher pollination effi ciencies.
These results support the hypothesis that local pollinators are important in the pollination of watermelon crop that has been bred from the indigenous African Citrullus lanatus. Other than the popular honeybees, wild Lasioglossium bee species were identifi ed to be important pollinators with a unique relationship with the crop as some of them nest in the soils where watermelon is growing. These bees also forage the male fl owers soon after the anthers dehisce and the female fl owers soon after they have become receptive. The indigenous pollinators of a crop are thought to be signifi cant especially in continents where the crop’s close relatives are found (Cane, 1997). Since watermelon has its origin in Tropical Africa where wild relatives are found (Cobley, 1965; Kirkbrid, 1993; Nayar and More, 1998) these indigenous
pollinators and the pollination biology of wild watermelon as well as other wild cucurbits need to be studied further. Conservation status of these wild pollinators needs to be assessed so that strategies can be worked out to ensure their continued survival and hence more benefi ts to watermelon production and other plants in the ecosystem.
Limited information on the importance of wild pollinators and their interaction with crops in the past has been a hindrance to the development of appropriate strategies for pollinator conservation and sustainable use. This study will signifi cantly contribute to the understanding of the interaction between watermelon and the diversity of pollinators particularly the wild pollinators. Data from this study will contribute to the local and global understanding of ecosystem service that pollinators provide. This is especially an important key since there is now an established International Pollinator Initiative (IPI), which is a centralised entity to facilitate information exchange on pollinator conservation and sustainable use.
AcknowledgementThe fi nancial support given by the Plant Protection Research of South Africa’s Agricultural Research Council, BIOTA (East Africa) and ICIPE, Nairobi is gratefully acknowledged. The authors are also grateful to Laban Njoroge who assisted in fi eld collection of the pollinators. Our sincere appreciation to Alain Pauly for identifying the bees collected in this study.
ReferencesAbbot, J.D., B.D. Bruton and C.L. Patterson, 1991. Fungicidal inhibition
of pollen germination and germ-tube elongation in muskmelon. HortScience, 26: 529-530.
Baker, H.G. 1976. Mistake pollination as a reproductive system with special reference to the Caricaceae. In: Tropical Trees: Variation, Breeding and Conservation. Barley and Styles (eds.) Academic Press, London.
Bawa, K.S. 1977. The reproductive biology of Capama guatemalensis Randlk. (Sapindaceae). Evolution, 31: 52-63.
Bierzychudek, P. 1987. Pollinators increase the cost of sex by avoiding female fl owers. Ecology, 68(2): 444-447.
Cane, J.H. 1997. Ground-nesting bees: The neglected pollinator resource for agriculture. In: Seventh International Symposium on Pollination. Richards, K.W. (ed.). Lethbridge, Alberta, Canada.
Cobley, L.S. 1965. An Introduction to the Botany of Tropical Crops. Longman, London.
Corbet, S.A., I.H. Williams and J.L. Osborne, 1991. Bees and the pollination of crops and wild fl owers in the European Community. Bee World, 72: 47-59.
Dag, A. and Y. Kammer, 2001. Comparison between the effectiveness of honeybee (Apis mellifera) and bumblebee (Bombus terrestris) as pollinators of greenhouse seed pepper (Capsicum annum). Amer. Bee J., 144(6): 447-448.
Denton, O.A. 2004. Citrullus lanatus (Watermelon). In: Plant Resources of Tropical Africa. 2. Vegetables. Grubben, G.J.H. and Denton, O.A. (eds.). PROTA Foundation, Wageningen, Netherlands.
Fursa, T.B. and I.P. Gavrilyuk, 1990. Phylogenetic relations in the genus Citrullus Schrad. According to data from immunochemical analysis of the seed proteins. Gen. Sel., 133: 19-26.
Gikungu, M.W. 2006. Bee diversity and some aspects of their ecological interactions with plants in a successional Tropical community. Ph.D.
Fig. 2. Comparison of pollen deposits between honeybee and the three wild pollinators of watermelon. (HB= honeybee; MS= Lasioglossum (Ipomalictus) nairobiense; SS= Lasioglossum (Ctenonomia) sp 4; VSS= Lasioglossum (Ctenonomia) scobe.
40 Diversity and effi ciency of wild pollinators of watermelon at Yatta (Kenya)
Specimen Copy: Not for sale
Thesis, University of Bonn, Germany.Gemmill, B. and A. Ochieng, 1999. The role of wild bees in the
pollination of eggplant, Solanum melongena. (Proceedings of Second International Workshop on Conservation and Utilization of Commercial Insects, pp 227-235).
Gikungu, M.W. 2002. Studies on bee populations and some aspects of their foraging habits in Mt. Kenya forest. M. Sc. Thesis. University of Nairobi, 2002.
Gikungu, M.W. 2006. Bee diversity and some aspects of their ecological interactions with plants in a successional Tropical community. PhD Thesis, University of Bonn, Germany.
Heiser, C.B. 1969. The Gourd Book. University of Oklahoma Press, Norman.
Hodges, L. and F. Baxendale, 1995. Bee pollination of Cucurbit crops. Nebraska Co-operative Extension, NF91-50.
Inouye, D.W. and G.H. Pyke, 1988. Pollination biology in the snowy mountains of Australia: Comparisons with montane Colorado, USA. Australian Journal of Ecology, 13: 191-210.
IRACC, 2000. Small holder farming Handbook for self-employment, Nairobi.
Kasina, J.M. 2007. Bee pollinators and economic importance of pollination in crop production. Case of Kakamega Western Kenya. PhD Thesis University of Bonn, Germany.
Karanja, R.H.N. 2010. Pollination of Coffea arabica L. and associated awareness of pollination signifi cance among farmers in selected farms in Kiambu District, Kenya. PhD Thesis Jomo Kenyatta University of Agriculture and Technology, Kenya.
Kasina, J.M. 2007. Bee pollinators and economic importance of pollination in crop production. Case of Kakamega Western Kenya. Ph.D. Thesis University of Bonn, Germany.
Karanja, R.H.N. 2010. Pollination of Coffea arabica L. and associated awareness of pollination signifi cance among farmers in selected farms in Kiambu District, Kenya. Ph.D. Thesis Jomo Kenyatta University of Agriculture and Technology, Kenya.
Kahenya, A.W. and J. Gathuru, 1985. Identifi cation of honey plants in Kenya by pollen analysis. (Proc. 3 int. Conf. Apic. Trop. Climates, Nairobi, 1984: 203-204). IBRA London UK.
Kearns, C.A and D.W. Inouye, 1993. Techniques in Pollination Biology. University Press, Colorado.
Kigatiira, I.K. 1974. Hive designs for beekeeping in Kenya. Proc. Ento. Soc. Ont., 105: 118-128.
Kigatiira, I.K. 1976. Keeping bees in fi xed comb and movable frameless hives. Apiculture in Tropical climates. London: International Bee Research Association, pp. 9-13.
Kigatiira, I.K. 1984. Some aspects of the ecology of African honeybees. Ph.D. thesis. University of Aradisia, London.
Kirkbrid, J.H. 1993. Biosystematic monograph of the genus Cucumis (Cucurbitaceae) Botanical identifi cation of cucumbers and melons. Parkway, Carolina.
Masefi eld, G.B., M. Wallis, Harrison and B.E. Nicholson, 1969. The Oxford Book of Food Plants. Oxford University Press, London.
Mbaya, J.S.K. 1981. Studies in the distribution and some aspects of African honeybee in Kenya. M.Sc. Thesis, University of Nairobi, 1981.
Mischener, C.D. 2000. The Bees of the World. The John Hopkins University Press, Baltimore.
Morimoto, Y., M. Gikungu and P. Maundu, 2004. Pollinators of the bottle gourd (Lagenaria siceraria) observed in Kenya. Intern. J. Trop. Ins. Sci., 24(1): 79-86.
Motten, A.F. 1986. Pollination ecology of the spring wildfl ower community of a temperate deciduous forest. Ecol. Monogr., 56: 21-42.
Nayar, N.M. and T.A More, 1998. Cucurbits. Science Publishers, Enfi eld.
Ng’ethe, J. C. 1985. Honey production from natural vegetation in Kitui District, Kenya. In: Proc. 3 Int. Conf. Apic. Climates, Nairobi, IBRA London UK, pp 205-208.
Njoroge, G., B. Gemmill, R. Bussmann, L.E. Newton and V.W. Ngumi, 2004. Pollination ecology of Citrullus lanatus at Yatta, Kenya. Intern. J. Trop. Ins. Sci., 24: 73-77.
Owens, S.J. 1992. Pollination and fertilization in higher plants. In: Fruit and Seed Production. Aspects of Development, Environmental Physiology and Ecology. Marshall, C. and Grace, J. (Eds.), University Press, Cambridge.
Rao, G.M. and M.C. Suryanarayana, 1988. Studies on pollination of watermelon (Citrullus lanatus (Thunb.) Mansf.). Ind. Bee J., 50: 5-8.
Sanford, M.T. 1992. Bee keeping: Watermelon pollination. Co-operative extension service RF-AA091, Florida.
Siro, P.M. 2004. Trap-fl y pollination in East African Ceropegia L. (Apocynaceae). Intern. J. Trop. Ins. Sci., 24: 55-72.
Spears, E.E. 1983. A direct measure of pollinator effectiveness. Oecologie, 57: 196-199.
Stanghellini, M.S., J.T. Ambrose and J.R. Schulthesis, 1998. The effects of honey bee and bumblebee pollination on fruit set and abortion of cucumber and watermelon. Amer. Bee J., 137(5): 386-391.
Stanghellini, M.S., J.T. Ambrose and J.R. Schultheis, 2002. Diurnal activity, fl oral visitation and pollen deposition by honey bees and bumblebees on fi eld-grown cucumber and watermelon. J. Apic. Res., 41: 27-34
Stubbs, C.S. and F.A. Drummond, 1999. Pollination of low bush Blueberry by Anrhophora pilipes villosula and Bombus impatiens (Hymenoptera: Anthophoridae and Apidae). J. Kans. Ento. Soc., 72: 330-333.
Van der Werf, F. 1978. Discriminating visiting in Salix by Apis. In: Pollen: Biology and Implications for Breeding, Mulcahy and Ottaviano (eds.). Elsevier, New York.
Wolf, N.M., Y. Lenskey and N. Paldi, 1999. Genetic variability in fl ower attractiveness to honeybees (Apis mellifera) within the Genus Citrullus. HortScience, 34: 860-865.
Yeboah, G.K. and S.R.J. Woodell, 1987. Analysis of insect pollen loads and pollination effi ciency of some common insect visitors of four species of wood Rosaceae. Func. Ecol., 1: 269-274.
Diversity and effi ciency of wild pollinators of watermelon at Yatta (Kenya) 41
Specimen Copy: Not for sale
Journal
ApplJournal of Applied Horticulture, 12(1): 42-45, January-June, 2010
In vitro mass propagation of Sikkim Himalayan Rhododendron (R. dalhousiae Hook. f.) from nodal segment
Bhusan Gurung and K.K. Singh*
G.B. Pant Institute of Himalayan Environment and Development, Sikkim Unit, Pangthang, Post Box 24, Gangtok, East Sikkim-737 101, India. *E-mail: [email protected]
AbstractThe fi rst successful micropropagation protocol was developed for an important Sikkim Himalayan Rhododendron, R. dalhousiae Hook. f. also known as Lahare Chimal in Sikkim. In vitro raised shoot tip explants from R. dalhousiae were used to produce multiple shoots on a medium containing various concentrations of growth regulators. Among the combinations used, Murashige and Skoog (MS) medium containing 5 mg L-l 2-isopentenyladenine (2iP) along with additives such as, 100 mg L-l polyvinyl pyrrolidone (PVP), 100 mg L -l ascorbic acid, 10 mg L-l citric acid was found to be best for induction of multiple shoots within 12 weeks of culture. The combination of 5 mg L-l 2iP +1 mg L-1 indole-3-acetic acid (IAA) resulted in further multiple shoot production than using them alone. Rooting of shoots in vitro was achieved on MS medium containing 0.2 mg L-l indolebutyric acid (IBA). Rooted plantlets were transferred to small polythene bags containing autoclaved fresh peat moss and soil (1:3) and maintained with a high humidity for acclimation. These in vitro-raised plants grew normally in greenhouse and natural habitat (arboretum of the Institute) without showing any morphological variation. The protocol developed from the present study could be used for large scale multiplication of R. dalhousiae in a limited time.
Key words: Micropropagation, shoot formation, rooting, acclimatization, Rhododendron dalhousiae, Sikkim Himalaya
IntroductionCreamy white fl owered Rhododendron (R. dalhousiae Hook. f., local Name -Lahare Chimal) is found on steep banks, rocks and trees of Michelia and Quercus, growing mostly epiphytically in association with ferns, orchids, etc. and distributed in Sikkim Himalaya at an elevation of 1500 to 2500m amsl. The genus Rhododendron, having about 50 species in India, is mainly distributed in the Himalayan region (Gamble, 1936; Pradhan and Lachungpa, 1990; Singh, et al., 2003) and is one of the most neglected groups of Indian plants in terms of scientifi c research. The major threats to Rhododendrons are deforestation and unsustainable extraction for fi rewood and incense by local people. The regeneration status in the form of available seedlings/saplings is very poor due to the above situation for many of the Rhododendrons (Kumar, et al., 2005; Paul, et al., 2005; Singh, et al., 2008a).
In vitro propagation from meristematic tissues is a suitable method for production of Rhododendrons and Azaleas; their propagation by conventional methods (seeds, cuttings, etc.) is either diffi cult or ineffective (Almeida, et al., 2005; Vejsadova, 2008; Singh et al., 2008b). All the species of Sikkim Himalayan Rhododendrons have the potential of commercial value. Various reports are available on the Rhododendron research and development internationally (Rotherham, 1983; Krishna, et al., 2002; Alper and Rotherham, 2006) with regards to it’s growing condition, reproductive methods, taxonomy, breeding etc. (Hsia and Korban, 1977), but actual study on conservation issue of these plants in the Sikkim Himalaya is almost non existent. Therefore, considering the importance of the Rhododendron spp., the present experiment was initiated to study the in vitro response of R. dalhousiae and attempt was made to regenerate plants from nodal segment explants.
Materials and methods Plant material, sterilization and culture conditions: Seeds were collected in the month of October-November from Rate-chu, East Sikkim and were washed for 30 min in running tap water followed by detergent (Tween-80; 1.0%, v/v; 10 min). Surface sterilization was performed with freshly prepared aqueous solution of mercuric chloride (0.05%; w/v; 3 min). Each treatment was followed by repeated washing (4 times) with sterile distilled water under aseptic conditions. The seeds were placed aseptically in test tubes (10 seeds per culture test tube, 25 mm dia, 15 mL medium) onto Murashige and Skoog medium (MS) (1962) containing 3% sucrose and 0.8% (w/v) agar. The medium was adjusted to pH 5.6 before autoclaving at 121oC for 15 minutes at 1.05 kg/cm2 pressure. All the cultures were maintained at 23 ± 1 oC temperature and 80% relative humidity under 16 hr/8 hr (light/dark) photoperiod and a light intensity of 60 μmol m-2 s-1 photon fl ux provided by cool-white fl uorescent lamps.
Selection of best medium for mass propagation: In order to induce shoot proliferation in vitro, following culture media were tested: Murashige and Skoog medium (MS) (1962), half-strength MS (half amount of inorganic constituents, full amounts of organic and other constituents per litre of MS medium) (½ MS), Anderson medium (AM) (1975) and Woody Plant medium (WPM) (Lloyd and McCown, 1981). The medium gelled with 0.8% Agar supplemented with 5 mg L-l 2iP along with additives (100 mg L-l PVP, 100 mg L-l ascorbic acid and 10 mg L-l citric acid) and 3% sucrose was used for multiplication of shoots.
Nodal segment (10-15 cm) were excised from six weeks old in vitro seedlings and directly planted onto conical fl ask (250 mL) containing MS medium supplemented with 2iP, Zeatin and TDZ at various concentration along with auxin as shown in tables.
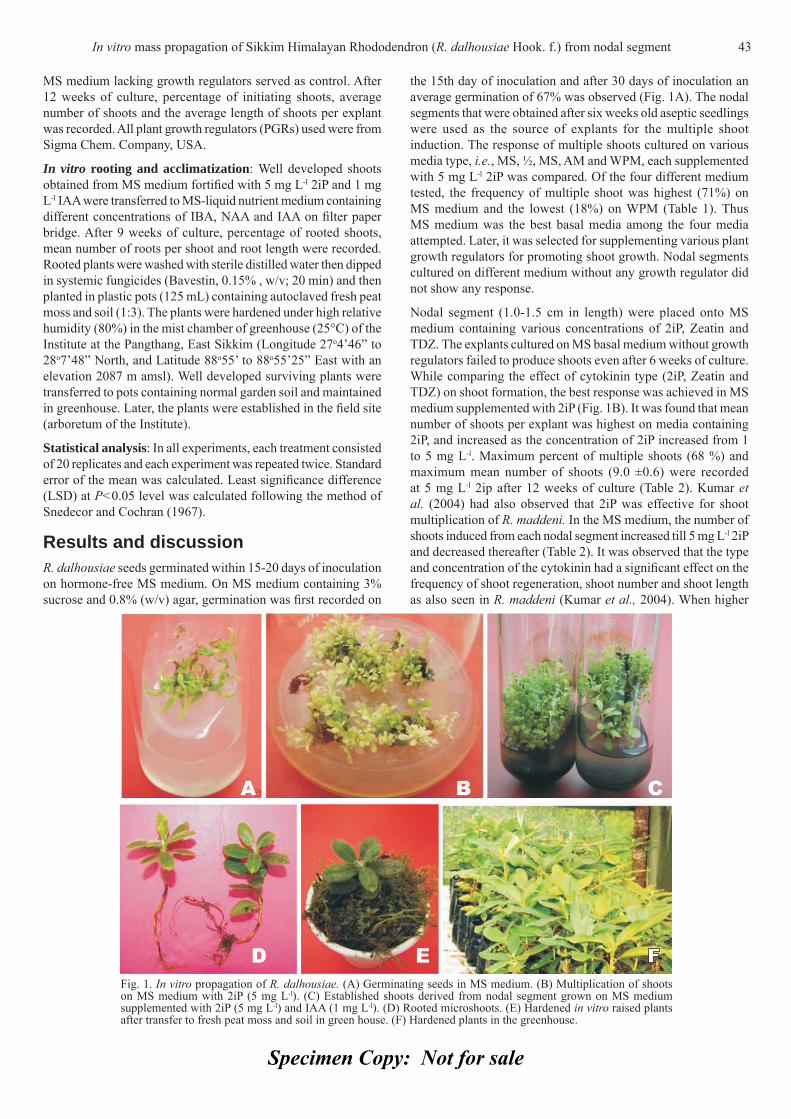
Specimen Copy: Not for sale
MS medium lacking growth regulators served as control. After 12 weeks of culture, percentage of initiating shoots, average number of shoots and the average length of shoots per explant was recorded. All plant growth regulators (PGRs) used were from Sigma Chem. Company, USA.
In vitro rooting and acclimatization: Well developed shoots obtained from MS medium fortifi ed with 5 mg L-l 2iP and 1 mg L-l IAA were transferred to MS-liquid nutrient medium containing different concentrations of IBA, NAA and IAA on fi lter paper bridge. After 9 weeks of culture, percentage of rooted shoots, mean number of roots per shoot and root length were recorded. Rooted plants were washed with sterile distilled water then dipped in systemic fungicides (Bavestin, 0.15% , w/v; 20 min) and then planted in plastic pots (125 mL) containing autoclaved fresh peat moss and soil (1:3). The plants were hardened under high relative humidity (80%) in the mist chamber of greenhouse (25°C) of the Institute at the Pangthang, East Sikkim (Longitude 27o4’46” to 28o7’48” North, and Latitude 88o55’ to 88o55’25” East with an elevation 2087 m amsl). Well developed surviving plants were transferred to pots containing normal garden soil and maintained in greenhouse. Later, the plants were established in the fi eld site (arboretum of the Institute).
Statistical analysis: In all experiments, each treatment consisted of 20 replicates and each experiment was repeated twice. Standard error of the mean was calculated. Least signifi cance difference (LSD) at P<0.05 level was calculated following the method of Snedecor and Cochran (1967).
Results and discussionR. dalhousiae seeds germinated within 15-20 days of inoculation on hormone-free MS medium. On MS medium containing 3% sucrose and 0.8% (w/v) agar, germination was fi rst recorded on
the 15th day of inoculation and after 30 days of inoculation an average germination of 67% was observed (Fig. 1A). The nodal segments that were obtained after six weeks old aseptic seedlings were used as the source of explants for the multiple shoot induction. The response of multiple shoots cultured on various media type, i.e., MS, ½, MS, AM and WPM, each supplemented with 5 mg L-l 2iP was compared. Of the four different medium tested, the frequency of multiple shoot was highest (71%) on MS medium and the lowest (18%) on WPM (Table 1). Thus MS medium was the best basal media among the four media attempted. Later, it was selected for supplementing various plant growth regulators for promoting shoot growth. Nodal segments cultured on different medium without any growth regulator did not show any response.
Nodal segment (1.0-1.5 cm in length) were placed onto MS medium containing various concentrations of 2iP, Zeatin and TDZ. The explants cultured on MS basal medium without growth regulators failed to produce shoots even after 6 weeks of culture. While comparing the effect of cytokinin type (2iP, Zeatin and TDZ) on shoot formation, the best response was achieved in MS medium supplemented with 2iP (Fig. 1B). It was found that mean number of shoots per explant was highest on media containing 2iP, and increased as the concentration of 2iP increased from 1 to 5 mg L-l. Maximum percent of multiple shoots (68 %) and maximum mean number of shoots (9.0 ±0.6) were recorded at 5 mg L-l 2ip after 12 weeks of culture (Table 2). Kumar et al. (2004) had also observed that 2iP was effective for shoot multiplication of R. maddeni. In the MS medium, the number of shoots induced from each nodal segment increased till 5 mg L-l 2iP and decreased thereafter (Table 2). It was observed that the type and concentration of the cytokinin had a signifi cant effect on the frequency of shoot regeneration, shoot number and shoot length as also seen in R. maddeni (Kumar et al., 2004). When higher
Fig. 1. In vitro propagation of R. dalhousiae. (A) Germinating seeds in MS medium. (B) Multiplication of shoots on MS medium with 2iP (5 mg L-l). (C) Established shoots derived from nodal segment grown on MS medium supplemented with 2iP (5 mg L-l) and IAA (1 mg L-l). (D) Rooted microshoots. (E) Hardened in vitro raised plants after transfer to fresh peat moss and soil in green house. (F) Hardened plants in the greenhouse.
In vitro mass propagation of Sikkim Himalayan Rhododendron (R. dalhousiae Hook. f.) from nodal segment 43
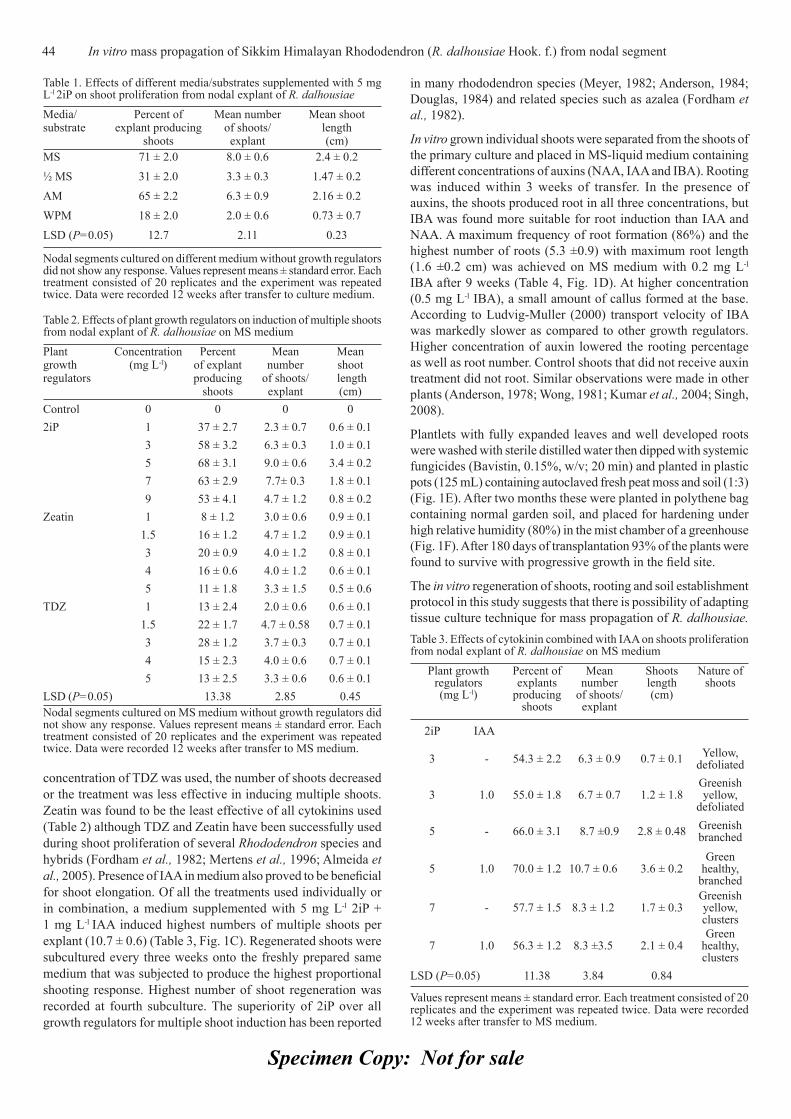
Specimen Copy: Not for sale
concentration of TDZ was used, the number of shoots decreased or the treatment was less effective in inducing multiple shoots. Zeatin was found to be the least effective of all cytokinins used (Table 2) although TDZ and Zeatin have been successfully used during shoot proliferation of several Rhododendron species and hybrids (Fordham et al., 1982; Mertens et al., 1996; Almeida et al., 2005). Presence of IAA in medium also proved to be benefi cial for shoot elongation. Of all the treatments used individually or in combination, a medium supplemented with 5 mg L-l 2iP + 1 mg L-l IAA induced highest numbers of multiple shoots per explant (10.7 ± 0.6) (Table 3, Fig. 1C). Regenerated shoots were subcultured every three weeks onto the freshly prepared same medium that was subjected to produce the highest proportional shooting response. Highest number of shoot regeneration was recorded at fourth subculture. The superiority of 2iP over all growth regulators for multiple shoot induction has been reported
in many rhododendron species (Meyer, 1982; Anderson, 1984; Douglas, 1984) and related species such as azalea (Fordham et al., 1982).
In vitro grown individual shoots were separated from the shoots of the primary culture and placed in MS-liquid medium containing different concentrations of auxins (NAA, IAA and IBA). Rooting was induced within 3 weeks of transfer. In the presence of auxins, the shoots produced root in all three concentrations, but IBA was found more suitable for root induction than IAA and NAA. A maximum frequency of root formation (86%) and the highest number of roots (5.3 ±0.9) with maximum root length (1.6 ±0.2 cm) was achieved on MS medium with 0.2 mg L-l
IBA after 9 weeks (Table 4, Fig. 1D). At higher concentration (0.5 mg L-l IBA), a small amount of callus formed at the base. According to Ludvig-Muller (2000) transport velocity of IBA was markedly slower as compared to other growth regulators. Higher concentration of auxin lowered the rooting percentage as well as root number. Control shoots that did not receive auxin treatment did not root. Similar observations were made in other plants (Anderson, 1978; Wong, 1981; Kumar et al., 2004; Singh, 2008).
Plantlets with fully expanded leaves and well developed roots were washed with sterile distilled water then dipped with systemic fungicides (Bavistin, 0.15%, w/v; 20 min) and planted in plastic pots (125 mL) containing autoclaved fresh peat moss and soil (1:3) (Fig. 1E). After two months these were planted in polythene bag containing normal garden soil, and placed for hardening under high relative humidity (80%) in the mist chamber of a greenhouse (Fig. 1F). After 180 days of transplantation 93% of the plants were found to survive with progressive growth in the fi eld site.
The in vitro regeneration of shoots, rooting and soil establishment protocol in this study suggests that there is possibility of adapting tissue culture technique for mass propagation of R. dalhousiae.
Table 1. Effects of different media/substrates supplemented with 5 mg L-l 2iP on shoot proliferation from nodal explant of R. dalhousiaeMedia/substrate
Percent of explant producing
shoots
Mean number of shoots/explant
Mean shoot length(cm)
MS 71 ± 2.0 8.0 ± 0.6 2.4 ± 0.2½ MS 31 ± 2.0 3.3 ± 0.3 1.47 ± 0.2AM 65 ± 2.2 6.3 ± 0.9 2.16 ± 0.2WPM 18 ± 2.0 2.0 ± 0.6 0.73 ± 0.7LSD (P=0.05) 12.7 2.11 0.23
Nodal segments cultured on different medium without growth regulators did not show any response. Values represent means ± standard error. Each treatment consisted of 20 replicates and the experiment was repeated twice. Data were recorded 12 weeks after transfer to culture medium.
Table 2. Effects of plant growth regulators on induction of multiple shoots from nodal explant of R. dalhousiae on MS medium
Plant growth regulators
Concentration(mg L-l)
Percent of explant producing
shoots
Mean number
of shoots/explant
Mean shoot
length(cm)
Control 0 0 0 02iP 1 37 ± 2.7 2.3 ± 0.7 0.6 ± 0.1
3 58 ± 3.2 6.3 ± 0.3 1.0 ± 0.15 68 ± 3.1 9.0 ± 0.6 3.4 ± 0.27 63 ± 2.9 7.7± 0.3 1.8 ± 0.19 53 ± 4.1 4.7 ± 1.2 0.8 ± 0.2
Zeatin 1 8 ± 1.2 3.0 ± 0.6 0.9 ± 0.11.5 16 ± 1.2 4.7 ± 1.2 0.9 ± 0.13 20 ± 0.9 4.0 ± 1.2 0.8 ± 0.14 16 ± 0.6 4.0 ± 1.2 0.6 ± 0.15 11 ± 1.8 3.3 ± 1.5 0.5 ± 0.6
TDZ 1 13 ± 2.4 2.0 ± 0.6 0.6 ± 0.11.5 22 ± 1.7 4.7 ± 0.58 0.7 ± 0.13 28 ± 1.2 3.7 ± 0.3 0.7 ± 0.14 15 ± 2.3 4.0 ± 0.6 0.7 ± 0.15 13 ± 2.5 3.3 ± 0.6 0.6 ± 0.1
LSD (P=0.05) 13.38 2.85 0.45Nodal segments cultured on MS medium without growth regulators did not show any response. Values represent means ± standard error. Each treatment consisted of 20 replicates and the experiment was repeated twice. Data were recorded 12 weeks after transfer to MS medium.
Table 3. Effects of cytokinin combined with IAA on shoots proliferation from nodal explant of R. dalhousiae on MS medium
Plant growth regulators(mg L-l)
Percent of explants
producing shoots
Mean number
of shoots/explant
Shoots length(cm)
Nature of shoots
2iP IAA
3 - 54.3 ± 2.2 6.3 ± 0.9 0.7 ± 0.1 Yellow, defoliated
3 1.0 55.0 ± 1.8 6.7 ± 0.7 1.2 ± 1.8Greenish yellow,
defoliated
5 - 66.0 ± 3.1 8.7 ±0.9 2.8 ± 0.48 Greenish branched
5 1.0 70.0 ± 1.2 10.7 ± 0.6 3.6 ± 0.2Green
healthy, branched
7 - 57.7 ± 1.5 8.3 ± 1.2 1.7 ± 0.3Greenish yellow,clusters
7 1.0 56.3 ± 1.2 8.3 ±3.5 2.1 ± 0.4Green
healthy,clusters
LSD (P=0.05) 11.38 3.84 0.84
Values represent means ± standard error. Each treatment consisted of 20 replicates and the experiment was repeated twice. Data were recorded 12 weeks after transfer to MS medium.
44 In vitro mass propagation of Sikkim Himalayan Rhododendron (R. dalhousiae Hook. f.) from nodal segment
Specimen Copy: Not for sale
This is the fi rst report for in vitro regeneration of R. dalhousiae where large number of plant have been successfully produced and transferred to the fi eld.
AcknowledgementsAuthors are highly grateful to Dr. L.M.S. Palni, Director, G.B. Pant Institute of Himalayan Environment and Development, Almora, for all kinds of laboratory and institutional facilities. Miss Shanty Rai and Mr. Mohan Thapa are thanked for their assistance.
ReferencesAlmeida, R., S. Gonçalves and A. Romano, 2005. In vitro micropropagation
of endangered Rhododendron ponticum L. subsp. baeticum (Boissier & Reuter) Handel-Mazzetti. Biodiversity and Conservation, 14: 1059-1069.
Alper, H.C. and I.D. Rotherham, 2006. A review of the forest vegetation of turkey: Its status past and present and its future conservation. Biology and Environment Proceeding Royal Iris Academy, 106B, 343-354.
Anderson, W.C. 1975. Propagation of rhododendrons by tissue culture. Part 1. Development of a culture medium for multiplication of shoots. Proceedings Plant Propagators Society, 25: 129-135.
Anderson, W.C. 1978. Rooting of tissue-cultured rhododendrons. Proceedings Plant Propagators Society, 28: 135-139.
Anderson, W.C. 1984. A revised tissue culture medium for shoot multiplication of rhododendron. Journal American Society Horticultural Science, 109: 343-347.
Douglas, G.C. 1984. Propagation of eight cultivars of rhododendron in vitro using agar-solidifi ed media and direct rooting of shoots in vivo. Scientia Horticulturae, 24, 337-347.
Fordham, I., D.P. Stimart and R.H. Zimmerman, 1982. Axillary and adventitious shoot proliferation of Exbury Azaleas in vitro. Horticulture Science, 17: 738-139.
Gamble, J. 1936. A Manual of Indian Timbers. Sampson Low, Marston & Co., London.
Hsia, C.N. and S.S. Korban, 1977. The infl uence of cytokinins and ionic strength of Anderson’s medium on shoot establishment and proliferation of evergreen azalea. Euphytica, 93: 11-17.
Krishna, A.P., S. Chhetri and K.K. Singh, 2002. Human dimensions of conservation in the Kangchenzonga Biosphere Reserve: The need for confl ict prevention. Mountain Research Development, 22: 328-331.
Kumar, S., L.K. Rai, K.K. Singh and U. Bajpai, 2005. Spermoderm pattern in seeds of rhododendron in Sikkim Himalaya, India-1. SEM Studies. Phytomorphology, 55: 01-08.
Kumar, S., K.K. Singh and L.K. Rai, 2004. In vitro propagation of an endangered Sikkim Himalayan Rhododendron (R. maddeni) from cotyledonary nodal segments. Journal American Rhododendrons Society, 58: 101-105.
Lloyd, G. and B. McCown, 1981. Commercially-feasible micropropagation of mountain laurel, Kalmia Latifolia, by use of shoot tips culture. Combined Proceedings International Plant Propagators Society, 30: 421-427.
Ludvig-Muller, J. 2000. Indole-3-butyric acid in plant growth and development. Plant Growth Regulators, 32: 219-230.
Mertens, M., S. Werbrouck, G. Samyn, H. Botelho dos Santos Moreira da Silva and P. Deberg, 1996. In vitro regeneration of evergreen azalea from leaves. Plant Cell, Tissue Organ Culture, 45: 231-236.
Meyer, M.M. 1982. In vitro propagation of rhododendron catawbiense from fl ower buds. Horticulture Science, 17: 891-892.
Murashige, T. and F. Skoog, 1962. A revised medium for rapid growth and bioassays with tobacco tissue cultures. Physiologia Plantarum, 15: 473-497.
Paul, A., M.L. Khan, A. Arunachalam and K. Arunachalam, 2005. Biodiversity and conservation of rhododendrons in Arunachal Pradesh in the Indo-Burma biodiversity hot spot. Current Science, 89: 623-634.
Pradhan, U.C. and S.T. Lachungpa, 1990. Sikkim-Himalayan Rhododendrons. Primulaceae Books, Kalimpong, West Bengal, India.
Rotherham, I. D. 1983. The ecology of Rhododendron ponticum L. with special reference to its competitive and invasive capabilities. Ph.D. thesis, University of Scheffi eld, UK.
Singh, K.K. 2008. In vitro plant regeneration of an endangered Sikkim Himalayan Rhododendron (R. maddeni Hook. f.) from Alginate-encapsulated shoot tips. Biotechnology, 7: 144-148.
Singh, K.K., S. Kumar and A. Pandey, 2008a. Soil treatments for improving seed germination of rare and endangered Sikkim Himalayan Rhododendrons. World Journal Agricultural Sciences, 4(2): 288-296.
Singh, K.K., S. Kumar, L.K. Rai and A.P. Krishna, 2003. Rhododendron conservation in Sikkim Himalaya. Current Science, 85: 602-606.
Singh, K.K., S. Kumar and R. Shanti, 2008. Raising planting materials of Sikkim Himalayan Rhododendron through vegetative propagation using “Air-wet technique”. JournalAmerican Rhododendron Society, 62: 136-138.
Snedecor, G.W. and W.G. Cochran, 1967. Statistical Methods. Oxford and IBH publishing Co., New Delhi. pp. 593.
Vejsadová, H. 2008. Growth regulator effect on in vitro regeneration of rhododendron cultivars. Horticultural Science (Prague), 35(2): 90-94.
Wong, S. 1981. Direct rooting of tissue-cultured rhododendrons into an artifi cial soil mix. Proceedings Plant Propagators Society, 31: 36-39.
Table 4. Effect of different auxins incorporated in MS medium on rooting of the shoots of R. dalhousiaeAuxins(mg L-l)
Rootingfrequency (%)
Mean number of roots per shoot
Mean root length (cm)
IBA0.1 24 4.0 ± 0.7 1.2 ± 0.10.2 86 5.3 ± 0.9 1.6 ± 0.20.3 58 3.3 ± 0.3 1.2 ± 0.10.5 56 2.7 ± 1.2 1.3 ± 0.1
IAA0.1 27 3.3 ± 1.5 1.2 ± 0.20.2 39 3.7 ± 1.3 1.4 ± 0.20.3 26 3.0 ± 1.5 1.1 ± 0.10.5 20 3.3 ± 1.3 1.0 ± 0.1
NAA0.1 26 3.7 ± 0.7 1.1 ± 0.10.2 45 5.0 ± 0.6 1.2 ± 0.20.3 56 4.3 ± 1.2 1.2 ± 0.10.5 28 3.3 ± 0.3 1.2 ± 0.1
LSD (P=0.01) 17 1.4 0.98Values represent means ± standard error. Each treatment consisted of 20 replicates and the experiment was repeated twice. Data were recorded 9 weeks after transfer to liquid-MS medium.
In vitro mass propagation of Sikkim Himalayan Rhododendron (R. dalhousiae Hook. f.) from nodal segment 45
Specimen Copy: Not for sale
Journal of Applied Horticulture, 12(1): 46-49, January-June, 2010
Induction of multiple shoots in Amomum hypoleucum Thwaites – A threatened wild relative of large cardamom
M. Bejoy*, M. Dan, N.P. Anish, Githa Ann George and B.J. Radhika
Plant Genetic Resource Division, Tropical Botanic Garden and Research Institute, Palode, Trivandrum 695 562, Kerala, India. *E-mail: [email protected]
AbstractAn effi cient and repeatable micropropagation protocol has been established for Amomum hypoleucum, a lesser known threatened medicinal plant of the family Zingiberaceae. Eighty percent of the rhizome nodes from greenhouse grown plants, cultured on MS medium supplemented with 1 mg L-1 BA and 0.5 mg L-1 IAA, showed axillary bud break in 8-10 days. Multiple shoots proliferated from such shoot explants when transplanted to medium with 3 mg L-1 BA and 1 mg L-1 TDZ. An average of 9.2 shoots could be recovered in two months and about 65-70% of the shoots showed simultaneous rooting. Isolated shoots were also rooted in medium fortifi ed with 0.5 mg L-1 NAA. Plantlets, transferred to the fi eld after acclimatization in greenhouse conditions, showed 85% survival.
Key words: Amomum hypoleucum, micropropagation, tissue culture, Zingiberaceae
IntroductionSeveral of the members of the family Zingiberaceae have direct influence on India’s agri-produce export trade. Cardamom (Elettaria cardamomum), ginger (Zingiber offi cinale), turmeric (Curcuma longa), large cardamom (Amomum subulatum) etc. are prominent spice members of international trade importance. These domesticated members of the spice family are well focused in research, while their wild relatives have received less attention in propagation, biology, ecology etc. A. hypoleucum is a wild relative of large cardamom. Its distribution is restricted to evergreen hilly forests of South India (Kerala and Karnataka) and Sri Lanka (Sabu, 2006).
The genus Amomum is represented by 90 species worldwide, out of which 22 are reported from India. A. hypoleucum Thwaites which occurs in small scattered populations has been included in the red list of threatened vascular plants (Rao et al., 2003). This wild ginger is a perennial herb with infl orescence having 2-3 small white fl owers borne distinctly on long creeping underground rhizomes. Flowering and fruit set are very rarely observed. Recent studies showed that fresh rhizomes and leaves contain 0.03 and 0.04% essential oils, respectively. The rhizome oil constitutes cryptone (15.4%), β-pinene (11.9%), caryophyllene oxide (15.4%) etc, whereas the leaf oil mostly contains (E)-nerolidol (26.5%), α-fenchyl acetate (15%), β- caryophyllene (8.4%) etc. The essential oils have pleasant aroma as well as anti-bacterial activity against Pseudomonas aeruginosa, Salmonella typhi and Escherichia coli (Sabulal et al., 2007).
Apart from the rare fruit setting in A. hypoleucum, most of the half-ripe fruits are eaten by rodents in their natural habitat which are the major factors for its rarity in the wild. In lieu of lack of seed set, it is necessary to establish propagation protocols for this rare plant. There are no reports on the micropropagation of A. hypoleucum and therefore, the present work was undertaken to develop and establish non-conventional propagation system for increasing the population as well as for possible exploitation of its antimicrobial properties.
Materials and methodsAmomum hypoleucum (Zingiberaceae) plants, collected from Palode Forest Ranges (Thiruvananthapuram, Kerala, India) and maintained in the Tropical Botanic Garden and Research Institute (TBGRI), Palode, Thiruvananthapuram, served as the source of explants. Herbarium specimens were also processed and kept in the TBGRI Herbarium for reference (No. TBGT - 47720). Nodal segments isolated from young rhizomes were washed thoroughly in running tap water for 10 min, followed by treatment in a mixture of 0.2% labolene (Qualigens, Mumbai) and 2% commercial bleach for 60 min and rinsed thrice in distilled water.
The explants were surface sterilised with 15% bleach for 15 min and then in 0.1% HgCl2 for 8 min. They were washed thoroughly in sterile distilled water thrice, trimmed to 1.5-2.0 cm size by keeping the node at the middle. The explants were inoculated onto MS basal medium (Murashige and Skoog, 1962) containing 3% sucrose. Plant growth regulators (PGRs) such as N6-benzyladenine (BA), thidiazuron (TDZ) and kinetin (KN) at various concentrations (0.5, 1.0 and 2.0 mg L-1) were added either singly or in combination with indole-3-acetic acid (IAA; 0.1, 0.5, 1.0 mg L-1) to the medium for evoking responses. The developed shoots (2-3 cm) were subcultured as decapitated and non-decapitated explants to test their infl uence. After standardizing the PGR regime for optimum shoot multiplication, effect of mineral salt formulations of MS, B5 (Gamborg et al., 1968), Nitsch (Nitsch, 1969) and WPM (Lloyd and McCown, 1981) were also tested. In vitro rooting of micro shoots was studied in MS medium supplemented with auxins – α-Naphthylacetic acid (NAA) and indole-3-butyric acid (IBA).
The cultures were incubated at 25±20C under 16 h light period provided by cool white fl uorescent tubes (1000 lux). All well rooted in vitro plantlets were defl asked and washed thoroughly in tap water. Plantlets free of agar were dipped in 3% commercial fungicide (Indofi l M-45) for 5 min prior to planting in clay pots containing river sand and coarse charcoal (3:1). All the plantlets
Journal
Appl

Specimen Copy: Not for sale
were maintained in semi shade (50% shade) and high humid (80-90% RH) net houses and sprinkled with water 3-4 times a day. Well established plants were potted and kept in the same net house conditions till fi eld transfer.
All the experiments were set up in completely randomized block design. Each treatment was replicated 8 times. The data were analysed by single factor analysis of variance and the means were compared using Duncan’s Multiple Range Test (DMRT) at P=0.05.
Results and discussion Culture initiation: Nodal explants from underground rhizome of A. hypoleucum were initially established with 70 percent survival. The initial response of the primary explants varied according to the PGRs present in the medium. A combination of BA (1 mg L-1) and IAA (0.5 mg L-1) favoured the best culture initiation and showed 80 percent bud break within 10 days (Fig. 1A), while only 30-60 % bud break was observed in combinations of BA (0.5 - 2 mg L-1) + IAA (0.1-1 mg L-1) and BA (0.5- 2 .0 mg L-1) used alone. KN was least effective of all the cytokinins tested. The superiority of BA over KN for multiple shoot formation was also demonstrated in Jetropha integerrima (Sujatha and Dhingra, 1993), Sapium sebiferum (Siril and Dhar, 1997), and Bombax ceiba (Chand and Singh, 1999). Though single buds were developed in PGR supplemented media, the explants failed to initiate bud break in hormone-free medium. The newly sprouted axillary buds developed into shoots with distinct nodes and
internodes. The developed shoots were subcultured on to the same medium for multiplication and the elongated shoots (2-3 cm) were used for all further experiments. Decapitated and intact shoots explants in the medium showed varied responses. The intact shoot explants though elongated, scarcely produced axillary branches, while the decapitated explants showed frequent sprouting of axillary buds and therefore were selected as potential explants. In Musa, decapitation of apical dome was found necessary for the development of new shoots (Ma and Shii, 1972; Doreswamy et al., 1983), while longitudinally split shoot halves showed better multiplication than whole explant in Curcuma haritha (Bejoy et al., 2006), Allium wallichi (Wawrosch et al., 2001) and Opuntia polyacantha (Mauseth and Halperin, 1975), whereas rhizome bud explants longitudinally divided into four equal parts showed better response in C. longa (Parthanturarug et al., 2003). The present study showed that the removal of apical meristem facilitated sprouting of axillary buds overcoming the apical dominance reminiscent of the in vivo systems.
Shoot multiplication: The growth response of shoots in terms of shoot elongation was better in BA alone supplemented media.
Table 1. Effect of plant growth regulators on morphogenetic response of shoot explants of A. hypoleucum*
BA (mg L-1)
TDZ (mg L-1)
IAA (mg L-1)
Number of of shoots**
Shoot length (mm)**
Number of roots**
0.5 1.8 ±0.4a 50.8±7.3n 20.0±2.5q1.0 2.8±0.6ab 41.1±5.5lm 18.0±3.5p2.0 4.3±0.6bcd 44.4±4.6m 23.8±3.4r3.0 3.7±0.4bcd 31.5±2.7ikj 14.4±1.4no
0.01 2.7±0.4ab 40.2±6.2l 13.0±3.9mn0.05 3.1±0.6ab 32.7±4.2jk 4.6±1.0ghi0.10 3.8±0.8bcd 31.3±4.2ijk 5.3±1.3hi0.50 3.7±0.8bcd 22.7±4.4fg 4.0±0.6fgh1.0 5.0±0.7bcd 15.8±2.3abc 0.8±0.4a2.0 5.8±0.9cd 13.9±1.5a 3.2±0.8efg3.0 6.3±0.8d 17.6±1.7cde 1.6±0.6abc4.0 4.6±0.9bcd 15.3±1.9ab 2.0±1.3bcd
2.0 0.5 4.0±0.8bcd 21.2±2.0def 4.2±1.1ghi2.0 1.0 5.2±0.7bcd 19.8±1.7def 3.6±0.6fgh2.0 2.0 6.3±0.8d 17.2±1.3bcd 3.0±0.7efg3.0 0.5 4.3±1.0bcd 18.7±2.8cde 2.0±0.9efg3.0 1.0 9.2±0.8e 18.0±1.6cde 2.8±1.0efg3.0 2.0 4.1±0.5bcd 18.3±2.6cde 1.0±0.5ab1.0 0.1 3.2±0.8abc 16.9±4.6abc 8.8±2.1j1.0 0.5 3.8±1.2bcd 32.0±3.8jk 4.3±0.8ghi1.0 1.0 5.2±0.9bcd 34.8±4.4k 15.2±2.4o2.0 0.1 3.0±0.7ab 49.0±3.9n 12.0±2.3lm2.0 0.5 3.5±0.6abc 30.2±3.0ij 9.0±3.4jk2.0 1.0 4.8±0.4bcd 21.7±2.5ef 10.6±2.1kl
1.0 0.1 3.8±0.8bcd 28.1±4.1hi 2.1±0.4cde1.0 0.5 5.1±0.5bcd 25.6±2.8gh 2.5±1.0efg1.0 1.0 6.3±0.8d 18.6±1.3cde 2.3±0.7def2.0 0.1 4.3±0.6bcd 23.0±1.9fg 4.0±0.6fgh2.0 0.5 5.2±0.7bcd 15.0±1.4ab 6.0±0.9i2.0 1.0 4.6±0.7bcd 21.3±5.0ef 1.0±0.4ab
*Basal medium: MS + 3% sucrose + 0.7% agar & pH 5.7; all data after 60 days of incubation; **Mean ± Standard error followed by different letters within a column denotes signifi cant difference at P =0.05 by Duncan’s multiple range test.
Fig. 1. In vitro propagation of A. hypoleucum from shoots of rhizome origin: 1A. Proliferating axillary bud from rhizome; 1B. Shoot development from decapitated shoot; 1C. Induction of multiple shoots with roots in BA (3mg L-1) + TDZ (1mg L-1) supplemented medium; 1D. Initial establishment of in vitro plantlets after one month; 1E. Well established plantlet showing newly formed rhizome developing into shoot.
Induction of multiple shoots in Amomum hypoleucum Thwaites – A threatened wild relative of large cardamom 47
Specimen Copy: Not for sale
Maximum elongation of in vitro shoots was achieved in 0.5 mg L-1 BA (50.8 mm). The shoots produced in medium supplemented with TDZ above 3 mg L-1 were short, stout and occasionally produced malformed leaves. Though BAP initiated multiple shoots, TDZ was found to be more effective. Thidiazuron, a substituted phenylurea (1-phenyl-3-(1,2,3-thiadiazol-5-yl)-urea) has been identifi ed for its cytokinin-like activity in various explants cultured in vitro (Mok et al., 1982; Huetteman and Preece, 1993). As per available literature, TDZ has been very rarely tested in members of Zingiberaceae, except in C. longa (Parthanturarug et al., 2003). However, cytokinins were individually effective, their combined use improved the rate of multiplication. Addition of BA along with TDZ was the most potential hormonal regime for evoking almost 50% more multiplication (Table 1). The explants developed an average 9.2 shoots when treated with 3 mg L-1 BA and 1 mg L-1 TDZ in 9 weeks. This is in line with the reports of Vincent et al. (1992) and Anish et al. (2008), where the synergistic action of two cytokinins resulted in maximum shoot production. In contrast, cytokinin supplemented with an auxin was found optimal in other species, C. amada (Prakash et al., 2004) and C. longa (Salvi et al., 2002). Application of an auxin (IAA) along with BA did not improve the rate of multiplication in A. hypoleucum.
Effect of nutrient formulations: Mineral nutrition has also a controlling infl uence over morphogenic response of explants cultured in vitro (Preece 1995; Ramage and Richard, 2002). Hence, effect of four basal media (MS, B5, Nitsch and WPM) with constant PGR regime (3 mg L-1 BA and 1 mg L-1 TDZ) was investigated (Fig. 2). There were signifi cant differences in the culture responses depending on the nutrient media used. The rate of multiplication was 9.2, 5.2, 4.6 and 2.8 in MS, Nitsch, WPM and B5 formulations, respectively revealing the superiority of MS medium in shoot multiplication for A. hypoleucum. Improved regeneration using MS has been reported in many members of Zingeberaceae such as A. microstephanum (Thoyajaksha and Rai, 2006), C. haritha (Bejoy et al., 2006), Kaempferia rotunda (Anand et al., 1997) and Z. offi cinale (Balachandran et al., 1990). Shoot elongation (25.4 mm) was better in B5 compared to 17.8 mm in MS medium although the shoots developed in B5 medium showed pale yellow and narrow leaves when compared to other media. In contrast, B5 was found to be the best nutrient formulation for shoot multiplication in C. amada (Barthakur and Bordoloi, 1992). Rhizogenesis also varied in accordance with the nutrient composition. In the present study, Nitsch medium induced maximum number of roots (17.0) when compared to WPM (7.8), MS (2.8) and B5 (2.5).
Rooting and ex vitro establishment: In A. hypoleucum, about 70 percent of the shoots rooted in multiplication media. This is in agreement with reports in other Zingiberaceae members such as C. haritha (Bejoy et al., 2006), Paracautleya bhatii (Rai and Thoyajaksha, 2001), B. pulcherrima (Anish et al., 2008) etc, where rooting was achieved during shoot multiplication. Such concurrent root formation along with shoot development, reported in many Zingiberaceae members, may be due to an inherent root inducing capability of rhizomatous tissues. Simultaneous root development from microshoots also made the multiplication system easier and cost effective as reported in Anthurium andraeanum (Bejoy et al., 2008). Since 30 percent shoots did not show simultaneous
root development, a rooting medium was also adopted. Shoots without roots were rooted with the help of rooting hormones such as NAA and IBA (Table 2). The time required for root initiation was lesser (12-14 days) in NAA supplemented medium, when compared to that with IBA. Maximum number of roots per shoot (8.3) was also observed in 0.5 mg L-1 NAA. The necessity of a separate rooting phase in Zingiberaceae has been very rarely reported (Thoyajaksha and Rai, 2006).
After 4-5 weeks of incubation in the rooting media, plantlets with good root system were defl asked and transplanted to the ex vitro condition. The young plants showed 85% survival and started producing new leaves in 6-8 weeks in community pots (Fig. 1D). They were then transferred to 8 inch clay pots containing river sand and soil mixture. The plantlets grew to 30-45 cm size in 6-7 months and developed fresh rhizome with vigorous shoot system (Fig. 1E). The regenerated plants were morphologically similar to their mother plants in vivo.
This is the fi rst report on in vitro multiplication of A. hypoleucum. The multiplication programme established for the species has considerable practical importance to establish new population for the restoration of this rare species with minimum samples, suitable for its conservation.
AcknowledgementWe thank the Director, TBGRI for facilities and Dr. P.J. Mathew for encouragement. We also gratefully acknowledge Western Ghats Cell, Planning and Economic Affairs Department, Govt. of Kerala for fi nancial support and Kerala Forest Department for permission for collection.
ReferencesAnand, P.H.M., K.N. Harikrishnan, K.P. Martin and M. Hariharan, 1997.
In vitro propagation of Kaempferia rotunda Linn. ‘Indian Crocus’ – a medicinal plant. Phytomorphology, 47: 281-286.
Anish, N.P., M. Bejoy and M. Dan, 2008. Conservation using in vitro progenies of the threatened ginger – Boesenbergia pulcherrima (Wall) O. Kuntze. Int. J. Bot., 4: 93-98.
Balachandran, S.M., S.R. Bhat and K.P.S. Chandel, 1990. In vitro clonal multiplication of turmeric (Curcuma sp.) and ginger (Zingiber offi cinale Rosc.). Plant Cell Rep., 8: 521-524.
Barthakur, M. and D.N. Bordoloi, 1992. Micropropagation of Curcuma amada (Roxb.). J. Spice Aromatic Crops, 1: 154-156.
Barthakur, M., J. Hazarika and R.S. Singh, 1999. A protocol for micropropagation of Alpinia galanga. Plant Cell Tiss. Organ Cult., 55: 231-233.
Bejoy, M., M. Dan and N.P. Anish, 2006. Factors affecting the in vitro multiplication of the endemic zingiber Curcuma haritha Mangaly and Sabu. Asian J. Plant Sci., 5: 847-853.
Table 2. Effect of auxins on in vitro rooting response in A. hypoleucum*
NAA (mg L-1)
IBA (mg L-1)
Days to root initiation
Percent response
Number of roots/shoot**
0.1 - 12-14 98 6.2±1.2ab
0.5 - 12-14 99 8.3±1.1b
- 0.1 15-18 95 5.4±0.6a
- 0.5 14-16 97 7.8±0.6ab
* Basal medium: MS+3% sucrose+0.7% agar & pH 5.7; all data after 4 weeks of incubation; **Mean ± Standard error followed by different letters within a column denotes signifi cant difference at ∞ =0.05 by Duncan’s multiple range test.
48 Induction of multiple shoots in Amomum hypoleucum Thwaites – A threatened wild relative of large cardamom

Specimen Copy: Not for sale
Bejoy, M., V.R. Sumitha and N.P. Anish, 2008. Foliar regeneration in Anthurium andraeanum Hort. cv. ‘Agnihothri’. Biotechnol., 7: 134-138.
Chand, S. and A.K. Singh, 1999. In vitro propagation of Bombax ceiba L. (Silk cotton). Silvae Genet., 48: 313-317.
Doreswamy, R., N.K.S. Rao and E.K. Chacko, 1983. Tissue culture propagation of banana. Scientia Hort., 18: 247-252.
Gamborg, O.L., R.A. Miller and K. Ojima, 1968. Nutrient requirements for suspension culture of soybean root cells. Expl. Cell Res., 50: 151-158.
George, E.F. 1996. Micropropagation in Practice. In: Plant Propagation by Tissue Culture. Part 2 In practice. 2nd edition. Exegetics Ltd. England: 834-1222.
Huetteman, C.A. and J.E. Preece, 1993. Thidiazuron – A potent cytokinin for woody plant tissue culture. Plant Cell Tiss. Organ Cult., 33: 105-119.
Lloyd, G. and B. McCown, 1981. Commercially feasible micropropagation of mountain laurel, Kalmia latifolia, by use of shoot tip culture. Comb. Proc. Int. Plant Propagators Soc., 30: 421-427.
Ma, S.S. and C.R. Shii, 1972. In vitro formation of adventitious buds in banana shoot apex following decapitation. J. Hort. Sci., 18: 135-147.
Mauseth, J.D. and W. Halperin, 1975. Hormonal control of organogenesis in Opuntia polyacantha (Cactaceae). Am. J. Bot., 62: 869-877.
Mok, M.C., D.W.S. Mok, D.J. Armstrong, K. Shudo, Y. Isogai and T. Okamoto, 1982. Cytokinins activity of N-phenyl-N’-1,2,3-thiadiazol-5-ylurea (Thidiazuron). Phytochemistry, 21: 1509-1511.
Murashige, T. and F. Skoog, 1962. A revised medium for rapid growth and bioassays with tobacco tissue cultures. Physiol. Plant., 15: 473-497.
Nitsch, J.P. 1969. Experimental androgenesis in Nicotiana. Phytomorphology, 19: 389-404.
Prakash, S., R. Elongomathavan, S. Seshadri, K. Kathiravan and S. Ignacimuthu, 2004. Effi cient regeneration of Curcuma amada Roxb. plantlets from rhizome and leaf sheath explants. Plant Cell Tiss. Organ Cult., 78: 159-165.
Prathanturarug, S., N. Soonthornchareonnon, W. Chuakul, Y. Phaidee and P. Saralamp, 2003. High-frequency shoot multiplication in Curcuma longa L. using thidiazuron. Plant Cell Rep., 11: 1054-1059.
Prathanturarug, S., N. Soonthornchareonnon, W. Chuakul, Y. Phaidee and P. Saralamp, 2005. Rapid micropropagation of Curcuma longa using bud explants pre-cultured on thidiazuron supplemented liquid medium. Plant Cell Tiss. Org. Cult., 80: 347-351.
Preece, J.E. 1995. Can nutrient salts partially substitute for plant growth regulators? Plant Tissue Cult. Biotechnol, 1: 26-37.
Rai, R.V. and Thoyajaksha, 2001. Micropropagation of Paracautleya bhatii Smith – A rare and endemic plant. Phytomorphology, 51: 87-89.
Ramage, C.M. and W.R. Richard, 2002. Mineral nutrition and plant morphogenesis. In vitro Cell. Dev. Biol., 38: 116-124.
Rao, C.K., B.L. Geetha and G. Suresh, 2003. List of Threatened Vascular Plants in India – Complied from the 1997 IUCN Red List of Threatened Plants. BSI, Ministry of Environment and Forests, ENVIS, Howrah, p. 130-131.
Roy, A. and A. Pal, 1991. Propagation of Costus speciosus (Koen.) Sm. through in vitro rhizome production. Plant Cell Rep., 10: 525-528.
Sabu, M. 2006. Zingiberaceae and Costaceae of South India. Indian Association of Angiosperm Taxonomy, Calicut, India, p. 85.
Sabulal, B., R. Kurup, V. George, M. Dan and N.S. Pradeep, 2007. Chemical composition and antibacterial activity of the rhizome and leaf oils of Amomum hypoleucum Thwaites. J. Essential Oil Res., 19: 279-281.
Sajina, A., P.M. Mini, C.Z. John, K.N. Babu, P.N. Ravindran and K.V. Peter, 1997. Micropropagation of large cardamom (Amomum subulatum Roxb.). J. Spice and Aromatic Crops, 6: 145-148.
Salvi, N.D., L. George and S. Eapen, 2002. Micropropagation and fi eld evaluation of micropropagated plants of turmeric. Plant Cell Tiss. Organ Cult., 68: 143-151.
Siril, E.A. and U. Dhar, 1997. Micropropagation of mature Chinese tallow tree (Sapium sebiferum Roxb.). Plant Cell Rep., 16: 637-640.
Sujatha, M. and M. Dhingra, 1993. Rapid plant regeneration from various explants of Jetropha integerrima. Plant Cell Tiss. Organ Cult., 35: 293-296.
Thoyajaksha and R.V. Rai, 2006. In vitro multiplication of Amomum microstephanum Baker – An endangered species. Phytomorphology, 56: 23-28.
Vincent, K.A., K.M. Mathew and M. Hariharan, 1992. Micropropagation of Kaempferia galanga L. – A medicinal plant. Plant Cell Tissue Organ Cult., 28: 229-230.
Wawrosch, C., P.R. Malla and B. Kopp, 2001. Micropropagation of Allium wallichi Kunth, A threatened medicinal plant of Nepal. In vitro Cell. Dev. Biol. – Plant, 37: 555-557.
Induction of multiple shoots in Amomum hypoleucum Thwaites – A threatened wild relative of large cardamom 49
Specimen Copy: Not for sale
Journal of Applied Horticulture, 12(1): 50-53, January-June, 2010
Effect of nitrogen concentration and growth regulators on growth and nitrate content of lettuce
Damianos Neocleous
Agricultural Research Institute, Ministry of Agriculture, Natural Resources and Environment, P.O.Box 22016, 1516 Nicosia, Cyprus. E-mail: [email protected]
AbstractLettuce plants (Lactuca sativa L. cv. ‘Paris Island’) were grown in an unheated plastic greenhouse to determine the effects of solution nitrogen concentration and growth regulators (gibberellin and kinetin) on growth (fresh and dry head weight) and tissue nitrate content (TNC). The plants were grown in plastic containers with perlite and supplied with a basic nutrient solution supplemented with nitrogen (N) corresponding to 50, 100, 150, and 200 ppm NO3-N. Growth regulators; gibberellin (GA3) and kinetin were applied at different doses independently and in combination. Fresh, dry weight and TNC were responsive to N application level. However, fresh and dry weights were similar at 150 and 200 ppm and TNC at 100 and 150 ppm nitrogen supply. Gibberellin (GA3) and gibberellin and kinetin in combination (GA3+kinetin) enhanced fresh and dry weight and TNC compared to the control. There were few differences in response to application rates. Therefore, where lettuce plants are grown in similar conditions and low NO3 accumulation is desirable, together with high yield and good size, the best N application level is 150 ppm NO3-N and growth regulators application may enhance yield. However their use in reducing the nitrate content is not recommended.
Key words: Lactuca sativa, nitrogen, gibberellin, kinetin, growth, TNC
IntroductionThe presence of nitrates in vegetables (Peck et al., 1971), as in water and generally in other food products is a serious threat to man health (WHO, 1985). Not so much due to its toxicity, which is low, but for giving rise to the dangerous compounds in the organism (e.g. methaemoglobin, nitrosamines) (Van Der Boon et al., 1986, 1990; Boink and Speijers, 2001).Vegetables constitute the major source of nitrate providing 72-74% of the average daily human dietary intakes (Santamaria, 1997). Generally leafy vegetables tend to accumulate nitrates and the European Commission has issued the Commission Regulation (EC) No. 563/2002 setting maximum acceptable nitrate concentration in lettuce and spinach. For winter grown lettuce the value is 4500 mg kg-1 fresh weight and for summer-grown lettuce 2500 mg kg-1 fresh weight.
To fi nd ways to reduce nitrate accumulation in lettuce, many experiments were conducted by controlling some factors like the nitrogen form and concentration, light intensity, CO2 concentration, genetic variation and cultivation techniques. (Blom-Zandstra and Lampe, 1985; Reinink and Groenwold, 1987; Reinink et al., 1987; Kaiser and Brendle-Behnisch, 1991; Economakis, 1992; Jaervau, 1994, Pasda et al., 2001; Premuzic et al., 2002, 2003).
There are reports focusing on nitrate content in lettuce and other leafy vegetables known as nitrate accumulators by growth regulators (Rozek et al., 1989; Rozek and Wojciechowska, 1990; Myczkowski et al., 1990, 1991; Sady et al., 1995). Encouraged by these observations, EU recommendations to lower nitrate content of vegetables and the growing interest in soilless culture, our research was focused on the infl uence of solution nitrogen concentration and two plant growth regulators (gibberellin and
kinetin) on growth and tissue nitrate content (TNC) in lettuce grown in soilless culture under eastern Mediterranean climatic conditions (Cyprus).
Materials and methodsPlant material and culture: The experiment was conducted at the Agricultural Research Institute of Cyprus (32°24´ E, 35°09´ N) in a plastic greenhouse under natural daylight conditions and temperature. Lettuce seedlings at four true leaves stage (cv. ‘Paris Island’, a romaine type) were transplanted into plastic containers filled with 2 kg of horticultural perlite. The N treatments corresponded to nutrient solutions nitrogen concentration of 50, 100, 150, and 200 ppm NO3-N and electrical conductivity values 1.5, 2.0, 2.6 and 2.8 mS cm-1. It does appear that although lettuce plants can be grown over a wide range of solution conductivities, EC levels within 2.0-3.0 mS cm-1 give more satisfactory results (Economakis, 1991). The pH of the nutrient solutions was adjusted around 6.5 (Bres, 1992). Treatments were arranged in a randomized complete block design. Each nitrogen treatment corresponded to a block with 32 plants and replicated three times. Each block consisted of four rows with four plastic containers in each row and two plants per container. Within every block the growth regulators (GA3, kinetin, GA3+kinetin) were applied.
In-line drip irrigation, providing 2 L h-1, was placed at the top of the containers. Small holes were cut on the bottom of the plastic containers to allow excess nutrient solution to fl ow out and the plastic containers were laid on a catchment plate to gather the excess nutrient solution. The nutrient solution applied and the number of trickling turns per day was adjusted depending on the amount of over drained solution. The plants were fertigated with a basic nutrient solution (Table 1) supplemented with the nitrogen concentration corresponding to the treatment.
Journal
Appl
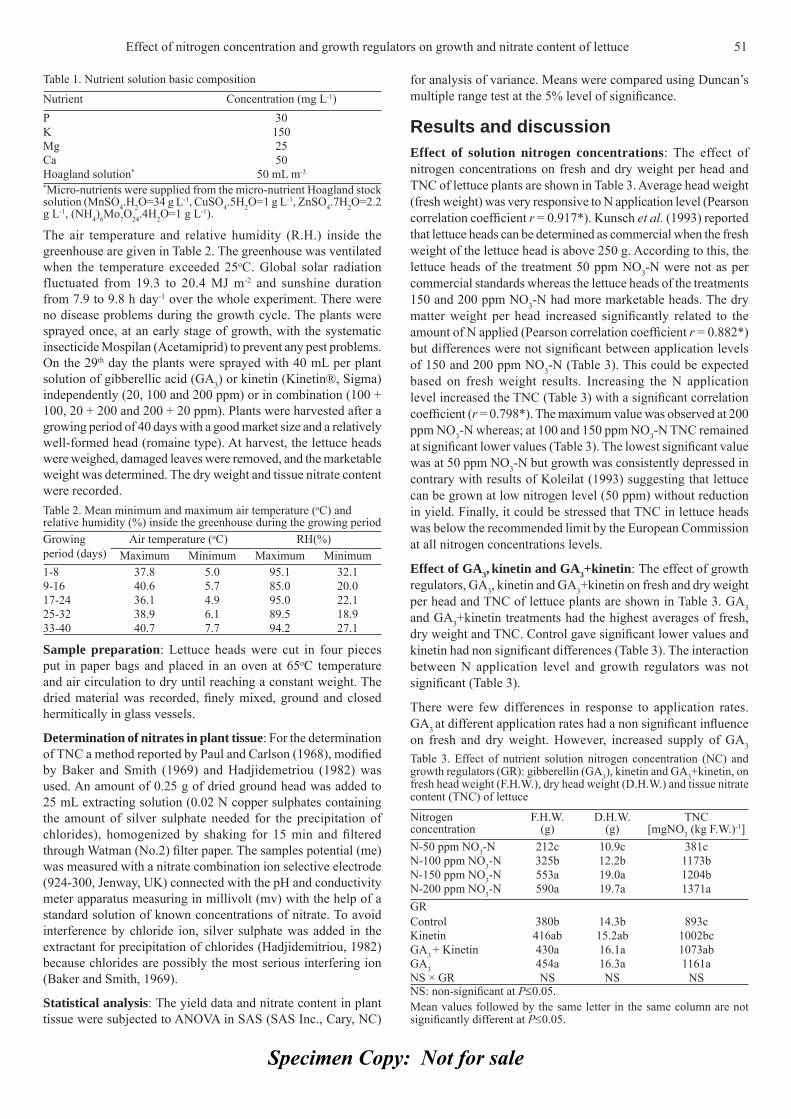
Specimen Copy: Not for sale
The air temperature and relative humidity (R.H.) inside the greenhouse are given in Table 2. The greenhouse was ventilated when the temperature exceeded 25oC. Global solar radiation fluctuated from 19.3 to 20.4 MJ m-2 and sunshine duration from 7.9 to 9.8 h day-1 over the whole experiment. There were no disease problems during the growth cycle. The plants were sprayed once, at an early stage of growth, with the systematic insecticide Mospilan (Acetamiprid) to prevent any pest problems. On the 29th day the plants were sprayed with 40 mL per plant solution of gibberellic acid (GA3) or kinetin (Kinetin®, Sigma) independently (20, 100 and 200 ppm) or in combination (100 + 100, 20 + 200 and 200 + 20 ppm). Plants were harvested after a growing period of 40 days with a good market size and a relatively well-formed head (romaine type). At harvest, the lettuce heads were weighed, damaged leaves were removed, and the marketable weight was determined. The dry weight and tissue nitrate content were recorded.
for analysis of variance. Means were compared using Duncan’s multiple range test at the 5% level of signifi cance.
Results and discussionEffect of solution nitrogen concentrations: The effect of nitrogen concentrations on fresh and dry weight per head and TNC of lettuce plants are shown in Table 3. Average head weight (fresh weight) was very responsive to N application level (Pearson correlation coeffi cient r = 0.917*). Kunsch et al. (1993) reported that lettuce heads can be determined as commercial when the fresh weight of the lettuce head is above 250 g. According to this, the lettuce heads of the treatment 50 ppm NO3-N were not as per commercial standards whereas the lettuce heads of the treatments 150 and 200 ppm NO3-N had more marketable heads. The dry matter weight per head increased signifi cantly related to the amount of N applied (Pearson correlation coeffi cient r = 0.882*) but differences were not signifi cant between application levels of 150 and 200 ppm NO3-N (Table 3). This could be expected based on fresh weight results. Increasing the N application level increased the TNC (Table 3) with a signifi cant correlation coeffi cient (r = 0.798*). The maximum value was observed at 200 ppm NO3-N whereas; at 100 and 150 ppm NO3-N TNC remained at signifi cant lower values (Table 3). The lowest signifi cant value was at 50 ppm NO3-N but growth was consistently depressed in contrary with results of Koleilat (1993) suggesting that lettuce can be grown at low nitrogen level (50 ppm) without reduction in yield. Finally, it could be stressed that TNC in lettuce heads was below the recommended limit by the European Commission at all nitrogen concentrations levels.
Effect of GA3, kinetin and GA3+kinetin: The effect of growth regulators, GA3, kinetin and GA3+kinetin on fresh and dry weight per head and TNC of lettuce plants are shown in Table 3. GA3 and GA3+kinetin treatments had the highest averages of fresh, dry weight and TNC. Control gave signifi cant lower values and kinetin had non signifi cant differences (Table 3). The interaction between N application level and growth regulators was not signifi cant (Table 3).
There were few differences in response to application rates. GA3 at different application rates had a non signifi cant infl uence on fresh and dry weight. However, increased supply of GA3
Table 1. Nutrient solution basic composition
Nutrient Concentration (mg L-1)P 30K 150Mg 25Ca 50Hoagland solution* 50 mL m-3
*Micro-nutrients were supplied from the micro-nutrient Hoagland stock solution (MnSO4.H2O=34 g L-1, CuSO4.5H2O=1 g L-1, ZnSO4.7H2O=2.2 g L-1, (NH4)6Mo7O24.4H2O=1 g L-1).
Table 2. Mean minimum and maximum air temperature (oC) and relative humidity (%) inside the greenhouse during the growing periodGrowing period (days)
Air temperature (oC) RH(%)Maximum Minimum Maximum Minimum
1-8 37.8 5.0 95.1 32.19-16 40.6 5.7 85.0 20.017-24 36.1 4.9 95.0 22.125-32 38.9 6.1 89.5 18.933-40 40.7 7.7 94.2 27.1
Table 3. Effect of nutrient solution nitrogen concentration (NC) and growth regulators (GR): gibberellin (GA3), kinetin and GA3+kinetin, on fresh head weight (F.H.W.), dry head weight (D.H.W.) and tissue nitrate content (TNC) of lettuce
Nitrogen concentration
F.H.W. (g)
D.H.W. (g)
TNC [mgNO3 (kg F.W.)-1]
N-50 ppm NO3-N 212c 10.9c 381cN-100 ppm NO3-N 325b 12.2b 1173bN-150 ppm NO3-N 553a 19.0a 1204bN-200 ppm NO3-N 590a 19.7a 1371aGRControl 380b 14.3b 893cKinetin 416ab 15.2ab 1002bcGA3 + Kinetin 430a 16.1a 1073abGA3 454a 16.3a 1161aNS × GR NS NS NSNS: non-signifi cant at P≤0.05.Mean values followed by the same letter in the same column are not signifi cantly different at P≤0.05.
Sample preparation: Lettuce heads were cut in four pieces put in paper bags and placed in an oven at 65oC temperature and air circulation to dry until reaching a constant weight. The dried material was recorded, fi nely mixed, ground and closed hermitically in glass vessels.
Determination of nitrates in plant tissue: For the determination of TNC a method reported by Paul and Carlson (1968), modifi ed by Baker and Smith (1969) and Hadjidemetriou (1982) was used. An amount of 0.25 g of dried ground head was added to 25 mL extracting solution (0.02 N copper sulphates containing the amount of silver sulphate needed for the precipitation of chlorides), homogenized by shaking for 15 min and fi ltered through Watman (No.2) fi lter paper. The samples potential (me) was measured with a nitrate combination ion selective electrode (924-300, Jenway, UK) connected with the pH and conductivity meter apparatus measuring in millivolt (mv) with the help of a standard solution of known concentrations of nitrate. To avoid interference by chloride ion, silver sulphate was added in the extractant for precipitation of chlorides (Hadjidemitriou, 1982) because chlorides are possibly the most serious interfering ion (Baker and Smith, 1969).
Statistical analysis: The yield data and nitrate content in plant tissue were subjected to ANOVA in SAS (SAS Inc., Cary, NC)
Effect of nitrogen concentration and growth regulators on growth and nitrate content of lettuce 51

Specimen Copy: Not for sale
enhanced the accumulation of nitrates (Table 4). The TNC was highest at 200 ppm and lowest at 20 ppm GA3 application. The GA3 at 100 ppm gave non signifi cant differences. The effects of kinetin application rates on fresh and dry weight and TNC of lettuce plants were not signifi cant as shown in Table 4. Similarly, the effects of GA3+kinetin at different application rates on fresh and dry weight were not signifi cant. However, the exposure of plants at application rate of 100+100 ppm resulted in signifi cantly higher TNC (Table 4).
Gibberellin and GA3+kinetin enhanced fresh and dry weight per head and similar results were reported by Rozek et al. (1989) and Neocleous et al. (2007), who found that growth regulators GA3, kinetin and GA3+kinetin combination stimulated fresh weight growth in lettuce heads, being the most intensive in plants sprayed with the combination of the two regulators. In addition, GA3 and GA3+kinetin enhanced TNC. These results are in agreement with those found by Neocleous et al. (2007) but in confl ict with those found by Rozek and Wojciechowska (1990), Myczkowski et al. (1990) and Sady et al. (1995) who reported that lettuce plants sprayed with GA3 and kinetin had the greatest reduction in nitrate content. Attributed to different weather conditions (light intensity, sunshine duration and temperature) and reports from the literature (Roorda-Van-Eysinger, 1984; Blom-Zandstra and Lampe, 1985; Kaiser and Forster, 1989; Van der Boon et al., 1990; Talon et al., 1991; Lacertosa et al., 1997; Neocleous et al., 2007) showing that there is an interaction between the amount of light or time of the year in which crop is grown and the nitrate content, it can be argued that under east Mediterranean (Cyprus) climatic conditions, where light intensity and temperature are high even in winters, the role of growth regulators in lowering the tissue nitrate content might be less important. Similarly, Behr and Wiebe (1992) reported a close negative correlation between photosynthesis and nitrate content in lettuce cultivars and this explaination may be suitable in present study also. Tissue nitrate content was between 381 and 1371 mg NO3 (kg fresh weight)-1 all over the experiment which is lower than European standards and comparable with biologically produced lettuce (Leuzzi et al., 1997).
In conclusion, in lettuce plants low NO3 accumulation is desirable together with high fresh and dry head weight for which the best N-application level is 150 ppm NO3-N. Also the use of growth regulators, GA3 and GA3+kinetin, may enhance yield. However, their use for reducing the nitrate content is not recommended.
ReferencesBaker, A.S. and R. Smith, 1969. Extracting solution for potentiometer
determination of nitrate in plant tissue. J. Agric. Food Chem., 17: 1284.
Behr, U. and H.J. Wiebe, 1992. Relationship between photosynthesis and nitrate content of lettuce cultivars. Sci. Hort., 49: 175-179.
Blom-Zandstra, M. and J.E.M. Lampe, 1985. The role of nitrate in the osmoregulation of lettuce (Lactuca sativa L.) grown at different light intensities. J. Exp. Bot., 36: 1043-1052.
Boink, A. and G. Speijers, 2001. Health effects of nitrates and nitrites, a review. Acta Hort., 563: 29-36.
Bres, W. 1992. Nutrient accumulation and tip burn in NFT-grown lettuce at several potassium and pH levels. HortScience, 27: 790-792.
Economakis, C.D. 1991. Effect of solution conductivity on growth and yield of lettuce in nutrient fi lm culture. Acta Hort., 287: 309-316.
Economakis, C.D. 1992. Effect of climatic conditions and time of harvest on growth and tissue nitrate content of lettuce in Nutrient Film Technique. Acta Hort., 323: 75-80.
Hadjidemetriou, D.G. 1982. Comparative study of determination of nitrates in calcareous soils by the ion selective electrode, chromotropic acid and phenoldisulphonic acid methods. The Analyst, 107: 25-29.
Jaervau, M. 1994. The dependence of nitrate content of vegetables on biological peculiarities and growth conditions. J. Agric. Sci., 5: 149-169.
Kaiser, W.M. and J. Forster, 1989. Low CO2 presents nitrate reduction in leaves. Plant Physiol., 91: 970-974.
Kaiser, W.M. and E. Brendle-Behnisch, 1991. Rapid modulation of spinach leaf nitrate reductase activity by photosynthesis. I. Modulation in vivo by CO2 availability. Plant Physiol., 96: 363-367.
Koleilat, R. 1993. The effects of different solution nitrogen concentrations on growth and tissue nitrate content of lettuce plants (Lactuca sativa L.) grown in solution culture (NFT). M.Sc. thesis. Mediterranean Agronomic Institute of Chania, Greece.
Kunsch, U., H. Scharer, J. Hurter and P. Konrad, 1993. Moglichkeiten zur Reduktion des Nitratgehalts in Kopfasalat durch erdelosen Anbau. Kongreβband, 37: 453-456.
Lacertosa, G., G. Capotorti, D. Palazzo and F. Montemurro, 1997. Effects of enviromental parameters and nitrogen fertilization on nitrate content of lettuce (Lactuca sativa L.) (Basilicata). Rivista -di-Agronomia, 31: 72-77.
Leuzzi, U., G. Cimino and G. Dugo, 1997. Application of ionic chromatography to the determination of the anionic composition in vegetables (lettuce, spinach) produced with biological method. Rivista-di-Scienza-dell’Alimentazione, 25: 349-355.
Myczkowsci, J., S. Rozek and W. Sady, 1991. The effects of fertilization with different forms of nitrogen on yield and nitrate metabolism in leaves of greenhouse lettuce. II. The effect of growth regulators. Folia Hort., 3: 13-25.
Myczkowsci, J., S. Rozek, W. Sady and T. Wojtaszek, 1990. The effect of some factors on the content of nitrates and nitrite in lettuce leaves grown with the nutrient fi lm technique. II. Effect of light and growth regulators in conditions of NPK fertilization discontinued before harvesting. Folia Hort., 2: 7-16.
Neocleous, D., I. Papadopoulos and C. Olympios, 2007. The effects of growth regulators on growth and tissue nitrate content of lettuce plants (Lactuca sativa) grown in Cyprus. Technical Bulletin 230, Agricultural Research Institute, Nicosia.
Table 4. Effect of growth regulators (GR): gibberellin (GA3), kinetin and GA3 + kinetin combination at different application rates on fresh head weight (F.H.W.), dry head weight (D.H.W.) and tissue nitrate content (TNC) of lettuceGR (ppm)
F.H.W. (g)
D.H.W. (g)
TNC [mgNO3 (kg F.W.)-1]
GA320 417 15.3 1095b100 478 17.3 1141ab200 466 16.3 1248aSignifi cance NS NS *Kinetin20 418 15.3 978100 428 15.3 983200 403 15.0 1044Signifi cance NS NS NSGA3 + kinetin100 + 100 409 15.5 1317a20 + 200 415 15.5 906b200 + 20 466 16.2 996bSignifi cance NS NS *NS, non-signifi cant, * signifi cant at P≤0.05.Means within columns for a given treatment followed by the same letter are not signifi cantly different at P≤0.05.
52 Effect of nitrogen concentration and growth regulators on growth and nitrate content of lettuce
Specimen Copy: Not for sale
Pasda, G., R. Hahndel and W. Zerulla, 2001. Effect of fertilizers with the new nitrifi cation inhibitor DMPP (3,4-dimethylpyrazolephosphate) on yield and quality of agricultural and horticultural crops. Biol. Fertil. Soils, 34: 85-97.
Paul, J.L. and R.M. Carlson, 1968. Nitrate determination in plant extracts by the nitrate electrode. J. Agric. Food Chem., 16: 766.
Peck, N.H., A.V. Barker, G.E. MacDonald and R.S. Shallenberger, 1971. Nitrate accumulation in vegetables. Agron. J., 63: 130-132
Premuzic, Z., A. Garate and I. Bonilla, 2002. Production of lettuce under different fertilisation tratments, yield and quality. Acta Hort., 571: 65-72.
Premuzic, Z., F. Vilella, A. Garate and I. Bonilla, 2003. Production and quality of winter fi eld and greenhouse grown lettuce (Lactuca sativa). Acta Hort., 607: 149-155.
Reinink, K., R. Groenwold and A. Bootsma, 1987. Genotypic differences in nitrate content in Lactuca sativa L. and related species and correlation with dry matter content. Euphytica, 36: 11-18.
Reinink, K. and R. Groenwold, 1987. The inheritance of nitrate content in lettuce (Lactuca sativa L.). Euphytica, 36: 733-744.
Roorda-Van-Eysinger, J.P.N.L.1984. Nitrate and glasshouse vegetables. Fert. Res., 5: 149-156.
Rozek, S., J. Myczkowsci, W. Sady and T. Wojtaszek, 1989. The effect of some factors on the content of nitrate and nitrite in lettuce leaves grown with the nutrient fi lm technique. I. The effect of light and growth regulators. Folia Hort., 1: 31-34.
Rozek, S. and R. Wojciechowska, 1990. Effect of light and growth regulators on the circadian rhythmicity of nitrate reductase and nitrite reductase activities in greenhouse lettuce leaves. Folia Hort., 2: 53-64.
Sady, W., S. Rozek and J. Myczkowsci, 1995. Effects of different forms of nitrogen on the quality of lettuce yield. Acta Hort., 401: 409-418.
Santamaria, P. 1997. Occurrence of nitrates in vegetables and total dietary intakes (nitrate-nitrite-nitrosamine). Industrie-Alimentari, 36: 1324-1334.
Talon, M., J.A.D. Zeerant and D.A. Gage, 1991. Identifi cation of gibberellins in spinach and effects of light and darkness on their levels. Plant Physiol., 97: 1521-1526.
Van der Boon, J., J.W. Steenhuizen, H. Lampers, J.J. Neeteson and I. Stulen, 1986. Reduction of the nitrate concentration of lettuce grown in recirculating nutrient solution. Fundamental-ecological and agricultural aspects of nitrogen metabolism in higher plants. J. Hort. Sci., 61: 485-489.
Van der Boon, J., J.W. Steenhuizen and E.g. Steingrover, 1990. Growth and nitrate concentration of lettuce as affected by total nitrogen and chloride concentration, NH4/NO3 ratio and temperature of the recirculating nutrient solution. J. Hort. Sci., 65: 309-321.
WHO, 1985. Health hazards from nitrates in drinking water. Report on a WHO Meeting, Copenhagen 5-9 March, 1984.
Effect of nitrogen concentration and growth regulators on growth and nitrate content of lettuce 53
Specimen Copy: Not for sale
Journal of Applied Horticulture, 12(1): 54-58, January-June, 2010
Fruit ripening of Solo Sunrise, Tainung #2 and Red Lady papaya at two temperatures
S. Protain, M. Mohammed* and L.A. Wilson
The University of the West Indies, Department of Food Production, Faculty of Science and Agriculture, St. Augustine, Trinidad, West Indies. *E-mail: [email protected]
AbstractThe process of ripening was evaluated in three papaya cultivars, Solo Sunrise (SS), Tainung #2 (T2) and Red Lady (RL) with different mean fruit weights of 387, 1364 and 2266 g and fruit cavity void volumes of 56, 334 and 502 mL and fruit weight/cavity void volume ratios of 6.9, 3.8 and 4.3 g mL-1, respectively. The evaluation was done by comparing physiological determinants of the ripening process; ethylene (C2H4) generation and respiratory CO2 production, measured at two temperature ranges, 20-22oC and 28-30oC, by sampling cavity void volumes, with physico-chemical quality characteristics of ripening: skin colour, fl esh fi rmness and pH. Fruit ripening of the three cultivars was delayed at the lower temperature range as measured both by physiological determinants including pre-and peak climacteric rates and physico-chemical quality characteristics. However, cv RL showed slower ripening than cvs SS and T2 at both temperature ranges, probably partly related to its low fruit weight/cavity void volume of 4.3 g mL-1. Moreover, there were negative temporal displacements for skin degreening compared with those for fl esh softening, respiration and ethylene generation in fruit of the three cultivars. Fruits of cvs SS and T2 were fully ripened in 8 days after harvest (DAH) and RL fruits in 10 DAH at the lower temperature range. Values for C2H4 generation and CO2 production measured in the fruit cavity are judged to be sensitive indicators of the progress in the process of ripening.
Key words: Papaya, ripening, climacteric, ethylene, colour, fi rmness
IntroductionPapaya (Carica papaya L.; Caricaceae) is a native of Tropical America but is cultivated throughout the tropics, where there are several cultivars retained by inbreeding in their countries of selection. These include Solo in Hawaii, Betty in Florida, Hortus Gold in South Africa and Improved Petersen in Australia (Simpson, 1980). Moreover, although Solo originated in Barbados in the Caribbean, several improved lines were developed in Hawaii e.g. cvs Solo 5, Solo 8, Bush and Sunrise, where papaya is cultivated on a commercial scale for export to the United States and Canada.
The papaya fruit is a fl eshy, hollow berry of 0.5 to 3.0 kg in weight. At the lower end of the weight range, the Solo cultivars are hermaphrodites with yellow fl esh fruit except for the preferred cvs Bush and Sunrise, with red fl esh fruits. Alternatively, cv Hortus Gold is dioecious with fi rm golden fl esh fruits and weights of 1.5 -2.0 kg (Salunkhe and Desai, 1984). Most of the postharvest research on papaya including changes in physiology, composition and sensory characteristics with ripening has been done on fruits of cv Solo in Hawaii (Wills and Widjanarko, 1995). However, the wide range of respiratory rates in papaya fruit 3-32 mL CO2 kg-1 hr -1 was noted by Biale and Barcus (1970) and recommended storage conditions of temperature and relative humidity reviewed by Thompson (1996).
Solo fruit are exported on a large scale from Hawaii, Malaysia and to a lesser extent from Jamaica in the Caribbean to the U.K., U.S. and Canada. Internationally, they are most popular because of their small size, red fl esh colour and other quality attributes, suitable for use as a fresh fruit. However, because of their susceptibility
to Bunchy Top, a microplasmic disease transmitted by a leaf hopper, several hybrids have been produced worldwide. Two of these hermaphroditic hybrids, cvs T2 and RL are cultivated in the Caribbean. They vary considerably in size and eating quality from cv SS but are sold locally and exported to regional and international markets (Zhang and Paull, 1990). Unfortunately, little work has been published on the ripening of cvs.T2 and RL. Accordingly, the objective of this study was to conduct a comparative evaluation of the effect of storage temperature on ripening as indicated by parameters of ethylene generation and carbon dioxide production as well as by quality changes of skin colour, fl esh fi rmness and pH in order to detect characteristics of the process of ripening of fruits of the three cultivars, which may be useful in further studies. Gases were measured in the fruit cavity rather than in the void volume of containers in which the fruits were stored to ripen, because preliminary investigations revealed earlier detection of C2H4 and CO2 in the former system by the gas chromatograph used in the investigations.
Materials and methods Mature papaya fruit of cvs. Solo Sunrise, Tainung #2 and Red Lady at the stage of colour break with yellow streaks comprising 6 - 8% of the fruit surface were harvested at the University Field Station and packed in cardboard boxes lined with shredded paper. Fruits were transported to the Food Biology Laboratory, Department of Food Production, at the University of the West Indies, St. Augustine within one hour of harvest. At the laboratory, the fruits were hand washed to remove surface debris. Forty fruits from each cultivar were treated for 20 minutes with hot water at 40°C in separate 150 L metal drums each equipped with
Journal
Appl
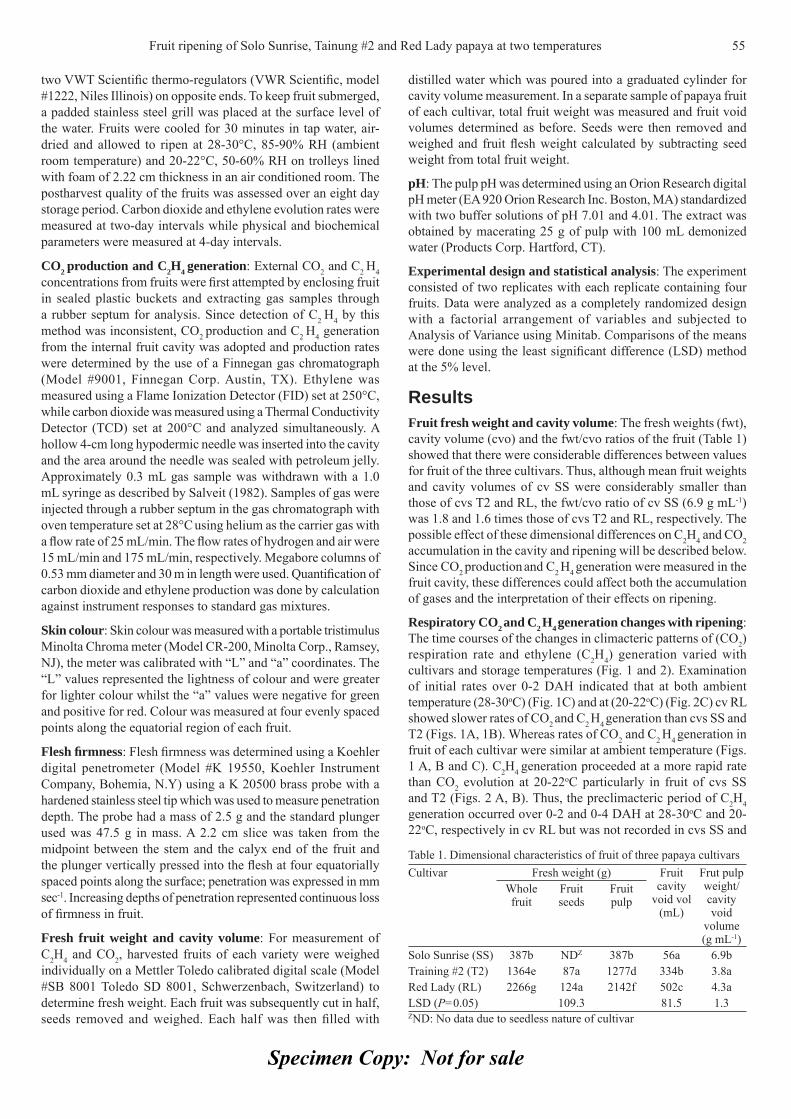
Specimen Copy: Not for sale
two VWT Scientifi c thermo-regulators (VWR Scientifi c, model #1222, Niles Illinois) on opposite ends. To keep fruit submerged, a padded stainless steel grill was placed at the surface level of the water. Fruits were cooled for 30 minutes in tap water, air-dried and allowed to ripen at 28-30°C, 85-90% RH (ambient room temperature) and 20-22°C, 50-60% RH on trolleys lined with foam of 2.22 cm thickness in an air conditioned room. The postharvest quality of the fruits was assessed over an eight day storage period. Carbon dioxide and ethylene evolution rates were measured at two-day intervals while physical and biochemical parameters were measured at 4-day intervals.
CO2 production and C2H4 generation: External CO2 and C2 H4 concentrations from fruits were fi rst attempted by enclosing fruit in sealed plastic buckets and extracting gas samples through a rubber septum for analysis. Since detection of C2 H4 by this method was inconsistent, CO2 production and C2 H4 generation from the internal fruit cavity was adopted and production rates were determined by the use of a Finnegan gas chromatograph (Model #9001, Finnegan Corp. Austin, TX). Ethylene was measured using a Flame Ionization Detector (FID) set at 250°C, while carbon dioxide was measured using a Thermal Conductivity Detector (TCD) set at 200°C and analyzed simultaneously. A hollow 4-cm long hypodermic needle was inserted into the cavity and the area around the needle was sealed with petroleum jelly. Approximately 0.3 mL gas sample was withdrawn with a 1.0 mL syringe as described by Salveit (1982). Samples of gas were injected through a rubber septum in the gas chromatograph with oven temperature set at 28°C using helium as the carrier gas with a fl ow rate of 25 mL/min. The fl ow rates of hydrogen and air were 15 mL/min and 175 mL/min, respectively. Megabore columns of 0.53 mm diameter and 30 m in length were used. Quantifi cation of carbon dioxide and ethylene production was done by calculation against instrument responses to standard gas mixtures.
Skin colour: Skin colour was measured with a portable tristimulus Minolta Chroma meter (Model CR-200, Minolta Corp., Ramsey, NJ), the meter was calibrated with “L” and “a” coordinates. The “L” values represented the lightness of colour and were greater for lighter colour whilst the “a” values were negative for green and positive for red. Colour was measured at four evenly spaced points along the equatorial region of each fruit.
Flesh fi rmness: Flesh fi rmness was determined using a Koehler digital penetrometer (Model #K 19550, Koehler Instrument Company, Bohemia, N.Y) using a K 20500 brass probe with a hardened stainless steel tip which was used to measure penetration depth. The probe had a mass of 2.5 g and the standard plunger used was 47.5 g in mass. A 2.2 cm slice was taken from the midpoint between the stem and the calyx end of the fruit and the plunger vertically pressed into the fl esh at four equatorially spaced points along the surface; penetration was expressed in mm sec-1. Increasing depths of penetration represented continuous loss of fi rmness in fruit.
Fresh fruit weight and cavity volume: For measurement of C2H4 and CO2, harvested fruits of each variety were weighed individually on a Mettler Toledo calibrated digital scale (Model #SB 8001 Toledo SD 8001, Schwerzenbach, Switzerland) to determine fresh weight. Each fruit was subsequently cut in half, seeds removed and weighed. Each half was then fi lled with
distilled water which was poured into a graduated cylinder for cavity volume measurement. In a separate sample of papaya fruit of each cultivar, total fruit weight was measured and fruit void volumes determined as before. Seeds were then removed and weighed and fruit fl esh weight calculated by subtracting seed weight from total fruit weight.
pH: The pulp pH was determined using an Orion Research digital pH meter (EA 920 Orion Research Inc. Boston, MA) standardized with two buffer solutions of pH 7.01 and 4.01. The extract was obtained by macerating 25 g of pulp with 100 mL demonized water (Products Corp. Hartford, CT).
Experimental design and statistical analysis: The experiment consisted of two replicates with each replicate containing four fruits. Data were analyzed as a completely randomized design with a factorial arrangement of variables and subjected to Analysis of Variance using Minitab. Comparisons of the means were done using the least signifi cant difference (LSD) method at the 5% level.
ResultsFruit fresh weight and cavity volume: The fresh weights (fwt), cavity volume (cvo) and the fwt/cvo ratios of the fruit (Table 1) showed that there were considerable differences between values for fruit of the three cultivars. Thus, although mean fruit weights and cavity volumes of cv SS were considerably smaller than those of cvs T2 and RL, the fwt/cvo ratio of cv SS (6.9 g mL-1) was 1.8 and 1.6 times those of cvs T2 and RL, respectively. The possible effect of these dimensional differences on C2H4 and CO2 accumulation in the cavity and ripening will be described below. Since CO2 production and C2 H4 generation were measured in the fruit cavity, these differences could affect both the accumulation of gases and the interpretation of their effects on ripening.
Respiratory CO2 and C2 H4 generation changes with ripening: The time courses of the changes in climacteric patterns of (CO2) respiration rate and ethylene (C2H4) generation varied with cultivars and storage temperatures (Fig. 1 and 2). Examination of initial rates over 0-2 DAH indicated that at both ambient temperature (28-30oC) (Fig. 1C) and at (20-22oC) (Fig. 2C) cv RL showed slower rates of CO2 and C2 H4 generation than cvs SS and T2 (Figs. 1A, 1B). Whereas rates of CO2 and C2 H4 generation in fruit of each cultivar were similar at ambient temperature (Figs. 1 A, B and C). C2H4 generation proceeded at a more rapid rate than CO2 evolution at 20-22oC particularly in fruit of cvs SS and T2 (Figs. 2 A, B). Thus, the preclimacteric period of C2H4 generation occurred over 0-2 and 0-4 DAH at 28-30oC and 20-22oC, respectively in cv RL but was not recorded in cvs SS and
Table 1. Dimensional characteristics of fruit of three papaya cultivarsCultivar Fresh weight (g) Fruit
cavity void vol
(mL)
Frut pulp weight/ cavity void
volume (g mL-1)
Whole fruit
Fruit seeds
Fruit pulp
Solo Sunrise (SS) 387b NDZ 387b 56a 6.9bTraining #2 (T2) 1364e 87a 1277d 334b 3.8aRed Lady (RL) 2266g 124a 2142f 502c 4.3aLSD (P=0.05) 109.3 81.5 1.3ZND: No data due to seedless nature of cultivar
Fruit ripening of Solo Sunrise, Tainung #2 and Red Lady papaya at two temperatures 55
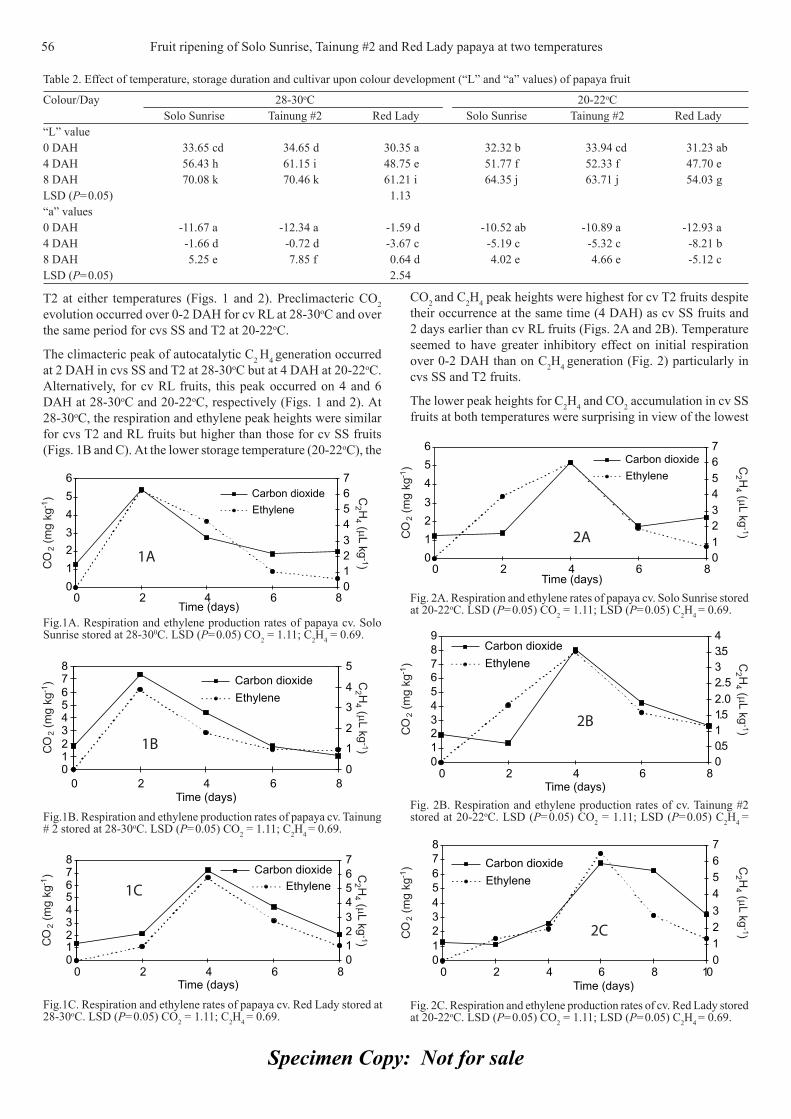
Specimen Copy: Not for sale
T2 at either temperatures (Figs. 1 and 2). Preclimacteric CO2 evolution occurred over 0-2 DAH for cv RL at 28-30oC and over the same period for cvs SS and T2 at 20-22oC.
The climacteric peak of autocatalytic C2 H4 generation occurred at 2 DAH in cvs SS and T2 at 28-30oC but at 4 DAH at 20-22oC. Alternatively, for cv RL fruits, this peak occurred on 4 and 6 DAH at 28-30oC and 20-22oC, respectively (Figs. 1 and 2). At 28-30oC, the respiration and ethylene peak heights were similar for cvs T2 and RL fruits but higher than those for cv SS fruits (Figs. 1B and C). At the lower storage temperature (20-22oC), the
CO2 and C2H4 peak heights were highest for cv T2 fruits despite their occurrence at the same time (4 DAH) as cv SS fruits and 2 days earlier than cv RL fruits (Figs. 2A and 2B). Temperature seemed to have greater inhibitory effect on initial respiration over 0-2 DAH than on C2H4 generation (Fig. 2) particularly in cvs SS and T2 fruits.
The lower peak heights for C2H4 and CO2 accumulation in cv SS fruits at both temperatures were surprising in view of the lowest
Table 2. Effect of temperature, storage duration and cultivar upon colour development (“L” and “a” values) of papaya fruit
Colour/Day 28-30oC 20-22oCSolo Sunrise Tainung #2 Red Lady Solo Sunrise Tainung #2 Red Lady
“L” value0 DAH 33.65 cd 34.65 d 30.35 a 32.32 b 33.94 cd 31.23 ab4 DAH 56.43 h 61.15 i 48.75 e 51.77 f 52.33 f 47.70 e8 DAH 70.08 k 70.46 k 61.21 i 64.35 j 63.71 j 54.03 gLSD (P=0.05) 1.13“a” values0 DAH -11.67 a -12.34 a -1.59 d -10.52 ab -10.89 a -12.93 a4 DAH -1.66 d -0.72 d -3.67 c -5.19 c -5.32 c -8.21 b8 DAH 5.25 e 7.85 f 0.64 d 4.02 e 4.66 e -5.12 cLSD (P=0.05) 2.54
1A
1B
1C
Fig.1C. Respiration and ethylene rates of papaya cv. Red Lady stored at 28-30oC. LSD (P=0.05) CO2 = 1.11; C2H4 = 0.69.
Fig.1A. Respiration and ethylene production rates of papaya cv. Solo Sunrise stored at 28-300C. LSD (P=0.05) CO2 = 1.11; C2H4 = 0.69.
Fig.1B. Respiration and ethylene production rates of papaya cv. Tainung # 2 stored at 28-30oC. LSD (P=0.05) CO2 = 1.11; C2H4 = 0.69.
Fig. 2C. Respiration and ethylene production rates of cv. Red Lady stored at 20-22oC. LSD (P=0.05) CO2 = 1.11; LSD (P=0.05) C2H4 = 0.69.
2C
2B
2A
Fig. 2B. Respiration and ethylene production rates of cv. Tainung #2 stored at 20-22oC. LSD (P=0.05) CO2 = 1.11; LSD (P=0.05) C2H4 =
Fig. 2A. Respiration and ethylene rates of papaya cv. Solo Sunrise stored at 20-22oC. LSD (P=0.05) CO2 = 1.11; LSD (P=0.05) C2H4 = 0.69.
56 Fruit ripening of Solo Sunrise, Tainung #2 and Red Lady papaya at two temperatures
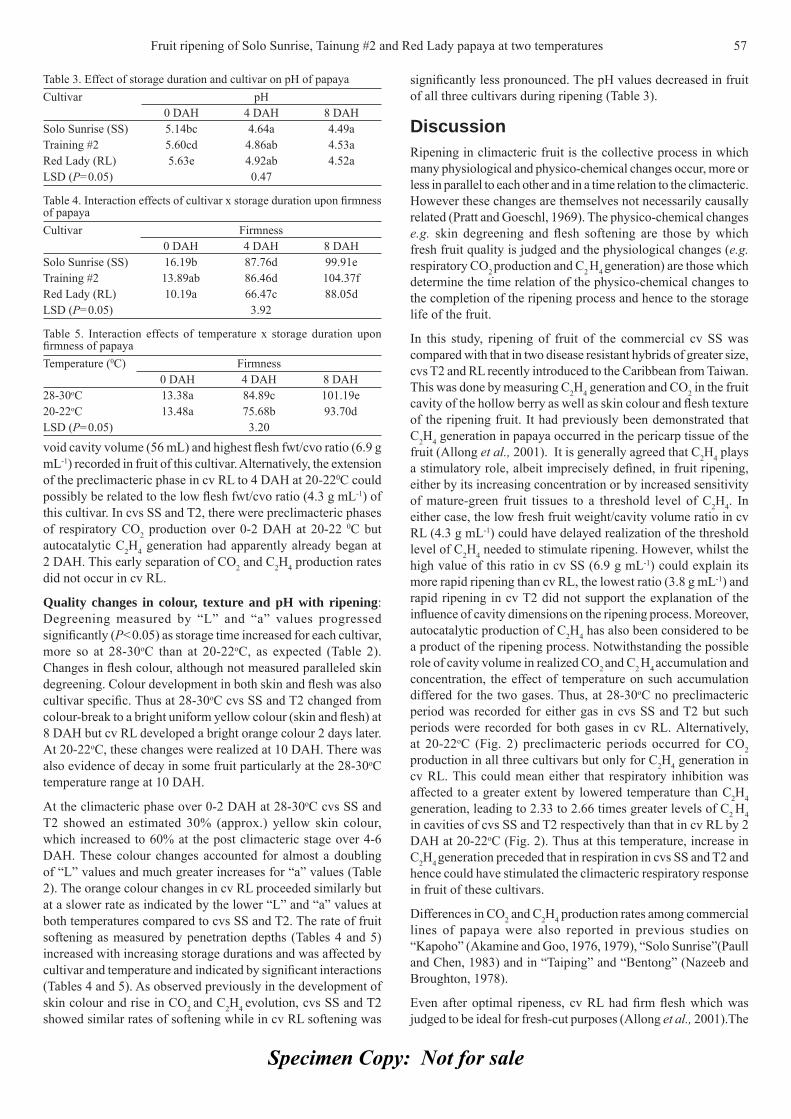
Specimen Copy: Not for sale
void cavity volume (56 mL) and highest fl esh fwt/cvo ratio (6.9 g mL-1) recorded in fruit of this cultivar. Alternatively, the extension of the preclimacteric phase in cv RL to 4 DAH at 20-220C could possibly be related to the low fl esh fwt/cvo ratio (4.3 g mL-1) of this cultivar. In cvs SS and T2, there were preclimacteric phases of respiratory CO2 production over 0-2 DAH at 20-22 0C but autocatalytic C2H4 generation had apparently already began at 2 DAH. This early separation of CO2 and C2H4 production rates did not occur in cv RL.
Quality changes in colour, texture and pH with ripening: Degreening measured by “L” and “a” values progressed signifi cantly (P<0.05) as storage time increased for each cultivar, more so at 28-30oC than at 20-22oC, as expected (Table 2). Changes in fl esh colour, although not measured paralleled skin degreening. Colour development in both skin and fl esh was also cultivar specifi c. Thus at 28-30oC cvs SS and T2 changed from colour-break to a bright uniform yellow colour (skin and fl esh) at 8 DAH but cv RL developed a bright orange colour 2 days later. At 20-22oC, these changes were realized at 10 DAH. There was also evidence of decay in some fruit particularly at the 28-30oC temperature range at 10 DAH.
At the climacteric phase over 0-2 DAH at 28-30oC cvs SS and T2 showed an estimated 30% (approx.) yellow skin colour, which increased to 60% at the post climacteric stage over 4-6 DAH. These colour changes accounted for almost a doubling of “L” values and much greater increases for “a” values (Table 2). The orange colour changes in cv RL proceeded similarly but at a slower rate as indicated by the lower “L” and “a” values at both temperatures compared to cvs SS and T2. The rate of fruit softening as measured by penetration depths (Tables 4 and 5) increased with increasing storage durations and was affected by cultivar and temperature and indicated by signifi cant interactions (Tables 4 and 5). As observed previously in the development of skin colour and rise in CO2 and C2H4 evolution, cvs SS and T2 showed similar rates of softening while in cv RL softening was
signifi cantly less pronounced. The pH values decreased in fruit of all three cultivars during ripening (Table 3).
DiscussionRipening in climacteric fruit is the collective process in which many physiological and physico-chemical changes occur, more or less in parallel to each other and in a time relation to the climacteric. However these changes are themselves not necessarily causally related (Pratt and Goeschl, 1969). The physico-chemical changes e.g. skin degreening and fl esh softening are those by which fresh fruit quality is judged and the physiological changes (e.g. respiratory CO2 production and C2 H4 generation) are those which determine the time relation of the physico-chemical changes to the completion of the ripening process and hence to the storage life of the fruit.
In this study, ripening of fruit of the commercial cv SS was compared with that in two disease resistant hybrids of greater size, cvs T2 and RL recently introduced to the Caribbean from Taiwan. This was done by measuring C2H4 generation and CO2 in the fruit cavity of the hollow berry as well as skin colour and fl esh texture of the ripening fruit. It had previously been demonstrated that C2H4 generation in papaya occurred in the pericarp tissue of the fruit (Allong et al., 2001). It is generally agreed that C2H4 plays a stimulatory role, albeit imprecisely defi ned, in fruit ripening, either by its increasing concentration or by increased sensitivity of mature-green fruit tissues to a threshold level of C2H4. In either case, the low fresh fruit weight/cavity volume ratio in cv RL (4.3 g mL-1) could have delayed realization of the threshold level of C2H4 needed to stimulate ripening. However, whilst the high value of this ratio in cv SS (6.9 g mL-1) could explain its more rapid ripening than cv RL, the lowest ratio (3.8 g mL-1) and rapid ripening in cv T2 did not support the explanation of the infl uence of cavity dimensions on the ripening process. Moreover, autocatalytic production of C2H4 has also been considered to be a product of the ripening process. Notwithstanding the possible role of cavity volume in realized CO2 and C2 H4 accumulation and concentration, the effect of temperature on such accumulation differed for the two gases. Thus, at 28-30oC no preclimacteric period was recorded for either gas in cvs SS and T2 but such periods were recorded for both gases in cv RL. Alternatively, at 20-22oC (Fig. 2) preclimacteric periods occurred for CO2 production in all three cultivars but only for C2H4 generation in cv RL. This could mean either that respiratory inhibition was affected to a greater extent by lowered temperature than C2H4 generation, leading to 2.33 to 2.66 times greater levels of C2 H4 in cavities of cvs SS and T2 respectively than that in cv RL by 2 DAH at 20-22oC (Fig. 2). Thus at this temperature, increase in C2H4 generation preceded that in respiration in cvs SS and T2 and hence could have stimulated the climacteric respiratory response in fruit of these cultivars.
Differences in CO2 and C2H4 production rates among commercial lines of papaya were also reported in previous studies on “Kapoho” (Akamine and Goo, 1976, 1979), “Solo Sunrise”(Paull and Chen, 1983) and in “Taiping” and “Bentong” (Nazeeb and Broughton, 1978).
Even after optimal ripeness, cv RL had fi rm fl esh which was judged to be ideal for fresh-cut purposes (Allong et al., 2001).The
Table 3. Effect of storage duration and cultivar on pH of papayaCultivar pH
0 DAH 4 DAH 8 DAHSolo Sunrise (SS) 5.14bc 4.64a 4.49aTraining #2 5.60cd 4.86ab 4.53aRed Lady (RL) 5.63e 4.92ab 4.52aLSD (P=0.05) 0.47
Table 4. Interaction effects of cultivar x storage duration upon fi rmness of papayaCultivar Firmness
0 DAH 4 DAH 8 DAHSolo Sunrise (SS) 16.19b 87.76d 99.91eTraining #2 13.89ab 86.46d 104.37fRed Lady (RL) 10.19a 66.47c 88.05dLSD (P=0.05) 3.92
Table 5. Interaction effects of temperature x storage duration upon fi rmness of papayaTemperature (0C) Firmness
0 DAH 4 DAH 8 DAH28-30oC 13.38a 84.89c 101.19e20-22oC 13.48a 75.68b 93.70dLSD (P=0.05) 3.20
Fruit ripening of Solo Sunrise, Tainung #2 and Red Lady papaya at two temperatures 57
Specimen Copy: Not for sale
slower softening rate of cv RL fruit would also allow for greater fl exibility in harvesting and handling of the fruit throughout the marketing chain. The intensity of the orange skin colour and corresponding fi rmer fl esh have the added advantage of allowing harvesters to pick fruits at a later stage when more sugar has accumulated. According to Chan et al. (1979) papaya fruits on the whole have no starch reserves for production of soluble sugars after harvest. Thus, a fruit that remains on the tree accumulates more sugars and develop a higher quality (Zhang and Paull, 1990). Although the mode of action of slower ripening in cv RL fruits is unknown it could provide material for generating commercial lines with longer shelf life as well as to conduct research on the genetic regulation of fl esh softening in papaya ripening either through changes in pectin or pectolytic enzyme activity.
The negative temporal displacement of skin degreening, compared to softening, respiration and ethylene production rates in this study is in agreement with Zhang and Paull (1990) and appears to be unique when compared both with results of Grumet et al. (1981) and Tigchelaar et al. (1978) in tomatoes as well as those with Brecht et al. (1984) with nectarines. However, in view of the rapid degreening response of most fruits to low C2H4 concentrations, the apparent inhibition of degreening in our investigation could be due to the lower C2H4 concentration in the laboratory atmosphere compared with that in the fruit cavity.
The pH values decreased in all three cultivars during storage. This may be explained by the observation that papayas are one of the few fruits in which ascorbic acid content increased with ripening (Selvaraj et al., 1982). However, storage temperature had no signifi cant effect on these changes.
Fruit of three papaya cultivars, cvs SS, T2 and RL stored at the 20-22oC temperature range showed distinct pre-climacteric phases, delayed climacteric peaks (2 days later) and ripened more slowly, than fruit stored at 28-30oC as assessed by C2H4 generation and CO2 production as indicated by the physico-chemical quality characteristics measured. Such fruit were also more attractive as judged by even colour, ripened fi rmness and reduced incidence of disease lesions. They were more likely to be acceptable to consumers. As a result, the 20-22oC temperature range was used in the following experiments on the inhibition of ripening by 1-MCP. However, fruit of cv RL ripened more slowly than those of cvs SS and T2. This could have been induced by higher concentrations of C2H4 in the fruit cavity of cv RL than in that of cv SS; associated with a lower fresh fruit/cavity volume ratio in cv RL. However, the rapid ripening/low ratio characteristics of fruit of cv T2 did not support this interpretation.
The negative temporal displacement of skin degreening compared with C2H4 generation and CO2 production and fl esh softening was explained by the difference in C2H4 concentration between the fruit cavity and the laboratory environment. It was concluded that
occurrence of preclimacteric C2H4 and CO2 concentrations and climacteric peak levels of the fruit cavity were sensitive indicators of the progress of ripening in papaya fruit and may be used in studies of the effect of 1-MCP on ripening.
ReferencesAkamine, E.K. and T. Goo, 1976. Respiration, ethylene production and
shelf life extension in irradiated papaya fruit after storage under simulated shipping conditions. Hawaii Agric. Expt. Station, 93: 1-2.
Akamine, E.K. and T. Goo, 1979. Concentrations of carbon dioxide and ethylene in the cavity of attached papaya fruit. HortScience, 14: 138-139.
Allong, R., L.D. Wickham and M. Mohammed, 2001. Effect of cultivar, hot water treatment and storge conditions on quality fresh-cut papaya (Carica papaya L.). J. Appl. Hort., 2(1): 15-18.
Biale, J.B. and D.E. Barcus, 1970. Respiratory patterns in tropical fruits of the Amazon basin. Tropical Science, 12: 93-104.
Brecht, J.K., A.A. Kader and D.W. Ramming, 1984. Description and postharvest physiology of some slow-ripening nectarine geneotype. J. Amer, Soc. Hort. Sci., 109: 763-767.
Chan, H.T., K.L Hibbard, T. Goo and E.K. Akamine, 1979. Sugar composition of papayas during fruit development. HortScience, 14: 140-141.
Grumat, R., J.F. Fobes and R.C. Herner, 1981 Ripening behaviour of wild tomato species. Plant Physiol., 68: 1428-1432.
Nazeeb, M. and W.J. Broughton, 1978. Storage conditions and ripening of papaya “Bentong” and “Taiping”. Scientia Hort., 9: 265-277.
Paull, R.E. and N.J. Chen, 1983. Postharvest variation in cell wall-degrading enzymes of papaya (Carica papaya L.) during fruit ripening. Plant Physiol., 72: 382-385.
Pratt, H.K. and J.D. Goeschl, 1969. Physiological roles of ethylene in plants. Ann. Rev. Plant Physiol., 20: 541-584.
Salunkhe, D.K. and B.B. Desai, 1984. Postharvest Biotechnology of Fruits. Volume 2. CRC Press, Boca Raton, Florida. 147 pp.
Saltveit, M.E. 1982. Procedures for extracting and analyzing internal gas samples from plant tissues by gas chromatography. HortScience, 17(6): 878-881.
Selvaraj, Y., D.K. Pal, M.D. Subramanyam and C.P.A. Iyer, 1982. Fruit set and the development pattern of fruits of fi ve papaya varieties. Indian J. Hort., 39: 50-56.
Simpson, J.A. 1980. Tropical Fruits. Tropical Agricultural Series. Longman New York.
Thompson, A.K. 1996. Postharvest Technology of Truits and Vegetables. Blackwell Science Ltd, Oxford UK. 410 pp.
Tigchelaar, E.C., B. McGlasson and M.J. Franklyn, 1978. Natural and etheponstimulated ripening of F1 hybrids of ripening inhibitor (rin) and non-ripening (nor) mutants of tomato (Lycopersicon esculentum Mill). Austral J. Plant Physiol., 5: 449-456.
Wills, R.B.H. and S.B. Widjanarko, 1995. Canges in physiology, composition and sensory characteristics of Australian papaya during ripening. Aust. J. Exp. Agric., 35: 1173-1176.
Zhang, L.X. and R.E. Paull, 1990. Ripening behaviour of papaya genotypes. HortScience, 25(4): 454-455.
58 Fruit ripening of Solo Sunrise, Tainung #2 and Red Lady papaya at two temperatures
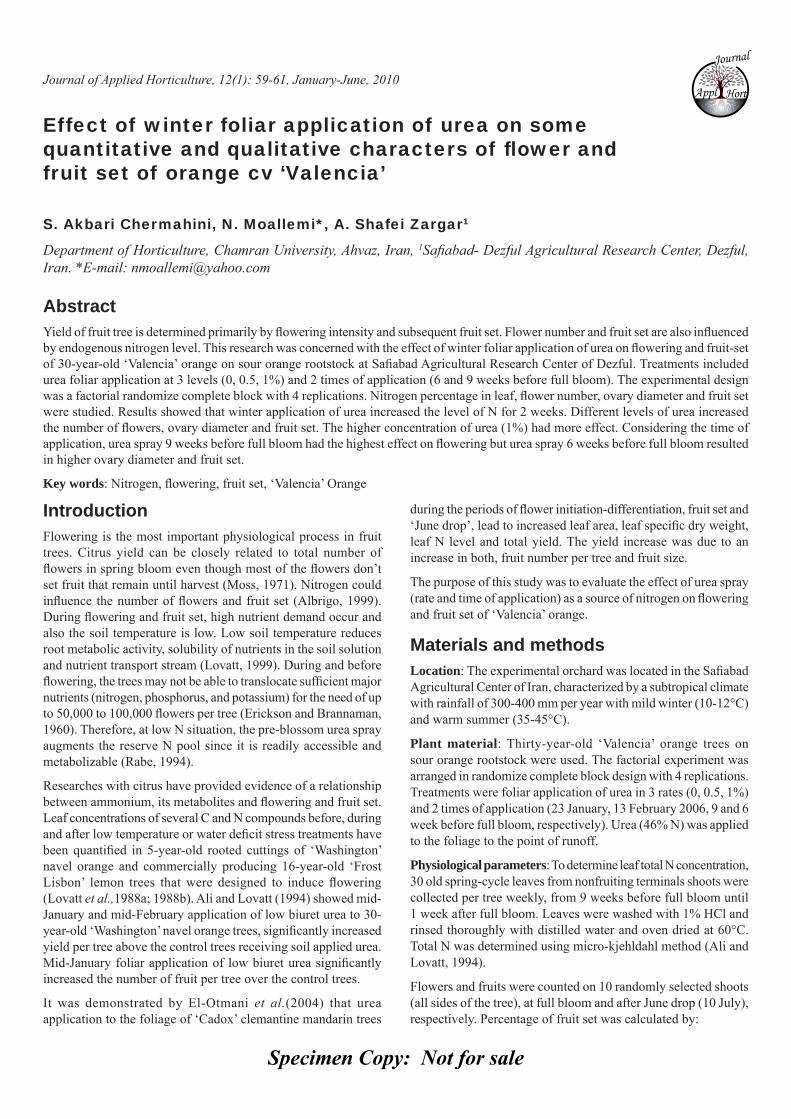
Specimen Copy: Not for sale
Journal of Applied Horticulture, 12(1): 59-61, January-June, 2010
Effect of winter foliar application of urea on some quantitative and qualitative characters of fl ower and fruit set of orange cv ‘Valencia’
S. Akbari Chermahini, N. Moallemi*, A. Shafei Zargar1
Department of Horticulture, Chamran University, Ahvaz, Iran, 1Safi abad- Dezful Agricultural Research Center, Dezful, Iran. *E-mail: [email protected]
AbstractYield of fruit tree is determined primarily by fl owering intensity and subsequent fruit set. Flower number and fruit set are also infl uenced by endogenous nitrogen level. This research was concerned with the effect of winter foliar application of urea on fl owering and fruit-set of 30-year-old ‘Valencia’ orange on sour orange rootstock at Safi abad Agricultural Research Center of Dezful. Treatments included urea foliar application at 3 levels (0, 0.5, 1%) and 2 times of application (6 and 9 weeks before full bloom). The experimental design was a factorial randomize complete block with 4 replications. Nitrogen percentage in leaf, fl ower number, ovary diameter and fruit set were studied. Results showed that winter application of urea increased the level of N for 2 weeks. Different levels of urea increased the number of fl owers, ovary diameter and fruit set. The higher concentration of urea (1%) had more effect. Considering the time of application, urea spray 9 weeks before full bloom had the highest effect on fl owering but urea spray 6 weeks before full bloom resulted in higher ovary diameter and fruit set.
Key words: Nitrogen, fl owering, fruit set, ‘Valencia’ Orange
IntroductionFlowering is the most important physiological process in fruit trees. Citrus yield can be closely related to total number of fl owers in spring bloom even though most of the fl owers don’t set fruit that remain until harvest (Moss, 1971). Nitrogen could infl uence the number of fl owers and fruit set (Albrigo, 1999). During fl owering and fruit set, high nutrient demand occur and also the soil temperature is low. Low soil temperature reduces root metabolic activity, solubility of nutrients in the soil solution and nutrient transport stream (Lovatt, 1999). During and before fl owering, the trees may not be able to translocate suffi cient major nutrients (nitrogen, phosphorus, and potassium) for the need of up to 50,000 to 100,000 fl owers per tree (Erickson and Brannaman, 1960). Therefore, at low N situation, the pre-blossom urea spray augments the reserve N pool since it is readily accessible and metabolizable (Rabe, 1994).
Researches with citrus have provided evidence of a relationship between ammonium, its metabolites and fl owering and fruit set. Leaf concentrations of several C and N compounds before, during and after low temperature or water defi cit stress treatments have been quantifi ed in 5-year-old rooted cuttings of ‘Washington’ navel orange and commercially producing 16-year-old ‘Frost Lisbon’ lemon trees that were designed to induce fl owering (Lovatt et al.,1988a; 1988b). Ali and Lovatt (1994) showed mid-January and mid-February application of low biuret urea to 30-year-old ‘Washington’ navel orange trees, signifi cantly increased yield per tree above the control trees receiving soil applied urea. Mid-January foliar application of low biuret urea signifi cantly increased the number of fruit per tree over the control trees.
It was demonstrated by El-Otmani et al.(2004) that urea application to the foliage of ‘Cadox’ clemantine mandarin trees
during the periods of fl ower initiation-differentiation, fruit set and ‘June drop’, lead to increased leaf area, leaf specifi c dry weight, leaf N level and total yield. The yield increase was due to an increase in both, fruit number per tree and fruit size.
The purpose of this study was to evaluate the effect of urea spray (rate and time of application) as a source of nitrogen on fl owering and fruit set of ‘Valencia’ orange.
Materials and methodsLocation: The experimental orchard was located in the Safi abad Agricultural Center of Iran, characterized by a subtropical climate with rainfall of 300-400 mm per year with mild winter (10-12°C) and warm summer (35-45°C).
Plant material: Thirty-year-old ‘Valencia’ orange trees on sour orange rootstock were used. The factorial experiment was arranged in randomize complete block design with 4 replications. Treatments were foliar application of urea in 3 rates (0, 0.5, 1%) and 2 times of application (23 January, 13 February 2006, 9 and 6 week before full bloom, respectively). Urea (46% N) was applied to the foliage to the point of runoff.
Physiological parameters: To determine leaf total N concentration, 30 old spring-cycle leaves from nonfruiting terminals shoots were collected per tree weekly, from 9 weeks before full bloom until 1 week after full bloom. Leaves were washed with 1% HCl and rinsed thoroughly with distilled water and oven dried at 60°C. Total N was determined using micro-kjehldahl method (Ali and Lovatt, 1994).
Flowers and fruits were counted on 10 randomly selected shoots (all sides of the tree), at full bloom and after June drop (10 July), respectively. Percentage of fruit set was calculated by:
Journal
Appl
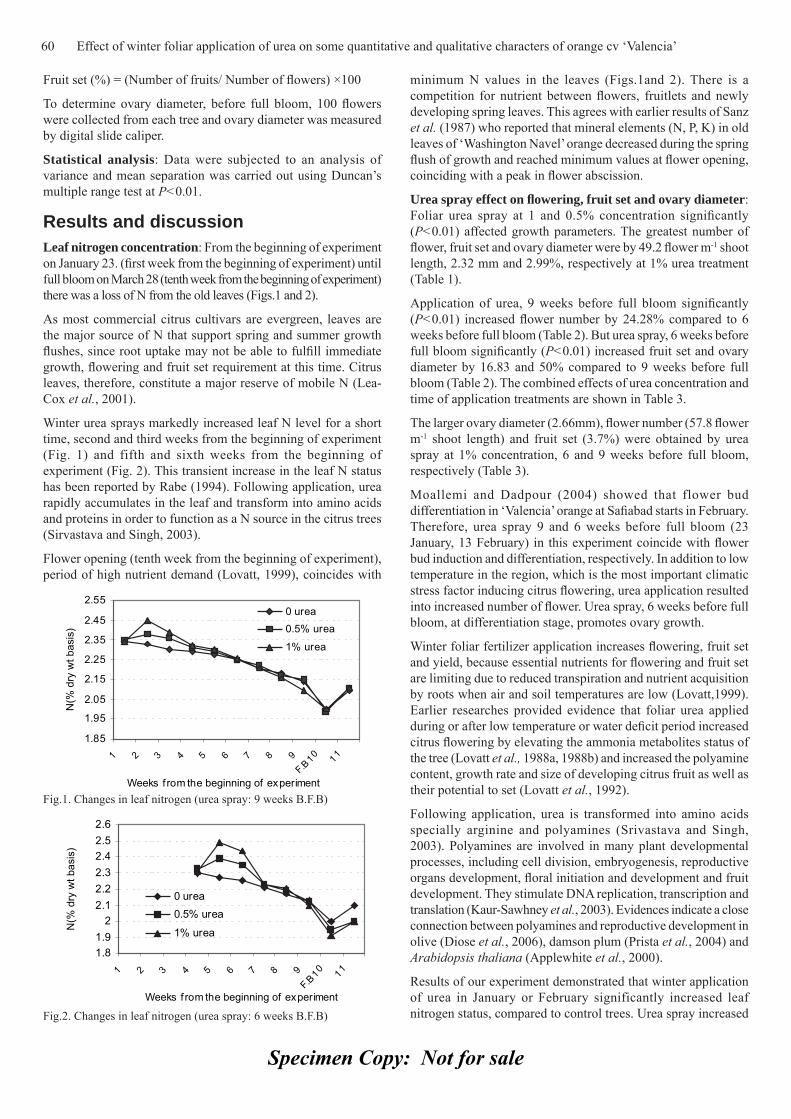
Specimen Copy: Not for sale
Fruit set (%) = (Number of fruits/ Number of fl owers) ×100
To determine ovary diameter, before full bloom, 100 fl owers were collected from each tree and ovary diameter was measured by digital slide caliper.
Statistical analysis: Data were subjected to an analysis of variance and mean separation was carried out using Duncan’s multiple range test at P<0.01.
Results and discussion Leaf nitrogen concentration: From the beginning of experiment on January 23. (fi rst week from the beginning of experiment) until full bloom on March 28 (tenth week from the beginning of experiment) there was a loss of N from the old leaves (Figs.1 and 2).
As most commercial citrus cultivars are evergreen, leaves are the major source of N that support spring and summer growth fl ushes, since root uptake may not be able to fulfi ll immediate growth, fl owering and fruit set requirement at this time. Citrus leaves, therefore, constitute a major reserve of mobile N (Lea-Cox et al., 2001).
Winter urea sprays markedly increased leaf N level for a short time, second and third weeks from the beginning of experiment (Fig. 1) and fifth and sixth weeks from the beginning of experiment (Fig. 2). This transient increase in the leaf N status has been reported by Rabe (1994). Following application, urea rapidly accumulates in the leaf and transform into amino acids and proteins in order to function as a N source in the citrus trees (Sirvastava and Singh, 2003).
Flower opening (tenth week from the beginning of experiment), period of high nutrient demand (Lovatt, 1999), coincides with
minimum N values in the leaves (Figs.1and 2). There is a competition for nutrient between fl owers, fruitlets and newly developing spring leaves. This agrees with earlier results of Sanz et al. (1987) who reported that mineral elements (N, P, K) in old leaves of ‘Washington Navel’ orange decreased during the spring fl ush of growth and reached minimum values at fl ower opening, coinciding with a peak in fl ower abscission.
Urea spray effect on fl owering, fruit set and ovary diameter: Foliar urea spray at 1 and 0.5% concentration signifi cantly (P<0.01) affected growth parameters. The greatest number of fl ower, fruit set and ovary diameter were by 49.2 fl ower m-1 shoot length, 2.32 mm and 2.99%, respectively at 1% urea treatment (Table 1).
Application of urea, 9 weeks before full bloom signifi cantly (P<0.01) increased fl ower number by 24.28% compared to 6 weeks before full bloom (Table 2). But urea spray, 6 weeks before full bloom signifi cantly (P<0.01) increased fruit set and ovary diameter by 16.83 and 50% compared to 9 weeks before full bloom (Table 2). The combined effects of urea concentration and time of application treatments are shown in Table 3.
The larger ovary diameter (2.66mm), fl ower number (57.8 fl ower m-1 shoot length) and fruit set (3.7%) were obtained by urea spray at 1% concentration, 6 and 9 weeks before full bloom, respectively (Table 3).
Moallemi and Dadpour (2004) showed that flower bud differentiation in ‘Valencia’ orange at Safi abad starts in February. Therefore, urea spray 9 and 6 weeks before full bloom (23 January, 13 February) in this experiment coincide with fl ower bud induction and differentiation, respectively. In addition to low temperature in the region, which is the most important climatic stress factor inducing citrus fl owering, urea application resulted into increased number of fl ower. Urea spray, 6 weeks before full bloom, at differentiation stage, promotes ovary growth.
Winter foliar fertilizer application increases fl owering, fruit set and yield, because essential nutrients for fl owering and fruit set are limiting due to reduced transpiration and nutrient acquisition by roots when air and soil temperatures are low (Lovatt,1999). Earlier researches provided evidence that foliar urea applied during or after low temperature or water defi cit period increased citrus fl owering by elevating the ammonia metabolites status of the tree (Lovatt et al., 1988a, 1988b) and increased the polyamine content, growth rate and size of developing citrus fruit as well as their potential to set (Lovatt et al., 1992).
Following application, urea is transformed into amino acids specially arginine and polyamines (Srivastava and Singh, 2003). Polyamines are involved in many plant developmental processes, including cell division, embryogenesis, reproductive organs development, fl oral initiation and development and fruit development. They stimulate DNA replication, transcription and translation (Kaur-Sawhney et al., 2003). Evidences indicate a close connection between polyamines and reproductive development in olive (Diose et al., 2006), damson plum (Prista et al., 2004) and Arabidopsis thaliana (Applewhite et al., 2000).
Results of our experiment demonstrated that winter application of urea in January or February significantly increased leaf nitrogen status, compared to control trees. Urea spray increased Fig.2. Changes in leaf nitrogen (urea spray: 6 weeks B.F.B)
Fig.1. Changes in leaf nitrogen (urea spray: 9 weeks B.F.B)
60 Effect of winter foliar application of urea on some quantitative and qualitative characters of orange cv ‘Valencia’
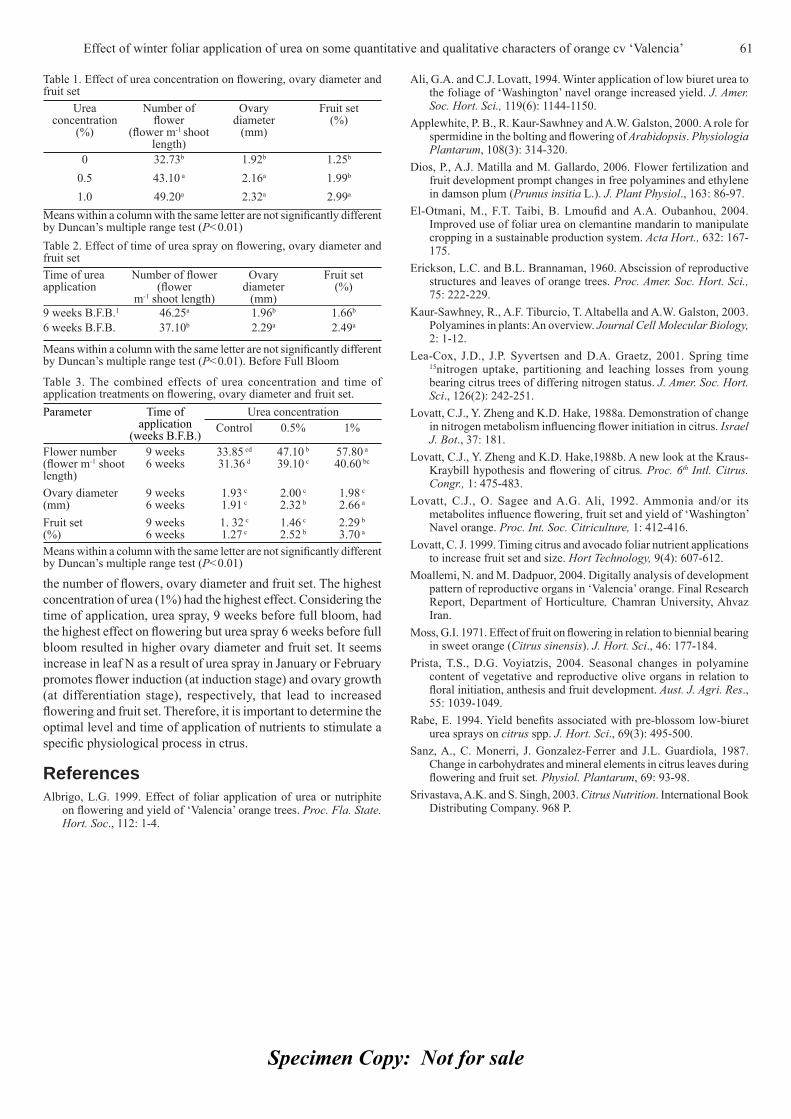
Specimen Copy: Not for sale
the number of fl owers, ovary diameter and fruit set. The highest concentration of urea (1%) had the highest effect. Considering the time of application, urea spray, 9 weeks before full bloom, had the highest effect on fl owering but urea spray 6 weeks before full bloom resulted in higher ovary diameter and fruit set. It seems increase in leaf N as a result of urea spray in January or February promotes fl ower induction (at induction stage) and ovary growth (at differentiation stage), respectively, that lead to increased fl owering and fruit set. Therefore, it is important to determine the optimal level and time of application of nutrients to stimulate a specifi c physiological process in ctrus.
References Albrigo, L.G. 1999. Effect of foliar application of urea or nutriphite
on fl owering and yield of ‘Valencia’ orange trees. Proc. Fla. State. Hort. Soc., 112: 1-4.
Ali, G.A. and C.J. Lovatt, 1994. Winter application of low biuret urea to the foliage of ‘Washington’ navel orange increased yield. J. Amer. Soc. Hort. Sci., 119(6): 1144-1150.
Applewhite, P. B., R. Kaur-Sawhney and A.W. Galston, 2000. A role for spermidine in the bolting and fl owering of Arabidopsis. Physiologia Plantarum, 108(3): 314-320.
Dios, P., A.J. Matilla and M. Gallardo, 2006. Flower fertilization and fruit development prompt changes in free polyamines and ethylene in damson plum (Prunus insitia L.). J. Plant Physiol., 163: 86-97.
El-Otmani, M., F.T. Taibi, B. Lmoufi d and A.A. Oubanhou, 2004. Improved use of foliar urea on clemantine mandarin to manipulate cropping in a sustainable production system. Acta Hort., 632: 167-175.
Erickson, L.C. and B.L. Brannaman, 1960. Abscission of reproductive structures and leaves of orange trees. Proc. Amer. Soc. Hort. Sci., 75: 222-229.
Kaur-Sawhney, R., A.F. Tiburcio, T. Altabella and A.W. Galston, 2003. Polyamines in plants: An overview. Journal Cell Molecular Biology, 2: 1-12.
Lea-Cox, J.D., J.P. Syvertsen and D.A. Graetz, 2001. Spring time 15nitrogen uptake, partitioning and leaching losses from young bearing citrus trees of differing nitrogen status. J. Amer. Soc. Hort. Sci., 126(2): 242-251.
Lovatt, C.J., Y. Zheng and K.D. Hake, 1988a. Demonstration of change in nitrogen metabolism infl uencing fl ower initiation in citrus. Israel J. Bot., 37: 181.
Lovatt, C.J., Y. Zheng and K.D. Hake,1988b. A new look at the Kraus- Kraybill hypothesis and fl owering of citrus. Proc. 6th Intl. Citrus. Congr., 1: 475-483.
Lovatt, C.J., O. Sagee and A.G. Ali, 1992. Ammonia and/or its metabolites infl uence fl owering, fruit set and yield of ‘Washington’ Navel orange. Proc. Int. Soc. Citriculture, 1: 412-416.
Lovatt, C. J. 1999. Timing citrus and avocado foliar nutrient applications to increase fruit set and size. Hort Technology, 9(4): 607-612.
Moallemi, N. and M. Dadpuor, 2004. Digitally analysis of development pattern of reproductive organs in ‘Valencia’ orange. Final Research Report, Department of Horticulture, Chamran University, Ahvaz Iran.
Moss, G.I. 1971. Effect of fruit on fl owering in relation to biennial bearing in sweet orange (Citrus sinensis). J. Hort. Sci., 46: 177-184.
Prista, T.S., D.G. Voyiatzis, 2004. Seasonal changes in polyamine content of vegetative and reproductive olive organs in relation to fl oral initiation, anthesis and fruit development. Aust. J. Agri. Res., 55: 1039-1049.
Rabe, E. 1994. Yield benefi ts associated with pre-blossom low-biuret urea sprays on citrus spp. J. Hort. Sci., 69(3): 495-500.
Sanz, A., C. Monerri, J. Gonzalez-Ferrer and J.L. Guardiola, 1987. Change in carbohydrates and mineral elements in citrus leaves during fl owering and fruit set. Physiol. Plantarum, 69: 93-98.
Srivastava, A.K. and S. Singh, 2003. Citrus Nutrition. International Book Distributing Company. 968 P.
Table 1. Effect of urea concentration on fl owering, ovary diameter and fruit set
Urea concentration
(%)
Number of fl ower
(fl ower m-1 shoot length)
Ovary diameter
(mm)
Fruit set (%)
00.51.0
32.73b
43.10 a
49.20a
1.92b
2.16a
2.32a
1.25b
1.99b
2.99a
Means within a column with the same letter are not signifi cantly different by Duncan’s multiple range test (P<0.01)Table 2. Effect of time of urea spray on fl owering, ovary diameter and fruit setTime of urea application
Number of fl ower (fl ower
m-1 shoot length)
Ovary diameter
(mm)
Fruit set (%)
9 weeks B.F.B.1
6 weeks B.F.B.46.25a
37.10b1.96b
2.29a1.66b
2.49a
Means within a column with the same letter are not signifi cantly different by Duncan’s multiple range test (P<0.01). Before Full Bloom
Table 3. The combined effects of urea concentration and time of application treatments on fl owering, ovary diameter and fruit set.Parameter Time of
application (weeks B.F.B.)
Urea concentrationControl 0.5% 1%
Flower number (fl ower m-1 shoot length)
9 weeks6 weeks
33.85 cd 31.36 d
47.10 b 39.10 c
57.80 a 40.60 bc
Ovary diameter (mm)
9 weeks6 weeks
1.93 c 1.91 c
2.00 c 2.32 b
1.98 c 2.66 a
Fruit set (%)
9 weeks6 weeks
1. 32 c 1.27 c
1.46 c 2.52 b
2.29 b 3.70 a
Means within a column with the same letter are not signifi cantly different by Duncan’s multiple range test (P<0.01)
Effect of winter foliar application of urea on some quantitative and qualitative characters of orange cv ‘Valencia’ 61
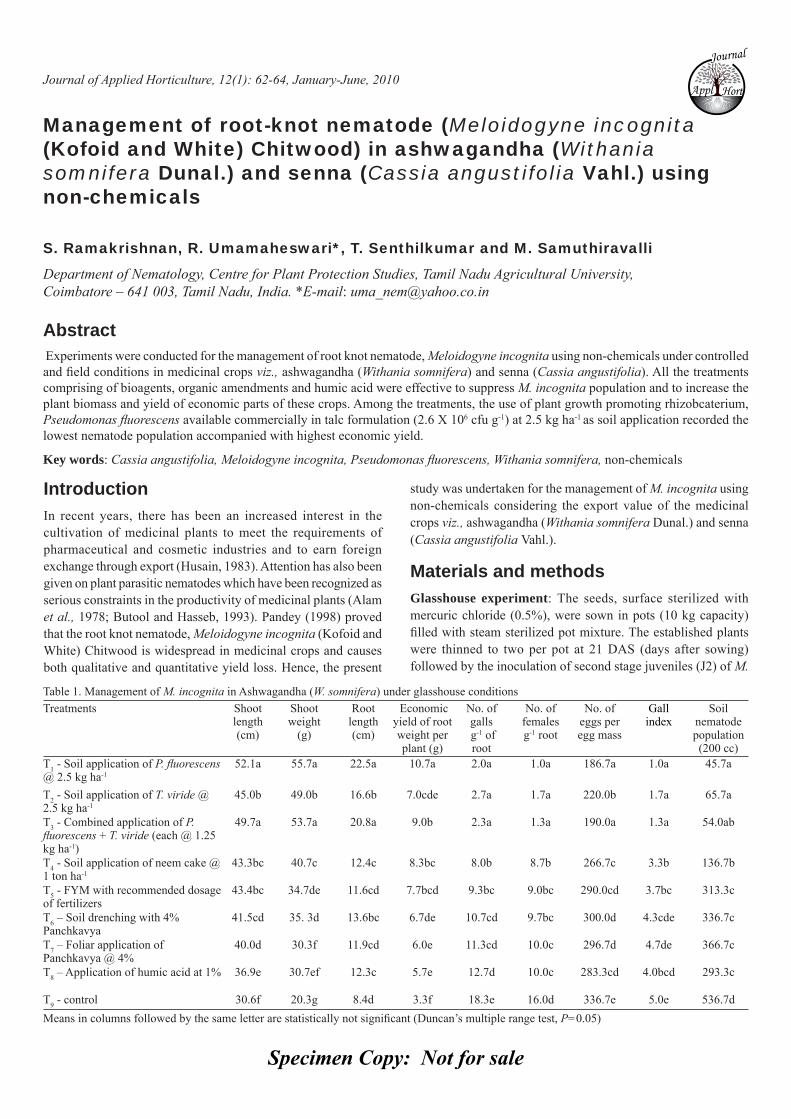
Specimen Copy: Not for sale
Journal of Applied Horticulture, 12(1): 62-64, January-June, 2010
Management of root-knot nematode (Meloidogyne incognita (Kofoid and White) Chitwood) in ashwagandha (Withania somnifera Dunal.) and senna (Cassia angustifolia Vahl.) using non-chemicals
S. Ramakrishnan, R. Umamaheswari*, T. Senthilkumar and M. Samuthiravalli
Department of Nematology, Centre for Plant Protection Studies, Tamil Nadu Agricultural University, Coimbatore – 641 003, Tamil Nadu, India. *E-mail: [email protected]
Abstract Experiments were conducted for the management of root knot nematode, Meloidogyne incognita using non-chemicals under controlled and fi eld conditions in medicinal crops viz., ashwagandha (Withania somnifera) and senna (Cassia angustifolia). All the treatments comprising of bioagents, organic amendments and humic acid were effective to suppress M. incognita population and to increase the plant biomass and yield of economic parts of these crops. Among the treatments, the use of plant growth promoting rhizobcaterium, Pseudomonas fl uorescens available commercially in talc formulation (2.6 X 10⁶ cfu g-1) at 2.5 kg ha-1 as soil application recorded the lowest nematode population accompanied with highest economic yield.
Key words: Cassia angustifolia, Meloidogyne incognita, Pseudomonas fl uorescens, Withania somnifera, non-chemicals
IntroductionIn recent years, there has been an increased interest in the cultivation of medicinal plants to meet the requirements of pharmaceutical and cosmetic industries and to earn foreign exchange through export (Husain, 1983). Attention has also been given on plant parasitic nematodes which have been recognized as serious constraints in the productivity of medicinal plants (Alam et al., 1978; Butool and Hasseb, 1993). Pandey (1998) proved that the root knot nematode, Meloidogyne incognita (Kofoid and White) Chitwood is widespread in medicinal crops and causes both qualitative and quantitative yield loss. Hence, the present
study was undertaken for the management of M. incognita using non-chemicals considering the export value of the medicinal crops viz., ashwagandha (Withania somnifera Dunal.) and senna (Cassia angustifolia Vahl.).
Materials and methodsGlasshouse experiment: The seeds, surface sterilized with mercuric chloride (0.5%), were sown in pots (10 kg capacity) fi lled with steam sterilized pot mixture. The established plants were thinned to two per pot at 21 DAS (days after sowing) followed by the inoculation of second stage juveniles (J2) of M.
Table 1. Management of M. incognita in Ashwagandha (W. somnifera) under glasshouse conditionsTreatments Shoot
length (cm)
Shoot weight
(g)
Root length (cm)
Economic yield of root weight per plant (g)
No. of galls g-1 of root
No. of females g-1 root
No. of eggs per egg mass
Gall index
Soil nematode population (200 cc)
T1 - Soil application of P. fl uorescens @ 2.5 kg ha-1
52.1a 55.7a 22.5a 10.7a 2.0a 1.0a 186.7a 1.0a 45.7a
T2 - Soil application of T. viride @ 2.5 kg ha-1
45.0b 49.0b 16.6b 7.0cde 2.7a 1.7a 220.0b 1.7a 65.7a
T3 - Combined application of P. fl uorescens + T. viride (each @ 1.25 kg ha-1)
49.7a 53.7a 20.8a 9.0b 2.3a 1.3a 190.0a 1.3a 54.0ab
T4 - Soil application of neem cake @ 1 ton ha-1
43.3bc 40.7c 12.4c 8.3bc 8.0b 8.7b 266.7c 3.3b 136.7b
T5 - FYM with recommended dosage of fertilizers
43.4bc 34.7de 11.6cd 7.7bcd 9.3bc 9.0bc 290.0cd 3.7bc 313.3c
T6 – Soil drenching with 4% Panchkavya
41.5cd 35. 3d 13.6bc 6.7de 10.7cd 9.7bc 300.0d 4.3cde 336.7c
T7 – Foliar application of Panchkavya @ 4%
40.0d 30.3f 11.9cd 6.0e 11.3cd 10.0c 296.7d 4.7de 366.7c
T8 – Application of humic acid at 1% 36.9e 30.7ef 12.3c 5.7e 12.7d 10.0c 283.3cd 4.0bcd 293.3c
T9 - control 30.6f 20.3g 8.4d 3.3f 18.3e 16.0d 336.7e 5.0e 536.7dMeans in columns followed by the same letter are statistically not signifi cant (Duncan’s multiple range test, P=0.05)
Journal
Appl
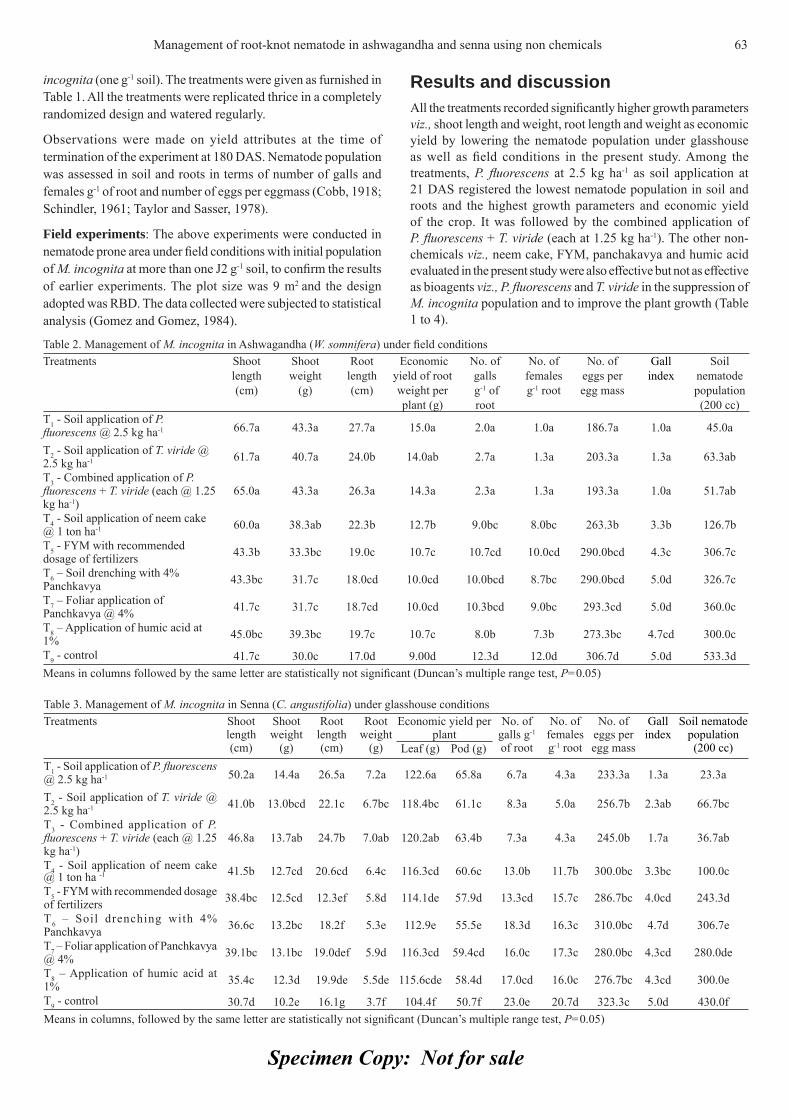
Specimen Copy: Not for sale
incognita (one g-1 soil). The treatments were given as furnished in Table 1. All the treatments were replicated thrice in a completely randomized design and watered regularly.
Observations were made on yield attributes at the time of termination of the experiment at 180 DAS. Nematode population was assessed in soil and roots in terms of number of galls and females g-1 of root and number of eggs per eggmass (Cobb, 1918; Schindler, 1961; Taylor and Sasser, 1978).
Field experiments: The above experiments were conducted in nematode prone area under fi eld conditions with initial population of M. incognita at more than one J2 g-1 soil, to confi rm the results of earlier experiments. The plot size was 9 m2 and the design adopted was RBD. The data collected were subjected to statistical analysis (Gomez and Gomez, 1984).
Results and discussionAll the treatments recorded signifi cantly higher growth parameters viz., shoot length and weight, root length and weight as economic yield by lowering the nematode population under glasshouse as well as fi eld conditions in the present study. Among the treatments, P. fl uorescens at 2.5 kg ha-1 as soil application at 21 DAS registered the lowest nematode population in soil and roots and the highest growth parameters and economic yield of the crop. It was followed by the combined application of P. fl uorescens + T. viride (each at 1.25 kg ha-1). The other non-chemicals viz., neem cake, FYM, panchakavya and humic acid evaluated in the present study were also effective but not as effective as bioagents viz., P. fl uorescens and T. viride in the suppression of M. incognita population and to improve the plant growth (Table 1 to 4).
Table 2. Management of M. incognita in Ashwagandha (W. somnifera) under fi eld conditionsTreatments Shoot
length (cm)
Shoot weight
(g)
Root length (cm)
Economic yield of root weight per plant (g)
No. of galls g-1 of root
No. of females g-1 root
No. of eggs per egg mass
Gall index
Soil nematode population (200 cc)
T1 - Soil application of P. fl uorescens @ 2.5 kg ha-1 66.7a 43.3a 27.7a 15.0a 2.0a 1.0a 186.7a 1.0a 45.0a
T2 - Soil application of T. viride @ 2.5 kg ha-1 61.7a 40.7a 24.0b 14.0ab 2.7a 1.3a 203.3a 1.3a 63.3ab
T3 - Combined application of P. fl uorescens + T. viride (each @ 1.25 kg ha-1)
65.0a 43.3a 26.3a 14.3a 2.3a 1.3a 193.3a 1.0a 51.7ab
T4 - Soil application of neem cake @ 1 ton ha-1 60.0a 38.3ab 22.3b 12.7b 9.0bc 8.0bc 263.3b 3.3b 126.7b
T5 - FYM with recommended dosage of fertilizers 43.3b 33.3bc 19.0c 10.7c 10.7cd 10.0cd 290.0bcd 4.3c 306.7c
T6 – Soil drenching with 4% Panchkavya 43.3bc 31.7c 18.0cd 10.0cd 10.0bcd 8.7bc 290.0bcd 5.0d 326.7c
T7 – Foliar application of Panchkavya @ 4% 41.7c 31.7c 18.7cd 10.0cd 10.3bcd 9.0bc 293.3cd 5.0d 360.0c
T8 – Application of humic acid at 1% 45.0bc 39.3bc 19.7c 10.7c 8.0b 7.3b 273.3bc 4.7cd 300.0c
T9 - control 41.7c 30.0c 17.0d 9.00d 12.3d 12.0d 306.7d 5.0d 533.3dMeans in columns followed by the same letter are statistically not signifi cant (Duncan’s multiple range test, P=0.05)
Table 3. Management of M. incognita in Senna (C. angustifolia) under glasshouse conditionsTreatments Shoot
length (cm)
Shoot weight
(g)
Root length (cm)
Root weight
(g)
Economic yield per plant
No. of galls g-1 of root
No. of females g-1 root
No. of eggs per egg mass
Gall index
Soil nematode population (200 cc)Leaf (g) Pod (g)
T1 - Soil application of P. fl uorescens @ 2.5 kg ha-1 50.2a 14.4a 26.5a 7.2a 122.6a 65.8a 6.7a 4.3a 233.3a 1.3a 23.3a
T2 - Soil application of T. viride @ 2.5 kg ha-1 41.0b 13.0bcd 22.1c 6.7bc 118.4bc 61.1c 8.3a 5.0a 256.7b 2.3ab 66.7bc
T3 - Combined application of P. fl uorescens + T. viride (each @ 1.25 kg ha-1)
46.8a 13.7ab 24.7b 7.0ab 120.2ab 63.4b 7.3a 4.3a 245.0b 1.7a 36.7ab
T4 - Soil application of neem cake @ 1 ton ha -1 41.5b 12.7cd 20.6cd 6.4c 116.3cd 60.6c 13.0b 11.7b 300.0bc 3.3bc 100.0c
T5 - FYM with recommended dosage of fertilizers 38.4bc 12.5cd 12.3ef 5.8d 114.1de 57.9d 13.3cd 15.7c 286.7bc 4.0cd 243.3d
T6 – Soil drenching with 4% Panchkavya 36.6c 13.2bc 18.2f 5.3e 112.9e 55.5e 18.3d 16.3c 310.0bc 4.7d 306.7e
T7 – Foliar application of Panchkavya @ 4% 39.1bc 13.1bc 19.0def 5.9d 116.3cd 59.4cd 16.0c 17.3c 280.0bc 4.3cd 280.0de
T8 – Application of humic acid at 1% 35.4c 12.3d 19.9de 5.5de 115.6cde 58.4d 17.0cd 16.0c 276.7bc 4.3cd 300.0e
T9 - control 30.7d 10.2e 16.1g 3.7f 104.4f 50.7f 23.0e 20.7d 323.3c 5.0d 430.0fMeans in columns, followed by the same letter are statistically not signifi cant (Duncan’s multiple range test, P=0.05)
Management of root-knot nematode in ashwagandha and senna using non chemicals 63
Specimen Copy: Not for sale
Earlier, several studies have proved the effi cacy of P. fl uorescens in suppressing M. incognita in many fi eld crops viz., tomato (Jonathan et al., 2000), chickpea (Khan et al., 2001) and turmeric (Srinivasan et al., 2001). Several mechanisms were attributed to the suppression of phytonematodes by the application of P. fl uorescens such as induced systemic resistance, production of antibiotics and siderophores, competition for nutrients and alteration of specifi c root exudates such as polysaccharides and amino acids which modify nematode behaviour (Oostendorp and Sikora, 1990; Aalten et al., 1998).
Thus, the present study indicated that the use of P. fl uorescens treatment is effective to reduce M. incognita population and to enhance the yield. Hence P. fl uorescens can be used as an effi cient and eco-friendly bionematicide in ashwagandha and senna.
Acknowledgement The authors are grateful to the National Medicinal Plants Board, New Delhi for providing the funds to carry out the study.
ReferencesAalten, P.M., D. Vitour, D. Blanvillain, S.R. Gowen and L. Sutra,
1998. Effect of rhizosphere fluorescent pseudomonads strains on plant parasitic nematodes, Radopholus similis and Meloidogyne spp. Letters in Applied Microbiololgy, 27: 357-361.
Alam, M.M., S.K. Saxena and A.M. Khan, 1978. Root knot nematode as pests of yams (Dioscorea spp.) in Southern Nigeria. Nematologica, 24: 132-134.
Butool, F. and A. Haseeb, 1993. Relationship between root knot nematode, Meloidogyne incognita and growth/yield of Trachyspermum ammi. New Agricult., 2: 2.
Cobb, N.A. 1918. Estimating the nematode population of soil. U.S. Dep. Agric. Circ. No. 1. 48 pp.
Gomez, K.A. and A.A. Gomez, 1984. Statistical Procedures for Agricultural Research. John Wiley and Sons, New York, U.S.A.
Husain, A. 1983. Present and future of medicinal plants in India – A scientifi c appraisal. Proceedings of National Seminar on Medicinal Plants, Phytochemicals and Bulk Drugs, held at New Delhi from 23-25th March, 1983.
Jonathan, E.I., K.R. Barker, F.F. Abdel Alim, T.C. Vrain and D.W. Dickson, 2000. Biological control of Meloidogyne incognita on tomato and banana with rhizobacteria, Actinomycetes and Pasteuria penetrans. Nematropica, 30: 231-240.
Khan, M.R., S.M. Khan and N. Khan, 2001. Effects of soil application of certain fungal and bacterial bioagents against Meloidogyne incognita infecting chick pea. Proceedings of National congress on Centenary of Nematology in India: Appraisal and Future Plans, held at Division of Nematology, Indian Agricultural Research Institute, New Delhi from 5-7th December, 2001.
Oostendorp, M. and R.A. Sikora, 1990. In vitro interrelationship between rhizosphere bacteria and Heterodera schachtii. Revue de Nematologie, 13: 269-274.
Pandey, R. 1998. Nematode pests of medicinal and aromatic plants and their management. In: Nematode Diseases in Plants, Trivedi, P.C. (Eds), New Delhi: CBS Publishers and Distributors, p. 177-216.
Schindler, A.F. 1961. A simple substitute for a Baermann funnel. Plant Disease Reporter, 45: 747–748.
Srinivasan, N., S. Parameswaran, R.P. Sridar, C. Gopalakrishnan and P. Gnanamurthy, 2001. Bioagent of Meloidogyne incognita on turmeric. Proceedings of National congress on Centenary of Nematology in India: Appraisal and Future Plans, held at Division of Nematology, Indian Agricultural Research Institute, New Delhi from 5-7th December, 2001.
Taylor, A.L. and J.N. Sasser, 1978. Biology, Identifi cation and Control of Root-knot Nematode (Meloidogyne spp.) North Carolina State University, Raleigh, N.C., USA,111 pp.
64 Management of root-knot nematode in ashwagandha and senna using non chemicals
Table 4. Management of M. incognita in Senna (C. angustifolia) under fi eld conditionsTreatments Shoot
length (cm)
Shoot weight
(g)
Root length (cm)
Root weight
(g)
Economic yield per plant
No. of galls g-1 of root
No. of females g-1
root
No. of eggs
per egg mass
Gall index
Soil nematode population (200 cc)Leaf (g) Pod (g)
T1 - Soil application of P. fl uorescens @ 2.5 kg ha-1 58.7a 18.5a 31.7a 9.6a 223.3a 76.7a 6.3a 5.0a 230.0a 1.7a 15.0a
T2 - Soil application of T.viride @ 2.5 kg ha-1 53.2b 15.5c 28.7b 9.2ab 171.7b 73.3a 6.7a 5.0a 246.0ab 2.3b 60.0a
T3 - Combined application of P. fl uorescens + T.viride (each @ 1.25 kg ha-1)
52.2bc 16.9b 29.3b 8.7bc 176.7b 73.3a 6.0a 4.3a 170.7a 2.0ab 46.7a
T4 - Soil application of neem cake @ 1 ton ha-1 50.2c 16.7b 25.3c 8.3c 150.0c 65.0b 13.3b 12.0b 266.7bc 4.0c 168.3b
T5 - FYM with recommended dosage of fertilizers
45.2de 13.5d 24.7cd 7.2d 120.0d 65.0b 17.0bc 15.0bc 211.0de 5.0e 340.0c
T6 – Soil drenching with 4% Panchakavya
47.12d 13.5d 24.0cd 7.0d 125.0d 46.7c 18.0c 16.3cd 266.7cd 4.7de 366.7c
T7 – Foliar application of Panchakavya @ 4%
44.2e 13.0de 23.3d 6.7 e 120.0d 45.0c 18.7c 17.7cd 280.0cd 5.0e 356.6c
T8 – Application of humic acid at 1% 47.2d 13.3d 24.7cd 6.9de 121.7d 45.0c 17.0bc 16.7cd 286.7cd 4.7cd 326.6c
T9 - control 41.3f 12.3e 19.7e 6.2e 118.3d 43.3c 20.7c 19.3d 313.3e 5.0e 426.6d
Means in columns followed by the same letter are statistically not signifi cant (Duncan’s multiple range test, P=0.05)
Specimen Copy: Not for sale
Journal of Applied Horticulture, 12(1): 65-68, January-June, 2010
Studies on the suitability of cling-stone and free-stone low chilling peach cultivars for canning and other processed products
P. Aggarwal*, A.K. Bakshi and J.S. Kanwar
*Department of Food Science and Technology & Department of Horticulture, Punjab Agricultural University, Ludhiana-141004, E-mail: [email protected]
AbstractTwo cling stone peach cultivars “Shan-i-Punjab” and “Tropic Beauty” and one free stone cultivar “Florda Grande” were processed for canning (whole and halves) and beverages (squash and nectar). Fruits of Shan-i-Punjab were found to have the best characteristics for canning (as whole) and for making pulp based beverages (nectar and squash) with maximum ascorbic acid content (17 mg/100 g) and pulp yield (47.62%). Organoleptically Shan-i-Punjab fruits were found to have the highest acceptability scores i.e. 8.50 for canned peaches, 8.58 for squash and 8.38 for nectar among all the cultivars studied on a 9-point Hedonic scale judged by eight semi-trained panelists and general consumers. Florda Grande also received the higher acceptability scores (8.50) for its canned peach halves because of its tough texture. The fruits of Florda Grande were not much suitable for pulp based beverages, whereas those of Tropic Beauty were found acceptable for canning as well as for making beverages at zero time and also after six months storage.
Key words: Cling stone, peach, Shan-i-Punjab, cultivar, canning
IntroductionPeach (Prunus persica (L) Batsch.) is a popular temperate zone fruit, but with the introduction of high quality and heavy bearing low chilling peach cultivars, it has become possible to grow it in subtropical areas of Punjab, Haryana, Delhi and Western U.P. In Punjab, peach is grown over an area of 1367 hectares with the production of 20505 metric tones of fruit annually (Anonymous, 2007). In India, stone fruits are cultivated on nearly 0.31 million ha area with annual production of 2.52 million tonnes and average productivity of 8.13 tonnes/ha (2002-03). As per FAO production data 2006, peach production in India was 1.5 lakhs tonnes.
The demand for stone fruits and their processed products has increased because of rise in health concerns and nutritional awareness. The demand of these fruits is expected to improve further in near future. Peach is an excellent source of minerals like potassium, phosphorus and iron and a good source of vitamins and low calorifi c diet (Gopalan et al., 1996). Peach comes in the market for a short period of time from end of April to May and moreover the fruit is highly perishable at ambient temperature. Its palatability and utilization can be increased by processing fruit either into canned form or into different processed products. Some work has been done on canning of peaches (Aggarwal et al., 1992, Srivastava and Arora, 1994) but the studies are not available on the processing suitability of these cultivars into canned and pulp based products.
Therefore, the present investigation was carried out with the objective to fi nd out the suitability of cling stone and free stone peach varieties for canning and other processed products. Selected varieties may be propagated on a wider scale for distribution to the farmers for suffi cient production to supply processing industry and to develop some new products from peaches for domestic and export markets.
Materials and methodsPeach varieties, two cling stone “Shan-i-Punjab” and “Tropical Beauty” and one free stone “Florda Grande”, were procured from Department of Horticulture, PAU, Ludhiana and were processed into canned peaches (whole and halves) and beverages (squash and nectar).
Canning: Selected hard matured and well riped fruit of all the peach varieties weighing 20 and 25 kg each were washed under running water with gentle rubbing of the skin with hands. The fruit was lye peeled in 1% solution for 1 minute (which was pre standardized by using various concentrations of lye solution i.e. 0.5, 1.0, 1.5 and 2% for 1 and 2 minutes of boiling. After 1 minute treatment of fruit in boiling lye solution, it was immediately cooled under running water followed by a dilute acid treatment. Peeled fruits were fi lled in pre sterilized A 2-1/2 tall cans. The fruits were covered with hot syrup (40 and 50oB). Cans were steam exhausted until the temperature in the center of the cans reached 85oC and sealed immediately. Cans were boiled in water for 30 minutes and were quickly cooled after processing under running water.
Pulp: Pulp from all the peach varieties was extracted by superfi ne pulper (Raylons, India). Two extractions were made from each variety to have better pulp yield, which was stored for further use with 2000 ppm of potassium meta bisulphite. The pulp was further used for making squash and nectar.
Nectar: Sugar syrup was prepared in a stainless steel jacketed kettle. Pulp (20%) was added into the sugar syrup which was then strained through a muslin cloth. Total soluble solids were adjusted to 15o B. Acidity of nectar was adjusted to 0.32 % with the addition of citric acid. 200 mL capacity bottles were fi lled with peach nectar at the temperature of 80-82oC. Bottles were corked
Journal
Appl
Specimen Copy: Not for sale
and processed in boiling water for 20 minutes. These were then air cooled and stored at room temperature for use.
Squash: Syrup was prepared by mixing and heating sugar, acid and water. Total soluble solids were adjusted to 45oB. The mixture was fi ltered through muslin cloth. Pulp was added to the sugar syrup after cooling. Potassium meta bisulphite was added in the squash after dissolving in small amount of squash and then mixing in bigger lot. Squash was fi lled into 650 mL capacity bottles and crown corked. The following recipes were used for the preparation of squash and nectar from the pulp of all the peach varieties.Standardized recipes for peach squash and peach nectar
Sr.No.
Ingredients Quantity (Approx)
Squash Nectar1 Juice 1.00 kg 1.00 kg
2 Sugar 1.70 kg 0.65 kg
3 Water 1.25 kg 3.30 kg
4 Citric acid 41.0 g 9.00 g
5 Potassium meta bisulphite 700 ppm -
Analytical Methods: Peach pulp of all the varieties was analysed for total solids, total soluble solids, acidity, ascorbic acid, total sugars and reducing sugars (Ranganna,1994). Cut out analysis of canned peaches was done. Canned peaches, squash and nectar were analysed for their sensory parameters by a panel of eight semi-trained judges periodically on the basis of 9 point hedonic scale (Amerine et al., 1965). Sensory evaluation was also done by general consumers on a simple format. Results were analysed statistically for their interpretation using completely randomized design experiment as discussed by Cochran and Cox (1957).
Results and discussionAll the varieties i.e. Shan-i-Punjab, Florda Grande and Tropical Beauty were processed into canned and bottled products. Data regarding the various chemical and sensory parameters of the peach products are presented in Tables 1 to 5.
Canned peaches: In cut out analysis of canned peaches, external and internal conditions of the cans were found satisfactory (Table 1). No swelling and rusting was observed in any can. Vacuum in cans ranged between 10 inch to 11 inch Hg. Head space was also within permissible limits. Drained weight of the fruit ranged from 64.4 to 50 per cent, thus meeting the FPO specifi cations.
Canned whole peaches from variety Shan-i-Punjab were scored the highest for appearance (8.63) whereas peach halves from variety Florda Grande (free stone variety) were scored the highest for its texture (8.63) and taste (8.50) by a panel of eight semi-trained judges at zero time. Fruits of Shan-i-Punjab were quite
big and of bright yellow colour which was liked by most of the consumers (semi-trained panel and general consumers). After six months storage the texture of the two varieties Shan-i-Punjab and Florda Grande was found the same, and both the varieties were very much liked by the panel. A simple proforma was prepared to take the views of general consumers. Excellent remarks were received for Florda Grande and Shan-i-Punjab and good for Tropical Beauty.
Pulp: Shan-i-Punjab gave the highest percentage of pulp yield i.e. 47.62% among all the varieties (Table 3). Ascorbic acid was found to be maximum in Shan-i-Punjab i.e. 17.00 mg/100g. Florda-Grande gave the lowest pulp yield i.e. 30% because it was quite hard textured variety, which was not found much suitable for making pulp.
Squash: Squash prepared from Shan-i-Punjab had bright yellow colour whereas Florda Grande was pale yellow which caused lowering of scores for appearance (Table 4). Squash from Shan-
Table 1. Cut out analysis* of canned peaches from different varietiesVariety Can wt
(g)Drained wt (g)
Syrup wt (g)
Drained wt (%)
Syrup wt (%)
Vacuum (Hg”)
Head space (cm)
TSS (oB )
Acidity (%)
Shan-i-Punjab 986.50 561.5 309.00 64.40 35.50 11 1.20 27.2 0.50
Tropical Beauty 955.70 421.1 420.60 50.05 49.95 11 1.45 27.2 0.44
Florda Grande 961.30 421.9 467.70 50.25 49.74 10 1.40 27.2 0.37
*Average of three values.
Table 2. Effect of variety and storage on the organoleptic evaluation* of canned peaches
Variety Storage (months)
Appearance Texture Taste Overall mean
Shan-i- Punjab 0 8.63 8.50 8.38 8.503 8.50 8.38 8.25 8.386 8.38 8.38 8.25 8.34
Mean 8.50 8.42 8.29 8.41Tropical Beauty
0 7.38 7.50 7.50 7.463 7.25 7.38 7.38 7.346 7.25 7.13 7.25 7.21
Mean 7.29 7.33 7.38 7.34Florda Grande 0 8.38 8.63 8.50 8.50
3 8.50 8.50 8.38 8.466 8.25 8.38 8.25 8.29
Mean 8.38 8.50 8.38 8.42LSD (P=0.05)Varieties 0.33 0.34 0.35 0.09Storage NS NS NS 0.09*Mean values of eight panelists.
Table 3. Effect of varieties on the yield and *bio-chemical parameters of peach pulpVariety Yield
(% )TS (%)
TSS (OB)
Acidity (%)
Ascorbic acid
(mg/100g)
Total sugars
(%)
Reducing sugars
(%)Shan-i-Punjab 47.62 10.04 8.2 0.75 17.00 5.61 5.08Tropical Beauty 46.06 13.41 11.5 0.76 5.00 7.56 6.69Florda Grande 30.0 14.25 11.5 0.73 3.10 6.78 6.14* Mean of three values.
66 Studies on the suitability of low chilling peach cultivars for canning and other processed products
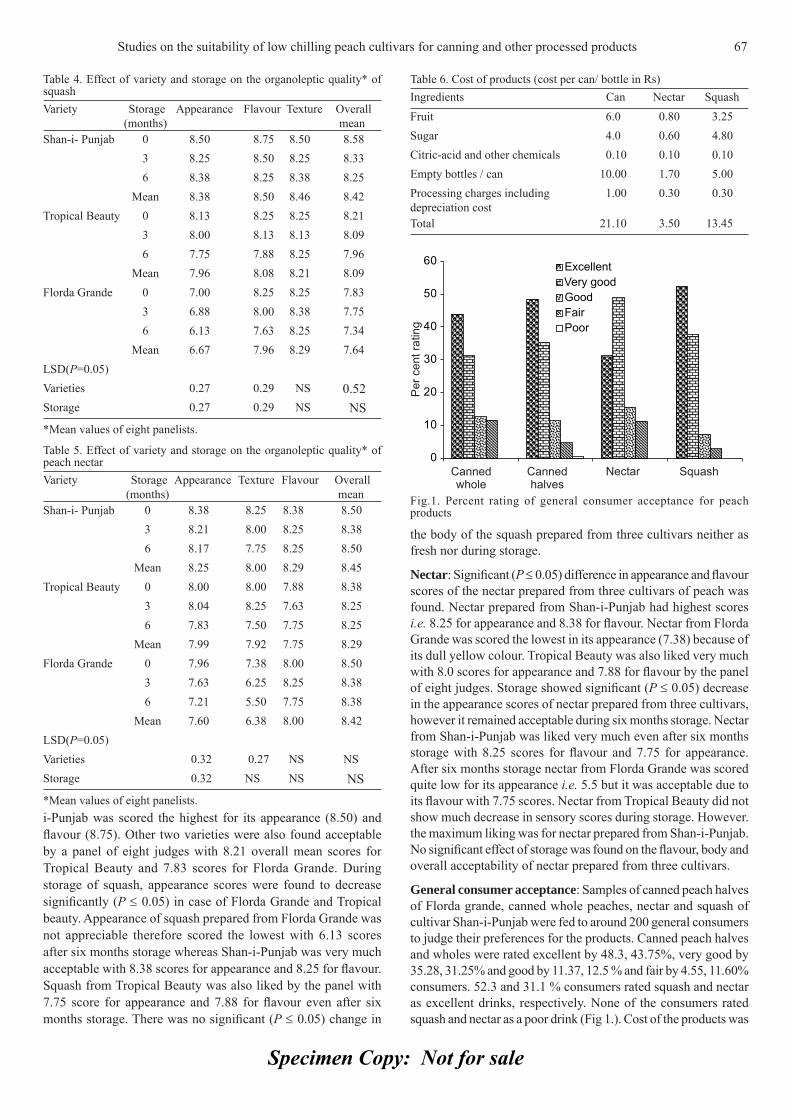
Specimen Copy: Not for sale
i-Punjab was scored the highest for its appearance (8.50) and fl avour (8.75). Other two varieties were also found acceptable by a panel of eight judges with 8.21 overall mean scores for Tropical Beauty and 7.83 scores for Florda Grande. During storage of squash, appearance scores were found to decrease signifi cantly (P ≤ 0.05) in case of Florda Grande and Tropical beauty. Appearance of squash prepared from Florda Grande was not appreciable therefore scored the lowest with 6.13 scores after six months storage whereas Shan-i-Punjab was very much acceptable with 8.38 scores for appearance and 8.25 for fl avour. Squash from Tropical Beauty was also liked by the panel with 7.75 score for appearance and 7.88 for fl avour even after six months storage. There was no signifi cant (P ≤ 0.05) change in
the body of the squash prepared from three cultivars neither as fresh nor during storage.
Nectar: Signifi cant (P ≤ 0.05) difference in appearance and fl avour scores of the nectar prepared from three cultivars of peach was found. Nectar prepared from Shan-i-Punjab had highest scores i.e. 8.25 for appearance and 8.38 for fl avour. Nectar from Florda Grande was scored the lowest in its appearance (7.38) because of its dull yellow colour. Tropical Beauty was also liked very much with 8.0 scores for appearance and 7.88 for fl avour by the panel of eight judges. Storage showed signifi cant (P ≤ 0.05) decrease in the appearance scores of nectar prepared from three cultivars, however it remained acceptable during six months storage. Nectar from Shan-i-Punjab was liked very much even after six months storage with 8.25 scores for fl avour and 7.75 for appearance. After six months storage nectar from Florda Grande was scored quite low for its appearance i.e. 5.5 but it was acceptable due to its fl avour with 7.75 scores. Nectar from Tropical Beauty did not show much decrease in sensory scores during storage. However. the maximum liking was for nectar prepared from Shan-i-Punjab. No signifi cant effect of storage was found on the fl avour, body and overall acceptability of nectar prepared from three cultivars.
General consumer acceptance: Samples of canned peach halves of Florda grande, canned whole peaches, nectar and squash of cultivar Shan-i-Punjab were fed to around 200 general consumers to judge their preferences for the products. Canned peach halves and wholes were rated excellent by 48.3, 43.75%, very good by 35.28, 31.25% and good by 11.37, 12.5 % and fair by 4.55, 11.60% consumers. 52.3 and 31.1 % consumers rated squash and nectar as excellent drinks, respectively. None of the consumers rated squash and nectar as a poor drink (Fig 1.). Cost of the products was
Table 4. Effect of variety and storage on the organoleptic quality* of squashVariety Storage
(months) Appearance Flavour Texture Overall
meanShan-i- Punjab 0 8.50 8.75 8.50 8.58
3 8.25 8.50 8.25 8.336 8.38 8.25 8.38 8.25
Mean 8.38 8.50 8.46 8.42Tropical Beauty 0 8.13 8.25 8.25 8.21
3 8.00 8.13 8.13 8.096 7.75 7.88 8.25 7.96
Mean 7.96 8.08 8.21 8.09Florda Grande 0 7.00 8.25 8.25 7.83
3 6.88 8.00 8.38 7.756 6.13 7.63 8.25 7.34
Mean 6.67 7.96 8.29 7.64LSD(P=0.05)Varieties 0.27 0.29 NS 0.52Storage 0.27 0.29 NS NS*Mean values of eight panelists.
Table 5. Effect of variety and storage on the organoleptic quality* of peach nectarVariety Storage
(months) Appearance Texture Flavour Overall
meanShan-i- Punjab 0 8.38 8.25 8.38 8.50
3 8.21 8.00 8.25 8.386 8.17 7.75 8.25 8.50
Mean 8.25 8.00 8.29 8.45Tropical Beauty 0 8.00 8.00 7.88 8.38
3 8.04 8.25 7.63 8.256 7.83 7.50 7.75 8.25
Mean 7.99 7.92 7.75 8.29Florda Grande 0 7.96 7.38 8.00 8.50
3 7.63 6.25 8.25 8.386 7.21 5.50 7.75 8.38
Mean 7.60 6.38 8.00 8.42LSD(P=0.05)Varieties 0.32 0.27 NS NSStorage 0.32 NS NS NS*Mean values of eight panelists.
Table 6. Cost of products (cost per can/ bottle in Rs)Ingredients Can Nectar SquashFruit 6.0 0.80 3.25Sugar 4.0 0.60 4.80Citric-acid and other chemicals 0.10 0.10 0.10Empty bottles / can 10.00 1.70 5.00Processing charges including depreciation cost
1.00 0.30 0.30
Total 21.10 3.50 13.45
Fig.1. Percent rating of general consumer acceptance for peach products
Studies on the suitability of low chilling peach cultivars for canning and other processed products 67
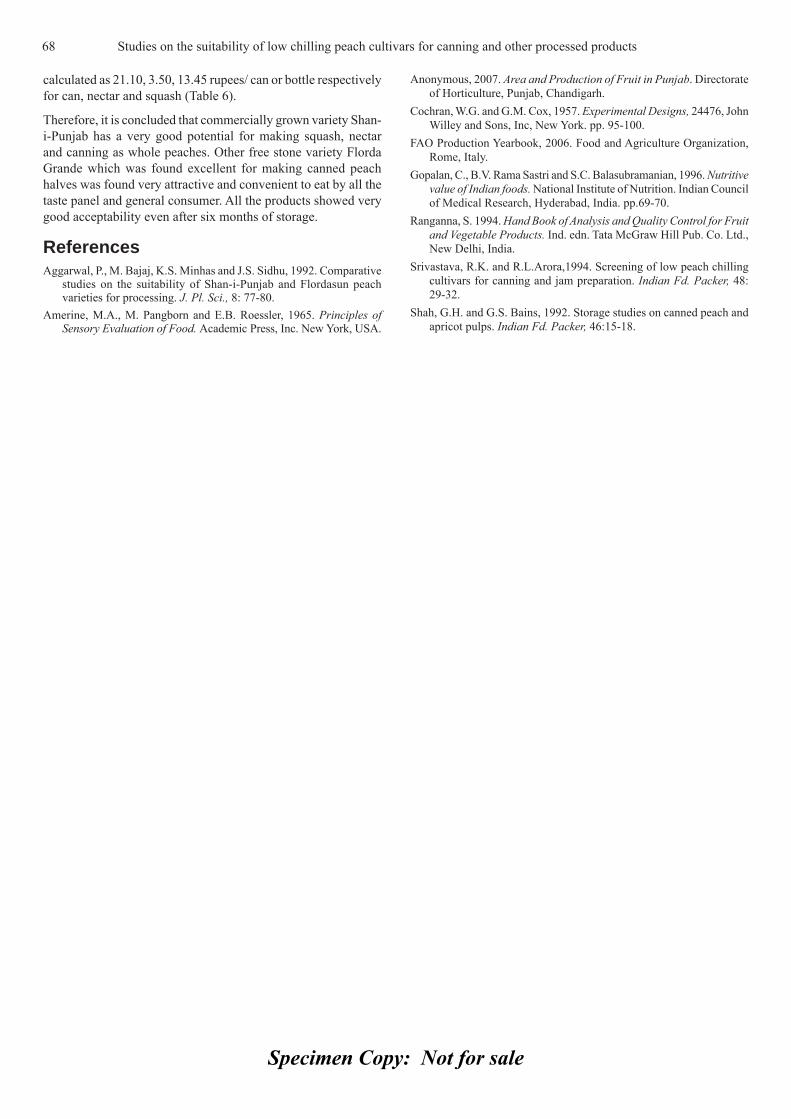
Specimen Copy: Not for sale
calculated as 21.10, 3.50, 13.45 rupees/ can or bottle respectively for can, nectar and squash (Table 6).
Therefore, it is concluded that commercially grown variety Shan-i-Punjab has a very good potential for making squash, nectar and canning as whole peaches. Other free stone variety Florda Grande which was found excellent for making canned peach halves was found very attractive and convenient to eat by all the taste panel and general consumer. All the products showed very good acceptability even after six months of storage.
ReferencesAggarwal, P., M. Bajaj, K.S. Minhas and J.S. Sidhu, 1992. Comparative
studies on the suitability of Shan-i-Punjab and Flordasun peach varieties for processing. J. Pl. Sci., 8: 77-80.
Amerine, M.A., M. Pangborn and E.B. Roessler, 1965. Principles of Sensory Evaluation of Food. Academic Press, Inc. New York, USA.
Anonymous, 2007. Area and Production of Fruit in Punjab. Directorate of Horticulture, Punjab, Chandigarh.
Cochran, W.G. and G.M. Cox, 1957. Experimental Designs, 24476, John Willey and Sons, Inc, New York. pp. 95-100.
FAO Production Yearbook, 2006. Food and Agriculture Organization, Rome, Italy.
Gopalan, C., B.V. Rama Sastri and S.C. Balasubramanian, 1996. Nutritive value of Indian foods. National Institute of Nutrition. Indian Council of Medical Research, Hyderabad, India. pp.69-70.
Ranganna, S. 1994. Hand Book of Analysis and Quality Control for Fruit and Vegetable Products. Ind. edn. Tata McGraw Hill Pub. Co. Ltd., New Delhi, India.
Srivastava, R.K. and R.L.Arora,1994. Screening of low peach chilling cultivars for canning and jam preparation. Indian Fd. Packer, 48: 29-32.
Shah, G.H. and G.S. Bains, 1992. Storage studies on canned peach and apricot pulps. Indian Fd. Packer, 46:15-18.
68 Studies on the suitability of low chilling peach cultivars for canning and other processed products
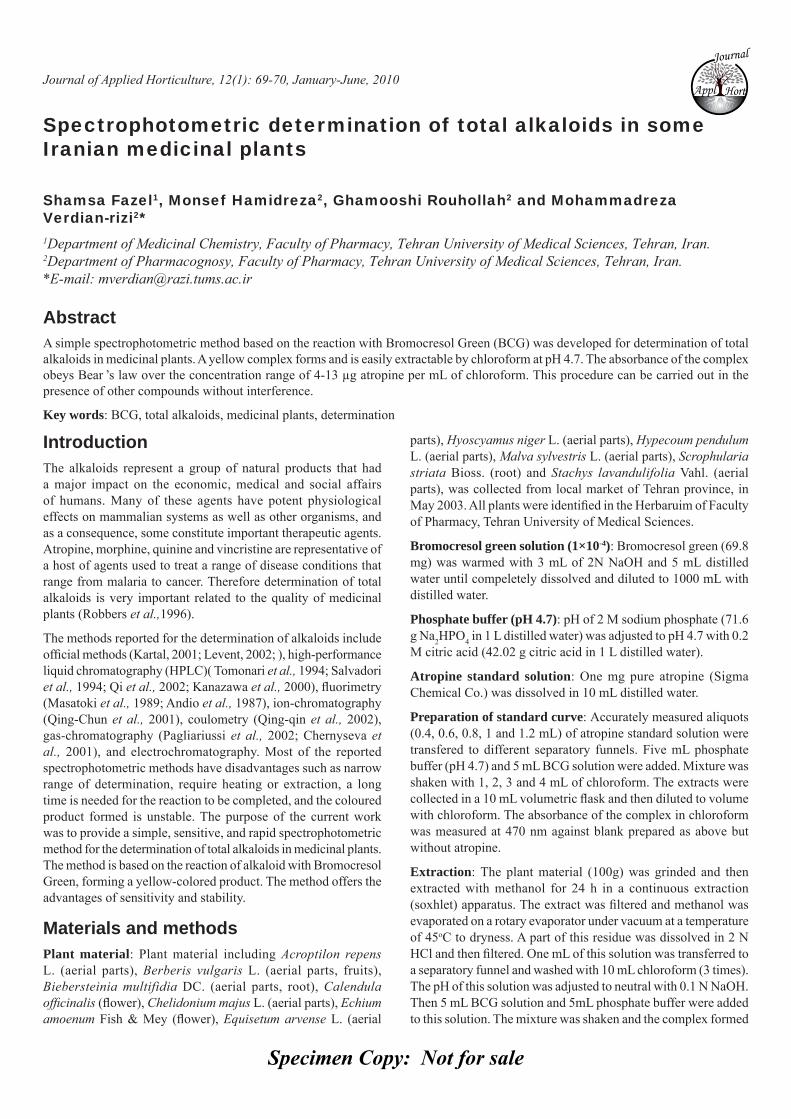
Specimen Copy: Not for sale
Journal of Applied Horticulture, 12(1): 69-70, January-June, 2010
Spectrophotometric determination of total alkaloids in some Iranian medicinal plants
Shamsa Fazel1, Monsef Hamidreza2, Ghamooshi Rouhollah2 and Mohammadreza Verdian-rizi2*1Department of Medicinal Chemistry, Faculty of Pharmacy, Tehran University of Medical Sciences, Tehran, Iran. 2Department of Pharmacognosy, Faculty of Pharmacy, Tehran University of Medical Sciences, Tehran, Iran. *E-mail: [email protected]
AbstractA simple spectrophotometric method based on the reaction with Bromocresol Green (BCG) was developed for determination of total alkaloids in medicinal plants. A yellow complex forms and is easily extractable by chloroform at pH 4.7. The absorbance of the complex obeys Bear ’s law over the concentration range of 4-13 μg atropine per mL of chloroform. This procedure can be carried out in the presence of other compounds without interference.
Key words: BCG, total alkaloids, medicinal plants, determination
IntroductionThe alkaloids represent a group of natural products that had a major impact on the economic, medical and social affairs of humans. Many of these agents have potent physiological effects on mammalian systems as well as other organisms, and as a consequence, some constitute important therapeutic agents. Atropine, morphine, quinine and vincristine are representative of a host of agents used to treat a range of disease conditions that range from malaria to cancer. Therefore determination of total alkaloids is very important related to the quality of medicinal plants (Robbers et al.,1996).
The methods reported for the determination of alkaloids include offi cial methods (Kartal, 2001; Levent, 2002; ), high-performance liquid chromatography (HPLC)( Tomonari et al., 1994; Salvadori et al., 1994; Qi et al., 2002; Kanazawa et al., 2000), fl uorimetry (Masatoki et al., 1989; Andio et al., 1987), ion-chromatography (Qing-Chun et al., 2001), coulometry (Qing-qin et al., 2002), gas-chromatography (Pagliariussi et al., 2002; Chernyseva et al., 2001), and electrochromatography. Most of the reported spectrophotometric methods have disadvantages such as narrow range of determination, require heating or extraction, a long time is needed for the reaction to be completed, and the coloured product formed is unstable. The purpose of the current work was to provide a simple, sensitive, and rapid spectrophotometric method for the determination of total alkaloids in medicinal plants. The method is based on the reaction of alkaloid with Bromocresol Green, forming a yellow-colored product. The method offers the advantages of sensitivity and stability.
Materials and methods Plant material: Plant material including Acroptilon repens L. (aerial parts), Berberis vulgaris L. (aerial parts, fruits), Biebersteinia multifidia DC. (aerial parts, root), Calendula offi cinalis (fl ower), Chelidonium majus L. (aerial parts), Echium amoenum Fish & Mey (fl ower), Equisetum arvense L. (aerial
parts), Hyoscyamus niger L. (aerial parts), Hypecoum pendulum L. (aerial parts), Malva sylvestris L. (aerial parts), Scrophularia striata Bioss. (root) and Stachys lavandulifolia Vahl. (aerial parts), was collected from local market of Tehran province, in May 2003. All plants were identifi ed in the Herbaruim of Faculty of Pharmacy, Tehran University of Medical Sciences.
Bromocresol green solution (1×10⁻⁴): Bromocresol green (69.8 mg) was warmed with 3 mL of 2N NaOH and 5 mL distilled water until compeletely dissolved and diluted to 1000 mL with distilled water.
Phosphate buffer (pH 4.7): pH of 2 M sodium phosphate (71.6 g Na2HPO4 in 1 L distilled water) was adjusted to pH 4.7 with 0.2 M citric acid (42.02 g citric acid in 1 L distilled water).
Atropine standard solution: One mg pure atropine (Sigma Chemical Co.) was dissolved in 10 mL distilled water.
Preparation of standard curve: Accurately measured aliquots (0.4, 0.6, 0.8, 1 and 1.2 mL) of atropine standard solution were transfered to different separatory funnels. Five mL phosphate buffer (pH 4.7) and 5 mL BCG solution were added. Mixture was shaken with 1, 2, 3 and 4 mL of chloroform. The extracts were collected in a 10 mL volumetric fl ask and then diluted to volume with chloroform. The absorbance of the complex in chloroform was measured at 470 nm against blank prepared as above but without atropine.
Extraction: The plant material (100g) was grinded and then extracted with methanol for 24 h in a continuous extraction (soxhlet) apparatus. The extract was fi ltered and methanol was evaporated on a rotary evaporator under vacuum at a temperature of 45oC to dryness. A part of this residue was dissolved in 2 N HCl and then fi ltered. One mL of this solution was transferred to a separatory funnel and washed with 10 mL chloroform (3 times). The pH of this solution was adjusted to neutral with 0.1 N NaOH. Then 5 mL BCG solution and 5mL phosphate buffer were added to this solution. The mixture was shaken and the complex formed
Journal
Appl
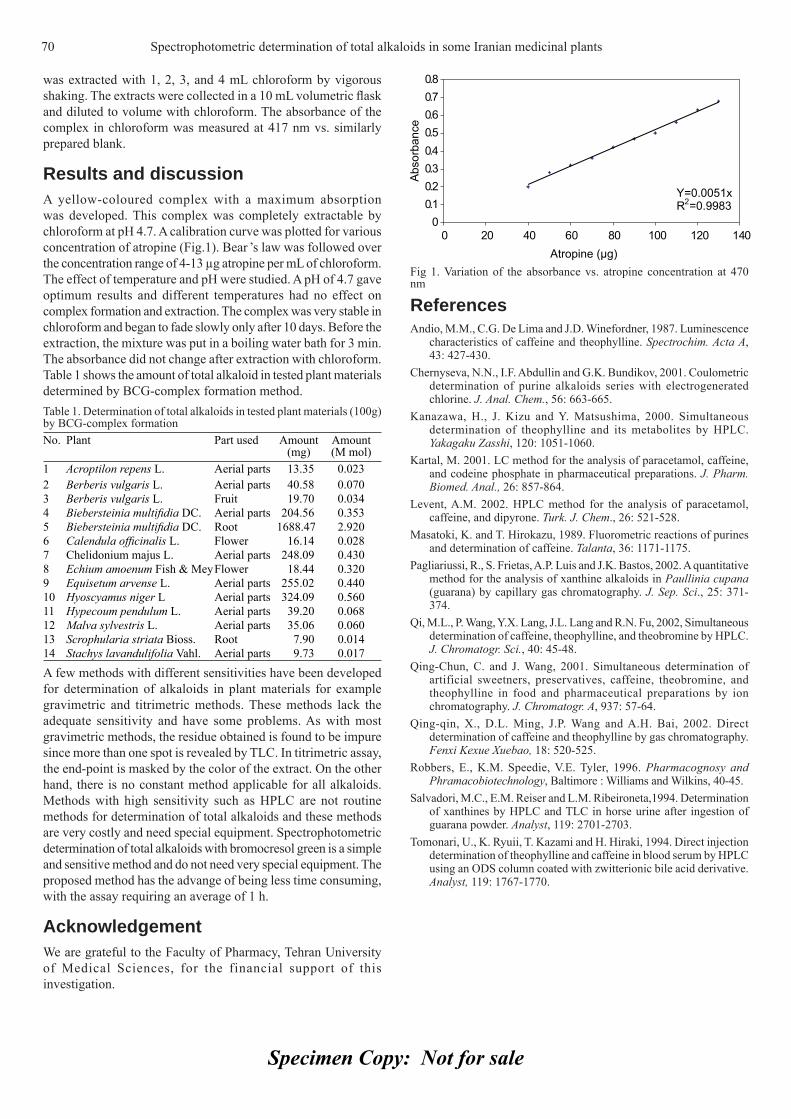
Specimen Copy: Not for sale
was extracted with 1, 2, 3, and 4 mL chloroform by vigorous shaking. The extracts were collected in a 10 mL volumetric fl ask and diluted to volume with chloroform. The absorbance of the complex in chloroform was measured at 417 nm vs. similarly prepared blank.
Results and discussionA yellow-coloured complex with a maximum absorption was developed. This complex was completely extractable by chloroform at pH 4.7. A calibration curve was plotted for various concentration of atropine (Fig.1). Bear ’s law was followed over the concentration range of 4-13 μg atropine per mL of chloroform. The effect of temperature and pH were studied. A pH of 4.7 gave optimum results and different temperatures had no effect on complex formation and extraction. The complex was very stable in chloroform and began to fade slowly only after 10 days. Before the extraction, the mixture was put in a boiling water bath for 3 min. The absorbance did not change after extraction with chloroform. Table 1 shows the amount of total alkaloid in tested plant materials determined by BCG-complex formation method.Table 1. Determination of total alkaloids in tested plant materials (100g) by BCG-complex formationNo. Plant Part used Amount
(mg)Amount (M mol)
1 Acroptilon repens L. Aerial parts 13.35 0.0232 Berberis vulgaris L. Aerial parts 40.58 0.0703 Berberis vulgaris L. Fruit 19.70 0.0344 Biebersteinia multifi dia DC. Aerial parts 204.56 0.3535 Biebersteinia multifi dia DC. Root 1688.47 2.9206 Calendula offi cinalis L. Flower 16.14 0.0287 Chelidonium majus L. Aerial parts 248.09 0.4308 Echium amoenum Fish & MeyFlower 18.44 0.3209 Equisetum arvense L. Aerial parts 255.02 0.44010 Hyoscyamus niger L Aerial parts 324.09 0.56011 Hypecoum pendulum L. Aerial parts 39.20 0.06812 Malva sylvestris L. Aerial parts 35.06 0.06013 Scrophularia striata Bioss. Root 7.90 0.01414 Stachys lavandulifolia Vahl. Aerial parts 9.73 0.017
A few methods with different sensitivities have been developed for determination of alkaloids in plant materials for example gravimetric and titrimetric methods. These methods lack the adequate sensitivity and have some problems. As with most gravimetric methods, the residue obtained is found to be impure since more than one spot is revealed by TLC. In titrimetric assay, the end-point is masked by the color of the extract. On the other hand, there is no constant method applicable for all alkaloids. Methods with high sensitivity such as HPLC are not routine methods for determination of total alkaloids and these methods are very costly and need special equipment. Spectrophotometric determination of total alkaloids with bromocresol green is a simple and sensitive method and do not need very special equipment. The proposed method has the advange of being less time consuming, with the assay requiring an average of 1 h.
Acknowledgement We are grateful to the Faculty of Pharmacy, Tehran University of Medical Sciences, for the financial support of this investigation.
ReferencesAndio, M.M., C.G. De Lima and J.D. Winefordner, 1987. Luminescence
characteristics of caffeine and theophylline. Spectrochim. Acta A, 43: 427-430.
Chernyseva, N.N., I.F. Abdullin and G.K. Bundikov, 2001. Coulometric determination of purine alkaloids series with electrogenerated chlorine. J. Anal. Chem., 56: 663-665.
Kanazawa, H., J. Kizu and Y. Matsushima, 2000. Simultaneous determination of theophylline and its metabolites by HPLC. Yakagaku Zasshi, 120: 1051-1060.
Kartal, M. 2001. LC method for the analysis of paracetamol, caffeine, and codeine phosphate in pharmaceutical preparations. J. Pharm. Biomed. Anal., 26: 857-864.
Levent, A.M. 2002. HPLC method for the analysis of paracetamol, caffeine, and dipyrone. Turk. J. Chem., 26: 521-528.
Masatoki, K. and T. Hirokazu, 1989. Fluorometric reactions of purines and determination of caffeine. Talanta, 36: 1171-1175.
Pagliariussi, R., S. Frietas, A.P. Luis and J.K. Bastos, 2002. A quantitative method for the analysis of xanthine alkaloids in Paullinia cupana (guarana) by capillary gas chromatography. J. Sep. Sci., 25: 371-374.
Qi, M.L., P. Wang, Y.X. Lang, J.L. Lang and R.N. Fu, 2002, Simultaneous determination of caffeine, theophylline, and theobromine by HPLC. J. Chromatogr. Sci., 40: 45-48.
Qing-Chun, C. and J. Wang, 2001. Simultaneous determination of artificial sweetners, preservatives, caffeine, theobromine, and theophylline in food and pharmaceutical preparations by ion chromatography. J. Chromatogr. A, 937: 57-64.
Qing-qin, X., D.L. Ming, J.P. Wang and A.H. Bai, 2002. Direct determination of caffeine and theophylline by gas chromatography. Fenxi Kexue Xuebao, 18: 520-525.
Robbers, E., K.M. Speedie, V.E. Tyler, 1996. Pharmacognosy and Phramacobiotechnology, Baltimore : Williams and Wilkins, 40-45.
Salvadori, M.C., E.M. Reiser and L.M. Ribeironeta,1994. Determination of xanthines by HPLC and TLC in horse urine after ingestion of guarana powder. Analyst, 119: 2701-2703.
Tomonari, U., K. Ryuii, T. Kazami and H. Hiraki, 1994. Direct injection determination of theophylline and caffeine in blood serum by HPLC using an ODS column coated with zwitterionic bile acid derivative. Analyst, 119: 1767-1770.
Fig 1. Variation of the absorbance vs. atropine concentration at 470 nm
70 Spectrophotometric determination of total alkaloids in some Iranian medicinal plants
Specimen Copy: Not for sale
Journal of Applied Horticulture, 12(1): 71-74, January-June, 2010
Characterisation of promising okra genotypes on the basis of Principal Component Analysis
R.K. Sharma1 and K. Prasad2*1S.C.I. India Ltd., Bhagalpur - 812001, Bihar. 2Department of Food Engineering and Technology, SLIET, Longowal – 148 106, Punjab. *E-mail: [email protected]
AbstractTwenty selected genetically diverse okra strains were evaluated using Principal Component and cluster analysis for the extent of variability and relationship between various economically important traits for the purpose of genetic improvement. The trial was laid out in a randomized block design (RBD). Positive signifi cant correlation for days to 50% fl owering (DF) with days to fi rst harvest (DFH), number of pod per plant (NP) with pod yield per plant (PY) and pod yield per plot (PYP) (P≤0.001) and PY with PYP (P≤0.001) and negative correlation was observed for pod weight (PW) with NP (P≤0.01). The analysis of extracted components, component pattern and Eigen values revealed that the fi rst two principal components alone accounted for 53.25% of variance. First component was found heavily loaded with days to 50% fl owering (DF), days to fi rst harvest (DFH), pod length (PL), pod diameter (PD) and pod weight (PW), which comprised of fourteen genotypes in three clusters. The matrix obtained from principal component analysis revealed that the genotype Pb- 57 and HRB-9-2 found their positions in same cluster in principal space. Dominating similar prominent phenotypic characters formed separate place in principal space as coherent cluster. Cluster based inter breeding of genotypes would exhibit high hetrosis and is also likely to produce new recombinants with desired characters in okra.
Key words: Okra, Abelmoschus esculentus, correlation, variance, principal component.
Introduction Okra [Abelmoschus esculentus (L.) Moench] is one of the oldest cultivated vegetable crops. Abelmoschus genus contains about 150 known species with esculentus as the species of okra (Thompson and Kelly, 1957), also known as lady’s fi nger or gumbo in England (Tindall, 1986) and bhindi in India, is believed to be native to tropical Africa and belongs to family Malvaceae. It is grown in all parts of the tropics during spring, summer and rainy season as kharif crop (Baloch, 1994). It is available all year-round, with a peak season during the summer months (Anon., 2003).
The crop is highly nutritious and also considered as power house of valuable nutrients. This vegetable provides protein, carbohydrate and an important input of vitamins and mineral salts, including calcium; which are often lacking in diet of developing countries. The young tender pods of okra are used in different ways; as boiled vegetables (Magness et al., 1971), fresh, canned, frozen or dried and used as soup thickeners (Tindall, 1986) or cooked in curries, stewed and used in soups. Considerably high quantity of both soluble and insoluble fi bre is present in okra. Nearly half of which is soluble fi bre in the form of gums and pectin, which helps in lowering the serum cholesterol and thus reducing the risk of coronary heart diseases. The other half is insoluble fi bre, which helps to keep the intestinal tract healthy (Jeff, 2002) and prevent the symptom of irritable bowel syndrome (IBS). The mucilaginous extract of okra is often used for clearing the cane juice from which jaggary or brown sugar is manufactured (Prasad and Nath, 2002). The stem of plant provides non digestible strong linear fi ber, which fi nds uses in the paper, packaging and textile industries (Baloch, 1994).
Stability with consistent performance under predictable and unpredictable environment is the main concern in screening
of phenotypically stable genotypes. Large variations among important traits are desirable. To improve particular attribute including yield characteristic information on genetic variability and inter-relationship among different traits is necessary as improvement is proportional to its magnitude of genetic variability present in the germplasm. Genetic diversity is one of the important tools to qualify genetic variability in both cross- and self-pollinated crops (Murty and Arunachalam, 1966; Gaur et al.,1978). Therefore, the present study was undertaken to analyze the genetic divergence in 20 okra genotypes, based on multivariate approach, which is not possible through univariate analysis. The aim was also to fi nd out the characteristic pattern prevailed so as to get divergence information that may be useful for the varietal improvement.
Materials and methodsIn pursuance of the envisaged objectives, the present study was carried out with twenty okra genotypes collected from different agro climatic regions of India. Seeds of selected genotypes were planted in randomized block design at three different sowing time scattered uniformly of twenty days interval during the kharif season starting from mid June with three replications. Standard techniques were adopted in data collection for 5 competitive plants in each genotypes on 10 characters viz., plant height (PH), number of branches per plant (NB), days to 50% fl owering (DF), days to fi rst harvest (DFH), number of pods per plant (NP), pod length (PL), pod diameter (PD), pod weight (PW), pod yield per plant (PY) and pod yield per plot (PYP).
The data on various genotypes of okra under kharif season was processed using MINITAB v 13.2 and SPSS v 11.0 for multivariate analysis and Microsoft Excel v 2000 for descriptive statistics. The
Journal
Appl
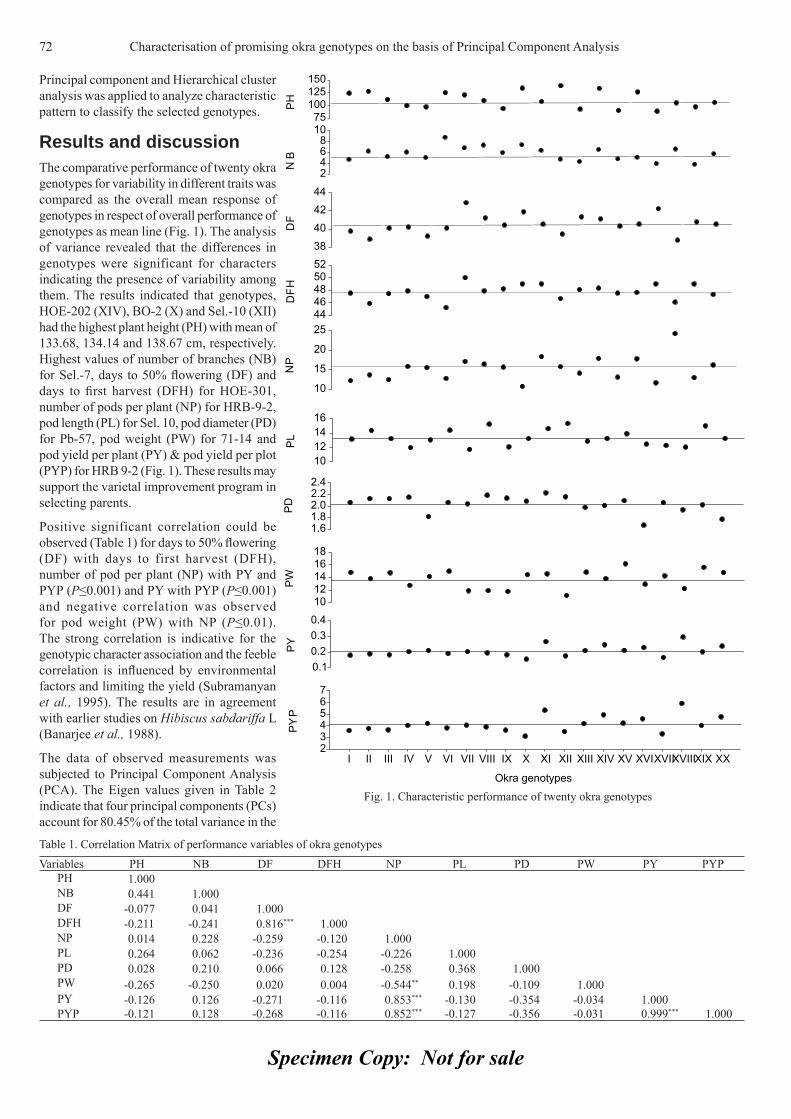
Specimen Copy: Not for sale
Principal component and Hierarchical cluster analysis was applied to analyze characteristic pattern to classify the selected genotypes.
Results and discussionThe comparative performance of twenty okra genotypes for variability in different traits was compared as the overall mean response of genotypes in respect of overall performance of genotypes as mean line (Fig. 1). The analysis of variance revealed that the differences in genotypes were significant for characters indicating the presence of variability among them. The results indicated that genotypes, HOE-202 (XIV), BO-2 (X) and Sel.-10 (XII) had the highest plant height (PH) with mean of 133.68, 134.14 and 138.67 cm, respectively. Highest values of number of branches (NB) for Sel.-7, days to 50% fl owering (DF) and days to fi rst harvest (DFH) for HOE-301, number of pods per plant (NP) for HRB-9-2, pod length (PL) for Sel. 10, pod diameter (PD) for Pb-57, pod weight (PW) for 71-14 and pod yield per plant (PY) & pod yield per plot (PYP) for HRB 9-2 (Fig. 1). These results may support the varietal improvement program in selecting parents.
Positive significant correlation could be observed (Table 1) for days to 50% fl owering (DF) with days to first harvest (DFH), number of pod per plant (NP) with PY and PYP (P≤0.001) and PY with PYP (P≤0.001) and negative correlation was observed for pod weight (PW) with NP (P≤0.01). The strong correlation is indicative for the genotypic character association and the feeble correlation is infl uenced by environmental factors and limiting the yield (Subramanyan et al., 1995). The results are in agreement with earlier studies on Hibiscus sabdariffa L (Banarjee et al., 1988).
The data of observed measurements was subjected to Principal Component Analysis (PCA). The Eigen values given in Table 2 indicate that four principal components (PCs) account for 80.45% of the total variance in the
Table 1. Correlation Matrix of performance variables of okra genotypes
Variables PH NB DF DFH NP PL PD PW PY PYPPH 1.000NB 0.441 1.000DF -0.077 0.041 1.000DFH -0.211 -0.241 0.816*** 1.000NP 0.014 0.228 -0.259 -0.120 1.000PL 0.264 0.062 -0.236 -0.254 -0.226 1.000PD 0.028 0.210 0.066 0.128 -0.258 0.368 1.000PW -0.265 -0.250 0.020 0.004 -0.544** 0.198 -0.109 1.000PY -0.126 0.126 -0.271 -0.116 0.853*** -0.130 -0.354 -0.034 1.000PYP -0.121 0.128 -0.268 -0.116 0.852*** -0.127 -0.356 -0.031 0.999*** 1.000
Fig. 1. Characteristic performance of twenty okra genotypes
72 Characterisation of promising okra genotypes on the basis of Principal Component Analysis
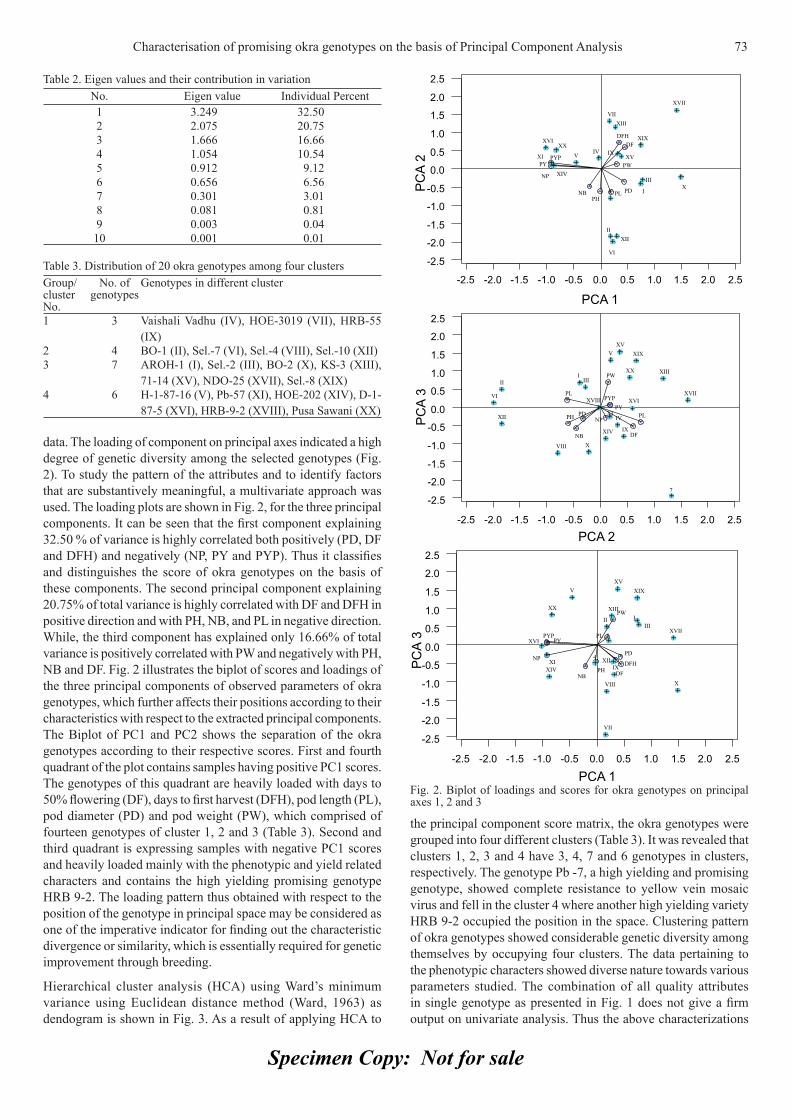
Specimen Copy: Not for sale
data. The loading of component on principal axes indicated a high degree of genetic diversity among the selected genotypes (Fig. 2). To study the pattern of the attributes and to identify factors that are substantively meaningful, a multivariate approach was used. The loading plots are shown in Fig. 2, for the three principal components. It can be seen that the fi rst component explaining 32.50 % of variance is highly correlated both positively (PD, DF and DFH) and negatively (NP, PY and PYP). Thus it classifi es and distinguishes the score of okra genotypes on the basis of these components. The second principal component explaining 20.75% of total variance is highly correlated with DF and DFH in positive direction and with PH, NB, and PL in negative direction. While, the third component has explained only 16.66% of total variance is positively correlated with PW and negatively with PH, NB and DF. Fig. 2 illustrates the biplot of scores and loadings of the three principal components of observed parameters of okra genotypes, which further affects their positions according to their characteristics with respect to the extracted principal components. The Biplot of PC1 and PC2 shows the separation of the okra genotypes according to their respective scores. First and fourth quadrant of the plot contains samples having positive PC1 scores. The genotypes of this quadrant are heavily loaded with days to 50% fl owering (DF), days to fi rst harvest (DFH), pod length (PL), pod diameter (PD) and pod weight (PW), which comprised of fourteen genotypes of cluster 1, 2 and 3 (Table 3). Second and third quadrant is expressing samples with negative PC1 scores and heavily loaded mainly with the phenotypic and yield related characters and contains the high yielding promising genotype HRB 9-2. The loading pattern thus obtained with respect to the position of the genotype in principal space may be considered as one of the imperative indicator for fi nding out the characteristic divergence or similarity, which is essentially required for genetic improvement through breeding.
Hierarchical cluster analysis (HCA) using Ward’s minimum variance using Euclidean distance method (Ward, 1963) as dendogram is shown in Fig. 3. As a result of applying HCA to
the principal component score matrix, the okra genotypes were grouped into four different clusters (Table 3). It was revealed that clusters 1, 2, 3 and 4 have 3, 4, 7 and 6 genotypes in clusters, respectively. The genotype Pb -7, a high yielding and promising genotype, showed complete resistance to yellow vein mosaic virus and fell in the cluster 4 where another high yielding variety HRB 9-2 occupied the position in the space. Clustering pattern of okra genotypes showed considerable genetic diversity among themselves by occupying four clusters. The data pertaining to the phenotypic characters showed diverse nature towards various parameters studied. The combination of all quality attributes in single genotype as presented in Fig. 1 does not give a fi rm output on univariate analysis. Thus the above characterizations
Table 2. Eigen values and their contribution in variationNo. Eigen value Individual Percent1 3.249 32.502 2.075 20.753 1.666 16.664 1.054 10.545 0.912 9.126 0.656 6.567 0.301 3.018 0.081 0.819 0.003 0.0410 0.001 0.01
Table 3. Distribution of 20 okra genotypes among four clustersGroup/cluster No.
No. of genotypes
Genotypes in different cluster
1 3 Vaishali Vadhu (IV), HOE-3019 (VII), HRB-55 (IX)
2 4 BO-1 (II), Sel.-7 (VI), Sel.-4 (VIII), Sel.-10 (XII)3 7 AROH-1 (I), Sel.-2 (III), BO-2 (X), KS-3 (XIII),
71-14 (XV), NDO-25 (XVII), Sel.-8 (XIX)4 6 H-1-87-16 (V), Pb-57 (XI), HOE-202 (XIV), D-1-
87-5 (XVI), HRB-9-2 (XVIII), Pusa Sawani (XX)
Fig. 2. Biplot of loadings and scores for okra genotypes on principal axes 1, 2 and 3
Characterisation of promising okra genotypes on the basis of Principal Component Analysis 73
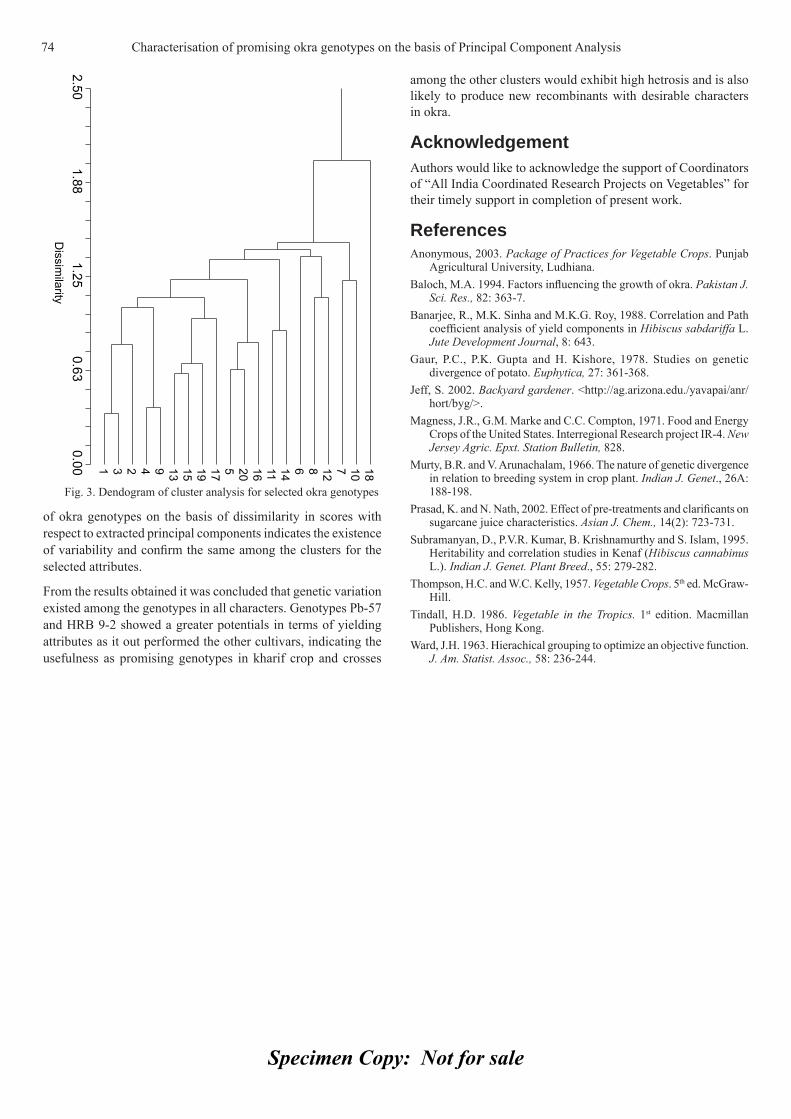
Specimen Copy: Not for sale
of okra genotypes on the basis of dissimilarity in scores with respect to extracted principal components indicates the existence of variability and confi rm the same among the clusters for the selected attributes.
From the results obtained it was concluded that genetic variation existed among the genotypes in all characters. Genotypes Pb-57 and HRB 9-2 showed a greater potentials in terms of yielding attributes as it out performed the other cultivars, indicating the usefulness as promising genotypes in kharif crop and crosses
among the other clusters would exhibit high hetrosis and is also likely to produce new recombinants with desirable characters in okra.
AcknowledgementAuthors would like to acknowledge the support of Coordinators of “All India Coordinated Research Projects on Vegetables” for their timely support in completion of present work.
References Anonymous, 2003. Package of Practices for Vegetable Crops. Punjab
Agricultural University, Ludhiana.Baloch, M.A. 1994. Factors infl uencing the growth of okra. Pakistan J.
Sci. Res., 82: 363-7.Banarjee, R., M.K. Sinha and M.K.G. Roy, 1988. Correlation and Path
coeffi cient analysis of yield components in Hibiscus sabdariffa L. Jute Development Journal, 8: 643.
Gaur, P.C., P.K. Gupta and H. Kishore, 1978. Studies on genetic divergence of potato. Euphytica, 27: 361-368.
Jeff, S. 2002. Backyard gardener. <http://ag.arizona.edu./yavapai/anr/hort/byg/>.
Magness, J.R., G.M. Marke and C.C. Compton, 1971. Food and Energy Crops of the United States. Interregional Research project IR-4. New Jersey Agric. Epxt. Station Bulletin, 828.
Murty, B.R. and V. Arunachalam, 1966. The nature of genetic divergence in relation to breeding system in crop plant. Indian J. Genet., 26A: 188-198.
Prasad, K. and N. Nath, 2002. Effect of pre-treatments and clarifi cants on sugarcane juice characteristics. Asian J. Chem., 14(2): 723-731.
Subramanyan, D., P.V.R. Kumar, B. Krishnamurthy and S. Islam, 1995. Heritability and correlation studies in Kenaf (Hibiscus cannabinus L.). Indian J. Genet. Plant Breed., 55: 279-282.
Thompson, H.C. and W.C. Kelly, 1957. Vegetable Crops. 5th ed. McGraw-Hill.
Tindall, H.D. 1986. Vegetable in the Tropics. 1st edition. Macmillan Publishers, Hong Kong.
Ward, J.H. 1963. Hierachical grouping to optimize an objective function. J. Am. Statist. Assoc., 58: 236-244.
Fig. 3. Dendogram of cluster analysis for selected okra genotypes
74 Characterisation of promising okra genotypes on the basis of Principal Component Analysis
Specimen Copy: Not for sale
Journal of Applied Horticulture, 12(1): 75-80, January-June, 2010
Effi cacy of some essential oils on controlling powdery mildew on zinnia (Zinnia elegans L.)
M.A. Hegazi* and G.A.N. El-Kot1
Department of Horticulture (Floriculture),1Department of Agriculture Botany (Phytopathology), Faculty of Agriculture, Kafr El-Sheikh University, Kafr el-Sheikh, Egypt. *E-mail: [email protected]
AbstractA fi eld experiment was carried out during two successive seasons at the Experimental Farm of the Faculty of Agriculture, Kafr El- Sheikh University to evaluate some essential oils as biocontrol agents for powdery mildew on Zinnia elegans, L. Marjoram, clove, cinnamon, garlic, ginger and fennel oil were used as a foliar spray at 2 levels (250 and 500 ppm) beside Kema zein 75% and distilled water as a control. The plants were sprayed four times beginning from June 15th with one week interval by a hand atomizer as soon as the fi rst sign of powdery mildew detected on plants. Disease incidence and severity as well as vegetative parameters such as plant height, number of branches per plant, leaf area, fresh and dry weights of shoots, root length and fresh and dry weights of roots were determined in the two seasons. Peroxidase and polyphenol oxidase activities were determined after 24 hour from the last spray in leaves samples. The highest signifi cant decrease in disease incidence and severity and the best results for most of the studied growth and fl owering parameters and total green colour were recorded when plants were sprayed with ginger, cinnamon and clove oils, respectively each at 500 ppm compared to the other treatments in both seasons. In addition, the activities of peroxidase (POX) and polyphenol oxidase (PPO) enzymes increased as a result of oil spray on plants. In conclusion, these fi ndings provide a rational basis for possible utilization of these essential oils as a safe and alternative method to fungicides for controlling powdery mildew in zinnia plants.
Key words: Zinnia elegans, essential oils, powdery mildew, biocontrol agents.
IntroductionZinnias are one of the easy to grow herbaceous summer annual fl ower, blooming from mid-summer all the way until frost. About 10 species of zinnia are garden fl owers but only the Zinnia elegans is the most popular. Z. elegans belongs to family Asteraceae and native to the Southwest United States, Mexico and Central America and therefore, likes an warm-hot climate. Zinnia plant’s leaves are lance-shaped, sandpaper like in texture, stalkless, and have erect stems that bear opposite leaves and terminal fl ower heads. Zinnias come as yellow, orange, white, red, rose, pink, purple, lilac and multi-colored blooms. Zinnia varieties include both miniatures and giants that range from about a foot to over three feet tall. However, zinnia plants are subjected to many pathogens, which cause various diseases, Erysiphe cichoracearum is one of the important pathogens since it causes one of the most serious disease of zinnia plants namely powdery mildew. This pathogen attacks all plant parts destroying most leaves and fl owers, fi nally the remaining fl owers become unmarketable.
The present work aimed to study the effi cacy of certain essential oils in controlling powdery mildew on zinnia caused by E. cichoracearum.
Material and methodsA fi eld experiment was carried out during the two successive seasons of 2006 and 2007 at the Experimental Farm of the Faculty of Agriculture, Kafr El- Sheikh University to evaluate some essential oils as biocontrol agents for powdery mildew on Z. elegans L. Seeds were sown in nursery beds on March 15th in both years and seedlings were transplanted in May 1st to a clay
soil in plots 1 x 1.5m2 at 50 cm apart as a twins in the hill, and each bed was divided into two parts (1 x 0.75 m2). Each part contained 12 plants (6 hills) and was considered as a replicate. Therefore, every treatment consisted of 36 plants (18 hills) in the three replicates. The experiment was arranged in a completely randomized block design. The plants including control were fertilized with the recommended dose of N, P and K (100, 200 and 100 kg/ application, respectively), beginning from May 15th and repeated three times with two weeks interval. The used fertilizers were ammonium sulphate “20% N”, calcium super phosphate “15.5% P2O5” and potassium sulphate “48% K2O”. The common agricultural practices i.e., watering, weed control, etc. were done whenever plants needed.
Marjoram, clove, cinnamon, garlic, ginger and fennel oils were added as a foliar spray at 2 levels of 250 and 500 ppm. Tween-20 was used as a surfactant at the rate of 0.1% v/v. Kemah zein 75% was used at recommended dose (2 g/L). The plants were sprayed four times beginning from June 15th with one week interval by a hand atomizer as soon as the fi rst sign of the symptoms were observed. For control treatments, plants were sprayed with distilled water only. Percentage of disease incidence and severity were determined after 7 days from the last spray according to the scale reported by Horsfall and Barrett (1945) and Biswas et al. (1992).
Enzymes extraction and assay: Leaf samples of each treatment, healthy and infected, were collected after 24h of the treatment for peroxidase and polyphenol oxidase enzymes activity assay. In addition, untreated healthy and infected leaves were used as control. Enzyme extract was obtained by grinding leaf tissue in 0.1 M sodium phosphate buffer at pH 7.1 (2g leaf tissues) in a
Journal
Appl
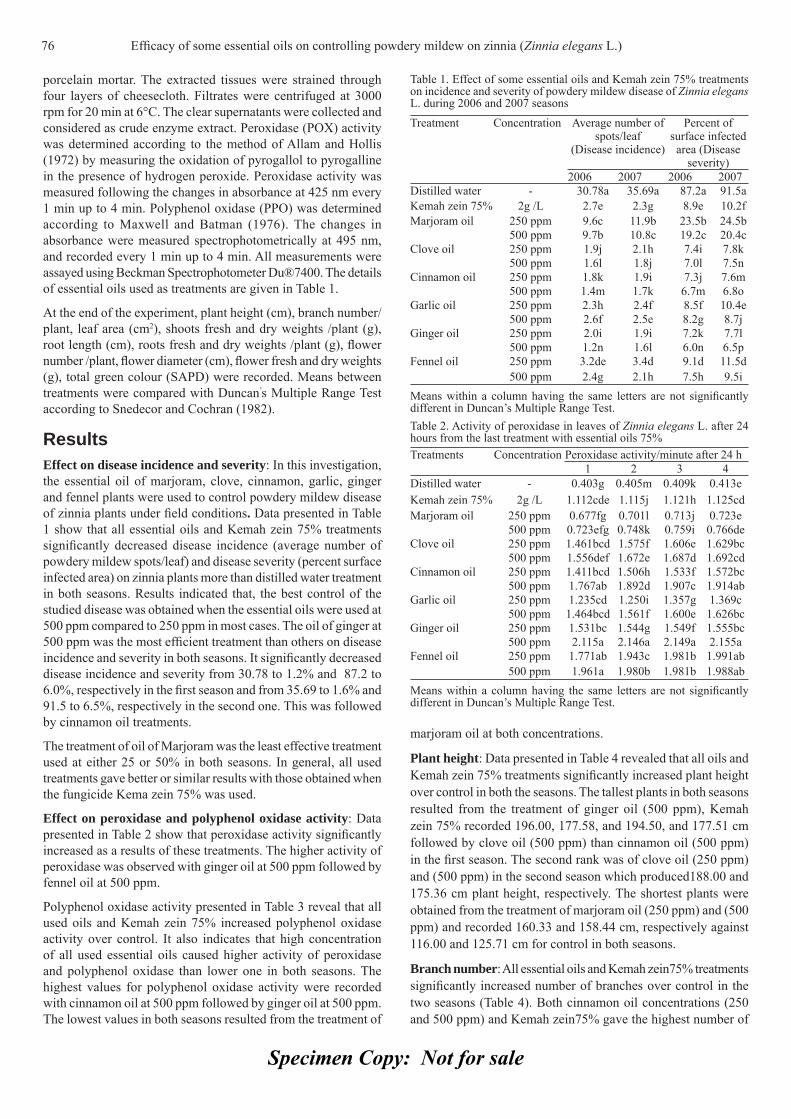
Specimen Copy: Not for sale
porcelain mortar. The extracted tissues were strained through four layers of cheesecloth. Filtrates were centrifuged at 3000 rpm for 20 min at 6°C. The clear supernatants were collected and considered as crude enzyme extract. Peroxidase (POX) activity was determined according to the method of Allam and Hollis (1972) by measuring the oxidation of pyrogallol to pyrogalline in the presence of hydrogen peroxide. Peroxidase activity was measured following the changes in absorbance at 425 nm every 1 min up to 4 min. Polyphenol oxidase (PPO) was determined according to Maxwell and Batman (1976). The changes in absorbance were measured spectrophotometrically at 495 nm, and recorded every 1 min up to 4 min. All measurements were assayed using Beckman Spectrophotometer Du®7400. The details of essential oils used as treatments are given in Table 1.
At the end of the experiment, plant height (cm), branch number/ plant, leaf area (cm2), shoots fresh and dry weights /plant (g), root length (cm), roots fresh and dry weights /plant (g), fl ower number /plant, fl ower diameter (cm), fl ower fresh and dry weights (g), total green colour (SAPD) were recorded. Means between treatments were compared with Duncan’s Multiple Range Test according to Snedecor and Cochran (1982).
ResultsEffect on disease incidence and severity: In this investigation, the essential oil of marjoram, clove, cinnamon, garlic, ginger and fennel plants were used to control powdery mildew disease of zinnia plants under fi eld conditions. Data presented in Table 1 show that all essential oils and Kemah zein 75% treatments signifi cantly decreased disease incidence (average number of powdery mildew spots/leaf) and disease severity (percent surface infected area) on zinnia plants more than distilled water treatment in both seasons. Results indicated that, the best control of the studied disease was obtained when the essential oils were used at 500 ppm compared to 250 ppm in most cases. The oil of ginger at 500 ppm was the most effi cient treatment than others on disease incidence and severity in both seasons. It signifi cantly decreased disease incidence and severity from 30.78 to 1.2% and 87.2 to 6.0%, respectively in the fi rst season and from 35.69 to 1.6% and 91.5 to 6.5%, respectively in the second one. This was followed by cinnamon oil treatments.
The treatment of oil of Marjoram was the least effective treatment used at either 25 or 50% in both seasons. In general, all used treatments gave better or similar results with those obtained when the fungicide Kema zein 75% was used.
Effect on peroxidase and polyphenol oxidase activity: Data presented in Table 2 show that peroxidase activity signifi cantly increased as a results of these treatments. The higher activity of peroxidase was observed with ginger oil at 500 ppm followed by fennel oil at 500 ppm.
Polyphenol oxidase activity presented in Table 3 reveal that all used oils and Kemah zein 75% increased polyphenol oxidase activity over control. It also indicates that high concentration of all used essential oils caused higher activity of peroxidase and polyphenol oxidase than lower one in both seasons. The highest values for polyphenol oxidase activity were recorded with cinnamon oil at 500 ppm followed by ginger oil at 500 ppm. The lowest values in both seasons resulted from the treatment of
marjoram oil at both concentrations.
Plant height: Data presented in Table 4 revealed that all oils and Kemah zein 75% treatments signifi cantly increased plant height over control in both the seasons. The tallest plants in both seasons resulted from the treatment of ginger oil (500 ppm), Kemah zein 75% recorded 196.00, 177.58, and 194.50, and 177.51 cm followed by clove oil (500 ppm) than cinnamon oil (500 ppm) in the fi rst season. The second rank was of clove oil (250 ppm) and (500 ppm) in the second season which produced188.00 and 175.36 cm plant height, respectively. The shortest plants were obtained from the treatment of marjoram oil (250 ppm) and (500 ppm) and recorded 160.33 and 158.44 cm, respectively against 116.00 and 125.71 cm for control in both seasons.
Branch number: All essential oils and Kemah zein75% treatments signifi cantly increased number of branches over control in the two seasons (Table 4). Both cinnamon oil concentrations (250 and 500 ppm) and Kemah zein75% gave the highest number of
Table 1. Effect of some essential oils and Kemah zein 75% treatments on incidence and severity of powdery mildew disease of Zinnia elegans L. during 2006 and 2007 seasons
Treatment Concentration Average number of spots/leaf
(Disease incidence)
Percent of surface infected area (Disease
severity)2006 2007 2006 2007
Distilled water - 30.78a 35.69a 87.2a 91.5aKemah zein 75% 2g /L 2.7e 2.3g 8.9e 10.2fMarjoram oil 250 ppm 9.6c 11.9b 23.5b 24.5b
500 ppm 9.7b 10.8c 19.2c 20.4cClove oil 250 ppm 1.9j 2.1h 7.4i 7.8k
500 ppm 1.6l 1.8j 7.0l 7.5nCinnamon oil 250 ppm 1.8k 1.9i 7.3j 7.6m
500 ppm 1.4m 1.7k 6.7m 6.8oGarlic oil 250 ppm 2.3h 2.4f 8.5f 10.4e
500 ppm 2.6f 2.5e 8.2g 8.7jGinger oil 250 ppm 2.0i 1.9i 7.2k 7.7l
500 ppm 1.2n 1.6l 6.0n 6.5pFennel oil 250 ppm 3.2de 3.4d 9.1d 11.5d
500 ppm 2.4g 2.1h 7.5h 9.5iMeans within a column having the same letters are not signifi cantly different in Duncan’s Multiple Range Test.Table 2. Activity of peroxidase in leaves of Zinnia elegans L. after 24 hours from the last treatment with essential oils 75%Treatments Concentration Peroxidase activity/minute after 24 h
1 2 3 4Distilled water - 0.403g 0.405m 0.409k 0.413eKemah zein 75% 2g /L 1.112cde 1.115j 1.121h 1.125cdMarjoram oil 250 ppm 0.677fg 0.701l 0.713j 0.723e
500 ppm 0.723efg 0.748k 0.759i 0.766deClove oil 250 ppm 1.461bcd 1.575f 1.606e 1.629bc
500 ppm 1.556def 1.672e 1.687d 1.692cdCinnamon oil 250 ppm 1.411bcd 1.506h 1.533f 1.572bc
500 ppm 1.767ab 1.892d 1.907c 1.914abGarlic oil 250 ppm 1.235cd 1.250i 1.357g 1.369c
500 ppm 1.464bcd 1.561f 1.600e 1.626bcGinger oil 250 ppm 1.531bc 1.544g 1.549f 1.555bc
500 ppm 2.115a 2.146a 2.149a 2.155aFennel oil 250 ppm 1.771ab 1.943c 1.981b 1.991ab
500 ppm 1.961a 1.980b 1.981b 1.988abMeans within a column having the same letters are not signifi cantly different in Duncan’s Multiple Range Test.
76 Effi cacy of some essential oils on controlling powdery mildew on zinnia (Zinnia elegans L.)

Specimen Copy: Not for sale
branches as 10.67, 10.33 and 10.30, respectively in the fi rst season while in the second one, the treatments of cinnamon oil at 500 ppm and Kemah zein 75% gave 8.55 and 8.49, respectively. In the second rank were the oils of cinnamon (250 ppm) and clove (500 ppm) in the fi rst and second seasons which gave 10.33 and 8.12 branches, respectively. The lowest branch number resulted from the treatments of marjoram oil (250 and 500 ppm) and fennel oil (250 ppm) in the fi rst season and marjoram oil (250 ppm) in the second one as recorded 6.00, 6.33 and 6.00 and 5.85, respectively.
Leaf area: It is obvious from Table 4 that all the oils at both concentrations and Kemah zein 75% produced the wide leaves than control in both the seasons. The widest leaves resulted from plants sprayed with cinnamon oil at 500 ppm in both seasons and Kemah zein75% in the second one. This was followed by ginger oil at 500 ppm and Kemah zein75% in the fi rst season and ginger oil at 250 ppm and Kemah zein75% in the second one. The smallest leaves resulted from the treatments of garlic oil 250 ppm in the fi rst season and marjoram oil at 250 ppm in the second one which gave 29.33 and 31.79 cm2 leaf area, respectively against 21.58 and 27.25 cm2 for control in both seasons.
Shoot’s fresh and dry weights: It is clear from Table 5 that all oils and Kemah zein75% treated plants had signifi cantly high values for both fresh and dry weight of shoots than control in both
seasons. The heaviest fresh and dry shoots /plant in the fi rst season resulted from the treatments of ginger oil at 500 ppm and Kemah zein 75%. Whereas in the second one were the treatments of clove oil at 500 ppm as recorded 286.08 and 41.17 g, respectively. This was followed by the treatments of cinnamon oil at 500 ppm for fresh weight and ginger oil at 250 ppm for dry weight in the fi rst season. The lightest fresh and dry shoots /plant in both seasons were obtained in the treatment of marjoram oil at 250 ppm.
Root length: Data in Table 5 reveal that all used treatments gave signifi cantly longer roots than control in both the seasons. The long roots in the fi rst season were recoreded with clove oil at 500 ppm, ginger oil at 500 ppm and cinnamon oil at 500 ppm and recorded 17.67, 17.62 and 17.00 cm, respectively against 11.67 cm for control without signifi cant differences among themselves in most cases. Whereas in the second season root length was more in clove oil at 500 ppm.
Root’s fresh and dry weights: Data presented in Table 6 show that essential oils and Kemah zein75% treatments signifi cantly increased both root fresh and dry weights over control in both seasons. The heaviest fresh roots resulted from ginger oil at 500 ppm and Kemah zein75% in the fi rst season and clove oil at 500 ppm in the second season. The lightest fresh roots resulted from the treatment of cinnamon oil at 250 ppm in the fi rst season and fennel oil at 250 ppm in the second season (15.16 and 9.10 g, respectively) against 11.40 and 8.58 g for control in both the seasons.
Heavy roots were produced under the treatments of clove oil at 250 ppm, clove oil at 500 ppm and ginger oil at 500 ppm in the fi rst season. There were no signifi cant differences among most treatments in the second season.
Flower number: Data in Table 6 indicated that all used treatments signifi cantly increased the fl ower number over control in both seasons. In the fi rst season, there were non-signifi cant differences among most treatments. The highest fl ower number resulted from the treatments of clove oil at 500 ppm, Kemah zein75%, cinnamon oil at 500 ppm, ginger oil at 500 ppm, cinnamon oil at 250 ppm, ginger oil at 250 ppm and clove oil at 250 ppm against control. In contrast to this, the signifi cantly higher fl ower number in the second season resulted from the treatment of ginger oil at 500 ppm. The lowest fl ower number resulted from the treatments of marjoram oil at 250 ppm and fennel oil at 250 ppm in the fi rst
Table 4. Effect of essential oils and Kemah zein 75% on plant height, branches number and leaf area of Zinnia elegans L. Treatments Concentration Plant height (cm) Branch number / plant Leaf area (cm2)
2006 2007 2006 2007 2006 2007Distilled water - 116.00j 125.71l 3.67f 4.05l 21.58m 27.25lKemah zein 75% 2g /L 194.50a 177.51a 10.30ab 8.49a 48.95b 48.55abMarjoram oil 250 ppm 160.33i 164.31i 6.00e 5.85k 30.60j 31.79k
500 ppm 164.00h 158.44k 6.33e 6.10i 31.80i 34.27iClove oil 250 ppm 188.00c 171.48e 7.33d 7.54e 35.50f 37.22g
500 ppm 190.00b 175.36c 8.00c 8.12b 37.63e 46.55dCinnamon oil 250 ppm 165.00gh 170.64g 10.33ab 7.90c 44.23c 47.84c
500 ppm 175.00e 176.98b 10.67a 8.55a 52.20a 48.66aGarlic oil 250 ppm 165.30g 165.48h 7.00d 6.56g 29.33l 39.12f
500 ppm 170.00f 170.71f 8.00c 7.13f 34.67g 41.59eGinger oil 250 ppm 183.00d 175.23d 8.00c 7.66d 42.37d 48.50b
500 ppm 196.00a 177.58a 10.00b 8.17b 49.57b 47.88cFennel oil 250 ppm 166.00g 162.70j 6.00e 5.94j 30.23k 32.45j
500 ppm 170.00f 164.31i 7.00d 6.27h 33.52h 35.20hMeans within a column having the same letters are not signifi cantly different in Duncan’s Multiple Range Test.
Table 3. Activity of polyphenol oxidase in leaves of Z. elegans L. after 24 hours from the last treatment with essential oils and Kemah zein 75% Treatments Concen-
trationPolyphenol oxidase activity/minute
1 2 3 4Distilled water - 0.043d 0.071h 0.073f 0.077hKemah zein 75% 2g /L 0.113a 0.117b 0.119b 0.082ghMarjoram oil 250 ppm 0.072bc 0.073gh 0.076ef 0.078h
500 ppm 0.050d 0.097cde 0.100bc 0.102cdefClove oil 250 ppm 0.058cd 0.090efg 0.092cde 0.095efgh
500 ppm 0.087b 0.102bcde 0.104bc 0.105bcdeCinnamon oil 250 ppm 0.111a 0.112bcd 0.114b 0.116bc
500 ppm 0.115a 0.145a 0.154a 0.157aGarlic oil 250 ppm 0.074bc 0.111bcd 0.114b 0.115bcd
500 ppm 0.088b 0.115bc 0.119b 0.123bGinger oil 250 ppm 0.082b 0.094def 0.095cd 0.097defg
500 ppm 0.114a 0.143a 0.152a 0.155aFennel oil 250 ppm 0.050d 0.077fgh 0.081def 0.085fgh
500 ppm 0.111a 0.112bcd 0.114b 0.115bcdMeans within a column having the same letters are not signifi cantly different in Duncan’s Multiple Range Test.
Effi cacy of some essential oils on controlling powdery mildew on zinnia (Zinnia elegans L.) 77
Specimen Copy: Not for sale
season and marjoram oil at 250 ppm in the second season.
Flower diameter: Table 7 showed that all used treatments increased fl ower diameter over control in both seasons. The biggest fl ower in the fi rst season resulted from plants treated with ginger oil at 250 ppm, ginger oil at 500 ppm, fennel oil at 500 ppm and cinnamon oil at 500 ppm without signifi cant differences among themselves in most cases against control. Whereas, in the second year plants treated with ginger oil at 250 ppm, followed by cinnamon oil at 250 ppm recoreded increased diameter.
Fresh and dry weights of fl ower: Table 7 indicate that all the used essential oils at both concentrations and Kemah zein75% gave the heavier fresh and dry weights of fl ower than control in both seasons. The heaviest fresh and dry weights in the fi rst season resulted from the plants treated with ginger oil at 500 ppm. Whereas in the second year, the plants treated with both cinnamon oil at 250 ppm and ginger oil at 250 ppm recorded higher fresh weight. The lightest fresh and dry weights in the fi rst season resulted from plants treated with garlic oil at 250 ppm. However, in the second year this resulted from the plants treated with fennel oil at 500 ppm.
Effect on total green colour: Table 8 revealed that all treated plants were greener than untreated ones in both seasons. The greenest plants were those treated with ginger oil at 500 ppm
and Kemah zein75% in the fi rst season (33.85 and 3380 SAPD value, respectively). Cinnamon oil at 500 ppm gave 38.72 SAPD value in second season. The palest plants were those treated with marjoram oil at 250 ppm in the fi rst season and marjoram oil at 500 ppm in the second season.
DiscussionIn this study, results indicated that disease incidence and severity of powdery mildew on Z. elegans L. was signifi cantly decreased by spraying some essential oils as ginger, cinnamon and clove each at 500 ppm, four times beginning from June 15th with 7 days interval. These three treatments signifi cantly surpassed others in most cases and the essential oils treatments gave better or similar results with those obtained when the fungicide Kemazein 75% was sprayed.
These fi ndings could be explained as per previous workers who revealed that essential oils have important ecological functions. One of these functions is to protect the plant against infection by pathogens (Taiz and Zeiger, 1991; El-Kazzaz et al., 2003). The mycelia growth of Aspergillus fl avus Link was completely inhibited and the hyphal diameter decreased and hyphal wall appeared as precipitates and disappeared in some regions when oil of Cymbopogon citratus L. was used. In addition, oil treatment
Table 5. Effect of some essential oils and Kemah zein 75% on shoots fresh and dry weights (g) /plant and root length (cm) of Zinnia elegans, L. during 2006 and 2007 seasonsTreatments Concentration Shoots fresh weight / plant (g) Shoots dry weight plant (g) Root length (cm)
2006 2007 2006 2007 2006 2007Distilled water - 99.25m 112.52l 9.04m 11.42l 11.67d 7.52mKemah zein 75% 2gm/L 326.09a 280.55b 40.12a 36.88b 16.58b 12.95bcMarjoram oil 250 ppm 178.04l 244.48k 20.27l 25.15k 16.00c 10.45k
500 ppm 187.63j 259.80h 21.50k 30.28f 16.33bc 11.60fClove oil 250 ppm 289.05f 277.62c 30.77h 36.92b 16.60bc 12.88c
500 ppm 305.77d 286.08a 33.74e 41.17a 17.67a 13.15aCinnamon oil 250 ppm 295.64e 268.53g 32.75f 26.85i 16.33bc 12.47e
500 ppm 315.62b 277.32d 37.22c 35.49c 17.00ab 13.02bGarlic oil 250 ppm 242.51h 245.83j 31.53g 28.61g 16.03c 11.26h
500 ppm 268.06g 268.97f 34.33d 26.52j 16.08c 10.67jGinger oil 250 ppm 312.78c 275.24e 38.27b 32.62e 16.67bc 11.45g
500 ppm 336.08a 283.78b 42.23a 35.22d 17.62a 12.74dFennel oil 250 ppm 182.06k 258.81i 22.63i 26.83i 16.00c 10.26l
500 ppm 188.45i 269.13f 21.77j 27.75h 16.01c 11.08iMeans within a column having the same letters are not signifi cantly different in Duncan’s Multiple Range Test.
Table 6. Effect of some essential oils and Kemah zein 75% on roots fresh and dry weights (g)/ plant and fl ower number of Zinnia elegans, L. during 2006 and 2007 seasonsTreatments Concentration Roots fresh weight / plant (g) Roots dry weight / plant (g) Flower number / plant
2006 2007 2006 2007 2006 2007Distilled water - 11.40i 8.58l 1.55g 1.18f 10.01f 11.21kKemah zein 75% 2gm/L 16.20a 10.88b 2.26b 1.50a 26.95a 17.85bMarjoram oil 250 ppm 15.38g 9.66j 2.27b 1.35cd 18.00de 15.19j
500 ppm 15.46f 10.24f 2.20d 1.45b 19.00cd 15.61iClove oil 250 ppm 15.83d 10.83c 2.30a 1.48ab 25.67ab 16.21h
500 ppm 16.01b 11.13a 2.31a 1.53a 27.00a 17.81bCinnamon oil 250 ppm 15.16h 10.34e 2.10f 1.48ab 26.33a 16.81g
500 ppm 15.58e 10.91b 2.24c 1.51a 27.00a 17.75cGarlic oil 250 ppm 15.38g 9.75i 2.17e 1.32d 20.67c 16.88f
500 ppm 15.46f 10.14g 2.10f 1.38c 24.33b 17.20eGinger oil 250 ppm 15.90c 10.00h 2.20d 1.36cd 26.00ab 17.52d
500 ppm 16.24a 10.55d 2.30a 1.45b 26.67a 18.11aFennel oil 250 ppm 15.33g 9.10k 2.10f 1.27e 17.00e 15.58i
500 ppm 15.35g 9.77i 2.20d 1.34cd 17.37de 16.92fMeans within a column having the same letters are not signifi cantly different in Duncan’s Multiple Range Test.
78 Effi cacy of some essential oils on controlling powdery mildew on zinnia (Zinnia elegans L.)
Specimen Copy: Not for sale
caused plasma membrane disruption and mitochondrial structure disorganization (Helal et al., 2007). Scarito et al. (2007) studied the effect of essential oils of oregano and clove at 0.125 and 0.5 mL L-1 concentration on roses. Other investigators reported that the essential oils contained antifungal compounds and fungitoxic agents that can inhibit the growth of certain microorganisms (Farag et al., 1989; Zambonelli, 1996; El-Shoraky, 1998; Chao et al., 2000; El-Shazly, 2000; Abd El-Kader et al., 2003; Voda et al., 2003; Moleyar and Narasimham, 2004; Sheng et al., 2005; Krishna Kishore and Pande, 2007).
Results also showed that spraying zinnia plants with these essential oils induced higher activity of peroxidase and polyphenol oxidase enzymes. The higher activity of enzymes was associated with decreased infection of powdery mildew disease. This means that spraying plants with essential oils gave a defense to plants from invasion with pathogen. Many investigators explained these results since they reported that peroxidase is known to be involved in the oxidation and polymerization of hydroxycinnamyl alcohols to yield lignin and cross-linking isodityrosine bridges in cell wall. It also produces free radicals and hydrogen peroxide which are toxic to many microorganisms (Vance et al., 1980; Fry, 1982; Pena and Kuc,1992). Also, Ride (1983) and Tarred (1983) stated that the increase in peroxidase activity enhances lignifi cations in
response to infection with pathogens which may restrict fungal penetration.
The study revealed that spray of ginger, cinnamon and clove oil at 500 ppm reduced disease incidence. In addition, the activities of peroxidase and polyphenol oxidase increased as a result of oil spray on plants. These fi ndings provide a basis for possible utilization of these essential oils as a safe and alternative method to fungicides for controlling powdery mildew in zinnia plants.
ReferencesAbd El-Kader, D.A., A.A. Hilal, A.Z. Aly and M.G.A. Nada, 2003.
Effect of essential oils and volatile substances of some medicinal and aromatic plants on squash powdery mildew disease. Proc 10th Congress Phytpathology, Giza, Egypt, 179-192.
Allam, A.I. and S.P. Hollis,1972. Sulfi de inhibition of oxidase in rice root.Phytpathology, 62: 634-639.
Biswas, S., R.S. Teotia and S.K. Manil, 1992. Some fi eld observation on the severity of powdery mildew (Phyllactinia corylea) in mulberry. Indian J. Seric., 31: 67-69.
Chao, C.S., D.G. Young and C.J. Oberg, 2000. Screening for inhibitory activity of essential oils on selected bacteria, fungi and viruses. J. Essent. Oil Res., 12: 639-649.
El-Kazzaz, M.K., E.M. El-Assiuty, M.M. Badr, H.M. El-Zahaby and M.I. Gouda, 2003. Effect of some plant extracts and essential oils on controlling sugar beet root rot disease caused by Sclerotium rolfsii Sacc. Proc 10th Congress of Phytopathology, Giza, Egypt: 237-248.
El-Shazly, A.M.A. 2000. Antifungal activity of some essential oils on fungi causing damping-off diseases of maize. Al-Azhar J. Agric. Res., 31(6): 95-107.
El-Shoraky, Fathia, S.A. 1998. Using extracts and oils of some plants in controlling plant diseases. Ph.D. Thesis, Fac. of Agric. Kafr El-Sheikh, Tanta Univ., 1998. 187 pp.
Farag, R.S, Z.Y. Daw, F.M. Hewedi and G.S.A. El-Baroty, 1989. Antimicrobial activity of some spice essential oils. J. Protec., 52(9): 665-667.
Fry, S.C. 1982. Isodityrosine a new amino acid from plant cell wall glycoprotein. Biochem. J., 204: 449-455.
Helal, G.A., M. M. Sarhan, A.N.K. Abu Shahla and E.K. Abou El-Khair, 2007. Effects of Cymbopogon citratus L. essential oil on the growth, morphogenesis and afl atoxin production of Aspergillus fl avus ML2-strain. J. Basic Microbio., 47: 5-15
Horsfall, J.C. and A. Barratt, 1945. An improved grading system for measuring plant diseases. Phytpathology, 35: 655-658.
Table 8. Effect of essential oils and Kemah zein 75% on total green colour (SAPD) of Zinnia elegans L. Treatments Concentration Total green colour (SAPD)
2006 2007 Distilled water - 23.85k 28.84mKemah zein 75% 2g /L 33.80a 37.49bMarjoram oil 250 ppm 25.44j 34.71j
500 ppm 25.94i 33.65lClove oil 250 ppm 28.98g 35.88g
500 ppm 31.61c 37.55bCinnamon oil 250 ppm 30.46e 36.81d
500 ppm 31.45d 38.72aGarlic oil 250 ppm 30.06f 35.34i
500 ppm 31.69c 37.21cGinger oil 250 ppm 33.39b 35.44h
500 ppm 33.85a 36.75eFennel oil 250 ppm 25.95i 34.66k
500 ppm 26.48h 36.40fMeans within a column having the same letters are not signifi cantly different in Duncan’s Multiple Range Test.
Table 7. Effect of some essential oils and Kemah zein 75% on fl ower diameter (cm) and fl ower fresh and dry weights (g) of Zinnia elegans, L. during 2006 and 2007 seasonsTreatments Concentration Flower diameter (cm) Flower fresh weight (g) Flower dry weight (g)
2006 2007 2006 2007 2006 2007Distilled water - 4.00e 3.21l 1.95j 2.52i 0.32i 0.51hKemah zein 75% 2gm/ L 6.62b 4.85c 2.90b 4.86bc 0.65b 0.83cMarjoram oil 250 ppm 5.50d 4.66f 2.65h 4.71de 0.55gh 0.80c
500 ppm 6.40b 4.82cd 2.71ef 4.80c 0.57e 0.78cdClove oil 250 ppm 5.67d 4.31h 2.65h 4.68e 0.55fgh 0.71ef
500 ppm 5.83cd 4.08i 2.70g 4.37g 0.56efg 0.68efCinnamon oil 250 ppm 6.33bc 5.87b 2.89c 5.13a 0.63c 0.96b
500 ppm 6.73ab 4.50g 2.93b 4.80c 0.65b 0.73deGarlic oil 250 ppm 5.50d 4.01j 2.50i 4.40g 0.54h 0.66fg
500 ppm 6.33bc 4.87c 2.74e 4.75cd 0.57ef 0.83cGinger oil 250 ppm 7.17a 6.01a 2.77d 5.18a 0.66b 1.03a
500 ppm 6.97a 4.81d 3.03a 4.92b 0.71a 0.81cFennel oil 250 ppm 6.33bc 4.72e 2.72f 4.52f 0.59d 0.51h
500 ppm 6.83ab 3.95k 2.76d 4.28h 0.61c 0.83cMeans within a column having the same letters are not signifi cantly different in Duncan’s Multiple Range Test.
Effi cacy of some essential oils on controlling powdery mildew on zinnia (Zinnia elegans L.) 79
Specimen Copy: Not for sale
Krishna Kishore, G. and S. Pande, 2007. Evaluation of essential oils and their components for broad-spectrum antifungal activity and control of late leaf spot and crown rot diseases in peanut. J. Amer. Soc. Phytopath., 91(4): 375-379.
Maxwell, D.P. and D.F. Batman, 1976. Changes in the activity of some oxidases in extracts of Rhizoctonia infected bean hypocotyls in relation to lesion maturation. Phytopathology, 57: 132-136.
Moleyar, V. and P. Narasimham, 2004. Antifungal activity of some essential oil components. Food Microbiol., 10: 331-336.
Pena, M. and J.A. Kuc, 1992. Peroxidase-generated hydrogen peroxidase as a source of antifungal activity in vitro and on tobacco leaf disks. Phytopathology, 82: 696-699.
Ride, J.P. 1983. Cell walls and other structural barriers in defense. In: Biochemical Plant Pathology. Calloz, J.A.(ed.), John Wiley and Sons, New York, USA.
Scarito, G., A. Salamone, G. Vito Zizzo and S. Agnello, 2007. Use of natural products for the control of powdery mildew of rose plants. Acta Hort., 751: 251-257.
Sheng,Y.W., F.C. Pin and T.C. Shang, 2005. Antifungal activities of essential oils and their constituents from indigenous cinnamon (Cinnamomum osmophloeum) leaves against wood decay fungi. Bioresouce Technology, 96: 813-818.
Snedecor, G.W. and W.G. Cochran, 1982. Statistical Methods. 6 ed., The Iowa State Univ. Press, Ames, Iowa, USA.
Taiz, I. and E. Zeiger, 1991. Surface protection and secondary defense compounds. In: Plant Physiology, Taiz, I. and E. Zeiger (eds.). Benjamin/Cummings, California. pp318-345.
Tarred, A.M., Y.Y. El-Hyatemy and S.A Omar, 1993. Wyerone derivatives and activities of peroxidase and polyphenol oxidase in faba bean leaves as induced by chocolate spot disease. Plant. Sci., 89: 161-165.
Vance, C.P., T.K. Kirk and R.T. Sherwood, 1980. Lignifi cation as a mechanism of disease resistance. Annu. Rev. Phytopathol., 18: 259-288.
Voda, K., B. Boh, M. Vrtacnik and F. Pohleven, 2003. Effect of the antifungal activity of oxygenated aromatic essential oil compounds on the white-rot Trametes versicolor and the brown-rot Coniophora puteana. Inter. Biodeterioration and Biodegradation, 51: 51-59.
Zambonelli, A., A. Bianchi and A. Elbasini, 1996. Effect of essential oils on phytopathogenic fungi in vitro. Phytpathology, 86: 491-494.
80 Effi cacy of some essential oils on controlling powdery mildew on zinnia (Zinnia elegans L.)
Specimen Copy: Not for sale
Journal of Applied Horticulture, 12(1): 81-84, January-June, 2010
The valuation of olive orchards: A case study for Turkey
Sait Engindeniz*, Murat Yercan and Hakan Adanacioglu
Ege University, Faculty of Agriculture, Department of Agricultural Economics, Bornova-Izmir/Turkey. E-mail: [email protected]
AbstractValuation of orchards is an important issue in condemnation, taxation, loan, insurance, inheritance, and purchase-sale cases. The approach to be used for orchards may vary according to the purpose of appraisal, age of the establishment, obtainable data, and according to the current regulations. In this study, land and tree values of olive orchards in a selected region from Turkey were determined by the periodic income capitalization approach. For this aim, four villages were selected and data was collected from 55 farmers selected randomly. While determining the value of the olive orchards with trees, past values approach was used. The capitalization rate for the income capitalization approach was determined as 5.32%. The value of bare land of olive orchards over periodic net income was calculated to be $ 19,684.87/ha. Tree values per hectare varied between $ 9,189.86 and $ 16,768.13 according to tree ages.
Key words: Capitalization rate, orchards, income capitalization approach, olive, valuation.
IntroductionThe olive which is the symbol of peace has been the most important plant in Mediterranean and Aegean Regions since ancient times (Sesli and Tokmakoglu, 2006). According to 2007 FAO statistics, olive production in the world was realized in 7.7 million ha area and production quantity was 17.4 million tonnes. The most important share in olive production of the world belongs to Spain (33%) followed by Italy (20%), Greece (15%), and Turkey (9%) (FAO, 2007). In Turkey, 65-70% of olives are produced for oil and the rest are reserved for table olives. Further, 85% of table olive production in Turkey is black olive (Tunalioglu and Karahocagil, 2005).
Olives grow best in warm temperatures, and cannot tolerate extreme climatic conditions. The Mediterranean region, owing to its mild climate, contains 98% of the olive harvest and 95% of the olive oil production in the world. The annual production of olives depends on climatic conditions and the alternate bearing nature of the olive tree, which yields one-year high/one-year low amounts (periodicity). Nevertheless, Turkey enjoys the advantages of being one of the major producer of olives in the Mediterranean basin. Turkey stands in second place in table olives production (fi rst in black olives) and fourth in olive oil production in the world (Göksu, 2008).
According to 2007 data of Turkish Statistical Institute, there are 144.3 million olive trees in Turkey (TURKSTAT, 2007). 65% of olive trees in Turkey are in the Aegean region. Manisa which is located in the Aegean region is an important place in olive production of Turkey. Manisa is situated in the western part of Turkey between 38° 04′ N and 27° and 27° 08′ E. According to 2007 data of Turkish Statistical Institute, there are 4.4 million olive trees in Manisa and its olive production is 34,249 tonnes (TUKSTAT, 2007).
In recent years, many studies have been made on economics of olive and olive oil production in Turkey (Olgun ve Akgungor, 1998; Artukoglu, 2002; Tunalioglu and Gokce, 2002; Dizdaroglu
et al., 2003; Tunalioglu and Karahocagil, 2005; Ozden, 2006; Karsli, 2006; Erdoğan, 2008; Artukoglu and Olgun, 2008). However, there has not been much research examining valuation of olive and other orchards in Turkey (Angin, 1989; Ozudogru, 1998; Engindeniz, 2001; Engindeniz, 2003; Keskin, 2003; Engindeniz, 2007). Therefore, there is still need for study, especially in local level.
The purpose of valuation should be known to carry out valuation accurately, to explain the results, and to interpret them correctly. The approach to be used for valuation of real estates varies according to the purpose and different approaches give different results (Murray et al., 1983). Valuation of orchards is mainly carried out for condemnation, taxation, loan, insurance, inheritance, and purchase-sale purposes (Casler and White, 1982; Anonymous, 1983; Buchwald, 1986; Verger et al., 1989; Kennedy et al., 1995; Henning et al., 1996; Correra, 1997; Kennedy et al., 1997).
In this study, the periodic income capitalization approach that can be applied in determining the land and tree values of orchards was theoretically examined, and then application of this approach was performed for olive orchards in Manisa, Turkey.
Material and methodsData was collected from 55 non-irrigated olive orchard owners (farmers) by randomly sampling method in four villages (Caglayan, Karayakup, Malkoca, and Tepekoy) selected from Gordes district of Manisa province by survey method. According to 2007 data of Turkish Statistical Institute, there are 93,000 olive trees in Gordes district and its annual olive production is 180 tonnes (TURKSTAT, 2007). All the data surveyed from the farmers were the data of 2008. Size of olive orchards varied between 0.3-3.6 hectares and average olive orchard size was 1.7 hectares.
Various data of this study were collected by survey method. To serve the purpose, two different survey forms were used. The
Journal
Appl
Specimen Copy: Not for sale
fi rst one was fi lled with owners of olive orchards and the second one with people dealing with purchase-and-sales of land in every location.
To determine the land and tree values of olive orchards, the periodic income capitalization approach was used. According to the periodic income capitalization approach, in order to fi nd the value of a real estate, all incomes of that real-estate in future were estimated and added to the value on valuation time. The standpoint in this approach is the income of the appraised goods. Therefore, to apply this approach the appraised goods should have a continuous income (Boykin and Ring, 1993; Ventolo and Williams, 2001; Anonymous, 2001). Basically, it is possible to appraise land and tree values of orchards both over average annual net income and over periodic net income.
In calculation of average annual net income of orchards; total establishment and maintenance (production) costs were subtracted from total production value (gross production value) to be obtained. Compound interest factor (1+f)n was used in calculating the added establishment and production costs at the end of rotation period.
In determination of land value over average annual net income, the following equation was used (Murray et al., 1983);
(1)
where: D0 – is land value of orchard; R – was obtained average annual net income from orchard; f – is capitalization rate.
For appraisal of tree value according to age; gross income value was used and all paid costs at the end of economic life should be updated to the valuation time. At this stage, a discount factor
was used. As a second step, total cost was subtracted from gross income. In determining the value of land with trees according to their age, values determined according to age were also added to the land value. Because, orchards are perennial, in valuation of orchards by the income capitalization approach, it is better to take the periodic net income capitalization as the basis (Casler and White, 1982; Murray et al., 1983; Correra, 1997). This is not the only reason; other important factors are that tree ages and thus yield (income from trees) differ. Therefore, periodic net income should be calculated instead of annual net income for valuation of orchards.
The following equation was used in determination of value of bare land of orchard using total periodic net income (Mulayim, 2001):
(2)
where: D0 – is value of bare land of orchard; – is total
periodic net income obtained from orchard at the end of economic life; n – is economic life of orchard; q – is compound interest factor (1+f)n.
In determining value of land with trees in orchards over periodic net income, generally two approaches viz., Past value or Future value approach are used (Rehber, 2008).
In calculating the value of land covered with trees by using past values approach, the value of bare land was updated to “t” year and then the updated total income is subtracted from this value. This equation can be written as follows:
(3)
In future values approach; the value of bare land covered with trees at “t” age is calculated by adding the updated land value (n–t) and net income updated to “t”. This equation can be written as follows:
(4)
In principle, same or similar results are obtained by past and future approaches. Therefore, past values approach was only used in this study. However, it is recommended to use past values approach if the orchard to be appraised is close to establishment years and future values approach if it is close to end of economic life.
In determination of tree values according to age, value of bare land was subtracted from the calculated value of land with trees according to age and divided by number of trees per hectare.
Results According to 2007 data of Turkish Statistical Institute, yield of olive per tree in Gordes, Manisa and Turkey were 8, 14, and 10 kg, respectively (TURKSTAT, 2007). The average yield of olive in normal production period was found 2,959.60 kg per hectare and 10.57 kg per tree in this study. Productive years of olive had been accepted to be 100 years.
Olive is marketed by sales co-operatives, wholesalers, commissioners, olive oil companies, and retailers in Turkey. In the selected area, most olives of producers were marketed to olive oil companies. The producer price of olives varied between $ 0.73/kg and $ 1.17/kg according to results of this study. Average price was calculated to be $ 1.05/kg (Table 1).
The establishment cost cover all the expenses that is relating with the period of the trees having productive capacity and were included for six years in olive orchards. These are generally related with the costs of labour and machines (maintenance, energy, etc). On the other hand, production cost consists of both operating (variable) and fi x cost. Labor is used for harvesting, transporting and classifi cation in this production branch.
In this study, average gross production value of olive orchards for productive years was found to be $ 3,107.58 per year and $ 11.10 per tree in normal production period. Gross production value is expressed by the total yield multiplied with the average price of olive. Net income was calculated by deduction from the total gross production value all such costs within the production period. This value was the income of fi x assets. Net income of olive orchards in normal production period was found to be $ 1,960.18/year and $ 7.00/tree (Table 1).
Generally, land values of olive orchards can be appraised according to sales comparison and income capitalization approaches. In Turkey, farmers rarely sell their land. Therefore, in using of sales comparison approach, only data of six non-irrigated orchards that have undergone purchase-sales procedures lately were used. Sales price per hectare of six non-irrigated orchards varied between
0RDf
=
( )1
1 nf
⎡ ⎤⎢ ⎥
+⎢ ⎥⎣ ⎦
( )0
0 1
n
n
RD
q=
−
∑
( )0
n
R∑
( ) ( )00
tt
tD D q R= ⋅ −∑
( )01 t
t n tn
D D Rq −
⎛ ⎞= ⋅ +⎜ ⎟⎝ ⎠
∑
82 The valuation of olive orchards: A case study for Turkey
Specimen Copy: Not for sale
$14,666.67 and 19,166.67. Average sales price per hectare of six non-irrigated orchards was calculated to be $18,079.10.
In application of periodic income capitalization approach, fi rst of all capitalization rate should be determined. In the study for determining appropriate capitalization rate, total net income obtained from the above mentioned six non-irrigated orchards divided by total sales price of these orchards (Mulayim, 2001), and a capitalization rate of 5.32 % has been calculated.
In this study, value of bare land of olive orchards over periodic net income was calculated to be $ 19,684.87. Further, tree values for between 10 and 80 ages were determined by using the periodic income capitalization approach. When periodic net income is used in calculation, past or future values approaches can be preferred. Past values approach was used for determining tree values in this study. Tree values per hectare varied between $ 9,189.86 and 16,768.13 according to tree ages (Table 2).
In this study, the planting space was found between the interval of 5x5 and 8x8 m. The most common and preferable planting space in olive orchards was 6x6 m. The number of trees per hectare was determined to be average 280 trees. Thus, if total value of trees in one hectare is divided by 280 trees, the value of one olive tree can be calculated which ranged between $32.82 and 59.89 according to ages of trees.
DiscussionFor valuation of orchards, the sales comparison, the periodic income capitalization and the cost approaches can be used. However, the approach to be used varies, depending on the
purpose of the appraisal (condemnation, taxation etc.), the period of establishment, obtainable data, and regulations of the country. Cost approach can be used only for valuation of olive trees (1-6 ages). However, value of olive trees (1-100 ages) can be also determined by the periodic income capitalization approach. But, the periodic income capitalization approach for valuation of trees is preferred more than the cost approach in valuation practices of orchards (Casler and White, 1982; Correra, 1997)
In determination of value of bare land of olive orchards, the sales comparison and the periodic income approaches can be used, in general. In valuation of trees; the sales comparison, the periodic income capitalization and the cost approaches can be used. Especially, if olive orchards are within the establishment period the cost approach for calculating value of trees can be preferred. But, if the establishment period is over the sales comparison and the periodic income capitalization approaches are better.
As stated above, the approach to be used in valuation of olive orchards differs depending on the regulations of the country. For example in valuation for condemnation; cost and sales comparison approaches are preferred in countries like Holland, Germany, and Italy; income capitalization approach is preferred in England, Scotland, Ireland, and Turkey; and that both approaches are used in USA and Canada. Besides, it should be stated that application of the same approach varies from one country to another (Correra, 1997; Gulten, 2000; Mulayim, 2001).
According to the results of this study, it was found out that value of bare land of olive orchards calculated over net income and a rate of 5.32% was higher then the sales comparison approach. This result can be evaluated as a contradiction. But, the value of land with tree per hectare of olive orchards by the sales comparison approach can be less than the value of bare land per hectare of olive orchards by the periodic income capitalization approach in valuation practices. There are many reasons for value loosenesses in Turkish land market. For example; avoiding the high property tax, economical crisis, agricultural and land policies, industrialization, economic affects of drought, immigration from villages to urban etc. The same results were determined also in some previous studies done in Turkey (Engindeniz, 2001; Engindeniz, 2003).
Basically, making calculations according to more than one
Table 1. Average net income of olive orchards by age of trees Periods Olive production Number of
tree in aha
Average price of oil ($/kg)
Gross production value ($/ha)
Total costs($/ha)
Net income($/ha)
Age of trees kg/tree kg/ha
Establishment period 1 - - 280 - - 1,247.06 -1,247.062 - - 280 - - 469.93 -469.933 - - 280 - - 571.07 -571.074 - - 280 - - 571.07 -571.075 - - 280 - - 571.07 -571.076 - - 280 - - 571.07 -571.07
Increasing period 7 2.21 618.80 280 1.05 649.74 1,147.40 -497.668 4.07 1,139.60 280 1.05 1,196.58 1,147.40 49.189 6.92 1,937.60 280 1.05 2,034.48 1,147.40 887.08
Normal production period 10-96 10.57 2,959.60 280 1.05 3,107.58 1,147.40 1,960.18
Decreasing period
97 8.39 2,349.20 280 1.05 2,466.66 1,147.40 1,319.2698 7.86 2,200.80 280 1.05 2,310.84 1,147.40 1,163.4499 7.45 2,086.00 280 1.05 2,190.30 1,147.40 1,042.90100 6.96 1,948.80 280 1.05 2,046.24 1,147.40 898.84
Table 2. Land and tree values of olive orchards by the periodic income capitalization approach Age of
treeValue of bare
land (D0) ($/ha)
Value of land with tree (Dt)
($/ha)
Total value of trees
(Dt- D0) ($/ha)
Value per tree
($/tree)10 19,684.87 36,453.00 16,768.13 59.8920 19,684.87 36,309.47 16,624.60 59.3730 19,684.87 36,077.40 16,392.53 58.5440 19,684.87 35,681.33 15,996.46 57.1350 19,684.87 35,016.53 15,331.66 54.7660 19,684.87 33,898.80 14,213.93 50.76
The valuation of olive orchards: A case study for Turkey 83
Specimen Copy: Not for sale
approach is important in making comparisons and interpretation of results. But, different approaches may arrive to different results. Further, different approaches can be used according to aims of valuation and country’s law. Accuracy of data to be used is as important as the selection of the approach to be used. For example, if the sales comparison approach is used, recent sales-and-purchase values should be determined; if the income capitalization approach is used, periodic net income and proper capitalization rate should be determined; and if the cost approach is used, the cost should be carefully determined. Therefore, advantages and disadvantages of every approach should be taken into consideration in determining the approach to be used.
AcknowledgementThis study was supported by General Directorate of State Hydraulic Woks. Several farmers helped in collection of data for this study. The help of the farmers and other colleagues who provided assistance is appreciated.
ReferencesAngin, N. 1989. The Determination of Land and Tree Values for
Condemnation and A Case Study (in Turkish), Bilgehan Publications, Izmir, 21 p.
Anonymous, 1983. The Appraisal of Rural Property, American Institute of Real Estate Appraisers, Illinois, Chicago, USA, 93 p.
Anonymous, 2001. The Appraisal of Real Estate, The Appraisal Institute, 2001, Twelfth Edition, Chicago, Illinois, USA., 758 p.
Artukoglu, M.M. 2002. A research on the socio-economic features of the olive oil producers in western part of Turkey: Production, organization, marketing problems and solutions. Pakistan Journal of Biological Sciences, 5(3): 371-374.
Artukoglu, M.M. and A. Olgun, 2008. Quality problems in raw material of olive oil mills and marketing channels: case of Turkey. Agricultura Tropica et Subtropica, 41(3): 128-131.
Boykin, J.H. and A.A. Ring, 1993. The Valuation of Real Estate, Fourth Edition, South Western College Publishing, Ohio, USA., 654 p.
Buchwald, H.H. 1986. Application of bio-economic models for orchard appraisal. Acta Horticulturae, 184:209-216.
Casler, G.L. and G.B. White, 1982. Alternative Methods of Capitalizing Income From Orchards, Groves and Vineyards, Cornell Univ., 22 p.
Correra, A.T. 1997. The Valuation of Permanent Plantings: Agricultural Real Estate Appraisal and Consultation, Fresno, California, 18 p.
Dizdaroglu, T., B. Aksu and S. Dönmez, 2003, Economic Analysis of Growing Olive for Oil and Table Olive in the Aegean and South Marmara Regions (in Turkish), Agricultural Economics Research Institute, Publication Number:101, Ankara, 49 p.
Engindeniz, S. 2001, The Principles of Orchards Valuation: A Case Study on Valuing of Fig Orchards in Tire District of Izmir Province (in Turkish), Union of Turkish Chambers of Agriculture, Publication Number:214, Ankara, 105 p.
Engindeniz, S. 2003. The valuation of orchards: a case study for fi g orchards in Turkey, International Journal of Strategic Property Management, 7(4):155-161.
Engindeniz, S. 2007. Valuation of orchards using the income capitalization approach: the case of pistachio (in Turkish). Journal of Agricultural Faculty of Ege University, 44(3):75-87.
Erdogan, O. 2008. Olive oil economics, marketing and policies in Turkey. Acta Horticulturae, 791:759-761.
FAO, 2007. Production statistics. http://faostat.fao.org/. (May 15, 2009).
Goksu, Ç. 2008. Olive Oil and Table Olives, Undersecretariat of the Prime Ministry for Foreign Trade Export Promotion Center of Turkey, Ankara, 7 p.
Gulten, S. 2000, Valuation (in Turkish), Publication of Atatürk University Faculty of Agriculture No.202, Erzurum-Turkey, 213 p.
Henning, S.A., L.R. Vandever, G.A. Kennedy, and S. Green, 1996. Louisiana Rural Land Values and Tenure Arrangements, Information Series No:145, Department of Agricultural Economics and Agribusiness, Louisiana State University, Louisiana, 49 p.
Karsli, I.E. 2006. Marketing and Production Economics of Conventional and Organic Olive Oil in Thrace and North Aegean Region (in Turkish), Trakya University, Edirne-Turkey, p.97, (M.S. Thesis).
Kennedy, G.A., S. Henning and R.V. Lonnie, 1995. Rural Land Values and Tenure Arrangements in Louisiana, Louisiana State University, Louisiana Agricultural Experiment Station, Department of Agricultural Economics and Agribusiness, Research Report No: 701, Louisiana, 53 p.
Kennedy, G.A., S. Henning, L.R. Vandeveer and M. Dai, 1997. An Empirical Analysis of the Louisiana Rural Land Market, Louisiana State University, Louisiana Agricultural Experiment Station, Bulletin Number: 857, Louisiana, 54 p.
Keskin, G. 2003. Valuation of Orchards (Special Situation: Olive Orchards) (in Turkish), Proceedings of the First National Turkish Olive Oil and Table Olive Symposium, Izmir-Turkey, October, 2-3, 2003. p.183-188.
Murray, W.G., D.G. Harris, G.A. Miller and N.S. Thompson, 1983. Farm Appraisal and Valuation, Sixth Edition, The Iowa State University Press, Ames, Iowa, 303 p.
Mulayim, Z.G. 2001. Farm Appraisal and Expertness (in Turkish), Yetkin Publications, Ankara, 367 p.
Olgun, A., and S. Akgungor, 1998. Olive production and marketing policies in Turkey with special emphasis on alternative marketing possibilities. Acta Horticulturae, 480: 321-323.
Ozden, F. 2006. Turkey’s Olive Oil Foreign Trade, Implementing Policies, Encountered Problems and Suggestions (in Turkish), Ege University, Izmir-Turkey. p.144, (M.S. Thesis).
Ozudogru, H. 1998. Valuation of Orchards: The Case Study of Cherry Orchards in Cubuk District of Ankara Province (in Turkish), Ankara University, Ankara-Turkey. p.78, (M.S. Thesis).
Rehber, E. 2008. Farm Appraisal and Expertness (in Turkish), Ekin Publications, Bursa, 161 p.
Sesli, M. and A. Tokmakoğlu, 2006. Olive existence in Akhisar district in Manisa province in Turkey. Journal of Applied Sciences, 6(13): 2849-2852.
Tunalioglu, R. and O. Gokce, 2002. A Research on Determine of Optimal Spreading of Olive Groves Fields in the Aegean Region (in Turkish), Agricultural Economics Research Institute, Publication Number:90, Ankara, 59 p.
Tunalioglu, R. and P. Karahocagil, 2005. Olive Oil, Table Olive and Olive Pomace Oil-Situation and Outlook (2004/2005) (in Turkish), Agricultural Economics Research Institute, Publication Number:128, Ankara, 113 p.
TURKSTAT (Turkish Statistical Institute), 2007. Agricultural production statistics. www.tuik.gov.tr. (May 20, 2009).
Ventolo, W.L. and M.R. Williams, 2001. Fundamentals of Real Estate Appraisal, 8th Edition, Published by Dearbon, Inc., Chicago, USA., 446 p.
Verger, L., M.J. Labrousse and M. Herlaut, 1989. The Prices of Agricultural Properties in 1988, Bulletin of Agricultural Statistics, No:287, Paris, France, 58 p.
84 The valuation of olive orchards: A case study for Turkey


![HERENCIA Y RELACIÓN GENÉTICA ASOCIADOS AL RENDIMIENTO, MADUREZ EN HÍBRIDOS DE TOMATE [Solanum lycopersicum L. (MILL.)]](https://static.fdokumen.com/doc/165x107/6342693d2f8ceabea207af37/herencia-y-relacion-genetica-asociados-al-rendimiento-madurez-en-hibridos-de.jpg)