An expression quantitative trait loci-guided co-expression analysis for constructing regulatory...
11
Journal of Experimental Botany, Vol. 65, No. 4, pp. 1069–1079, 2014 doi:10.1093/jxb/ert464 Advance Access publication 13 January, 2014 This paper is available online free of all access charges (see http://jxb.oxfordjournals.org/open_access.html for further details) RESEARCH PAPER An expression quantitative trait loci-guided co-expression analysis for constructing regulatory network using a rice recombinant inbred line population Jia Wang, Huihui Yu, Xiaoyu Weng, Weibo Xie, Caiguo Xu, Xianghua Li, Jinghua Xiao and Qifa Zhang* National Key Laboratory of Crop Genetic Improvement, National Center of Plant Gene Research, Huazhong Agricultural University, Wuhan 430070, PR China * To whom correspondence should be addressed. Email: [email protected] Received 16 August 2013; Revised 26 October 2013; Accepted 28 November 2013 Abstract The ability to reveal the regulatory architecture of genes at the whole-genome level by constructing a regulatory net- work is critical for understanding the biological processes and developmental programmes of organisms. Here, we conducted an eQTL-guided function-related co-expression analysis to identify the putative regulators and construct gene regulatory network. We performed an eQTL analysis of 210 recombinant inbred lines (RILs) derived from a cross between two indica rice lines, Zhenshan 97 and Minghui 63, the parents of an elite hybrid, using data obtained by hybridizing RNA samples of flag leaves at the heading stage with Affymetrix whole-genome arrays. Making use of an ultrahigh-density single-nucleotide polymorphism bin map constructed by population sequencing, 13 647 eQTLs for 10 725 e-traits were detected, comprising 5079 cis-eQTLs (37.2%) and 8568 trans-eQTLs (62.8%). The analysis revealed 138 trans-eQTLs hotspots, each of which apparently regulates the expression variations of many genes. Co-expression analysis of functionally related genes within the framework of regulator–target relationships outlined by the eQTLs led to the identification of putative regulators in the system. The usefulness of the strategy was demon- strated with the genes known to be involved in flowering. We also applied this strategy to the analysis of QTLs for yield traits, which also suggested likely candidate genes. eQTL-guided co-expression analysis may provide a promising solution for outlining a framework for the complex regulatory network of an organism. Key words: Gene expression; network construction; phenotype; quantitative genomics; regulation. Introduction Expression of genes is co-ordinately regulated in space and time in an organism to deliver the gene products when needed, according to developmental programmes and in response to environmental cues (Schmid et al., 2005; Wang et al., 2010b). The ability to reveal the regulatory architecture of genes at the whole-genome scale by constructing a regulatory network is critical for understanding the biological processes and genome function of an organism (Davidson et al., 2002; Bar- Joseph et al., 2003; Shinozaki et al., 2003). In the past, technical approaches have been developed in two major ways to characterize gene expression regulation. The first is the detection technology of gene expression, ranging from traditional analysis of one gene at a time using Northern blotting, reverse transcription-PCR and real-time quantita- tive PCR (qPCR), to large-scale analysis of many genes, such as microarrays composed of all the annotated genes in an entire genome (Schena et al., 1995; Tan et al., 2003), and more recently by RNA sequencing (Wang et al., 2009). This is an Open Access article distributed under the terms of the Creative Commons Attribution License (http://creativecommons.org/licenses/by/3.0/), which permits unrestricted reuse, distribution, and reproduction in any medium, provided the original work is properly cited. © The Author 2014. Published by Oxford University Press on behalf of the Society for Experimental Biology. Abbreviations: eQTL, expression quantitative trait locus; iGA, iterative group analysis; LOD, logarithm of the odds; NIL, or nearly isogenic line; PC, probability of change; qPCR, real-time quantitative PCR; pQTL, phenotypic quantitative trait locus; RIL, recombinant inbred line; SI, support interval; SNP, single-nucleotide polymorphisms; SR, standardized residue.
-
Upload
independent -
Category
Documents
-
view
4 -
download
0
Transcript of An expression quantitative trait loci-guided co-expression analysis for constructing regulatory...

Journal of Experimental Botany, Vol. 65, No. 4, pp. 1069–1079, 2014doi:10.1093/jxb/ert464 Advance Access publication 13 January, 2014This paper is available online free of all access charges (see http://jxb.oxfordjournals.org/open_access.html for further details)
ReseaRch papeR
An expression quantitative trait loci-guided co-expression analysis for constructing regulatory network using a rice recombinant inbred line population
Jia Wang, Huihui Yu, Xiaoyu Weng, Weibo Xie, Caiguo Xu, Xianghua Li, Jinghua Xiao and Qifa Zhang*
National Key Laboratory of Crop Genetic Improvement, National Center of Plant Gene Research, Huazhong Agricultural University, Wuhan 430070, PR China
* To whom correspondence should be addressed. Email: [email protected]
Received 16 August 2013; Revised 26 October 2013; Accepted 28 November 2013
Abstract
The ability to reveal the regulatory architecture of genes at the whole-genome level by constructing a regulatory net-work is critical for understanding the biological processes and developmental programmes of organisms. Here, we conducted an eQTL-guided function-related co-expression analysis to identify the putative regulators and construct gene regulatory network. We performed an eQTL analysis of 210 recombinant inbred lines (RILs) derived from a cross between two indica rice lines, Zhenshan 97 and Minghui 63, the parents of an elite hybrid, using data obtained by hybridizing RNA samples of flag leaves at the heading stage with Affymetrix whole-genome arrays. Making use of an ultrahigh-density single-nucleotide polymorphism bin map constructed by population sequencing, 13 647 eQTLs for 10 725 e-traits were detected, comprising 5079 cis-eQTLs (37.2%) and 8568 trans-eQTLs (62.8%). The analysis revealed 138 trans-eQTLs hotspots, each of which apparently regulates the expression variations of many genes. Co-expression analysis of functionally related genes within the framework of regulator–target relationships outlined by the eQTLs led to the identification of putative regulators in the system. The usefulness of the strategy was demon-strated with the genes known to be involved in flowering. We also applied this strategy to the analysis of QTLs for yield traits, which also suggested likely candidate genes. eQTL-guided co-expression analysis may provide a promising solution for outlining a framework for the complex regulatory network of an organism.
Key words: Gene expression; network construction; phenotype; quantitative genomics; regulation.
Introduction
Expression of genes is co-ordinately regulated in space and time in an organism to deliver the gene products when needed, according to developmental programmes and in response to environmental cues (Schmid et al., 2005; Wang et al., 2010b). The ability to reveal the regulatory architecture of genes at the whole-genome scale by constructing a regulatory network is critical for understanding the biological processes and genome function of an organism (Davidson et al., 2002; Bar-Joseph et al., 2003; Shinozaki et al., 2003).
In the past, technical approaches have been developed in two major ways to characterize gene expression regulation. The first is the detection technology of gene expression, ranging from traditional analysis of one gene at a time using Northern blotting, reverse transcription-PCR and real-time quantita-tive PCR (qPCR), to large-scale analysis of many genes, such as microarrays composed of all the annotated genes in an entire genome (Schena et al., 1995; Tan et al., 2003), and more recently by RNA sequencing (Wang et al., 2009).
This is an Open Access article distributed under the terms of the Creative Commons Attribution License (http://creativecommons.org/licenses/by/3.0/), which permits unrestricted reuse, distribution, and reproduction in any medium, provided the original work is properly cited.
© The Author 2014. Published by Oxford University Press on behalf of the Society for Experimental Biology.
Abbreviations: eQTL, expression quantitative trait locus; iGA, iterative group analysis; LOD, logarithm of the odds; NIL, or nearly isogenic line; PC, probability of change; qPCR, real-time quantitative PCR; pQTL, phenotypic quantitative trait locus; RIL, recombinant inbred line; SI, support interval; SNP, single-nucleotide polymorphisms; SR, standardized residue.
1070 | Wang et al.
In parallel, there has also been the development of approaches to determine regulatory relationships of the genes. It is a common practice in the literature to identify the down-stream targets of an altered gene using mutants or nearly iso-genic lines (NILs) to analyse expression profiles for genes of interest, and then to expand the regulatory pathways stepwise using more mutants or NILs (Doi et al., 2004; Espinosa-Soto et al., 2004; Xue et al., 2008). Another approach involves co-expression analysis by calculating correlations between genes based on large volumes of expression data, which can also provide useful information on how likely the gene func-tions are to be related (van Noort et al., 2003; Zhang and Horvath, 2005; Wang et al., 2010b). Expression quantitative trait loci (eQTLs) are genomic regions that regulate the gene expression variations in a population. Analysis of eQTLs that treats the expression values of the genes as a quantitative trait (e-trait) to perform QTL analysis using a genetically seg-regating population appears to be a useful strategy for sug-gesting regulatory relationships between genes (Gilad et al., 2008; Kliebenstein, 2009). eQTL analysis can detect genetic elements that regulate the expression variation of the e-trait acting in cis if the QTL is located in the vicinity of an e-trait, or in trans if it is located in a distant position. Such analy-sis could suggest the existence of a potential regulator in a genomic region for a gene (Hansen et al., 2008; Kliebenstein, 2009). Moreover, one regulator could be the target of another regulator. Thus, connecting such regulator–target relation-ships revealed by multiple e-traits and eQTLs of different layers would lead to a net-like structure, providing basic ele-ments for the construction of a regulatory network. More recently, an approach combining eQTL with co-expression analysis was proposed to identify regulator candidates under-lying eQTLs, which may greatly refine the resolution of the analysis (Terpstra et al., 2010; Flassig et al., 2013).
We attempted to construct a regulatory network adopting an eQTL-guided co-expression analysis strategy using flag leaf, a tissue that contributes significantly to grain yield as a primary source of carbohydrate production, from a pop-ulation of 210 recombinant inbred lines (RILs) in rice. We showed that the analysis could identify candidate regulators and their targets down to the level of single genes. We verified the usefulness of this approach using genes in the flowering pathways. The results suggest that this analysis may provide a promising solution for outlining the framework for the com-plex regulatory network of an organism.
Materials and methods
Plant materialThe population used in the study contained 210 RILs derived by sin-gle-seed descent from a cross between two indica rice lines, Zhenshan 97 and Minghui 63. The RILs and two parents were planted in a seed bed and transplanted to an experimental farm at Huazhong Agricultural University in the rice growing seasons in Wuhan, China. Ten seedlings were planted for each of the RILs in two dif-ferent batches at 45 d apart as two biological replicates. Flag leaves from three random plants of each RIL per replicate were collected at the heading stage (day of the panicle emergence; Supplementary Fig. S1 available at JXB online) between 8:00 and 9:30 a.m.
RNA extraction, isolation, and Agilent Bioanalyzer quality test-ing were conducted for each of the two biological replicates. High-quality RNA samples of the two replicates were mixed (1:1) for cDNA synthesis, labelling, microarray hybridization and scanning. All processes were conducted by CapitalBio Corporation (Beijing, China).
NIL(mh7) and Zhenshan 97, which differ only by an introgressed genome segment, for the network verification were planted and the tissue samples collected in the same way as the RIL population.
Microarray analysisR platform (http://www.R-project.org) and ‘Affy’ packages from bioconductor (http://www.bioconductor.org) were applied to man-age all the CEL files. Robust multiarray average (RMA) analysis was used for background correction and probe set expression value collection. Probe sets identified by MAS 5.0 algorithm as ‘P’ or ‘M’ for at least one-third of the 210 RILs were employed as e-traits for eQTL analysis.
eQTL and phenotypic QTL (pQTL) analyseseQTL and classical pQTL analyses were based on a genetic map consisting of 1619 recombinant bins constructed using high-quality single-nucleotide polymorphisms (SNPs) from resequencing of the 210 RILs (Yu et al., 2011). The R/qtl function cim (Broman et al., 2003) was employed for eQTL and pQTL mapping using a 10 cM scan window and five marker covariates (Potokina et al., 2008; Yu et al., 2011). The logarithm of the odds (LOD) threshold for eQTL identification was obtained based on a global permutation test that randomly selects 100 e-traits from all 21 929 e-traits to do 1000 per-mutations (West et al., 2007; Wang et al., 2010a). The eQTL addi-tive effect and variation explained by the eQTL were determined using the linear QTL model described by Yu et al (2011). With the ultrahigh-density SNP bin map, the LOD thresholds of pQTL analysis for 10 yield-associated traits at P=0.05 ranged from 4.76 to 5.10 using 1000 permutation test for each phenotypic trait, with an average LOD value of 4.97. We used 5.0 as the threshold for pQTL identification.
Real-time PCR analysisRNA was isolated from NIL(mh7) and Zhenshan 97 rice flag leaves at the heading stage using TRIzol reagent (Invitrogen). First-strand cDNA was synthesized from DNase I-treated total RNA using Superscript III reverse transcriptase (Invitrogen) according to the manufacturer’s instructions. qPCR was performed with gene-spe-cific primers (Supplementary Table S1 available at JXB online) in Applied Biosystems ViiA™ 7 using SYBR Premix Ex Taq (Takara) for six biological replicates of each sample. The program was 95 °C for 10 s, followed by 40 cycles of 95 °C for 5 s and 60 °C for 34 s, and relative expression levels were calculated by the 2–ΔΔCT method (Livak and Schmittgen, 2001) compared with levels of expression of the ubiquitin gene.
Accession codesThe National Center for Biotechnology Information Gene Expression Omnibus microarray data have been submitted under accession number GSE49020.
Results
Distribution of e-traits
In total, 44 029 (76.7%) of the 57 194 probe sets on the GeneChip Rice Genome Array each had a locus support in

eQTL-guided regulatory network construction | 1071
the Rice Genome Pseudomolecules (Release version MSU 6.1) representing 35 885 genes. In addition, 21 929 (49.8%) of the 44 029 probe sets corresponding to 17 934 genes were iden-tified as ‘present’ in more than one-third of 210 RILs using the ‘mas5calls’ algorithm (Liu et al., 2002) and were thus regarded as e-traits. We mapped the e-traits to the ultrahigh-density SNP bin map consisting of 1619 bins (Yu et al., 2011). The distribution of e-traits was highly uneven across the genome (Supplementary Fig. S2 available at JXB online), and their numbers in the 1619 bins deviated significantly from the expec-tation based on physical sizes of the bins as shown by a χ2 test (χ2=47 264, P=2.2E–16) using the chisq.test function for a goodness-of-fit test. Further evaluation using the standard-ized residue (SR), which follows an asymptotical normal dis-tribution, showed that the numbers of e-traits in 274 bins were significantly different from the expectations (Supplementary Table S2 available at JXB online). The density of the genes and e-traits in the centromeric and pericentromeric regions was lower than that in other chromosomal regions.
Genome-wide eQTL mapping
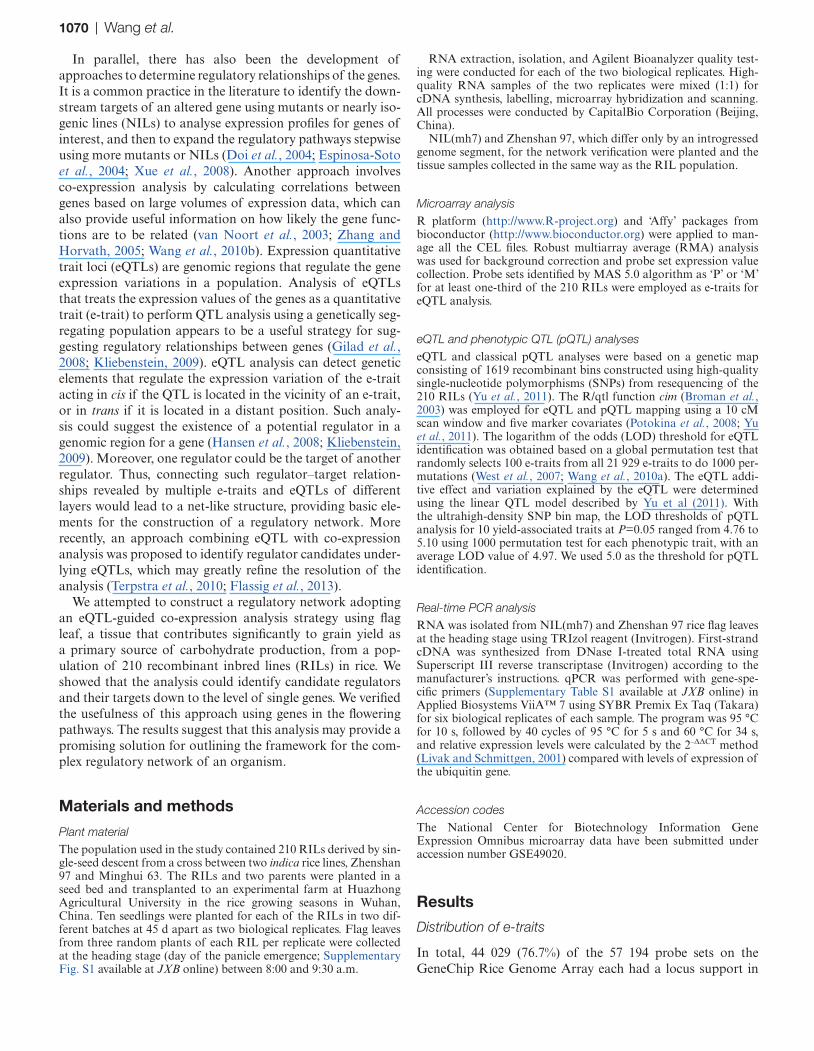
These e-traits were subjected to eQTL analysis based on the ultrahigh-density SNP bin map using composite interval map-ping (Zeng, 1993, 1994). We applied an LOD threshold of 4.95 (P=0.05), which was determined by a global permutation test, to identify eQTLs. An eQTL was regarded as cis-acting if the gene (e-trait) was within the 1.5 LOD-drop support interval (SI) of the corresponding eQTL, or as trans-acting if the gene (e-trait) was not located within the 1.5 LOD-drop SI (Keurentjes et al., 2007). These processes eventually resulted in 13 647 eQTLs for 10 725 e-traits (Fig. 1 and Supplementary Table S3 available at JXB online), including 5079 cis-eQTLs (37.2%) and 8568 trans-eQTLs (62.8%) (Table 1). Only one eQTL was detected for 8258 (77.0%) of the 10 725 e-traits, and more than two eQTLs were detected for 407 (3.79%) of the e-traits. Most of the cis-eQTLs had greater LOD values and effects on gene expression than trans-eQTLs (Fig. 1 and Supplementary Fig. S3 available at JXB online). Overall, 69.2% of the cis-eQTLs each explained ≥ 20% of the expression variation for the corresponding e-traits, while only 8.79% of the trans-eQTLs could explain ≥ 20% of the expression variation for the corresponding e-traits.
Trans-eQTL hotspots
Four chromosomes (1, 3, 6, and 9) had higher numbers of eQTLs than expected based on both physical and genetic maps (Table 1), suggesting possible eQTL hotspots, as indi-cated by the horizontal bands (trans-eQTL hotspots) in Fig. 1. Comparison of observed and expected numbers of trans-eQTLs showed that trans-eQTLs detected in bins on some chromosomes (1, 3, 6, 7, and 9) were obviously more than the e-traits with cis-eQTLs (Supplementary Table S4 available at JXB online). We also performed a χ2 test for goodness of fit between observed and expected trans-eQTLs followed by cal-culating the SR, and a hypergeometric test for observed trans-eQTLs and e-traits with cis-eQTLs in the bins. It was found that the numbers of trans-eQTLs in 138 bins were significantly
more than the expectations based on the sizes of the bins (P<0.01) and the numbers of e-traits with cis-eQTLs (P<0.01) (Supplementary Table S4 available at JXB online), indicating both trans-eQTL hotspots and coldspots. In particular, the top five bins of the trans-eQTL hotspots (Bin851 on chromosome 6; Bin857 on chromosome 6, Bin37 on chromosome 1, Bin 394 on chromosome 3, and Bin1012 on chromosome 7) ranging from 20 to 50 kb harboured 439, 190, 169, 124, and 111 trans-eQTLs, respectively.
Identifying candidate master regulators
A regulator at the high-node level in the network, or master regulator, frequently regulates many genes involved in mul-tiple biological processes. We thus reasoned that: (1) such a regulator should correspond to a trans-eQTL hotspot, and (2) it should be co-expressed (positively or negatively) with the genes (targets) it regulates. To validate such an asser-tion and find candidate master regulators, we performed a co-expression analysis by calculating correlations between e-traits with cis-eQTLs and e-traits whose trans-eQTLs are located in the 1.5 LOD-drop SI of the cis-eQTLs (Fig. 2A).
Fig. 1. eQTLs identified using flag leaf tissue at the heading stage of RILs from a cross between Zhenshan 97 and Minghui 63. The positions of 13 647 eQTLs for 10 725 e-traits in the genome are shown. The x-axis shows the physical positions of expressed probe sets (e-traits) in the genome, and the y-axis the physical positions of eQTLs. Each dot represents an eQTL detected. The diagonal indicates possible cis-eQTLs, which are co-located with their corresponding probe sets. All the off-diagnal points indicate trans-eQTLs. The 12 rice chromosomes are separated by grey lines. The color key reflects the LOD scores (LOD scores >30 are set to 30). Most of the dots in higher scores are located in the diagonal representing cis-eQTLs. Multiple horizontal bands (trans-eQTL hotspots) are shown on four chromosomes (1, 3, 6, and 9), which suggests that transcript levels for many of the probe sets are associated with the polymorphisms in these regions. LOD scores >4.95 were adopted as the cut-off point for eQTLs.

1072 | Wang et al.
The threshold for significant correlations (0.60 and –0.52, P<0.01) was appraised based on 1 000 000 pair-wise corre-lations from two randomly selected groups each containing 1000 e-traits. Six genes seemed to be putative master regula-tors, as each was associated with more than 100 genes as the targets (Table 2), and other 27 genes obtained 20–100 candi-date targets (Supplementary Table S5 available at JXB online). A gene ontology analysis based on biological processes of the associated targets for the six genes revealed that the targets for two of the putative regulators (Os.12583.1.S1_at anno-tated as expressed protein and Os.53449.1.A1_at annotated as OMP85 family protein) seemed to be highly enriched in certain functional categories (Supplementary Table S6 avail-able at JXB online). No obvious enrichment was detected for the other four putative master regulators, indicating that these putative master regulators might be involved in diverse regulatory pathways.
Network construction for functionally related genes
Gene regulatory networks usually regulate the expression of arrays of genes in specific spatial and temporal patterns. To explore the feasibility of using the expression data to identify regulatory networks, we performed co-expression analysis of genes known to be involved in the long-day flowering path-way. Many studies have revealed that, as a short-day plant, rice flowering is regulated by both a short-day activation pathway and a long-day suppression pathway (Hayama et al., 2003). Our RIL populations were planted in the rice grow-ing season (May–September) in Wuhan, China, in which the natural day length is 13–14.5 h (nearly a long day).
An iterative group analysis (iGA) algorithm (Breitling et al., 2004; Keurentjes et al., 2007) was used to analyse the e-trait expression profile to find master regulators of the flowering genes, based on the assumption that a concerted
expression variation was controlled by the same regulator and that the functions of the genes were physiologically rel-evant. In this process (Fig. 2B, C), a putative local regula-tor gene that has a cis-eQTL co-located with a trans-eQTL was assigned a group name, and an e-trait with a trans-eQTL that co-mapped with the group was assigned as a member of the group. We first sorted the putative targets (members) according to the expression correlations with potential regu-lators (groups) in descending order, and moved along the list counting the targets of each candidate regulator. When a new target was encountered each time, we inquired: How likely is it that we would observe this many targets of the regulator that high up in the list by chance? For each group, we defined the probability of change (PC) value, which indicated how likely a regulator with cis-eQTL is to show a strong corre-lation with several members with trans-eQTLs of a selected group of genes. A regulatory group with a significant PC value (P<0.05) would be regarded as a regulator controlling the members contributing to this PC value.
We illustrated this procedure using the flowering regulation genes as an example. We identified 577 unique loci annotated as known or predicted genes in the category GO:0009908 (flower development), as well as ones known to be involved in flower development and the flowering time pathway from the literature (Supplementary Table S7 available at JXB online). There were 280 eQTLs associated with 177 of the 577 unique probe sets including 109 cis-eQTLs and 171 trans-eQTLs (Supplementary Table S8 available at JXB online). Sixty-one of the 109 genes with cis-eQTLs had a SI overlapping the SI of trans-eQTLs. We calculated expression correlations between the 61 genes (potential regulators) and 171 genes with trans-eQTLs (potential targets), which amounted to 7808 gene pairs when disregarding the genes that had both cis- and trans-eQTLs (Supplementary Table S9 available at JXB online). The correlation coefficients were rank ordered.
Table 1. Statistics of the eQTLs on each chromosome
Chr. eQTLs on chr. Cis-eQTL Trans-eQTL Chr. size (Mb) Expecteda SRb Chr. size (cM) Expectedc SRd cM/Mb
1 2563 943 1620 43.3 1588 24.5 201 1684 21.4 4.62 929 463 466 35.9 1316 –10.7 175 1473 –14.2 4.93 1855 579 1276 36.4 1335 14.3 188 1574 7.1 5.24 706 379 327 35.3 1294 –16.4 127 1068 –11.1 3.65 608 373 235 29.9 1096 –14.7 116 974 –11.7 3.96 2453 410 2043 31.2 1144 38.7 144 1212 35.6 4.67 1135 290 845 29.7 1089 1.4 135 1137 –0.1 4.68 610 326 284 28.4 1041 –13.4 120 1010 –12.6 4.29 1093 356 737 23 843 8.6 107 900 6.4 4.710 509 332 177 23.1 847 –11.6 85 716 –7.1 3.711 739 380 359 28.5 1045 –9.5 117 980 –7.7 4.112 447 248 199 27.5 1008 –17.7 109 918 –15.5 4.0
13647 5079 8568 372.2 13647 1625 13647 4.4
aExpected number of eQTLs based on chromosome size from physical map. χ2 = 3690.2 (P < 2.2e–16) for the test of goodness of fit between the observed and expected numbers of eQTLs on the 12 chromosomes.bSR: for physical map, standardized residue [=(observed – expected)/√expected], which follows a normal distribution asymptotically. An absolute SR value >2.33 indicates statistical significance at P<0.01. A positive value indicates that the observed number is greater than expected.cExpected number of eQTLs based on chromosome size from genetic map. χ2 = 2801.18 (P < 2.2e–16).dSR: standardized residue for genetic map.

eQTL-guided regulatory network construction | 1073
iGA (Breitling et al., 2004) was applied to select the most sig-nificant groups and the significant change targets contribut-ing to PC value, which indicate how likely a regulator with cis-eQTL is to observe a strong correlation with several mem-bers with trans-eQTLs of a selected group of genes.
Hd3a and RFT1, essential for flowering in rice, share 91% identity in their deduced amino acid sequences and are located only 11.5 kb apart on chromosome 6 (Komiya et al., 2008). A cis-eQTL was detected for RFT1, but the expression varia-tion of Hd3a mapped no significant locus. To avoid the obscur-ing effect of sequence identity between the genes, the expression levels of RFT1 and Hd3a were recalculated using a subset of four probes selected from the 11 probes in the chip for each gene that had more than five SNPs between RFT1 and Hd3a. With this analysis, the effect of the cis-eQTL for RFT1 was
greatly elevated with the LOD increasing from 7.33 to 76.02 (Supplementary Table S10 and Supplementary Fig. S4 availa-ble at JXB online), and the amount of variation explained from 9.9 to 12.3%. A trans-eQTL for Hd3a (LOD=5.2, R2=9.2%), associated with Bin1006 (chromosome 7), emerged from this analysis (Supplementary Table S10 and Supplementary Fig. S5 available at JXB online). At the cis-eQTL for RFT1 on chromosome 6, the Minghui 63 allele had a positive effect on RFT1 expression. However, RFT1 also had a trans-eQTL on chromosome 1, at which the Zhenshan 97 allele had a positive effect on RFT1 expression. Consequently, the expression levels of RFT1 did not seem to be very different in the two parents (Supplementary Fig. S6 available at JXB online). In contrast, the two parents showed large difference in the expression level of Hd3a, apparently due to the trans-eQTL on chromosome 7.
Fig. 2. Schematic diagram of the procedure for identification of master regulators and construction of regulatory network for functionally related genes. (A) Identification of master regulators in the trans-eQTL hotspots by eQTL mapping. (B) eQTL map of functionally related genes. (C) The process of seeking master regulators and their targets according to the expression correlation between putative regulators and candidate targets for constructing a regulatory network (see main text for details).

1074 | Wang et al.
Eight obvious regulatory groups were identified (P<0.05) (Table 3) based on the iGA analysis, and the targets for each regulator are shown in Fig. 3, with the expression cor-relations displayed in Supplementary Table S11 available at JXB online. Ghd7, Hd1, and RFT1 were identified as master regulators in this analysis, which were the trans-eQTLs for several flowering-related genes. The trans-eQTL for Hd3a appeared to be Ghd7 (cor=–0.30, P=8.63E–6). Several trans-eQTLs for flowering-related genes seemed to be RFT1, of which OsMADS14 and OsMADS15 were identified as tar-gets of RFT1 in a previous work (Komiya et al., 2008, 2009). Meanwhile, OsGF14b and OsGF14c, two 14-3-3 proteins, act as intracellular receptors for rice Hd3a florigen (Taoka et al., 2011), and were identified as the targets of RFT1 in our results. This is in agreement with the conclusion that RFT1 was the major regulator for long-day flowering (Komiya et al., 2009). Ehd1 and OsMADS50, confirmed as upstream
regulators of RFT1/Hd3a, both had trans-eQTLs co-located with Hd1 on chromosome 6. Highly significant nega-tive expression correlations of Hd1 with Ehd1 (cor=–0.54, P=4.06E–17) and OsMADS50 (cor=–0.27, P=7.51E–05) in 210 RILs indicated that they both were downregulated by Hd1, suggesting Hd1 as a regulator of Ehd1 and OsMADS50. Others have reported that Hd1 and Ehd1 are independent in flowering regulation (Doi et al., 2004; Takahashi et al., 2009), and a more recent study showed that Ehd1 appears to be negatively regulated and Ghd7 was positively regulated by Hd1 under long-day conditions (Song et al., 2012), which seems to substantiate our network. We obtained the 2 kb genomic sequence upstream of the ATG site of Ehd1 and OsMADS50, and found no difference between Zhenshan 97 and Minghui 63, suggesting that this 2 kb sequence may not be the cause of the expression difference. In contrast, OsMADS50 was positively regulated by Ghd7 (cor=0.25,
Table 3. The eight regulatory groups identified in the analysis
Groupa Membersb Number changedc P value changedd Gene MUS6.1
Os.15230.1.S1_at 24 19 1.14E–05 RFT1 LOC_Os06g06300Os.10204.1.S1_at 10 7 1.08E–04 Os01g09590 LOC_Os01g09590Os.12795.1.S1_at 2 2 7.68E–03 OsPRR59 LOC_Os11g05930OsAffx.28467.1.S1_at 11 11 0.016 Ghd7 LOC_Os07g15770Os.12674.1.S1_s_at 2 2 0.022 Os03g11340 LOC_Os03g11340Os.1189.1.S1_at 6 6 0.032 Hd1 LOC_Os06g16370Os.30077.2.S1_at 5 3 0.033 Os03g16210 LOC_Os03g16210Os.2720.1.S1_at 3 1 0.042 OsPEP LOC_Os10g41440
aGroup, All local regulatory genes were classified as group names.bMembers, the number of e-traits with trans-eQTLs co-mapped with the corresponding group.cNumber changed, the number of candidate targets that may be controlled by the regulator.dP value changed, the probability of change, indicating the likelihood of observing the members of the group that high up in the list by chance.
Table 2. Information on the six putative master regulators genes, associated with more than 100 genes as targets
The candidate regulators were suggested to be the gene with cis-eQTLs that co-mapped with trans-eQTLs of many co-expressed genes (P<0.01).
Regulator Na Bin Chr. LODb Inf. Mbc Sup. Mbd Vare Annotationf
Os.3539.1.S1_at 412 Bin851 6 5.61 2.89 4.50 7.45% Vesicle-associated membrane protein, putative, expressed
Os.12583.1.S1_at 213 Bin389 3 14.77 8.66 9.53 22.27% Outer-membrane protein, OMP85 family, putative, expressed
Os.53449.1.A1_at 204 Bin395 3 6.80 8.75 10.04 11.39% Expressed proteinOs.9960.1.S1_at 145 Bin857 6 23.56 3.29 4.02 35.33% WD-40 repeat family protein,
putative, expressedOs.16410.1.S1_s_at 127 Bin853 6 4.96 2.89 4.50 4.61% BSD domain containing
protein, expressedOs.27513.1.A1_a_at 103 Bin36 1 5.45 4.75 6.04 5.17% Phosphoenolpyruvate car-
boxylase, putative, expressed
aN, the number of co-expression probe sets with trans-eQTLs located in the 1.5 LOD-drop interval of corresponding cis-eQTL of the e-trait.bLOD, the LOD value for the cis-eQTL for the regulator.cInf.Mb, the inferior position for the 1.5 LOD-drop interval of cis-eQTLs.dSup.Mb, the superior position for the 1.5 LOD-drop interval of cis-eQTLs.eVar, the expression variation explained by the cis-eQTL for the regulator.fAnnotation, the gene annotation for the regulator.

eQTL-guided regulatory network construction | 1075
P=2.05E–4) with a trans-eQTL (LOD=14.1, R2=20%) in the genomic position of Ghd7.
To confirm the network, we checked the transcript abundance of the candidate downstream targets for modulator of Ghd7 using flag leaves at heading date from Zhenshan 97 and NIL (mh7), which have an identical genetic background except for the introgressed segment (Xue et al., 2008). The qPCR results showed that the transcript levels of OsFTL10, OsFTL12, and Hd3a were lower in NIL(mh7) than in Zhenshan 97, while the reverse was the case for OsMFT1, OsMADS50, OsMADS55, and OsMADS16 (Fig. 4). This was consistent with the result presented in the network analysis (Supplementary Table S11 available at JXB online). However, the situation for 11g31540 was different from the analysis of the population data (Fig. 3). Moreover, OsSPL17 and OsFTL1, putative targets of Ghd7 that were identified with very low correlations (0.19, P=0.007; 0.24, P=4.8E–4), did not show significantly different gene expression between NIL(mh7) and Zhenshan 97. These dis-crepancies may be due to differences in the genetic material (RILs vs NILs) and/or environmental factors, as the cis-eQTL for Ghd7 could not fully explain the expression variation of the gene in the population (LOD=67.6, R2=68.5%).
Application of cis-eQTLs for gene discovery of phenotypic traits
Genetic variations for gene expression and phenotypic quanti-tative traits are mostly the results of DNA sequence polymor-phisms. Combining pQTL mapping with eQTL analysis may
facilitate investigation of the molecular regulatory networks underlying quantitative traits. A gene with cis-eQTLs usu-ally has functional polymorphisms in promoter and/or gene-coding regions, which may cause variations in gene expression levels and phenotypic effects. Indeed, phenotypic variations in a number of QTLs for phenotypic traits result from gene expression variation due to sequence polymorphisms (Chu et al., 2006; Weng et al., 2008; Li et al., 2011). Flag leaves at the heading stage, the tissue used in this analysis, have a cru-cial role for rice yield. We thus used data for yield and yield-related traits for QTL mapping to identify candidate genes controlling the variation of the traits. With the ultrahigh-density SNP bin map, the LOD thresholds at P=0.05 ranged from 4.76 to 5.10 for 1000 permutation test, with an average LOD value of 4.97, and we selected 5.0 as the threshold for pQTLs (Supplementary Table S12 available at JXB online). We then calculated correlations between phenotypic trait scores and gene expression levels of e-traits with cis-eQTLs with SIs overlapping the corresponding pQTLs. The genes with significant correlations with the trait scores are shown for each trait in Supplementary Table S13 (available at JXB online). Interestingly, a pleiotropic QTL controlling the num-ber of grains per panicle, plant height, heading date, yield per plant, and flag leaf width was shown to be associated with Bin1006 on chromosome 7. Three genes (LOC_Os07g16030, LOC_Os07g15670, and LOC_Os07g15770) with larger-effect cis-eQTLs were regarded as putative candidate genes, and exhibited significant correlations with the phenotypes of the four traits (Supplementary Table S14 available at JXB online).
OsMFT1
OsMADS55
OsFTL12
OsFTL1
Os11g31540 Ghd7
OsFTL10
OsMADS1 OsMADS50
Hd1
OsMADS47
OsMADS15
OsMADS14
Os12g37970
Os11g47460
Os3g11614
Os10g42190 Os04g57630 Os03g16220
OsCOL4
Os07g48660
RFT1
Os01g05950
Os03g11340 Os03g11120
Os03g16210 OsPEP
OsPRR59
OsGF14C
OsGF14b
VRN5
Hd3a OsSPL17
Ehd1
OsMADS51
OsPRR37 Os01g65650 Os11g25160
OsMSI1 OsCOP1
HAP3B_2
CKA2_2 Os05g02420
Os01g06790 Os06g10350 OsFIE1a OsFVE
OsFLKb
Fig. 3. The regulatory network of genes involved in flower development and the flowering time pathway. Genes in yellow are putative regulators, while other genes connected to them in black are the candidate targets. Arrows indicate positive regulation and bars indicate negative regulation.

1076 | Wang et al.
The cloned gene Ghd7 (LOC_Os07g15770) has been shown to be a pleiotropic QTL for number of grains per panicle, plant height, heading date, and yield per plant (Xue et al., 2008), and Zhenshan 97 lacked the Ghd7 locus while Minghui 63 had a functional allele. This confirmed a cis-eQTL with a remark-able effect on the expression level of Ghd7 (LOD= 67.6, R2=68.5%).
Discussion
Construction of a regulatory network is the basis for depict-ing regulation of gene expression at the whole-genome level, which is fundamental for an understanding of biological processes and the functions of both individual genes and the genome. A classical gene expression network is constructed based on one gene perturbation at a time, making use of genetic materials such as mutants and NILs. Although such analysis could provide reliable information on the immedi-ate downstream target(s) of the perturbed gene, it may not be able to provide useful information for regulators and/or targets that are in more distant positions or upstream of the perturbed gene in the network. eQTL mapping seeks to understand the genetic basis of gene expression variation and
identify causal relationships between gene expression and genetic variation by analysing multifactorial natural pertur-bations (Jansen and Nap, 2001; Logsdon and Mezey, 2010). However, like pQTLs, an eQTL corresponds to a genomic region of variable size, usually ranging from hundreds of kilobases to megabases, which still requires huge efforts to identify possible candidate genes.
In this study, we have presented a simple, yet effective method for gene regulatory network reconstruction using an eQTL-guided function-related co-expression analysis. We combined data for gene expression from a rice RIL popula-tion, gene functional annotation of prior knowledge and iGA with the co-expression level to identify candidate regulators. Such analysis is based on the hypothesis that a regulator in a high node of the network regulates many genes and would show trans-acting effects in the form of trans-eQTLs for many e-traits that show a correlated expression profile at the popu-lation level, and the targets and regulator would be involved in the same biological process.
We used genes involved in the flowering regulation as an example to demonstrate the utility of the method in con-structing a gene regulatory network, and identified and vali-dated with high confidence a number of elements and the
0
0.5
1
1.5
2
2.5
3
3.5
Ghd7NIL(Minghui 63)
Zhenshan 97
11g31540 P=0.0043
0
0.5
1
1.5
2
2.5
Ghd7NIL(Minghui 63)
Zhenshan 97
OsFTL10 P=0.0013
0
0.1
0.2
0.3
0.4
0.5
0.6
0.7
0.8
Ghd7NIL(Minghui 63)
Zhenshan 97
OsFTL12 P=0.0017
0
0.2
0.4
0.6
0.8
1
1.2
1.4
1.6
1.8
Ghd7NIL(Minghui 63)
Zhenshan 97
Hd3a P=0.0015
0
0.5
1
1.5
2
2.5
3
3.5
Ghd7NIL(Minghui 63)
Zhenshan 97
OsMADS50 P=1.03e-7
0
0.5
1
1.5
2
2.5
3
Ghd7NIL(Minghui 63)
Zhenshan 97
OsMADS55 p=4.18e-7
0
0.5
1
1.5
2
2.5
Ghd7NIL(Minghui 63)
Zhenshan 97
OsMADS16 P=0.017
0
1
2
3
4
5
6
Ghd7NIL(Minghui 63)
Zhenshan 97
OsMIF1 P=0.041
Fig. 4. qPCR verification for the expression abundance of candidate targets in NIL(mh7) and Zhenshan 97. Flag leaves at the heading date were used for the analysis. The y-axis represents relative expression levels. Means ±standard error are based on six biological replicates.

eQTL-guided regulatory network construction | 1077
pathways known to be involved in flowering regulation. Our results demonstrated that the strategy adopted here could precisely identify a putative regulator down to the single gene, representing a great improvement compared with ordinary eQTL analysis, which detected the trans-eQTL as an inter-val harbouring many genes. Compared with co-regulation analysis by simple correlations, the strategy here was able to provide a causal relationship between the co-expressed genes, which also represents a major improvement. In addi-tion, the analysis revealed other genes in the network that have not been identified previously as elements in flowering regulation. Whether they really represent genes in the sys-tem that are yet to be discovered remains to be confirmed, but these may be used as clues for future experiments.
We further expanded such eQTL-guided co-expression analysis to the identification of candidate genes for pQTLs. The results also demonstrated the promise of this approach, which may lead to the identification of candidate genes con-trolling quantitative traits.
Another point to be discussed is that the tissue used in this study was flag leaf at the heading stage, at which time the plant is already flowering, well after flowering induction. This raises a question about the functions of these genes and the regulatory network, suggesting that they may also have functions in other biological processes besides flower-ing regulation. In fact, it has been shown that flowering-related genes often exhibit pleiotropic effects that cannot be explained by the extended length of the vegetative stage alone (Yan et al., 2011, 2013). For example, Ghd7 affects grain number, plant height, and heading date under long-day conditions (Xue et al., 2008), and was also reported as con-trolling flag leaf area (Tan et al., 2012). Combination of Hd1 and Ehd1 in rice can reduce the number of primary branches in a panicle, resulting in smaller spikelet numbers per pani-cle (Endo-Higashi and Izawa, 2011). Pleiotropic effects of flowering-related genes have also been reported in other plants. Arabidopsis LHP1 controls developmental pathways involved in organ and cell size (Gaudin et al., 2001). The potato tuberization transitions are controlled by two differ-ent FT-like paralogues (StSP3D and StSP6A) that respond to independent environmental cues (Navarro et al., 2011). Another observation is that flowering-related genes are not only expressed in the panicle, but also in the leaf, sheath, stem, hull, shoot, seedling, and even roots (Supplementary Fig. S7 available at JXB online) (Wang et al., 2010b). All this evidence suggests that these firmly regarded ‘flowering genes’ have more functions than just flowering induction. However, whether the compositions and architectures of the regula-tory networks in terms of the genes and pathways are the same in different processes remain to be determined.
Gene expression is a dynamic process depending on devel-opment stages, and different tissues or cells, as well as genetic backgrounds and growth environments (Jiao et al., 2009; Wang et al., 2010b). Thus, the results and interpretations of the eQTL analysis are also valid in terms of the tissues from which the RNA samples were collected. Whether the regula-tory network and/or co-expression relationships between the genes identified in a single tissue study are tissue specific, or
are to some extent also valid in other tissues, remains to be investigated.
It should also be noted that the outcome of the eQTL detec-tion is critically dependent on the genetic composition of the mapping population defined by the polymorphisms between the parents. For example, Komiya et al. (2009) confirmed that the OsMADS50–Ehd1–RFT1 pathway is involved in floral activation under long-day conditions. However, no cis-eQTL was detected for either OsMADS50 or Ehd1, probably because of no sequence difference in the promoter regions of these genes between the parents of our population. Consequently, neither OsMADS50 and Ehd1 was identified as a trans-eQTL for other e-traits, and hence were not suggested as regulators by the eQTL analysis. Clearly, the parental genotypes pose a limiting factor for the extent to which the components in the regulatory network can be discovered in the analysis. Multiple populations of diverse parents may be used to provide com-plementary information for the network construction.
A further challenge is to identify the cis-acting element in each case that regulates the expression variation of the e-trait, or the causal agent of the cis-eQTL. The definition of cis-effect in eQTL analyses is somewhat arbitrary, varying from 5 Mb (Morley et al., 2004) to 10 kb of the gene (Yvert et al., 2003), or a 1.5 LOD-drop SI of the QTL (Keurentjes et al., 2007). In principle, a cis-eQTL should be caused by polymor-phisms within a neighbouring range of the gene, including polymorphisms within the gene itself that alter the cis-act-ing elements or sites for mRNA stability, or polymorphisms between parents in the promoter region (Heap et al., 2009; Smith et al., 2011). The above definition does not exclude the possibility that the regulatory element may act in trans, as in the case of the AMN1 gene in Saccharomyces cerevisiae that was found to be a local but trans-acting through feed-back regulation due to a coding polymorphism in its tran-script (Ronald et al., 2005). In any case, it is essential to find sequence polymorphisms between the parents and associate such polymorphisms with the expression level variation of the gene for identifying the cis-acting elements of the e-traits.
The large number of regulators and the regulatory network identified in the study only provide a starting point for under-standing the system. Although we have illustrated that some are supported by results from previous studies, huge effort is needed experimentally to confirm any of the master regula-tors and the regulatory network.
Supplementary data
Supplementary data is available at JXB online.Supplementary Fig. S1. An example of a flag leaf har-
vested at the heading stage.Supplementary Fig. S2. The distribution of e-traits and
probe sets with locus support in the genome.Supplementary Fig. S3. Distribution of R2 values for cis-
eQTLs and trans-eQTLs individually.Supplementary Fig. S4. LOD curve for expression varia-
tion that was calculated with the full set of probe sets and modified probe sets of RFT1 and Hd3a on chromosome 6.

1078 | Wang et al.
Supplementary Fig. S5. LOD curve for expression varia-tion, which was calculated with the full set of probe sets and modified probe sets of RFT1 and Hd3a on chromosome 7.
Supplementary Fig. S6. Gene expression levels for RFT1 and Hd3a in Zhenshan 97 and Minghui 63 of three biological replicates.
Supplementary Fig. S7. Heatmap of the global development stage of the flowering-related genes identified in our network.
Supplementary Table S1. Primers used in qPCR analy-sis for the candidate targets expression in NIL(mh7) and Zhenshan 97.
Supplementary Table S2. Numbers of observed and expected e-traits in 1619 bins.
Supplementary Table S3. Details of 13 647 significant gene expression quantitative trait loci (eQTLs) (P ≥ 0.05), affecting the expression of 10 725 rice unique probe sets.
Supplementary Table S4. Information on observed trans-eQTLs, expected trans-eQTLs, and e-traits with cis-QTLs in 1619 bins.
Supplementary Table S5. The significant master candidate regulators.
Supplementary Table S6. The enrichment gene ontology (GO) terms for significantly associated targets for six master regulators.
Supplementary Table S7. Information on 577 unique loci involved in flowering time and development.
Supplementary Table S8. Cis and trans-eQTL identifica-tion of flowering-associated genes.
Supplementary Table S9. Total number of unique correlation pairs: 7808 for 61 candidate regulators and 171 potential targets.
Supplementary Table S10. Gene expression for RFT1 and Hd3a was recalculated with the full set of probe sets and modified probe sets with probes with less than five SNPs removed between RFT1 and Hd3a.
Supplementary Table S11. Expression correlation for regu-lator and corresponding targets.
Supplementary Table S12. The statistics of 25 pQTLs iden-tified using the ultrahigh-density SNP bin map.
Supplementary Table S13. The most significant candidate genes for each trait.
Supplementary Table S14. Correlation between phenotypic traits and e-traits with cis-eQTL in the SI of QTL controlling corresponding traits.
Acknowledgements
This research was supported by grants from the National 863 Project (2012AA10A304) and the National Natural Science Foundation (31330039) of China, and the Bill & Melinda Gates Foundation.
References
Bar-Joseph Z, Gerber GK, Lee TI, et al. 2003. Computational discovery of gene modules and regulatory networks. Nature Biotechnology 21, 1337–1342.
Breitling R, Amtmann A, Herzyk P. 2004. Iterative Group Analysis (iGA): a simple tool to enhance sensitivity and facilitate interpretation of microarray experiments. BMC Bioinformatics 5, 34.
Broman KW, Wu H, Sen S, Churchill GA. 2003. R/qtl: QTL mapping in experimental crosses. Bioinformatics 19, 889–890.
Chu Z, Yuan M, Yao J, et al. 2006. Promoter mutations of an essential gene for pollen development result in disease resistance in rice. Genes & Development 20, 1250–1255.
Davidson EH, Rast JP, Oliveri P, et al. 2002. A genomic regulatory network for development. Science 295, 1669–1678.
Doi K, Izawa T, Fuse T, Yamanouchi U, Kubo T, Shimatani Z, Yano M, Yoshimura A. 2004. Ehd1, a B-type response regulator in rice, confers short-day promotion of flowering and controls FT-like gene expression independently of Hd1. Genes & Development 18, 926–936.
Endo-Higashi N, Izawa T. 2011. Flowering time genes Heading date 1 and Early heading date 1 together control panicle development in rice. Plant and Cell Physiology 52, 1083–1094.
Espinosa-Soto C, Padilla-Longoria P, Alvarez-Buylla ER. 2004. A gene regulatory network model for cell-fate determination during Arabidopsis thaliana flower development that is robust and recovers experimental gene expression profiles. Plant Cell Online 16, 2923–2939.
Flassig RJ, Heise S, Sundmacher K, Klamt S. 2013. An effective framework for reconstructing gene regulatory networks from genetical genomics data. Bioinformatics 29, 246–254.
Gaudin V, Libault M, Pouteau S, Juul T, Zhao G, Lefebvre D, Grandjean O. 2001. Mutations in LIKE HETEROCHROMATIN PROTEIN 1 affect flowering time and plant architecture in Arabidopsis. Development 128, 4847–4858.
Gilad Y, Rifkin SA, Pritchard JK. 2008. Revealing the architecture of gene regulation: the promise of eQTL studies. Trends in Genetics 24, 408–415.
Hansen BG, Halkier BA, Kliebenstein DJ. 2008. Identifying the molecular basis of QTLs: eQTLs add a new dimension. Trends in Plant Science 13, 72–77.
Hayama R, Yokoi S, Tamaki S, Yano M, Shimamoto K. 2003. Adaptation of photoperiodic control pathways produces short-day flowering in rice. Nature 422, 719–722.
Heap GA, Trynka G, Jansen RC, Bruinenberg M, Swertz MA, Dinesen LC, Hunt KA, Wijmenga C, Vanheel DA, Franke L. 2009. Complex nature of SNP genotype effects on gene expression in primary human leucocytes. BMC Medical Genomics 2, 1.
Jansen RC, Nap JP. 2001. Genetical genomics: the added value from segregation. Trends in Genetics 17, 388–391.
Jiao Y, Tausta SL, Gandotra N, et al. 2009. A transcriptome atlas of rice cell types uncovers cellular, functional and developmental hierarchies. Nature Genetics 41, 258–263.
Keurentjes JJ, Fu J, Terpstra IR, et al. 2007. Regulatory network construction in Arabidopsis by using genome-wide gene expression quantitative trait loci. Proceedings of the National Academy of Sciences, USA 104, 1708–1713.
Kliebenstein D. 2009. Quantitative genomics: analyzing intraspecific variation using global gene expression polymorphisms or eQTLs. Annual Review of Plant Biology 60, 93–114.

eQTL-guided regulatory network construction | 1079
Komiya R, Ikegami A, Tamaki S, Yokoi S, Shimamoto K. 2008. Hd3a and RFT1 are essential for flowering in rice. Development 135, 767–774.
Komiya R, Yokoi S, Shimamoto K. 2009. A gene network for long-day flowering activates RFT1 encoding a mobile flowering signal in rice. Development 136, 3443–3450.
Li Y, Fan C, Xing Y, et al. 2011. Natural variation in GS5 plays an important role in regulating grain size and yield in rice. Nature Genetics 43, 1266–1269.
Liu WM, Mei R, Di X, et al. 2002. Analysis of high density expression microarrays with signed-rank call algorithms. Bioinformatics 18, 1593–1599.
Livak KJ, Schmittgen TD. 2001. Analysis of relative gene expression data using real-time quantitative PCR and the 2–ΔΔCT method. Methods 25, 402–408.
Logsdon BA, Mezey J. 2010. Gene expression network reconstruction by convex feature selection when incorporating genetic perturbations. PLoS Computational Biology 6, e1001014.
Morley M, Molony CM, Weber TM, Devlin JL, Ewens KG, Spielman RS, Cheung VG. 2004. Genetic analysis of genome-wide variation in human gene expression. Nature 430, 743–747.
Navarro C, Abelenda JA, Cruz-Oro E, Cuellar CA, Tamaki S, Silva J, Shimamoto K, Prat S. 2011. Control of flowering and storage organ formation in potato by FLOWERING LOCUS T. Nature 478, 119–122.
Potokina E, Druka A, Luo Z, Wise R, Waugh R, Kearsey M. 2008. Gene expression quantitative trait locus analysis of 16 000 barley genes reveals a complex pattern of genome-wide transcriptional regulation. The Plant Journal 53, 90–101.
Ronald J, Brem RB, Whittle J, Kruglyak L. 2005. Local regulatory variation in Saccharomyces cerevisiae. Plos Genetics 1, e25.
Schena M, Shalon D, Davis RW, Brown PO. 1995. Quantitative monitoring of gene expression patterns with a complementary DNA microarray. Science 270, 467–470.
Schmid M, Davison TS, Henz SR, Pape UJ, Demar M, Vingron M, Scholkopf B, Weigel D, Lohmann JU. 2005. A gene expression map of Arabidopsis thaliana development. Nature Genetics 37, 501–506.
Shinozaki K, Yamaguchi-Shinozaki K, Seki M. 2003. Regulatory network of gene expression in the drought and cold stress responses. Current Opinion in Plant Biology 6, 410–417.
Smith RM, Alachkar H, Papp AC, Wang D, Mash DC, Wang JC, Bierut LJ, Sadee W. 2011. Nicotinic α5 receptor subunit mRNA expression is associated with distant 5′ upstream polymorphisms. European Journal of Human Genetics 19, 76–83.
Song Y, Gao Z, Luan W. 2012. Interaction between temperature and photoperiod in regulation of flowering time in rice. Science China Life Sciences 55, 241–249.
Takahashi Y, Teshima KM, Yokoi S, Innan H, Shimamoto K. 2009. Variations in Hd1 proteins, Hd3a promoters, and Ehd1 expression levels contribute to diversity of flowering time in cultivated rice. Proceedings of the National Academy of Sciences, USA 106, 4555–4560.
Tan C, Weng XY, Yan WH, Bai XF, Xing YZ. 2012. Ghd7, a pleiotropic gene controlling flag leaf area in rice. Yi Chuan 34, 901–906.
Tan PK, Downey TJ, Spitznagel Jr EL, Xu P, Fu D, Dimitrov DS, Lempicki RA, Raaka BM, Cam MC. 2003. Evaluation of gene expression measurements from commercial microarray platforms. Nucleic Acids Research 31, 5676–5684.
Taoka K, Ohki I, Tsuji H, et al. 2011. 14–3-3 proteins act as intracellular receptors for rice Hd3a florigen. Nature 476, 332–335.
Terpstra IR, Snoek LB, Keurentjes JJ, Peeters AJ, van den Ackerveken G. 2010. Regulatory network identification by genetical genomics: signaling downstream of the Arabidopsis receptor-like kinase ERECTA. Plant Physiology 154, 1067–1078.
van Noort V, Snel B, Huynen MA. 2003. Predicting gene function by conserved co-expression. Trends in Genetics 19, 238–242.
Wang J, Yu H, Xie W, Xing Y, Yu S, Xu C, Li X, Xiao J, Zhang Q. 2010a. A global analysis of QTLs for expression variations in rice shoots at the early seedling stage. The Plant Journal 63, 1063–1074.
Wang L, Xie W, Chen Y, et al. 2010b. A dynamic gene expression atlas covering the entire life cycle of rice. The Plant Journal 61, 752–766.
Wang Z, Gerstein M, Snyder M. 2009. RNA-Seq: a revolutionary tool for transcriptomics. Nature Reviews Genetics 10, 57–63.
Weng J, Gu S, Wan X, et al. 2008. Isolation and initial characterization of GW5, a major QTL associated with rice grain width and weight. Cell Research 18, 1199–1209.
West MA, Kim K, Kliebenstein DJ, van Leeuwen H, Michelmore RW, Doerge RW, St Clair DA. 2007. Global eQTL mapping reveals the complex genetic architecture of transcript-level variation in Arabidopsis. Genetics 175, 1441–1450.
Xue W, Xing Y, Weng X, et al. 2008. Natural variation in Ghd7 is an important regulator of heading date and yield potential in rice. Nature Genetics 40, 761–767.
Yan W, Liu H, Zhou X, et al. 2013. Natural variation in Ghd7.1 plays an important role in grain yield and adaptation in rice. Cell Research 23, 969–971.
Yan W, Wang P, Chen H, et al. 2011. A major QTL, Ghd8, plays pleiotropic roles in regulating grain productivity, plant height, and heading date in rice. Molecular Plant 4, 319–330.
Yu H, Xie W, Wang J, Xing Y, Xu C, Li X, Xiao J, Zhang Q. 2011. Gains in QTL detection using an ultra-high density SNP map based on population sequencing relative to traditional RFLP/SSR markers. PLoS ONE 6, e17595.
Yvert G, Brem RB, Whittle J, Akey JM, Foss E, Smith EN, Mackelprang R, Kruglyak L. 2003. Trans-acting regulatory variation in Saccharomyces cerevisiae and the role of transcription factors. Nature Genetics 35, 57–64.
Zeng ZB. 1993. Theoretical basis for separation of multiple linked gene effects in mapping quantitative trait loci. Proceedings of the National Academy of Sciences, USA 90, 10972–10976.
Zeng ZB. 1994. Precision mapping of quantitative trait loci. Genetics 136, 1457–1468.
Zhang B, Horvath S. 2005. A general framework for weighted gene co-expression network analysis. Statistical Applications in Genetics and Molecular Biology 4, 1128.