Template for using biological trait groupings when exploring ...
17
Template for using biological trait groupings when exploring large-scale variation in seafloor multifunctionality ANNA VILLN € AS, 1,6 JUDI HEWITT , 2 MARTIN SNICKARS, 3 MATS WESTERBOM, 1,4 AND ALF NORKKO 1,5 1 Tv€ arminne Zoological Station, University of Helsinki, J.A. Palm enin tie 260, FI-10900 Hanko, Finland 2 Marine Ecology Department Hamilton, National Institute of Water and Atmospheric Research, Hamilton 3251 New Zealand 3 Department of Biosciences, Environmental and Marine Biology, Abo Akademi University, FI-20520 Turku, Finland 4 Mets€ ahallitus, Parks & Wildlife Finland, PO Box 94, FI-01301 Vantaa, Finland 5 Baltic Sea Centre, Stockholm University, SE-106 91 Stockholm, Sweden Abstract. Understanding large-scale spatial variation in ecosystem properties and associated functionality is key for successful conservation of ecosystems. This study provides a template for how to estimate differences in ecosystem functionality over large spatial scales by using groupings of biological traits. We focus on trait groupings that describe three important benthic ecosystem properties, namely bioturbation, community stability, and juvenile dispersal. Recognizing that groups of traits interact and are constrained within an organism, we statistically define important functional trait subgroups that describe each ecosystem property. The sub-groups are scored according to their weighted ecological impact to gain an overall estimation of the cumulative expression of each ecosystem property at individual sites. Furthermore, by assigning each property a value relative to its observed maximum, and by summing up the individual property values, we offer an estimate of benthic ecosystem multi- functionality. Based on a spatially extensive benthic data set, we were able to identify coastal areas with high and low potential for the considered benthic ecosystem properties and the mea- sure of ecosystem multifunctionality. Importantly, we show that a large part of the spatial vari- ation in functional trait sub-groups and in benthic ecosystem multifunctionality was explained by environmental change. Our results indicate that through this simplification it is possible to estimate the functionality of the seafloor. Such information is vital in marine spatial planning efforts striving to balance the utilization with the preservation of natural resources. Key words: Baltic Sea; benthic communities; ecosystem multifunctionality; groupings of biological traits; marine spatial planning; sediment ecosystem function; spatial distribution. INTRODUCTION A large part of the world’s population lives beside the sea and relies on the essential goods and services that the marine ecosystems provide. Simultaneously, human activ- ities are increasingly disturbing coastal environments (Halpern et al. 2008), resulting in habitat alterations and degrading biodiversity (Lotze et al. 2006). This undermi- nes species’ contribution to important ecosystem func- tions. Ecosystem functions underlie the properties, goods and services of an ecosystem, with ecosystem properties representing pools of materials and process rates, and also ecosystem stability and resilience (Hooper et al. 2005). Efforts are being made to preserve the functional- ity of coastal ecosystems by implementing ecosystem- based management through marine spatial planning (MSP; Foley et al. 2010). An effective MSP should be based on information regarding the spatial dynamics of biodiversity and ecosystem properties, which ensures that the desired ecosystem functions are, in fact, provided (Foley et al. 2010, B€ ohnke-Henrichs et al. 2013). Spatial data on biodiversity and associated ecosystem functions is often scarce in marine systems, due to logisti- cal difficulties with obtaining data and financial con- straints. Hence evaluations of biodiversity–ecosystem function relationships are often performed over small spatial scales (Snelgrove et al. 2014), but see, e.g., Lohrer et al. (2015) for an example on how field data can be used to upscale ecosystem functions across time and space. Still, as marine ecosystems often span habitats and environmental and anthropogenic gradients, the extrapolation of local properties onto larger scales is complicated, undermining our ability to assess real-world contributions of biodiversity to ecosystem function (Snelgrove et al. 2014). Functional biogeography, i.e., the examination of patterns, causes, and consequences of the spatial variation in biological trait diversity, could bridge the gap between biodiversity patterns and ecosystems functions over larger scales (Violle et al. 2014). Biological traits are the morphological, physiological, phenological or behavioral features of an organism that describe its performance (Violle et al. 2014). Traits are often used as surrogates for ecosystem properties as they have been documented to affect multiple ecosystem functions, such as nutrient cycling (Norkko et al. 2013), primary (Lohrer et al. 2015) and secondary production Manuscript received 9 March 2017; revised 28 June 2017; accepted 3 August 2017. Corresponding Editor: Eva E. Plaganyi. 6 E-mail: [email protected] 78 Ecological Applications, 28(1), 2018, pp. 78–94 © 2017 by the Ecological Society of America
-
Upload
khangminh22 -
Category
Documents
-
view
1 -
download
0
Transcript of Template for using biological trait groupings when exploring ...

Template for using biological trait groupings when exploringlarge-scale variation in seafloor multifunctionality
ANNAVILLN€AS,1,6 JUDI HEWITT,2 MARTIN SNICKARS,3 MATS WESTERBOM,1,4 ANDALF NORKKO1,5
1Tv€arminne Zoological Station, University of Helsinki, J.A. Palm�enin tie 260, FI-10900 Hanko, Finland2Marine Ecology Department Hamilton, National Institute of Water and Atmospheric Research, Hamilton 3251 New Zealand
3Department of Biosciences, Environmental and Marine Biology,�Abo Akademi University, FI-20520 Turku, Finland4Mets€ahallitus, Parks & Wildlife Finland, PO Box 94, FI-01301 Vantaa, Finland
5Baltic Sea Centre, Stockholm University, SE-106 91 Stockholm, Sweden
Abstract. Understanding large-scale spatial variation in ecosystem properties andassociated functionality is key for successful conservation of ecosystems. This study provides atemplate for how to estimate differences in ecosystem functionality over large spatial scales byusing groupings of biological traits. We focus on trait groupings that describe three importantbenthic ecosystem properties, namely bioturbation, community stability, and juvenile dispersal.Recognizing that groups of traits interact and are constrained within an organism, westatistically define important functional trait subgroups that describe each ecosystem property.The sub-groups are scored according to their weighted ecological impact to gain an overallestimation of the cumulative expression of each ecosystem property at individual sites.Furthermore, by assigning each property a value relative to its observed maximum, and bysumming up the individual property values, we offer an estimate of benthic ecosystem multi-functionality. Based on a spatially extensive benthic data set, we were able to identify coastalareas with high and low potential for the considered benthic ecosystem properties and the mea-sure of ecosystem multifunctionality. Importantly, we show that a large part of the spatial vari-ation in functional trait sub-groups and in benthic ecosystem multifunctionality was explainedby environmental change. Our results indicate that through this simplification it is possible toestimate the functionality of the seafloor. Such information is vital in marine spatial planningefforts striving to balance the utilization with the preservation of natural resources.
Key words: Baltic Sea; benthic communities; ecosystem multifunctionality; groupings of biologicaltraits; marine spatial planning; sediment ecosystem function; spatial distribution.
INTRODUCTION
A large part of the world’s population lives beside thesea and relies on the essential goods and services that themarine ecosystems provide. Simultaneously, human activ-ities are increasingly disturbing coastal environments(Halpern et al. 2008), resulting in habitat alterations anddegrading biodiversity (Lotze et al. 2006). This undermi-nes species’ contribution to important ecosystem func-tions. Ecosystem functions underlie the properties, goodsand services of an ecosystem, with ecosystem propertiesrepresenting pools of materials and process rates, andalso ecosystem stability and resilience (Hooper et al.2005). Efforts are being made to preserve the functional-ity of coastal ecosystems by implementing ecosystem-based management through marine spatial planning(MSP; Foley et al. 2010). An effective MSP should bebased on information regarding the spatial dynamics ofbiodiversity and ecosystem properties, which ensures thatthe desired ecosystem functions are, in fact, provided(Foley et al. 2010, B€ohnke-Henrichs et al. 2013).
Spatial data on biodiversity and associated ecosystemfunctions is often scarce in marine systems, due to logisti-cal difficulties with obtaining data and financial con-straints. Hence evaluations of biodiversity–ecosystemfunction relationships are often performed over smallspatial scales (Snelgrove et al. 2014), but see, e.g., Lohreret al. (2015) for an example on how field data can beused to upscale ecosystem functions across time andspace. Still, as marine ecosystems often span habitatsand environmental and anthropogenic gradients, theextrapolation of local properties onto larger scales iscomplicated, undermining our ability to assess real-worldcontributions of biodiversity to ecosystem function(Snelgrove et al. 2014). Functional biogeography, i.e., theexamination of patterns, causes, and consequences of thespatial variation in biological trait diversity, could bridgethe gap between biodiversity patterns and ecosystemsfunctions over larger scales (Violle et al. 2014).Biological traits are the morphological, physiological,
phenological or behavioral features of an organism thatdescribe its performance (Violle et al. 2014). Traits areoften used as surrogates for ecosystem properties as theyhave been documented to affect multiple ecosystemfunctions, such as nutrient cycling (Norkko et al. 2013),primary (Lohrer et al. 2015) and secondary production
Manuscript received 9 March 2017; revised 28 June 2017;accepted 3 August 2017. Corresponding Editor: �Eva E.Plaganyi.
6 E-mail: [email protected]
78
Ecological Applications, 28(1), 2018, pp. 78–94© 2017 by the Ecological Society of America

(Bolam and Eggleton 2014), and sediment erodibility(Harris et al. 2015). The trait expression of differing tax-onomic communities is found to be rather consistentover large geographic scales, as a result of environmentalfiltering (Poff 1997, Statzner et al. 2001, Bremner et al.2006, Hewitt et al. 2008, Tolonen et al. 2016). This con-sistency enables comparisons of ecological functionsover larger areas, where differences in species composi-tion could make traditional, species-based assessmentsdifficult (Bremner et al. 2003). Importantly, biologicaltraits are known to respond to environmental change(Lavorel et al. 2011) as well as anthropogenic distur-bances (Villn€as et al. 2011, 2013, Mouillot et al. 2013).Biological traits can also highlight small-scale environ-mental heterogeneity (Bremner et al. 2003). While differ-ences in functional expressions between habitats havebeen attributed to differences in organisms’ densities,within-habitat differences can be due to presence/ab-sence of individual traits (Hewitt et al. 2008).To improve the predictive performance of trait-based
approaches it is important to recognize that traits inter-act and are constrained within a species (Poff 1997, Pear-son 2001, Verberk et al. 2013, Winemiller et al. 2015,Greenfield et al. 2016). Trait interactions occur if thepossession of a certain modality inclines a species toexpress other specific features (Verberk et al. 2013).Interactions among traits are the result of the adaptiveresponses of species’ to their prevailing environment aswell as natural selection (Poff 1997, Pearson 2001, deBello et al. 2010, Verberk et al. 2013). Although the the-oretical number of random trait groupings can be poten-tially large, only a small subset of combinations mightbe present if the realized linkages among species’ traitsare accounted for. The use of trait groupings could beespecially helpful when exploring spatial variation inecosystem functioning, as they could enable the identifi-cation of trait modalities most important for the func-tions under consideration and improve the signal tonoise ratio by avoiding the averaging effect (Verberket al. 2013). The separation of overall trait compositioninto functional groups might thus increase the variationexplained by local environmental drivers (Tolonen et al.2016). An increasing number of recent studies areaccounting for the way that trait modalities interact andare constrained within a species (e.g., Sirot et al. 2015,Greenfield et al. 2016, Tolonen et al. 2016).The approach of considering combinations of biologi-
cal attributes, in terms of functional groups, has a longhistory in marine benthic ecology (e.g., Fauchald andJumars 1979, Bonsdorff and Pearson 1999, Pearson2001). We argue that such groupings of biological traitscould be particularly useful when assessing spatial varia-tion in benthic ecosystem properties across habitats andenvironmental gradients. The Baltic Sea offers the per-fect setting for exploring spatial variability in groupingsof biological traits. The structural and functional biodi-versity of the benthic communities in this estuarine areais naturally reduced due to the low salinity (Bonsdorff
2006, Villn€as and Norkko 2011), and the biological traitsof the residing species are consequently quite wellknown. Furthermore, as the potential for functionalredundancy might be lower here than in more diversesystems (Elmgren and Hill 1997), disturbances mighthave far-reaching consequences for ecosystem function-ality. Although this brackish water body is continuouslyexposed to multiple stressors, including widespreadeutrophication-induced hypoxia as a major threat tobenthic ecosystems (Conley et al. 2011, Norkko et al.2015), spatial variation in benthic ecosystem functionshas rarely been considered in ecosystem based manage-ment or marine spatial planning in the Baltic Sea. Theaim of this study is to offer a template for how to esti-mate large-scale spatial variation in benthic ecosystemproperties by using groupings of biological traits. We (1)statistically confirm trait groupings in order to (2) exam-ine large-scale spatial variation in important benthicecosystem properties and (3) explore their response toenvironmental change. We account for the fact that eachfunctional trait subgroup may have a unique contribu-tion to the cumulative expression of an ecosystem prop-erty and acknowledge that species simultaneously affectmultiple properties by illustrating the spatial pattern inbenthic ecosystem multifunctionality.We focus on three properties performed by the benthic
community, i.e., bioturbation, community stability, andjuvenile dispersal potential. These properties are keycomponents of essential functions provided by coastalbenthic ecosystems. Benthic bioturbation influences thecycling of organic matter, energy, and nutrients (Kris-tensen 2000). Specifically, size, environmental position,and reworking mode of the benthic fauna are essentialtraits that regulate biological sediment mixing, whichdirects sediment oxygen and redox gradients and ulti-mately the cycling of carbon and nutrients (Kristensen2000, Solan et al. 2004, Queir�os et al. 2013). Commu-nity stability and the potential for juvenile dispersal con-tributes to the stability and recovery potential of thebenthic ecosystem when facing environmental change(Foley et al. 2010, Pilditch et al. 2015). Traits such assize and longevity represent the stability of a community,as the presence of large, long-lived species is indicativeof a mature community (that has not been severely dis-turbed during a longer period; Pearson and Rosenberg1978). Such species can also function as facilitatorsthrough improving living conditions and offering refugiafor other species (Norkko et al. 2006, Thrush et al.2006). Furthermore, changes in body size patterns arelikely to affect predator–prey interactions, which deter-mines food web stability (Emmerson and Raffaelli 2004).From a benthic ecosystem function perspective, disper-sal, re-colonization, and connectivity are essential formaintaining biodiversity and the resilience of the ecosys-tem (Pilditch et al. 2015). Especially in shallow coastaland estuarine areas, where the benthic and pelagic realmare intimately linked, the considered properties areimportant for the functioning of the entire ecosystem
January 2018 TRAITGROUPINGS ESTIMATE FUNCTIONALITY 79

(Kristensen et al. 2014, Griffiths et al. 2017). Still, evenin open waters, the functions provided by the benthiccommunities have proven to be important from anecosystem perspective (e.g., Norkko et al. 2015, Belleyand Snelgrove 2016). Consequently, we argue that theseproperties are essential for sustaining ecosystem func-tions and services in disturbance-prone coastal areas, asexemplified in this study by focusing on the Baltic Sea.
METHODS
The sampling area was located in the northern BalticSea, at the southwestern coast of Finland (Fig. 1). Thisnon-tidal region is characterized by an irregular coast-line and an extensive archipelago of thousands ofislands. Soft-sediment benthic communities at 427 siteswere sampled in August to September of 2012. Sam-pling sites were selected by random stratification, usingmodeled depth, wave exposure, salinity, and turbidity.Generally, sites were situated within a depth range of0.5–25 m (Appendix S1: Table S1). GPS coordinates(decimal degrees) and depth were measured at all sitesat the time of sampling. The samples cover a large areaencompassing four different water types (separatedaccording to the typology of the EU Water FrameworkDirective on the basis of salinity, location, duration ofice coverage, substratum composition, and wave expo-sure [Vuori et al. 2006]). The four water types describea complex archipelago and are further divided into 17different water basins (Karonen et al. 2015), accordingto hydro-morphological, biological, and physicochemi-cal differences (Fig. 1).
Benthic macrofauna was collected with one replicatesample at each site. At 335 sites, a Petite Ponar grab sam-pler (231 cm2) was used, while 92 additional sites weresampled by a Peterson grab (450 cm2). Individual countswere converted to density (individuals/m2), and statisticalanalyses confirmed that no differences between the twosampling methods occurred (ANOSIM global R = �0.07,P = 0.97). Samples were sieved using a 0.5 mm mesh andpreserved in 70% ethanol. Species were sorted and enu-merated to the lowest practical level using a binocularmicroscope. The benthic fauna was dominated by thebivalveMacoma balthica, gastropods belonging to Hydro-biidae, the polychate complex Marenzelleria spp., as wellas species belonging to Chironomidae. Meiofauna(Turbellaria, Nematoda, Ostracoda, and Oligochaeta),pelagic (Mysidaceae, Palaemon elegans, Hydracarina), andparasitic species (Helobdella stagnalis, Piscicola spp.) wereexcluded from the data set. Wave exposure was modelledfor all the sites in the data set (Bekkby et al. 2008).For a more rigorous analysis of the relationships between
trait groupings and environmental variables, a subset of 72sites sampled in 2012 were revisited in the summer of 2013,when additional environmental variables were measured(Fig. 1; Valanko & Kauppi). The sediment was sampledwith an Ekman grab and analyzed for organic matter(LOI) and sediment grain size (gravel, 2 mm; very coarsesand, 1 mm; coarse sand, 0.5 mm; fine sand, 0.25 mm;very fine sand, >0.063 mm; and mud, <0.063 mm). Depth,bottom, and surface water salinity and temperature weremeasured with a conductivity, temperature and depthprobe, while bottom water oxygen concentration (mg/L, %)was determined with the Winkler procedure. Water
FIG. 1. The different water basins considered in this study are outlined; for basin numbers and corresponding names seeAppendix S3: Table S1. The water basins represent the following water types; the inner (light blue) and outer (dark blue)archipelago areas of the Gulf of Finland and the southwestern Finnish archipelago. Circles mark the sites sampled in 2012 whiletriangles mark the subset of sites revisited in 2013 for quantification of environmental variables. [Color figure can be viewed atwileyonlinelibrary.com]
80 ANNAVILLN€AS ET AL.Ecological Applications
Vol. 28, No. 1

transparency (Secchi depth) was assessed with a Secchidisk. Importantly, the subset of sites represented the vari-ability in environmental and benthic parameters of theextended data set (Appendix S1: Table S1).
Groupings of benthic trait modalities
Proxies of three benthic properties, i.e., the bioturba-tion potential, the stability of the community and the
potential for larval dispersal, were investigated by usingexpert definition of the biological traits contributing tothe expression of each property. In total, seven traits and26 different trait modalities were considered (Table 1).Species were assigned to these trait modalities usingpublished classifications as well as taxonomic and mor-phologic sources of information (e.g., Fish and Fish1996, MarLIN 2006, Valanko et al. 2010, T€ornroos andBonsdorff 2012). To account for the multiple modalities
TABLE 1. Traits and trait modalities selected to represent the considered benthic ecosystem properties (EP) and functions (EF).
Ecosystem function, ecosystem property, trait groups, trait modalities Explanation
Nutrient cycling, bioremediation of waste, sediment stabilityBioturbation potentialSediment reworking mode
No transportSurficial modifier modifies the sediment surfaceTube-dweller builds and dwells in a tubeBio diffuser moves particles in random manner over short distancesGallery diffuser excavates burrows, particles moved by biodiffusion
or directlyEnvironmental position
Infauna top in the uppermost 2 cm of the sedimentInfauna bottom in deeper layers of the sediment (2–5 cm)Pelagic in the water columnEpibenthic on the sediment surface
Maximum sizeVery small <0.001 gSmall 0.001–0.01 gMedium 0.01–0.1 gLarge 0.1–1.0 g
ResilienceStability
Longevity<1 yr1–2 yr2–5 yr5–10 yr
Maximum sizeVery small <0.001 gSmall 0.001–0.01 gMedium 0.01–0.1 gLarge 0.1–1.0 g
Dispersal, recovery, resiliencePotential for juvenile dispersal
Reproductive frequencySemelparous breeds only once, then diesAnnual episodic breeds every year in discrete periodsAnnual protracted breeds every year during an extended period
Larval typeDirect development development without a larval stageLecitotrophic larvae nourished on internal resourcesPlanktotrophic larvae feed on planktonic material
Duration of planktonic larval stageNone no planktotrophic larval stagePlanktotrophic_days planktotrophic larvae during daysPlanktotrophic_month planktotrophic larvae during month(s)
January 2018 TRAITGROUPINGS ESTIMATE FUNCTIONALITY 81

species usually express within a trait, the fuzzy codingprocedure (Chevenet et al. 1994) was used, allowing spe-cies relative affinity to modalities to differentiate, sum-ming up to 1 within a trait. The fuzzy coded traitexpressions of individual species were scaled up by cor-recting each modality for species- and sample-specificabundances, creating a site-by-trait matrix.Groups of traits expected to contribute to the magni-
tude of each property at a site were defined (i.e., func-tional trait groups; see Table 1) and each species wasthen assigned to a single functional trait subgroup (notfuzzy coded) that represented its maximum potential for
benthic bioturbation, stability and dispersal (Figs. 2, 3,Table 2). For estimating benthic bioturbation potential,traits representing faunal environmental position, sedi-ment reworking mode, and maximum size were consid-ered and five subgroups representing different degrees ortypes of bioturbation were defined (Table 2). To estimatethe stability of the benthic community, species’ longevityand maximum size were used to define three subgroupsrepresenting different contributions to community stabil-ity (Table 2). Finally, the potential for larval dispersal(here represented by reproductive frequency, larval type,and the duration of planktonic larval stage) has
Trait modali�es
1. Non-random trait interac�ons
Trait Subgroup 1 Subgroup 2 Subgroup 3
Ecosystem proper�es
A B C
Ecosystem mul�func�onality
2. Importance for ecosystem proper�es
Envi
ronm
ent
3. Mul�ple, interconnected proper�es
FIG. 2. Conceptual figure identifying (spatial) patterns in ecosystem multifunctionality by using groupings of biological traits.As a result of environmental filtering, species’ traits do non-randomly interact (1) enabling the identification of subgroups of traitshaving differing importance (2; width of arrows) for directing ecosystem properties. The simultaneous contribution of species tomultiple, interacting properties (3) is considered by combining several properties in an estimation of ecosystem multifunctionality.[Color figure can be viewed at wileyonlinelibrary.com]
82 ANNAVILLN€AS ET AL.Ecological Applications
Vol. 28, No. 1

traditionally been considered important for re-coloniza-tion over large scales (e.g., Whitlatch et al. 1998, Pilditchet al. 2015). Four subgroups representing differentdegrees of larval dispersal in space and time were defined(Table 2).For each functional-trait grouping, the relations bet-
ween the biological trait modalities comprising the sub-groups were explored by using multivariate analyses (e.g.,Figs. 2, 3). The trait similarity matrix underlying theanalyses was based on Whittaker’s index of association,calculated on square-root-transformed and standardizeddata. Starting from the site-by-trait matrix, SIMPROF 2and 3 tests were performed to objectively detect associa-tions between trait modalities for each ecosystem prop-erty. SIMPROF 2 was used to test whether thecombinations of biological traits exhibited by a specieswere random or whether there is some structure (rela-tionship) between traits. Sub-groups of traits were furtheridentified with cluster analyses (complete linkage) and
SIMPROF 3 was used to explore the uniformity of traitsimilarities within subgroups (Clarke et al. 2014). Finally,the trait combinations were inspected with coherent spe-cies curves and compared with the subgroups identifiedby expert opinion (Fig. 3).
Spatial patterns in benthic ecosystem properties
To identify functionally diverse sites, the number ofspecies, trait modalities and functional trait subgroupswere calculated for each site. The relationship betweenthese variables was examined with nonparametric Spear-man q. The nonparametric Kruskal-Wallis test was usedto detect differences in the number of functional traitsub-groups between water basins. Significance values forpairwise comparisons were adjusted by the Bonferronicorrection for multiple tests (Fig. 3).Spatial differences in functional trait sub-groups
between water basins were examined and the subgroups
Biological traitsIdentificaiton of importantgroups of traits directing EP
Trait subgroupsRe-appointment of spp. and individuals to trait subgroups(based on matrix 1)
Ecosystem propertyThe sum of weighted and abundance-corrected traitsubgroups
Estimation of multifunctionaliyThe sum of values of severalproperties.
Spatial differences:Univariate: Kruskal-Wallis (SPSS)Multivariate: ANOSIM and SIMPER (PRIMER).As directed by environmental variables: DISTLM (PERMANOVA+)
Spatial differences: Spatial clustering and outlieranalysis (Local Moran’s I; ArcGIS)As directed by environmentalvariables: DISTLM (PERMANOVA+)
Underlying estimationsand analyses
Assessment of change: statistical analyses
Species by trait matrix (1)Site by trait matrix (2) (Fuzzy coded and abundancecorrected)
Cluster, SIMPROF, coherentspp. curves (PRIMER; basedon matrix 2)
Each property is assigned a value relative to its max. potential, based on itspercentile distribution
Step 1
Step 2
Step 3
Sub-groups areweighted according to their impact on theproperty (0–3: no to high impact)
FIG. 3. Template for using biological trait groupings when exploring variation in ecosystem properties (EP) and multifunction-ality. Groups of traits important for directing ecosystem properties are selected. Subgroups of traits are identified by expert opinionand statistically confirmed from a site-by-trait matrix (Step 1). The subgroups are scored according to their estimated (0–3; no tohigh) impact on the property under consideration (Step 2). The cumulative expression of one property represents the sum of itsweighed and abundance-corrected trait sub-groups. For evaluating ecosystem multifunctionality, each property is ranked (based onits percentile distribution) and assigned a value relative to its maximum (max., Step 3). Individual property values are summed tocreate an overall estimation of ecosystem multifunctionality. Univariate as well as multivariate analyses can be used for assesschange. Please note that Step 1–3 also correspond to the numbers given in Fig. 2. All phases involving literature-based assessmentsor expert judgement are shown in italic typeface.
January 2018 TRAITGROUPINGS ESTIMATE FUNCTIONALITY 83

contributing to these were identified (one-way ANOSIMand SIMPERof Bray-Curtis similarities [Fig. 3]). The Bray-Curtis measures were based on square-root-transformeddata, and the analyses were performedwith the PRIMER 7software (Clarke et al. 2014, Clarke andGorley 2015).Finally, in order to estimate the cumulative expression
of each property (i.e., bioturbation, stability, and juve-nile dispersal) at a site, the functional trait subgroupswere scored according to their weighted impact on eachproperty. Trait groupings estimated to have a greaterimpact on the considered property got a higher value(0, no impact; 1, low; 2, medium; and 3, high; Table 2,
Fig. 2). The sum of these scored, abundance-correctedtrait groupings represent the cumulative expression of aproperty at a site (Fig. 3).
Estimation of multifunctionality
All three properties, i.e., bioturbation, stability, andjuvenile dispersal were considered when estimating thepotential for benthic ecosystem multifunctionality(EMF). Each property was assigned a value relative toits observed cumulative expression in the study area.Observations were divided into percentiles (the 25th,
TABLE 2. Sub-groups of traits depicting benthic ecosystem properties such as bioturbation, stability and larval dispersal.
Species
Groupings of biological traits
Bioturbation Stability Dispersal
Sub-groups Impact score Sub-groups Impact score Sub-groups Impact score
Halicryptus spinulosus B5 3 S3 3 D2 1Cyanophthalma obscura B3 2 S1 1 D2 1Macoma balthica B4 3 S3 3 D4 3Mytilus trossulus B0 0 S3 3 D4 3Mya arenaria B4 3 S3 3 D4 3Cerastoderma spp. B3 2 S3 3 D4 3Anodonta spp. B3 2 S3 3 †Theodoxus fluviatilis B1 1 S2 2 D2 1Valvata spp. B1 1 S1 1 D2 1Hydrobia spp. B1 1 S1 1 D3, D4 3Potamopyrgus antipodarum B1 1 S1 1 D2 1Bithynia tentaculata B1 1 S1 1 D2 1Limapontia capitata B1 1 S1 1 D3 2Alderia modesta B1 1 S1 1 D3 2Marenzelleria spp. B5 3 S2 2 D4 3Bylgides sarsi B3 2 S1 1 D4 3Nereis diversicolor B5 3 S2 2 D1 1Polydora redeki B2 2 S1 1 D4 3Pygospio elegans B2 2 S1 1 D4 3Manayunkia aestuarina B2 2 S1 1 D2 1Idotea spp. B0 0 S1 1 D2 1Saduria entomon B3 2 S3 3 D1 1Asellus aquaticus B0 0 S2 2 D1 1Jaera spp. B0 0 S1 1 D2 1Gammarus spp. B1 1 S1 1 D2 1Monoporeia affinis B3 2 S2 2 D1 1Corophium volutator B5 3 S1 1 D1 1Crangon crangon B3 2 S2 2 D4 3Chironomidae B2 2 S1 1 D1 1Chironomus spp. B2 2 S1 1 D1 1Ephemeroptera B2 2 S1 1 D1 1Trichoptera B2 2 S1 1 D2 1
Notes: The estimated contribution of each subgroup to the overall potential for a benthic ecosystem property is scored as 0, noimpact; 1, low; 2, medium; and 3, high impact. The following subgroupings were identified: bioturbation (B; 0, no transport orpelagic; 1, small individual or epibenthic surface modifier; 2, very small individual or tube dweller or infauna top; 3, biodiffuser,infauna top; 4, large biodiffuser, infauna bottom; and 5, medium-sized gallery diffuser); stability (S; 1, small, short-lived species[<2 yr]; 2, medium-sized species with a life span of 2–5 yr; 3, large, long-lived species [5–10 yr or more]); dispersal (D; 1, semel-parous reproductive frequency, direct development without a planktotrophic larval stage; 2, annual reproductive frequency, directdevelopment, no planktotrophic larval stage; 3, lecitotrophic larvae with a short planktotrophic larval stage; 4, annually episodicor protracted reproductive frequency, planktotrophic larvae during months).†Not included in juvenile dispersal potential, as reproduction in Anodonta spp. involves a parasitic stage (in fish; Haukioja andHakala 1978), complicating the dispersal assessment.
84 ANNAVILLN€AS ET AL.Ecological Applications
Vol. 28, No. 1

50th, 75th, and 95th percentile), where observations inthe first quartile got the lowest functional value (1), thesecond a value of 2, and so on, while observations abovethe 95th percentile were given a value of 5. Values werethen summed across properties to provide an overallestimation of benthic EMF at a site (Figs. 2, 3). Spatialclustering and outlier analysis (Local Moran’s I; Anselin1995) was used to analyze the standardized spatial struc-ture of each cumulative property and the estimation ofEMF separately (Fig. 3). Local Moran’s I z scores wereused to find clusters of sites with high values (HH) andlow values (LL) relative to the average of all sites, andoutlier sites that have either high values (HL) or lowvalues (LH) relative to neighboring sites. The falsediscovery rate method was used to correct P values formultiple tests (Benjamini and Hochberg 1995) and datawas fourth-root transformed prior to analyses to reduceskewness. The spatial analyses were conducted in Arc-GIS 10.2 (ESRI, Redlands, California, USA).
Environmental parameters directing benthicecosystem functionality
Distance based linear models (DISTLM) were used toidentify environmental parameters most related to thespatial patterns in the functional trait subgroups repre-senting each property and to the estimate of EMF(Fig. 3) using the subset of 72 sites with the additionalenvironmental parameters available. The responsematrix consisted of site data of the abundance-correctedfunctional trait subgroups or the overall estimation ofEMF, while environmental parameters were depth (m),wave exposure, sediment organic matter (%), grain size(%), bottom and surface water temperature (°C), bottomwater salinity, oxygen content (%), and the Secchi depth.Due to high observed correlations between sedimentorganic matter and mud and coarse sand with both verycoarse sand and fine sand, models were constrained toonly use one of each of these sets. Final inclusion of pre-dictor variables in the model was based on AIC criteriaand a forward as well as a backward selection procedure.The DISTLM analyses were performed with the PRI-MER PERMANOVA+ package (Anderson et al. 2008).
RESULTS
Groupings of biological traits
SIMPROF tests suggested that there were strong asso-ciations between trait modalities important for benthicbioturbation (SIMPROF 2, Pi = 12.67, P = 0.0001;SIMPROF 3, Pi = 17.34, P = 0.0001). Cluster analysisdistinguished five different functional trait subgroups thatwere combined with, at least, 64% similarity (Table 2;Appendix S2: Fig. S1A). The traits “pelagic” and “no sedi-ment transport” could not be statistically separated fromone another and were thus considered as one subgroup(impact scoring for overall bioturbation potential; 0).
Another subgroup was created by traits describing smallindividuals and epibenthic surface modifiers, while thenext sub-group consisted of tube dwellers and infauna inthe top sediment layer (impact scoring 1 and 2, respec-tively). The traits “large” and “biodiffuser” were statisti-cally inseparable, and were grouped together with“infauna bottom” creating the following subgroup (impactscoring 3). Finally, medium-sized gallery diffusers createdthe last functional sub-group depicting benthic bioturba-tion (impact scoring 3). However, the hypothesized traitcombination “biodiffuser, in the upper part of the sedi-ment (top 2 cm)” was not discerned by the cluster analy-ses. It was still accounted for in the subsequent analyses,and scored as having a medium impact (2) for the overallbioturbation potential (Table 2; Appendix S2: Fig. S1A).For traits related to the stability of the benthic com-
munity, three different trait groupings were discerned(SIMPROF 2, Pi = 12.92, P = 0.0001; SIMPROF 3,Pi = 12.93, P = 0.0001). The traits large body size and alife span of 5–10 yr could not be statistically separatedfrom one another (impact scoring for overall stabilitypotential 3). Likewise, the traits medium size and a long-evity of 2–5 yr were grouped together (impact scoring2). The third trait combination described small (verysmall and small) and short-lived (<1 yr, 1–2 yr) species(impact scoring 1; Table 2; Appendix S2: Fig. S1B).Traits describing juvenile dispersal potential also showed
associations between modalities (SIMPROF 2, Pi = 13.27,P = 0.0001; SIMPROF 3, Pi = 29.27, P = 0.0001). Clusteranalysis discerned three different subgroupings, withinwhich trait modalities showed at least 62% similarity(Table 2; Appendix S2: Fig. S1C). Trait attributes describ-ing a semelparous reproductive frequency, direct develop-ment, and no planktotrophic larval stage were closelygrouped together (impact scoring for overall dispersalpotential, 1). Lecitotrophic development strategy and ashort planktotrophic larval stage (days) could not be statis-tically separated, creating another functional subgroup(impact scoring, 2). The third grouping, describing specieswith annually protracted and episodic reproductive fre-quencies and planktotrophic development with larvae inthe plankton during month(s), was considered to have highimpact (3) on the community dispersal potential. Still, oneadditional combination of attributes was predicted fromthe expressed benthic features, namely “annual repro-ductive frequency,” “direct development,” and “noplanktotrophic larval stage” (impact scoring, 1). Thesubgroupings of different trait modalities were sup-ported by the pattern displayed by coherent traitcurves (results not shown).
Spatial variation in subgroups of functional traits
The number of biological trait modalities and func-tional trait subgroups observed at a site were significantlycorrelated with each other and with the number of species(q ≥ 0.8, P < 0.001, N = 426). The average number ofspecies at the 427 sites was 5.0 � 2.6 (mean � SD), while
January 2018 TRAITGROUPINGS ESTIMATE FUNCTIONALITY 85

FIG.4.
Exp
ressionof
traitsubg
roup
sthat
describe
benthicbioturba
tion
.B0,
notran
sportor
pelagic;B1,
smallind
ividua
lsor
epibenthicsurfacemod
ifiers;B
2,very
smallind
ividua
lsor
tube
dwellers
orinfaun
atop;
B3,
biod
iffusers,infau
natop;
B4,
largebiod
iffusers,infau
nabo
ttom
;and
B5,
medium-sized
gallery
diffusers.The
size
andcolorof
thecirclecorrespo
ndsto
the
numberof
individu
alsexpressing
acertaintraitsubg
roup
atasite.[Color
figu
recanbe
view
edat
wileyo
nlinelibrary.com
]
86 ANNAVILLN€AS ET AL.Ecological Applications
Vol. 28, No. 1
a maximum of 15 species was found at a site. The numberof biological trait modalities and functional-trait sub-groups were, on average, 18.7 � 5.4 and 8.2 � 2.7, respec-tively, with maximum values of 26 and 13 (Appendix S3:Table S1). In the outermost water basin both high abun-dances and a high number of functional trait sub-groupswas observed (Appendix S3: Table S1). Benthic communi-ties in this basin differed in terms of functional trait sub-groups to inner archipelago basins, which had lowerfunctional diversity (Kruskal-Wallis nonparametric test;v2 = 76.18, df = 16, P < 0.001, Appendix S3: Table S1).
Bioturbation potential
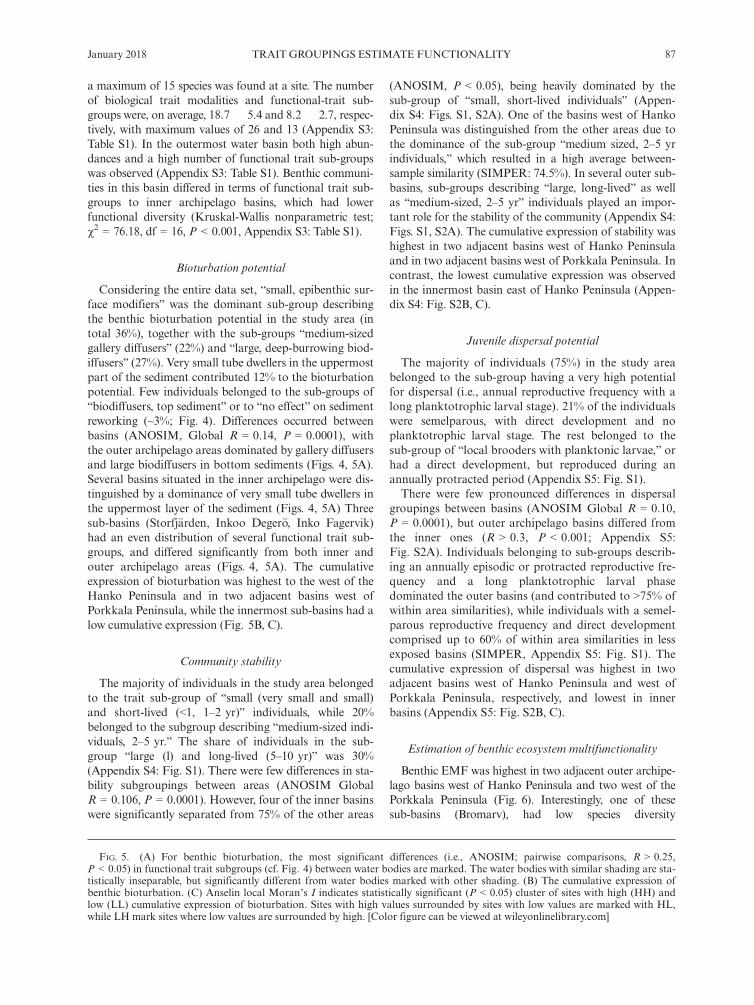
Considering the entire data set, “small, epibenthic sur-face modifiers” was the dominant sub-group describingthe benthic bioturbation potential in the study area (intotal 36%), together with the sub-groups “medium-sizedgallery diffusers” (22%) and “large, deep-burrowing biod-iffusers” (27%). Very small tube dwellers in the uppermostpart of the sediment contributed 12% to the bioturbationpotential. Few individuals belonged to the sub-groups of“biodiffusers, top sediment” or to “no effect” on sedimentreworking (~3%; Fig. 4). Differences occurred betweenbasins (ANOSIM, Global R = 0.14, P = 0.0001), withthe outer archipelago areas dominated by gallery diffusersand large biodiffusers in bottom sediments (Figs. 4, 5A).Several basins situated in the inner archipelago were dis-tinguished by a dominance of very small tube dwellers inthe uppermost layer of the sediment (Figs. 4, 5A) Threesub-basins (Storfj€arden, Inkoo Deger€o, Inko Fagervik)had an even distribution of several functional trait sub-groups, and differed significantly from both inner andouter archipelago areas (Figs. 4, 5A). The cumulativeexpression of bioturbation was highest to the west of theHanko Peninsula and in two adjacent basins west ofPorkkala Peninsula, while the innermost sub-basins had alow cumulative expression (Fig. 5B, C).
Community stability
The majority of individuals in the study area belongedto the trait sub-group of “small (very small and small)and short-lived (<1, 1–2 yr)” individuals, while 20%belonged to the subgroup describing “medium-sized indi-viduals, 2–5 yr.” The share of individuals in the sub-group “large (l) and long-lived (5–10 yr)” was 30%(Appendix S4: Fig. S1). There were few differences in sta-bility subgroupings between areas (ANOSIM GlobalR = 0.106, P = 0.0001). However, four of the inner basinswere significantly separated from 75% of the other areas
(ANOSIM, P < 0.05), being heavily dominated by thesub-group of “small, short-lived individuals” (Appen-dix S4: Figs. S1, S2A). One of the basins west of HankoPeninsula was distinguished from the other areas due tothe dominance of the sub-group “medium sized, 2–5 yrindividuals,” which resulted in a high average between-sample similarity (SIMPER: 74.5%). In several outer sub-basins, sub-groups describing “large, long-lived” as wellas “medium-sized, 2–5 yr” individuals played an impor-tant role for the stability of the community (Appendix S4:Figs. S1, S2A). The cumulative expression of stability washighest in two adjacent basins west of Hanko Peninsulaand in two adjacent basins west of Porkkala Peninsula. Incontrast, the lowest cumulative expression was observedin the innermost basin east of Hanko Peninsula (Appen-dix S4: Fig. S2B, C).
Juvenile dispersal potential
The majority of individuals (75%) in the study areabelonged to the sub-group having a very high potentialfor dispersal (i.e., annual reproductive frequency with along planktotrophic larval stage). 21% of the individualswere semelparous, with direct development and noplanktotrophic larval stage. The rest belonged to thesub-group of “local brooders with planktonic larvae,” orhad a direct development, but reproduced during anannually protracted period (Appendix S5: Fig. S1).There were few pronounced differences in dispersal
groupings between basins (ANOSIM Global R = 0.10,P = 0.0001), but outer archipelago basins differed fromthe inner ones (R > 0.3, P < 0.001; Appendix S5:Fig. S2A). Individuals belonging to sub-groups describ-ing an annually episodic or protracted reproductive fre-quency and a long planktotrophic larval phasedominated the outer basins (and contributed to >75% ofwithin area similarities), while individuals with a semel-parous reproductive frequency and direct developmentcomprised up to 60% of within area similarities in lessexposed basins (SIMPER, Appendix S5: Fig. S1). Thecumulative expression of dispersal was highest in twoadjacent basins west of Hanko Peninsula and west ofPorkkala Peninsula, respectively, and lowest in innerbasins (Appendix S5: Fig. S2B, C).
Estimation of benthic ecosystem multifunctionality
Benthic EMF was highest in two adjacent outer archipe-lago basins west of Hanko Peninsula and two west of thePorkkala Peninsula (Fig. 6). Interestingly, one of thesesub-basins (Bromarv), had low species diversity
FIG. 5. (A) For benthic bioturbation, the most significant differences (i.e., ANOSIM; pairwise comparisons, R > 0.25,P < 0.05) in functional trait subgroups (cf. Fig. 4) between water bodies are marked. The water bodies with similar shading are sta-tistically inseparable, but significantly different from water bodies marked with other shading. (B) The cumulative expression ofbenthic bioturbation. (C) Anselin local Moran’s I indicates statistically significant (P < 0.05) cluster of sites with high (HH) andlow (LL) cumulative expression of bioturbation. Sites with high values surrounded by sites with low values are marked with HL,while LH mark sites where low values are surrounded by high. [Color figure can be viewed at wileyonlinelibrary.com]
January 2018 TRAITGROUPINGS ESTIMATE FUNCTIONALITY 87

88 ANNAVILLN€AS ET AL.Ecological Applications
Vol. 28, No. 1

(Appendix S3: Table S1) but high EMF, due to the pres-ence of a species complex important for all of the consid-ered benthic ecosystem properties, Marenzelleria spp.Clusters of sites with low EMF in the innermost archipe-lago were also identified, while outliers were common inone sub-basin situated in the middle archipelago (Fig. 6).
Environmental variables related to functional traitgroupings and benthic ecosystem multifunctionality
The most important environmental drivers of the func-tional trait subgroups describing benthic bioturbationwere temperature stratification of the water column,
FIG. 6. Overall estimation of benthic ecosystem multifunctionality along the southwest Finnish coast. Three ecosystem proper-ties are assessed, i.e., bioturbation, stability, and juvenile dispersal. Each property was assigned a functional value relative to itsmaximum, and the individual property values were summed to reach an overall estimation of benthic ecosystem multifunctionality.Clusters of sites with values of similar magnitude are marked, as well as outliers (P < 0.05, for explanation of labels, see Fig. 5).[Color figure can be viewed at wileyonlinelibrary.com]
TABLE 3. Results of variation partitioning analyses (DISTLM) quantifying the marginal and partial effects of environmentalvariables on the functional trait subgroups describing benthic bioturbation, stability and juvenile dispersal, as well as on theoverall estimation of benthic ecosystem multifunctionality (EMF).
Variable
Bioturbation(AIC = 471.0,R2 = 32.8)
Stability(AIC = 446.0,R2 = 38.9)
Juvenile dispersal(AIC = 437.2,R2 = 46.5)
EMF(AIC = 110.2,R2 = 62.4)
Marg. Part. AIC Marg. Part. AIC Marg. Part. AIC Marg. Part. AIC
OM (%) 10.8* 6.8** 473.6 13.7** 10.2** 453.4 18.5** 18.5** 454.5 36.6** 36.6** 134.1O2 (%) 10.1** 8.9** 477.4 11.0** 4.9* 446.1 10.2** 2.9*** 439.9 14.0* 2.3ns 120.1Salinity 7.9** 4.9* 471.0 8.6* 6.8** 449.1 10.4** 4.3* 442.2 8.5*** 3.7* 121.3Temp.diff. (°C) 12.2** 12.2** 482.4 17.0** 17.0** 459.9 7.5* 1.9ns 438.4 2.5ns 5.0* 114.7Depth (m) 10.6** 14.9** 6.9* 13.8** 437.2 0.005nsTemp. (°C) 10.2** 14.9** 7.1* 1.2ns 2.1ns 111.5Secchi depth 6.0* 6.4* 9.9** 11.4*Exposure 7.0** 10.0** 9.6** 8.0***Gravel 1.1ns 1.0ns 2.5ns 7.1***Very coarse sand 4.8* 5.5*** 11.1** 2.9*** 441.1 14.8**Fine sand 3.7*** 4.2*** 6.8* 10.3*Very fine sand 9.7** 12.3** 17.3** 2.8*** 438.7 34.5** 2.0ns 110.2
Notes: The marginal test (Marg.) represents the relationship between the response data cloud and an individual explanatory vari-able alone, while the partial (Part.) test describes this relationship after fitting the other variables. AIC, Akaike informationcriterion, where lower values describe a better model; OM, organic matter; Temp.diff., difference between surface and bottom watertemperature (°C).*P < 0.05, **P < 0.01, ***P < 0.001, ns P > 0.05.
January 2018 TRAITGROUPINGS ESTIMATE FUNCTIONALITY 89

bottom water oxygen and salinity content, and the sedi-ment organic matter content (total R2: 32.8%, Table 3).All trait subgroups describing bioturbation were repre-sented in well-oxygenated, coarse, sandy sediments, whilemedium-sized gallery diffusers and, especially, very smalltube dwellers in the uppermost part of the sedimentbecame more common as bottom water oxygen contentdecreased and sediment organic matter content increased.Environmental parameters could describe a large part
of the variation in trait subgroups portraying benthicstability (total R2: 38.9%; Table 3). Again, temperaturestratification, sediment organic matter content, bottomwater oxygen and salinity were the most important envi-ronmental drivers (Table 3). All trait groupings weremost abundant at sites with high oxygen and salinity val-ues, where sediment organic matter was low.Functional trait subgroups describing juvenile disper-
sal were foremost predicted by sediment organic matterand depth (total R2: 46.5%, Table 3). Functional traitsubgroups representing a higher dispersal potential werefound to be more common at sites with coarser sedi-ments, while sites with higher organic matter contentand less oxygen and salinity in bottom waters (oxygenand salinity together explaining 7.2% of the totalvariation, Table 3), were characterized by individualswith a lower dispersal potential, displaying a semel-parous reproductive frequency, direct development, andno planktotrophic larval phase.The variation in benthic EMF was strongly related to
single environmental predictors describing sedimentproperties, water column stratification as well as bottomwater salinity (Table 3). Overall, 62.4% of the variationin EMF could be explained, with sediment organic mat-ter alone being able to explain 36.6% (P = 0.0001) of thetotal variation (Table 3).
DISCUSSION
Our study is able to identify coastal areas (currentmarine management basins) with high and low potentialfor benthic bioturbation, stability, and juvenile dispersal,based on groupings of biological traits. We also demon-strate that the functional trait subgroups are the onesthat occur naturally for the resident species and by scor-ing them according to their weighted ecological impact,an actual representation of benthic ecosystem propertieswas gained. We furthermore offer an overall estimate ofbenthic ecosystem multifunctionality (EMF), whichsums over the considered properties. Importantly, weshow that a large part of the spatial differences in traitgroupings as well as the estimate of multifunctionality isexplained by environmental information. Hence, weargue that this study can provide a template for estimat-ing differences in ecosystem functionality over large geo-graphical scales, information sorely needed in marinemanagement and spatial planning efforts striving to bal-ance the utilization with the preservation of naturalresources.
The quantification of ecosystem functions and servicesin marine areas is complicated by ecological complexity,functional scale dependency, and a lack of data (Town-send et al. 2014) and there is a need for alternativeapproaches to evaluate ecosystem functionality. This hasbeen increasingly recognized and studies to date haveestimated the spatial variability in ecosystem functionsby, for example, considering variation in the number oftraits important for ecosystem processes (Rees et al.2012) or by identifying differences in the trait expressionof benthic communities between contrasting environmen-tal settings (Bolam et al. 2017). Studies have also usedestablished proxies to assess the spatial variability in sin-gle ecosystem functions such as secondary production(Bolam and Eggleton 2014) or bioturbation (Goginaet al. 2017). Interestingly, hot spots for ecosystem func-tionality have also been identified by encompassing arange of ecosystem processes in several habitats (Eyreand Maher 2011). By quantifying each individual ecosys-tem process, using measured process rates and areaextent of the habitat, the functional importance of eachhabitat to overall ecosystem multifunctionality was esti-mated (Eyre and Maher 2011). Furthermore, where dataare scarce, the potential for multiple ecosystem serviceshas been mapped through defining them from a series ofprinciples based on current ecological understanding andby linking these to marine biophysical parameters(Townsend et al. 2014). Utilizing a spatially large dataset, as well as expert knowledge, our study takes theabove mentioned approaches a step forward by offering atemplate on how to identify and score relevant functionaltrait subgroupings for estimating a range of ecosystemproperties, resulting in an overall approximation ofecosystem multifunctionality.In this study, we used groupings of biological traits as a
proxy for benthic ecosystem properties. By starting froma species by traits matrix with abundance-corrected, fuzzycoded data, we recognize that species’ affinities to differ-ent trait modalities do vary. Interestingly, despite the largenumber of possible combinations among trait modalitiesfor each process, our study identifies that traits do notoccur randomly and that only a smaller number ofcombinations are realized, simplifying the assignation ofspecies to trait subgroups that represent ecosystem prop-erties. Such trait interactions can be a result of trade-offs(i.e., the investment in one trait modality leaves fewerresources available for another), spin offs (selection favorstraits modalities that act together), or a result of con-straints (Verberk et al. 2013). For example, we found thata semelparous reproductive frequency often favored directdevelopment of juveniles. This trade-off increases the sur-vival probability for the juveniles at the expense of adultsurvival (Giangrande et al. 1994). As predicted by therate of living theory, we also observed that larger animalshad a longer life span than smaller species, which couldbe considered as a spin-off directed by metabolic rate(Brown et al. 2004). When describing the benthic biotur-bation potential, a constrained interaction is exemplified
90 ANNAVILLN€AS ET AL.Ecological Applications
Vol. 28, No. 1

by the epibenthic fauna, which mainly modified the sedi-ment surface (cf. Pearson 2001).However, another explanation for the small number of
trait interactions observed could be the reduced speciesdiversity occurring in the Baltic Sea. The current distri-bution of species in the Baltic Sea is a result of strongenvironmental filtering (Bonsdorff 2006), implying thatspecies present are adapted to a few environmental nichesand likely to present a similar combination of traits. Forexample, the variation in benthic community structure inour examined study area has been suggested to be aresult of similar responses of species’ to an underlyingenvironmental gradient across sites (Valanko et al. 2015).How trait modalities interact is an important avenue fornew research. It would improve our understanding ofspecies-environment relationship (Poff 1997), and be fun-damental for estimating effects of species on ecosystemproperties. Convergent evolution in response to environ-mental features is one of the strongest arguments for cat-egorization of traits (Winemiller et al. 2015). This makesthe geologically young Baltic Sea an ideal setting to eval-uate trait interactions.One essential finding of this study is that the identified
trait sub-groups differ in functionality compared to theuse of single traits. It is clear that consideration of singletrait modalities does not describe the functionality of theecosystem. For example, consider the modality “large”and its importance for benthic bioturbation. Bivalvessuch as Macoma balthica and Mytilus trossulus can bothbe “large,” but only Macoma affects benthic bioturbation(as Mytilus is an epibenthic species). Our study makesuse of mechanisms demonstrated from the literature toderive weighting that estimate the impact of a trait sub-group on a property, acknowledging that certain func-tional groups are more important for sustaining benthicecosystem functionality than others (cf. Foley et al. 2010,Norkko et al. 2013, Lohrer et al. 2015). For example,large gallery and biodiffusers in deeper parts of the sedi-ment are known to oxygenate the sediment, which stimu-lates microbial activity and can enhance overall nutrientbinding (PO4
3�) and/or removal (N2; Kristensen 2000).These trait subgroups were thus considered to have ahigher impact on sediment bioturbation than, for exam-ple, small epibenthic surface modifiers, known to mainlybioturbate and resuspend the top centimeter of the sedi-ment (Orvain et al. 2004).By using trait groupings to estimate benthic ecosystem
properties, we found pronounced divergences betweenouter, exposed archipelago areas and the innermost shel-tered sites. In the outer archipelago areas, benthic faunagenerally displayed higher functional diversity and alsoexpressed a greater cumulative expression for bioturba-tion, stability, and juvenile dispersal. In general, thesemore exposed outer areas had a higher salinity and coar-ser sediments than the inner sites. Their fauna was diverseand abundant, and their ecological status (based on theBrackish Water Benthic Index; Perus et al. 2007) has beenfound to be higher compared to the inner archipelago
sites (Snickars et al. 2016). The similarity in spatial pat-terns observed for the cumulative expression of the threeproperties suggests that no trade-offs between the consid-ered properties existed (de Bello et al. 2010, Lefchecket al. 2015). For example, large biodiffusers deep in thesediment had high potential for dispersion (breeding everyyear and having a long planktotrophic larval stage) andwere considered to increase the stability of the benthiccommunity (long life span). Such synergies betweenecosystem properties can enable the identification of func-tionally important areas, serving as “hotspots” also frombiodiversity and marine spatial planning perspective (cf.Foley et al. 2010, Lavorel et al. 2011) and highlight theimportance of a few, abundant, key species for overallecosystem functioning (cf. Norkko et al. 2013). Consider-ing their disproportionate impact, it is suggested thatecosystem-based marine spatial planning efforts shouldaim to preserve and, if necessary, restore such populationsof functionally important species (Foley et al. 2010).Interestingly, however, due to high abundance of one
functionally important taxon, Marenzelleria spp., basinscould express high multifunctionality although havingonly a moderate diversity (in terms of species and traitcombinations). Marenzelleria spp. is an invasive surfacedeposit feeder and an efficient bioirrigator that buriesdeeper into the sediment than other resident species(Renz and Forster 2013) and adds new functionality tothe native communities (Hewitt et al. 2016, Kauupiet al. 2017). This species is known to be tolerant againstdisturbances and can endure low oxygen conditions(Norkko et al. 2012), indicating that conditions at a sitedo not have to be good for all species in order to exhibithigh levels of multifunctionality.Although high diversity might not be a requirement for
the maintenance of benthic ecosystem functions even inlow-diverse systems such as the Baltic Sea (Elmgren andHill 1997), preserving or restoring species and functionaldiversity will be essential for sustaining ecosystem servicesfrom a management point of view (Foley et al. 2010,Greenfield et al. 2016). This is especially important incases where the loss or reduction of individual species canlead to the loss of an entire functional group, with harm-ful consequences for benthic ecosystem functions (Elm-gren and Hill 1997, Norkko et al. 2013, Greenfield et al.2016). Indeed, our results showed that the inner waterbasins, characterized by a low potential for the examinedecosystem properties, had benthic communities express-ing fewer and less influential trait groupings for benthicbioturbation, stability, and dispersal. Still, a majority ofthe considered water basins could not be separatedaccording to differences in functional trait subgroups,and the variability in the estimations of ecosystem proper-ties within water basins was generally high. Between 32and 47% of the variation in single ecosystem propertiescould be explained by environmental factors. Interest-ingly, the overall estimate of benthic ecosystem multifunc-tionality gained the highest explanatory power (62%) andwas foremost directed by variation in sediment organic
January 2018 TRAITGROUPINGS ESTIMATE FUNCTIONALITY 91
content. It is important to highlight that the variation inbenthic properties and ecosystem multifunctionality canbe explained by environmental variables indicative ofeutrophication-induced hypoxia, the most prominent dis-turbance of benthic habitats in the Baltic Sea (Conleyet al. 2011). It suggests that this template could be usedto evaluate what benthic ecosystem functions might belost in case of stress (Mouillot et al. 2013) and providesmanagers with a method to assess human impact, whichis essential for resource planning and ecosystem basedmanagement (Townsend et al. 2014).The suggested template for estimating properties of the
benthic ecosystem and combining these to a measure ofmultifunctionality is an approach driven by expert opin-ion as well as large-scale data. In addition to the litera-ture-based weighting of the impact of the sub-groups oneach property, the subsequent calculation of multifunc-tionality of the benthic ecosystem relies on a subjectivedefinition of percentile thresholds and associated scoresfor each property. The validity of this method dependson the size of the underlying data set, and therefore wesuggest that in case of small data sets, bias-correctedbootstrapping of the samples could be used before identi-fying the percentiles. By relying on expert opinion, itshould be stressed that the suggested template does notoffer a quantitative estimation of benthic ecosystem func-tions. It is a “best you can get” approach, where uncer-tainties depend on available knowledge of species andtheir traits, and the inherent differences in species’ traitexpression. Hence, the template simply offers an identifi-cation of sites with higher and lower potential for benthicecosystem properties and multifunctionality.The advantages of the suggested template is that differ-
ent properties of the ecosystem can be assessed, if onlytrait data are available. For example, the approach can beused to estimate the provision of food resources by thebenthic ecosystem to higher trophic levels by accountingfor traits such as energy content and palatability (Weigelet al. 2016). The template can also be replicated to otherdata sets and give an estimate of, for example, biodiver-sity as predicted by traits describing benthic habitatcomplexity across scales (Thrush et al. 2001). Hereby,the approach could offer a way to assess the ecologicalimpacts of trawling and dredging. By using the templateit is also possible to account for across habitat andecosystem functionality, through evaluating the contribu-tion of different compartments to common properties.For example, by quantifying traits such as carboncontent and turn-over in both algae, vascular plants andanimals, estimations on current carbon stocks and theirstability and maintenance could be performed in ecosys-tems facing global change. The trait grouping approachcould be a useful and relatively simple way of extractinginformation that bears relevance to assessments ofecosystem functionality, including pinpointing areas withdifferent levels of functional capacity. This is central forsuccessful conservation efforts and for identification ofareas in need of mitigation measures.
ACKNOWLEDGMENTS
We thank Anna Arnkil for help in field and laboratory. Thelaboratory work in 2012 was financed by Uusimaa ELY-centreas part of the VELMU programme. We wish to especially thankTero Taponen at Uusimaa ELY-centre. We are grateful to Sebas-tian Valanko and Laura Kauppi that collected the subset ofenvironmental data, and to Tv€arminne Zoological Station forproviding excellent research facilities. The manuscript was sig-nificantly improved by comments of two anonymous reviewers,which is gratefully acknowledged. This study was funded by theMaj and Tor Nessling Foundation (Grant no. 2014322), theSophie von Julins Stiftelse and the BONUS COCOA and Balti-cApp projects, which was supported by BONUS (Art 185),funded jointly by EU and the Academy of Finland.
LITERATURE CITED
Anderson, M. J., R. N. Gorley, and K. R. Clarke. 2008. PER-MANOVA+ for PRIMER: Guide to software and statisticalmethods. PRIMER-E, Plymouth, UK.
Anselin, L. 1995. Local indicators of spatial association-LISA.Geographical Analysis 27:93–115.
Bekkby, T., P. E. Isachsen, M. Isæus, and V. Bakkestuen. 2008.GIS modeling of wave exposure at the seabed: a depth-attenuated wave exposure model. Marine Geodesy 31:117–127.
Belley, R., and P. V. R. Snelgrove. 2016. Relative contributionsof biodiversity and environment to benthic ecosystem func-tioning. Frontiers in Marine Science 3:242. doi: 10.3389/fmars.2016.00242
Benjamini, Y., and Y. Hochberg. 1995. Controlling the falsediscovery rate: a practical and powerful approach to multipletesting. Journal of the Royal Statistical Society Series B 57:289–300.
B€ohnke-Henrichs, A., C. Baulcomb, R. Koss, S. S. Hussain,and R. S. de Groot. 2013. Typology and indicators of ecosys-tem services for marine spatial planning and management.Journal of Environmental Management 130:135–145.
Bolam, S. G., and J. D. Eggleton. 2014. Macrofaunal produc-tion and biological traits: spatial relationships along the UKcontinental shelf. Journal of Sea Research 64:166–179.
Bolam, S. G., et al. 2017. Differences in biological traitscomposition of benthic assemblages between unimpactedhabitats. Marine Environmental Research. https://doi.org/10.1016/j.marenvres.2017.01.004
Bonsdorff, E. 2006. Zoobenthic diversity-gradients in the BalticSea: continuous post-glacial succession in a stressed ecosys-tem. Journal of Experimental Marine Biology and Ecology330:283–291.
Bonsdorff, E., and T. H. Pearson. 1999. Variation in the sublit-toral macrozoobenthos of the Baltic Sea along environmentalgradients: a functional group approach. Australian Journalof Ecology 24:312–326.
Bremner, J., S. I. Rogers, and C. L. J. Frid. 2003. Assessing func-tional diversity in marine benthic ecosystems: a comparisonof approaches. Marine Ecology Progress Series 254:11–25.
Bremner, J., R. Si, and C. L. J. Frid. 2006. Matching biologicaltraits to environmental conditions in marine benthic ecosys-tems. Journal of Marine Systems 60:302–316.
Brown, J. H., J. F. Gillooly, A. P. Allen, V. M. Savage, and G. B.West. 2004. Toward a metabolic theory of ecology. Ecology85:1771–1789.
Chevenet, F., S. Dol�edec, and D. Chessel. 1994. A fuzzy codingapproach for the analysis of long-term ecological data. Fresh-water Biology 31:295–309.
Clarke, K. R., R. N. Gorley, P. J. Somerfield, and R. M.Warwick. 2014. Change in marine communities: an approach
92 ANNAVILLN€AS ET AL.Ecological Applications
Vol. 28, No. 1

to statistical analysis and interpretation. Third edition. PRI-MER-E, Plymouth, UK.
Clarke, K. R., and R. N. Gorley. 2015. PRIMERv7: User man-ual/tutorial. PRIMER-E, Plymouth, UK.
Conley, D. J., et al. 2011. Hypoxia is increasing in the coastalzone of the Baltic Sea. Environmental Science and Technol-ogy 45:6777–6783.
de Bello, F., et al. 2010. Towards an assessment of multipleecosystem processes and services via functional traits. Biodi-versity and Conservation 19:2873–2893.
Elmgren, R., and C. Hill. 1997. Ecosystem function at lowbiodiversity – the Baltic example. Pages 319–336 in R. F. G.Ormond, J. Gage, and M. Angel, editors. Marine biodiversity:patterns and processes. Cambridge University Press, Cam-bridge, UK.
Emmerson, M. C., and D. Raffaelli. 2004. Predator-prey bodysize, interaction strength and the stability of a real food web.Journal of Animal Ecology 73:399–409.
Eyre, B. D., and D. Maher. 2011. Mapping ecosystem processesand function across shallow seascapes. Continental ShelfResearch 31:S162–S172.
Fauchald, K., and P. A. Jumars. 1979. The diet of worms: astudy of polychaete feeding guilds. Oceanography and MarineBiology: An Annual Review 17:193–284.
Fish, J. D., and S. Fish. 1996. A student’s guide to the seashore.Second edition. Cambridge University Press, Cambridge,UK.
Foley, M. M., et al. 2010. Guiding ecological principles formarine spatial planning. Marine Policy 34:955–966.
Giangrande, A., S. Geraci, and G. Belmonte. 1994. Life-cycleand life-history diversity in marine invertebrates and theimplications in community dynamics. Oceanography andMarine Biology: An Annual Review 32:305–333.
Gogina, M., C. Morys, S. Forster, U. Gr€awe, R. Friedland,and M. Zettler. 2017. Towards benthic ecosystem func-tioning maps: Quantifying bioturbation potential in theGerman part of the Baltic Sea. Ecological Indicators73:574–588.
Greenfield, B. L., C. Kraan, C. Pilditch, and S. F. Thrush. 2016.Mapping functional groups can provide insight into ecosys-tem functioning and potential resilience of intertidal sand-flats. Marine Ecology Progress Series 548:1–10.
Griffiths, J. R., et al. 2017. The importance of benthic–pelagiccoupling for marine ecosystem functioning in a changingworld. Global Change Biology 23:2179–2196.
Halpern, B. S., et al. 2008. A global map of human impact onmarine ecosystems. Science 319:948–952.
Harris, R. J., C. A. Pilditch, J. E. Hewitt, A. M. Lohrer, C. VanColen, M. Townsend, and S. F. Thrush. 2015. Biotic interac-tions influence sediment erodibility on wave-exposed sand-flats. Marine Ecology Progress Series 523:15–30.
Haukioja, E., and T. Hakala. 1978. Life-history evolution inAnodonta piscinalis (Mollusca, Pelecypoda). Oecologia 35:253–266.
Hewitt, J. E., S. F. Thrush, and P. D. Dayton. 2008. Habitatvariation, species diversity and ecological functioning in amarine system. Journal of Experimental Marine Biology andEcology 366:116–122.
Hewitt, J. E., J. Norkko, L. Kauppi, A. Villn€as, and A. Norkko.2016. Species and functional trait turnover in response tobroad-scale change and an invasive species. Ecosphere 7:e01289.
Hooper, D. U., et al. 2005. Effects of biodiversity on ecosystemfunctioning; a consensus of current knowledge. EcologicalMonographs 75:3–35.
Karonen, M., A. M€antykoski, V. Lankiniemi, E. Nylander, andK. Lehto. 2015. Vesien tila hyv€aksi yhdess€a. Ehdotus
Kymijoen-Suomenlahden vesienhoitoalueen vesienhoitosuun-nitelmaksi vuosiksi 2016–2021. Juvenes Print, Tampere, Fin-land.
Kauppi, L., J. Norkko, J. Ikonen, and A. Norkko. 2017.Seasonal variability in ecosystem functions: quantifying thecontribution of invasive species to nutrient cycling in coastalecosystems. Marine Ecology Progress Series 572:193–207.
Kristensen, E. 2000. Organic matter diagenesis at the oxic/anoxic interface in coastal marine sediments, with the empha-sis on the role of burrowing animals. Hydrobiologia 426:1–24.
Kristensen, E., M. Delefosse, C. O. Quintana, M. R. Flindt,and T. Valdemarsen. 2014. Influence of benthic macrofaunacommunity shifts on ecosystem functioning in shallow estuar-ies. Frontiers in Marine Science 41:1–14.
Lavorel, S., K. Grigulis, P. Lamarque, M.-P. Colace, D. Garden,J. Girel, G. Pellet, and R. Douzet. 2011. Using plant func-tional traits to understand the landscape distribution of mul-tiple ecosystem services. Journal of Ecology 99:135–147.
Lefcheck, J. S., J. E. K. Byrnes, F. Isbell, L. Gamfeldt, J. N.Griffin, N. Eisenhauer, M. J. S. Hensel, A. Hector, B. J.Cardinale, and E. Duffy. 2015. Biodiversity enhancesecosystem multifunctionality across trophic levels and habi-tats. Nature Communications 6:6936. https://doi.org/10.1038/ncomms7936
Lohrer, A. M., S. F. Thrush, J. E. Hewitt, and C. Kraan. 2015.The up-scaling of ecosystem functions in a heterogeneous world.Scientific Reports 5:10349. https://doi.org/10.1038./srep10349
Lotze, H. K., H. S. Lenihan, B. J. Bourque, R. H. Bradbury,R. G. Cooke, M. C. Kay, S. M. Kidwell, M. X. Kirby, C. H.Peterson, and J. B. C. Jackson. 2006. Depletion, degradationand recovery potential of estuaries and coastal seas. Science312:1806–1809.
MarLIN. 2006. BIOTIC—biological traits information cata-logue. Marine Life Information Network, Marine BiologicalAssociation of the United Kingdom, Plymouth, UK. www.-marlin.ac.uk/biotic
Mouillot, D., N. A. J. Graham, S. Vill�eger, N. W. H. Mason,and D. R. Bellwood. 2013. A functional approach revealscommunity responses to disturbances. Trends in Ecology andEvolution 28:167–177.
Norkko, A., J. E. Hewitt, S. F. Thrush, and G. A. Funnell.2006. Conditional outcomes of facilitation by a habitat-modi-fying subtidal bivalve. Ecology 87:226–234.
Norkko, J., D. C. Reed, K. Timmerman, A. Norkko, B. G.Gustafsson, E. Bonsdorff, C. P. Slomp, J. Carstensen, andD. J. Conley. 2012. A welcome can of worms? Hypoxiamitigation by an invasive species. Global Change Biology18:422–434.
Norkko, A., A. Villn€as, J. Norkko, S. Valanko, and C. Pilditch.2013. Size matters: implications of the loss of largeindividuals for ecosystem function. Scientific Reports 3:2646.https://doi.org/10.1038/srep02646
Norkko, J., J. Gammal, J. E. Hewitt, A. B. Josefson, J. Carsten-sen, and A. Norkko. 2015. Seafloor ecosystem function rela-tionships: In situ patterns of change across gradients ofincreasing hypoxic stress. Ecosystems 18:1424–1439.
Orvain, F., P.-G. Sauriau, A. Sygut, L. Joassard, and P. Le Hir.2004. Interacting effects of Hydrobia ulvae bioturbation andmicrophytobenthos on the erodibility of mudflat sediments.Marine Ecology Progress Series 278:205–223.
Pearson, T. H. 2001. Functional group ecology in soft-sedimentmarine benthos: the role of bioturbation. Oceanography andMarine Biology: An Annual Review 39:233–267.
Pearson, T. H., and R. Rosenberg. 1978. Macrobenthic succes-sion in relation to organic enrichment and pollution of themarine environment. Oceanography and Marine Biology: AnAnnual Review 16:229–311.
January 2018 TRAITGROUPINGS ESTIMATE FUNCTIONALITY 93

Perus, J., E. Bonsdorff, S. B€ack, H.-G. Lax, A. Villn€as, andV. Westberg. 2007. Zoobenthos as indicators of ecologicalstatus in coastal brackish waters: a comparative study fromthe Baltic Sea. Ambio 26:250–256.
Pilditch, C. A., S. Valanko, J. Norkko, and A. Norkko. 2015.Post-settlement dispersal: the neglected link in maintenanceof soft-sediment biodiversity. Biology Letters 11:20140795.
Poff, N. L. 1997. Landscape filters and species traits: towardsmechanistic understanding and prediction in stream ecology.Journal of the North American Benthological Society16:391–409.
Queir�os, A. M., et al. 2013. A bioturbation classification ofEuropean marine infaunal invertebrates. Ecology and Evolu-tion 3:3958–3985.
Rees, S. E., M. C. Austen, M. J. Attrill, and L. D. Rodwell. 2012.Incorporating indirect ecosystem services into marine pro-tected area planning and management. International Journalof Biodiversity Science, Ecosystem Services and Management8:273–285. https://doi.org/10.1080/21513732.2012.680500
Renz, J. R., and S. Forster. 2013. Are similar worms different?A comparative tracer study on bioturbation in the threesibling species Marenzelleria arctica, M. viridis, andM. neglecta from the Baltic Sea. Limnology and Oceanogra-phy 58:2046–2058.
Sirot, C., S. Vill�eger, D. Mouillot, A. M. Darnaude, J. Ramos-Miranda, D. Flores-Hernandez, and J. Panfili. 2015. Combi-nations of biological attributes predict temporal dynamics offish species in response to environmental changes. EcologicalIndicators 48:147–156.
Snelgrove, P. V. R., S. F. Thrush, D. H. Wall, and A. Norkko.2014. Real world biodiversity-ecosystem functioning: a seafloorperspective. Trends in Ecology and Evolution 29:398–405.
Snickars, M., et al. 2016. Assessment of the status of thezoobenthos in the coastal waters of western Uusimaa, SWFinland—a tool for management. Nature Protection Publica-tions of Mets€ahallitus Series A 224:55.
Solan, M., B. J. Cardinale, A. L. Downing, K. A. M. Engelhardt,J. L. Ruesink, and D. S. Srivastava. 2004. Extinction and ecosys-tem function in the marine benthos. Science 306:1177–1180.
Statzner, B., B. Bis, S. Dol�edec, and P. Usseglio-Polatera. 2001.Perspectives for biomonitoring at large spatial scales: a uni-fied measure for the functional composition of invertebratecommunities in European running waters. Basic and AppliedEcology 2:73–85.
Thrush, S. F., J. E. Hewitt, G. A. Funnell, V. J. Cummings,J. Ellis, D. Schultz, D. Talley, and A. Norkko. 2001. Fishingdisturbance and marine biodiversity: the role of habitat struc-ture in simple soft-sediment systems. Marine Ecology Pro-gress Series 223:277–286.
Thrush, S. F., J. E. Hewitt, M. Gibbs, C. Lundquist, andA. Norkko. 2006. Functional role of large organisms in inter-tidal communities: community effects and ecosystem func-tion. Ecosystems 9:1029–1040.
Tolonen, K. E., L. Tokola, M. Gr€onroos, J. Hjort, O.-M.K€arn€a, J. Erkinaro, and J. Heino. 2016. Hierarchical decom-position of trait patterns of macroinvertebrate communitiesin subarctic streams. Freshwater Science 35:1032–1048.
T€ornroos, A., and E. Bonsdorff. 2012. Developing the multitraitconcept for functional diversity: lessons from a system rich infunctions but poor in species. Ecological Applications 22:2221–2236.
Townsend, M., S. F. Thrush, A. M. Lohrer, J. E. Hewitt, C. J.Lundquist, M. Carbines, and M. Felsing. 2014. Overcomingthe challenges of data scarcity in mapping marine ecosystemservice potential. Ecosystem Services 8:44–55.
Valanko, S., A. Norkko, and J. Norkko. 2010. Strategies ofpost-larval dispersal in non-tidal soft-sediment communities.Journal of Experimental Marine Biology and Ecology 384:51–60.
Valanko, S., J. Heino, M. Westerbom, M. Viitasalo, andA. Norkko. 2015. Complex metacommunity structure forbenthic invertebrates in a low-diversity coastal system. Ecol-ogy and Evolution 5:5203–5215.
Verberk, W. C. E. P., C. G. E. van Noordwijk, and A. G.Hildrew. 2013. Delivering on a promise: integrating speciestraits to transform descriptive community ecology into apredictive science. Freshwater Science 32:531–547.
Villn€as, A., and A. Norkko. 2011. Benthic diversity gradientsand shifting baselines: implications for assessing environmen-tal status. Ecological Applications 21:2172–2186.
Villn€as, A., J. Perus, and E. Bonsdorff. 2011. Structural andfunctional shifts in zoobenthos induced by organic enrich-ment—implications for community recovery potential. Jour-nal of Sea Research 65:8–18.
Villn€as, A., J. Norkko, S. Hietanen, A. B. Josefson, K. Lukkari,and A. Norkko. 2013. The role of recurrent disturbances forecoystem multifunctionality. Ecology 94:2275–2287.
Violle, C., P. B. Reich, S. W. Pacala, B. J. Enquist, and J. Kattge.2014. The emergence and promise of functional biogeogra-phy. Proceedings of the National Academy of Sciences USA111:13690–13696.
Vuori, K.-M., et al. 2006. Suomen pintavesien tyyppittelyn jaekologisen luokitteluj€arjestelm€an perusteet. Suomen ymp€arist€o807:151.
Weigel, B., T. Blenckner, and E. Bonsdorff. 2016. Maintainedfunctional diversity in benthic communities in spite of diverg-ing functional identities. Oikos 125:1421–1433.
Whitlatch, R. B., A. M. Lohrer, S. F. Thrush, R. D. Pridmore,J. E. Hewitt, V. J. Cummings, and R. N. Zajac. 1998. Scale-dependent benthic recolonization dynamics: life stage-baseddispersal and demographic consequences. Hydrobiologia 375/376:217–226.
Winemiller, K. O., D. B. Fitzgerald, L. M. Bower, and E. R.Pianka. 2015. Functional traits, convergent evolution andperiodic tables of niches. Ecology Letters. https://doi.org/10.1111/ele.12462
SUPPORTING INFORMATION
Additional supporting information may be found online at: http://onlinelibrary.wiley.com/doi/10.1002/eap.1630/full
DATA AVAILABILITY
Data available from the Dryad Digital Repository: https://doi.org/10.5061/dryad.3v5d2
94 ANNAVILLN€AS ET AL.Ecological Applications
Vol. 28, No. 1