Investigation of the osteitis deformans phases in snake vertebrae by double-pulse laser-induced...
14
This article was published in the above mentioned Springer issue. The material, including all portions thereof, is protected by copyright; all rights are held exclusively by Springer Science + Business Media. The material is for personal use only; commercial use is not permitted. Unauthorized reproduction, transfer and/or use may be a violation of criminal as well as civil law. ISSN 1618-2642, Volume 398, Number 2
-
Upload
independent -
Category
Documents
-
view
3 -
download
0
Transcript of Investigation of the osteitis deformans phases in snake vertebrae by double-pulse laser-induced...

This article was published in the above mentioned Springer issue.The material, including all portions thereof, is protected by copyright;all rights are held exclusively by Springer Science + Business Media.
The material is for personal use only;commercial use is not permitted.
Unauthorized reproduction, transfer and/or usemay be a violation of criminal as well as civil law.
ISSN 1618-2642, Volume 398, Number 2
ORIGINAL PAPER
Investigation of the osteitis deformans phases in snakevertebrae by double-pulse laser-induced breakdownspectroscopy
M. Galiová & J. Kaiser & K. Novotný & M. Ivanov &
M. Nývltová Fišáková & L. Mancini & G. Tromba &
T. Vaculovič & M. Liška & V. Kanický
Received: 26 February 2010 /Revised: 24 June 2010 /Accepted: 28 June 2010 /Published online: 14 July 2010# Springer-Verlag 2010
Abstract Double-pulse laser-induced breakdown spectros-copy (DP-LIBS) was optimized for microspatial analyses offossil and recent snake vertebrae. As complimentary techni-ques, solution analysis by inductively coupled plasma massspectrometry and synchrotron radiation X-ray microtomog-raphy was utilized in order to determine the overallconcentration of the selected elements in the samples and tovisualize nondestructively the fossil sample microstructure,
respectively. Elemental mapping of pathological bony tissueby DP-LIBS has been proven as a powerful tool forconsidering the osteitis deformans phases in fossil vertebrae.
Keywords Laser ablation . LIBS .Mapping . X-raymicrotomography . Fossil . Snake vertebra
Introduction
Laser-ablation-based analytical methods, e.g., laser ablationinductively coupled plasma mass spectrometry (LA-ICP-MS)or laser-induced breakdown spectroscopy (LIBS), have beenproven by several authors as excellent tools for quantitativeand qualitative microspatial analysis of wide variety ofsamples [1, 2]. These techniques, due to their high spatialresolution, offer the possibility to study the chemical distribu-tion, namely chemical mapping, of the element constituents ina broad variety of matrices [3–11]. Spatially resolved analysisof trace element concentration has a big relevance amongothers in disciplines ranging from dentistry and health care toforensics, anthropology, zoology, and archaeology [9, 12,13]. Bone or tooth materials are traditionally studied by abulk sampling approach [14]. For spatially resolved analysisof these samples, X-ray fluorescence [15, 16], electronmicroprobe X-ray microanalysis [17, 18], particle (proton)-induced X-ray emission spectroscopy [19], or secondary ionmass spectrometry [20, 21] is utilized for many years.
In this work, one of the numerous modifications of LIBStechnique, the so-called double-pulse LIBS, was applied formultielement mapping of fossil and recent snake vertebrae.DP-LIBS offers several advantages over single-pulse LIBS.The double-pulse excitation of plasma over a samplesurface surrounded by ambient air has specific features.
Presented at the 2010 Winter Conference on Plasma Spectrochemistryheld in Fort Myers, Florida, January 4–9, 2010
M. Galiová :K. Novotný : T. Vaculovič :V. KanickýDepartment of Chemistry, Faculty of Science,Masaryk University,Kotlářská 2,611 37 Brno, Czech Republic
J. Kaiser (*) :M. LiškaInstitute of Physical Engineering, Faculty of MechanicalEngineering, Brno University of Technology,Technická 2,616 69 Brno, Czech Republice-mail: [email protected]
M. IvanovDepartment of Geological Sciences, Faculty of Science,Masaryk University,Kotlářská 2,611 37 Brno, Czech Republic
M. Nývltová FišákováInstitute of Archaeology, Academy of Science,Královopolská 147,612 00 Brno, Czech Republic
L. Mancini :G. TrombaSincrotrone Trieste S.C.p.A.,S.S. 14-km 163.5 in AREA Science Park, 34149 Basovizza,Trieste, Italy
Anal Bioanal Chem (2010) 398:1095–1107DOI 10.1007/s00216-010-3976-1
Author's personal copy
At the same laser power, spectra recorded after double-pulse excitation have better quality for analytical use,namely less line broadening and line shift than in thesingle-pulse case [22]. By using DP-LIBS, lower detectionlimits and increased spatial resolution can be reached.According to our knowledge, this is the first time that thisanalytical technique was optimized for high-resolutionmapping of fossil samples.
Our analysis of healthy and pathological samples includesboth recent and fossil snake vertebrae. We are primarilyfocused on the matrix elements Ca and P in fossil material.Because of the age of fossil vertebrae (about one millionyears), it is very probable that trace elements do not reflectoriginal composition of the bone just after burial due to theiraffinity to migration in rock environment. Nevertheless, traceelements can play an important role in recent material. Severalelements are of a great importance—Na, Fe, Sr, and Ba.
The DP-LIBS measurements are accomplished by twodifferent experimental approaches. A routinely usedtechnique—ICP-MS solution analysis—was utilized inorder to quantify the overall amount of investigated elementsin dissolved vertebra fragments. X-ray microradiographytechniques were proven as powerful, nondestructive methodscapable, for example, of visualizing the sample structurebefore the laser-ablation-based chemical mapping [23, 24].Here, synchrotron radiation X-ray microtomography (SR-μCT) was applied in order to visualize the 3D structure offossil samples and to localize the areas of interest within thesample.
Material and sample preparation
Material of fossil snakes was found in the Mladeč Cavessite about 4 km WNW from the Litovel town near Olomouccity, Czech Republic. Mladeč Caves are situated at theTřesín Hill (345 m a.s.l.) which forms an East–Westenlarged elevation about 1.5 km WNW from the Mladečvillage. Mladeč Caves are developed in the Devoniankarstified limestone of the Třesín Hill.
The detailed investigation of Mladeč Caves was carriedout in 1958–1959 [25]. Samples come from the deposits ofthe talus cone in the “Dóm mrtvých,” excavation no. II.Horáček and Ložek [26] tried to resolve the biostratigraphyof deposits within the “Dóm mrtvých” during their researchof micromammalian assemblages and concluded that theage the deposits within the profile in close vicinity ofexcavation II should be about 1 Ma. Snake fauna from theexcavation II is unusually rich (more than 170,000 snakevertebrae) and the snake assemblage shows on the warmand relatively dry interglacial environment with numer-ous highly thermophilic taxa including Hierophis viridi-flavus and Elaphe quatuorlineata. Therefore, deposits of the
excavation no. II are correlated with the Waalian interglacial,possibly the end of the Waalian interglacial (Early Pleisto-cene, Early Biharian, Q12).
The snake material from Mladeč excavation II shows acomparatively high species diversity. Therefore, locality ofMladeč excavation II represents one of the most complexsamples of Pleistocene snake fauna in Central Europe [27].
The investigated samples
The investigated pathological recent and fossil snake verte-brae with bony proliferations were selected on the basis ofvisual observation of available samples. The appropriatehealthy vertebrae used for comparison were chosen fromsnake spines without visible bony proliferations.
Fossil material The fossil material was Natrix natrix(Linnaeus, 1758), Mladeč Caves excavation II (CzechRepublic), Early Pleistocene (Early Biharian).
Healthy vertebra
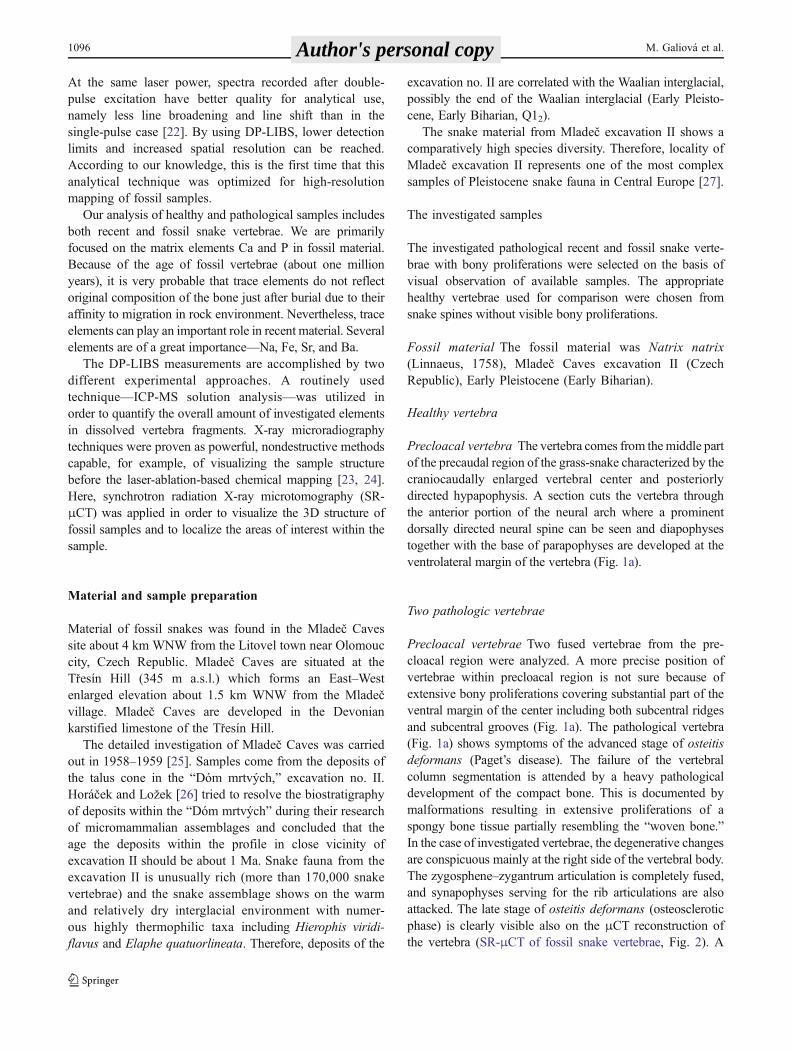
Precloacal vertebra The vertebra comes from themiddle partof the precaudal region of the grass-snake characterized by thecraniocaudally enlarged vertebral center and posteriorlydirected hypapophysis. A section cuts the vertebra throughthe anterior portion of the neural arch where a prominentdorsally directed neural spine can be seen and diapophysestogether with the base of parapophyses are developed at theventrolateral margin of the vertebra (Fig. 1a).
Two pathologic vertebrae
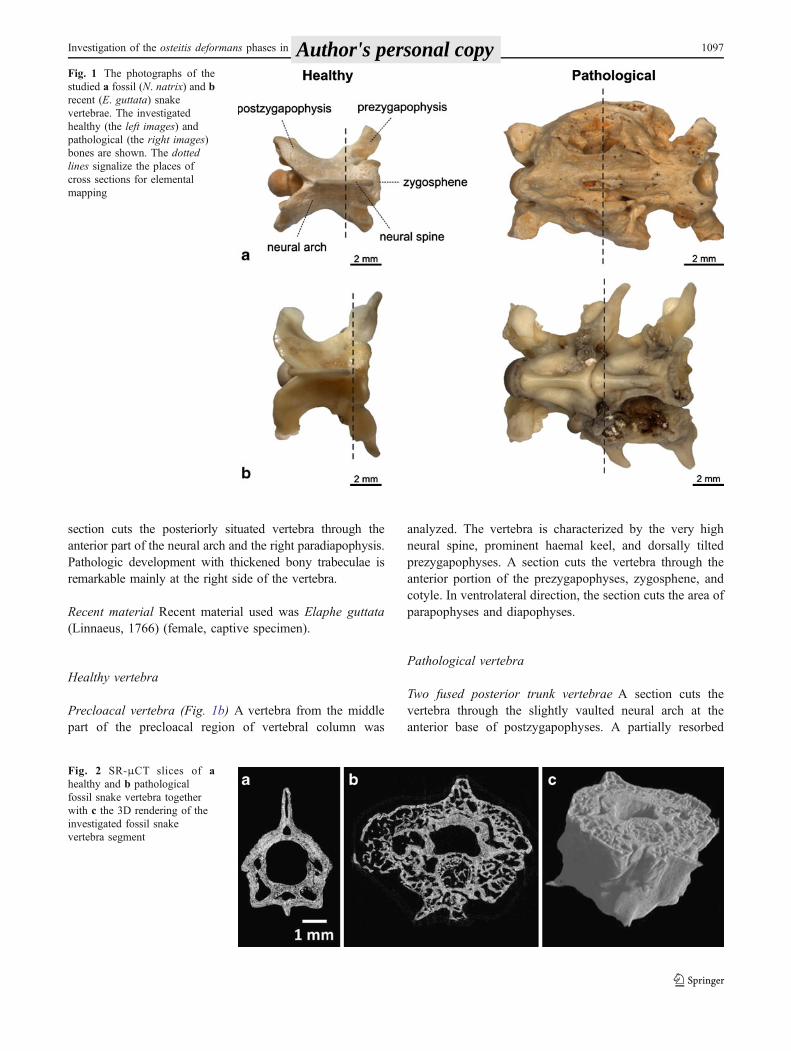
Precloacal vertebrae Two fused vertebrae from the pre-cloacal region were analyzed. A more precise position ofvertebrae within precloacal region is not sure because ofextensive bony proliferations covering substantial part of theventral margin of the center including both subcentral ridgesand subcentral grooves (Fig. 1a). The pathological vertebra(Fig. 1a) shows symptoms of the advanced stage of osteitisdeformans (Paget’s disease). The failure of the vertebralcolumn segmentation is attended by a heavy pathologicaldevelopment of the compact bone. This is documented bymalformations resulting in extensive proliferations of aspongy bone tissue partially resembling the “woven bone.”In the case of investigated vertebrae, the degenerative changesare conspicuous mainly at the right side of the vertebral body.The zygosphene–zygantrum articulation is completely fused,and synapophyses serving for the rib articulations are alsoattacked. The late stage of osteitis deformans (osteoscleroticphase) is clearly visible also on the μCT reconstruction ofthe vertebra (SR-μCT of fossil snake vertebrae, Fig. 2). A
1096 M. Galiová et al. Author's personal copy
section cuts the posteriorly situated vertebra through theanterior part of the neural arch and the right paradiapophysis.Pathologic development with thickened bony trabeculae isremarkable mainly at the right side of the vertebra.
Recent material Recent material used was Elaphe guttata(Linnaeus, 1766) (female, captive specimen).
Healthy vertebra
Precloacal vertebra (Fig. 1b) A vertebra from the middlepart of the precloacal region of vertebral column was
analyzed. The vertebra is characterized by the very highneural spine, prominent haemal keel, and dorsally tiltedprezygapophyses. A section cuts the vertebra through theanterior portion of the prezygapophyses, zygosphene, andcotyle. In ventrolateral direction, the section cuts the area ofparapophyses and diapophyses.
Pathological vertebra
Two fused posterior trunk vertebrae A section cuts thevertebra through the slightly vaulted neural arch at theanterior base of postzygapophyses. A partially resorbed
Fig. 1 The photographs of thestudied a fossil (N. natrix) and brecent (E. guttata) snakevertebrae. The investigatedhealthy (the left images) andpathological (the right images)bones are shown. The dottedlines signalize the places ofcross sections for elementalmapping
Fig. 2 SR-μCT slices of ahealthy and b pathologicalfossil snake vertebra togetherwith c the 3D rendering of theinvestigated fossil snakevertebra segment
Investigation of the osteitis deformans phases in snake vertebrae 1097 Author's personal copy

bone of the next vertebra is developed on the leftventrolateral side of the prezygapophysis, indicating theinitial (osteolytic) phase of the osteitis deformans (Fig. 1b).
Sample preparation
The microstructure of fossil vertebra was investigatedprior to the chemical mapping by SR-μCT. The propercut across the fossil sample was realized on the basis ofthese measurements. Similar to fossil, recent sampleswere also cut into two pieces. Part of the sample for bothfossil and recent vertebrae was dissolved and analyzedby ICP-MS. The remaining parts were embedded inresins and repolished prior to the DP-LIBS mapping.
Aim of this study
The study presented in this paper has two main aspects.First of them is the development and optimization of DP-LIBS analytical technique with respect to increasing thespatial resolution on 2D mapping of fossil samples.Another aspect is to utilize this technique to investigateosteitis deformans phases in fossil snake vertebrae.
Enhancement of LIBS capabilities for elemental mappingin fossil samples using DP-LIBS technique
DP-LIBS is an experimental approach used for improvingsome figures of merit of the LIBS technique [28]. Thisapproach has been extensively studied since it is reported togive a substantial enhancement of the signal-to-noise ratiowith respect to single-pulse LIBS (SP-LIBS) configurationwith a corresponding improvement of the limits ofdetections (LODs).
In DP-LIBS, a second laser pulse is applied after a delaytime from the first laser pulse, usually for re-exciting theregion where the plasma generated by the first laser pulsewas created and sometimes also the sample surface. Severalmethods of generating the pulses, arranging them geometri-cally and varying the timing and/or the wavelength of the twolaser beams, have been tried [2, 29]. The two orthogonal DP-LIBS arrangements differ from each other in the sequentialorder of the pulses. In orthogonal reheating configuration,the first laser pulse is applied on the sample surface,perpendicular to it, and the second pulse, horizontal withrespect to the surface, is focused slightly above it, in theregion where the first plasma was created. In orthogonalpreablation, air spark is formed above and parallel to thesample surface prior to ablation of the sample by the secondpulse [30]. Collinear configuration is more frequently used,mainly because it enables an easier alignment of the laser
beams. The crossed beam configuration [31] is the leastused. Proceeding historically, the improvements in LODusing a DP-LIBS in collinear configuration was demonstrat-ed in 1984 by Cremers et al. [32]. Works employingorthogonal configurations in reheating [33] and preablation[34] modes for DP-LIBS are dated from 1991 to 2000,respectively. Some papers from 2002 to 2004 report on theuse of different wavelengths [22, 35] or different pulsedurations [36] in DP-LIBS.
Although the mechanisms causing the analytical improve-ments of DP-LIBS excitation are not yet completely clear,there is agreement in literature [2, 28] about three possiblemain sources of these emission enhancements:
(a) Higher ablated mass (mainly in collinear configuration)(b) Re-excitation of the material ablated in the first laser
pulse by the second laser pulse with consequent higherplasma temperature and electron density in thereheated plasma
(c) Physical and energetic effects associated with theformation of the first plasma, such as lower atmosphericpressure in the region where the first plasma was createdand a higher sample temperature with the application ofthe second pulse, leading to a lower ablation and/orplasma threshold energy, also improving the ablation andincreasing the plasma temperature
Recent studies realized in order to clarify the differencein nature of SP and DP-LIBS mechanism in the case ofmetallic samples using spectroscopic and shadowgraphicanalysis and spectrally resolved imaging are presented in[37] and [29], respectively. It was shown that, while plasmacreated in SP-LIBS has a marked recombination character andit is affected by chemical reactions with the surrounding air,the plasma used for DP-LIBS is expanding in the first pulse-induced plasma and keeps its energy for longer times, whichturns in a higher ionization degree, better fulfillment of thelocal thermodynamic equilibrium condition, and a more stablesignal.
Another advantage of DP-LIBS, not yet widely discussedin literature, is that this technique allows decreasing theablation craters size by maintaining the same or evenincreasing the LODs. This is especially true for DP-LIBS inorthogonal reheating mode, where, by using an appropriateablation laser, the crater size can be decreased considerably.Here, the DP-LIBS configuration in reheating mode usingdifferent wavelengths (266 and 1,064 nm) was optimized inorder to reach crater sizes usually used in LA-ICP-MSanalysis [9].
Study of pathological vertebrae
The complex studies of pathological development of snakevertebrae are almost missing in literature. Pathologically
1098 M. Galiová et al. Author's personal copy

developed vertebrae occur only in about 0.5% of studiedsamples. There are altogether two groups of pathologicallydeveloped snake vertebrae [38]:
1. The first group of pathologically developed vertebrae isrepresented by fused vertebrae as a result of failures invertebrate column segmentation during the embryonicdevelopment (fused vertebrae without abnormal develop-ment of bony tissue). On the other side, unusual metrics,asymmetry, or morphological abnormalities of the largestvertebrae are usually a result of gerontic stage of theontogenic development.
2. The second group is formed by vertebrae which show adistinctly different development of the bony tissue incomparison with normal (healthy) tissue. The vertebralcolumn of snakes is sensitive on the mechanicaldamages especially in the zygosphene–zygantrumarticulation. In many cases, those injuries were notfatal for snakes if the neural canal was not injured. Thisis documented by the fact that the injured bony tissue,most probably as a result of predator attack, forms anewly developed bony calus. If the calus is notabsorbed, the “woven” tissue sometimes coveringsubstantial part of the vertebra can be developed. Thegrowth of newly formed pathological bone generatespressure on the spinar nervous system, and this canfinally result in reduction of integument function.
As results from preliminary studies in Mladeč excavationII, the snakes of the subfamily Natricinae (N. natrix) areextremely sensitive on the vertebral column injuries, beingthe usual prey of carnivorous birds. Moreover, natricinesnakes have relatively gracile structure of vertebrae incomparison with a more massive vertebrae of large colubrids(e.g., Zamenis longissimus, H. viridiflavus) discovered inMladeč excavation II. Although no pathological vertebrae ofVipera berus and Coronella austriaca were discovered in theEarly Pleistocene of Mladeč excavation II, this result wasprobably caused by a much rarer fossil occurrence of thosespecies.
Osteitis deformans is a degenerative bone disease ofcomplicated etiology characterized by increased bone remod-eling and abnormal bone architecture associated with morpho-logical and functional abnormalities of osteoclasts. Sometimes,it is compared with Paget’s disease of the bone [39, 40].Although osteitis deformans is well known in human bone[41], occurrences of this disease frequently occurs in captivelizards and it was rarely documented even in snakes. Paget’sdisease can attack any bone but the skull, long bones, andvertebrae are the most frequently affected skeletal elements[42]. The first phase is connected with partial loss ofmobility; the subsequent phase is characterized by spinaldeformities usually forming the anarchic proliferations.During the later phase, pathological fractures can occur [43].
There is no agreement as regards possible causes ofosteitis deformans in snakes. Many authors suggest that aninfectious viral agent may play a substantial role, mostoften the mouse Polyomavirus is considered. A relativelylong latency period from the initial viral infection cannot beexcluded [41]. However, autoimunne disease triggered bychronic infection and/or neoplasia cannot be excluded [43].
Considering the histology of these bones, there are threephases of osteitis deformans (Paget’s disease of the bone):(1) resorption phase (osteolytic phase), (2) the mixedosteolytic and osteoblastic phase, (3) osteosclerotic phase.The first phase is represented by an active bone resorption(osteolytic phase) which is characterized by the presence ofnumerous large osteoclasts. They are abnormal in numbers,size, and activity; they dig multiple cavities in bone matrix.This phase is followed by the second phase usuallycharacterized by the simultaneous occurrence of bothosteoclastic and osteoblastic activity or formation of anew highly vascular bone of “woven” type. This kind ofbone is less resistant but more elastic than normal lamellarbone [41]. In the final phase, the sclerotic bone is formedwith a characteristic “mosaic” pattern of histologicalstructure [42].
All three aforementioned phases of the Paget’s diseaseare usually documented by a radiographic diagnosis andhistological or biochemical testing.
The mineralized phase of the bone is composed ofhydroxyapatite [Ca10(PO4)6(OH)2]. In human bone, thefraction of calcium (Ca) and phosphorus (P) in hydroxy-apatite is 39.9% and 18.5%, respectively. Althoughhydroxyapatite is the main component of the bone, thepresence of collagen, marrow, fat, noncollagen proteins,and water causes somewhat different Ca/P ratio incomparison with hydroxyapatite [44]. The study of Ca/Pratio in long bones of mammals also showed that Ca/Pratios could fluctuate in statistically significant way,depending on the type of bone and level of its mechanicalstress [45, 46]. Higher Ca/P ratio (wt.%) in the samplescan be probably accompanied by the (PO4)
3− substitutionby the (CO3)
2− anions in a crystal lattice of hydroxyap-atite. This frequent type of substitution in carbonizedhydroxyapatite results in significant changes of physicalproperties of hydroxyapatite, the chemical composition ofwhich is considerably variable [47, 48].
The aim of the study is the determination of different Ca/Pratio in newly formed pathological bone both in fossil andrecent snake vertebrae and comparison of result with healthyvertebrae. The elemental mapping could be useful not only forthe determination of the single phases of Paget’s disease infossil material but also for the better localization of the centerof areas affected by the disease. The complex analysiscould help to find the causes of osteitis deformans whichis a quite difficult task even in osteological material of
Investigation of the osteitis deformans phases in snake vertebrae 1099 Author's personal copy

recent specimens. Therefore, our results could beapplicable in different branches of osteological researchincluding (paleo) anthropology.
Instrumentation
LIBS device
The experimental double-pulse system was designed toreach high sensitivity, maintaining high spatial resolutionand possibilities of line or raster scanning. This paperpresents for the first time orthogonal reheating double-pulseLIBS system utilizing modified commercially availablelaser ablation system (New Wave, UP 266 MACRO).The UV Nd:YAG (266 nm) laser ablation system wasspecifically designed for ICP-OES and ICP-MS solidsampling analysis. For double-pulse LIBS experiments,the ablation chamber used for connection UP 266MACRO to ICP spectrometry, was replaced with asample holder, which was equipped with inclinationalignment. The laser ablation device incorporates a 30to 750 μm expandable, aperture-imaged beam deliverysystem. The control software offers a wide variety ofablation methods such as spot ablation for depthprofiling, line scanning for lateral analysis, and rasterscanning for bulk or surface analysis. The laser ablationsoftware program controls all laser parameters, sampleviewing, and stage positioning. It also offers thepossibility of external triggering.
The radiation of the second Nd:YAG laser (Quantel,Brilliant) with fundamental wavelength (1,064 nm) wasfocused parallel to the sample surface by 80-mm focallength glass lens. The two lasers were aligned such thattheir intersecting beam path resulted in a coincident sparkjust 0.5 mm above the sample surface. Both lasers wereexternally triggered using two digital delay generators(Stanford Research Systems, DG 645) which wereinitialized by control pulses from UP 266 MACRO lasermodule. The first delay generator was used for flashlamps triggering and second for Q-switch and detectorcontrol. Hence, the starting of measurement, sampleposition, and parameters of first laser pulse was con-trolled by UP 266 MACRO software. The ablationrepetition rate had to be reduced to 1 Hz in order totransfer all data from the ICCD camera for eachinvestigated spot. The laser-induced plasma radiationwas transported by a fiber-optic system onto the entranceslit of a monochromator (Jobin Yvon TRIAX 320). Themonochromator was equipped with three interchangeableholographic gratings of 1,200, 2,400, and 3,600 g/mm. Inthis study, the grating of 2,400 g/mm and entrance slit of50 μm were used. The spectral resolution of Jobin Yvon
Triax 320 with this grating was 0.016 nm. For detectionof emission signal, ICCD detector (Jobin Yvon Horiba)coupled to the monochromator was utilized.
The LIBS spectra were recorded in spectral windows forregion of matrix and some trace elements. The spectral lineswere chosen on the basis of preliminary analysis ofarchaeological samples: P (I) (253.56, 255.32 nm), Mg(II) (279.55, 280.27 nm), Mg (I) (285.21 nm), Fe (I)(302.40 nm), Ca (I) (452.69 nm), Ca (II) (393.36,396.85 nm), Ba (II) (455.40 nm), Sr (I) (460.73,407.77 nm), and Na (I) (589.00, 589.59 nm) [9].
ICP-MS setup
Quadrupole ICP-MS spectrometer Agilent 7500 CE(Agilent, Japan) was used for analysis of dissolvedvertebra samples. Optimization of ICP-MS conditions(gas flow rates, sampling depth, electrostatic lensesvoltages of the MS) was performed with the tuningsolution (Agilent) with respect to maximum S/N ratio ofLi, Y, and Tl, minimum oxide formation (CeO/Ce counts ratiolower than 1.5%), and double charged ion formation (Ce2+/Ce+ counts ratio lower than 3%). Optimization ICP-MSparameters are summarized in Table 1. For removing isobaricinterferences, collision cell was used. Samples werenebulized into plasma by means of microconcentricnebulizer MicroMist with uptake rate of 0.1 ml/min.The isotopes were measured with integration time of0.1 s per isotope.
Snake vertebra samples were dried at 105 °C temperaturefor 5 h. Then 0.07–0.18 g of sample was dissolved in 5 ml ofHNO3 and 5 ml H2O2 at temperature of 100 °C. The solutionwas diluted to 50 ml. This diluted solution was nebulizedinto ICP-MS spectrometer.
Synchrotron radiation X-ray microtomography
The SR-μCT measurements were realized at the SYRMEPbeamline of Elettra synchrotron Light Laboratory in Trieste(Italy) [23]. SYRMEP is one of the bending magnets ofElettra. The beamline provides, at a distance of about 23 mfrom the source, a monochromatic, laminar-section X-ray
Table 1 ICP-MS optimized parameters
RF power 1,450 W
Carrier gas flow 0.90 l/min Ar
Makeup gas 0.19 l/min Ar
Main gas 15 l/min Ar
Spray chamber temperature 2 °C
Sampling depth 8.0 mm
Collision gas 3.5 ml/min He
1100 M. Galiová et al. Author's personal copy
beam with a maximum area of about 160×5 mm2 at20 keV. The monochromator is based on a double-Si(111)crystal system working in Bragg configuration that can betuned in an energy range of 8–35 keV with an energyresolving power of about 10−3.
For SR-μCT measurements, the samples have beenmounted on a high-resolution rotation stage and illuminatedwith a monochromatic radiation (E=27 keV). Images havebeen recorded by a charge-coupled device (CCD) camera ata distance of 6 cm from the sample. As detector, a water-cooled 12-bit CCD camera (Photonic Science, X-ray FDI-VHR) with a 4.5×4.5 μm2 effective pixel size was used.The camera head comprises a high-resolution 4,008horizontal × 2,670 vertical pixels, full-frame CCD imager.The CCD is optically bonded to a tapered fiber-optic. Onthe front of the taper, a gadolinium oxysulfide scintillatorlayer is deposited in order to make the detector optimizedfor resolution with X-ray energies in the range given by thesource. For this experiment, we used a 2×2 binning of thedetector pixel, corresponding to a calculated spatialresolution of around 13 μm with a field of view of18 mm×12 mm.
For each tomographic scan, 1,440 projections of thesample were acquired for equally spaced rotation anglesand measurement time of 15 s over a total rotation of 180°.In order to reconstruct a 3D image of the sample, thetomographic projections have been elaborated using acustom-developed software [49] written in IDL® languageand based on the filtered backprojection algorithm [50, 51].
Results and discussion
Solution analysis
ICP-MS analysis of dissolved vertebrae was utilized as afirst step in order to find differences between elemental
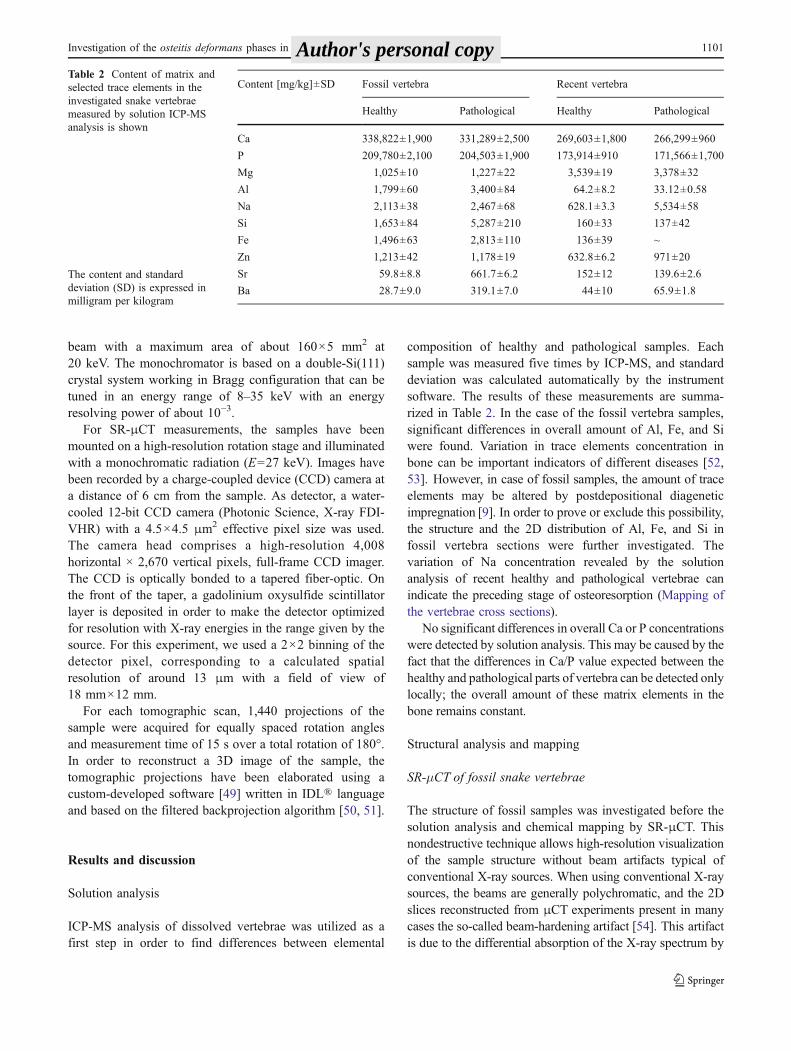
composition of healthy and pathological samples. Eachsample was measured five times by ICP-MS, and standarddeviation was calculated automatically by the instrumentsoftware. The results of these measurements are summa-rized in Table 2. In the case of the fossil vertebra samples,significant differences in overall amount of Al, Fe, and Siwere found. Variation in trace elements concentration inbone can be important indicators of different diseases [52,53]. However, in case of fossil samples, the amount of traceelements may be altered by postdepositional diageneticimpregnation [9]. In order to prove or exclude this possibility,the structure and the 2D distribution of Al, Fe, and Si infossil vertebra sections were further investigated. Thevariation of Na concentration revealed by the solutionanalysis of recent healthy and pathological vertebrae canindicate the preceding stage of osteoresorption (Mapping ofthe vertebrae cross sections).
No significant differences in overall Ca or P concentrationswere detected by solution analysis. This may be caused by thefact that the differences in Ca/P value expected between thehealthy and pathological parts of vertebra can be detected onlylocally; the overall amount of these matrix elements in thebone remains constant.
Structural analysis and mapping
SR-μCT of fossil snake vertebrae
The structure of fossil samples was investigated before thesolution analysis and chemical mapping by SR-μCT. Thisnondestructive technique allows high-resolution visualizationof the sample structure without beam artifacts typical ofconventional X-ray sources. When using conventional X-raysources, the beams are generally polychromatic, and the 2Dslices reconstructed from μCT experiments present in manycases the so-called beam-hardening artifact [54]. This artifactis due to the differential absorption of the X-ray spectrum by
Content [mg/kg]±SD Fossil vertebra Recent vertebra
Healthy Pathological Healthy Pathological
Ca 338,822±1,900 331,289±2,500 269,603±1,800 266,299±960
P 209,780±2,100 204,503±1,900 173,914±910 171,566±1,700
Mg 1,025±10 1,227±22 3,539±19 3,378±32
Al 1,799±60 3,400±84 64.2±8.2 33.12±0.58
Na 2,113±38 2,467±68 628.1±3.3 5,534±58
Si 1,653±84 5,287±210 160±33 137±42
Fe 1,496±63 2,813±110 136±39 ~
Zn 1,213±42 1,178±19 632.8±6.2 971±20
Sr 59.8±8.8 661.7±6.2 152±12 139.6±2.6
Ba 28.7±9.0 319.1±7.0 44±10 65.9±1.8
Table 2 Content of matrix andselected trace elements in theinvestigated snake vertebraemeasured by solution ICP-MSanalysis is shown
The content and standarddeviation (SD) is expressed inmilligram per kilogram
Investigation of the osteitis deformans phases in snake vertebrae 1101 Author's personal copy

the sample and leads to a misleading recovery of the linearabsorption coefficients on the reconstructed slices, mainlyappearing as brightening of the sample borders. Beam
hardening is related to the density of the material; then, asfossil samples are generally highly dense, this artifact is oftenstrong. Performing synchrotron X-ray μCT experiment usinga third-generation synchrotron source, as Elettra, instead ofconventional X-ray sources, strongly improves the quality ofimages in the investigation of fossil samples thanks to themonochromaticity and the high intensity of the X-ray beam.A monochromatic intense beam leads to reconstructed slicesfree of beam-hardening effects and with a high signal-to-noise ratio.
Figure 2a, b shows the comparison of a SR-μCT slice ofhealthy and pathological fossil vertebrae, respectively. Thehighly porous structure of pathological sample is clearlyvisible. This less compact structure with respect to thehealthy vertebra, with considerably higher bone surfacearea can help to explain the increased content of Si, Al, andFe trace elements due the digenesis. The spongy structureof the pathological bone is observable also on the 3Dreconstruction of the vertebra section (Fig. 2c).
Mapping of the vertebrae cross sections
The parameters of DP-LIBS setup that worked inorthogonal, reheating configuration were optimized inorder to map the fossil material effectively. The maingoal of this optimization process was to reach ablationcrater sizes∼100 μm with the lowest LOD, i.e., withhighest achievable signal-to-noise ratio. The desirablesize of the ablation craters was determined by severalfactors. The decrease of the LIBS ablation craters twotimes with respect to our earlier study [9] was needed inorder to reach comparable spatial resolution to LA-ICP-MS. Simultaneously, high-resolution, large-area DP-LIBSmapping had to be realized in acceptable temporal interval formeasurements. Considering a typical sample size of ∼50 mm2
and ablation craters placed ~150 μm in both axes fromeach other, one map (consisting∼2,100 sampling points)could be measured in about 2 h, including the alignmenttime.
The∼100 μm in diameter ablation craters were createdby setting the energy of 266-nm ablation laser to 10 mJper pulse. The calculated irradiance of the target was 25GW cm−2. Parametric optimization of the DP-LIBS setupincluded setting the 1,064-nm reheating laser energy,interpulse delay, and the ICCD detector gating. Thehighest signal-to noise ratio was detected for the reheatinglaser energy of 90 mJ/pulse, interpulse delay of 500 ns,ICCD detector delay time of 1 μs, and integration time of10 μs. The pulse duration was∼5 ns for both laser pulses.The comparison of SP-LIBS and optimized DP-LIBSspectra together with the ablation crater photograph isshown in Fig. 3. A typical LA-ICP-MS crater [9] is shownfor comparison.
Fig. 3 Examples of SP-LIBS (SP) and DP-LIBS (DP) spectraobtained in optimized orthogonal reheating DP-LIBS configuration.The SP-LIBS spectrum was recorded without the reheating laser pulse.The arrow shows a the 253.56 nm P (I) and b the 452.69 nm Ca (I)spectral lines used for analysis. c The photograph of the typical DP-LIBS ablation crater (left), together with LA-ICP-MS crater [9] (right)shown for comparison. The bars have a length of 100 μm
1102 M. Galiová et al. Author's personal copy
Before each measurement, a cleaning shot was appliedand LIBS spectra of selected elements were acquired, withone laser pulse applied into each spot.
During the data analysis, the continuum backgrounddetermined for each shot from five data points on both sidesof the monitored spectral line by a linear background fitmethod was subtracted from the intensity value of everydata point forming the spectral line.
Typical relative standard deviation (RSD) of spectral lineintensities depends on the sample surface structure [9]. Teethand bones contain capillaries that can affect variability ofmonitored signals and cause higher RSD. Here, the RSD wasestimated by application of five laser pulses into one spot of
calcified tissue. RSD was 10%, 15%, and 8% for calcium,phosphorus, and sodium, respectively.
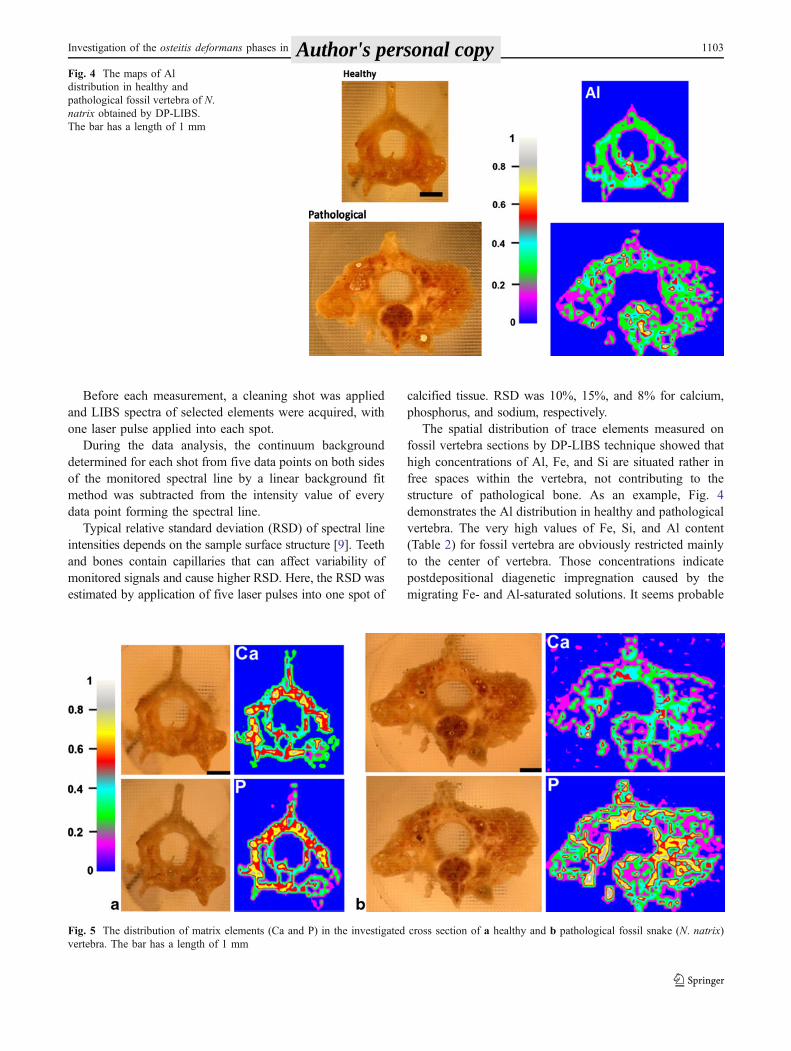
The spatial distribution of trace elements measured onfossil vertebra sections by DP-LIBS technique showed thathigh concentrations of Al, Fe, and Si are situated rather infree spaces within the vertebra, not contributing to thestructure of pathological bone. As an example, Fig. 4demonstrates the Al distribution in healthy and pathologicalvertebra. The very high values of Fe, Si, and Al content(Table 2) for fossil vertebra are obviously restricted mainlyto the center of vertebra. Those concentrations indicatepostdepositional diagenetic impregnation caused by themigrating Fe- and Al-saturated solutions. It seems probable
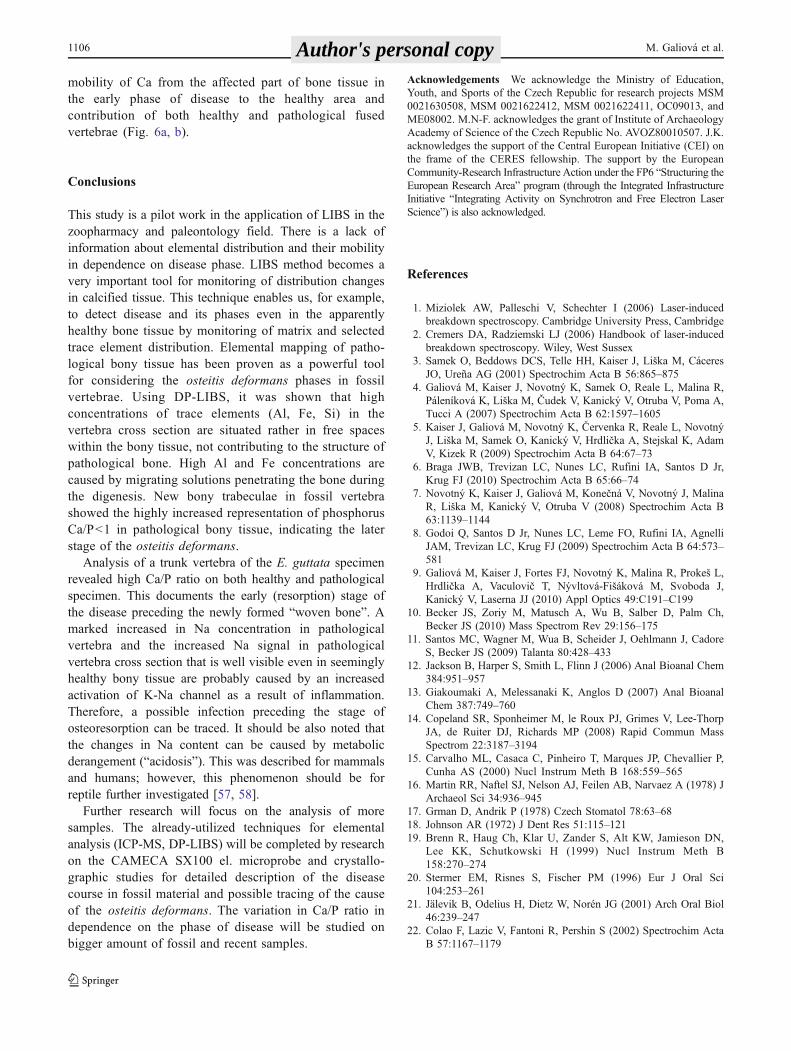
Fig. 5 The distribution of matrix elements (Ca and P) in the investigated cross section of a healthy and b pathological fossil snake (N. natrix)vertebra. The bar has a length of 1 mm
Fig. 4 The maps of Aldistribution in healthy andpathological fossil vertebra of N.natrix obtained by DP-LIBS.The bar has a length of 1 mm
Investigation of the osteitis deformans phases in snake vertebrae 1103 Author's personal copy

that migrating solutions entered vertebral body through thesystem of foramina (paracotylar and subcentral foramina)soon after the deposition of fossil material as a result ofinstable environmental conditions after the burial ofosteological material. Instability of sedimentary rockenvironment is also documented by the low concentrationsof both elements in newly formed highly porous bonytissue of the pathological vertebra as a result of thesecondary depletion of the surface areas of the bone.
Comparison of relative representation of both matrixelements (Ca and P) in distributional maps (Figs. 4 and5) indicates that healthy specimen has almost equal
distribution of relatively high Ca and P concentrations invertebral center and in the neural arch with the onlyexception of synapophyses, which are formed primarily bya spongy bony tissue in comparison with compact bone. Infossil vertebra with osteitis deformans, the relative amountof Ca is lower. It is probable that decrease in Ca and Pratio occurred during the life of the analyzed specimen.Distributional maps of Ca and P document pathologicaldisintegration of compact bone accompanied by theincreasing porosity of the proliferating newly formedtrabecular bone.
Osteitis deformans is polyetiologic disease. Severalfactors can be responsible for this disease causing animbalance of matrix elements Ca and P. However, two ofthem are most probable for fossil snakes from MladečCaves—either viral infection (Polyomavirus) or metabolicbone disease. Viral infection seems to be the more probablebecause of pathological bone tissue restriction.
In the case of recent snake vertebrae samples, high Ca/Pratio was detected on both healthy and pathologicalspecimen (Fig. 6). This documents the early (resorption)stage of the disease preceding the newly formed “wovenbone”.
The increased Na concentration in pathological vertebra,revealed by solution analysis, is well visible also in the 2Dmaps of vertebra section (Fig. 7). Even seemingly healthybony tissue indicates an increased activation of K-Nachannel as a result of inflammation [55]. Thus, the possibleinflammation preceding the stage of osteoresorption can betraced.
A possible cause of the disease could be a polyomavirusinfection as a result of a bite from an infected prey, beingusually small rodents in the case of E. guttata.
Fig. 7 2D maps of Na distribution in both healthy and pathologicalbone samples of recent snake (E. guttata) vertebra. The bar has alength of 1 mm
Fig. 6 The distribution of matrix elements (Ca and P) in the investigated cross section of a healthy and b pathological recent snake (E. guttata)vertebra. The bar has a length of 1 mm
1104 M. Galiová et al. Author's personal copy

Use of Ca/P ratios to determination of osteitis deformansphases
As it was discussed above, the variation in Ca/P ratio cancorrespond to the osteitis deformans phases. The differentcalcium and phosphorus distributions for healthy andpathological vertebrae are shown in Fig. 8. Ca and P mapsof all samples were normalized to maximum intensity andvisualized by eight colors, i.e., divided to intervals accordingto the appropriate spectral line intensities of Ca and P. Thetotal areas of vertebrae together with the areas correspondingto each color in the map were calculated by ImageJ software[56].
In the case of healthy fossil vertebra sample (Fig. 8a),the Ca area (for each color) is bigger or similar to P area. Incomparison, in the recent healthy bone tissue, the biggerarea of Ca is obtained for higher value of normalizedintensity (Fig. 8b). For both healthy samples, the averagevalues of Ca/P ratio was ~1.5.
The decrease in matrix element areas with increasingnormalized intensity was observed for fossil pathologicalvertebra. The decrease of P area is slower in comparisonwith the calcium area decrease (Figs. 7 and 8a). Thisbehavior confirms the decrease of the Ca content in thesample affected with osteitis deformans. The average Ca/Pratio was about 0.6. The changed Ca/P ratio corresponds tothe advanced stage of osteitis deformans seen on bonemorphology. Resorbed part of the sample has a differentmatrix element ratio.
A similar result was obtained for recent pathologicalvertebra. However, in this case, the presence of twofused vertebrae has to be taken into account. Only smallarea that can be localized by lower calcium intensity(Fig. 6a) is affected by Paget’s disease. The phosphorusdistribution is similar to that one in the healthy sample.The dependence of Ca area on normalized intensity hasan inverse variation with respect to P area. Ca/P ratio forthis sample is about 2.4. Higher ratio can be caused by
Fig. 8 Comparison of matrix elements (Ca, P); normalized intensity with area corresponds to different intensities in a fossil and b recent snakevertebrae
Investigation of the osteitis deformans phases in snake vertebrae 1105 Author's personal copy
mobility of Ca from the affected part of bone tissue inthe early phase of disease to the healthy area andcontribution of both healthy and pathological fusedvertebrae (Fig. 6a, b).
Conclusions
This study is a pilot work in the application of LIBS in thezoopharmacy and paleontology field. There is a lack ofinformation about elemental distribution and their mobilityin dependence on disease phase. LIBS method becomes avery important tool for monitoring of distribution changesin calcified tissue. This technique enables us, for example,to detect disease and its phases even in the apparentlyhealthy bone tissue by monitoring of matrix and selectedtrace element distribution. Elemental mapping of patho-logical bony tissue has been proven as a powerful toolfor considering the osteitis deformans phases in fossilvertebrae. Using DP-LIBS, it was shown that highconcentrations of trace elements (Al, Fe, Si) in thevertebra cross section are situated rather in free spaceswithin the bony tissue, not contributing to the structure ofpathological bone. High Al and Fe concentrations arecaused by migrating solutions penetrating the bone duringthe digenesis. New bony trabeculae in fossil vertebrashowed the highly increased representation of phosphorusCa/P<1 in pathological bony tissue, indicating the laterstage of the osteitis deformans.
Analysis of a trunk vertebra of the E. guttata specimenrevealed high Ca/P ratio on both healthy and pathologicalspecimen. This documents the early (resorption) stage ofthe disease preceding the newly formed “woven bone”. Amarked increased in Na concentration in pathologicalvertebra and the increased Na signal in pathologicalvertebra cross section that is well visible even in seeminglyhealthy bony tissue are probably caused by an increasedactivation of K-Na channel as a result of inflammation.Therefore, a possible infection preceding the stage ofosteoresorption can be traced. It should be also noted thatthe changes in Na content can be caused by metabolicderangement (“acidosis”). This was described for mammalsand humans; however, this phenomenon should be forreptile further investigated [57, 58].
Further research will focus on the analysis of moresamples. The already-utilized techniques for elementalanalysis (ICP-MS, DP-LIBS) will be completed by researchon the CAMECA SX100 el. microprobe and crystallo-graphic studies for detailed description of the diseasecourse in fossil material and possible tracing of the causeof the osteitis deformans. The variation in Ca/P ratio independence on the phase of disease will be studied onbigger amount of fossil and recent samples.
Acknowledgements We acknowledge the Ministry of Education,Youth, and Sports of the Czech Republic for research projects MSM0021630508, MSM 0021622412, MSM 0021622411, OC09013, andME08002. M.N-F. acknowledges the grant of Institute of ArchaeologyAcademy of Science of the Czech Republic No. AVOZ80010507. J.K.acknowledges the support of the Central European Initiative (CEI) onthe frame of the CERES fellowship. The support by the EuropeanCommunity-Research Infrastructure Action under the FP6 “Structuring theEuropean Research Area” program (through the Integrated InfrastructureInitiative “Integrating Activity on Synchrotron and Free Electron LaserScience”) is also acknowledged.
References
1. Miziolek AW, Palleschi V, Schechter I (2006) Laser-inducedbreakdown spectroscopy. Cambridge University Press, Cambridge
2. Cremers DA, Radziemski LJ (2006) Handbook of laser-inducedbreakdown spectroscopy. Wiley, West Sussex
3. Samek O, Beddows DCS, Telle HH, Kaiser J, Liška M, CáceresJO, Ureña AG (2001) Spectrochim Acta B 56:865–875
4. Galiová M, Kaiser J, Novotný K, Samek O, Reale L, Malina R,Páleníková K, Liška M, Čudek V, Kanický V, Otruba V, Poma A,Tucci A (2007) Spectrochim Acta B 62:1597–1605
5. Kaiser J, Galiová M, Novotný K, Červenka R, Reale L, NovotnýJ, Liška M, Samek O, Kanický V, Hrdlička A, Stejskal K, AdamV, Kizek R (2009) Spectrochim Acta B 64:67–73
6. Braga JWB, Trevizan LC, Nunes LC, Rufini IA, Santos D Jr,Krug FJ (2010) Spectrochim Acta B 65:66–74
7. Novotný K, Kaiser J, Galiová M, Konečná V, Novotný J, MalinaR, Liška M, Kanický V, Otruba V (2008) Spectrochim Acta B63:1139–1144
8. Godoi Q, Santos D Jr, Nunes LC, Leme FO, Rufini IA, AgnelliJAM, Trevizan LC, Krug FJ (2009) Spectrochim Acta B 64:573–581
9. Galiová M, Kaiser J, Fortes FJ, Novotný K, Malina R, Prokeš L,Hrdlička A, Vaculovič T, Nývltová-Fišáková M, Svoboda J,Kanický V, Laserna JJ (2010) Appl Optics 49:C191–C199
10. Becker JS, Zoriy M, Matusch A, Wu B, Salber D, Palm Ch,Becker JS (2010) Mass Spectrom Rev 29:156–175
11. Santos MC, Wagner M, Wua B, Scheider J, Oehlmann J, CadoreS, Becker JS (2009) Talanta 80:428–433
12. Jackson B, Harper S, Smith L, Flinn J (2006) Anal Bioanal Chem384:951–957
13. Giakoumaki A, Melessanaki K, Anglos D (2007) Anal BioanalChem 387:749–760
14. Copeland SR, Sponheimer M, le Roux PJ, Grimes V, Lee-ThorpJA, de Ruiter DJ, Richards MP (2008) Rapid Commun MassSpectrom 22:3187–3194
15. Carvalho ML, Casaca C, Pinheiro T, Marques JP, Chevallier P,Cunha AS (2000) Nucl Instrum Meth B 168:559–565
16. Martin RR, Naftel SJ, Nelson AJ, Feilen AB, Narvaez A (1978) JArchaeol Sci 34:936–945
17. Grman D, Andrik P (1978) Czech Stomatol 78:63–6818. Johnson AR (1972) J Dent Res 51:115–12119. Brenn R, Haug Ch, Klar U, Zander S, Alt KW, Jamieson DN,
Lee KK, Schutkowski H (1999) Nucl Instrum Meth B158:270–274
20. Stermer EM, Risnes S, Fischer PM (1996) Eur J Oral Sci104:253–261
21. Jälevik B, Odelius H, Dietz W, Norén JG (2001) Arch Oral Biol46:239–247
22. Colao F, Lazic V, Fantoni R, Pershin S (2002) Spectrochim ActaB 57:1167–1179
1106 M. Galiová et al. Author's personal copy
23. Kaiser J, Reale L, Ritucci A, Tomassetti G, Poma A, Spanò L,Tucci A, Flora F, Lai A, Faenov A, Pikuz T, Mancini L, TrombaG, Zanini F (2005) Eur Phys J D 32:113–118
24. Kaiser J, Samek O, Reale L, Liška M, Malina R, Ritucci A, PomaA, Tucci A, Flora F, Lai A, Mancini L, Tromba G, Zanini F,Faenov A, Pikuz T, Cinque G (2006) Microsc Res Tech 70:147–153
25. Jelinek J (1959) Dokumentační deník z výzkumu Mladečskéjeskyně v letech 1958-1959. —MS, archív Moravského zemskéhomuzea v Brně, Brno, pp. 1–70 (in Czech)
26. Horáček I, Ložek V (1984) Československý Kras 34:98–10027. Ivanov M (2007) Geodiversitas 29:297–32028. Pasquini C, Cortez J, Silva LMC, Gonzaga FB (2007) J Braz
Chem Soc 18:463–51229. Cristoforetti G, Legnaioli S, Palleschi V, Salvetti A, Tognoni E
(2005) Appl Phys B 80:559–56830. Cremers DA, Chinni RC (2009) Appl Spectrosc Rev 44:457–
50631. Kuwako A, Uchida Y, Maeda K (2003) Appl Opt 42:6052–605632. Cremers DA, Radziemski LJ, Loree TR (1984) Appl Spectrosc
38:721–72933. Uebbing J, Brust J, Sdorra W, Leis F, Niemax K (1991) Appl
Spectrosc 45:1419–142334. Stratis DN, Eland KL, Angel SM (2000) Appl Spectrosc 54:1270–
127435. St-Onge L, Detalle V, Sabsabi M (2002) Spectrochim Acta B
57:121–13536. Scaffidi J, Pearman W, Lawrence M, Carter JC, Colston BW,
Angel SM (2004) Appl Opt 43:5243–525037. Cristoforetti G, Legnaioli L, Pardini L, Palleschi V, Salvetti A,
Tognoni E (2006) Spectrochim Acta B 61:340–35038. Ivanov M (2004) In: 10, Kvartér 2004, Brno39. Tiegs RD (1997) Clin Ther 19:1309–132940. Preziosi R, Diana A, Florio D, Gustinelli A, Nardini G (2007) Vet
J 174:669–67241. Rousière M, Michou L, Cornélis F, Orcel P (2003) Best Pract Res
Clin Rheumatol 17:1019–104142. Cushing FR, Bone HG (2002) Clinic Rev Bone Miner Metab
1:115–134
43. Hajkova P, Knotek Z (1998) In: European Association of Zoo-and Wildlife Veretinarians (EAZWV), Second Scientific Meeting,Chester, pp 1–4
44. Zaichick V, Tzaphlidou M (2002) Appl Radiat Isotopes 56:781–786
45. Speller R, Pani S, Tzaphlidou M, Horrocks J (2005) Nucl InstrumMeth A 548:269–273
46. Tzaphlidou M (2008) J Biol Phys 34:39–4947. Wopenka B, Pasteris JD (2005) Mat Sci Eng C Bio S 25:131–14348. Skinner HCW (2005) Mineralogy of bone. In: Selinus O (ed)
Essentials of medical geology. Elsevier Academic, Amsterdam, pp667–693
49. Montanari F, Dreossi D, Mancini L (2003) SYRMEP TOMOProject. Tutorial
50. Radon J (1917) Berichte über die Verhandlungen der SächsischeAkademie der Wissenschaften (Reports on the proceedings of theSaxony Academy of Science), vol. 69, pp 262–277. Translation:Radon J, Parks PC (translator) (1986) IEEE Trans Med Imaging5:170–176
51. Herman GT (2009) Fundamentals of computerized tomography:image reconstruction from projections, 2nd edn. Springer, London
52. D'Haese PC, Couttenye MM, Lamberts LV, Elseviers MM,Goodman WG, Schrooten I, Cabrera WE, De Broe ME (1999)Clin Chem 45:1548–1556
53. Kinley D (1996) Targeting malnutrition: isotopic tools forevaluating nutrition worldwide. International Atomic EnergyAgency, Vienna
54. Baruchel J, Buffière JY, Maire E, Merle P, Peix G (2000) X-raytomography in material science, general principles. HermesScience, Paris
55. Murray RK, Granner DK, Mayes PA, Rodwell VW (2003)Harper’s illustrated biochemistry. McGraw-Hill, New York
56. Abramoff MD, Magelhaes PJ, Ram SJ (2004) Image Processingwith Image J. Biophoton Int 11:36–42
57. Bushinsky DA, Gavrilov K, Stathopoulos VM, Krieger NS,Chabala JM, LeviI-Setti R (1996) AJP Cell Phys 271:C1025–C1031
58. Bushinsky DA, Chabala JM, LeviI-Setti R (1989) Am J Physiol256:E152–E158
Investigation of the osteitis deformans phases in snake vertebrae 1107 Author's personal copy