Reconstruction from Breakdown in Northeastern India: Building State Capability
Upload
khangminh22Category
view
1download
0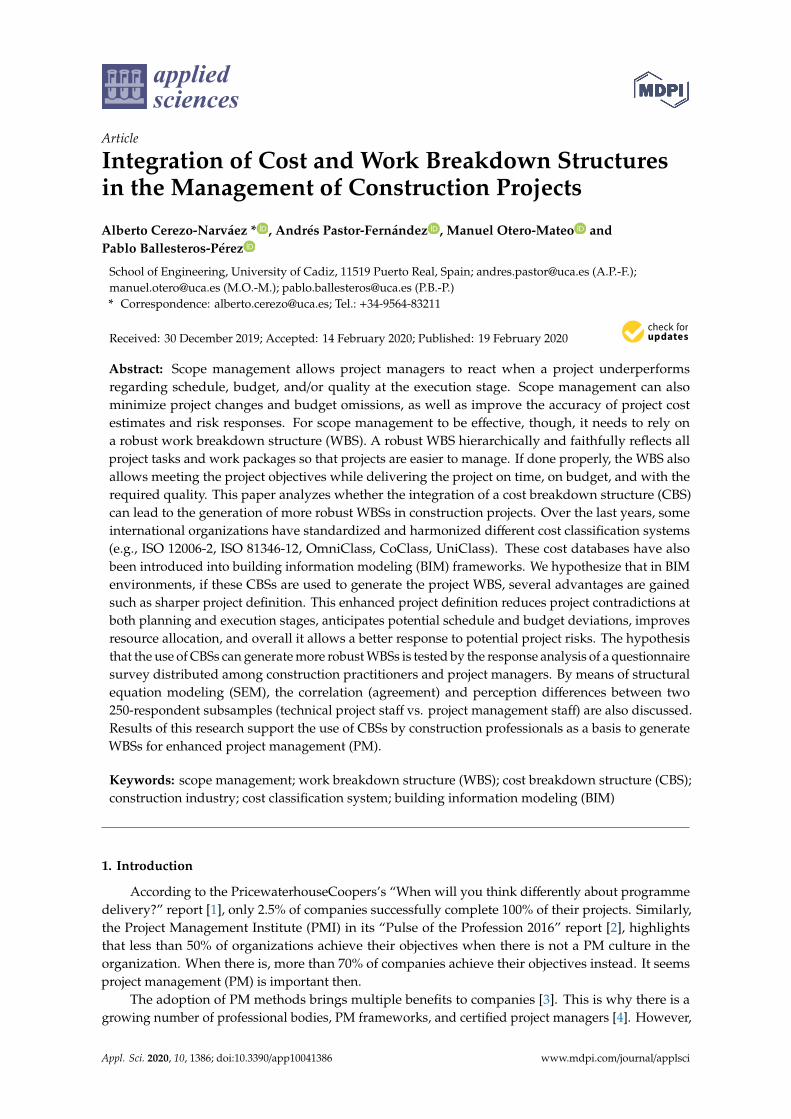
applied sciences
Article
Integration of Cost and Work Breakdown Structuresin the Management of Construction Projects
Alberto Cerezo-Narváez * , Andrés Pastor-Fernández , Manuel Otero-Mateo andPablo Ballesteros-Pérez
School of Engineering, University of Cadiz, 11519 Puerto Real, Spain; [email protected] (A.P.-F.);[email protected] (M.O.-M.); [email protected] (P.B.-P.)* Correspondence: [email protected]; Tel.: +34-9564-83211
Received: 30 December 2019; Accepted: 14 February 2020; Published: 19 February 2020�����������������
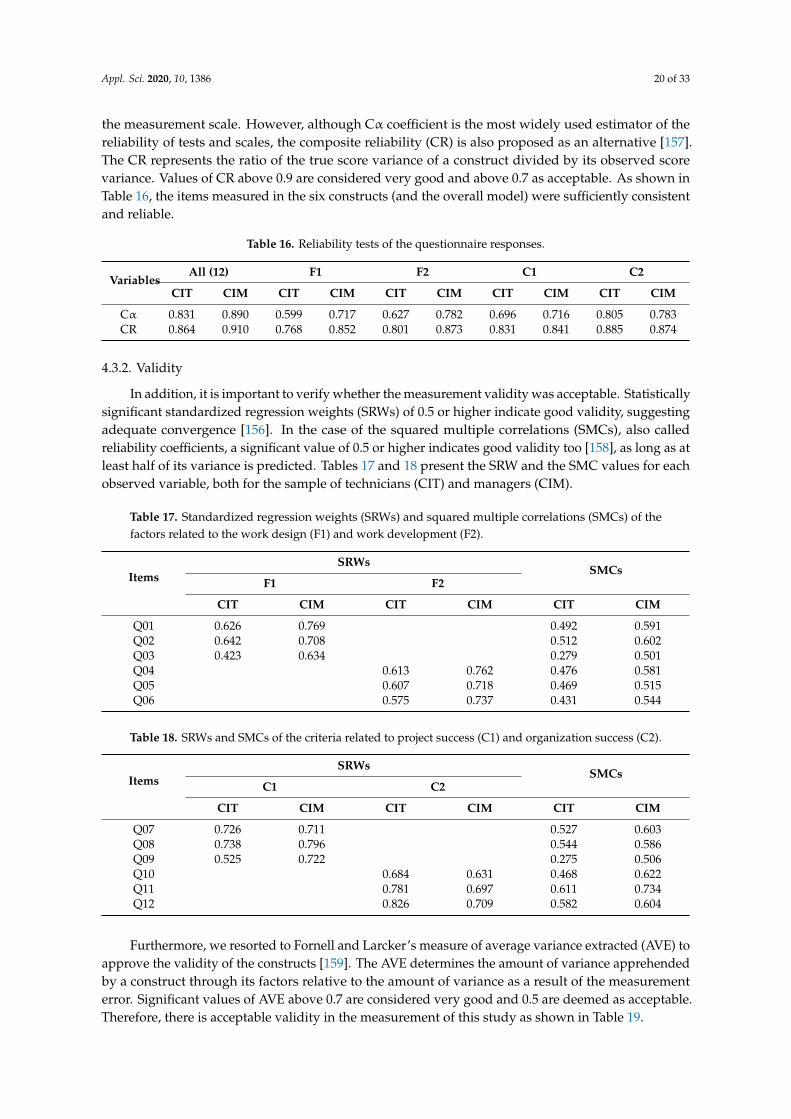
Abstract: Scope management allows project managers to react when a project underperformsregarding schedule, budget, and/or quality at the execution stage. Scope management can alsominimize project changes and budget omissions, as well as improve the accuracy of project costestimates and risk responses. For scope management to be effective, though, it needs to rely ona robust work breakdown structure (WBS). A robust WBS hierarchically and faithfully reflects allproject tasks and work packages so that projects are easier to manage. If done properly, the WBS alsoallows meeting the project objectives while delivering the project on time, on budget, and with therequired quality. This paper analyzes whether the integration of a cost breakdown structure (CBS)can lead to the generation of more robust WBSs in construction projects. Over the last years, someinternational organizations have standardized and harmonized different cost classification systems(e.g., ISO 12006-2, ISO 81346-12, OmniClass, CoClass, UniClass). These cost databases have alsobeen introduced into building information modeling (BIM) frameworks. We hypothesize that in BIMenvironments, if these CBSs are used to generate the project WBS, several advantages are gainedsuch as sharper project definition. This enhanced project definition reduces project contradictions atboth planning and execution stages, anticipates potential schedule and budget deviations, improvesresource allocation, and overall it allows a better response to potential project risks. The hypothesisthat the use of CBSs can generate more robust WBSs is tested by the response analysis of a questionnairesurvey distributed among construction practitioners and project managers. By means of structuralequation modeling (SEM), the correlation (agreement) and perception differences between two250-respondent subsamples (technical project staff vs. project management staff) are also discussed.Results of this research support the use of CBSs by construction professionals as a basis to generateWBSs for enhanced project management (PM).
Keywords: scope management; work breakdown structure (WBS); cost breakdown structure (CBS);construction industry; cost classification system; building information modeling (BIM)
1. Introduction
According to the PricewaterhouseCoopers’s “When will you think differently about programmedelivery?” report [1], only 2.5% of companies successfully complete 100% of their projects. Similarly,the Project Management Institute (PMI) in its “Pulse of the Profession 2016” report [2], highlightsthat less than 50% of organizations achieve their objectives when there is not a PM culture in theorganization. When there is, more than 70% of companies achieve their objectives instead. It seemsproject management (PM) is important then.
The adoption of PM methods brings multiple benefits to companies [3]. This is why there is agrowing number of professional bodies, PM frameworks, and certified project managers [4]. However,
Appl. Sci. 2020, 10, 1386; doi:10.3390/app10041386 www.mdpi.com/journal/applsci
Appl. Sci. 2020, 10, 1386 2 of 33
in the context of construction, KPMG’s “Climbing the curve” report [5] reveals the construction sector’slow productivity in which less than a third of projects are completed within less than a 10% delay anda quarter within less than a 10% overrun.
Construction projects performance is influenced by many aspects (e.g., constraints, specific tasks,project changes) [6]. The project stakeholders need to state the functional requirements at a very earlystage [7]. This allows identifying the elements that must be considered in the project definition (scope).The interrelationships among these elements and their relative importance allow the formulation ofa first project network structure model. In this regard, scope management constantly assesses andupdates this project network structure to carry out the project [8,9]. This implies the definition of allwork a project involves, and also how to break it down into more manageable pieces. Generally, thisprogressive task decomposition is referred as work breakdown structure (WBS). Eventually, peopleand responsibilities will also be attributed to the different work packages. This links the WBS to theproject and company’s organigram.
Additionally, but somehow in parallel, companies draft the project budget. They normally resortto another structure where items are classified in chapters, subchapters, and units. This structure isgenerally referred to as cost breakdown structure (CBS). CBSs may keep some parallelisms (or not)with the WBS. This, as items in the CBS may be grouped according to multiple criteria such as itemslocation, similar construction methodologies, materials, equipment, or resources involved.
Still, thanks to these processes, more accurate schedules and budgets can be generated and projectscan be controlled (facilitating a comparison of what is actually carried out with what was intended tobe executed). Conversely, ill-defined scopes are one of the most frequent causes of project failure [10].This normally arises as poor project definition, contradictory requirements, important tasks omission,very inaccurate estimates, and inappropriate (unrealistic or overly optimistic) contingencies [11].
In summary, scope management takes care of what must be done in a project, why it should be done,and how it can be done [12]. All these play a key role in project performance. In scope managementthen, a hierarchical decomposition of all project tasks under the form of the WBS is paramount.However, the CBS is equally important, as it allows to manage the project cost dimension. Hence,both the WBS and the CBS are valuable PM tools as they establish the basis for planning, scheduling,budgeting, resource allocation, responsibility assignment, and information management [13]. In theconstruction industry, the development of the WBS and CBS allows the implementation of other projectmonitoring and control techniques that can also handle potential risks [14].
The main objective of this research is to confirm whether a significant alignment between the WBSand the CBS offers additional advantages when managing construction projects. It also investigateshow this alignment can positively benefit and facilitate the adoption of BIM and other managementtools. To do so, we will confirm the existence of a direct and significant causal relationship between theoverlap (integration) between WBS and CBS with a higher degree of project objectives fulfilment. Thispiece of research is a continuation of the authors’ research on the influence of the scope management inconstruction projects success [15].
This paper is structured as follows: Section 2 analyzes the PM standards and frameworks regardingWBS. Then, it compiles current coding systems of construction prices classification (CBS). Section 2ends with the integration of WBS and CBS as BIM tools. Section 3 consists of the Methodology. Thebeginning of Section 3 describes which criteria were selected as synonym of project success, as well ashow the theoretical model is built. The second part of Section 3 then describes the survey that wasdistributed among project technicians and project managers of the construction industry. The statisticalanalysis is also presented at the end of this section. Section 4 presents the Results of a structuralequation model (SEM). This model describes the relationships between the project success criteriaand the survey respondents’ questions on WBS and CBS. Section 5 presents the Discussions. Finally,Section 6 includes the Conclusions, research limitations, and further research continuations.
Appl. Sci. 2020, 10, 1386 3 of 33
2. Literature Review
Delivering projects on time, within budget and with required quality is one of the most difficultand challenging goals for project managers [16,17]. In the construction industry, an incompletescope definition in the early stages of the project life cycle may be a source for future problems [18].On the contrary, if a project is well defined, all necessary information is provided to identify thework that must be carried out [19]. During planning, stakeholders’ needs and expectations becomerequirements. They shape the scope and inform about the major project deliverables, assumptions,and constraints [20–22]. The scope definition also allows to handle future project alterations [23,24]. Inshort, scope management ensures that only activities that contribute to meeting the project objectivesare performed, from planning to closure [25–28].
2.1. Work Breakdown Structure (WBS)
Structuring the project scope at the outset is a good way of mapping the project elements andkeeping internal consistency with the project objectives. All project work is broken down into activitiesand deliverables to which resources are allocated, scheduled, budgeted, and later, controlled [8]. Thisprocess is formalized under the creation of the work breakdown structure (WBS), as summarized inFigure 1.
Appl. Sci. 2020, 10, x FOR PEER REVIEW 3 of 32
2. Literature Review
Delivering projects on time, within budget and with required quality is one of the most difficult and challenging goals for project managers [16,17]. In the construction industry, an incomplete scope definition in the early stages of the project life cycle may be a source for future problems [18]. On the contrary, if a project is well defined, all necessary information is provided to identify the work that must be carried out [19]. During planning, stakeholders’ needs and expectations become requirements. They shape the scope and inform about the major project deliverables, assumptions, and constraints [20–22]. The scope definition also allows to handle future project alterations [23,24]. In short, scope management ensures that only activities that contribute to meeting the project objectives are performed, from planning to closure [25–28].
2.1. Work Breakdown Structure (WBS)
Structuring the project scope at the outset is a good way of mapping the project elements and keeping internal consistency with the project objectives. All project work is broken down into activities and deliverables to which resources are allocated, scheduled, budgeted, and later, controlled [8]. This process is formalized under the creation of the work breakdown structure (WBS), as summarized in Figure 1.
Figure 1. Relationship of the work breakdown structure (WBS) with the project.
The WBS has been extensively discussed and recognized as a powerful tool. Through the WBS, a project is hierarchically organized and systematically decomposed into smaller and manageable units for better performance control [29]. In this regard, the WBS aims at breaking down, classifying, and sub-grouping all project elements. Hence, in a WBS, each descending level represents increasingly detailed definition of all project components [30].
2.1.1. WBS in the International PM Standards
In order to achieve the project objectives, the ISO 21500 standard [31] suggests that the WBS must state all project deliverables and break them down into smaller packages. All WBS elements must include identification codes aligned with the configuration management plan. This way, the PM team can control the progress and assign responsible people to each of them.
Assumptions Resources
Budget Schedule
Control
Risks
Activities
Net
WBS
Figure 1. Relationship of the work breakdown structure (WBS) with the project.
The WBS has been extensively discussed and recognized as a powerful tool. Through the WBS,a project is hierarchically organized and systematically decomposed into smaller and manageableunits for better performance control [29]. In this regard, the WBS aims at breaking down, classifying,and sub-grouping all project elements. Hence, in a WBS, each descending level represents increasinglydetailed definition of all project components [30].
2.1.1. WBS in the International PM Standards
In order to achieve the project objectives, the ISO 21500 standard [31] suggests that the WBS muststate all project deliverables and break them down into smaller packages. All WBS elements mustinclude identification codes aligned with the configuration management plan. This way, the PM teamcan control the progress and assign responsible people to each of them.
Appl. Sci. 2020, 10, 1386 4 of 33
For the International Project Association (IPMA), the project scope must stipulate what isoutside and what is inside (what must be done/achieved) [8]. A good definition of the scope anddeliverables ensures that discrepancies are eventually avoided and helps with the project planning.However, projects can be broken down according to different points of view (work distribution, projectorganization, information, documentation structure, etc.) [32]. The (hierarchical) project structures arekey mechanisms for keeping the order and ensuring that nothing important is neglected [33]. The workpackages (WPs) are assigned to a resource provider, the work is scheduled, the costs are estimated,and eventually the work is commissioned, controlled and completed.
For the PMI [9], the WBS subdivides all project work into components, including its deliverables.The WBS also includes a dictionary, which helps to better organize all necessary work intomore-easily-identifiable portions. The decomposition has to be oriented to the deliverables required [34].In this context, there are at least two main issues when developing a WBS: The level of detail and thedecomposition criteria [35]. However, there is no universal rule for establishing the level of detail to bereached. Still, project managers know well that project decomposition requires subdividing the workof all deliverables and components into their most fundamental elements, up to the level at which theyrepresent verifiable products, services, or results [9]. This is because the work contained in the WPs hasto be eventually scheduled, resourced, budgeted, risk-assessed, measured, and monitored later. TheWBS decomposition can also include information on contracts, quality requirements, and technicalreferences of each element to facilitate the project control. However, the WBS does not sequence thework, nor states their interdependencies.
For the Project Management Association of Japan (PMAJ) [36], the focus of the WBS lies on therelationships between processes and work through cooperation and compensation. The documentationrequired for the elaboration of the WBS is prepared by focusing on the tasks and processes requiredto achieve the objectives. The objectives, in turn, are stated as the summary of characteristics of thequalitative results expected and the quantitative objectives to be reached.
To complete the review of the most common international PM standards, it is necessary tounderline the approach of AXELOS (a joint venture created by the Cabinet Office on behalf of HerMajesty’s Government and Capita PLC) in its PRINCE2 2017 standard [37]. In it, the product breakdownstructure (PBS) is at the project core, not the WBS. The PBS refers to the products to be produced duringa plan, but containing just that: Products. The WBS on the other hand, involves the entire work thatneeds to be completed during a plan, containing just activities. Project managers need to plan thewhole project then by breaking down the products or outputs of the project first. Only then, they canbreak down the activities needed to produce those products.
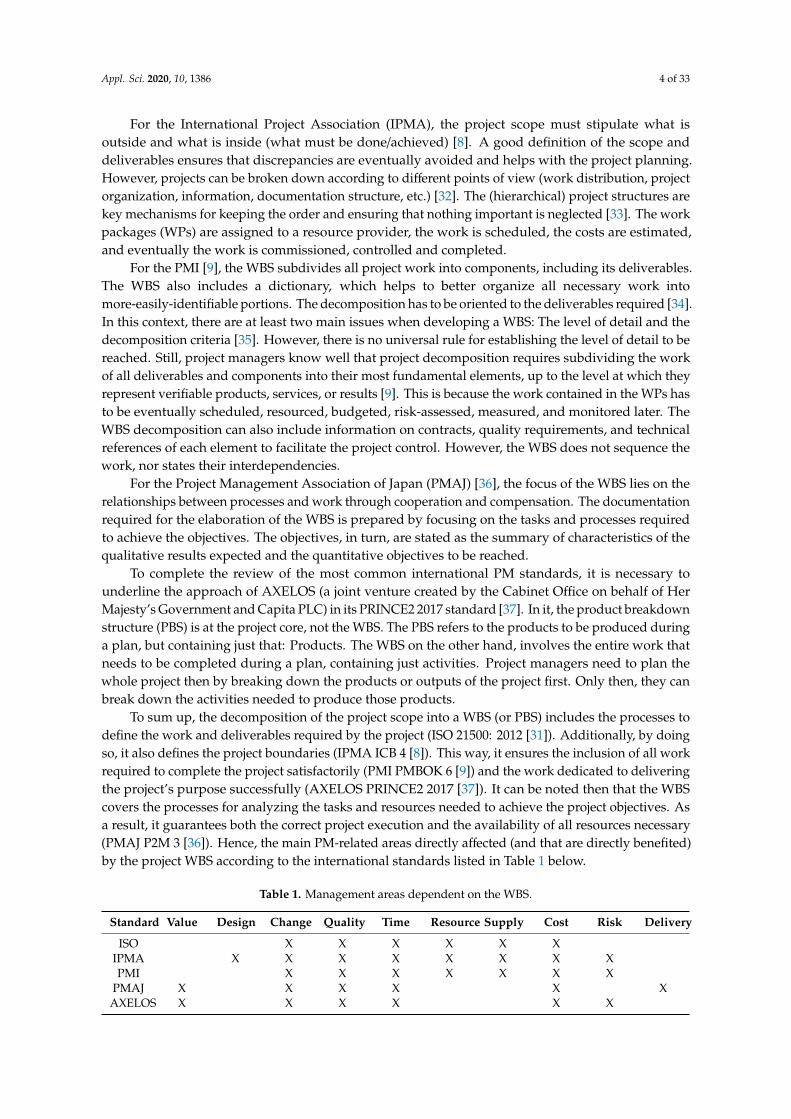
To sum up, the decomposition of the project scope into a WBS (or PBS) includes the processes todefine the work and deliverables required by the project (ISO 21500: 2012 [31]). Additionally, by doingso, it also defines the project boundaries (IPMA ICB 4 [8]). This way, it ensures the inclusion of all workrequired to complete the project satisfactorily (PMI PMBOK 6 [9]) and the work dedicated to deliveringthe project’s purpose successfully (AXELOS PRINCE2 2017 [37]). It can be noted then that the WBScovers the processes for analyzing the tasks and resources needed to achieve the project objectives. Asa result, it guarantees both the correct project execution and the availability of all resources necessary(PMAJ P2M 3 [36]). Hence, the main PM-related areas directly affected (and that are directly benefited)by the project WBS according to the international standards listed in Table 1 below.
Table 1. Management areas dependent on the WBS.
Standard Value Design Change Quality Time Resource Supply Cost Risk Delivery
ISO X X X X X XIPMA X X X X X X X XPMI X X X X X X X
PMAJ X X X X X XAXELOS X X X X X X

Appl. Sci. 2020, 10, 1386 5 of 33
2.1.2. WBS in the Construction Industry
Tracking is necessary at all project execution stages [17]. However, the approval andimplementation of changes at the planning stage of the project usually have a lower cost impact [38].Later, during the execution stage, the measurement of work in progress is one of the most pressingproblems for project managers [39]. In fact, accurate and up-to-date measurement of work in progressis essential for other PM functions such as schedule and cost control, financial reporting, changerequests, and legal claims [40]. It is in this context that the WBS can be used by contractors as anevaluation tool (especially in large projects) [41,42]. The specific choice when drafting this kind of WBSdepends mainly on three issues [43]:
1. The decomposition criteria, grouping activities into construction units assigned to the differentcontractors, and/or subcontractors involved in the execution of the project.
2. The degree of work complexity and level of detail that identifies the sequence and other relationsbetween the activities in a logical flow of execution.
3. The criticality of the tasks, being defined in terms of units of work, according to their importanceto avoid activity preemption.
Hence, there must be some logical pattern (decomposition criteria) in the way the activity tasksare subdivided [44]. For any significant project there usually is more than one correct way of breakingdown the project work (according to the physical parts of the project, organizational patterns or work,allocation by managers and supervisors, etc.) [45]. The use of adequate WBS templates may helpclients, contractors and consultants, particularly at the planning stage. More precisely, it can offerguidance to avoid important omissions at the conceptual and detail design and construction stages [46].Despite this, decomposition criteria will still vary across organizations and projects as they involvesome subjectivity [47]. In order to define consistent decomposition criteria, the considerations indicatedin Table 2 must be observed [43].
Table 2. Decomposition criteria to construction unit level.
Criterion: Comment
Global Vision: Integrate to simplify, prevent omissions, and allow globalanalysis of the deliverable
Strategy: Segregate to facilitate cross-referencing and save resourcesHomogeneity: Share measurement units and measurement approaches
Appraisal: Be executed by a single trade to be paid once completed
Equity: Make the investment profitable avoiding construction unitsthat are executed separately
Analysis: Meet aggregation criteria for cost analysisNormalization: Facilitate searches and comparisons
Regarding the level of detail of the decomposition, there is no uniform criterion either. Still,depending on the industry, organizational culture, and type of contract, a series of guidelines can beprovided. For example, for effective project planning and control, the WBS must reflect an appropriatelevel of detail, reflecting the extent of decomposition and the sizing of the WPs [16]. This level ofdecomposition must be balanced with the administrative burden costs of managing them [48]. Someorganizations also have general guidelines to make it easy to identify this optimum level of detail(emerging as one of main purposes of their PM offices). These are typically expressed in terms of effortor elapsed time, but do not usually consider the activities’ specific aims [49]. Some researchers havealso proposed alternative approaches, such as breaking down the project into 40-h work elements [50](a person’s work week), with no need to break it down further. Others have established that it ispointless to decompose the project elements once they represent less than 4% of the total project intime or cost [51].
Appl. Sci. 2020, 10, 1386 6 of 33
As a general rule in construction projects, seven criteria can be considered to stop furthersubdivision of project tasks [52]:
1. Organizational unit’s fixed responsibility.2. Clear deliverable.3. Exact scope of work.4. Reliable schedule estimation.5. Specific risk resolution.6. Reliable cost estimation.7. Specific organizational guideline.
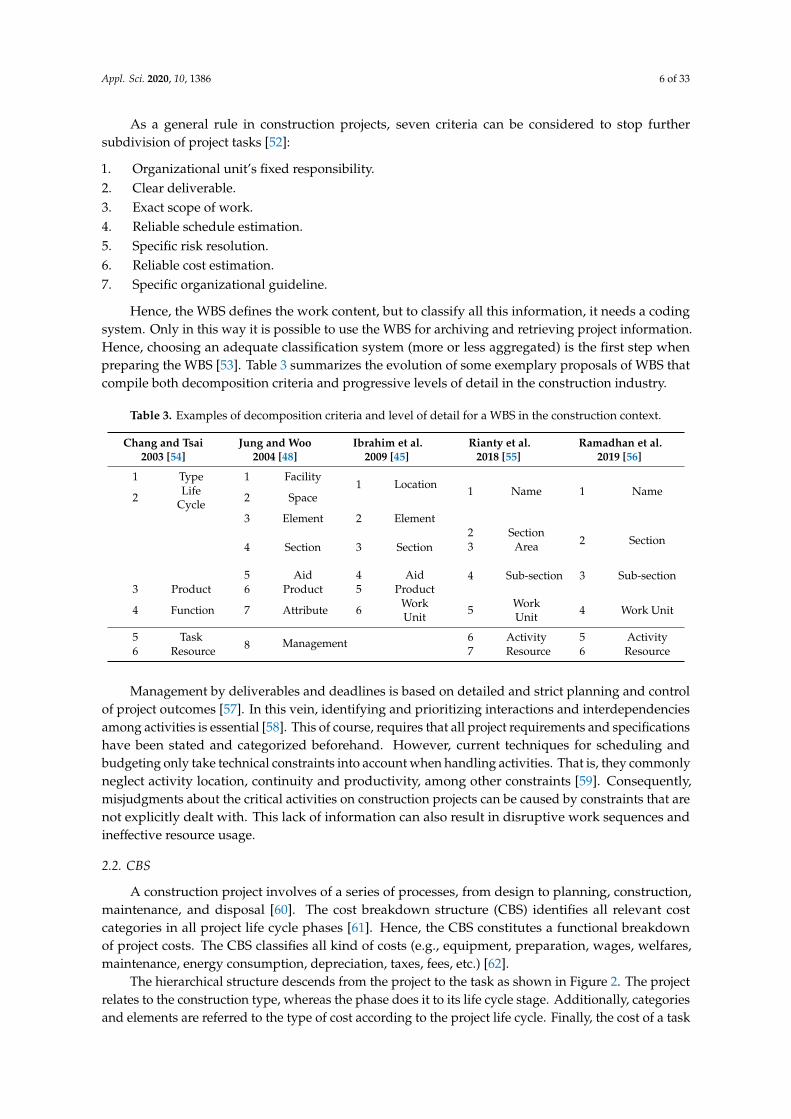
Hence, the WBS defines the work content, but to classify all this information, it needs a codingsystem. Only in this way it is possible to use the WBS for archiving and retrieving project information.Hence, choosing an adequate classification system (more or less aggregated) is the first step whenpreparing the WBS [53]. Table 3 summarizes the evolution of some exemplary proposals of WBS thatcompile both decomposition criteria and progressive levels of detail in the construction industry.
Table 3. Examples of decomposition criteria and level of detail for a WBS in the construction context.
Chang and Tsai2003 [54]
Jung and Woo2004 [48]
Ibrahim et al.2009 [45]
Rianty et al.2018 [55]
Ramadhan et al.2019 [56]
1 Type 1 Facility1 Location
1 Name 1 Name2 LifeCycle 2 Space
3 Element 2 Element
4 Section 3 Section2 Section
2 Section3 Area
4 Sub-section 3 Sub-section5 Aid 4 Aid3 Product 6 Product 5 Product
4 Function 7 Attribute 6 WorkUnit 5 Work
Unit 4 Work Unit
5 Task8 Management 6 Activity 5 Activity
6 Resource 7 Resource 6 Resource
Management by deliverables and deadlines is based on detailed and strict planning and controlof project outcomes [57]. In this vein, identifying and prioritizing interactions and interdependenciesamong activities is essential [58]. This of course, requires that all project requirements and specificationshave been stated and categorized beforehand. However, current techniques for scheduling andbudgeting only take technical constraints into account when handling activities. That is, they commonlyneglect activity location, continuity and productivity, among other constraints [59]. Consequently,misjudgments about the critical activities on construction projects can be caused by constraints that arenot explicitly dealt with. This lack of information can also result in disruptive work sequences andineffective resource usage.
2.2. CBS
A construction project involves of a series of processes, from design to planning, construction,maintenance, and disposal [60]. The cost breakdown structure (CBS) identifies all relevant costcategories in all project life cycle phases [61]. Hence, the CBS constitutes a functional breakdownof project costs. The CBS classifies all kind of costs (e.g., equipment, preparation, wages, welfares,maintenance, energy consumption, depreciation, taxes, fees, etc.) [62].
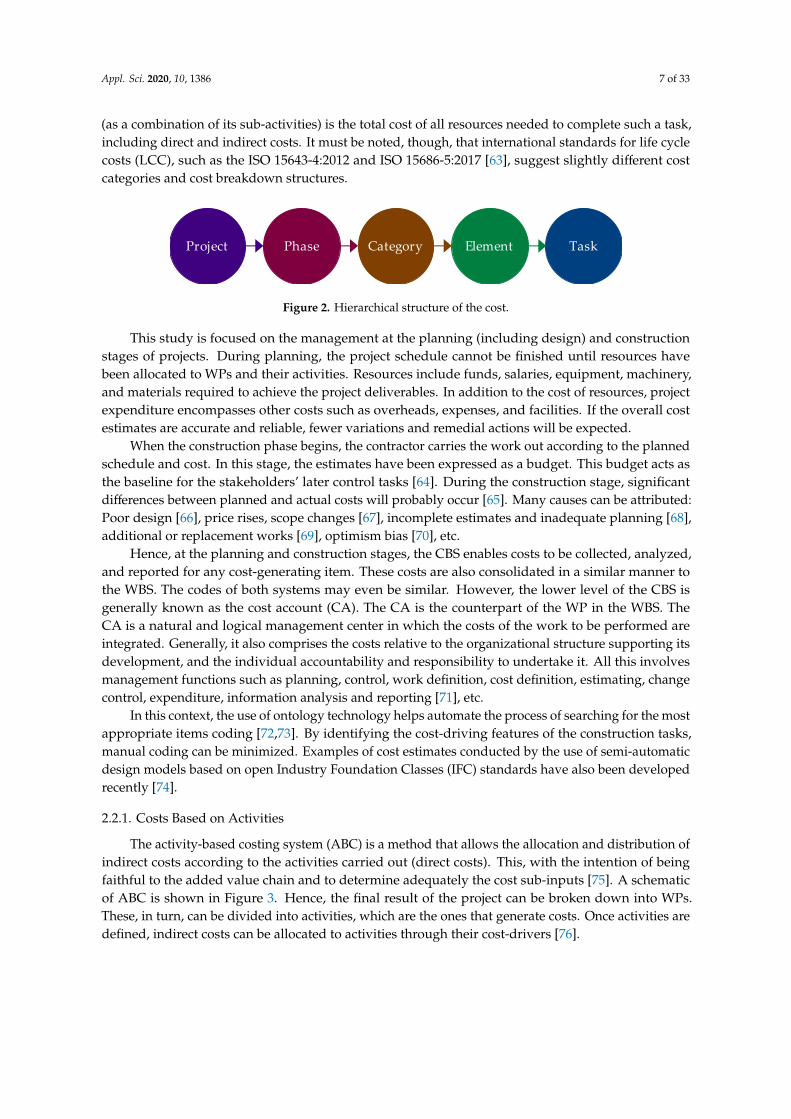
The hierarchical structure descends from the project to the task as shown in Figure 2. The projectrelates to the construction type, whereas the phase does it to its life cycle stage. Additionally, categoriesand elements are referred to the type of cost according to the project life cycle. Finally, the cost of a task
Appl. Sci. 2020, 10, 1386 7 of 33
(as a combination of its sub-activities) is the total cost of all resources needed to complete such a task,including direct and indirect costs. It must be noted, though, that international standards for life cyclecosts (LCC), such as the ISO 15643-4:2012 and ISO 15686-5:2017 [63], suggest slightly different costcategories and cost breakdown structures.Appl. Sci. 2020, 10, x FOR PEER REVIEW 7 of 32
Figure 2. Hierarchical structure of the cost.
This study is focused on the management at the planning (including design) and construction stages of projects. During planning, the project schedule cannot be finished until resources have been allocated to WPs and their activities. Resources include funds, salaries, equipment, machinery, and materials required to achieve the project deliverables. In addition to the cost of resources, project expenditure encompasses other costs such as overheads, expenses, and facilities. If the overall cost estimates are accurate and reliable, fewer variations and remedial actions will be expected.
When the construction phase begins, the contractor carries the work out according to the planned schedule and cost. In this stage, the estimates have been expressed as a budget. This budget acts as the baseline for the stakeholders’ later control tasks [64]. During the construction stage, significant differences between planned and actual costs will probably occur [65]. Many causes can be attributed: Poor design [66], price rises, scope changes [67], incomplete estimates and inadequate planning [68], additional or replacement works [69], optimism bias [70], etc.
Hence, at the planning and construction stages, the CBS enables costs to be collected, analyzed, and reported for any cost-generating item. These costs are also consolidated in a similar manner to the WBS. The codes of both systems may even be similar. However, the lower level of the CBS is generally known as the cost account (CA). The CA is the counterpart of the WP in the WBS. The CA is a natural and logical management center in which the costs of the work to be performed are integrated. Generally, it also comprises the costs relative to the organizational structure supporting its development, and the individual accountability and responsibility to undertake it. All this involves management functions such as planning, control, work definition, cost definition, estimating, change control, expenditure, information analysis and reporting [71], etc.
In this context, the use of ontology technology helps automate the process of searching for the most appropriate items coding [72,73]. By identifying the cost-driving features of the construction tasks, manual coding can be minimized. Examples of cost estimates conducted by the use of semi-automatic design models based on open Industry Foundation Classes (IFC) standards have also been developed recently [74].
2.2.1. Costs Based on Activities
The activity-based costing system (ABC) is a method that allows the allocation and distribution of indirect costs according to the activities carried out (direct costs). This, with the intention of being faithful to the added value chain and to determine adequately the cost sub-inputs [75]. A schematic of ABC is shown in Figure 3. Hence, the final result of the project can be broken down into WPs. These, in turn, can be divided into activities, which are the ones that generate costs. Once activities are defined, indirect costs can be allocated to activities through their cost-drivers [76].
Figure 3. Activity-based costing in the construction industry.
A variant to the ABC system is the time-driven activity-based costing (TDABC) system [77]. TDABC arises as a simpler, yet more precise and applicable model, that uses time as a cost driver. Once activities are defined, their durations must be estimated (thanks to their resource usage) and we can derive their cost-driver rates [76].
TaskElementCategoryPhaseProject
Activity ProductCost Work to be doneWBS
Cost for doingCBS
Figure 2. Hierarchical structure of the cost.
This study is focused on the management at the planning (including design) and constructionstages of projects. During planning, the project schedule cannot be finished until resources havebeen allocated to WPs and their activities. Resources include funds, salaries, equipment, machinery,and materials required to achieve the project deliverables. In addition to the cost of resources, projectexpenditure encompasses other costs such as overheads, expenses, and facilities. If the overall costestimates are accurate and reliable, fewer variations and remedial actions will be expected.
When the construction phase begins, the contractor carries the work out according to the plannedschedule and cost. In this stage, the estimates have been expressed as a budget. This budget acts asthe baseline for the stakeholders’ later control tasks [64]. During the construction stage, significantdifferences between planned and actual costs will probably occur [65]. Many causes can be attributed:Poor design [66], price rises, scope changes [67], incomplete estimates and inadequate planning [68],additional or replacement works [69], optimism bias [70], etc.
Hence, at the planning and construction stages, the CBS enables costs to be collected, analyzed,and reported for any cost-generating item. These costs are also consolidated in a similar manner tothe WBS. The codes of both systems may even be similar. However, the lower level of the CBS isgenerally known as the cost account (CA). The CA is the counterpart of the WP in the WBS. TheCA is a natural and logical management center in which the costs of the work to be performed areintegrated. Generally, it also comprises the costs relative to the organizational structure supporting itsdevelopment, and the individual accountability and responsibility to undertake it. All this involvesmanagement functions such as planning, control, work definition, cost definition, estimating, changecontrol, expenditure, information analysis and reporting [71], etc.
In this context, the use of ontology technology helps automate the process of searching for the mostappropriate items coding [72,73]. By identifying the cost-driving features of the construction tasks,manual coding can be minimized. Examples of cost estimates conducted by the use of semi-automaticdesign models based on open Industry Foundation Classes (IFC) standards have also been developedrecently [74].
2.2.1. Costs Based on Activities
The activity-based costing system (ABC) is a method that allows the allocation and distribution ofindirect costs according to the activities carried out (direct costs). This, with the intention of beingfaithful to the added value chain and to determine adequately the cost sub-inputs [75]. A schematicof ABC is shown in Figure 3. Hence, the final result of the project can be broken down into WPs.These, in turn, can be divided into activities, which are the ones that generate costs. Once activities aredefined, indirect costs can be allocated to activities through their cost-drivers [76].

Appl. Sci. 2020, 10, 1386 8 of 33
Appl. Sci. 2020, 10, x FOR PEER REVIEW 7 of 32
Figure 2. Hierarchical structure of the cost.
This study is focused on the management at the planning (including design) and construction stages of projects. During planning, the project schedule cannot be finished until resources have been allocated to WPs and their activities. Resources include funds, salaries, equipment, machinery, and materials required to achieve the project deliverables. In addition to the cost of resources, project expenditure encompasses other costs such as overheads, expenses, and facilities. If the overall cost estimates are accurate and reliable, fewer variations and remedial actions will be expected.
When the construction phase begins, the contractor carries the work out according to the planned schedule and cost. In this stage, the estimates have been expressed as a budget. This budget acts as the baseline for the stakeholders’ later control tasks [64]. During the construction stage, significant differences between planned and actual costs will probably occur [65]. Many causes can be attributed: Poor design [66], price rises, scope changes [67], incomplete estimates and inadequate planning [68], additional or replacement works [69], optimism bias [70], etc.
Hence, at the planning and construction stages, the CBS enables costs to be collected, analyzed, and reported for any cost-generating item. These costs are also consolidated in a similar manner to the WBS. The codes of both systems may even be similar. However, the lower level of the CBS is generally known as the cost account (CA). The CA is the counterpart of the WP in the WBS. The CA is a natural and logical management center in which the costs of the work to be performed are integrated. Generally, it also comprises the costs relative to the organizational structure supporting its development, and the individual accountability and responsibility to undertake it. All this involves management functions such as planning, control, work definition, cost definition, estimating, change control, expenditure, information analysis and reporting [71], etc.
In this context, the use of ontology technology helps automate the process of searching for the most appropriate items coding [72,73]. By identifying the cost-driving features of the construction tasks, manual coding can be minimized. Examples of cost estimates conducted by the use of semi-automatic design models based on open Industry Foundation Classes (IFC) standards have also been developed recently [74].
2.2.1. Costs Based on Activities
The activity-based costing system (ABC) is a method that allows the allocation and distribution of indirect costs according to the activities carried out (direct costs). This, with the intention of being faithful to the added value chain and to determine adequately the cost sub-inputs [75]. A schematic of ABC is shown in Figure 3. Hence, the final result of the project can be broken down into WPs. These, in turn, can be divided into activities, which are the ones that generate costs. Once activities are defined, indirect costs can be allocated to activities through their cost-drivers [76].
Figure 3. Activity-based costing in the construction industry.
A variant to the ABC system is the time-driven activity-based costing (TDABC) system [77]. TDABC arises as a simpler, yet more precise and applicable model, that uses time as a cost driver. Once activities are defined, their durations must be estimated (thanks to their resource usage) and we can derive their cost-driver rates [76].
TaskElementCategoryPhaseProject
Activity ProductCost Work to be doneWBS
Cost for doingCBS
Figure 3. Activity-based costing in the construction industry.
A variant to the ABC system is the time-driven activity-based costing (TDABC) system [77].TDABC arises as a simpler, yet more precise and applicable model, that uses time as a cost driver. Onceactivities are defined, their durations must be estimated (thanks to their resource usage) and we canderive their cost-driver rates [76].
In the context of Spain where this research has been developed, there is no standard form forcontract in construction projects. Most contracts between clients (public and private) and contractors arebased on quantity survey models. In quantity survey contracts, contractors assume all future variationof unit prices, but not variations in the bill of quantities due to the design defects or events that couldnot be planned. Other international contracts, such as FIDIC [78], are also used in Spain, but only wheninternational financing is involved. The quantity survey contract then reduces contractors’ uncertaintyand allows them to become more competitive by adjusting their mark-ups [79]. Additionally, from theclients’ point of view, it is very important that all activities are included and that they are well defined,both in terms of scope and quality [80].
Furthermore, in Spanish projects and public tenders, unit prices are taken from a seriesof construction price databases [81–83]. Most Spanish regions have their own price databases(e.g., Andalusia [84], Catalonia [85], Extremadura [86], Madrid [87], etc.). These prices are generallybinding when used in a project. In the private sector, there are also companies that have their ownconstruction price databases (e.g., Arquimedes by CYPE [88], Premeti by PREOC [89], Menfis byPROSOFT [90], etc.). The vast majority of all these public and private price databases are broken downin five progressive levels, as shown in Figure 4.
Appl. Sci. 2020, 10, x FOR PEER REVIEW 8 of 32
In the context of Spain where this research has been developed, there is no standard form for contract in construction projects. Most contracts between clients (public and private) and contractors are based on quantity survey models. In quantity survey contracts, contractors assume all future variation of unit prices, but not variations in the bill of quantities due to the design defects or events that could not be planned. Other international contracts, such as FIDIC [78], are also used in Spain, but only when international financing is involved. The quantity survey contract then reduces contractors’ uncertainty and allows them to become more competitive by adjusting their mark-ups [79]. Additionally, from the clients' point of view, it is very important that all activities are included and that they are well defined, both in terms of scope and quality [80].
Furthermore, in Spanish projects and public tenders, unit prices are taken from a series of construction price databases [81–83]. Most Spanish regions have their own price databases (e.g., Andalusia [84], Catalonia [85], Extremadura [86], Madrid [87], etc.). These prices are generally binding when used in a project. In the private sector, there are also companies that have their own construction price databases (e.g., Arquimedes by CYPE [88], Premeti by PREOC [89], Menfis by PROSOFT [90], etc.). The vast majority of all these public and private price databases are broken down in five progressive levels, as shown in Figure 4.
Figure 4. Hierarchical structure of Spanish construction price databases.
2.2.2. Coding Systems in the Construction Industry
A coding system is a methodology based on relationships and affinities that promotes organization and standardization. Coding systems allow terms homogenization, but also the adoption of common methods and concepts. They must have these three properties [91]:
• Consistency (single classification principle). • Mutual exclusivity of categories. • Exhaustiveness.
Identifying the criteria to be applied in the decomposition of WBS is the first challenge [13]. The International Organisation for Standardisation (ISO) identified eight possible classification criteria of construction information [92]: Space, element, work section, construction product, construction aid, attributes, and management. However, other authors have suggested to separate construction and engineering works [93]. Namely, the latter proposed a construction information classification system on the one hand (based on facility, space, element, operation, and resource criteria), and an engineering information classification system on the other hand (this based on construction type, life cycle, product or service, function, tasks, and man-hour attributes criteria) [54].
Hence, it soon became apparent that these deeply rooted national approaches would make the adoption of an international standard difficult. In this situation, a compromised agreement was necessary. A framework for classification tables was suggested that would at least make communication easy between the classification tables that different national organizations were using. This could spur them on to establish tables using the same criteria. This is why in the second half of the 20th century, construction organizations from different countries began to develop other classification and coding systems [93]. A good example was the European classification standard Code of Measurement for Cost Planning (CMCP) [94]. This standard is observed in Europe. The CMCP was developed by the European Council of Construction Economists (CEEC), which encompasses the following countries: Belgium, the Czech Republic, Denmark, Estonia, Finland, France, Germany, Hungary, Ireland, the Netherlands, Poland, Portugal, Spain, Switzerland, and United Kingdom (UK).
Work UnitSubgroupGroupSubchapterChapter
Figure 4. Hierarchical structure of Spanish construction price databases.
2.2.2. Coding Systems in the Construction Industry
A coding system is a methodology based on relationships and affinities that promotes organizationand standardization. Coding systems allow terms homogenization, but also the adoption of commonmethods and concepts. They must have these three properties [91]:
• Consistency (single classification principle).• Mutual exclusivity of categories.• Exhaustiveness.
Identifying the criteria to be applied in the decomposition of WBS is the first challenge [13]. TheInternational Organisation for Standardisation (ISO) identified eight possible classification criteria ofconstruction information [92]: Space, element, work section, construction product, construction aid,attributes, and management. However, other authors have suggested to separate construction andengineering works [93]. Namely, the latter proposed a construction information classification systemon the one hand (based on facility, space, element, operation, and resource criteria), and an engineeringinformation classification system on the other hand (this based on construction type, life cycle, productor service, function, tasks, and man-hour attributes criteria) [54].
Appl. Sci. 2020, 10, 1386 9 of 33
Hence, it soon became apparent that these deeply rooted national approaches would makethe adoption of an international standard difficult. In this situation, a compromised agreement wasnecessary. A framework for classification tables was suggested that would at least make communicationeasy between the classification tables that different national organizations were using. This couldspur them on to establish tables using the same criteria. This is why in the second half of the 20thcentury, construction organizations from different countries began to develop other classification andcoding systems [93]. A good example was the European classification standard Code of Measurementfor Cost Planning (CMCP) [94]. This standard is observed in Europe. The CMCP was developedby the European Council of Construction Economists (CEEC), which encompasses the followingcountries: Belgium, the Czech Republic, Denmark, Estonia, Finland, France, Germany, Hungary,Ireland, the Netherlands, Poland, Portugal, Spain, Switzerland, and United Kingdom (UK).
The European system is based on the classification and coding of the German standard DIN276-1 [95] and, to a lesser extent, on the standards from other countries (BSAB from Sweden [96],UniClass from the UK, Australia and New Zealand [97], TALO from Finland, Estonia and Russia [98],and DBK from Denmark [99], etc.). The CMCP, and its successor ICMS [100], arise from harmonizingworking methods and exchange of information among construction projects. This is achieved bysharing a standard set of measurement rules and essential guidance on cost management. Accordingto the CEEC [101], the creation of a WBS for construction projects consists of these six stages:
1. Identify the final result (or deliverable) to achieve the objectives.2. Review the scope to ensure consistency between requirements and the WBS elements.3. Define the chapters (first level of decomposition) in a way that facilitates the understanding by
dividing them into clearly differentiated blocks.4. Continue to break down each chapter to an appropriate level of detail.5. Break down the chapters to the final level of detail (construction unit), where both the cost and
the schedule are reliable, allowing efficient project monitoring and control.6. Review and refine the WBS until main stakeholders agree on the planning and execution.
There have been other coding system initiatives. In United States (USA) and Canada,the Construction Specifications Institute (CSI) [102] created standards such as Masterformat [103]and Uniformat [104]. Masterformat keeps a material-based organization and Uniformat keeps asystems-based organization. As a result of the combination of these two systems, the Omniclassstandard emerged [105]. With them, the CSI facilitates information management and sharing in theconstruction industry. This is also eventually aimed at improving construction projets performance.
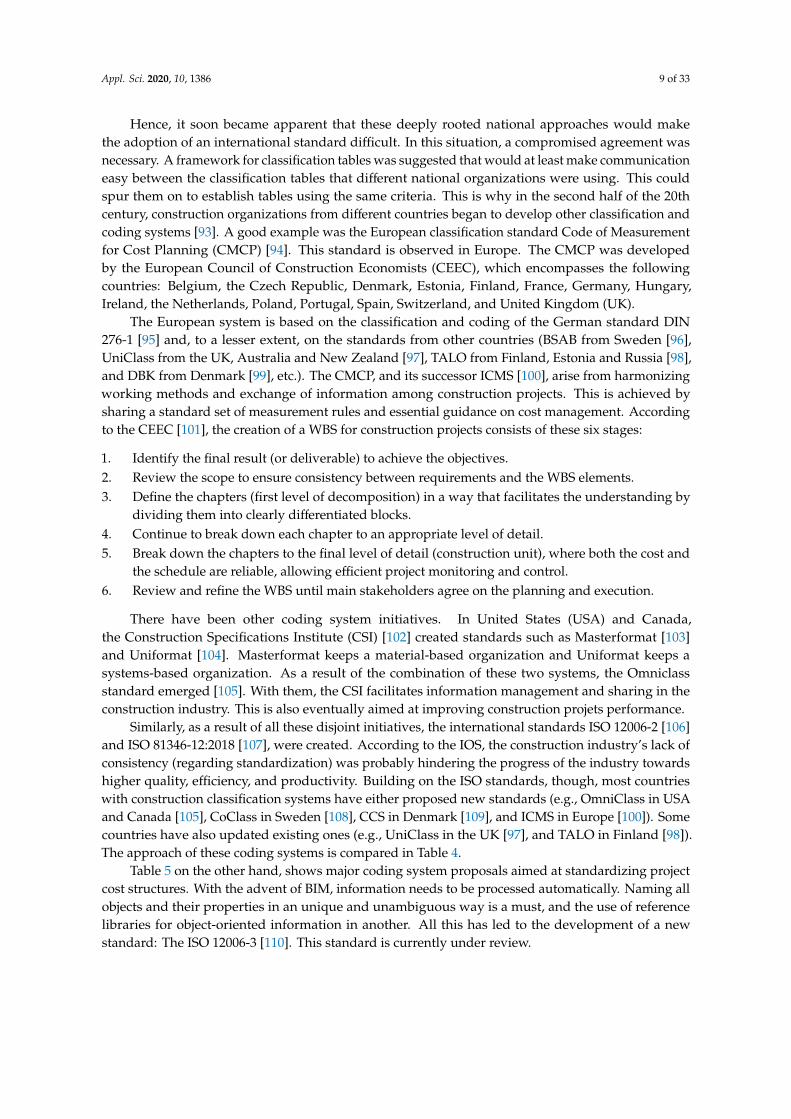
Similarly, as a result of all these disjoint initiatives, the international standards ISO 12006-2 [106]and ISO 81346-12:2018 [107], were created. According to the IOS, the construction industry’s lack ofconsistency (regarding standardization) was probably hindering the progress of the industry towardshigher quality, efficiency, and productivity. Building on the ISO standards, though, most countrieswith construction classification systems have either proposed new standards (e.g., OmniClass in USAand Canada [105], CoClass in Sweden [108], CCS in Denmark [109], and ICMS in Europe [100]). Somecountries have also updated existing ones (e.g., UniClass in the UK [97], and TALO in Finland [98]).The approach of these coding systems is compared in Table 4.
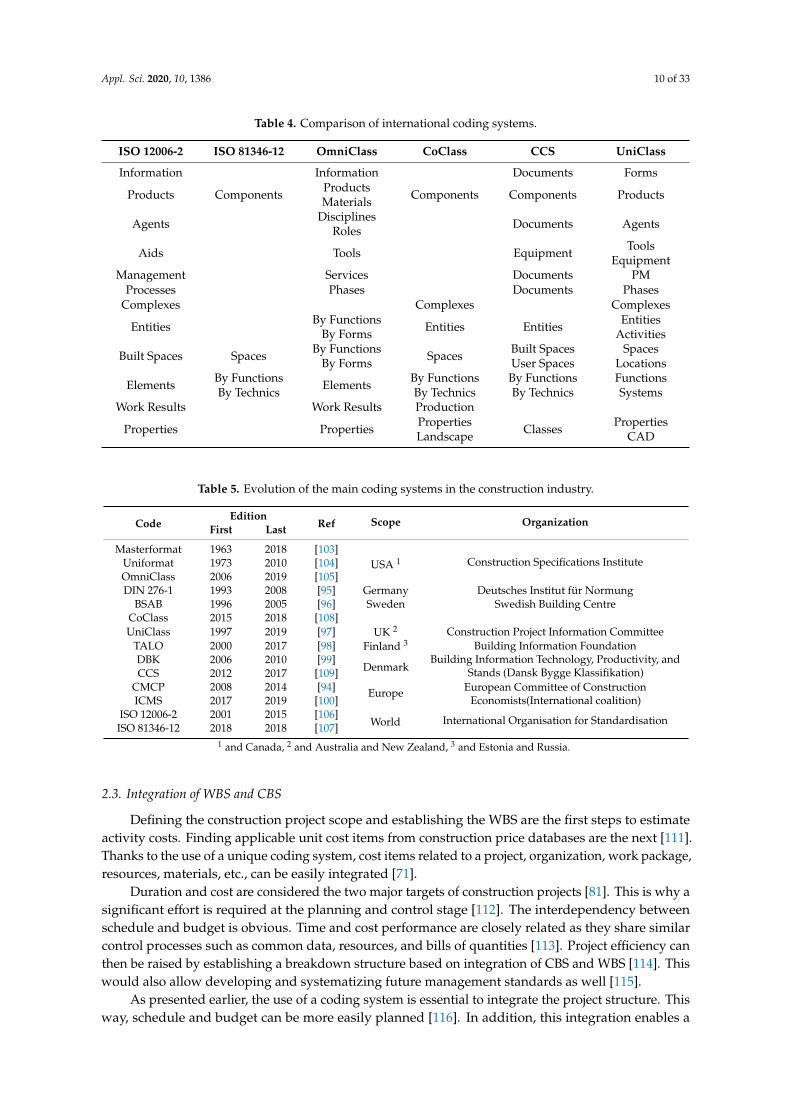
Table 5 on the other hand, shows major coding system proposals aimed at standardizing projectcost structures. With the advent of BIM, information needs to be processed automatically. Naming allobjects and their properties in an unique and unambiguous way is a must, and the use of referencelibraries for object-oriented information in another. All this has led to the development of a newstandard: The ISO 12006-3 [110]. This standard is currently under review.
Appl. Sci. 2020, 10, 1386 10 of 33
Table 4. Comparison of international coding systems.
ISO 12006-2 ISO 81346-12 OmniClass CoClass CCS UniClass
Information Information Documents Forms
Products Components ProductsMaterials Components Components Products
Agents DisciplinesRoles Documents Agents
Aids Tools Equipment ToolsEquipment
Management Services Documents PMProcesses Phases Documents Phases
Complexes Complexes Complexes
Entities By FunctionsBy Forms Entities Entities Entities
Activities
Built Spaces Spaces By FunctionsBy Forms Spaces Built Spaces
User SpacesSpaces
Locations
Elements By FunctionsBy Technics Elements By Functions
By TechnicsBy FunctionsBy Technics
FunctionsSystems
Work Results Work Results Production
Properties Properties PropertiesLandscape Classes Properties
CAD
Table 5. Evolution of the main coding systems in the construction industry.
CodeEdition
Ref Scope OrganizationFirst Last
Masterformat 1963 2018 [103]USA 1 Construction Specifications InstituteUniformat 1973 2010 [104]
OmniClass 2006 2019 [105]DIN 276-1 1993 2008 [95] Germany Deutsches Institut für Normung
BSAB 1996 2005 [96] Sweden Swedish Building CentreCoClass 2015 2018 [108]UniClass 1997 2019 [97] UK 2 Construction Project Information Committee
TALO 2000 2017 [98] Finland 3 Building Information FoundationDBK 2006 2010 [99]
DenmarkBuilding Information Technology, Productivity, and
Stands (Dansk Bygge Klassifikation)CCS 2012 2017 [109]CMCP 2008 2014 [94] Europe European Committee of Construction
Economists(International coalition)ICMS 2017 2019 [100]ISO 12006-2 2001 2015 [106]
World International Organisation for StandardisationISO 81346-12 2018 2018 [107]
1 and Canada, 2 and Australia and New Zealand, 3 and Estonia and Russia.
2.3. Integration of WBS and CBS
Defining the construction project scope and establishing the WBS are the first steps to estimateactivity costs. Finding applicable unit cost items from construction price databases are the next [111].Thanks to the use of a unique coding system, cost items related to a project, organization, work package,resources, materials, etc., can be easily integrated [71].
Duration and cost are considered the two major targets of construction projects [81]. This is why asignificant effort is required at the planning and control stage [112]. The interdependency betweenschedule and budget is obvious. Time and cost performance are closely related as they share similarcontrol processes such as common data, resources, and bills of quantities [113]. Project efficiency canthen be raised by establishing a breakdown structure based on integration of CBS and WBS [114]. Thiswould also allow developing and systematizing future management standards as well [115].
As presented earlier, the use of a coding system is essential to integrate the project structure. Thisway, schedule and budget can be more easily planned [116]. In addition, this integration enables a
Appl. Sci. 2020, 10, 1386 11 of 33
better definition of the attributes of all project entities, and it also ensures consistency [117]. A needfor a tighter control has also been claimed for thirty years (e.g., [35,118,119]). The integration ofthe CBS and WBS, for example, could allow building a matrix that mapped activities progress andlocation of each project element (WP- and CA-based). In fact, most existing integration models aim tomanage projects by measuring the progress rate during the execution stage. This, to check if they areprogressing according to planned schedules and costs [120]. This could also be promoted thanks to theintegration of CBS databases and WBS-based entities.
2.4. BIM in the Construction Industry
The implementation of BIM allows managing the construction project information (and itsdocumentation) from the design phase to its maintenance and operation [121]. BIM has demonstratedits potential in several environments, such as facility management (FM) [122], lean management(LM) [123], and more recently in the railway industry [124]. The first reason is that BIM systems containenriched information. This facilitates the exchange and interoperability of information making itcapable of supporting multiple types of analysis, including PM analyses (e.g., scope, quality, schedule,cost, and risk) [111]. Thanks to the growing popularity of BIM, data automation (at least regardingacquisition and processing) is guaranteeing a more reliable, accurate, and precise scope definition andcost estimation. These aspects enable wider collaboration and more active participation of projectstakeholders in all stages [11].
In this context, where there is more available and reliable, but confidential, information, the wholeconstruction process must be standardized. This can be done introducing a WBS in the BIM model [125].The WBS has proven to be an excellent tool for the prevention and control of cost overruns, delays, andrisk triggering [126], especially in combination with PM software [127]. Indeed, many BIM-based toolshave been developed for construction scheduling and cost estimating [111], although most of themfocus on product and element level [128].
BIM-based WBSs have occasionally been introduced in construction (for example prototyping alinkage between the CBS and the WBS [125]). However, these have mostly focused on the product(the infrastructure or building) neglecting the management dimension. The integration of the CBSand the WBS must take into account this double dimension (the result and the necessary work tomaterialize it) [114]. However, the process classification system and the cost classification system mustbe assembled into BIM models. This means dimensional activities must be aligned to cost statementsaccording to the combination of both WBS and CBS classification systems simultaneously. Fortunately,the object-oriented approach of modeling building information facilitates the standardization ofdifferent WBS databases [16].
BIM offers the best automatic approach to generate accurate and direct quantity measurementsfrom virtual models [129]. Management information such as progress, cost, safety, and quality isintegrated via 3D models providing useful information for project managers [130]. Additionally, BIMadds many other engineering information database capabilities, such as storing architectural designswith geometric and technical information.
However, a critical issue in current 3D BIM models is the discrepancy between the elementbreakdown structure (EBS) and the WBS of the project schedule. Integrating construction recordsinto BIM remains a challenge due to their heterogeneous and unstructured data formats [131]. In fact,at the construction stage, a large number of construction reports are generated (e.g., schedule andcost reports, construction methods, site photos, shop drawings, change orders, etc.), but these are notproperly integrated in the current as-built project documentation.
3. Methodology
The investigation of critical success factors in the construction industry has been a source of ideasfor the organizations to address their challenges [132]. The analysis of critical success factors has alsobeen a source to improve the efficiency of the companies’ work processes [133]. This research will allow
Appl. Sci. 2020, 10, 1386 12 of 33
companies to increase their competitiveness [134] by facilitating that the stakeholders’ expectationsare more easily meet [135]. As described earlier, the first step of the planning stage of a constructionproject consists of managing the scope [136], establishing objectives, setting boundaries, specifyingdeliverables, and ensuring the understanding of staff roles [137]. This way, organizations that undertakeconstruction projects list the necessary specifications, requirements, restrictions, and exclusions [138].Eventually, they disaggregate the work to achieve the project objectives [139], monitor the process [140],and validate the deliverables [141].
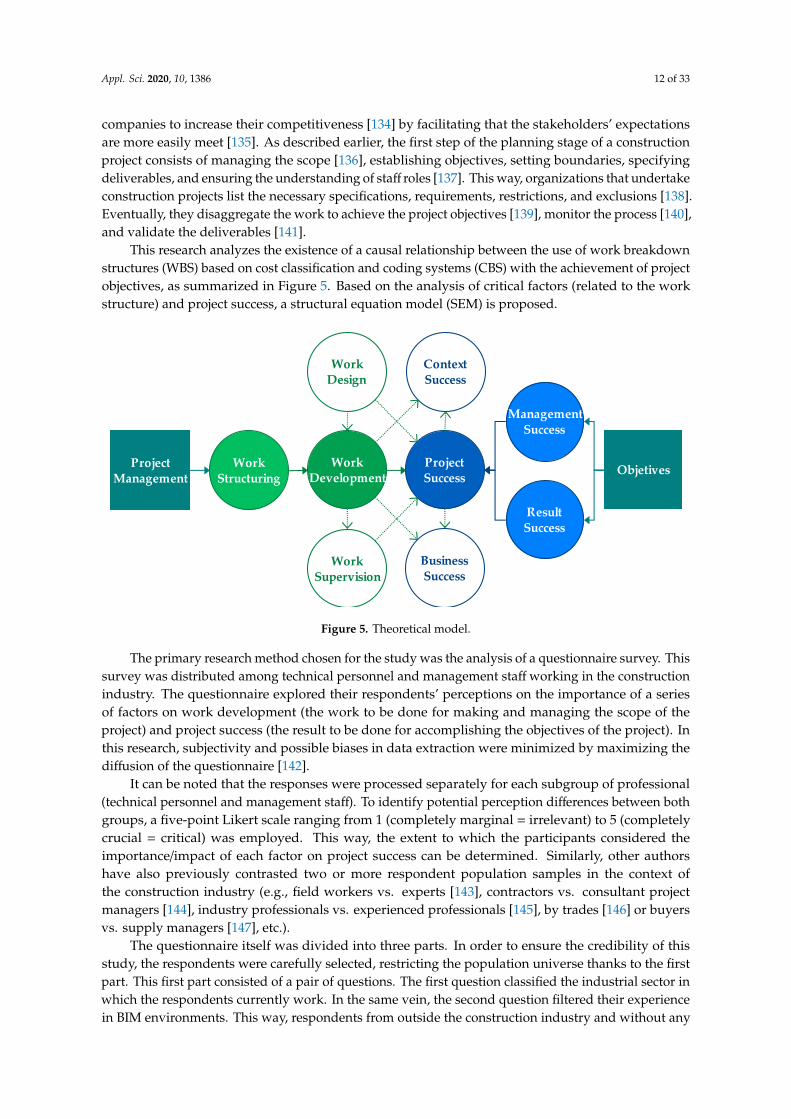
This research analyzes the existence of a causal relationship between the use of work breakdownstructures (WBS) based on cost classification and coding systems (CBS) with the achievement of projectobjectives, as summarized in Figure 5. Based on the analysis of critical factors (related to the workstructure) and project success, a structural equation model (SEM) is proposed.Appl. Sci. 2020, 10, x FOR PEER REVIEW 12 of 32
Figure 5. Theoretical model.
The primary research method chosen for the study was the analysis of a questionnaire survey. This survey was distributed among technical personnel and management staff working in the construction industry. The questionnaire explored their respondents’ perceptions on the importance of a series of factors on work development (the work to be done for making and managing the scope of the project) and project success (the result to be done for accomplishing the objectives of the project). In this research, subjectivity and possible biases in data extraction were minimized by maximizing the diffusion of the questionnaire [142].
It can be noted that the responses were processed separately for each subgroup of professional (technical personnel and management staff). To identify potential perception differences between both groups, a five-point Likert scale ranging from 1 (completely marginal = irrelevant) to 5 (completely crucial = critical) was employed. This way, the extent to which the participants considered the importance/impact of each factor on project success can be determined. Similarly, other authors have also previously contrasted two or more respondent population samples in the context of the construction industry (e.g., field workers vs. experts [143], contractors vs. consultant project managers [144], industry professionals vs. experienced professionals [145], by trades [146] or buyers vs. supply managers [147], etc.).
The questionnaire itself was divided into three parts. In order to ensure the credibility of this study, the respondents were carefully selected, restricting the population universe thanks to the first part. This first part consisted of a pair of questions. The first question classified the industrial sector in which the respondents currently work. In the same vein, the second question filtered their experience in BIM environments. This way, respondents from outside the construction industry and without any experience in the design, development, and/or management of BIM projects could be ruled out from this piece of research.
The second and third parts develop the main purpose of the research. The second part of the questionnaire included the demographics in order to classify the respondents (age, company size in which they provide their services, and average cost and duration of the projects in which they usually work). A second section of this part of the demographics set of questions allowed us to discriminate whether the respondents were technicians or managers.
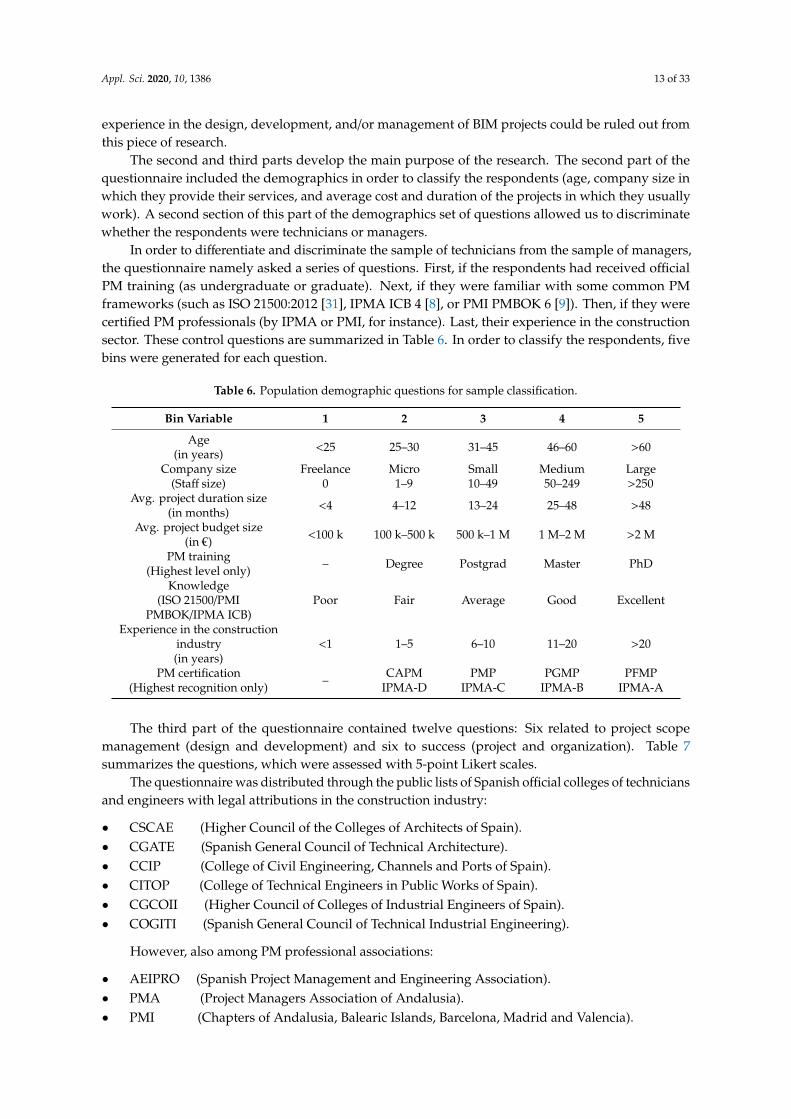
In order to differentiate and discriminate the sample of technicians from the sample of managers, the questionnaire namely asked a series of questions. First, if the respondents had received official PM training (as undergraduate or graduate). Next, if they were familiar with some common PM frameworks (such as ISO 21500:2012 [31], IPMA ICB 4 [8], or PMI PMBOK 6 [9]). Then, if they were certified PM professionals (by IPMA or PMI, for instance). Last, their experience in the construction sector. These control questions are summarized in Table 6. In order to classify the respondents, five bins were generated for each question.
WorkStructuring
WorkDevelopment
ProjectSuccess
ResultSuccess
ManagementSuccess
ProjectManagement
Objetives
WorkDesign
WorkSupervision
ContextSuccess
BusinessSuccess
Figure 5. Theoretical model.
The primary research method chosen for the study was the analysis of a questionnaire survey. Thissurvey was distributed among technical personnel and management staff working in the constructionindustry. The questionnaire explored their respondents’ perceptions on the importance of a seriesof factors on work development (the work to be done for making and managing the scope of theproject) and project success (the result to be done for accomplishing the objectives of the project). Inthis research, subjectivity and possible biases in data extraction were minimized by maximizing thediffusion of the questionnaire [142].
It can be noted that the responses were processed separately for each subgroup of professional(technical personnel and management staff). To identify potential perception differences between bothgroups, a five-point Likert scale ranging from 1 (completely marginal = irrelevant) to 5 (completelycrucial = critical) was employed. This way, the extent to which the participants considered theimportance/impact of each factor on project success can be determined. Similarly, other authorshave also previously contrasted two or more respondent population samples in the context ofthe construction industry (e.g., field workers vs. experts [143], contractors vs. consultant projectmanagers [144], industry professionals vs. experienced professionals [145], by trades [146] or buyersvs. supply managers [147], etc.).
The questionnaire itself was divided into three parts. In order to ensure the credibility of thisstudy, the respondents were carefully selected, restricting the population universe thanks to the firstpart. This first part consisted of a pair of questions. The first question classified the industrial sector inwhich the respondents currently work. In the same vein, the second question filtered their experiencein BIM environments. This way, respondents from outside the construction industry and without any
Appl. Sci. 2020, 10, 1386 13 of 33
experience in the design, development, and/or management of BIM projects could be ruled out fromthis piece of research.
The second and third parts develop the main purpose of the research. The second part of thequestionnaire included the demographics in order to classify the respondents (age, company size inwhich they provide their services, and average cost and duration of the projects in which they usuallywork). A second section of this part of the demographics set of questions allowed us to discriminatewhether the respondents were technicians or managers.
In order to differentiate and discriminate the sample of technicians from the sample of managers,the questionnaire namely asked a series of questions. First, if the respondents had received officialPM training (as undergraduate or graduate). Next, if they were familiar with some common PMframeworks (such as ISO 21500:2012 [31], IPMA ICB 4 [8], or PMI PMBOK 6 [9]). Then, if they werecertified PM professionals (by IPMA or PMI, for instance). Last, their experience in the constructionsector. These control questions are summarized in Table 6. In order to classify the respondents, fivebins were generated for each question.
Table 6. Population demographic questions for sample classification.
Bin Variable 1 2 3 4 5
Age(in years) <25 25–30 31–45 46–60 >60
Company size(Staff size)
Freelance0
Micro1–9
Small10–49
Medium50–249
Large>250
Avg. project duration size(in months) <4 4–12 13–24 25–48 >48
Avg. project budget size(in €) <100 k 100 k–500 k 500 k–1 M 1 M–2 M >2 M
PM training(Highest level only) – Degree Postgrad Master PhD
Knowledge(ISO 21500/PMI
PMBOK/IPMA ICB)Poor Fair Average Good Excellent
Experience in the constructionindustry(in years)
<1 1–5 6–10 11–20 >20
PM certification(Highest recognition only) – CAPM
IPMA-DPMP
IPMA-CPGMP
IPMA-BPFMP
IPMA-A
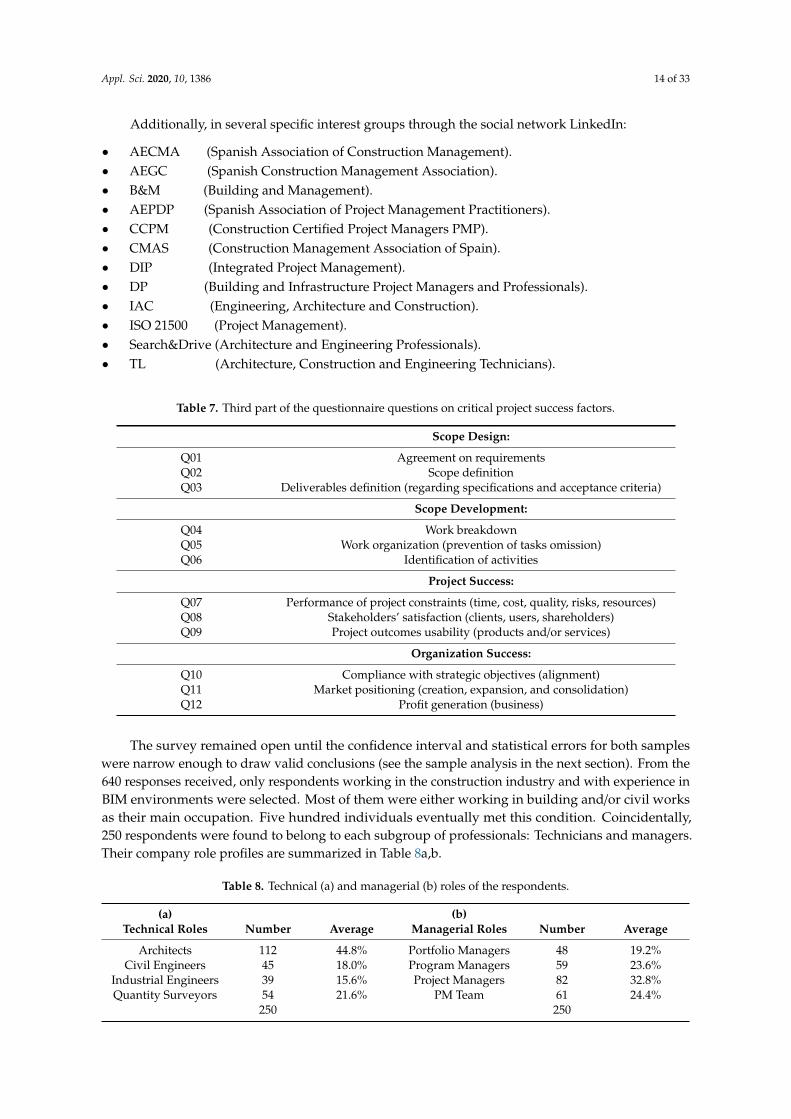
The third part of the questionnaire contained twelve questions: Six related to project scopemanagement (design and development) and six to success (project and organization). Table 7summarizes the questions, which were assessed with 5-point Likert scales.
The questionnaire was distributed through the public lists of Spanish official colleges of techniciansand engineers with legal attributions in the construction industry:
• CSCAE (Higher Council of the Colleges of Architects of Spain).• CGATE (Spanish General Council of Technical Architecture).• CCIP (College of Civil Engineering, Channels and Ports of Spain).• CITOP (College of Technical Engineers in Public Works of Spain).• CGCOII (Higher Council of Colleges of Industrial Engineers of Spain).• COGITI (Spanish General Council of Technical Industrial Engineering).
However, also among PM professional associations:
• AEIPRO (Spanish Project Management and Engineering Association).• PMA (Project Managers Association of Andalusia).• PMI (Chapters of Andalusia, Balearic Islands, Barcelona, Madrid and Valencia).
Appl. Sci. 2020, 10, 1386 14 of 33
Additionally, in several specific interest groups through the social network LinkedIn:
• AECMA (Spanish Association of Construction Management).• AEGC (Spanish Construction Management Association).• B&M (Building and Management).• AEPDP (Spanish Association of Project Management Practitioners).• CCPM (Construction Certified Project Managers PMP).• CMAS (Construction Management Association of Spain).• DIP (Integrated Project Management).• DP (Building and Infrastructure Project Managers and Professionals).• IAC (Engineering, Architecture and Construction).• ISO 21500 (Project Management).• Search&Drive (Architecture and Engineering Professionals).• TL (Architecture, Construction and Engineering Technicians).
Table 7. Third part of the questionnaire questions on critical project success factors.
Scope Design:
Q01 Agreement on requirementsQ02 Scope definitionQ03 Deliverables definition (regarding specifications and acceptance criteria)
Scope Development:
Q04 Work breakdownQ05 Work organization (prevention of tasks omission)Q06 Identification of activities
Project Success:
Q07 Performance of project constraints (time, cost, quality, risks, resources)Q08 Stakeholders’ satisfaction (clients, users, shareholders)Q09 Project outcomes usability (products and/or services)
Organization Success:
Q10 Compliance with strategic objectives (alignment)Q11 Market positioning (creation, expansion, and consolidation)Q12 Profit generation (business)
The survey remained open until the confidence interval and statistical errors for both sampleswere narrow enough to draw valid conclusions (see the sample analysis in the next section). From the640 responses received, only respondents working in the construction industry and with experience inBIM environments were selected. Most of them were either working in building and/or civil worksas their main occupation. Five hundred individuals eventually met this condition. Coincidentally,250 respondents were found to belong to each subgroup of professionals: Technicians and managers.Their company role profiles are summarized in Table 8a,b.
Table 8. Technical (a) and managerial (b) roles of the respondents.
(a) (b)Technical Roles Number Average Managerial Roles Number Average
Architects 112 44.8% Portfolio Managers 48 19.2%Civil Engineers 45 18.0% Program Managers 59 23.6%
Industrial Engineers 39 15.6% Project Managers 82 32.8%Quantity Surveyors 54 21.6% PM Team 61 24.4%
250 250
Appl. Sci. 2020, 10, 1386 15 of 33
4. Results
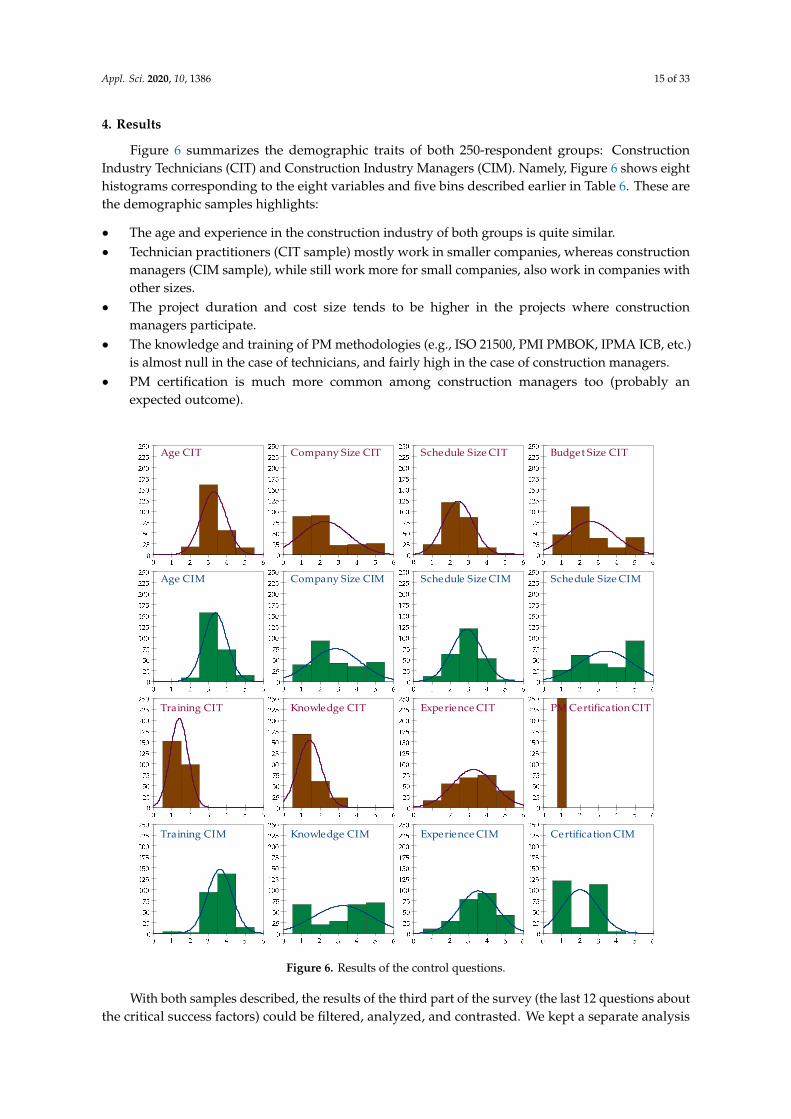
Figure 6 summarizes the demographic traits of both 250-respondent groups: ConstructionIndustry Technicians (CIT) and Construction Industry Managers (CIM). Namely, Figure 6 shows eighthistograms corresponding to the eight variables and five bins described earlier in Table 6. These arethe demographic samples highlights:
• The age and experience in the construction industry of both groups is quite similar.• Technician practitioners (CIT sample) mostly work in smaller companies, whereas construction
managers (CIM sample), while still work more for small companies, also work in companies withother sizes.
• The project duration and cost size tends to be higher in the projects where constructionmanagers participate.
• The knowledge and training of PM methodologies (e.g., ISO 21500, PMI PMBOK, IPMA ICB, etc.)is almost null in the case of technicians, and fairly high in the case of construction managers.
• PM certification is much more common among construction managers too (probably anexpected outcome).
Appl. Sci. 2020, 10, x FOR PEER REVIEW 15 of 32
Figure 6. Results of the control questions.
With both samples described, the results of the third part of the survey (the last 12 questions about the critical success factors) could be filtered, analyzed, and contrasted. We kept a separate analysis of this part of the questionnaire by sample group to observe whether each group had a significantly different perception regarding the importance of each critical success factor.
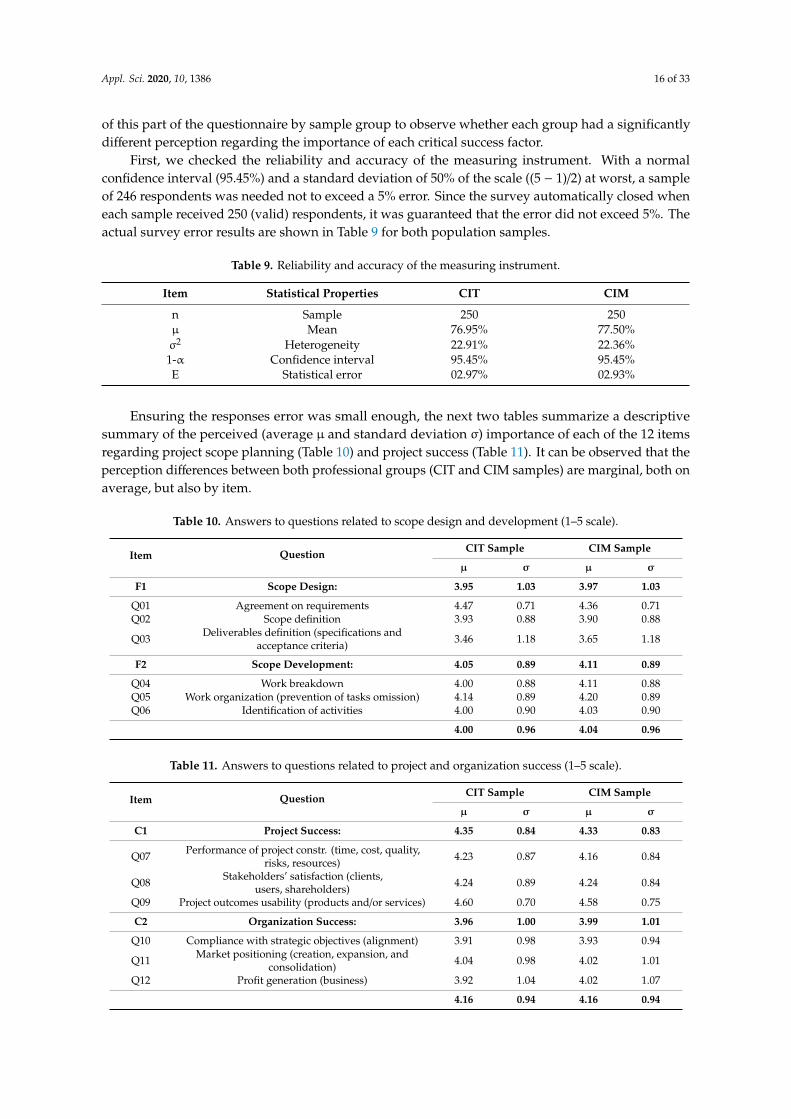
First, we checked the reliability and accuracy of the measuring instrument. With a normal confidence interval (95.45%) and a standard deviation of 50% of the scale ((5 − 1)/2) at worst, a sample of 246 respondents was needed not to exceed a 5% error. Since the survey automatically closed when each sample received 250 (valid) respondents, it was guaranteed that the error did not exceed 5%. The actual survey error results are shown in Table 9 for both population samples.
Table 9. Reliability and accuracy of the measuring instrument.
Item Statistical Properties CIT CIM n Sample 250 250 μ Mean 76.95% 77.50% σ2 Heterogeneity 22.91% 22.36%
1-α Confidence interval 95.45% 95.45% E Statistical error 02.97% 02.93%
Age CIM
Age CIT
Company Size CIM
Company Size CIT
Schedule Size CIM
Schedule Size CIT
Schedule Size CIM
Budget Size CIT
Training CIM
Training CIT
Knowledge CIM
Knowledge CIT
Experience CIM
Experience CIT
Certification CIM
PM Certification CIT
Figure 6. Results of the control questions.
With both samples described, the results of the third part of the survey (the last 12 questions aboutthe critical success factors) could be filtered, analyzed, and contrasted. We kept a separate analysis
Appl. Sci. 2020, 10, 1386 16 of 33
of this part of the questionnaire by sample group to observe whether each group had a significantlydifferent perception regarding the importance of each critical success factor.
First, we checked the reliability and accuracy of the measuring instrument. With a normalconfidence interval (95.45%) and a standard deviation of 50% of the scale ((5 − 1)/2) at worst, a sampleof 246 respondents was needed not to exceed a 5% error. Since the survey automatically closed wheneach sample received 250 (valid) respondents, it was guaranteed that the error did not exceed 5%. Theactual survey error results are shown in Table 9 for both population samples.
Table 9. Reliability and accuracy of the measuring instrument.
Item Statistical Properties CIT CIM
n Sample 250 250µ Mean 76.95% 77.50%σ2 Heterogeneity 22.91% 22.36%1-α Confidence interval 95.45% 95.45%E Statistical error 02.97% 02.93%
Ensuring the responses error was small enough, the next two tables summarize a descriptivesummary of the perceived (average µ and standard deviation σ) importance of each of the 12 itemsregarding project scope planning (Table 10) and project success (Table 11). It can be observed that theperception differences between both professional groups (CIT and CIM samples) are marginal, both onaverage, but also by item.
Table 10. Answers to questions related to scope design and development (1–5 scale).
Item Question CIT Sample CIM Sample
µ σ µ σ
F1 Scope Design: 3.95 1.03 3.97 1.03
Q01 Agreement on requirements 4.47 0.71 4.36 0.71Q02 Scope definition 3.93 0.88 3.90 0.88
Q03 Deliverables definition (specifications andacceptance criteria) 3.46 1.18 3.65 1.18
F2 Scope Development: 4.05 0.89 4.11 0.89
Q04 Work breakdown 4.00 0.88 4.11 0.88Q05 Work organization (prevention of tasks omission) 4.14 0.89 4.20 0.89Q06 Identification of activities 4.00 0.90 4.03 0.90
4.00 0.96 4.04 0.96
Table 11. Answers to questions related to project and organization success (1–5 scale).
Item Question CIT Sample CIM Sample
µ σ µ σ
C1 Project Success: 4.35 0.84 4.33 0.83
Q07 Performance of project constr. (time, cost, quality,risks, resources) 4.23 0.87 4.16 0.84
Q08 Stakeholders’ satisfaction (clients,users, shareholders) 4.24 0.89 4.24 0.84
Q09 Project outcomes usability (products and/or services) 4.60 0.70 4.58 0.75
C2 Organization Success: 3.96 1.00 3.99 1.01
Q10 Compliance with strategic objectives (alignment) 3.91 0.98 3.93 0.94
Q11 Market positioning (creation, expansion, andconsolidation) 4.04 0.98 4.02 1.01
Q12 Profit generation (business) 3.92 1.04 4.02 1.07
4.16 0.94 4.16 0.94
Appl. Sci. 2020, 10, 1386 17 of 33
4.1. Hypotheses
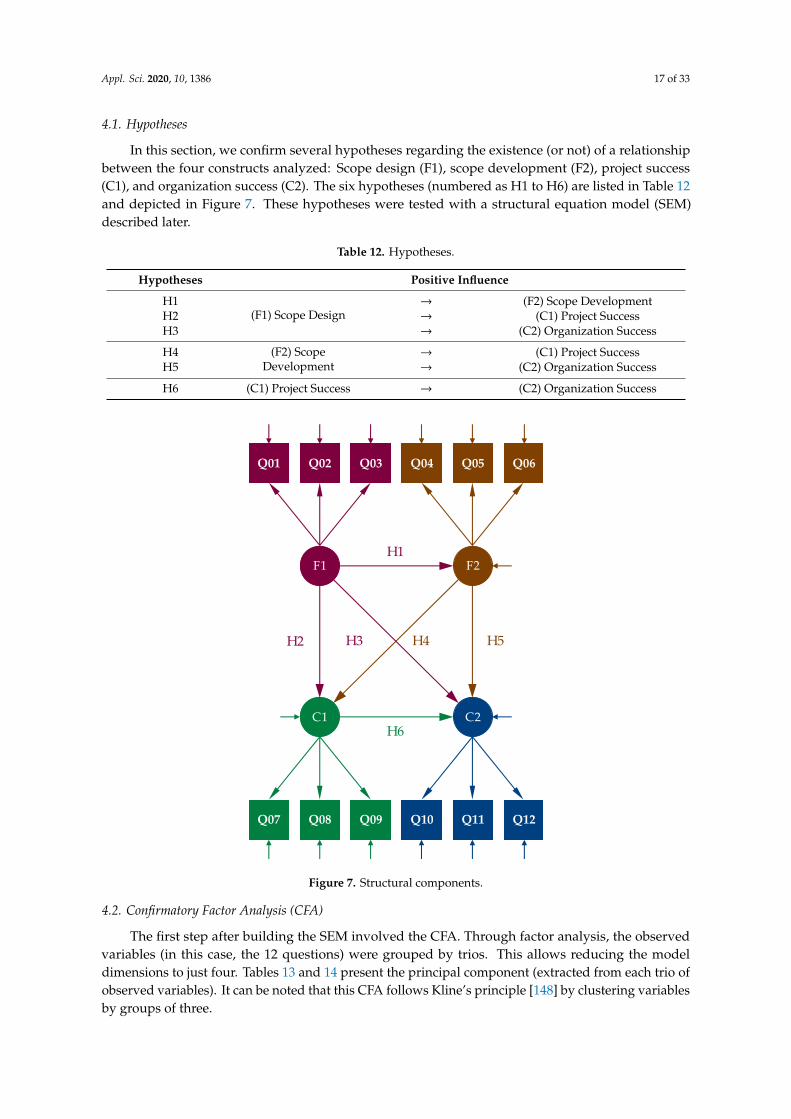
In this section, we confirm several hypotheses regarding the existence (or not) of a relationshipbetween the four constructs analyzed: Scope design (F1), scope development (F2), project success(C1), and organization success (C2). The six hypotheses (numbered as H1 to H6) are listed in Table 12and depicted in Figure 7. These hypotheses were tested with a structural equation model (SEM)described later.
Table 12. Hypotheses.
Hypotheses Positive Influence
H1(F1) Scope Design
→ (F2) Scope DevelopmentH2 → (C1) Project SuccessH3 → (C2) Organization Success
H4 (F2) ScopeDevelopment
→ (C1) Project SuccessH5 → (C2) Organization Success
H6 (C1) Project Success → (C2) Organization SuccessAppl. Sci. 2020, 10, x FOR PEER REVIEW 17 of 32
Figure 7. Structural components.
4.2. Confirmatory Factor Analysis (CFA)
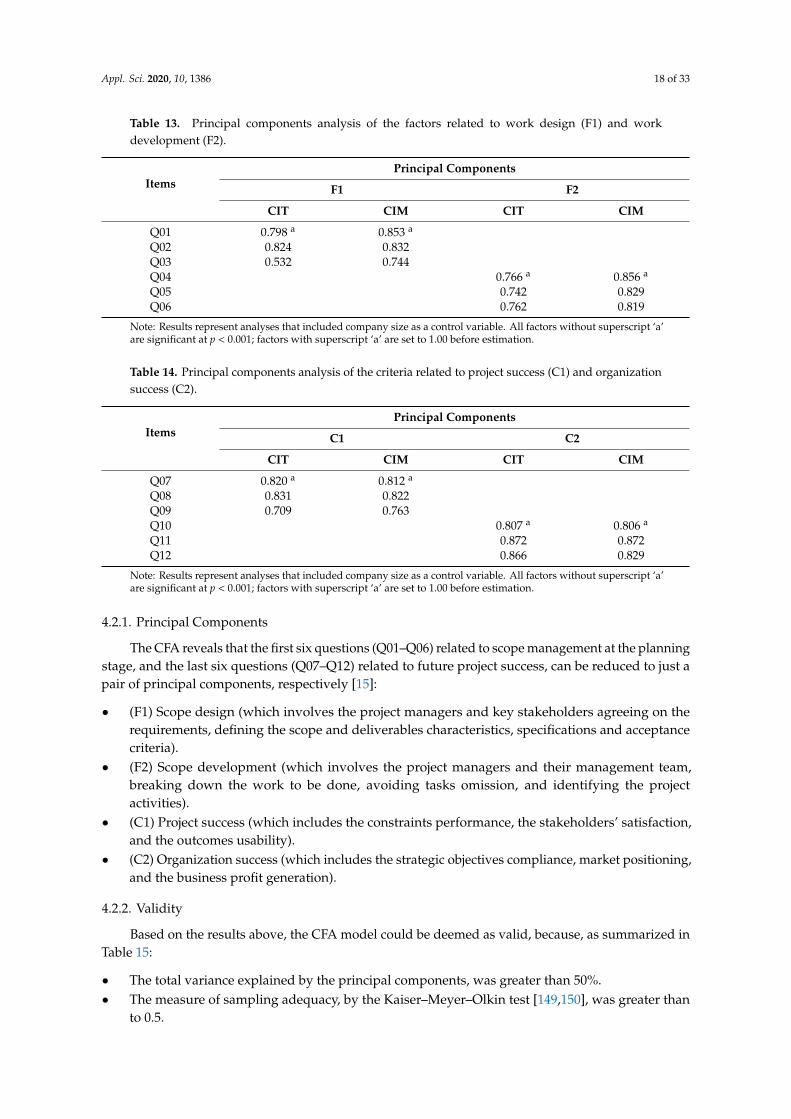
The first step after building the SEM involved the CFA. Through factor analysis, the observed variables (in this case, the 12 questions) were grouped by trios. This allows reducing the model dimensions to just four. Tables 13 and 14 present the principal component (extracted from each trio of observed variables). It can be noted that this CFA follows Kline’s principle [148] by clustering variables by groups of three.
Table 13. Principal components analysis of the factors related to work design (F1) and work development (F2).
Items Principal Components
F1 F2 CIT CIM CIT CIM
Q01 0.798 a 0.853 a Q02 0.824 0.832 Q03 0.532 0.744 Q04 0.766 a 0.856 a Q05 0.742 0.829 Q06 0.762 0.819
Note: Results represent analyses that included company size as a control variable. All factors without superscript ‘a’ are significant at p < 0.001; factors with superscript ‘a’ are set to 1.00 before estimation.
Q07 Q08 Q09
C1
Q12Q11Q10
C2
Q01 Q02 Q03
F1
Q06Q05Q04
F2H1
H2 H3 H4 H5
H6
Figure 7. Structural components.
4.2. Confirmatory Factor Analysis (CFA)
The first step after building the SEM involved the CFA. Through factor analysis, the observedvariables (in this case, the 12 questions) were grouped by trios. This allows reducing the modeldimensions to just four. Tables 13 and 14 present the principal component (extracted from each trio ofobserved variables). It can be noted that this CFA follows Kline’s principle [148] by clustering variablesby groups of three.
Appl. Sci. 2020, 10, 1386 18 of 33
Table 13. Principal components analysis of the factors related to work design (F1) and workdevelopment (F2).
ItemsPrincipal Components
F1 F2
CIT CIM CIT CIM
Q01 0.798 a 0.853 a
Q02 0.824 0.832Q03 0.532 0.744Q04 0.766 a 0.856 a
Q05 0.742 0.829Q06 0.762 0.819
Note: Results represent analyses that included company size as a control variable. All factors without superscript ‘a’are significant at p < 0.001; factors with superscript ‘a’ are set to 1.00 before estimation.
Table 14. Principal components analysis of the criteria related to project success (C1) and organizationsuccess (C2).
ItemsPrincipal Components
C1 C2
CIT CIM CIT CIM
Q07 0.820 a 0.812 a
Q08 0.831 0.822Q09 0.709 0.763Q10 0.807 a 0.806 a
Q11 0.872 0.872Q12 0.866 0.829
Note: Results represent analyses that included company size as a control variable. All factors without superscript ‘a’are significant at p < 0.001; factors with superscript ‘a’ are set to 1.00 before estimation.
4.2.1. Principal Components
The CFA reveals that the first six questions (Q01–Q06) related to scope management at the planningstage, and the last six questions (Q07–Q12) related to future project success, can be reduced to just apair of principal components, respectively [15]:
• (F1) Scope design (which involves the project managers and key stakeholders agreeing on therequirements, defining the scope and deliverables characteristics, specifications and acceptancecriteria).
• (F2) Scope development (which involves the project managers and their management team,breaking down the work to be done, avoiding tasks omission, and identifying the projectactivities).
• (C1) Project success (which includes the constraints performance, the stakeholders’ satisfaction,and the outcomes usability).
• (C2) Organization success (which includes the strategic objectives compliance, market positioning,and the business profit generation).
4.2.2. Validity
Based on the results above, the CFA model could be deemed as valid, because, as summarized inTable 15:
• The total variance explained by the principal components, was greater than 50%.• The measure of sampling adequacy, by the Kaiser–Meyer–Olkin test [149,150], was greater than
to 0.5.

Appl. Sci. 2020, 10, 1386 19 of 33
• The model applicability, by the Bartlett’s sphericity test [151], discarded a lack of correlationbetween items, as it presented a high Chi-square and a significance lower than 5%.
Table 15. Validity of the model confirmatory factor analysis (CFA) results.
Questions Variance Explained KMO Test Bartlett Test
CIT CIM CIT CIM CIT CIM
Q01–Q06 82.51% 87.37% 0.771 0.868 283.81 (15,*) 557.51 (15,*)Q07–Q12 87.64% 87.12% 0.766 0.793 448.07 (15,*) 464.29 (15,*)
Note: * 15 degrees of freedom with a significance (p-value) below 0.001.
4.3. Structural Equation Model (SEM)
SEMs are widely used to explore and test causal relationships among latent variables by thecombination of factor analysis, multiple correlation, regression and path analysis [152]. Compared toother multivariate analysis methods, such as multidimensional scaling, multiple regression and neuralnetworks, SEM has the ability to [148,153]:
• Define a model explaining a complete set of (significant) relationships.• Uncover unobserved (indirect) relationships between variables.• Estimate multiple and interrelated dependence relationships.• Consider measurement errors in the estimations.• Test the model where a structure can be imposed and assessed as to fit of the data.
However, before showing the effects, both direct and indirect, that confirm the hypothesesproposed in Table 12, it is necessary to check the model’s:
• Reliability:
By the Cronbach’s alpha and composite reliability.• Validity:
By the standardized regression weights and squared multiple correlations, as well as the averageextracted variance.
• Goodness of fit:
By absolute, incremental, and parsimonious fit measures.
4.3.1. Reliability
Cronbach’s alpha (Cα) value is used to test the consistency of the hypothesized constructs basedon the data [154]. Cα is inflated by a large number of variables, and there is no exact interpretation asto what constitutes an acceptable limit. However, a rule of thumb applies to most situations with thefollowing ranges [155,156]:
• Cα > 0.9 as excellent.• 0.9 > Cα > 0.8 as good.• 0.8 > Cα > 0.7 as acceptable.• 0.7 > Cα > 0.6 as questionable.• 0.6 > Cα > 0.5 as poor.• 0.5 > Cα as unacceptable.
Due to almost all Cα coefficients (including the six constructs and the overall model) were above0.7, the measurement of this study can be considered at least as acceptable, in terms of consistency of
Appl. Sci. 2020, 10, 1386 20 of 33
the measurement scale. However, although Cα coefficient is the most widely used estimator of thereliability of tests and scales, the composite reliability (CR) is also proposed as an alternative [157].The CR represents the ratio of the true score variance of a construct divided by its observed scorevariance. Values of CR above 0.9 are considered very good and above 0.7 as acceptable. As shown inTable 16, the items measured in the six constructs (and the overall model) were sufficiently consistentand reliable.
Table 16. Reliability tests of the questionnaire responses.
VariablesAll (12) F1 F2 C1 C2
CIT CIM CIT CIM CIT CIM CIT CIM CIT CIM
Cα 0.831 0.890 0.599 0.717 0.627 0.782 0.696 0.716 0.805 0.783CR 0.864 0.910 0.768 0.852 0.801 0.873 0.831 0.841 0.885 0.874
4.3.2. Validity
In addition, it is important to verify whether the measurement validity was acceptable. Statisticallysignificant standardized regression weights (SRWs) of 0.5 or higher indicate good validity, suggestingadequate convergence [156]. In the case of the squared multiple correlations (SMCs), also calledreliability coefficients, a significant value of 0.5 or higher indicates good validity too [158], as long as atleast half of its variance is predicted. Tables 17 and 18 present the SRW and the SMC values for eachobserved variable, both for the sample of technicians (CIT) and managers (CIM).
Table 17. Standardized regression weights (SRWs) and squared multiple correlations (SMCs) of thefactors related to the work design (F1) and work development (F2).
ItemsSRWs
SMCsF1 F2
CIT CIM CIT CIM CIT CIM
Q01 0.626 0.769 0.492 0.591Q02 0.642 0.708 0.512 0.602Q03 0.423 0.634 0.279 0.501Q04 0.613 0.762 0.476 0.581Q05 0.607 0.718 0.469 0.515Q06 0.575 0.737 0.431 0.544
Table 18. SRWs and SMCs of the criteria related to project success (C1) and organization success (C2).
ItemsSRWs
SMCsC1 C2
CIT CIM CIT CIM CIT CIM
Q07 0.726 0.711 0.527 0.603Q08 0.738 0.796 0.544 0.586Q09 0.525 0.722 0.275 0.506Q10 0.684 0.631 0.468 0.622Q11 0.781 0.697 0.611 0.734Q12 0.826 0.709 0.582 0.604
Furthermore, we resorted to Fornell and Larcker’s measure of average variance extracted (AVE) toapprove the validity of the constructs [159]. The AVE determines the amount of variance apprehendedby a construct through its factors relative to the amount of variance as a result of the measurementerror. Significant values of AVE above 0.7 are considered very good and 0.5 are deemed as acceptable.Therefore, there is acceptable validity in the measurement of this study as shown in Table 19.
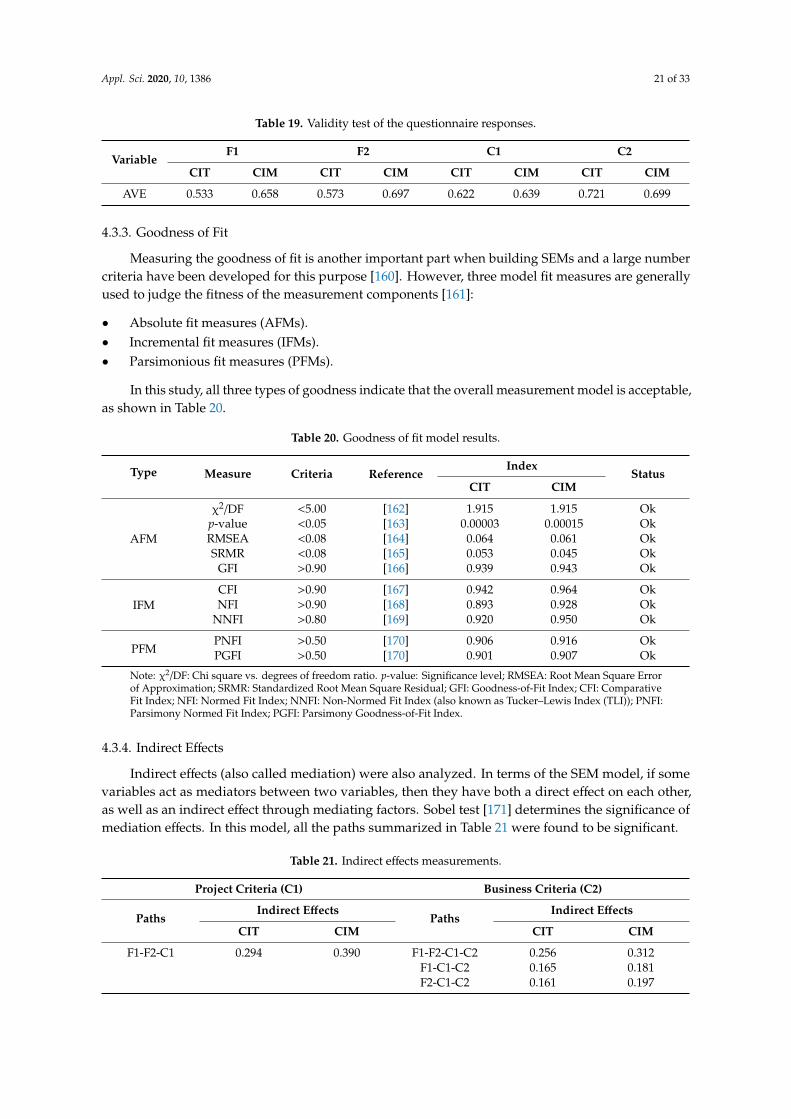
Appl. Sci. 2020, 10, 1386 21 of 33
Table 19. Validity test of the questionnaire responses.
VariableF1 F2 C1 C2
CIT CIM CIT CIM CIT CIM CIT CIM
AVE 0.533 0.658 0.573 0.697 0.622 0.639 0.721 0.699
4.3.3. Goodness of Fit
Measuring the goodness of fit is another important part when building SEMs and a large numbercriteria have been developed for this purpose [160]. However, three model fit measures are generallyused to judge the fitness of the measurement components [161]:
• Absolute fit measures (AFMs).• Incremental fit measures (IFMs).• Parsimonious fit measures (PFMs).
In this study, all three types of goodness indicate that the overall measurement model is acceptable,as shown in Table 20.
Table 20. Goodness of fit model results.
Type Measure Criteria ReferenceIndex
StatusCIT CIM
AFM
χ2/DF <5.00 [162] 1.915 1.915 Okp-value <0.05 [163] 0.00003 0.00015 OkRMSEA <0.08 [164] 0.064 0.061 OkSRMR <0.08 [165] 0.053 0.045 Ok
GFI >0.90 [166] 0.939 0.943 Ok
IFMCFI >0.90 [167] 0.942 0.964 OkNFI >0.90 [168] 0.893 0.928 Ok
NNFI >0.80 [169] 0.920 0.950 Ok
PFMPNFI >0.50 [170] 0.906 0.916 OkPGFI >0.50 [170] 0.901 0.907 Ok
Note: χ2/DF: Chi square vs. degrees of freedom ratio. p-value: Significance level; RMSEA: Root Mean Square Errorof Approximation; SRMR: Standardized Root Mean Square Residual; GFI: Goodness-of-Fit Index; CFI: ComparativeFit Index; NFI: Normed Fit Index; NNFI: Non-Normed Fit Index (also known as Tucker–Lewis Index (TLI)); PNFI:Parsimony Normed Fit Index; PGFI: Parsimony Goodness-of-Fit Index.
4.3.4. Indirect Effects
Indirect effects (also called mediation) were also analyzed. In terms of the SEM model, if somevariables act as mediators between two variables, then they have both a direct effect on each other,as well as an indirect effect through mediating factors. Sobel test [171] determines the significance ofmediation effects. In this model, all the paths summarized in Table 21 were found to be significant.
Table 21. Indirect effects measurements.
Project Criteria (C1) Business Criteria (C2)
PathsIndirect Effects
PathsIndirect Effects
CIT CIM CIT CIM
F1-F2-C1 0.294 0.390 F1-F2-C1-C2 0.256 0.312F1-C1-C2 0.165 0.181F2-C1-C2 0.161 0.197
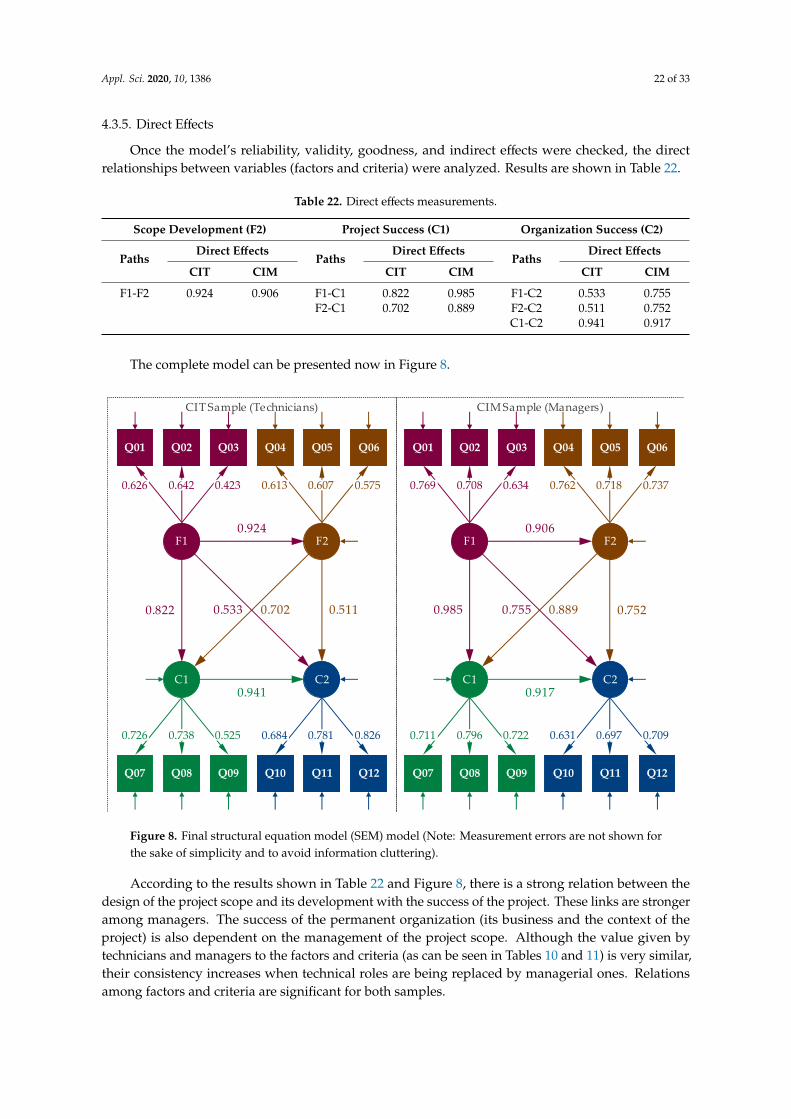
Appl. Sci. 2020, 10, 1386 22 of 33
4.3.5. Direct Effects
Once the model’s reliability, validity, goodness, and indirect effects were checked, the directrelationships between variables (factors and criteria) were analyzed. Results are shown in Table 22.
Table 22. Direct effects measurements.
Scope Development (F2) Project Success (C1) Organization Success (C2)
PathsDirect Effects
PathsDirect Effects
PathsDirect Effects
CIT CIM CIT CIM CIT CIM
F1-F2 0.924 0.906 F1-C1 0.822 0.985 F1-C2 0.533 0.755F2-C1 0.702 0.889 F2-C2 0.511 0.752
C1-C2 0.941 0.917
The complete model can be presented now in Figure 8.Appl. Sci. 2020, 10, x FOR PEER REVIEW 22 of 32
Figure 8. Final structural equation model (SEM) model.
Note: Measurement errors are not shown for the sake of simplicity and to avoid information cluttering.
According to the results shown in Table 22 and Figure 8, there is a strong relation between the design of the project scope and its development with the success of the project. These links are stronger among managers. The success of the permanent organization (its business and the context of the project) is also dependent on the management of the project scope. Although the value given by technicians and managers to the factors and criteria (as can be seen in Tables 10 and 11) is very similar, their consistency increases when technical roles are being replaced by managerial ones. Relations among factors and criteria are significant for both samples.
5. Discussion
In this study, the importance of project scope management has been endorsed, as it was in previous studies (e.g., [15,25,172]). However, we have emphasized that scope management is not just relevant to project planning. On the contrary, poor scope management may have very negative implications in later stages of project execution, mostly regarding project performance.
Hence, a clear definition of the project scope is key to successful project scope management. In the construction industry, some tools such as PDRI (project definition rating) [173,174], DECRIS (detail engineering completion rating index system) [175], and FEL (front-end loading) [176] have been implemented to better define the project scope. A clearer definition of the project scope can also be achieved by actively involving stakeholders [137]. Another is obviously by building a consistent and realistic WBS [26].
A good WBS is a hierarchical decomposition, oriented to the project deliverables and the work that has to be actually done to achieve the project objectives [30]. If stated properly, it constitutes the core of project management (PM) [29,177]. This, because the WBS allows implementing other PM functions such as planning, scheduling, budgeting, resource allocation, and risk management, as well as quality assurance and control.
Q07 Q08 Q09
C1
0.726 0.738 0.525
Q12Q11Q10
C2
0.8260.7810.684
Q01 Q02 Q03
F1
0.626 0.642 0.423
Q06Q05Q04
F2
0.5750.6070.613
0.924
0.822 0.533 0.702 0.511
0.941
Q07 Q08 Q09
C1
Q12Q11Q10
C2
0.7090.6970.6310.711 0.796 0.722
Q01 Q02 Q03
F1
0.769 0.708 0.634
Q06Q05Q04
F2
0.7370.7180.762
0.906
0.7520.8890.7550.985
0.917
CIT Sample (Technicians) CIM Sample (Managers)
Figure 8. Final structural equation model (SEM) model (Note: Measurement errors are not shown forthe sake of simplicity and to avoid information cluttering).
According to the results shown in Table 22 and Figure 8, there is a strong relation between thedesign of the project scope and its development with the success of the project. These links are strongeramong managers. The success of the permanent organization (its business and the context of theproject) is also dependent on the management of the project scope. Although the value given bytechnicians and managers to the factors and criteria (as can be seen in Tables 10 and 11) is very similar,their consistency increases when technical roles are being replaced by managerial ones. Relationsamong factors and criteria are significant for both samples.
Appl. Sci. 2020, 10, 1386 23 of 33
5. Discussion
In this study, the importance of project scope management has been endorsed, as it was in previousstudies (e.g., [15,25,172]). However, we have emphasized that scope management is not just relevantto project planning. On the contrary, poor scope management may have very negative implications inlater stages of project execution, mostly regarding project performance.
Hence, a clear definition of the project scope is key to successful project scope management.In the construction industry, some tools such as PDRI (project definition rating) [173,174], DECRIS(detail engineering completion rating index system) [175], and FEL (front-end loading) [176] have beenimplemented to better define the project scope. A clearer definition of the project scope can also beachieved by actively involving stakeholders [137]. Another is obviously by building a consistent andrealistic WBS [26].
A good WBS is a hierarchical decomposition, oriented to the project deliverables and the workthat has to be actually done to achieve the project objectives [30]. If stated properly, it constitutes thecore of project management (PM) [29,177]. This, because the WBS allows implementing other PMfunctions such as planning, scheduling, budgeting, resource allocation, and risk management, as wellas quality assurance and control.
Other authors, however, put the schedule at the centre of the whole project planning and definitionstages [178,179]. In BIM contexts, the WBS has already been implemented for monitoring and reactingto changes in the work schedule [180]. For example, measures to handle design conflicts (configurationmanagement) related to construction components have been already introduced in BIM platforms [181].Unfortunately, this approach tends to manage time and cost independently, and in it, the WBS isgenerally not integrated with the CBS [13]. Hence, in those cases, the WBS is used for project timecontrol whereas the CBS is used for budget control.
However, if the focus remains on the WBS, project risks can be more efficiently managed, as manyauthors have also noted [10,55,56,182]. Risk information can be relatively easily managed in BIMenvironments [183]. For example, risks with their associated project activities in the dynamic process canbe considered with a series of linkage rules [184]. These risks that generally derive in non-compliance ofproject deadlines, budgets and quality requirements, usually arise from incomplete designs, inadequatespecifications, and construction procedures, as well as scope changes [185].
However, when the WBS is integrated with the CBS, schedule and cost can be jointlymanaged [48,120]. This allows project performance to be more easily measured too [144]. Thelatter also allows the implementation of project control techniques such as earned value management(EVM) [117]. EVM for example assumes that work packages (WP, from the WBS) and cost accounts(CA, from the CBS) are significantly overlapped.
Still, the integration of WBS and CBS is not new in the construction industry, even before theadvent of BIM [14]. Unfortunately, the absence of accurate and real-time as-built information hasgenerally made it difficult to integrate and manage those events that produce project variability anduncertainty [186]. Conflicts arise more often, though, when the schedule depends on a WBS, and thebudget on a (separate) CBS. Furthermore, there still seems to be no common agreement on which arethe best criteria for decomposing the WBS and CBS, nor which is the best methodology to apply [49,52].In the construction industry, there have been proposals that have attempted to provide a referenceframework. However, although there is a global interest in standardizing processes, through codingsystems for instance, the result is still far from satisfactory. Indeed, even after the publication of theISO 12006-2 and 81346-12 standards (among others), many countries have kept issuing their ownnew standards.
The growing popularity of BIM, though, has made it possible to continue standardizing theintegration of information at the project level. Nevertheless, without agreement on how to structureand break the work down all the time, resource and cost information, many conflicts, compatibilityissues, and cost discrepancies will keep arising [53,131]. Still, while some authors continue researchinghow to manage project costs in BIM environments [11,73], only a few of them have started to focus the
Appl. Sci. 2020, 10, 1386 24 of 33
problem on the potential benefits of time and cost integration with the project scope (e.g., [47,111,113]).It is worth highlighting, though, that other digital technologies may help in preventing project delaysand cost overruns [187]. Two examples might be geographic information systems (GIS) and integratedproject delivery (IPD) frameworks.
Still, with the exception of Korea [125], no representative initiatives have been undertaken tostandardize work coding systems in most countries, including Spain [188]. While most constructionprojects in Korea are generally contracted at a fixed price [14], in Spain most contracts are based onquantity survey models [189]. It is very important then that all activities are included and that they arewell defined. However, a significant number of Spanish construction price databases, both public andprivate, have been published. Their aims are significantly overlapped with the definition of WBSs.This is because price databases require classifying different types of work and coding them. In fact,the utilization of these databases has become mandatory for most public works in Spain.
In short, thanks to the predictive nature (facilitating the works execution and control from theplanning stage) and global nature (connecting to deadlines, resources, costs and risks management),a more structured work management is essential in construction projects. That is why it is essential tocontemplate it into the digital management of projects.
6. Conclusions
Project scope management is key for project success. A sound project definition and structuregenerate fewer changes when project deficiencies are found. Similarly, with the integration of WBS andCBS fewer contradictions will arise and more realistic estimations will be possible at the execution stage.Conversely, poor project definition and structure at the planning stages will surely have performancerepercussions at the execution stage. These changes can proceed, for instance, from the task omission,cost overruns, project delays, and/or quality losses.
Most construction projects are not created as a whole, but as a collection of parts [45]. In thiscontext, WBS are used for breaking projects down into a number of small pieces that can each be moreeasily handled by a project manager, on site or in a screen. An early use of the WBS at the projectdefinition stage is critical for the achievement of the project objectives. Likewise, the use of the WBS,as a fundamental tool for the management of a project, is also confirmed with the development ofthe standard ISO 21511:2018 work breakdown structure (WBS) [190]. Its integration with the CBSalso allows both clients and contractors to develop the schedule based on the construction units level(the units of quantity survey contracts).
This research has confirmed the importance and advantages of developing WBSs based on CBSin construction projects. By means of a questionnaire distributed among 500 Spanish constructionprofessionals and a structural equation model, direct, significant, and causal relationships betweenthe integration of WBS and CBS have been identified with the achievement of project goals. We havealso found that as the competences and training in project management increase, there also is a higherawareness for any factor that facilitates managing the work to be done and implementing the toolsthat can measure its progress. This individuals’ competence and training can be improved throughspecialist courses, mentoring, professional certification, study of PM methodologies, and gainingexperience by participating in complex projects. In summary, according to the results obtained in thesurvey it can be stated that:
• The WBS involves structuring the project scope in a hierarchical manner. It is oriented to thedeliverables, and avoids both duplication and omission of tasks.
• As the project work is defined more clearly, project roles and responsibilities can be assigned tosubcontractors and organizational units more easily. This, in turn, also allows to define morerepresentative project schedules and budgets.
This research also has some limitations. The survey took place in Spain, a country whoseconstruction sector has no standardized system of coding and construction works classification.

Appl. Sci. 2020, 10, 1386 25 of 33
Furthermore, in the Spanish construction market, open quantity survey contracts are dominant. Thismight have partially biased the respondents’ perceptions regarding the relationship of project scope,time, and cost management with project success. Moreover, the use of the BIM methodologies is notwidespread in Spain. This means, major project stakeholders in this country may not fully grasp (yet)the advantages of standardization and integration of work-related and cost-related structures.
To conclude, future research will pursue to quantitatively measure the influence of integrating theWBSs and CBSs with the projects’ actual quality, time, and cost performance. It will also be worth askingwhether this integration will improve a company’s knowledge and change management capabilities.
Author Contributions: Conceptualization, A.C.-N.; methodology, A.C.-N., A.P.-F., and M.O.-M.; validation, P.B.-P.;formal analysis, A.C.-N. and P.B.-P.; investigation, A.C.-N., A.P.-F., and M.O.-M.; resources, A.C.-N.; data curation,A.C.-N.; writing A.C.-N. and P.B.-P.; original draft preparation, A.C.-N., A.P.-F., and M.O.-M.; writing—reviewand editing, A.C.-N. and P.B.-P.; supervision, A.P.-F. and M.O.-M.; funding acquisition, A.C.-N. and P.B.-P. Allauthors have read and agreed to the published version of the manuscript.
Funding: All authors acknowledge the help received by the research group TEP-955 from the PAIDI (Junta deAndalucía, Spain). The first and last authors acknowledge the help received by the research project PIN-0053-2019funded by the Fundación Pública Andaluza Progreso y Salud (Junta de Andalucía, Spain). The last author alsoacknowledges the Spanish Ministry of Science, Innovation, and Universities for his Ramon y Cajal contract(RYC-2017-22222) co-funded by the European Social Fund.
Conflicts of Interest: The authors declare no conflict of interest.
References
1. PwC. When Will You Think Differently about Programme Delivery; PwC: London, UK, 2014.2. Project Management Institute. The High Cost of Low Performance. How Will You Improve Business Results;
Project Management Institute: Newtown Square, PA, USA, 2016.3. Fortune, J.; White, D.; Jugdev, K.; Walker, D. Looking again at current practice in project management. Int. J.
Manag. Proj. Bus. 2011, 4, 553–572. [CrossRef]4. Davis, K. Different stakeholder groups and their perceptions of project success. Int. J. Proj. Manag. 2014, 32,
189–201. [CrossRef]5. KPMG International. Climbing the Curve; KPMG International: Amstelveen, The Netherlands, 2015.6. Demirkesen, S.; Ozorhon, B. Measuring Project Management Performance: Case of Construction Industry.
Eng. Manag. J. 2017, 29, 258–277. [CrossRef]7. Heywood, C.; Smith, J. Integrating stakeholders during community FM’s early project phases. Facilities 2006,
24, 300–313. [CrossRef]8. International Project Management Association. Individual Competence Baseline for Project, Programme & Portfolio
Management, 4th ed.; IPMA: Zurich, Switzerland, 2015; ISBN 978-9492338013.9. Project Management Institute. A Guide to the Project Management Body of Knowledge. PMBOK Guide, 6th ed.;
PMI: Newtown Square, PA, USA, 2017; ISBN 978-1628253825.10. Wang, Y. Applying the PDRI in Project Risk Management; The University of Texas at Austin: Austin, TX,
USA, 2002.11. Anticona, P. Does BIM offer a better approach to guarantee a reliable, accurate, and precise Cost Estimate?
PM World J. 2019, VIII, 1–28.12. Camilleri, E. Project Success: Critical Factors and Behaviours, 1st ed.; Gower Publishing: Burlington, VT, USA,
2011; ISBN 978-0566092282.13. García-Fornieles, J.M.; Fan, I.S.; Perez, A.; Wainwright, C.; Sehdev, K. A Work Breakdown Structure that
Integrates Different Views in Aircraft Modification Projects. Concurr. Eng. 2003, 11, 47–54. [CrossRef]14. Kim, S.; Park, C.; Lee, S.; Son, J. Integrated cost and schedule control in the Korean construction industry
based on a modified work-packaging model. Can. J. Civ. Eng. 2008, 35, 225–235. [CrossRef]15. Cerezo-Narváez, A.; Otero-Mateo, M.; Pastor-Fernández, A. Influence of scope management in construction
industry projects. DYNA Manag. 2016, 4, 1–15.

Appl. Sci. 2020, 10, 1386 26 of 33
16. Ibrahim, Y.M.; Kaka, A.P.; Trucco, E.; Kagioglou, M.; Ghassan, A. Semi-automatic development of the workbreakdown structure (WBS) for construction projects. In Proceedings of the 4th International Salford Centrefor Research and Innovation (SCRI) Research Symposium, Salford, UK, 26–27 March 2007; Salford Centre forResearch and Innovation (SCRI): Salford, UK, 2007; pp. 133–145.
17. Ballesteros-Pérez, P.; Cerezo-Narváez, A.; Otero-Mateo, M.; Pastor-Fernández, A.; Zhang, J.; Vanhoucke, M.Forecasting the Project Duration Average and Standard Deviation from Deterministic Schedule Information.Appl. Sci. 2020, 10, 654. [CrossRef]
18. Fageha, M.K.; Aibinu, A.A. Prioritising Project Scope Definition Elements in Public Building Projects.Australas. J. Constr. Econ. Build. 2014, 14, 18–33. [CrossRef]
19. Chritamara, S.; Ogunlana, S.O.; Bach, N.L. Investigating the effect of initial scope establishment on theperformance of a project through system dynamics modelling. Eng. Constr. Archit. Manag. 2001, 8, 381–392.[CrossRef]
20. Gómez-Senent Martínez, E. El Proyecto. Diseño en Ingeniería; Servicio de Publicaciones de la UniversidadPolitécnica de Valencia UPV: Valencia, Spain, 1997; ISBN 978-8477214540.
21. Wang, Y.-R.; Gibson, G.E., Jr. A study of preproject planning and project success using ANN and regressionmodels. In Proceedings of the 25th International Symposium on Automation and Robotics in Construction,Vilnius, Lithuania, 26–29 June 2008; Vilnius Gediminas Technical University: Vilnius, Lithuania, 2008;pp. 688–696.
22. Thaweejinda, J.; Methakullawat, N. Guideline for Clearly Definition Scope; Chulalongkorn University: Bangkok,Thailand, 2012.
23. Kraus, W. Analysis and Cost Estimating. Cost Eng. J. 2008, 50, 3–4.24. Seidel Calazans, A.T.; Dias Kosloski, R.A. O gerenciamento da alteração de escopo na contratação externa de
serviços de desenvolvimento/manutenção de software. In Proceedings of the 13th Argentine Symposium onSoftware Engineering (ASSE), La Plata, Argentina, 27–31 August 2012; Sociedad Argentina de Informática:La Plata, Argentina, 2012; pp. 75–90.
25. Khan, A. Project Scope Management. Cost Eng. J. 2006, 48, 12–16.26. Stal-Le Cardinal, J.; Marle, F. Project: The just necessary structure to reach your goals. Int. J. Proj. Manag.
2006, 24, 226–233. [CrossRef]27. Sikdar, S.; Das, O. Goal based project scope determination approach. In Proceedings of the IEEE International
Conference of Science and Technology for Humanity (TIC-STH), Toronto, ON, Canada, 26–27 September2009; IEEE: Toronto, ON, Canada, 2009; pp. 415–420.
28. Chrissis, M.B.; Konrad, M.; Shrum, S. CMMI for Development: A Guide to Process Integration and ProductImprovement, 1st ed.; Editorial Centro De Estudios Ramón Areces: Madrid, Spain, 2012; ISBN 978-8499610788.
29. Chua, D.K.; Godinot, M. Use of a WBS Matrix to Improve Interface Management in Projects. J. Constr.Eng. Manag. 2006, 132, 67–79. [CrossRef]
30. Project Management Institute. Practice Standard for Work Breakdown Structures, 3rd ed.; Project ManagementInstitute: Newtown Square, PA, USA, 2019; ISBN 978-1628256192.
31. International Organization for Standardization. ISO 21500:2012. Guidance on Project Management; InternationalOrganization for Standardization: Geneva, Switzerland, 2012.
32. López Paredes, A.; Pajares Gutierrez, J.; Iglesias Sanzo, M. Certificación IPMA-4LC. Manual de Preparación;Business Project Management Solutions & Technologies: Valladolid, Spain, 2013; ISBN 978-8461640324.
33. Kerzner, H. Project Management: A Systems Approach to Planning, Scheduling, and Controlling, 11th ed.; JohnWiley & Sons: Hoboken, NJ, USA, 2013; ISBN 978-1118022276.
34. Buchtik, L. Secrets to Mastering the WBS in Real World Projects, 2nd ed.; Project Management Institute:Newtown Square, PA, USA, 2013; ISBN 978-1628250336.
35. Hendrickson, C.; Au, T. Project Management for Construction: Fundamental Concepts for Owners, Engineers,Architects, and Builders, 1st ed.; Prentice Hall: Upper Saddle River, NJ, USA, 1989; ISBN 978-0137312665.
36. Engineering Advancement Association of Japan. A Guidebook of Project & Program Management for EnterpriseInnovation, 3rd ed.; Project Management Association of Japan: Tokyo, Japan, 2017; ISBN 978-4908520204.
37. AXELOS. Managing Successful Projects with PRINCE2; AXELOS: London, UK, 2017; ISBN 978-0113315338.38. The American Institute of Architects. Integrated Project Delivery: A Guide; The American Institute of Architects:
Washington, DC, USA, 2007.
Appl. Sci. 2020, 10, 1386 27 of 33
39. Saidi, K.S.; Lytle, A.M.; Stone, W.C. Report of the NIST Workshop on Data Exchange Standards at theConstruction Job Site. In Proceedings of the 20th International Symposium on Automation and Robotics inConstruction (ISARC), Eindhoven, The Netherlands, 21–24 September 2003; International Association forAutomation and Robotics in Construction (IAARC): Eindhoven, The Netherlands, 2003; pp. 617–622.
40. Zhang, X.; Bakis, N.; Lukins, T.C.; Ibrahim, Y.M.; Wu, S.; Kagioglou, M.; Aouad, G.; Kaka, A.P.; Trucco, E.Automating progress measurement of construction projects. Autom. Constr. 2009, 18, 294–301. [CrossRef]
41. Jawad, R.S.M.; Abdulkader, M.R.; Abang Ali, A.A. Variation Orders in Construction Projects. J. Eng. Appl. Sci.2009, 4, 170–176.
42. Ballesteros-Pérez, P.; Skitmore, M.; Pellicer, E.; Gutiérrez-Bahamondes, J.H. Improving the estimation ofprobability of bidder participation in procurement auctions. Int. J. Proj. Manag. 2016, 34, 158–172. [CrossRef]
43. González Fernández de Valderrama, F. Mediciones y Presupuestos, 2nd ed.; Reverte: Barcelona, Spain, 2010;ISBN 978-8429132014.
44. Lock, D. Project Management in Construction, 1st ed.; Routledge: Burlington, VT, USA, 2004;ISBN 978-1315602417.
45. Makarfi Ibrahim, Y.; Kaka, A.; Aouad, G.; Kagioglou, M. Framework for a generic work breakdown structurefor building projects. Constr. Innov. 2009, 9, 388–405. [CrossRef]
46. Nouban, F.; Sadeghi, K.; Abazid, M. An overall guidance and proposition of a WBS template for constructionplanning of the template (jacket) platforms. Acad. Res. Int. 2017, 8, 37–56.
47. Cha, H.S.; Lee, D.G. A case study of time/cost analysis for aged-housing renovation using a pre-made BIMdatabase structure. KSCE J. Civ. Eng. 2015, 19, 841–852. [CrossRef]
48. Jung, Y.; Woo, S. Flexible Work Breakdown Structure for Integrated Cost and Schedule Control. J. Constr.Eng. Manag. 2004, 130, 616–625. [CrossRef]
49. Raz, T.; Globerson, S. Effective Sizing and Content Definition of Work Packages. Proj. Manag. J. 1998, 29,17–23. [CrossRef]
50. Taylor, M.D. How to Develop Work Breakdown Structures; Systems Management Services: Montreal, QC,Canada, 2009.
51. Heerkens, G.R. Gestión de Proyectos; McGraw-Hill Interamericana: Madrid, Spain, 2002; ISBN 978-9701047729.52. Globerson, S.; Vardi, S.; Cohen, I. Identifying the Criteria Used for Establishing Work Package Size for Project
WBS. J. Mod. Proj. Manag. 2016, 4, 64–69.53. Pavan, A.; Daniotti, B.; Re Cecconi, F.; Maltese, S.; Spagnolo, S.L.; Caffi, V.; Chiozzi, M.; Pasini, D. INNOVance:
Italian BIM Database for Construction Process Management. In Computing in Civil and Building Engineering;American Society of Civil Engineers ASCE: Reston, VA, USA, 2014; pp. 641–648.
54. Chang, A.S.-T.; Tsai, Y.-W. Engineering Information Classification System. J. Constr. Eng. Manag. 2003, 129,454–460. [CrossRef]
55. Rianty, M.; Latief, Y.; Riantini, L.S. Development of risk-based standardized WBS (Work Breakdown Structure)for quality planning of high rise building architectural works. MATEC Web Conf. 2018, 159, 01019. [CrossRef]
56. Ramadhan, A.; Latief, Y.; Sagita, L. Development of risk-based standardized work breakdown structure forquality planning of airport construction project. J. Phys. Conf. Ser. 2019, 1360, 012005. [CrossRef]
57. Lister, G. Mastering Project, Program, and Portfolio Management. Models for Structuring and Executing the ProjectHierarchy; Pearson Education Limited: Upper Saddle River, NJ, USA, 2015; ISBN 978-0133839746.
58. Jaber, H.; Marle, F.; Vidal, L.-A.; Didiez, L. Criticality and propagation analysis of impacts between projectdeliverables. Res. Eng. Des. 2018, 29, 87–106. [CrossRef]
59. Büchmann-Slorup, R. Criticality in Location-Based Management of Construction; Technical University ofDenmark: Lyngby, Denmark, 2012.
60. Choi, O.-Y.; Kim, T.-H.; Kim, G.-H. A Study on Selection of Roof Waterproofing Method by analyzing LifeCycle Costing. J. Korean Inst. Build. Constr. 2008, 8, 127–134. [CrossRef]
61. El-Haram, M.A.; Marenjak, S.; Horner, M.W. Development of a generic framework for collecting whole lifecost data for the building industry. J. Qual. Maint. Eng. 2002, 8, 144–151. [CrossRef]
62. Le, Y.; Ren, J.; Ning, Y.; He, Q.; Li, Y. Life Cycle Cost Integrative Management in Construction Engineering. InProceedings of the First International Conference on Information Science and Engineering, Nanjing, China,26–28 December 2009; IEEE: Nanjing, China, 2009; pp. 4367–4370.
Appl. Sci. 2020, 10, 1386 28 of 33
63. Schade, J. Life Cycle Cost Calculation Models for Buildings. In Proceedings of the 4th Nordic Conferenceon Construction Economics and Organisation: Development Processes in Construction Mangement, Luleå,Sweden, 14–15 June 2007; Swedish National Research and Development Programme for Construction: Luleå,Sweden, 2007; pp. 321–329.
64. Bahaudin, A.Y.; Elias, E.M.; Dahalan, H.; Jamaluddin, R. Construction Cost Control: A Review of Practices inMalaysia. In Proceedings of the The 3rd International Conference on Technology and Operation Management(ICTOM), Bandung, Indonesia, 4–6 July 2012; Institute of Technology Bandung (ITB): Bandung, Indonesia,2012; pp. 1–11.
65. Lesniak, A.; Plebankiewicz, E.; Zima, K. Cost Calculation of Building Structures and Building Works inPolish Conditions. Eng. Manag. Res. 2012, 1, 72–81. [CrossRef]
66. Koushki, P.A.; Al-Rashid, K.; Kartam, N. Delays and cost increases in the construction of private residentialprojects in Kuwait. Constr. Manag. Econ. 2005, 23, 285–294. [CrossRef]
67. Derakhshanalavijeh, R.; Cardoso Teixeira, J.M. Cost overrun in construction projects in developing countries,gas-oil industry of Iran as a case study. J. Civ. Eng. Manag. 2016, 23, 125–136. [CrossRef]
68. Lind, H.; Brunes, F. Explaining cost overruns in infrastructure projects: A new framework with applicationsto Sweden. Constr. Manag. Econ. 2015, 33, 554–568. [CrossRef]
69. Cantarelli, C.C.; Molin, E.J.E.; Van Wee, B.; Flyvbjerg, B. Characteristics of cost overruns for Dutch transportinfrastructure projects and the importance of the decision to build and project phases. Transp. Policy 2012, 22,49–56. [CrossRef]
70. Cantarelli, C.C.; Flyvbjerg, B.; Molin, E.J.E.; van Wee, B. Cost overruns in large-scale transportationinfrastructure projects: Explanations and their theoretical embeddedness. Eur. J. Transp. Infrastruct. Res.2010, 10, 5–18.
71. Harrison, F.; Lock, D. Advanced Project Management; Gower Publishing: Burlington, VT, USA, 2017; ISBN978-1315263328.
72. Staub–French, S.; Fischer, M.; Kunz, J.; Ishii, K.; Paulson, B. A feature ontology to support construction costestimating. Artif. Intell. Eng. Des. Anal. Manuf. 2003, 17, 133–154. [CrossRef]
73. Lee, S.K.; Kim, K.R.; Yu, J.H. BIM and ontology-based approach for building cost estimation. Autom. Constr.2014, 41, 96–105. [CrossRef]
74. Ma, Z.; Wei, Z.; Zhang, X. Semi-automatic and specification-compliant cost estimation for tendering ofbuilding projects based on IFC data of design model. Autom. Constr. 2013, 30, 126–135. [CrossRef]
75. Cooper, R.; Kaplan, R.S. Measure Costs Right: Make the Right Decision. Harv. Bus. Rev. 1988, 66, 96–103.76. Everaert, P.; Bruggeman, W.; Sarens, G.; Anderson, S.R.; Levant, Y. Cost modeling in logistics using
time-driven ABC. Int. J. Phys. Distrib. Logist. Manag. 2008, 38, 172–191. [CrossRef]77. Kaplan, R.S.; Anderson, S.R. Time-Driven Activity- Based Costing. Harv. Bus. Rev. 2004, 82, 131–138.
[CrossRef] [PubMed]78. International Federation of Consulting Engineers Which FIDIC Contract Should I Use? Available online: http:
//fidic.org/bookshop/about-bookshop/which-fidic-contract-should-i-use (accessed on 30 December 2019).79. Marsh, P. Contracting for Engineering and Construction Projects, 5th ed.; Routledge: New York, NY, USA, 2016;
ISBN 978-0566082825.80. Hughes, W.; Champion, R.; Murdoch, J. Construction Contracts. Law and Management, 5th ed.; Routledge:
London, UK, 2015; ISBN 978-1315695211.81. Ballesteros-Pérez, P.; González-Cruz, M.C.; Cañavate-Grimal, A. Mathematical relationships between scoring
parameters in capped tendering. Int. J. Proj. Manag. 2012, 30, 850–862. [CrossRef]82. Ballesteros-Pérez, P.; del Campo-Hitschfeld, M.L.; Mora-Melià, D.; Domínguez, D. Modeling bidding
competitiveness and position performance in multi-attribute construction auctions. Oper. Res. Perspect. 2015,2, 24–35. [CrossRef]
83. Ballesteros-Pérez, P.; González-Cruz, M.C.; Fernández-Diego, M.; Pellicer, E. Estimating future biddingperformance of competitor bidders in capped tenders. J. Civ. Eng. Manag. 2014, 20, 702–713. [CrossRef]
84. Council for Development and Housing of the Regional Government of Andalusia; Universityof Seville; School of Building Engineering of Seville; Official Association of Quantity Surveyorsand Technical Architects of Seville Andalusian Construction Cost Base (BCCA). Available online:https://www.juntadeandalucia.es/organismos/fomentoinfraestructurasyordenaciondelterritorio/areas/vivienda-rehabilitacion/planes-instrumentos/paginas/vivienda-bcca.html (accessed on 30 December 2019).
Appl. Sci. 2020, 10, 1386 29 of 33
85. Construction Technology Institute of Catalonia (ITEC) BEDEC DataBase. Available online: https://metabase.itec.cat/vide/es/bedec (accessed on 30 December 2019).
86. Council of Development Housing Territorial Planning and Tourism of the Regional Government ofExtremadura Construction Pricing Base of the Regional Government of Extremadura. Available online:http://basepreciosconstruccion.gobex.es/ (accessed on 30 December 2019).
87. Directorate General of Housing and Rehabilitation of the Community of Madrid Construction Database ofthe Community of Madrid. Available online: http://www.madrid.org/bdccm/index.html (accessed on 30December 2019).
88. CYPE Arquimedes. Available online: http://arquimedes.cype.es/ (accessed on 30 December 2019).89. PREOC Premeti. Available online: http://www.preoc.es/#!129000001 (accessed on 30 December 2019).90. PROSOFT Menfis. Available online: https://prosoft.es/productos/menfis (accessed on 30 December 2019).91. Magalhães, P.M.; Sousa, H. Information consistency on construction—Case study of correlation between
classification systems for construction types. In Proceedings of the 10th European Conference on Productand Process Modelling (ECPPM), Vienna, Austria, 17–19 September 2014; European Association of Productand Process Modelling (EAPPM): Vienna, Austria; pp. 309–315.
92. International Organization for Standardization. ISO TR 14177:1994. Classification of Information in theConstruction Industry, 1st ed.; International Organization for Standardization: Geneva, Switzerland, 1994.
93. Kang, L.S.; Paulson, B.C. Adaptability of information classification systems for civil works. J. Constr.Eng. Manag. 1997, 123, 410–426. [CrossRef]
94. The European Council for Construction Economists. Code of Measurement for Cost Planning; CEEC: Paris,France, 2014.
95. Deutsches Institut für Normung. DIN 276-1. Building Costs. Part 1: Building Construction; DIN: Berlin,Germany, 2008.
96. Swedish Building Centre. BSAB 96. Systems and Applications, 1st ed.; Swedish Building Centre: Stockholm,Sweden, 2005; ISBN 978-9173339032.
97. National Building Specification (NBS) UniClass 2015. Available online: https://www.thenbs.com/our-tools/uniclass-2015 (accessed on 30 December 2019).
98. Construction 2000 Classification Committee. TALO 2000. Construction Classification; Building InformationFoundation: Helsinki, Finland, 2000; ISBN 978-9516829480.
99. Centre for Productivity in Construction (Cuneco). Development plan for the Danish Building Classification System(DBK) 2010–2012, 3rd ed.; Centre for Productivity in Construction (Cuneco): Copenhague, Denmark, 2010.
100. International Construction Measurement Standards Coalition. ICMS: Global Consistency in PresentingConstruction and Other Life Cycle Costs; International Construction Measurement Standards Coalition: London,UK, 2019; ISBN 978-1783213757.
101. Stoy, C.; Wright, M. The CEEC Code for Cost Planning: Introduction and Practical Application. J. CostAnal. Manag. 2007, 9, 37–54. [CrossRef]
102. Construction Specifications Institute. Construction Specifications Practice Guide, 1st ed.; John Wiley & Sons:Hoboken, NJ, USA, 2011; ISBN 978-0470635209.
103. Construction Specifications Institute. Masterformat 2018. Master List of Members and Titles for the ConstructionIndustry, 2018th ed.; Construction Specifications Institute: Alexandria, VA, USA, 2018.
104. Construction Specifications Institute. Uniformat. A Uniform Classification of Constructions Systems andAssemblies; Construction Specifications Institute: Alexandria, VA, USA, 2010; ISBN 978-0984535712.
105. Construction Specifications Institute. OmniClass. A Strategy for Classifying the Built Environment; ConstructionSpecifications Institute: Alexandria, VA, USA, 2019.
106. International Organization for Standardization. ISO 12006-2: 2015. Building Construction. Organization ofInformation about Construction Works. Part 2: Framework for Classification of Information, 2nd ed.; InternationalOrganization for Standardization: Geneva, Switzerland, 2015.
107. International Organization for Standardization. ISO 81346-12:2018. Industrial Systems, Installations andEquipment and Industrial Products. Structuring Principles and Reference Designations. Part 12: Construction Worksand Building Services, 1st ed.; International Organization for Standardization: Geneva, Switzerland, 2018.
108. Swedish Building Centre. Industry Practices for Application of CoClass in Software; Swedish Building Centre:Stockholm, Sweden, 2018.
Appl. Sci. 2020, 10, 1386 30 of 33
109. Centre for Productivity in Construction (Cuneco) Cuneco Classification System (CCS). Available online:https://ccs.molio.dk/ (accessed on 30 December 2019).
110. International Organization for Standardization. ISO 12006-3: 2007. Building Construction. Organization ofInformation about Construction Works. Part 3: Framework for Object-Oriented Information, 1st ed.; InternationalOrganization for Standardization: Geneva, Switzerland, 2007.
111. Liu, H.; Lu, M.; Al-Hussein, M. BIM-Based Integrated Framework for Detailed Cost Estimation and SchedulePlanning of Construction Projects. In Proceedings of the 31st International Symposium on Automation andRobotics in Construction and Mining (ISARC), Sydney, Australia, 9–11 July 2014; International Associationfor Automation and Robotics in Construction (IAARC): Sydney, Australia, 2014; pp. 286–294.
112. Park, I.J.; Jin, R.Z.; Yang, H.J.; Hyun, C.T. A support tool for cost and schedule integration by connectingPMIS & PgMIS. In Proceedings of the 2011 2nd International Conference on Engineering and Industries(ICEI), Jeju, Korea, 29 November–1 December 2011; IEEE: Jeju, Korea, 2011; pp. 142–146.
113. Fan, S.-L.; Chong, H.-Y.; Hung, T.-W.; Wang, Y.-C. Cost-based scheduling method using object-orientedapproach. Autom. Constr. 2016, 65, 65–77. [CrossRef]
114. Lee, J.-H.; Lee, S.-W.; Kim, T.-Y. A Development of Unified and Consistent BIM Database for Integrated Useof BIM-based Quantities, Process, and Construction Costs in Civil Engineering. J. Korea Soc. Comput. Inf.2019, 24, 127–137.
115. Young-Bae, C.; Hyun-Soo, L. An Aplication Model to Ensure Practical Usage in Construction Management.Proc. Korean Inst. Constr. Eng. Manag. 2002, 11, 401–404.
116. Yang, H.J.; Jin, R.Z.; Park, I.J.; Hyun, C.T. Development of a Support Tool for Cost and Schedule IntegrationManagment at Program Level. Int. J. Civ. Environ. Eng. 2012, 62, 790–797.
117. Park, H.-T.; Lee, B.-H. EVMS Database System Implementation for interworking of WBS & CBS basedmanagement in Construction Works. J. Korea Acad. Coop. Soc. 2011, 12, 2851–2858.
118. Teicholz, P.M. Current Needs for Cost Control Systems. In Project Controls: Needs and Solutions; Ibbs, C.W.,Ashley, D.B., Eds.; American Society of Civil Engineers: Chicago, IL, USA, 1987; pp. 47–57.
119. Rasdorf, W.J.; Abudayyeh, O.Y. Cost and Schedule Control Integration: Issues and Needs. J. Constr.Eng. Manag. 1991, 117, 486–502. [CrossRef]
120. Cho, K.; Hong, T.; Hyun, C. Integrated schedule and cost model for repetitive construction process.J. Manag. Eng. 2010, 26, 78–88. [CrossRef]
121. Villena Manzanares, F.; García Segura, T.; Ballesteros-Pérez, P.; Pellicer Armiñana, E. Influence of BIMin Construction Companies Innovation. In Proceedings of the 23rd International Congress on ProjectManagement and Engineering, Malaga, Spain, 10–12 July 2019; AEIPRO (IPMA Spain): Malaga, Spain, 2019;pp. 524–533.
122. Cavka, H.B.; Staub-French, S.; Pottinger, R. Evaluating the alignment of organizational and project contextsfor BIM adoption: A case study of a large owner organization. Buildings 2015, 5, 1265–1300. [CrossRef]
123. Terreno, S.; Asadi, S.; Anumba, C. An Exploration of Synergies between Lean Concepts and BIM in FM: AReview and Directions for Future Research. Buildings 2019, 9, 147. [CrossRef]
124. Bensalah, M.; Elouadi, A.; Mharzi, H. Overview: The opportunity of BIM in railway. Smart Sustain. BuiltEnviron. 2019, 8, 103–116. [CrossRef]
125. Nam, J.-Y.; Jo, C.-W.; Park, S.-H. A Study on Applying Information Framework for BIM Based WBS -Focusingon Civil Construction-. J. Korea Acad. Coop. Soc. 2017, 18, 770–777.
126. Subramani, T.; Sivakumar, P. Analysis Cost Overruns, Delays and Risk Involved in Construction ManagementUsing Primavera. Int. J. Eng. Technol. 2018, 7, 160. [CrossRef]
127. Aziz, A.; Kumar, S. Financial and work management analysis for residential construction: A case study. Int.J. Recent Technol. Eng. 2019, 7, 893–897.
128. Sun, C.; Man, Q.; Wang, Y. Study on BIM-based construction project cost and schedule risk early warning.J. Intell. Fuzzy Syst. 2015, 29, 469–477. [CrossRef]
129. Sattineni, A.; Bradford, R.H. Estimating with BIM: A Survey of US Construction Companies. In Proceedingsof the 28th International Symposium on Automation and Robotics in Construction (ISARC), Seoul, Korea, 29June–2 July 2011; International Association for Automation and Robotics in Construction (IAARC): Seoul,Korea, 2011; pp. 564–569.
130. Ding, L.Y.; Zhou, Y.; Luo, H.B.; Wu, X.G. Using nD technology to develop an integrated constructionmanagement system for city rail transit construction. Autom. Constr. 2012, 21, 64–73. [CrossRef]
Appl. Sci. 2020, 10, 1386 31 of 33
131. Park, J.; Cai, H. WBS-based dynamic multi-dimensional BIM database for total construction as-builtdocumentation. Autom. Constr. 2017, 77, 15–23. [CrossRef]
132. Taner, M.T. Critical Success Factors for Six Sigma Implementation in Large-scale Turkish ConstructionCompanies. Int. Rev. Manag. Mark. 2013, 3, 212–225.
133. Pinto, J.K.; Prescott, J.E. Planning and Tactical Factors in the Project Implementation Process. J. Manag. Stud.1990, 27, 305–327. [CrossRef]
134. Shenhar, A.J.; Dvir, D.; Levy, O.; Maltz, A.C. Project success: A multidimensional strategic concept.Long Range Plan. 2001, 34, 699–725. [CrossRef]
135. Kulatunga, U.; Amaratunga, D.; Haigh, R. Implementation of critical success factors in construction researchand development process. Int. J. Eng. Sci. Technol. 2010, 2, 96–106. [CrossRef]
136. Liberzon, V.; Shavyrina, V. Methods and Tools of Success Driven Project Management. Proj. Perspect. 2013,XXXV, 32–37.
137. Fageha, M.K.; Aibinu, A.A. Managing Project Scope Definition to Improve Stakeholders’ Participation andEnhance Project Outcome. Procedia-Soc. Behav. Sci. 2013, 74, 154–164. [CrossRef]
138. Baccarini, D. The Logical Framework Method for Defining Project Success. Proj. Manag. J. 1999, 30, 25–32.[CrossRef]
139. Tasevska, F.; Damij, T.; Damij, N. Project planning practices based on enterprise resource planning systemsin small and medium enterprises—A case study from the Republic of Macedonia. Int. J. Proj. Manag. 2014,32, 529–539. [CrossRef]
140. Kumar, D. Developing strategies and philosophies early for successful project implementation. Int. J.Proj. Manag. 1989, 7, 164–171. [CrossRef]
141. Dvir, D.; Lipovetsky, S.; Shenhar, A.J.; Tishler, A. In search of project classification: A non-universal approachto project success factors. Res. Policy 1998, 27, 915–935. [CrossRef]
142. Smith, S.D.; Beausang, P.; Moriarty, D.; Campbell, J.M. Subjectivity in data extraction: A study based onconstruction hazard identification. In Proceedings of the 24th Annual Conference of the Association ofResearchers in Construction Management, (ARCOM), Cardiff, UK, 1–3 September 2008; Association ofResearchers in Construction Management (ARCOM): Cardiff, UK, 2008; Volume 2, pp. 1065–1073.
143. Vahed, A.M.; Gambatese, J.A.; Hendricks, M.T. Perceptions of the Influence of Personal Demographic Factorson the Safety Performance of Field Employees. In Construction Research Congress 2016; American Society ofCivil Engineers: Reston, VA, USA, 2016; pp. 2936–2945.
144. Pheng, L.S.; Chuan, Q.T. Environmental factors and work performance of project managers in the constructionindustry. Int. J. Proj. Manag. 2006, 24, 24–37. [CrossRef]
145. Méxas, M.P.; Quelhas, O.L.G.; Costa, H.G. Prioritization of enterprise resource planning systems criteria:Focusing on construction industry. Int. J. Prod. Econ. 2012, 139, 340–350. [CrossRef]
146. Ruthankoon, R.; Olu Ogunlana, S. Testing Herzberg’s two-factor theory in the Thai construction industry.Eng. Constr. Archit. Manag. 2003, 10, 333–341. [CrossRef]
147. Jiang, Z.; Henneberg, S.C.; Naudé, P. Supplier relationship management in the construction industry: Theeffects of trust and dependence. J. Bus. Ind. Mark. 2011, 27, 3–15. [CrossRef]
148. Kline, R.B. Principles and Practice of Structural Equation Modeling, 3rd ed.; The Guilford Press: New York, NY,USA, 2011; ISBN 978-1606238776.
149. Kaiser, H.F. A second generation little jiffy. Psychometrika 1970, 35, 401–415. [CrossRef]150. Kaiser, M.O. Kaiser-Meyer-Olkin measure for identity correlation matrix. J. R. Stat. Soc. 1974, 52, 296–298.151. Bartlett, M.S. The Effect of Standardization on a chi square Approximation in Factor Analysis. Biometrika
1951, 38, 337–344.152. Cho, K.M.; Hong, T.H.; Hyun, C.T. Effect of project characteristics on project performance in construction
projects based on structural equation model. Expert Syst. Appl. 2009, 36, 10461–10470. [CrossRef]153. Xiong, B.; Skitmore, M.; Xia, B.; Masrom, M.A.; Ye, K.; Bridge, A. Examining the influence of participant
performance factors on contractor satisfaction: A structural equation model. Int. J. Proj. Manag. 2014, 32,482–491. [CrossRef]
154. Cronbach, L.J.; Schönemann, P.; McKie, D. Alpha Coefficients for Stratified-Parallel Tests. Educ. Psychol. Meas.1965, 25, 291–312. [CrossRef]
155. George, D.; Mallery, P. SPSS for Windows Step-by-Step: A Simple Guide and Reference, 7th ed.; Routledge:Abingdon, UK, 2006; ISBN 978-0205515851.
Appl. Sci. 2020, 10, 1386 32 of 33
156. Hair, J.F., Jr.; Black, W.C.; Babin, B.J.; Anderson, R.E. Multivariate Data Analysis, 7th ed.; Pearson EducationLimited: Harlow, UK, 2014; ISBN 978-1292021904.
157. Peterson, R.A.; Kim, Y. On the relationship between coefficient alpha and composite reliability. J. Appl. Psychol.2013, 98, 194–198. [CrossRef] [PubMed]
158. Ho, R. Handbook of Univariate and Multivariate Data Analysis and Interpretation with SPSS; Chapman& Hall/CRC:Boca Raton, FL, USA, 2006; ISBN 978-1420011111.
159. Fornell, C.; Larcker, D.F. Evaluating Structural Equation Models with Unobservable Variables andMeasurement Error. J. Mark. Res. 1981, 18, 39. [CrossRef]
160. Washington, S.P.; Karlaftis, M.G.; Mannering, F. Statistical and Econometric Methods for Transportation DataAnalysis, 2nd ed.; CRC Press: Boca Raton, FL, USA, 2010; ISBN 978-1420082852.
161. Hooper, D.; Coughlan, J.; Mullen, M. Structural Equation Modelling: Guidelines for Determining Model Fit.Electron. J. Bus. Res. Methods 2008, 6, 53–60.
162. Wheaton, B.; Muthen, B.; Alwin, D.F.; Summers, G.F. Assessing Reliability and Stability in Panel Models.Sociol. Methodol. 1977, 8, 84. [CrossRef]
163. Jöreskog, K.G.; Sörbom, D. Recent Developments in Structural Equation Modeling. J. Mark. Res. 1982, 19,404–416. [CrossRef]
164. Steiger, J.H. Understanding the limitations of global fit assessment in structural equation modeling.Pers. Individ. Dif. 2007, 42, 893–898. [CrossRef]
165. Hu, L.T.; Bentler, P.M. Cutoff criteria for fit indexes in covariance structure analysis: Conventional criteriaversus new alternatives. Struct. Equ. Model. 1999, 6, 1–55. [CrossRef]
166. Tabachnick, B.G.; Fidell, L.S. Using Multivariate Statistics, 5th ed.; Allyn & Bacon: Needham Heights, MA,USA, 2006; ISBN 978-0205459384.
167. Bentler, P.M. Comparative fit indexes in structural models. Psychol. Bull. 1990, 107, 238–246. [CrossRef][PubMed]
168. Bentler, P.M.; Bonett, D.G. Significance tests and goodness of fit in the analysis of covariance structures.Psychol. Bull. 1980, 88, 588–606. [CrossRef]
169. Byrne, B.M. Structural Equation Modeling with LISREL, PRELIS, and SIMPLIS: Basic Concepts, Applications, andProgramming; Psychology Press: Road Hove, UK, 1998; ISBN 978-0805829242.
170. Mulaik, S.A.; James, L.R.; Van Alstine, J.; Bennett, N.; Lind, S.; Stilwell, C.D. Evaluation of Goodness-of-FitIndices for Structural Equation Models. Psychol. Bull. 1989, 105, 430–445. [CrossRef]
171. Sobel, M.E. Asymptotic Confidence Intervals for Indirect Effects in Structural Equation Models.Sociol. Methodol. 1982, 13, 290. [CrossRef]
172. Cerezo-Narváez, A.; Otero-Mateo, M.; Pastor-Fernández, A. From requirements agreement to changesintegration: Keys not failing in construction projects. DYNA Ing. Ind. 2017, 92, 254.
173. Cho, C.-S.; Gibson, G.E., Jr. Building Project Scope Definition Using Project Definition Rating Index. J. Archit.Eng. 2001, 7, 115–125. [CrossRef]
174. Bingham, E.; Gibson, G.E. Infrastructure Project Scope Definition Using Project Definition Rating Index.J. Manag. Eng. 2017, 33, 04016037. [CrossRef]
175. Kim, M.H.; Lee, E.B.; Choi, H.S. Detail Engineering Completion Rating Index System (DECRIS) for optimalinitiation of construction works to improve contractors’ Schedule-Cost performance for offshore oil and GasEPC projects. Sustainability 2018, 10, 2469. [CrossRef]
176. Hansen, S.; Too, E.; Le, T. Retrospective look on front-end planning in the construction industry: A literaturereview of 30 years of research. Int. J. Constr. Supply Chain Manag. 2018, 8, 19–42.
177. Desmond, C.L. Work Breakdown Structure. In Project Management for Telecommunications Managers; KluwerAcademic Publishers: Boston, MA, USA, 2012; pp. 71–72. ISBN 978-1402077289.
178. Nayak, M.K.; Mohanty, S. Schedule Risk Analysis of ICT Infrastructure Projects. Int. J. Comput. Appl. 2012,38, 1–5.
179. Altahtooh, U.; Alaskar, T. Understanding Relationship between Milestone and Decision-Making in ProjectManagement: A Qualitative Study among Project Managers in Saudi Arabia. Int. J. Bus. Manag. 2018, 13,184. [CrossRef]
180. Kim, H.-S.; Park, S.-M.; Kim, S.-G.; Han, S.-J.; Kang, L.-S. BIM Application and Construction ScheduleSimulation for the Horizontal Work Area. Int. J. Civ. Environ. Eng. 2017, 11, 1581–1586.

Appl. Sci. 2020, 10, 1386 33 of 33
181. Lin, W.Y.; Huang, Y.H. Filtering of irrelevant clashes detected by BIM software using a hybrid method ofrule-based reasoning and supervised machine learning. Appl. Sci. 2019, 9, 5324. [CrossRef]
182. Su, L.; Cao, Y.; Chen, R. Research on WBS-based risk identification and the countermeasures for real estateprojects’ entire course. In Proceedings of the 8th International Conference on Information Systems for CrisisResponse and Management (ISCRAM), Harbin, China, 25–27 November 2011; IEEE: Harbin, China, 2011;pp. 223–226.
183. Zou, Y.; Kiviniemi, A.; Jones, S.W.; Walsh, J. Risk Information Management for Bridges by Integrating RiskBreakdown Structure into 3D/4D BIM. KSCE J. Civ. Eng. 2019, 23, 467–480. [CrossRef]
184. Hillson, D.; Grimaldi, S.; Rafele, C. Managing Project Risks Using a Cross Risk Breakdown Matrix. Risk Manag.2006, 8, 61–76. [CrossRef]
185. Mhetre, K.; Konnur, B.A.; Landage, A.B. Risk Management in Construction Industry. Int. J. Eng. Res. 2016, 5,153–155.
186. Navon, R.; Sacks, R. Assessing research issues in Automated Project Performance Control (APPC).Autom. Constr. 2007, 16, 474–484. [CrossRef]
187. Sepasgozar, S.M.E.; Karimi, R.; Shirowzhan, S.; Mojtahedi, M.; Ebrahimzadeh, S.; McCarthy, D. Delay Causesand Emerging Digital Tools: A Novel Model of Delay Analysis, Including Integrated Project Delivery andPMBOK. Buildings 2019, 9, 191. [CrossRef]
188. Palacios, J.L.; Gonzalez, V.; Alarcón, L.F. Selection of Third-Party Relationships in Construction. J. Constr.Eng. Manag. 2014, 140, B4013005. [CrossRef]
189. Montes, M.V.; Ponce, M.E.; Falcón, R.M.; Ramírez-de-Arellano, A. Aproximación a la gestión económicaintegral de las obras por procesos productivos: Elaboración del modelo COP de control de costes deconstrucción. Inf. Constr. 2017, 69, 1–11. [CrossRef]
190. International Organization for Standardization. ISO 21511:2018. Work Breakdown Structures for Project andProgramme Management, 1st ed.; International Organization for Standardization: Geneva, Switzerland, 2018.
© 2020 by the authors. Licensee MDPI, Basel, Switzerland. This article is an open accessarticle distributed under the terms and conditions of the Creative Commons Attribution(CC BY) license (http://creativecommons.org/licenses/by/4.0/).
Copyright © 2022 FDOKUMEN