cost sheet
97
COST SHEET Definition : A cost sheet is a statement which represents the various costs incurred at different stages of business operations, in a tabular format. It determines the total cost or expenditure made by the organization, along with the cost incurred on each unit of a product or service in a particular period. A cost sheet is a report which is accumulated all of the costs associated with a product or production job. A cost sheet is used to compile the margin earned on a product or job, and can form the basis for the setting of prices on similar products in the future. A Cost Sheet depicts the following facts: 1. Total cost and cost per unit for a product. 2. The various elements of cost such as prime cost, factory cost, production cost, cost of goods sold, total cost, etc. 3. Percentage of every expenditure to the total cost. 4. Compare the cost of any two periods and ascertain the inefficiencies if any. 5. Information to management for cost control 6. Calculate and summarize the total cost of the product. *Components ● Prime Cost ● Works Cost ● Cost of Production ● Total Cost PRIME COST The initial cost made for manufacturing a product, i.e., raw material, labour wages and other production-related expenses, is termed as prime cost. Following is the equation for computing the prime cost: Where direct material is calculated with the help of the following formula: WORKS COST OR FACTORY COST The works cost is calculated by summing up the prime cost with the factory overheads and simultaneously adjusting the opening and closing stocks of work in progress. It can
-
Upload
khangminh22 -
Category
Documents
-
view
6 -
download
0
Transcript of cost sheet
COST SHEET
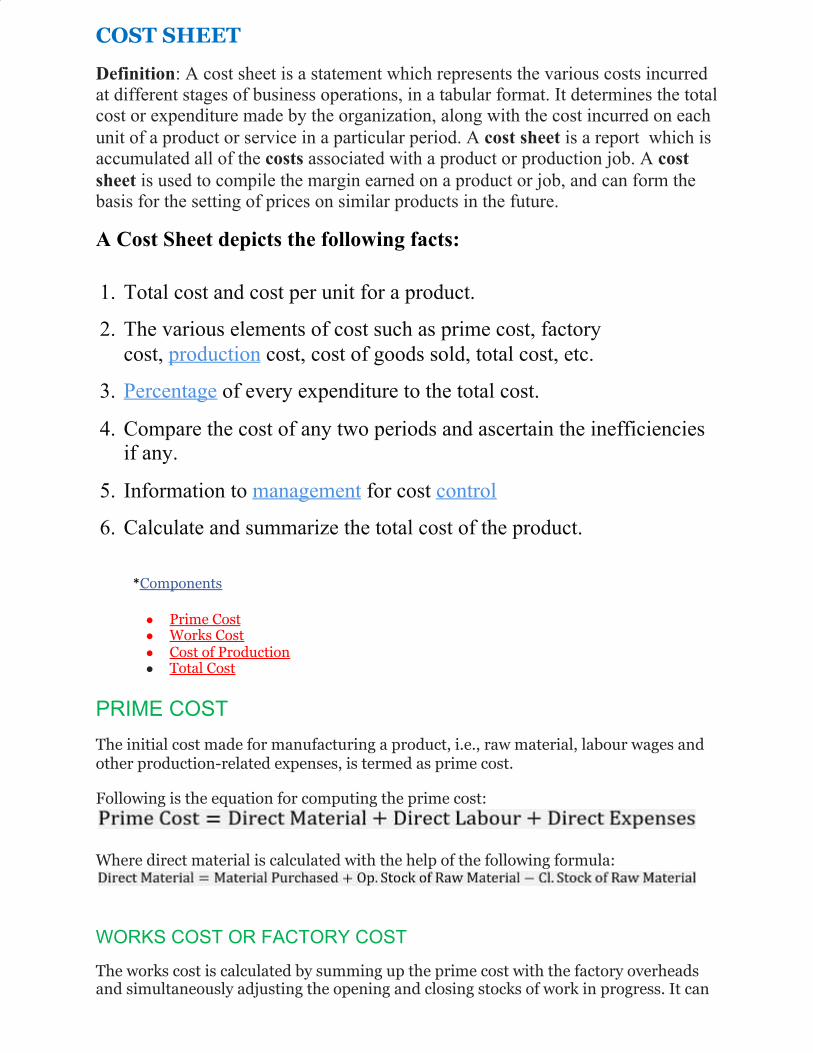
Definition: A cost sheet is a statement which represents the various costs incurred at different stages of business operations, in a tabular format. It determines the total cost or expenditure made by the organization, along with the cost incurred on each unit of a product or service in a particular period. A cost sheet is a report which is accumulated all of the costs associated with a product or production job. A cost sheet is used to compile the margin earned on a product or job, and can form the basis for the setting of prices on similar products in the future.
A Cost Sheet depicts the following facts:
1. Total cost and cost per unit for a product.
2. The various elements of cost such as prime cost, factory cost, production cost, cost of goods sold, total cost, etc.
3. Percentage of every expenditure to the total cost.
4. Compare the cost of any two periods and ascertain the inefficiencies if any.
5. Information to management for cost control
6. Calculate and summarize the total cost of the product.
*Components
● Prime Cost
● Works Cost
● Cost of Production
● Total Cost
PRIME COST The initial cost made for manufacturing a product, i.e., raw material, labour wages and
other production-related expenses, is termed as prime cost.
Following is the equation for computing the prime cost:
Where direct material is calculated with the help of the following formula:
WORKS COST OR FACTORY COST
The works cost is calculated by summing up the prime cost with the factory overheads
and simultaneously adjusting the opening and closing stocks of work in progress. It can

be denoted as:
The various indirect overheads incurred at the factory premises can be computed with the help
of the following formula:
Indirect Material
The indirect material includes all the additional items used for manufacturing products,
but not directly contribute as a raw material for the finished goods. It can be anything
like the oil, fuel, coal, stationery items and other factory utilities.
Also, the items which are though directly used for making a product, but are inexpensive
and small, are considered as indirect material. These include thread, pins, cello tape,
nails, nuts, etc.
Indirect Labour
The labour or human resource engaged in all the activities other than manufacturing of
goods or services which are essential to carry out the business and assist the production
operations is called indirect labour.
It includes salary paid to cleaning staff, security staff, drivers, etc.
Indirect Expenses
All the other overheads which are neither directly contributing to the production
operations, nor they can be termed as labour or material expense, are called indirect
expenses.
These are the expenses made for running the business operations smoothly. These
includes depreciation, rent, electricity, insurance, taxes, repairs and maintenance, etc.
COST OF PRODUCTION The cost of production includes all the direct and indirect cost, including the material,
labour and other expenses, i.e., production cost, factory cost and office or
administration cost.
The following formula denotes the computation of cost of production:
After making an adjustment of the opening finished goods and the closing finished
goods to the cost of production, we acquire the cost of production of goods sold.
Further, to calculate the cost of production of goods sold, the opening and closing stocks of
finished products are adjusted with the cost of production. Its formula is:
TOTAL COST The final value of a product or service can be determined after adding all the selling and
distribution expenses to the cost of production of goods sold. The formula to find out the

total cost or cost of sales is:
If the sales price of the products or service is known, the following method can be used
to determine the profit:
The companies which have their production or manufacturing units along with office
premises and also carry out sales and distribution of goods, require a systematic cost
accounting procedure to determine the cost, profit and sales price.
ITEMS EXCLUDED FROM COST SHEET: The following items are of financial nature and thus not included while preparing a cost sheet:
1. Cash discount
2. Transfer to reserves
3. Interest paid
4. Donations
5. Preliminary expenses written off
6. Income-tax paid
7. Goodwill written off
8. .Dividend paid
9. Provision for taxation
10. Profit/ loss on sale of fixed assets
11. Provision for bad debts
12.Damages payable at law, etc.

Cost Sheet Units
produced........
Particulars Total cost Rs.
Cost per unit Rs.
Opening Stock of Direct Raw Materials Add : Purchases ... ... Add : Carriage Inward ... ... Add : Octroi, Customs Duty and other expenses on purchases ... . Less : Closing Stock of Direct Raw Materials Cost of Direct Materials Consumed Direct or Productive Wages ... ... Direct (or Chargeable) Expenses Prime Cost Add : Works or Factory Overheads Indirect Materials Indirect Wages Leave Wages Overtime Premium Fuel and Power Coal Factory Rent and Taxes Insurance Factory Lighting Supervision Works Stationery Canteen and Welfare Expenses Repairs Haulage (the commercial transport of goods) Works Salaries Depreciation of Plant & Machinery Works Expenses Gas and Water Technical Fees Laboratory Expenses
XXXXX XXXX XXX XXX
XXXXXX XXXXX XXXXX
XXXXXX XXXXX Xxxxx Xxxxx Xxxxx Xxxxx Xxxxx Xxxxx Xxxxx Xxxxx Xxxxx Xxxxx Xxxxx Xxxxx Xxxxx Xxxxx Xxxxx Xxxxx Xxxxx Xxxxx Xxxxx xxxxx xxxxx
XXXXX XXXXX

Works Telephone Expenses Internal Transport Expenses Less : Sale of Scrap Add : Opening Stock of Work-in-progress Less : Closing Stock of Work-in-progress ... Works Cost Add : Office and Administrative Overheads Office Salaries Director’s Fees Office Rent and Rates Office Stationery and Printing Sundry Office Expenses Depreciation and Repairs of Office Equipment Depreciation of Office Furniture Subscript ion to Trade Journals Office Lighting Establishment Charges Director’s Travelling Expenses Postage Legal Charges Audit Fees Cost of Production Add : Opening Stock of Finished Goods Less : Closing Stock of Finished Goods Cost of Goods Sold Add : Selling and Distribution Overheads Advertising Showroom Expenses Bad Debts Salesmen’s Salaries and Expenses Packing Expenses Carriage Outward Commission of Sales Agents Counting House Salaries Cost of Catalogues Expenses of Delivery Vans Collect ion Charges Travelling Expenses
Xxxxx Xxxxx Xxxxx Xxxxx Xxxxx Xxxxx Xxxxx Xxxxx Xxxxx Xxxxx Xxxxx Xxxxx Xxxxx Xxxxx _______ Xxxxx xxxxx Xxxxx xxxxx xxxxx xxxxx xxxxx xxxxx xxxxx xxxxx xxxxx xxxxx xxxxx xxxxx
xxxxxx XXXXXX xxxxxx xxxxxx XXXXXX XXXXX
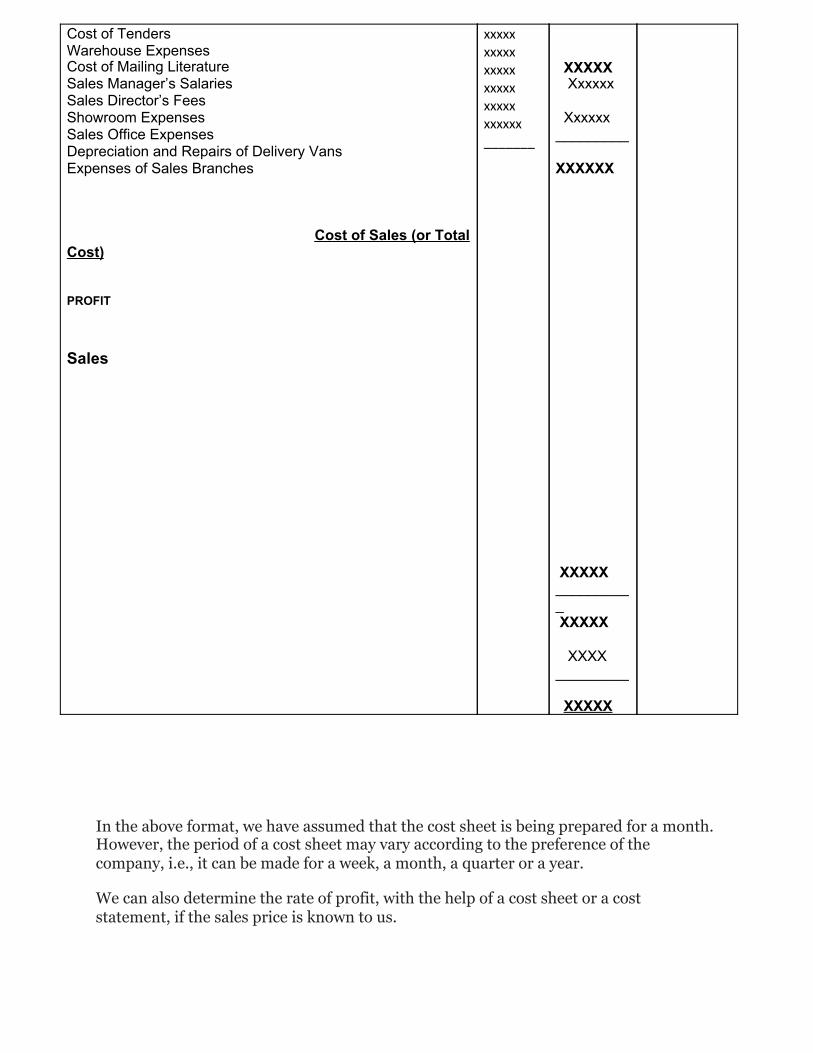
In the above format, we have assumed that the cost sheet is being prepared for a month.
However, the period of a cost sheet may vary according to the preference of the
company, i.e., it can be made for a week, a month, a quarter or a year.
We can also determine the rate of profit, with the help of a cost sheet or a cost
statement, if the sales price is known to us.
Cost of Tenders Warehouse Expenses Cost of Mailing Literature Sales Manager’s Salaries Sales Director’s Fees Showroom Expenses Sales Office Expenses Depreciation and Repairs of Delivery Vans Expenses of Sales Branches Cost of Sales (or Total Cost) PROFIT Sales
xxxxx xxxxx xxxxx xxxxx xxxxx xxxxxx _______
XXXXX Xxxxxx Xxxxxx _________ XXXXXX XXXXX __________ XXXXX XXXX _________ XXXXX

The following information has been extracted from the books of ABC & Co. for the
month ending January 31, 2019:
ITEMS AMOUNT
Raw Material (as on January 01, 2019) 54000
Work-in-Progress (as on January 01, 2019) 27500
Finished Goods (as on January 01, 2019) 61500
Raw Material (as on January 31, 2019) 48500
Work-in-Progress (as on January 31, 2019) 24750
Finished Goods (as on January 31, 2019) 66750

Material Purchased 280000
Carriage Inward for Raw Material 2150
Material destroyed by fire 6650
Productive Wages 175000
Wages of Storekeeper 7500
Depreciation on Machinery 8200
Factory Rent 14000
Electricity Bill of Factory 6700
Renovation of Factory Premises 9300
Machinery Repairs and Maintenance 2500
Office Cleaning 900
Depreciation on Office Computers 3500
Office Telephone Bill 650
Office Manager's Salary 11000

Prepare a cost sheet from the above data, showing:
● Prime cost
● Works cost
● Cost of production
● Total Cost
● Profit or loss, if the sales amounted to Rs. 661800.
Note that, 13236 units were manufactured in January 2019.
Office Stationery 1700
Fuel in Office Car 2750
Legal Charges 850
Salesperson Salary 7750
Warehouse Rent 4500
Freight Outwards 550
Depreciation of Delivery Van 2350
Showroom Rent and Taxes 8500
Advertisement 5000

COST SHEET
Definition: A cost sheet is a statement which represents the various costs incurred
at different stages of business operations, in a tabular format. It determines the total
cost or expenditure made by the organization, along with the cost incurred on each
unit of a product or service in a particular period. A cost sheet is a report which is
accumulated all of the costs associated with a product or production job. A cost
sheet is used to compile the margin earned on a product or job, and can form the
basis for the setting of prices on similar products in the future.
A Cost Sheet depicts the following facts:
1. Total cost and cost per unit for a product.
2. The various elements of cost such as prime cost, factory
cost, production cost, cost of goods sold, total cost, etc.
3. Percentage of every expenditure to the total cost.
4. Compare the cost of any two periods and ascertain the inefficiencies
if any.
5. Information to management for cost control
6. Calculate and summarize the total cost of the product.
*Components
• Prime Cost • Works Cost • Cost of Production • Total Cost
PRIME COST
The initial cost made for manufacturing a product, i.e., raw material, labour wages and other production-related expenses, is termed as prime cost.
Following is the equation for computing the prime cost:
Where direct material is calculated with the help of the following formula:
WORKS COST OR FACTORY COST
The works cost is calculated by summing up the prime cost with the factory overheads and simultaneously adjusting the opening and closing stocks of work in progress. It can

be denoted as:
The various indirect overheads incurred at the factory premises can be computed with the help of the following formula:
Indirect Material
The indirect material includes all the additional items used for manufacturing products, but not directly contribute as a raw material for the finished goods. It can be anything like the oil, fuel, coal, stationery items and other factory utilities.
Also, the items which are though directly used for making a product, but are inexpensive and small, are considered as indirect material. These include thread, pins, cello tape, nails, nuts, etc.
Indirect Labour
The labour or human resource engaged in all the activities other than manufacturing of goods or services which are essential to carry out the business and assist the production operations is called indirect labour.
It includes salary paid to cleaning staff, security staff, drivers, etc.
Indirect Expenses
All the other overheads which are neither directly contributing to the production operations, nor they can be termed as labour or material expense, are called indirect expenses.
These are the expenses made for running the business operations smoothly. These includes depreciation, rent, electricity, insurance, taxes, repairs and maintenance, etc.
COST OF PRODUCTION
The cost of production includes all the direct and indirect cost, including the material, labour and other expenses, i.e., production cost, factory cost and office or administration cost.
The following formula denotes the computation of cost of production:
After making an adjustment of the opening finished goods and the closing finished goods to the cost of production, we acquire the cost of production of goods sold.
Further, to calculate the cost of production of goods sold, the opening and closing stocks of finished products are adjusted with the cost of production. Its formula is:
TOTAL COST
The final value of a product or service can be determined after adding all the selling and distribution expenses to the cost of production of goods sold. The formula to find out the total cost or cost of sales is:

If the sales price of the products or service is known, the following method can be used
to determine the profit:
The companies which have their production or manufacturing units along with office premises and also carry out sales and distribution of goods, require a systematic cost accounting procedure to determine the cost, profit and sales price.
ITEMS EXCLUDED FROM COST SHEET: The following items are of financial nature and
thus not included while preparing a cost sheet:
1. Cash discount
2. Transfer to reserves
3. Interest paid
4. Donations
5. Preliminary expenses written off
6. Income-tax paid
7. Goodwill written off
8. .Dividend paid
9. Provision for taxation
10. Profit/ loss on sale of fixed assets
11. Provision for bad debts
12. Damages payable at law, etc.

Cost Sheet
Units produced........
Particulars Total cost Rs.
Cost per unit Rs.
Opening Stock of Direct Raw Materials Add : Purchases ... ... Add : Carriage Inward ... ... Add : Octroi, Customs Duty and other expenses on purchases ... . Less : Closing Stock of Direct Raw Materials Cost of Direct Materials Consumed Direct or Productive Wages ... ... Direct (or Chargeable) Expenses Prime Cost
Add : Works or Factory Overheads Indirect Materials Indirect Wages Leave Wages Overtime Premium Fuel and Power Coal Factory Rent and Taxes Insurance Factory Lighting Supervision Works Stationery Canteen and Welfare Expenses Repairs Haulage (the commercial transport of goods) Works Salaries Depreciation of Plant & Machinery Works Expenses Gas and Water Technical Fees Laboratory Expenses Works Telephone Expenses Internal Transport Expenses
XXXXX XXXX XXX XXX
XXXXXX XXXXX XXXXX
XXXXXX XXXXX
Xxxxx Xxxxx Xxxxx Xxxxx Xxxxx Xxxxx Xxxxx Xxxxx Xxxxx Xxxxx Xxxxx Xxxxx Xxxxx Xxxxx Xxxxx Xxxxx Xxxxx Xxxxx Xxxxx xxxxx xxxxx
XXXXX XXXXX xxxxxx

Less : Sale of Scrap
Add : Opening Stock of Work-in-progress
Less : Closing Stock of Work-in-progress ...
Works Cost Add : Office and Administrative Overheads
Office Salaries Director’s Fees Office Rent and Rates Office Stationery and Printing Sundry Office Expenses Depreciation and Repairs of Office Equipment Depreciation of Office Furniture Subscript ion to Trade Journals Office Lighting Establishment Charges Director’s Travelling Expenses Postage Legal Charges Audit Fees Cost of Production Add : Opening Stock of Finished Goods Less : Closing Stock of Finished Goods Cost of Goods Sold Add : Selling and Distribution Overheads
Advertising Showroom Expenses Bad Debts Salesmen’s Salaries and Expenses Packing Expenses Carriage Outward Commission of Sales Agents Counting House Salaries Cost of Catalogues Expenses of Delivery Vans Collect ion Charges Travelling Expenses Cost of Tenders Warehouse Expenses Cost of Mailing Literature Sales Manager’s Salaries Sales Director’s Fees
Xxxxx Xxxxx Xxxxx Xxxxx Xxxxx Xxxxx Xxxxx Xxxxx Xxxxx Xxxxx Xxxxx Xxxxx Xxxxx Xxxxx _______ Xxxxx xxxxx Xxxxx xxxxx xxxxx xxxxx xxxxx xxxxx xxxxx xxxxx xxxxx xxxxx xxxxx xxxxx xxxxx xxxxx
XXXXXX xxxxxx xxxxxx XXXXXX XXXXX XXXXX Xxxxxx Xxxxxx _________ XXXXXX
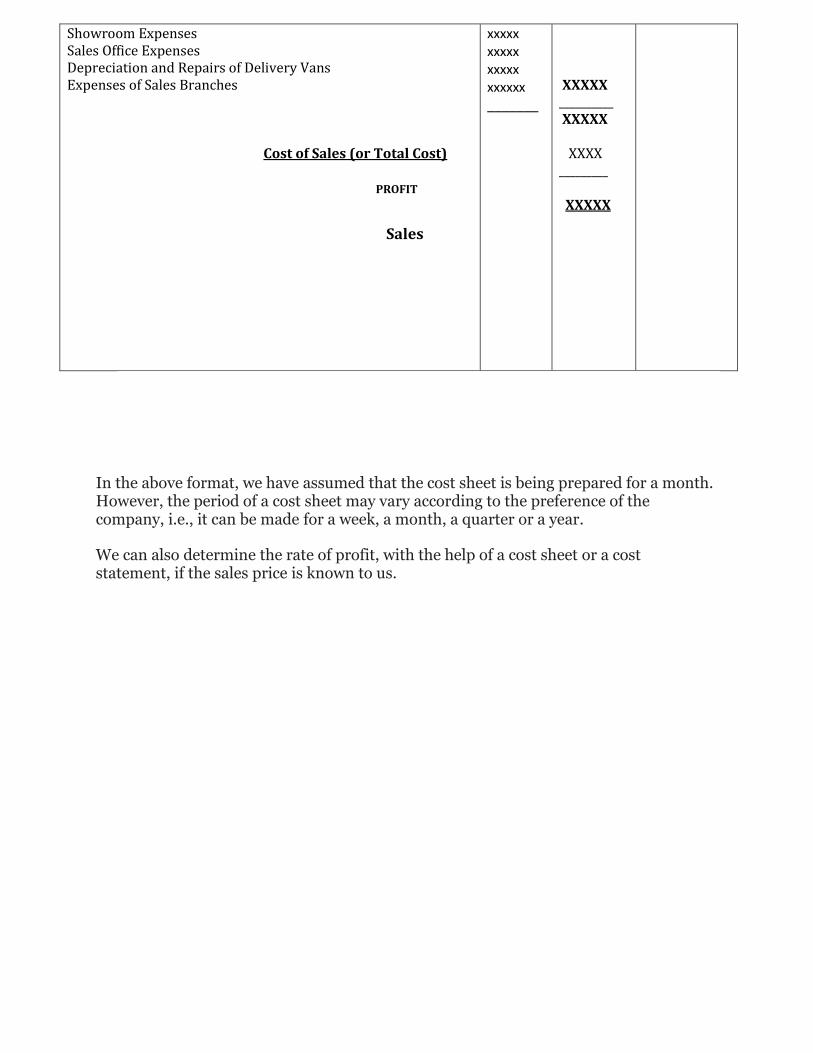
Showroom Expenses Sales Office Expenses Depreciation and Repairs of Delivery Vans Expenses of Sales Branches Cost of Sales (or Total Cost)
PROFIT
Sales
xxxxx xxxxx xxxxx xxxxxx _______
XXXXX __________ XXXXX XXXX _________ XXXXX
In the above format, we have assumed that the cost sheet is being prepared for a month. However, the period of a cost sheet may vary according to the preference of the company, i.e., it can be made for a week, a month, a quarter or a year.
We can also determine the rate of profit, with the help of a cost sheet or a cost statement, if the sales price is known to us.
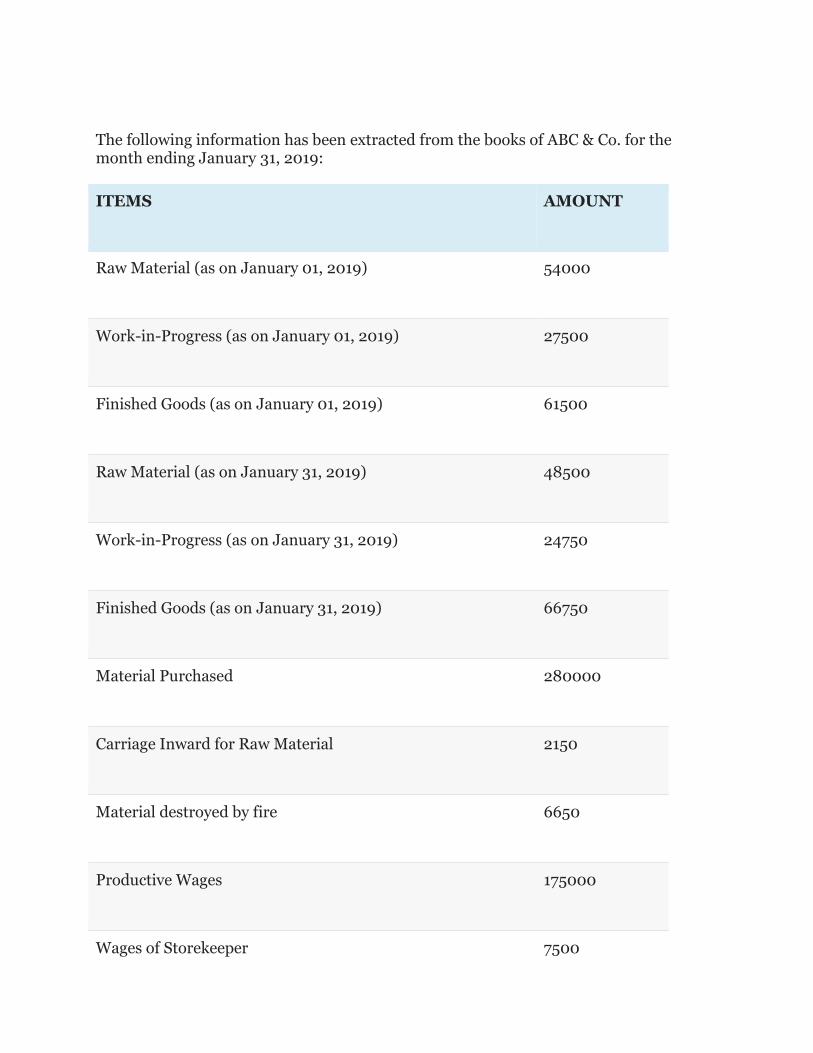
The following information has been extracted from the books of ABC & Co. for the month ending January 31, 2019:
ITEMS AMOUNT
Raw Material (as on January 01, 2019) 54000
Work-in-Progress (as on January 01, 2019) 27500
Finished Goods (as on January 01, 2019) 61500
Raw Material (as on January 31, 2019) 48500
Work-in-Progress (as on January 31, 2019) 24750
Finished Goods (as on January 31, 2019) 66750
Material Purchased 280000
Carriage Inward for Raw Material 2150
Material destroyed by fire 6650
Productive Wages 175000
Wages of Storekeeper 7500

ITEMS AMOUNT
Depreciation on Machinery 8200
Factory Rent 14000
Electricity Bill of Factory 6700
Renovation of Factory Premises 9300
Machinery Repairs and Maintenance 2500
Office Cleaning 900
Depreciation on Office Computers 3500
Office Telephone Bill 650
Office Manager's Salary 11000
Office Stationery 1700
Fuel in Office Car 2750
Legal Charges 850
Salesperson Salary 7750

ITEMS AMOUNT
Warehouse Rent 4500
Freight Outwards 550
Depreciation of Delivery Van 2350
Showroom Rent and Taxes 8500
Advertisement 5000
Prepare a cost sheet from the above data, showing:
• Prime cost • Works cost • Cost of production • Total Cost • Profit or loss, if the sales amounted to Rs. 661800.
Note that, 13236 units were manufactured in January 2019.
Cost Allocation, Apportionment and Absorption of Overheads
1
Learning Objectives
• To understand and apply the cost concepts

– Cost Allocation
– Apportionment of Overheads
– Absorption of Overheads
2
Introduction
The objective of Cost Accounting is classifying costs and recording an appropriate allocation of

expenditure for the determination of the costs of products or services, and for the presentation of suitably arranged data for the purpose of control
and guidance of management
3
Cost Allocation
• When items of cost are identifiable directly with some products or departments such costs are charged to cost centres. This process is known as cost allocation.
• It is the charging of discrete, identifiable items of cost to cost centres or cost
units.
• It is complete distribution of an item of overhead to the departments or products on logical or equitable basis is called allocation.
• Where a cost can be clearly identified with a cost centre or cost unit, then it can be allocated to that particular cost centre or unit.
• Allocation is the process by which cost items are charged directly to a cost unit or cost centre.
• Cost allocation calls for two basic factors –
– Concerned department/product should have caused the cost to be incurred
– Exact amount of cost should be computable. 4
Cost Allocation- Examples • Electricity charges can be allocated to various departments if separate meters
are installed
• Depreciation of machinery can be allocated to various departments as the machines can be identified
• Salary of stores clerk can be allocated to stores department • Cost of coal used in

boiler can be directly allocated to boiler house division. • Wages paid to workers of
service department can be allocated to the particular department.
• Indirect materials used by a particular department can also be allocated to the department.
Thus allocation is a direct process of identifying overheads to cost units or cost centres. So the term allocation means allotment of whole item of cost to
a particular cost centre or cost object without any division.
5
Cost Apportionment
• Cost Apportionment is the allotment of proportions of items to cost centers.
• When items of cost can not directly charge to or accurately identifiable with any cost centres, they are prorated or distributed amongst the cost centres on some predetermined basis. This method is known as cost apportionment.
• Wherever possible, the overheads are to be allocated. However, if it is not

possible to charge the overheads to a particular cost centre or cost unit, they are to be apportioned to various departments on some suitable basis. This process is called as ‘Apportionment’ of overheads.
• Items of indirect costs residual to the process of cost allocation are covered by cost apportionment.
• The predetermination of suitable basis of apportionment is very important and usually following principles are adopted- (i) Service or use (ii) Survey method (iii) Ability to bear.
6
Cost Apportionment
• The basis for apportionment is normally predetermined and is decided after a careful study of relationships between the base and the other variables within the organisation.
• A lot of quantitative information has to be collected and constantly updated or periodically reviewed to improve upon the accuracy of apportionment.

• The basis selected should be applied consistently to avoid faults. The basis ultimately adopted should ensure an equitable share of common expenses for the cost centres
• In simple words, distribution of various items of overheads in portions to the departments or products on logical or equitable basis is called apportionment.
7
Apportionment of overhead costs
• Apportionment of overhead costs means to divide total cost of overhead among different departments or branches or cost centers of a company. • We need the steps of apportionment of overhead

costs when there are many departments or cost centers of any company because when we know the overhead cost of each department, we can find the total cost of department. • With this, we can compare the revenue of each department with their total cost. • Then take decisions relating to particular department. 8
How to Apportion Overhead Costs
1st Step
2nd
Step :
9
• To Classify the Cost Centers
• Cost Centers should be classified into production department and service department.
• To Divide Total Overhead on Different Basis of Apportionment
• One of best step to apportion overhead costs is to know the basis of apportionment of overhead expenses and then to use them.
• All overhead will be allocated to the different department.

Basis for Overhead Apportionment
Overheads common to all these departments Apportioned on some suitable basis
Rent, rates & taxes Floor space occupied by each department , office, factory
Repair to Plant or Department, Depreciation on office building
Plant or Department's Value or any asset's Floor space occupied by each department
For Legal fees No of cases handled as the basis
For Salaries of common staff Ratio of salaries of departments as the basis
For Typist pool No of documents typed as the basis
For General Lighting and electricity No. of light points or Area or Units of Sub-meter in each Department
For Telephones No. of extensions in a department
For Material handling No. of material requisitions or Value of material issued
Power H.P. Of Plant
Supervision, Employer's liability No. of Employees
Fire Insurance Value of Stock in any Department
Indirect Labour Cost Total duty hours in any department
Canteen Service Cost and other welfare expenses No. of Employees in Any Department
Transport Cost No. of boxes or containers or weight of containers, hours of spending vehicle in any department

10
Example
• Total rent is Rs. 5000. • Area of production department is
– A 100 Sq. foot. – B 200 Sq. foot. – C 700 Sq. foot.
• Now total ratio of A : B : C is 1 : 2 : 7 • Total Rent Expense of
– A Department will be = 5000 X 1 /10 = Rs. 500 – B Department will be = 5000 X 2 / 10 = Rs. 1000 – C Department will be = 5000 X 7 / 10 = Rs. 3500
So, Total overhead cost will be apportioned to different department on some basis. Basis of Rent apportionment is the area of department

11
Distinction between Allocation & Apportionment
• Although the purpose of both allocation and apportionment is identical, i.e to identify or allot the costs to the cost centres or cost unit, both are not the same.
• Allocation deals with the whole items of cost and apportionment deals with proportion of items of cost. • Allocation is direct process of departmentalization of overheads, where as apportionment needs a suitable basis for sub-division of the cost. • Whether a particular item of expense can be allocated or
apportioned does not depends on the nature of expense,
but depends on the relation with the cost centre or cost unit to which it is to be charged.
12
Principles of Apportionment of Overhead Cost
1. Services Rendered
• A
production department which receives maximum services from service departments should be charged with the largest share of the overheads.
• Accordingly, the overheads of service departments are charged
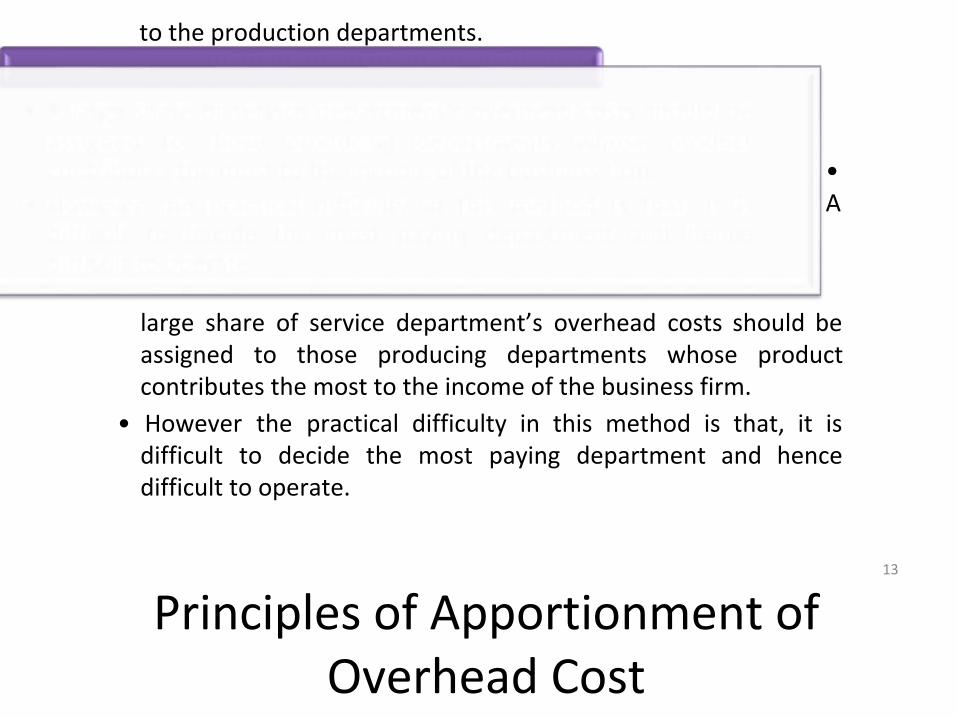
to the production departments.
2. Ability to Pay
• A
large share of service department’s overhead costs should be assigned to those producing departments whose product contributes the most to the income of the business firm.
• However the practical difficulty in this method is that, it is difficult to decide the most paying department and hence difficult to operate.
13
Principles of Apportionment of Overhead Cost

3. Survey or Analysis Method
• This method is used where a suitable base is difficult to find or it would be too costly to select a method which is considered suitable.
• For example, the postage cost could be apportioned on a survey of postage used during a year.
4. Efficiency Method
• The apportionment of expenses is made on the basis of

production targets.
• If the target is exceeded, the unit cost reduces indicating a more than average efficiency.
• If the target is not achieved, the unit cost goes up, disclosing there by, the inefficiency of the department.
14
Example
• A factory has 3 production departments (P1, P2, P3) and 2 service departments (S1 & S2). The following overheads & other information are extracted from the books for the month of January 2012.
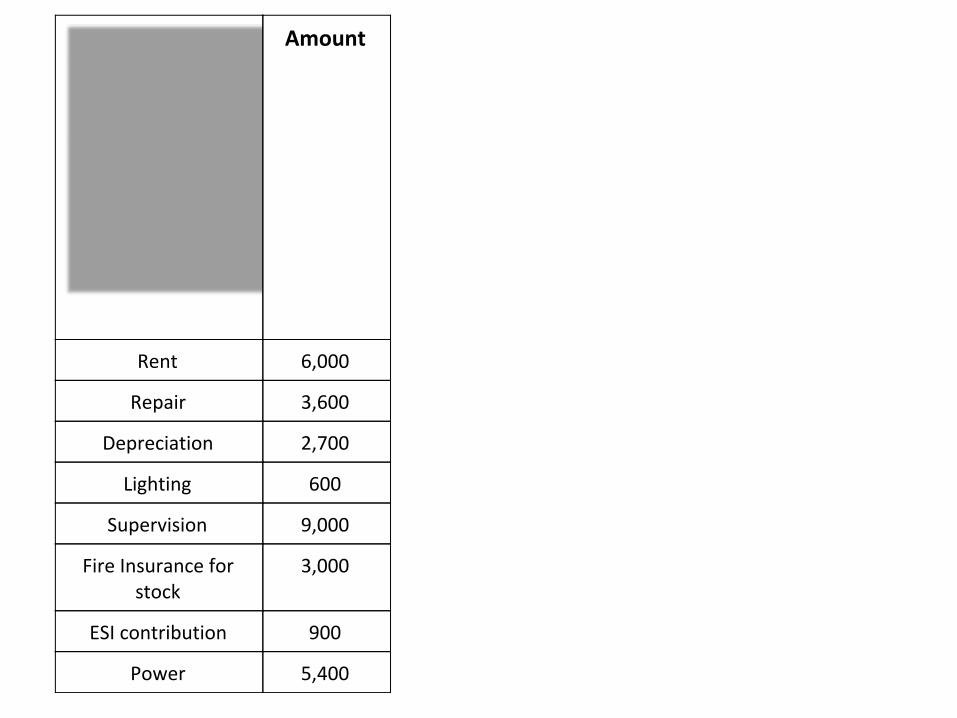
Amount
Rent 6,000
Repair 3,600
Depreciation 2,700
Lighting 600
Supervision 9,000
Fire Insurance for stock
3,000
ESI contribution 900
Power 5,400
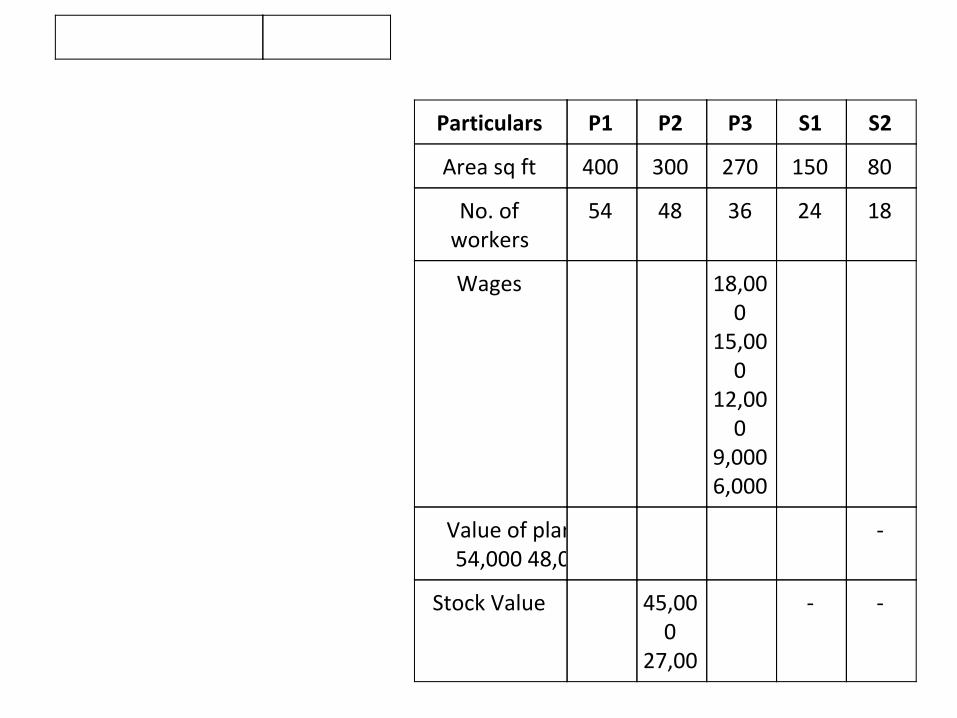
Particulars P1 P2 P3 S1 S2
Area sq ft 400 300 270 150 80
No. of workers
54 48 36 24 18
Wages 18,000
15,000
12,000
9,000 6,000
Value of plan54,000 48,0
-
Stock Value 45,000
27,00
- -

Allocate or apportion the overheads among the various departments on suitable basis.
15
The primary distribution of overheads is as follows
0 18,00
0
Horse power of plant
600 400 300 150 50
Expense/Basis Total P1 P2 P3 S1 S2
Rent (Area sq ft)
6,000 2,000
(6000* 400/1200)
1,500
(6000* 300/1200)
1,350
(6000* 270/1200
)
750
(6000* 150/1200)
400
(6000* 80/1200)
Repair (Plant value)
3,600 1,440 1,080 960 120 Nil
Depreciation (Plant value)
2,700 1,080 810 720 90 Nil

16
Cost Absorption
• The ultimate aim of Overhead Accounting is to absorb them in the product units produced by the firm.
Lighting (Area sq ft)
600 200 150 135 75 40
Supervision (No of workers )
9,000 2,700 2,400 1,800 1,200 900
Fire Insurance for stock
(Stock Value)
3,000 1,500 900 600 Nil Nil
ESI contribution (Wages)
900 270 225 180 135 90
Power (Horse power
of plant)
5,400 2,160 1,440 1,080 540 180
Total 31,200
11,350 8,505 6,825 2,910 1,610

• Thus, the indirect costs or overhead will have to be distributed over the final products so that the charge is complete.
• This process is known as cost absorption or ‘Absorption’ of overheads • It means
costs is absorbed by the production (or product units )during the period or charging
each unit of a product with an equitable share of overhead expenses. • Usually any of
the following methods are adopted for cost absorption- – Direct Material Cost
Percentage
– Direct Labour Cost Percentage
– Prime Cost Percentage
– Direct Labour Hour Rate Method
– Machine Hour Rate, etc.
17
Absorption’ of overheads
• Accurate absorption will help in arriving at accurate cost of production.

• Overheads are indirect costs and hence there are numerous difficulties in charging the overheads to the product units.
• The basis should be selected after careful maximum accuracy of Cost Distribution to various production units.
• The basis should be reviewed periodically and corrective action whatever needed should be taken for improving upon the accuracy of the absorption.
18
Under-absorption and Over absorption of Overhead
• Certain expenses may be

direct expenses for certain costs centres but they are indirect for the production departments. These do not form part of prime cost, but absorbed as overheads.
• The amount of overhead absorbed in costs is the sum total of the overhead costs allotted to individual cost units by application of the
When a predetermined rate worked out on the basis of anticipated or budgeted
overhead and base is applied to the actual base, the amount
absorbed may not be identical with the amount of overhead expenses incurred if
either the actual base or the actual expenses or both deviate from the estimates or the
budget.
overhead rate. 19

Under-absorption and Over absorption of Overhead
Under-absorption
• If the amount absorbed is less than the amount incurred , the difference denotes under absorption.
• It is also termed as 'under recovery'
• It may be due to
– Actual expenses exceeding the estimate; and / or
– Output or the hours worked may be less than the estimate
Over-absorption
• If the amount absorbed is more
than the expenditure incurred this would indicate over-absorption, which goes to inflate the costs.
• Over-absorption is also formed as 'over recovery'.
• It may be due to – Expense being less than
estimate; and / or
– Output or hours worked may be exceeding the estimate
20

Under Costing and Over
Costing • Restaurant bill for most recent get
together
• Product under Absorption: A product consumes a high level of resources but is reported to have a low cost per unit (Joe’s Dinner)
Items
Pizza
Annie
110
Joe
200
Paula
150
James
140
Total
Rs 600
Average
Rs150
Dessert 0 80 40 40 160 Rs 40
Drinks 40 140 80 60 320 80
Total 150 420 270 240 1080 270

• Product Over Absorption: A product consumes a low level of resources but is reported to have a high cost per unit (Annie’s Dinner)
21
Causes of Under or Over Absorption of Overhead
Error in estimating overhead expenses.
Error in estimating the level of production, i.e the base.
Major unanticipated changes in the methods of production.
Unforeseen changes in the production capacity.
Seasonal fluctuations in the overhead
expenses from period to period.
Overhead rate may be applied to the Normal Capacity which may be less than the full operating capacity of the undertaking.
• Example: – if the overheads absorbed on a
predetermined basis are Rs: 1, 00,000 – But the actual overheads incurred are Rs. 1, 20,000,
– There is under-absorption to the extent of Rs.20, 000.

• Example: – If the overhead rate is
predetermined to be $20 per direct labor hour consumed
– But the actual amount should have been $18 per hour
– Then the $2 difference is considered to be over absorbed overhead.
22
What are the strategic consequences of product under costing and over costing?
• Undercosted products – Underpriced-increasing demand-lowering profits (losses)
• Overpricing-products lose market share to competitors
producing similar products
• Product over-costing and

under-costing leads to managerial attention to wrong products
23
Methods of Overhead Absorption
• Direct Material Cost Method • Actual Overhead Cost / Direct Material Cost X 100
• Direct Labour Cost Method • Actual Overhead Cost / Direct Labour Cost X 100
• Prime Cost Method • Budgeted Overhead Expenses / Anticipated Prime Cost
• Direct Labour Hour Method • Overhead Cost / Direct labour Hours
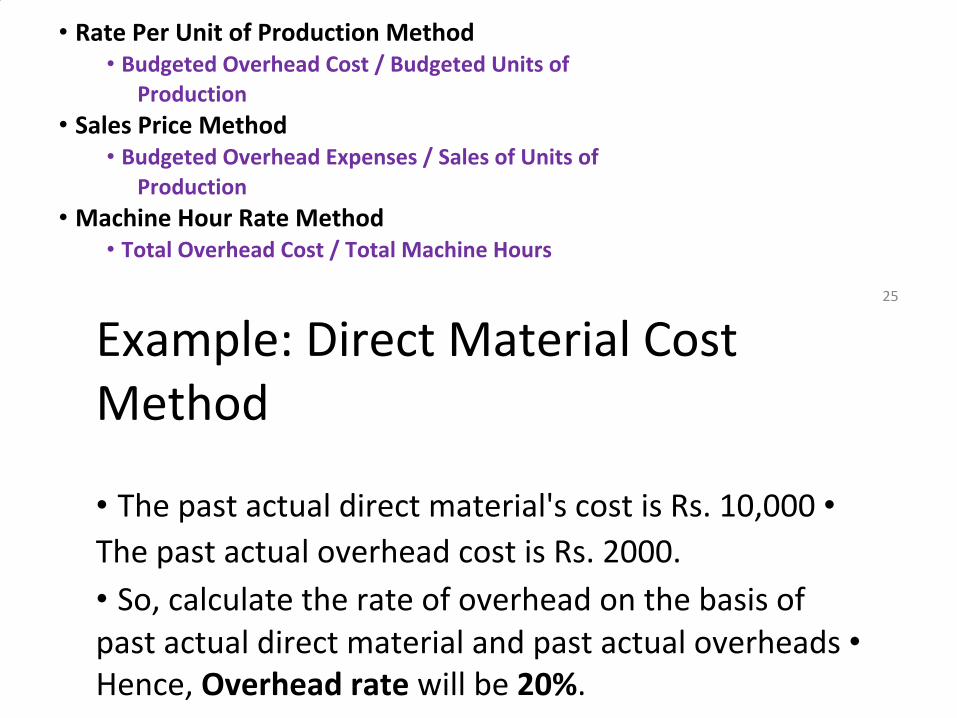
• Rate Per Unit of Production Method • Budgeted Overhead Cost / Budgeted Units of
Production
• Sales Price Method • Budgeted Overhead Expenses / Sales of Units of
Production
• Machine Hour Rate Method • Total Overhead Cost / Total Machine Hours
25
Example: Direct Material Cost Method
• The past actual direct material's cost is Rs. 10,000 • The past actual overhead cost is Rs. 2000.
• So, calculate the rate of overhead on the basis of past actual direct material and past actual overheads • Hence, Overhead rate will be 20%.
(2000/10,000*100) • If we have obtained any specific order for producing any product, we will include the 20% cost of overhead. – Example: • Suppose we have produced one unit for our customer for this and have used our Rs. 1000 material.
• Our overhead cost in it will be Rs. 1000 X 20% = Rs. 200. 26
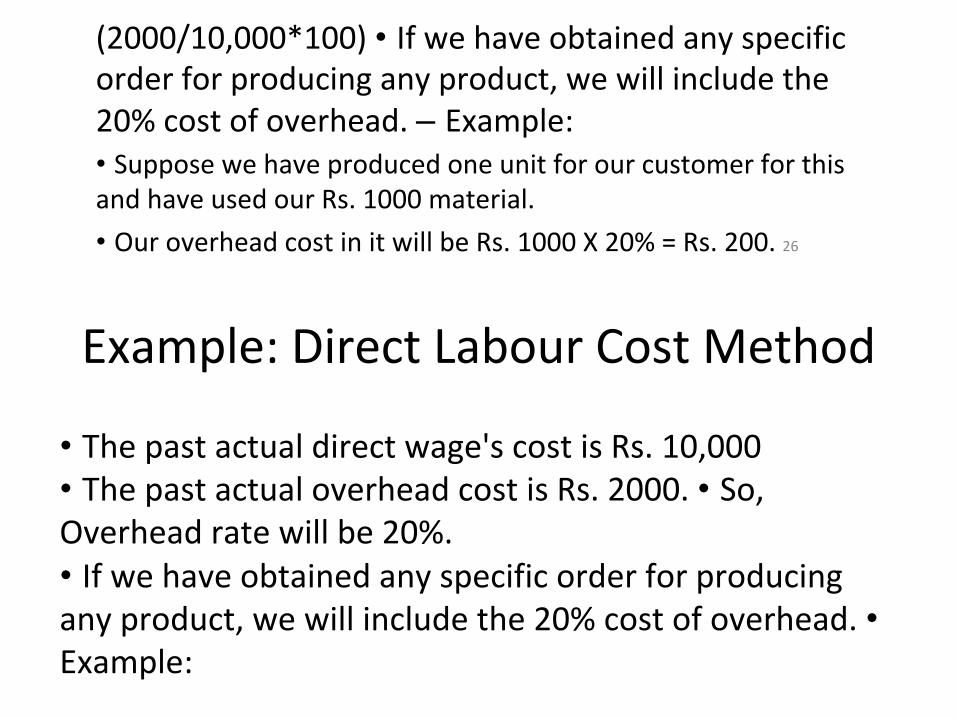
Example: Direct Labour Cost Method
• The past actual direct wage's cost is Rs. 10,000 • The past actual overhead cost is Rs. 2000. • So, Overhead rate will be 20%. • If we have obtained any specific order for producing any product, we will include the 20% cost of overhead. • Example:

• Suppose we have produced one unit for our customer for this, we have paid Rs. 1000 to our laborers for their labour.
• Our overhead cost in it will be Rs. 1000 X 20% = Rs. 200.
27
Conclusion
Allocation and apportionment of overheads and then absorption of overheads helps for finding
total cost of production for better decision making for cost control and cost reduction.

28
References
• http://www.svtuition.org/2012/10/how-to apportion-overhead-costs.html
• http://www.svtuition.org/2012/10/methods of-overhead-absorption.html

29

Meaning:
Cost Accounting: Cost accounting is the classifying, recording and appropriate allocation of expenditure for the determination of the costs of products or services. Cost Accounting is a business practice in which we record, examine, summarize, and study the company’s cost spent on any process, service, product or anything else in the organization. This helps the organization in cost controlling and making strategic planning and decision on improving cost efficiency. It includes the ascertainment of the cost of every order, job, contract, process, service or unit as may be appropriate. It deals with the cost of production, selling and distribution.
Definition of cost accounting:
Cost Accounting may be regarded as “a specialized branch of accounting which involves classification, accumulation, assignment and control of costs.”
The costing terminology of C.I.M.A, London defines cost accounting as “the process of accounting for costs from the point at which expenditure is incurred or committed to the establishment of its ultimate relationship with cost centers and cost units. In its widest usage, it embraces the preparation of statistical data, the application of cost control methods and the ascertainment of profitability of activities carried out or planned”.
Wheldon defines cost accounting as “classifying, recording and appropriate allocation of expenditure for determination of costs of products or services and for the presentation of suitably arranged data purposes of control and guidance of management”. It is thus a formal mechanism by means of which costs of products or services are ascertained and controlled.
Objectives of Cost Accounting:
Cost accounting aims at systematic recording of expenses and analysis of the same so as to ascertain the cost of each product manufactured or service rendered by an organization. Information regarding cost of each product or service would enable the management to know where to economize on costs, how to fix prices, how to maximize profits and so on. Thus, the main objectives of cost accounting are the following.
1. To analyse and classify all expenditure with reference to the cost of products and operations.
2. To arrive at the cost of production of every unit, job, operation, process, department or service and to develop cost standard.

3. To indicate to the management any inefficiencies and the extent of various forms of waste, whether of materials, time, expenses or in the use of machinery, equipment and tools. Analysis of the causes of unsatisfactory results may indicate remedial measures.
4. To provide data for periodical profit and loss accounts and balance sheets at such intervals, e.g. weekly, monthly or quarterly as may be desired by the management during the financial year, not only for the whole business but also by departments or individual products. Also, to explain in detail the exact reasons for profit or loss revealed in total in the profit and loss accounts.
5. To reveal sources of economies in production having regard to methods, types of equipment, design, output and layout. Daily, Weekly, Monthly or Quarterly information may be necessary to ensure prompt constructive action.
6. To provide actual figures of costs for comparison with estimates and to serve as a guide for future estimates or quotations and to assist the management in their price fixing policy.
7. To show, where Standard Costs are prepared, what the cost of production ought to be and with which the actual costs which are eventually recorded may be compared.
8. To present comparative cost data for different periods and various volume of output and to provide guidance in the development of business. This is also helpful in budgetary control.
9. To record the relative production results of each unit of plant and machinery in use as a basis for examining its efficiency. A comparison with the performance of other types of machines may suggest the necessity for replacement.
10. To provide a perpetual inventory of stores and other materials so that interim Profit and Loss Account and Balance Sheet can be prepared without stock taking and checks on stores and adjustments are made at frequent intervals. Also to provide the basis for production planning and for avoiding unnecessary wastages or losses of materials and stores.
Scope of Cost accounting:
Cost accounting refers to the process of determining the cost of a particular product or activity. It provides useful data both for internal and external reports reporting.

Cost Determination: This is the first step in the cost accounting system. It refers to determining the cost for a specific product or activity. This is a critical activity since the other three activities, explained below, depend on it.
Cost Recording: Its is concerned with recording of costs in the cost journal and their subsequent posting to the ledger. Cost recording may be done according to integral or non-integral system a separate set of books is maintained for costing and financial transactions.
Cost Analyzing: It is concerned with critical evaluation of cost information to assist the management in planning and controlling the business activates. Meaningful cost analysis depends largely upon the clear understanding of the cost finding methods used in cost accounting.
The link between Financial Accounting, Cost Accounting and Management Accounting
● Cost accounting is about determining the cost of providing a service or physical product. Once you know your cost, you can decide where you want to price your product/service. (Or perhaps whether you want to provide it at all given the market price.)
● Financial accounting tends to be concerned with reporting to external stakeholders (banks, shareholders, major suppliers etc.). As a result, financial accounts are prepared in keeping with regulated standards which are often very detail oriented.
● Management accounting is about providing information to managers that assists them to make the best decisions about managing the business. Part of this is minimising the delay between the activity and the reporting. Accuracy is often traded for timeliness, and the analysis and commentary on the numbers are paramount. The management accountant performs a type of “translation” service between the numbers and the operations focused managers.
Difference Between Cost Accounting and Financial Accounting
BASIS FOR
COMPARISON COST ACCOUNTING
FINANCIAL
ACCOUNTING
Meaning Cost Accounting is an
accounting system,
through which an
organization keeps the
track of various costs
Financial Accounting is an
accounting system that
captures the records of
financial information about
the business to show the

incurred in the business
in production activities.
correct financial position of
the company at a particular
date.
Information type Records the information
related to material, labor
and overhead, which are
used in the production
process.
Records the information
which is in monetary terms.
Which type of cost
is used for
recording?
Both historical and
pre-determined cost
Only historical cost.
Users Information provided by
the cost accounting is
used only by the internal
management of the
organization like
employees, directors,
managers, supervisors
etc.
Users of information
provided by the financial
accounting are internal and
external parties like
creditors, shareholders,
customers etc.
Valuation of Stock At cost Cost or Net Realizable
Value, whichever is less.
Mandatory No, except for
manufacturing firms it is
mandatory.
Yes for all firms.
Time of Reporting Details provided by cost
accounting are frequently
prepared and reported to
the management.
Financial statements are
reported at the end of the
accounting period, which is
normally 1 year.
Profit Analysis Generally, the profit is
analyzed for a particular
product, job, batch or
process.
Income, expenditure and
profit are analyzed together
for a particular period of the
whole entity.

Difference Between Cost Accounting and Management Accounting
Purpose Reducing and controlling
costs.
Keeping complete record of
the financial transactions.
Forecasting Forecasting is possible
through budgeting
techniques.
Forecasting is not at all
possible.
BASIS OF
COMPARISON COST ACCOUNTING
MANAGEMENT
ACCOUNTING
Meaning The recording,
classifying and
summarising of cost data
of an organisation is
known as cost
accounting.
The accounting in which the
both financial and
non-financial information are
provided to managers is
known as Management
Accounting.
Information Type Quantitative. Quantitative and Qualitative.
Objective Ascertainment of cost of
production.
Providing information to
managers to set goals and
forecast strategies.
Scope Concerned with
ascertainment,
allocation, distribution
and accounting aspects
of cost.
Impart and effect aspect of
costs.

Code of Ethics
● Integrity: A professional accountant should be straightforward and honest in all professional and business relationships.
● Objectivity: A professional accountant should not allow bias, conflict of interest or undue influence of others
● Professional Competence and Due Care: Members are duty bound
to carry out professional work with care and skill and in conformity
with the technical and professional standards prescribed by the
related professional body or legislation of the country. Members are
to accept professional work only within their professional. Competence
Confidentiality: A professional accountant should respect the confidentiality of information acquired as a result of professional and
Specific
Procedure
Yes No
Recording Records past and
present data
It gives more stress on the
analysis of future projections.
Planning Short range planning Short range and long range
planning
Interdependency Can be installed without
management
accounting.
Cannot be installed without
cost accounting.

business relationships and should not disclose any such information to third parties without proper and specific authority unless there is a legal or professional right or duty to disclose. Confidential information acquired as a result of professional and business relationships should not be used for the personal advantage of the professional accountant or third parties. Professional Behavior: A professional accountant should comply with the relevant laws and regulations and should avoid any action that discredits the profession.
Cost Audit
Meaning and Definitions: Cost Audit is a critical review undertaken to verify the correctness of Cost Accounts and to check that cost accounting principles and planning have been efficiently followed. It is noteworthy that India is the only country which has introduced statutory cost audit to regulate about 45 vital industries of the country.
Cost Audit has been defined by the Chartered Institute of Management Accountants (CIMA) of Landon as “the verification of cost accounts and a check on the adherence to the cost accounting plan.”
CWAI defines Statutory Cost Audit as a “system of audit introduced by the Government of India for the review, examination and appraisal of the cost accounting records and added information required to be maintained by the specified industries”.
Objectives of Cost Audit 1. General objectives, 2. Social objectives.

General objectives of Cost Audit The general objectives of cost audit can be enlisted as follows:
1. Detection of errors and frauds.
2. Verification of the adequacy of the books of accounts and the accounting system.
3. Correct valuation of work-in-progress.
4. Verification of the total cost of each product, process, operation, and job.
5. Verification of inter-company transactions and the reasonableness of the price charged for inter-company transfers.
6. Providing assistance to the management by bringing out the deficiencies to its notice and thereby avoid inefficient use of resources like capital, labour, raw material, etc Social Objectives of Cost Audit The cost audit has certain well-defined social objectives, which are as follows:
1. Protection of the interest of the investors and other shareholders.
2. Efficient utilization of resources.
3. Ensuring quality of the functioning of the corporate management.

4. Overall improvement in the socioeconomic structure.
Advantages of Cost Accounting
1. Elimination of Wastes, Losses and Inefficiencies A good cost accounting system eliminates wastes, losses and inefficiencies by fixing standard for everything.
2. Cost Reduction New and improved methods of production are followed under cost accounting system. It leads to cost reduction.
3. Identify the reasons for Profit or Loss A good cost accounting system highlights the reasons for increasing or decreasing profit. If so, the management can take remedial action to maintain profitability of the concern. There is no possibility of shutting down of any product or process or department.
4. Advises on Make or Buy Decision On the basis of cost information, the management can decide whether make or buy a product in open market. The management can rightly choose the best out of many alternatives. Sometimes, spare capacity can be used profitably.
5. Price Fixation The total cost of a product is available in the costing records. It is highly useful for price fixation of a product.
6. Cost Control Budgets are prepared and standards are fixed under cost accounting system. The expenses are not permitted beyond the budget amount. The actual performance is compared with standard to find the variation. If there is any variation, reasons are find out and the management can exercise control. Period to period cost comparison also helps cost control.
7. Assist the Government Government can collect reasonable tax from the company and exercise price control.

8. Fixation of Responsibility Responsibility centers are fixed under cost accounting system. If responsibility is fixed, it becomes difficult to evade responsibility of performance and leads to effective performance.
9. Helps to Prepare Financial Accounts The information like value of closing materials, work in progress and finished goods are necessary to prepare financial accounts. This information is supplied by the costing records and helps to prepare financial accounts without any further delay.
10. Prevention of Frauds Introducing cost audit can prevent frauds. If so, correct and reliable data was available from the costing records which are highly useful to the government, share holders, the creditors and the like.
Limitations of Cost Accounting
1.The cost of previous year is not same in the succeeding year. Hence, cost data are not highly useful.
2. The cost is ascertained on the basis of full utilization of capacity. If capacity is partly utilized, the cost may not be true.
3. Installation of Cost Accounting System requires the maintenance of many costing records. If results in heavy expenditure. 4. Delay in receiving costing information does not result in taking quality decision by the management.
5. Rigid Cost Accounting System does not serve all purposes.
6. Cost Accounting fails to solve the problems relating to work study, time and motion study and operation research.
7. Financial character expenses are not included for cost calculation. Hence, the calculated cost is not correct always.
COST CONCEPTS AND CLASSIFICATIONS

Concept of Cost:
According to the Chartered Institute of Management Accountants, cost
is “the amount of expenditure (actual or notional) incurred on or
attributable to a specified thing or activity.” Similarly, according to
Anthony and Wilsch “cost is a measurement in monetary terms of
the amount of resources used for some purposes.”
cost means the total of all expenses incurred for a product or a service.
Classification of Cost:
Classification of costs implies the process of grouping costs according to
their common characteristics. A proper classification of costs is absolutely
necessary to mention the costs with cost centers. Usually, costs are
classified according to their nature, viz., material, labour, over-head, among
others.
The following chart shows the various elements of cost and how they are classified.

Direct or Indirect Materials The materials directly contributed to a product and those easily identifiable in the finished product are called direct materials. For example, paper in books, wood in furniture, plastic in water tank, and leather in shoes are direct materials. They are also known as high-value items. Other lower cost items or supporting material used in the production of any finished product are called indirect material. For example, nails in shoes or furniture.
Direct Labour Any wages paid to workers or a group of workers which may directly co-relate to any specific activity of production, supervision, maintenance, transportation of material, or product, and directly associate in conversion of raw material into finished goods are called direct labor. Wages paid to trainee or apprentices does not comes under category of direct labor as they have no significant value.
Overheads are classified as:
● Production or manufacturing overheads ● Administrative expenses ● Selling Expenses ● Distribution expenses ● Research and development expenses
Cost, Costing and Cost Accountancy
Cost, costing, and cost accounting, are normally used interchangeably but they are not synonyms of each other. The meaning of these terms is related and similar but there are differences.
Cost is a sacrificed resource to obtain something.
Costing is a process of determining costs. It may be called a technique for ascertaining the cost of production of any product or service in the business organization.
Cost accounting is a technique to assist management in establishing various budgets, standards; etc Cost Accounting is basically the next step to costing.
Cost accounting involves the preparation of various budgets for an organization, determining standard costs based on technical estimates, finding and comparing with actual costs, ascertaining the reasons of

by variance analysis etc.
Cost Centre A cost centre is a type of responsibility centre that is called accountable for the
incurrence of the costs, which are under its control. Cost centers are typical business units that incur costs but only indirectly contribute to revenue generation. cost center is an organizational subunit that incurs cost but does not directly contribute to the company’s profits. In fact, a cost center may not generate any revenues at all.
For example, company’s legal department, accounting department, research and development, advertising, marketing, and customer service a cost center. The managers in charge of these departments can control and contain costs – and they are evaluated on their ability to control and contain costs.
Cost Unit A cost unit refers to the unit of quantity of product, service or time (or combination of these) in relation to which costs may be ascertained or expressed. While preparing cost statements and accounts, a specific measurement
unit is required to be chosen, so as to identify the expenses accurately and allocate
the cost conveniently and in this way, cost unit comes into the picture. A cost unit is unit of a product or a service to which production costs can be traced. It is important to identify cost unit in order to properly charged the costs incurred in every production processes.
For example,
Metre or Kilometre Cable, Rope, Road Construction, Wire
Tonne Iron and steel, Sugar, Cement, Mines and Quarries
Litre, Kilogram, Tonne Chemicals
Cubic Metre Gas, Casting
Square Metre Metal Plating,

Unit IV -Labour cost
Labour cost is a significant element of cost specially in an organisation using more manual operations. It is the cost of human endeavour in the product and requires coordinated efforts for its control. The management objective of keeping labour cost as low as possible is achieved by balancing productivity with wages. Low labour cost is possible by giving substantial increase in wages against corresponding increase in productivity.
Labour cost is a vital factor not only affecting the cost of production but also industrial relations of the organization. No organization can expect to attract and attain qualified and motivated employees unless it pays them fair remuneration. Employee remuneration therefore influences vitally the growth and profitability of the company. For employees remuneration is more than a means of satisfying their physical needs.
Classification of labour cost
CLA CLASSIFICATION OF LABOUR COST SSIFICATION OF LABOUR COST
The total labour cost can be classified as follows:
(a) Direct labour costs:-
Direct labour cost is that portion of wages or salaries which can be identified with and charged to a single costing unit. It can be easily identified with and charged to a single costing unit as there is a direct relationship with the product/process. Direct labour cost can be easily calculated and is quite significant in amount.
(b) Indirect labour costs:-
It refers to labour expended that does not alter the construction, conformation, composition or condition of the product, but which contributes generally to such work and to the completion of the product and its progressive movement and handling up to the point of dispatch. In other words, labour employed for the purpose of carrying out tasks incidental to goods produced or services provided is regarded as indirect labour. Wages or salaries paid to foremen, supervisors,

inspectors, clerks, store-keepers, managers, accountants, salesmen, directors, etc., are examples of indirect labour cost..
Labour Turnover
Definition: Labour turnover can be defined as the overall change in the number of people employed in a business entity during a particular period. It takes into consideration the number of exiting personnel, new joinees and the total number of workers as listed in the payroll at the end of a given period.
It is a common feature in any concern that some employees leave the concern and others join it. Workers
change the job either for personal betterment or for better working conditions or due to compulsion. Labour turnover is the ratio of the number of persons leaving in a period to the average number employed. It is the change in the composition of the labour force in an organisation. It can be measured by relating the
engagements and losses in the labour force to the total number employed at the beginning of the period. All the losses must be taken into account regardless of the cause for leaving.
Causes of labour turnover:
The main causes of labour turnover in an organisation/industry can be broadly
classified under the following three heads:
a. Personal Causes
b. Unavoidable Causes, and

c. Avoidable Causes
(a) Personal causes are those which induce or compel workers to leave their jobs such causes
includes the following:
i. Change of jobs for betterment.
ii. Premature retirement due to ill health or old age.
iii. Domestic problems and family responsibilities.
iv. Discontentment over the jobs and working environment.
In all the above cases the employee leaves the organisation at his will and, therefore, it is difficult to
suggest any possible remedy in the first three cases. But the last one can be overcome by creating
conditions leading to a healthy working environment. For this, officers should play a positive role and
make sure that their subordinates work under healthy working conditions.
(b) Unavoidable causes are those under which it becomes obligatory on the part of management to
ask some or more of their employees to leave the organisation, such causes are summed up as
listed below :
i. Seasonal nature of the business;
ii. Shortage of raw materials, power, slack market for the product etc :
iii. Change in the plant location;
iv. Disability, making a worker unfit for work;
v. Disciplinary measures;
vi. Marriage (generally in the case of women).
(c) Avoidable causes are those which require the attention of management on a continuous basis
so as to keep the labour turnover ratio as low as possible. The main causes under this case are
indicated below;
i. Dissatisfaction with job, remuneration, hours of work, working conditions, etc
ii. Strained relationship with management, supervisors or follow workers;
iii. Lack of training facilities and promotional avenues;
iv. Lack of recreational and medical facilities;
v. Low wages and allowances.
Proper and timely management actions reduce the labour turnover appreciably so far as avoidable
causes are concerned.
Effects of Labour Turnover
It increases cost of production due to the following reasons:
(i) Cost of selecting/replacing workers
(ii) Cost of training imparted to new workers
(iii) Production planning cannot be properly executed and this results in production loss
(iv) Loss due to defectives and wastage
(v) Loss due to mishandling of tools, equipments, breakages, etc.


Materials cost – unit III Materials: - The materials are a major part of the total cost of producing a product and are one of the most important assets in majority of the business enterprises. Hence the total cost of a product can be controlled and reduced by efficiently using materials.
The materials are of two types, namely:
(i) Direct materials: The materials which can be easily identified and attributable to the individual units being manufactured are known as direct materials. These materials also form part of finished products. All costs which are incurred to obtain direct materials are known as direct material costs.
(ii) (ii) Indirect materials: Indirect materials, on the other hand, are those materials which are of small value such as nuts, pins, screws, etc. and do not physically form part of the finished product. Costs associated with indirect materials are known as indirect material costs. Meaning of material control (EEE economy, efficiency and effectiveness) Material control can be defined as a comprehensive framework for the accounting and control of material cost designed with the object of maintaining material supplies at a level so as to ensure a uninterrupted production but at the same time minimising investment of funds in material. In simple Inventory control is the systematic control and regulation of purchase, storage and usage of materials in such a way as to maintain an even flow of production and at the same time avoiding excessive investment in materials Material control is accomplished through functional organisation, assignment of responsibility And documentary evidence obtained in various stages of operation from the approval of sales and production budget to the completion of products which are ready for sale and shipment. Material cost can be properly controllable using planning, purchasing, handling and accounting.

Efficient material control reduces loses and wastages of materials. Because materials constitute a significant part of the total production and cost of a product Material control is a planned method of determining what to indent, so that purchasing and storing cost are minimum without affecting production or sales.
Purchasing Control and Procedure: Purchasing is an art. Wrong purchases increase the cost of materials, store equipments and the finished goods. Hence it is imperative that purchases should be effectively, efficiently and economically performed. Methods of Purchasing : Purchasing can be broadly classified as centralized and localized purchasing. (a) Centralized Purchasing: In a large organization,
manufacturing units are many. In such cases centralized purchasing is beneficial.
(b) Decentralization of Purchases: this means purchasing separately according to the requirement s of the each department. Purchase Procedure: 1. Indenting for materials(requisition from each dept) 2. Issue of tenders to suppliers 3. Placing of purchase orders 4. Inspection 5. Receiving Stores(Receipt note no) 6. Checking and passing of bills for payment
OBJECTIVES OF INVENTORY CONTROL: Scientific control of materials should serve the following purposes:
(i) To provide continuous flow of required materials, parts and components for efficient and uninterrupted flow of production.
(ii) To minimize investment in inventories keeping in view operating requirements.

(iii) To provide for efficient store of materials so that inventories are protected from loss by fire and theft and handling time and cost are kept at a minimum.
(iv) To keep surplus and obsolete items to minimum.
TECHNIQUES OF INVENTORY CONTROL
ABC( ALWAYS BETTER CONTROL ) ANALYSIS: ABC plan is based upon segregation of materials for selection control. It measures the money value, i.e., cost significance of each material item in relation to total cost and material value.
Under ABC Analysis, the materials in stock are divided into three categories for the purpose of control. Generally it is seen that the materials which constitute the least percentage of items in stock may contribute to a large percentage of value and a large percentage of items may represent a smaller percentage of value of items consumed. Between these two items are those items, the percentage of which is more or less equal to their value in consumption.
Items falling in the first category are treated as ‘A’ items, of the second category as ‘B’ items and items of the third category are taken as ‘C’ items. Such an analysis of material is known as ABC analysis. This technique of stock control is also known as stock control according to value method or Always Better Control method or Proportional Parts Value Analysis method. Thus, under this technique of material control, materials are listed in ‘A’, ‘B’ and ‘C’ categories in descending order based on money value of consumption.
The logic behind this kind of analysis is that the management should study each item of stock in terms of its usage, lead time, technical or other problems and its relative money value in the total investment in inventories. Under ABC analysis, the different items of stock may be ranked in order of their average material investment or on the basis of their annual rupee usage.
If it is convenient different items may be classified into only three categories and labelled as A, B, and C respectively depending upon whether they are high value items, middle value items or low value items.

Requisitioning for Stores:
One of the duties of the storekeeper is to send requisitions for materials for replenishment in time so that the production is not held up due to shortage of materials. The storekeeper should also see that there is no unnecessary blocking of capital due to overstocking of materials. For this he keeps a check on the re-order level, economic ordering quantity, and the maximum and minimum quantity which he is authorized to store in respect of each kind of material.
Re-ordering Level : Re-ordering level is that point of level of stock of a material where the storekeeper starts the process of initiating purchase requisition for fresh supplies of those materials. This level is fixed somewhere between the maximum and minimum levels in such a way that the difference of quantity of the material between the re-ordering level and minimum level will be sufficient to meet the requirements of production until the fresh supply of the materials is received.
Economic Ordering Quantity: The quantity of material to be ordered at one time is known as economic ordering quantity. This quantity is fixed in such a manner as to minimize the cost of ordering and carrying the stock. The total costs of a material usually consist of: Total acquisition cost + total ordering cost + total carrying cost. Since the acquisition cost per unit of material is same whatever is the quantity purchased, it is usually excluded when deciding the quantity of a material to be ordered at one time. The only costs to be taken
Re-ordering Level= Minimum Level + Consumption during the time required to get the fresh delivery Re-ordering Level= Maximum Level x Miximum re-order period

care of are the ordering costs and carrying costs which vary with the quantity ordered.
Minimum Level or Safety Stock level: The minimum level is the minimum quantity of the material which must be maintained in hand at all times. The quantity is fixed so that the production is not held up due to shortage of the materials. In fixing this level, the following factors should be considered: 1. Lead time i.e. time lag between indenting and receiving of the material. It is the time required to replenish the supply. 2. Rate of consumption of the material during the lead time. 3. Nature of the material. Minimum level is not required in case of a special material which is required against customer’s specific order. Formula for calculating minimum level or safety stock level given by Wheldon is as follows:
Maximum Level: It is the maximum of stock which should be held in stock at any time during the year. The quantity is fixed so as to avoid overstocking as it leads to the following disadvantages.
Q = 2CO I Q = Quantity to be ordered C = Consumption of the material concerned in units during a year. O = Cost of placing one order including the cost of receiving the goods i.e. the cost of getting an item into the firms inventory I = Interest payment including variable cost of storing per unit per year i.e. holding costs of inventory.
Minimum Stock Level = Re-ordering level – (Normal consumption x Normal Re-order period)

1. Overstocking leads to increase in working capital requirement which could be profitable used somewhere else. 2. Overstocking will need more godown space, so more rent will have to be paid. 3. It may also lead to obsolescence on account of overstocking. 4. There are chances that the quality of materials will deteriorate because large stock will require more time before they are consumed. 5. There may be fear of depreciation in market values of the overstocked materials. According to Wheldon,
Danger Level :This level means that level of stock at which normal issues of the material are stopped and issues are made only under specific instructions. The purchase officer will make special arrangements to get the materials which reach at their danger levels so that the production may not stop due to shortage of materials.
Average Stock Level: The average stock level is calculated by the following formula:
Maximum Stock level = Reordering level + Re-ordering Quantity – (Minimum consumption x Minimum re-ordering period)
Danger Level = Average consumption x Max.re-order period for emergency purchases.
Average Stock Level = Minimum Stock Level + ½ of Re-order Quantity. Or ½ (Minimum Stock Level + Maximum Stock Level)

Problems
1. Calculate the ordering level of material A from the following particulars: Minimum Limit 1,000 units.
Maximum Limit 5,000 units. Daily requirement of material 200 units. Time required for fresh delivery 10 days. (Answer: 3,000 units)
2. Calculate the re-ordering level from the following information: Maximum consumption = 500 units per day Minimum consumption = 400 units per day Re-order period = 10 to 12 days (Answer: 6000 units)
3. Maximum consumption = 300 units per day Minimum consumption = 200 units per day Re-order period = 8 to 10 days
(Answer: 3,000 units)
4. Annual Usage : 6,000 units Cost of material per unit : Rs. 20 Cost of placing and receiving one order : Rs. 120
Annual carrying cost of one unit: 10% of inventory value. Find out the economic ordering quantity (Answer: 849 units)
5. Given annual consumption of a material is 1800 units, ordering costs are Rs.2 per order, Price per unit of material is 32 Paise and storage cost are 25% per annum of stock value . Find out the economic ordering quantity(EOQ).
6. Find out the economic ordering quantity (EOQ) from the following
particulars. Annual usage: 6000 units Cost of material per unit: Rs. 20 Cost of Placing and receiving one order: Rs.60 Annual carrying cost of one unit: 10% of inventory value. (Answer: 600 units)

7. Annual Usage : 1,20,000 units Cost of placing and receiving one order : Rs. 60 Annual carrying cost of one unit: 10%
(Answer: 12,000 units)
8. Annual Requirement of raw material : 6,0000 units
Ordering cost : Rs.600 Opportunity cost(cost of capital) of investment Re.1 per unit. Cost of deterioration, taxes, insurance, supervision cost Re.1 per unit. Calculate EOQ and number of orders to be placed and total cost of EOQ by applying formula from the above particulars. (Answer: 6000 units; 10 ORDERS ;Rs.12,000)
9. An industry currently is adopting and optimum purchase policy in
meeting annual inventory requirement of 100000 bags. Purchasing price per bag is rupees 20. The cost records project that it holding cost of 20% of original cost and repurchases cost of Rs. 500. The supplier is providing a discount facility of rupees 0.5 % if a purchased lot contains 10000 bags. you are asked to choose the most economic purchase lot between the above two alternative.
(Answer: second alternative as it is costing less)
10.Calculate the Minimum stock level Maximum stock level, Average stock level and Reordering level from the following information:
● Maximum consumption= 150 units per day ● Minimum consumption= 100 units per day ● Normal consumption= 120 units per day ● Reorder period= 10 to 15 days ● Reorder quantity 1500 units ● Normal period = 12 days
( Answer; Reordering level- 2,250 units; Minimum stock level- 810 units Maximum stock level -2,750 units Avg stock level 1560 units)

11. Two components A and B are used as follows: Normal Usage 50 units per week each Minimum Usage 25 units per week each Maximum usage 75 units per week each Reorder quantity A: 300 units
B: 500 units Reorder period A: 4 to 6 weeks
B: 2 to 4 weeks Calculate (i) Re- order level (ii) Minimum level and Maximum level (iii) Average stock level. (Answer (i) A-450 units B-300 units; (ii) A-200;B-150units; A-650;B-750 units (iii) A-350; B-400 units)
12.From the following particulars calculate (a) Re- order level(b) Minimum level(c) Maximum level.
Normal Usage 100 units per day Minimum Usage 60 units per day
Maximum usage 130 units per day EOQ 5,000 units Reorder period 25 to 30 days (Answer: 3,900 units; 1,150 units; 7,400 units)
13. You have been asked to calculate the following levels for part No. 80 90 13 from the following information.
(a) Re-ordering level (b) Maximum level (c) Minimum level (d)Danger level (e) Average Stock Level (f) Re- order quantity or EOQ
The Re -ordering quantity is to be calculated from the following data 1. Total cost of purchasing relating to the order= Rs. 20 2. Number of units to be produced during the year= Rs. 5000 3. Purchase price per unit including transportation cost= Rs 50 4. Annual cost of storage of one unit = Rs. 5
Lead Times Average = 10 days maximum= 15 days

minimum= 6 days maximum for emergency purchase= 4 days minimum consumption= 15 units per day maximum consumption= 20 units per day. (ANS: 300; 410; 125; 70; 225; 200)
14. P. Ltd. uses three types of materials A, B & C for production of X, the final product.
The relevant monthly data for the components are as given below:
Calculate for each component:
(a) Re-order level (b) Minimum level c) Maximum level (d) Average stock level
(Answer: Re-order level 900;1000;810 Minimum level 400;475;360 Maximum level 1450;1600;1350; Average stock level 775;925;720)
15. In a factory component A is used as follows: Normal usage – 50 kg per week Minimum usage – 25 kg per week Maximum usage – 75 kg per week Re-order quantity 300 kg. Re-order period 4 to 6 weeks. Calculate for component A: (i) Re-order level,(ii) Maximum level.(iii) Minimum level; and(iv) Average stock level.
(ANS: 450; 650; 200;3 50)
16. two material X and Yare used as follows: calculate Minimum level, Maximum level, Re-order level& Average stock level

Normal usage – 100 kg per week ordering quantity: X- 600 units ; Y- 1000 Units Minimum usage – 50 kg per week Delivery period : X – 4 to 6 ; Y- 2 to 6 weeks Maximum usage 150 Kg per week
(Answer: 400;300, 1,300;1,500, 900;600, 700;800)
1. The following are the inventory details of Sri Mils for the month of October 2019. Prepare Stores Ledger Account and calculate value of closing stock as per FIFO and LIFO method
Date Transactions Units Price per Unit
1-October Opening Stock 1100 30
7-October Purchases 700 32
15-October Issued for Consumption 600 -
16-October Purchases 500 35
20-October Issued for Consumption 1300 -
29-October Purchases 750 37
31-October Issued for Consumption 475 -
(Answer: FIFO-Value of Closing Inventory= 675 x 37 = 24,975; LIFO- Value of Closing Inventory= 400 x 30+ 275 x 37 = 22,175)
2. From the following transaction occur in the Purchase and issue of material from the information given below prepare the stores ledger account by adopting First in First out method and Last in First out method. January 2nd purchase 4000 units @ rupees 4 unit January 20 purchase 500 units @ 5 per unit February 5th issued 2,000 units February 10th purchase 6000 units at the rate of 6 per unit February 12th issued 4000 units March 2nd issued 1000 units March 5th issued 2,000 units March 15th purchase 4500 units @ 5.5 unit March 20th issued 3000 units
(Answer FIFO: value of closing stock 3000 units @ Rs.5.50=16,500
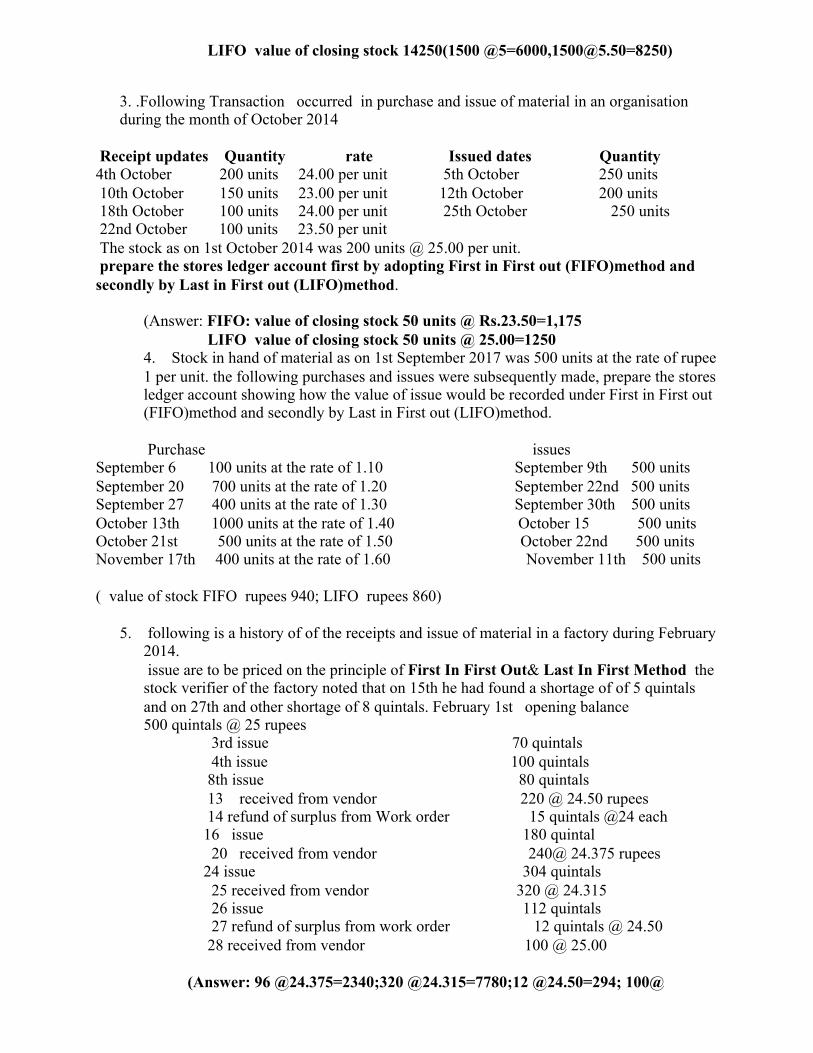
LIFO value of closing stock 14250(1500 @5=6000,[email protected]=8250)
3. .Following Transaction occurred in purchase and issue of material in an organisation during the month of October 2014
Receipt updates Quantity rate Issued dates Quantity 4th October 200 units 24.00 per unit 5th October 250 units 10th October 150 units 23.00 per unit 12th October 200 units 18th October 100 units 24.00 per unit 25th October 250 units 22nd October 100 units 23.50 per unit The stock as on 1st October 2014 was 200 units @ 25.00 per unit. prepare the stores ledger account first by adopting First in First out (FIFO)method and secondly by Last in First out (LIFO)method.
(Answer: FIFO: value of closing stock 50 units @ Rs.23.50=1,175 LIFO value of closing stock 50 units @ 25.00=1250 4. Stock in hand of material as on 1st September 2017 was 500 units at the rate of rupee 1 per unit. the following purchases and issues were subsequently made, prepare the stores ledger account showing how the value of issue would be recorded under First in First out (FIFO)method and secondly by Last in First out (LIFO)method.
Purchase issues September 6 100 units at the rate of 1.10 September 9th 500 units September 20 700 units at the rate of 1.20 September 22nd 500 units September 27 400 units at the rate of 1.30 September 30th 500 units October 13th 1000 units at the rate of 1.40 October 15 500 units October 21st 500 units at the rate of 1.50 October 22nd 500 units November 17th 400 units at the rate of 1.60 November 11th 500 units ( value of stock FIFO rupees 940; LIFO rupees 860)
5. following is a history of of the receipts and issue of material in a factory during February
2014. issue are to be priced on the principle of First In First Out& Last In First Method the stock verifier of the factory noted that on 15th he had found a shortage of of 5 quintals and on 27th and other shortage of 8 quintals. February 1st opening balance 500 quintals @ 25 rupees 3rd issue 70 quintals 4th issue 100 quintals 8th issue 80 quintals 13 received from vendor 220 @ 24.50 rupees 14 refund of surplus from Work order 15 quintals @24 each 16 issue 180 quintal 20 received from vendor 240@ 24.375 rupees 24 issue 304 quintals 25 received from vendor 320 @ 24.315 26 issue 112 quintals 27 refund of surplus from work order 12 quintals @ 24.50 28 received from vendor 100 @ 25.00 (Answer: 96 @24.375=2340;320 @24.315=7780;12 @24.50=294; 100@

5.00=2500) 6.From the following transactions calculate the cost of closing inventory using FIFO and LIFO and Weighted Average method.
Date Transactions Units Price per Unit
1 July 2019 Opening balance brought forward 2000 10
15 July 2019 Purchases 1000 15
31 July 2019 Purchases 800 11
1 August 2019 Sales 2400 -
15 August 2019 Sales 1000 -
16 August 2019 Purchases 800 15
30 August 2019 Sales 1000 -
FIFO method under perpetual and periodic inventory systems respectively:
(Answer: FIFO : Closing Inventory = 200 Units x 15 = 3,000;LIFO:Closing Inventory = 200 Units x 10 = 2,000; Weighted average method: Ending Inventory = 200 X 13.84 = 2,768)
7 Akshita limited started its business on 1st January, 2015. It purchased and used raw material during the month of January in 2015 as follows:
1 January: Opening Stock 500 kgs @ 60 per kg 5 January: Purchased 800 kgs @ 62 per kg 10 January: Issued 600 kgs 12 January: Purchased 1,200 kgs @ 57 per kg 18 January: Issued 1000 kgs 21 January: Issued 500 kgs 25 January: Purchased 900 kgs @ 65 per kg 28 January: Issued 800 kgs Calculate the value of closing stock according to LIFO, FIFO and Weighted Average.
(Answer: FIFO Value of Closing Stock = 500 Units @65 per unit = 32,500:;LIFO:Closing Inventory = 400 X 60 + 100X 65 = 30,500; Weighted average method: Ending Inventory = 500 Units @63.018 per unit = 31,509 Units @63.018 per unit = 31,509)
8.From the following details of Store receipt and issue of material in a manufacturing unit prepare stock ledger using weighted average method of valuation: 1st November opening stock 2000 units @ 5.00 each 3rd November issue 1500 units to production 4th November receive 5400 units @ 6.00 each 8th November issued 1600 units to production 9th November return to store 100 units by Production department ( from the issue of 3rd Nov)

16th November received 2400 units @ 6.50 19th November return to supplier 200 units out of the quantity received on November 4th 21st November receive 1000 units @ 7.00 24th November issued to production 2100 units 27th November Receive 1200 units at the rate of 7.50 each 29th November issue to production 2,800 units ( use rates upto 2 decimal places)
(Answer: 3000@19,558)

Materials cost – unit III
Materials: - The materials are a major part of the total cost of producing
a product and are one of the most important assets in majority of the
business enterprises. Hence the total cost of a product can be controlled
and reduced by efficiently using materials.
The materials are of two types, namely:
(i) Direct materials: The materials which can be easily identified and
attributable to the individual units being manufactured are known
as direct materials. These materials also form part of finished
products. All costs which are incurred to obtain direct materials
are known as direct material costs.
(ii) (ii) Indirect materials: Indirect materials, on the other hand, are
those materials which are of small value such as nuts, pins, screws,
etc. and do not physically form part of the finished product. Costs
associated with indirect materials are known as indirect material
costs. Meaning of material control (EEE economy, efficiency and
effectiveness)
Material control can be defined as a comprehensive framework for
the accounting and control of material cost designed with the
object of maintaining material supplies at a level so as to ensure a
uninterrupted production but at the same time minimising
investment of funds in material. In simple Inventory control is the
systematic control and regulation of purchase, storage and usage of
materials in such a way as to maintain an even flow of production
and at the same time avoiding excessive investment in materials
Material control is accomplished through functional organisation,
assignment of responsibility And documentary evidence obtained
in various stages of operation from the approval of sales and
production budget to the completion of products which are ready
for sale and shipment. Material cost can be properly controllable
using planning, purchasing, handling and accounting.

Efficient material control reduces loses and wastages of materials.
Because materials constitute a significant part of the total production and
cost of a product Material control is a planned method of determining
what to indent, so that purchasing and storing cost are minimum without
affecting production or sales.
Purchasing Control and Procedure: Purchasing is an art. Wrong
purchases increase the cost of materials, store equipments and the
finished goods. Hence it is imperative that purchases should be
effectively, efficiently and economically performed.
Methods of Purchasing : Purchasing can be broadly classified as
centralized and localized purchasing.
(a) Centralized Purchasing: In a large organization,
manufacturing units are many. In such cases centralized
purchasing is beneficial.
(b) Decentralization of Purchases: this means purchasing
separately according to the requirement s of the each
department.
Purchase Procedure:
1. Indenting for materials(requisition from each dept)
2. Issue of tenders to suppliers
3. Placing of purchase orders
4. Inspection
5. Receiving Stores(Receipt note no)
6. Checking and passing of bills for payment
OBJECTIVES OF INVENTORY CONTROL: Scientific control of
materials should serve the following purposes:
(i) To provide continuous flow of required materials, parts and
components for efficient and uninterrupted flow of production.
(ii) To minimize investment in inventories keeping in view operating
requirements.

(iii) To provide for efficient store of materials so that inventories are
protected from loss by fire and theft and handling time and cost are kept
at a minimum.
(iv) To keep surplus and obsolete items to minimum.
TECHNIQUES OF INVENTORY CONTROL
ABC( ALWAYS BETTER CONTROL ) ANALYSIS: ABC plan is
based upon segregation of materials for selection control. It measures the
money value, i.e., cost significance of each material item in relation to
total cost and material value.
Under ABC Analysis, the materials in stock are divided into three
categories for the purpose of control. Generally it is seen that the
materials which constitute the least percentage of items in stock may
contribute to a large percentage of value and a large percentage of items
may represent a smaller percentage of value of items consumed.
Between these two items are those items, the percentage of which is
more or less equal to their value in consumption.
Items falling in the first category are treated as ‘A’ items, of the second
category as ‘B’ items and items of the third category are taken as ‘C’
items. Such an analysis of material is known as ABC analysis. This
technique of stock control is also known as stock control according to
value method or Always Better Control method or Proportional
Parts Value Analysis method. Thus, under this technique of material
control, materials are listed in ‘A’, ‘B’ and ‘C’ categories in descending
order based on money value of consumption.
The logic behind this kind of analysis is that the management should
study each item of stock in terms of its usage, lead time, technical or
other problems and its relative money value in the total investment in
inventories. Under ABC analysis, the different items of stock may be
ranked in order of their average material investment or on the basis of
their annual rupee usage.
If it is convenient different items may be classified into only three
categories and labelled as A, B, and C respectively depending upon
whether they are high value items, middle value items or low value
items.

Requisitioning for Stores:
One of the duties of the storekeeper is to send requisitions for
materials for replenishment in time so that the production is not
held up due to shortage of materials. The storekeeper should also
see that there is no unnecessary blocking of capital due to
overstocking of materials. For this he keeps a check on the re-order
level, economic ordering quantity, and the maximum and
minimum quantity which he is authorized to store in respect of
each kind of material.
Re-ordering Level : Re-ordering level is that point of level of stock
of a material where the storekeeper starts the process of initiating
purchase requisition for fresh supplies of those materials. This level is
fixed somewhere between the maximum and minimum levels in such
a way that the difference of quantity of the material between the re-
ordering level and minimum level will be sufficient to meet the
requirements of production until the fresh supply of the materials is
received.
Re-ordering Level= Minimum Level + Consumption during the time required to get the fresh delivery Re-ordering Level= Maximum Level x Miximum re-order period
Economic Ordering Quantity: The quantity of material to be ordered at one time is known as economic ordering quantity. This quantity is fixed in such a manner as to minimize the cost of ordering and carrying the stock. The total costs of a material usually consist of: Total acquisition cost + total ordering cost + total carrying cost. Since the acquisition cost per unit of material is same whatever is the quantity purchased, it is usually excluded when deciding the quantity of a material to be ordered at one time. The only costs to be taken

care of are the ordering costs and carrying costs which vary with the quantity ordered.
Q = 2CO I Q = Quantity to be ordered C = Consumption of the material concerned in units during a year. O = Cost of placing one order including the cost of receiving the goods i.e. the cost of getting an item into the firms inventory I = Interest payment including variable cost of storing per unit per year i.e. holding costs of inventory.
Minimum Level or Safety Stock level: The minimum level is the minimum quantity of the material which must be maintained in hand at all times. The quantity is fixed so that the production is not held up due to shortage of the materials. In fixing this level, the following factors should be considered: 1. Lead time i.e. time lag between indenting and receiving of the material. It is the time required to replenish the supply. 2. Rate of consumption of the material during the lead time. 3. Nature of the material. Minimum level is not required in case of a special material which is required against customer’s specific order. Formula for calculating minimum level or safety stock level given by Wheldon is as follows:
Minimum Stock Level = Re-ordering level – (Normal consumption x Normal Re-order period)
Maximum Level: It is the maximum of stock which should be held in stock at any time during the year. The quantity is fixed so as to avoid overstocking as it leads to the following disadvantages.
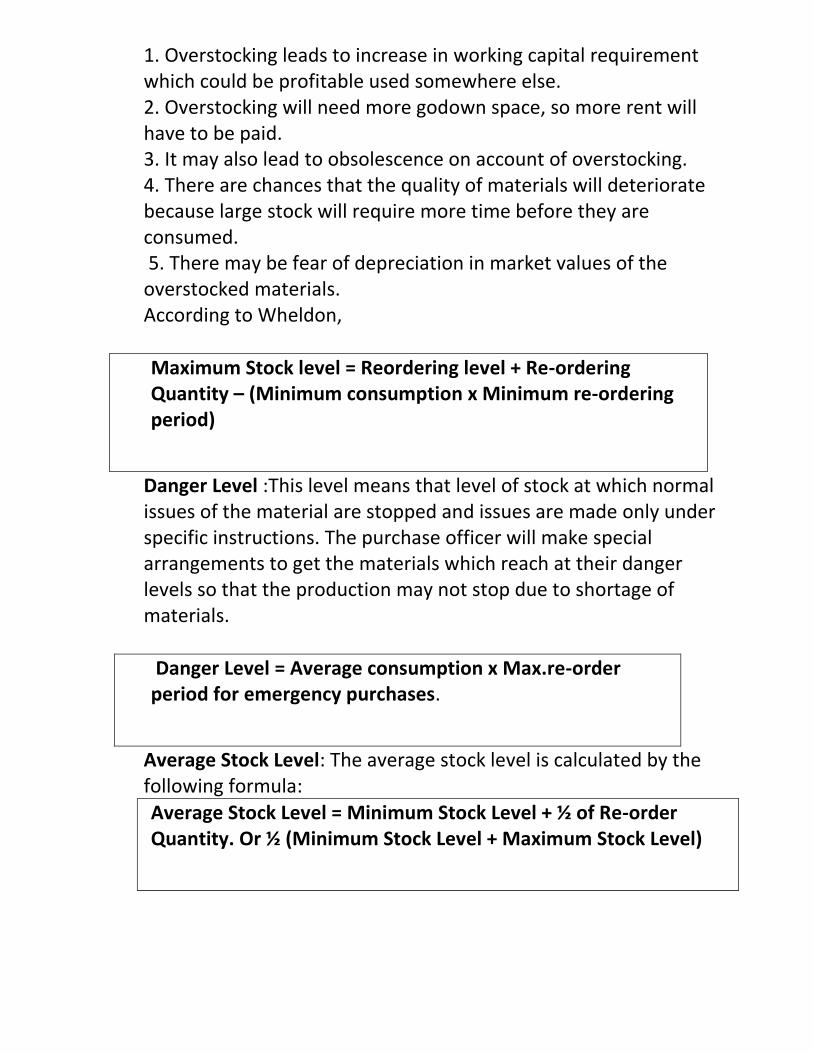
1. Overstocking leads to increase in working capital requirement which could be profitable used somewhere else. 2. Overstocking will need more godown space, so more rent will have to be paid. 3. It may also lead to obsolescence on account of overstocking. 4. There are chances that the quality of materials will deteriorate because large stock will require more time before they are consumed. 5. There may be fear of depreciation in market values of the overstocked materials. According to Wheldon,
Maximum Stock level = Reordering level + Re-ordering Quantity – (Minimum consumption x Minimum re-ordering period)
Danger Level :This level means that level of stock at which normal issues of the material are stopped and issues are made only under specific instructions. The purchase officer will make special arrangements to get the materials which reach at their danger levels so that the production may not stop due to shortage of materials.
Danger Level = Average consumption x Max.re-order period for emergency purchases.
Average Stock Level: The average stock level is calculated by the following formula:
Average Stock Level = Minimum Stock Level + ½ of Re-order Quantity. Or ½ (Minimum Stock Level + Maximum Stock Level)
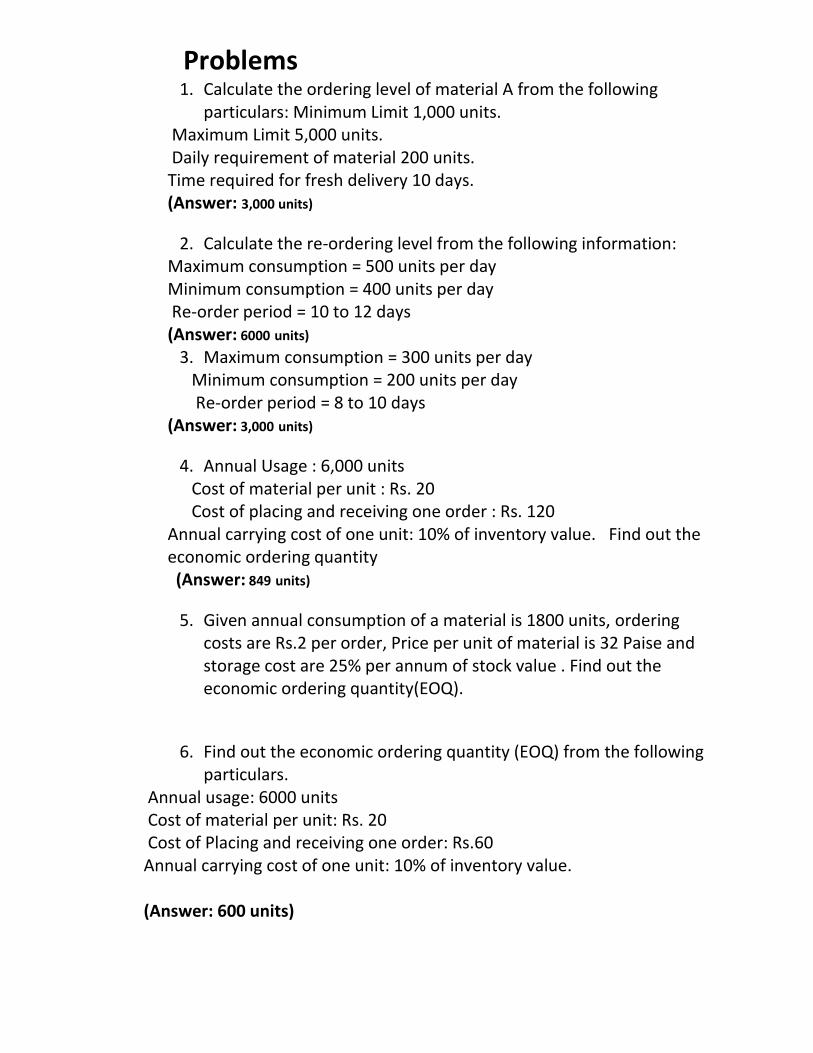
Problems 1. Calculate the ordering level of material A from the following
particulars: Minimum Limit 1,000 units. Maximum Limit 5,000 units. Daily requirement of material 200 units. Time required for fresh delivery 10 days. (Answer: 3,000 units)
2. Calculate the re-ordering level from the following information: Maximum consumption = 500 units per day Minimum consumption = 400 units per day Re-order period = 10 to 12 days (Answer: 6000 units)
3. Maximum consumption = 300 units per day Minimum consumption = 200 units per day Re-order period = 8 to 10 days
(Answer: 3,000 units)
4. Annual Usage : 6,000 units Cost of material per unit : Rs. 20 Cost of placing and receiving one order : Rs. 120
Annual carrying cost of one unit: 10% of inventory value. Find out the economic ordering quantity (Answer: 849 units)
5. Given annual consumption of a material is 1800 units, ordering costs are Rs.2 per order, Price per unit of material is 32 Paise and storage cost are 25% per annum of stock value . Find out the economic ordering quantity(EOQ).
6. Find out the economic ordering quantity (EOQ) from the following
particulars. Annual usage: 6000 units Cost of material per unit: Rs. 20 Cost of Placing and receiving one order: Rs.60 Annual carrying cost of one unit: 10% of inventory value. (Answer: 600 units)

7. Annual Usage : 1,20,000 units Cost of placing and receiving one order : Rs. 60 Annual carrying cost of one unit: 10%
(Answer: 12,000 units)
8. Annual Requirement of raw material : 6,0000 units
Ordering cost : Rs.600 Opportunity cost(cost of capital) of investment Re.1 per unit. Cost of deterioration, taxes, insurance, supervision cost Re.1 per unit. Calculate EOQ and number of orders to be placed and total cost of EOQ by applying formula from the above particulars. (Answer: 6000 units; 10 ORDERS ;Rs.12,000)
9. An industry currently is adopting and optimum purchase policy in
meeting annual inventory requirement of 100000 bags. Purchasing price per bag is rupees 20. The cost records project that it holding cost of 20% of original cost and repurchases cost of Rs. 500. The supplier is providing a discount facility of rupees 0.5 % if a purchased lot contains 10000 bags. you are asked to choose the most economic purchase lot between the above two alternative.
(Answer: second alternative as it is costing less)
10. Calculate the Minimum stock level Maximum stock level, Average stock level and Reordering level from the following information:
• Maximum consumption= 150 units per day
• Minimum consumption= 100 units per day
• Normal consumption= 120 units per day
• Reorder period= 10 to 15 days
• Reorder quantity 1500 units
• Normal period = 12 days
( Answer; Reordering level- 2,250 units; Minimum stock level- 810 units Maximum stock level -2,750 units Avg stock level 1560 units)
11. Two components A and B are used as follows:

Normal Usage 50 units per week each Minimum Usage 25 units per week each Maximum usage 75 units per week each Reorder quantity A: 300 units B: 500 units Reorder period A: 4 to 6 weeks B: 2 to 4 weeks Calculate (i) Re- order level (ii) Minimum level and Maximum level (iii) Average stock level. (Answer (i) A-450 units B-300 units; (ii) A-200;B-150units; A-650;B-750 units (iii) A-350; B-400 units)
12. From the following particulars calculate (a) Re- order level(b) Minimum level(c) Maximum level.
Normal Usage 100 units per day Minimum Usage 60 units per day
Maximum usage 130 units per day EOQ 5,000 units Reorder period 25 to 30 days (Answer: 3,900 units; 1,150 units; 7,400 units)
13. You have been asked to calculate the following levels for part No. 80 90 13 from the following information.
(a) Re-ordering level (b) Maximum level (c) Minimum level (d)Danger level (e) Average Stock Level (f) Re- order quantity or EOQ
The Re -ordering quantity is to be calculated from the following data 1. Total cost of purchasing relating to the order= Rs. 20 2. Number of units to be produced during the year= Rs. 5000 3. Purchase price per unit including transportation cost= Rs 50 4. Annual cost of storage of one unit = Rs. 5
Lead Times Average = 10 days maximum= 15 days minimum= 6 days maximum for emergency purchase= 4 days

minimum consumption= 15 units per day maximum consumption= 20 units per day. (ANS: 300; 410; 125; 70; 225; 200)
14. P. Ltd. uses three types of materials A, B & C for production of X, the final product.
The relevant monthly data for the components are as given below:
Calculate for each component:
(a) Re-order level (b) Minimum level c) Maximum level (d) Average stock level
(Answer: Re-order level 900;1000;810 Minimum level 400;475;360 Maximum level
1450;1600;1350; Average stock level 775;925;720)
15. In a factory component A is used as follows:
Normal usage – 50 kg per week Minimum usage – 25 kg per week Maximum usage – 75 kg per week Re-order quantity 300 kg. Re-order period 4 to 6 weeks.
Calculate for component A:
(i) Re-order level,(ii) Maximum level.(iii) Minimum level; and(iv)
Average stock level.
(ANS: 450; 650; 200;3 50)

16. two material X and Yare used as follows: calculate Minimum level, Maximum
level, Re-order level& Average stock level
Normal usage – 100 kg per week ordering quantity: X- 600 units ; Y-
1000 Units
Minimum usage – 50 kg per week Delivery period : X – 4 to 6 ; Y-
2 to 6 weeks
Maximum usage 150 Kg per week
(Answer: 400;300, 1,300;1,500, 900;600, 700;800)
1. The following are the inventory details of Sri Mils for the month of October 2019.
Prepare Stores Ledger Account and calculate value of closing stock as per FIFO and
LIFO method
Date Transactions Units Price per
Unit
1-October Opening Stock 1100 30
7-October Purchases 700 32
15-October Issued for Consumption 600 -
16-October Purchases 500 35
20-October Issued for Consumption 1300 -
29-October Purchases 750 37
31-October Issued for Consumption 475 -
(Answer: FIFO-Value of Closing Inventory= 675 x 37 = 24,975; LIFO- Value of Closing
Inventory= 400 x 30+ 275 x 37 = 22,175)
2. From the following transaction occur in the Purchase and issue of material from the
information given below prepare the stores ledger account by adopting First in First out method
and Last in First out method.
January 2nd purchase 4000 units @ rupees 4 unit

January 20 purchase 500 units @ 5 per unit
February 5th issued 2,000 units
February 10th purchase 6000 units at the rate of 6 per unit
February 12th issued 4000 units
March 2nd issued 1000 units
March 5th issued 2,000 units
March 15th purchase 4500 units @ 5.5 unit
March 20th issued 3000 units
(Answer FIFO: value of closing stock 3000 units @ Rs.5.50=16,500
LIFO value of closing stock 14250(1500 @5=6000,[email protected]=8250)
3. .Following Transaction occurred in purchase and issue of material in an organisation
during the month of October 2014
Receipt updates Quantity rate Issued dates Quantity
4th October 200 units 24.00 per unit 5th October 250 units
10th October 150 units 23.00 per unit 12th October 200 units
18th October 100 units 24.00 per unit 25th October 250 units
22nd October 100 units 23.50 per unit
The stock as on 1st October 2014 was 200 units @ 25.00 per unit.
prepare the stores ledger account first by adopting First in First out (FIFO)method and
secondly by Last in First out (LIFO)method.
(Answer: FIFO: value of closing stock 50 units @ Rs.23.50=1,175
LIFO value of closing stock 50 units @ 25.00=1250
4. Stock in hand of material as on 1st September 2017 was 500 units at the rate of rupee
1 per unit. the following purchases and issues were subsequently made, prepare the stores
ledger account showing how the value of issue would be recorded under First in First out
(FIFO)method and secondly by Last in First out (LIFO)method.
Purchase issues
September 6 100 units at the rate of 1.10 September 9th 500 units
September 20 700 units at the rate of 1.20 September 22nd 500 units
September 27 400 units at the rate of 1.30 September 30th 500 units
October 13th 1000 units at the rate of 1.40 October 15 500 units
October 21st 500 units at the rate of 1.50 October 22nd 500 units
November 17th 400 units at the rate of 1.60 November 11th 500 units
( value of stock FIFO rupees 940; LIFO rupees 860)
5. following is a history of of the receipts and issue of material in a factory during February
2014.
issue are to be priced on the principle of First In First Out& Last In First Method the
stock verifier of the factory noted that on 15th he had found a shortage of of 5 quintals
and on 27th and other shortage of 8 quintals. February 1st opening balance
500 quintals @ 25 rupees
3rd issue 70 quintals
4th issue 100 quintals
8th issue 80 quintals
13 received from vendor 220 @ 24.50 rupees

14 refund of surplus from Work order 15 quintals @24 each
16 issue 180 quintal
20 received from vendor 240@ 24.375 rupees
24 issue 304 quintals
25 received from vendor 320 @ 24.315
26 issue 112 quintals
27 refund of surplus from work order 12 quintals @ 24.50
28 received from vendor 100 @ 25.00
(Answer: 96 @24.375=2340;320 @24.315=7780;12 @24.50=294; 100@
5.00=2500)
6.From the following transactions calculate the cost of closing inventory using FIFO
and LIFO and Weighted Average method.
Date Transactions Units Price per Unit
1 July 2019 Opening balance brought forward 2000 10
15 July 2019 Purchases 1000 15
31 July 2019 Purchases 800 11
1 August 2019 Sales 2400 -
15 August 2019 Sales 1000 -
16 August 2019 Purchases 800 15
30 August 2019 Sales 1000 -
FIFO method under perpetual and periodic inventory systems respectively:
(Answer: FIFO : Closing Inventory = 200 Units x 15 = 3,000;LIFO:Closing Inventory = 200
Units x 10 = 2,000; Weighted average method: Ending Inventory = 200 X 13.84 = 2,768)
7 Akshita limited started its business on 1st January, 2015. It purchased and used raw
material during the month of January in 2015 as follows:
1 January: Opening Stock 500 kgs @ 60 per kg
5 January: Purchased 800 kgs @ 62 per kg
10 January: Issued 600 kgs
12 January: Purchased 1,200 kgs @ 57 per kg
18 January: Issued 1000 kgs 21
January: Issued 500 kgs 25
January: Purchased 900 kgs @ 65 per kg
28 January: Issued 800 kgs
Calculate the value of closing stock according to LIFO, FIFO and Weighted
Average.
(Answer: FIFO Value of Closing Stock = 500 Units @65 per unit = 32,500:;LIFO:Closing
Inventory = 400 X 60 + 100X 65 = 30,500; Weighted average method: Ending Inventory = 500
Units @63.018 per unit = 31,509 Units @63.018 per unit = 31,509)

8.From the following details of Store receipt and issue of material in a manufacturing unit
prepare stock ledger using weighted average method of valuation:
1st November opening stock 2000 units @ 5.00 each
3rd November issue 1500 units to production
4th November receive 5400 units @ 6.00 each
8th November issued 1600 units to production
9th November return to store 100 units by Production department ( from the issue of 3rd Nov)
16th November received 2400 units @ 6.50
19th November return to supplier 200 units out of the quantity received on November 4th
21st November receive 1000 units @ 7.00
24th November issued to production 2100 units
27th November Receive 1200 units at the rate of 7.50 each
29th November issue to production 2,800 units ( use rates upto 2 decimal places)
(Answer: 3000@19,558)