Cost and Schedule Integration Lessons learnt
55
Cost and Schedule Integration Lessons learnt Toxqui Damián, Ernesto Project work can be grouped by disciplines (Schedule, Cost, etc.) but all areas interact and eventually must be integrated as a single unit.
-
Upload
khangminh22 -
Category
Documents
-
view
0 -
download
0
Transcript of Cost and Schedule Integration Lessons learnt

Cost and Schedule IntegrationLessons learnt
Toxqui Damián, Ernesto
Project work can be grouped by disciplines (Schedule, Cost, etc.) but all areas interact and eventually must be
integrated as a single unit.

EXPOSITOR
30 years of experience in fields of InformationTechnology (software development, systemimplementation), Fiscal, Project Controls (Cost andSchedule Management, Change Control, DocumentControl, Risk Management and Integration)
Experience in different industries: Oil and Gas,Utilities, Financial sector, Information TechnologyConsulting companies, Education.
Hybrid academic and professional experience: PublicAccountant, Industrial Engineer, Master of Sciences inComputer Sciences, Business Analyst andProgrammer
ALGO QUE NO SABEN DE MÍ:

The need for integration….• External references and
foundation:• Industry standards• Best Practices• Regulatory laws
• Internal requirements• Manage the project• Report the status/progress• Identify variances• Make decisions
Organization
Planning, Scheduling &
Budgeting
Analysis & Management
Reports
CHANGE CONTROL -Revisions
and Maintenance
Control

The Basis

The Outcome

What is the output?Or the next step of the integration?
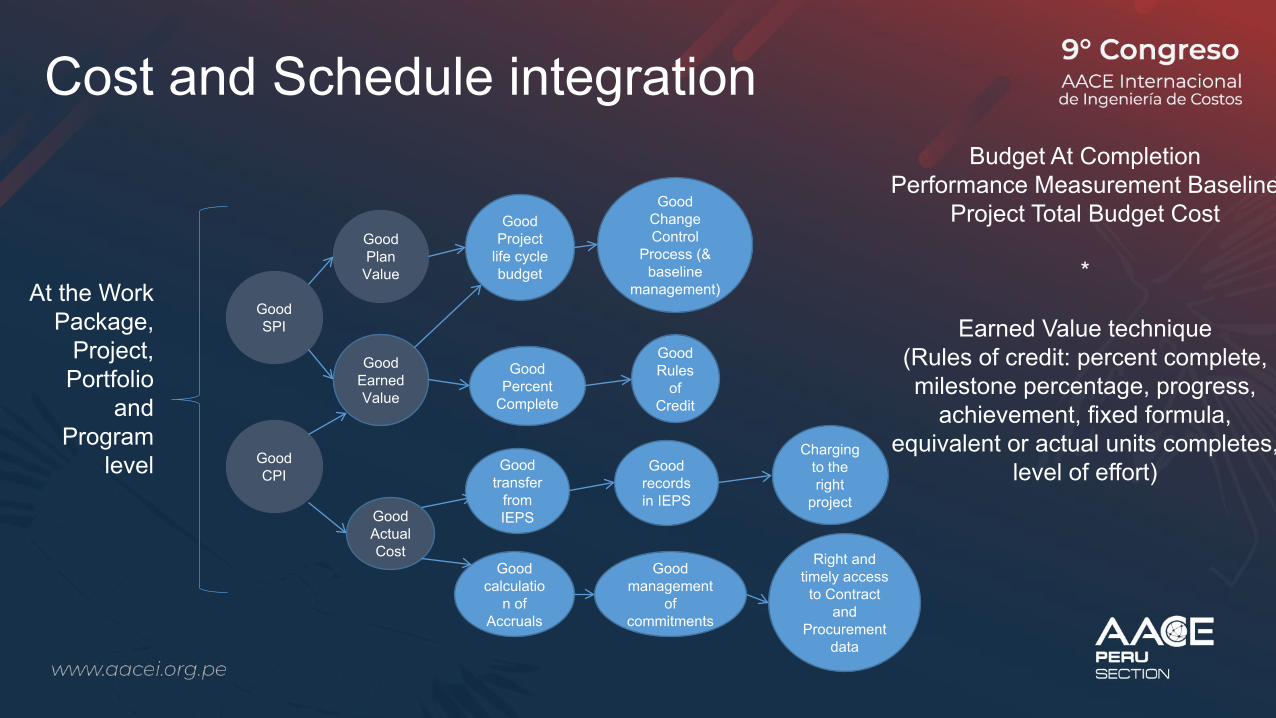
Good Earned Value
Good Project
life cycle budget
Good Rules
of Credit
Good Percent
Complete
Good Change Control
Process (& baseline
management)
Good Actual Cost
Good records in IEPS
Good transfer
from IEPS
Charging to the right
project
Good calculatio
n of Accruals
Good management
of commitments
Right and timely access
to Contract and
Procurement data
Good Plan
Value
Good SPI
Good CPI
At the Work Package,
Project, Portfolio
and Program
level
Cost and Schedule integrationBudget At Completion
Performance Measurement BaselineProject Total Budget Cost
*
Earned Value technique(Rules of credit: percent complete, milestone percentage, progress,
achievement, fixed formula, equivalent or actual units completes,
level of effort)

S c o p e
Budget
Duration
Internal Procedures
Technology
Organization
MaturityBest Practices / Mandatory requirements
Integration Implementation Strategy
Capacity
Outputs

Some key questions – checklist to consider• Right systems for the right data?• Right processes to handle the right data?• Manual and automated processes working in tandem? E.g. interfacing Financial information, transferring data into the
spreadsheets from the systems like P6• Right timing to avoid double-work (three cost updates during the month)?• Right alignment of disciplines? E.g. when Finance closes the Accounting GL, the Actuals are passed to Project Controls,
Contracts and Procurement discloses the commitments so Accruals can be calculated correctly• Roles and responsibilities are clearly defined (at the project, program, planning/work package, task level, per discipline, etc.)• Are schedules provided enough for the audience (levels 1, 2,…, project lifecycle, short term: 90 days look ahead, critical path,
milestones, milestones at risk, etc.)?• Is the project aware of fluctuations, part of the nature of their business (i.e. currency rates, inflation, labor rates, fees, etc.)? If
so, do they follow GAAP, IFRS?• Right transactions on Direct Cost, Indirect: Allocation of Overhead?• Is it following correctly the standard so it can be auditable (a proper Change Control process and tool implemented)? Earned
Value Management System (ANSI-748C, PMBOK, etc.)• Is there a proper QA process of: the Project Controls processes, data and tools?• Is there budget to upgrade the current tools (document controlling, reporting, etc.)?

In-house applications are incorporated to process the transfer and reports
A third party software is configured to transfer cost and schedule; the major investment is put into the data warehouse
A third party software is installed in SAP to handle earned value; data is read from SAP Hana to produce reports
Schedule and Cost work separately and at the end of the process, all information is combined into a monthly report

Mass data transfer of funding and actual costs from Hyperion and Peoplesoft

Overview• Every month, the Cashflow of over 300 projects had to be produced within
the same first five business days by the Project Controls team (3 people) and it was practically an unmanageable task within the timeframe.
The tasks included:• Processing the Actual Cost data and convert it into a format that can be
imported into P6-EPPM• Processing the Funding and Forecast data and convert it into a format that
can be imported into P6-EPPM
Bulk processing and data transfer for portfolio monthly Cashflow • Technology: P6-EPPM, SOAP web services, VBA Excel macros• Sources: Oracle Hyperion, Peoplesoft

What does “Processing” entail?
The processing included the definition of the rules: use of resources (dollar amount for cost), activities (that carry the cost), activity relationships (successors and predecessors), control accounts (to identify and classify the source of the cost and funding) and split the cost to different sources of funding.
And creating the 300+ templates (Excel import files) for each project.

Received Actual Cost – raw Peoplesoft data

Received Funding – raw Hyperion data

Creation of P6 import files, from the raw files
Run a macro to convert the raw data into 300+ files (one per project), ready to be imported into P6-EPPM, containing:
- Activity (task)- Relationships- Resource Assignments (Actual Cost,
forecast, curves)
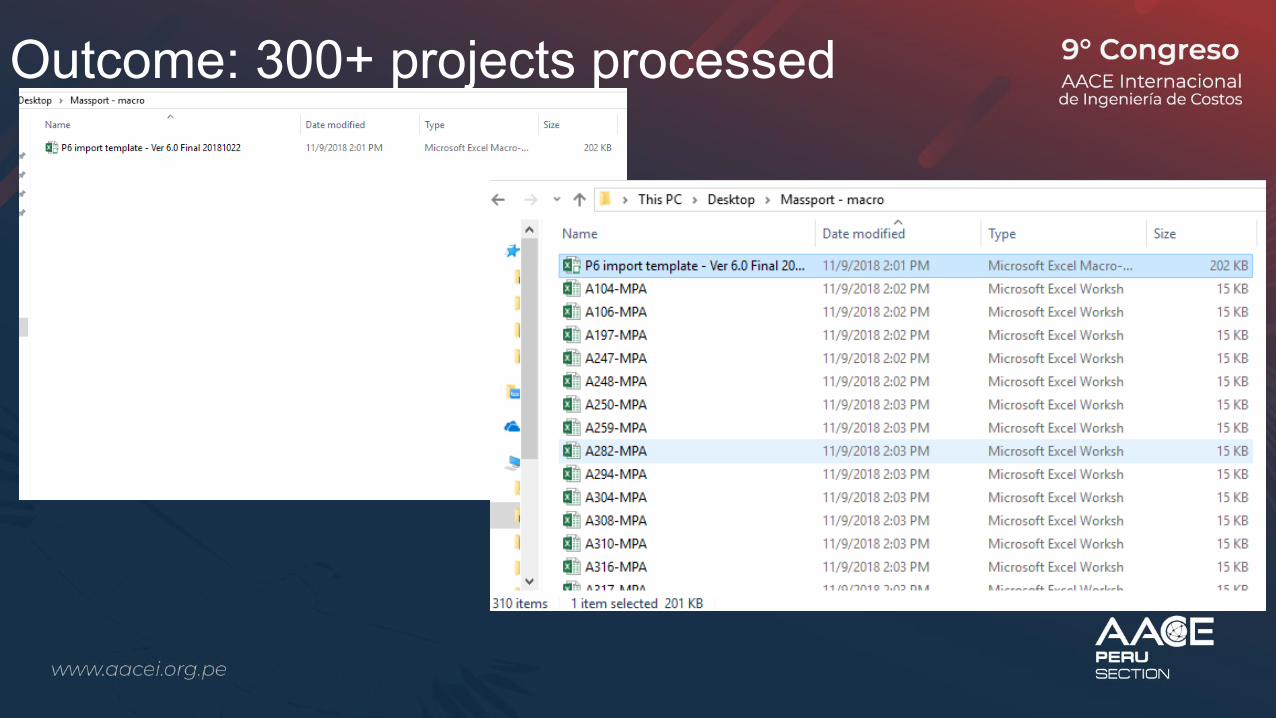
Outcome: 300+ projects processed

Web-Services to import directly into P6

Web Services incorporated in the macro
Administrator username and password are required to access the backend of P6
A log was incorporated to document the exceptions.These exceptions can be dealt with a regular import.

Summary for data processing• A macro is used to process 300+ actual cost and
funding/Forecast data (when done with formulas, it was not possible to achieve during the timeframe of 5 days)
• The macro enables to create 300+ files, with the right format to be imported into P6 (The manual import takes 3 days).
• The macro –with the incorporation of Web Services- can handle the import directly (It is expected to reduce the 3 days to half-day, including exceptions).

SAP actual cost transfer using an in-house Microsoft Access database

Overview• In lieu of not having access to Web Services and Oracle P6 SDK,
this solution processes the data from the SAP format (CJI3) into the current architecture (cost at the WBS Summary level).
• Due to security restrictions, the access to the MS-Access database where the queries are run is restricted.
• The P6 user has rights to import files and run Global Changes.
• The user of the Access database must have:• Login password to the Primavera Database (not only to the GUI)• Access to SharePoint• An ODBC connection in his computer to the Primavera Database

ETL
TransformIn AccessUsing SQL
LoadIn Primavera
Importing files
ExtractFrom SAP
Using CJI3

In SAP, run the CJI3 and input the next fields:
-Project: GZ-0001 to GZ-0004
-Cost Element Group: P_100
-Posting date: the transfer is cumulative, therefore select 2010-01-01 and the last day of the reporting month. I.e. 2010-10-31; 2010-11-30
-Layout: P_100_ET. The order of the columns of this layout matches the table of the Access Database.
-Further Settings: enter a huge number like 9999999.
Execute the report

Export the information to an Excel format by clicking the X icon (Spreadsheet).
Save the file.
Keep the file open.
SAP report

In Access
Run the Access database SAP-P6 transfer and open the table Tbl_SAPdump and erase all the content (this will be replace by the imported files in the previous step).

In Excel
Select all the content and copy the selection of the spreadsheet by pressing Ctrl-C.
Paste the content in the MS-Access database by selecting the row and pressing Ctrl-V.

In AccessRun the next queries in the assigned order.
If the results are empty, it means that there are no issues to resolve; otherwise these are the recommendations:
- Qry_Chk_EmployeeWithNoWorkCenterMatched. Contact the Project Tech to match the Employee to the right Work Center and input the record into the table Tbl_Mapping-WorkCenter_Employee located in SharePoint.
- Qry_Chk_Resources_Labour. Helps you identify a new combination of valid Work Center and valid Activity Type. This must be input in P6, taking care of the prices/unit.
- Qry_Chk_Resources_NonLabour_Vendor. Does not apply currently (no PS02)
- Qry_Chk_CostAccounts. Helps identify new Cost accounts that are not yet in P6. The records here must be inputted in P6.
- Qry_Chk_WBSSummaryActivities. Every cost must be placed in a specific WBS Summary activity. If the WBS does not have a WBS Summary activity with the nomenclature GZ000#-whatever, that WBS Summary activity must be created in their respective WBS.

Final ResultQueries
The last three queries are to populate the templates to be imported into P6. They have a correspondence:
Query Excel Template
Qry_Chk_Assignment_Both_Labour_and_nonLabour(CHK – 050.Resource assignments to import into P6)
050.Resources - New Assignments.xls
Qry_Chk_ActualCost_and_Assignment_CostAccounts(CHK – 060.Actual Cost assignments to import into P6)
060.Expenses - Assignments.xls
Qry_Chk_ActualCost_Both_Labour_and_nonLabour(CHK – 070.Resources Actual Cost to import into P6)
070.Resources - Cost.xls

New assignments
Sample of the 050. New Assignments file:
It is specific for each project;
It contains only newresource assignments

Expenses
Sample of the 060. Assignments file:
It is specific for each project;
It contains Expenses Cost:
- All Cost/Units equals 1
- Actual Cost

Update existing Assignments
Sample of the 070. Resources – Cost file:
It is specific for each project;
It contains all resource assignments with their respective cost (actual units and actual cost)

Enter the Actual cost into P6The import process repeats four times:• 1. Import new resource assignments (050) – to enter missing assignments.• 2. Import Expense assignments (060) – first time to input all expense
assignments.
Then run two Global changes to zeroed out all the Actual Cost in the project:• A) Zero down Actuals Resources-> for Resource Assignments (labour and
non-labor)• B) Zero down actuals Expenses -> for Expense AssignmentsThe Total Actual Cost of the project must be zero.
Resume the import:• 3. Import again Expense assignments (060) – to enter the Expense Cost• 4. Import Resources – Cost (070) – to enter the Resources Cost

Integration of systems of the same vendor

P6 – Unifier integration• Both systems from the same vendor: Oracle.• Unifier contains a schedule module and an option to receive dates from
Primavera P6
• Besides the effort to transfer data, the ultimate goal is to produce a Cash-Flow report and populate the cost and schedule sections of a Monthly Progress Report, with a flexible design as close as what the client is already utilizing and dynamic to react to future requirements.
• All Project Controls reports were developed out of Unifier using Oracle BI Publisher. Unifier as the system of record for Cost was missing the schedule data (plan, actual, baseline dates, percent complete)

Proposed :
More granularity, more detail, allow to make comparison, display Current, last month, baseline, changes, beginning of the month, sent to board, etc.
Current:
One single records that grabs only the latest information (current schedule) and even only some fields
Unifier Configuration

Current data fields set up in Unifier
Used data fields in Unifier during the proposed solution

There are more fields to pick (as needed) that can be:- Either transferred from P6 or
other Scheduling software- Or manually inputted- Or transferred via XML or CSVs

Key features of the processesCurrent process:• Used web-services – semi
automated process, still requires manual intervention by placing the files in a specific folder
• Quick to process all schedules at once into Unifier
• Modification of the current process may likely require to update the configuration of the web-services (similar to Arunee’s integration process)
Proposed:• Used CSVs – meaning more
manual intervention• More control on the
transferred data (as long asthere are some business rules like naming convention) that allow more sophisticated reporting and integration Cost/Schedule/contract
• It allows more flexibility to pick the needed fields and update the process
• Slow to update all the files/schedules at once into Unifier

Expected outcome
1. The schedule section of the Project Monthly Progress Report:• Original Baseline (a schedule sheet was added: Baseline)• Current Baseline (several schedule sheets can be added to reflect re-
baselines: Changes-yyyymmdd• Current (latest) schedule sheet: Progress-201608 (assuming the
data/update date is August/2016)• Last month schedule sheet: Progress-201607 (for July/2016)• Additional calculations, like variances
2. The Cash-flow, basically time-phasing the Cost Values (plan and forecast values) at the project and portfolio levels.

Integration at the reporting level(no data transfer)

Business Intelligence (BI) toolsWith the advent, popularity and accessibility of BI tools, there is less need to transfer data as the integration can be done only at the highest level: the reporting.
Common functions of business intelligence technologies include reporting, analytics, dashboard development, data mining, performance management, predictive analytics (forecast), and prescriptive analytics (explanation of actual data).
Among the common software packages: Tableau, Power BI, Analytics.

Monthly Updates
Data transfers
App upgrades and
new versions
Standard data
Process
Outputs:
• Traditional printed reports
• Interactive / Live dashboards
Valuable and Prompt
information to make decisions
“Without data… you’re just a person with an opinion”
- Edwards Deming
Integration of different data formats

Advantages of a BI solution and specifically, Power BI)
• Not only another sophisticated graph, but a way to slice and dice (analyze) the data and convert it into valuable information
• If the company has Excel, Word, Power Point… very likely is a Microsoft shop, and has “free” access to Microsoft Power BI
• Power BI comes from predetermined visualizations (graphs, charts, etc.) but they can be expanded from the store (Marketplace)
• There is no restriction about what is the data source (Peoplesoft, SAP, Oracle Unifier, P6, etc.)
• In a wider scope, a dashboard can be constructed not only from a Project Controls system but any Information System
• Integration: the same graph/visualization/dashboard can be fed from multiple data sources (systems and vendors), like Excel, SQL, Oracle, XML, CVS, SharePoint, etc.
• The data can be analyzed with natural language (it requires some normalization, but…is possible!)

Hints that an organization needs a dashboard
• Constant use of Excel graphs, and a need to dig (drill down) to the detail.
• Massive amount of records, reports, systems• Having a need to simplify or summarize the data• Many audiences with distinct and conversely similar needs• Overwhelm with too much information or total lack of information• Output from the systems not properly formatted• Delays in the process to provide information (Remember: the
information comes with an expiration date)• Several apps, each providing different but related information• Different owners of a piece of information

PureP6

Bonus: a process approach to integrate

Integration: Cause – effect relationship
Pseudo-code ExampleIF
<<something happens: CAUSE>> If an activity X falls behind
THEN
<<something else reacts: EFFECT>>Then there is an increase in the Y resources and will increase cost Z

Brainstorm - interactions
Systems
Processes
People & Things
- Systems/components (Unifier, eBuilder, Kahua, PM web, Microsoft Project, Net Suite, Ecosys, Excel, etc.)
- People/things (Project Controls, external Stakeholders, Project Management team, etc.)
- Processes (Accounts receivable/payable, mandatory requirements, monthly reporting progress, etc.)

Input -> Process -> Output approach
System/Component
Input 1
Input 2
Input 3
Input 4
Output 1
Output 2
Output 3
Output 4What is needed to be done?Who is doing it? Who is receiving it?How is done?, How is communicated, transferred, transmitted, submitted?

During the lifespan of a project, work package;Current administration, sponsorship

Interaction with components within and without the scope
Within the MSC Scope
Out of the Scope
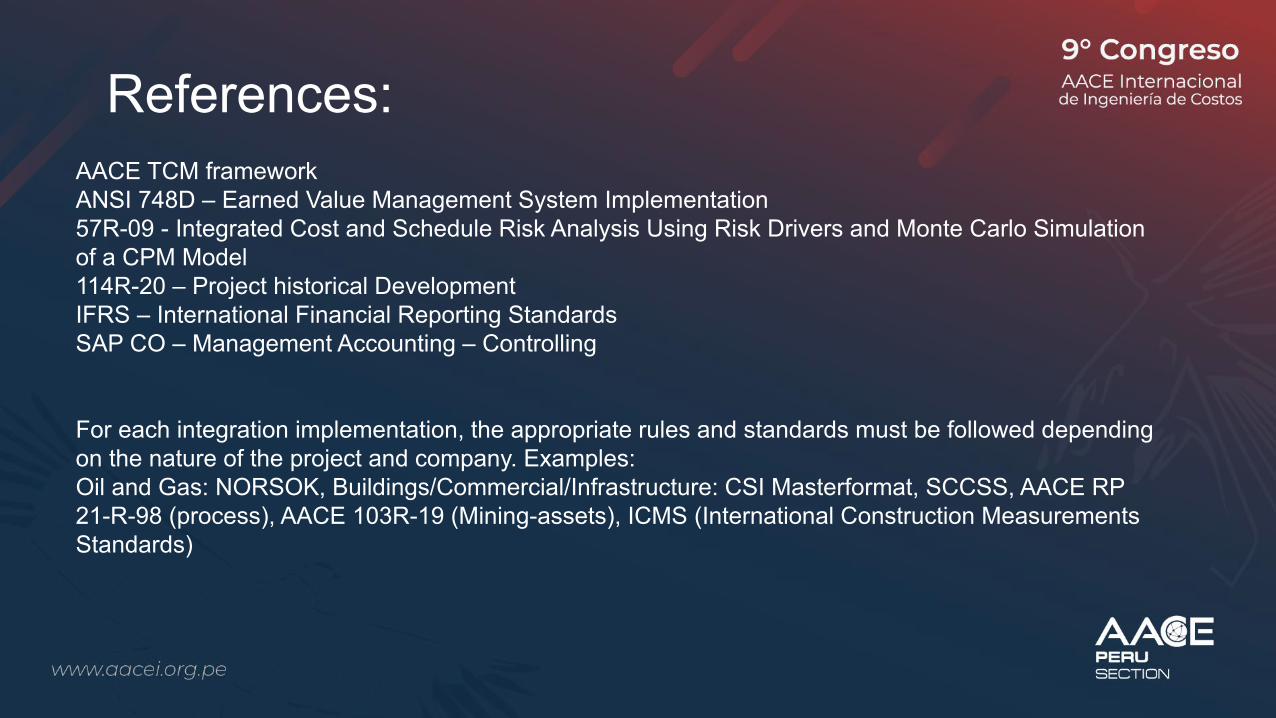
References:AACE TCM frameworkANSI 748D – Earned Value Management System Implementation57R-09 - Integrated Cost and Schedule Risk Analysis Using Risk Drivers and Monte Carlo Simulation of a CPM Model114R-20 – Project historical DevelopmentIFRS – International Financial Reporting StandardsSAP CO – Management Accounting – Controlling
For each integration implementation, the appropriate rules and standards must be followed depending on the nature of the project and company. Examples:Oil and Gas: NORSOK, Buildings/Commercial/Infrastructure: CSI Masterformat, SCCSS, AACE RP 21-R-98 (process), AACE 103R-19 (Mining-assets), ICMS (International Construction Measurements Standards)