The Use of the Land-Cover Classification System in Eastern European Countries: Experiences, Lessons...
29
Chapter 19 The Use of the Land-Cover Classification System in Eastern European Countries: Experiences, Lessons Learnt and the Way Forward Louisa J.M. Jansen, Alexandru Badea, Pavel Milenov, Cristian Moise, Vassil Vassilev, Ljudmila Milenova, and Wim Devos 19.1 Introduction into Categorisation and the Land-Cover Classification System The understanding of the interactions between land cover, defined as “the observed (bio)physical cover on the Earth’s surface” (Di Gregorio and Jansen 2000), and land use, defined as “the type of human activity taking place at or near the surface” (Cihlar and Jansen 2001), in their spatial and temporal appearances is fundamental to comprehension of land-use and land-cover change. Land cover can represent an expression (indicator) of human activities and, as such, changes with changes in land use and management. Hence, land cover may form a reference base for applications including forest and rangeland monitoring, production of statistics L.J.M. Jansen (*) Senior Advisor Agriculture, Environment and Land Administration, Arnhem, The Netherlands e-mail: [email protected] A. Badea Romanian Space Agency, 21-25 Mendeleev st., sector 1, 010362 Bucharest, Romania Romanian Centre for Remote Sensing Applications in Agriculture (CRUTA), 35-37, Sos. Oltenitei, sector 4, 041293 Bucharest, Romania e-mail: [email protected] P. Milenov • W. Devos MARS Unit, Institute for Environment and Sustainability, European Commission Joint Research Centre, Via E. Fermi 2749, 21027 Ispra, VA, Italy e-mail: [email protected]; [email protected] C. Moise Romanian Space Agency, 21-25 Mendeleev st., sector 1, 010362 Bucharest, Romania e-mail: [email protected] V. Vassilev • L. Milenova Remote Sensing Application Center (ReSAC), 61 Tzar Assen Str., fl. 2, 1463 Sofia, Bulgaria e-mail: [email protected] I. Manakos and M. Braun (eds.), Land Use and Land Cover Mapping in Europe: Practices & Trends, Remote Sensing and Digital Image Processing 18, DOI 10.1007/978-94-007-7969-3_19, © Springer Science+Business Media Dordrecht 2014 297
Transcript of The Use of the Land-Cover Classification System in Eastern European Countries: Experiences, Lessons...

Chapter 19
The Use of the Land-Cover Classification
System in Eastern European Countries:
Experiences, Lessons Learnt
and the Way Forward
Louisa J.M. Jansen, Alexandru Badea, Pavel Milenov, Cristian Moise,
Vassil Vassilev, Ljudmila Milenova, and Wim Devos
19.1 Introduction into Categorisation
and the Land-Cover Classification System
The understanding of the interactions between land cover, defined as “the observed(bio)physical cover on the Earth’s surface” (Di Gregorio and Jansen 2000), and
land use, defined as “the type of human activity taking place at or near the surface”(Cihlar and Jansen 2001), in their spatial and temporal appearances is fundamental
to comprehension of land-use and land-cover change. Land cover can represent an
expression (indicator) of human activities and, as such, changes with changes in
land use and management. Hence, land cover may form a reference base for
applications including forest and rangeland monitoring, production of statistics
L.J.M. Jansen (*)
Senior Advisor Agriculture, Environment and Land Administration, Arnhem, The Netherlands
e-mail: [email protected]
A. Badea
Romanian Space Agency, 21-25 Mendeleev st., sector 1, 010362 Bucharest, Romania
Romanian Centre for Remote Sensing Applications in Agriculture (CRUTA), 35-37, Sos.
Oltenitei, sector 4, 041293 Bucharest, Romania
e-mail: [email protected]
P. Milenov • W. Devos
MARS Unit, Institute for Environment and Sustainability, European Commission Joint
Research Centre, Via E. Fermi 2749, 21027 Ispra, VA, Italy
e-mail: [email protected]; [email protected]
C. Moise
Romanian Space Agency, 21-25 Mendeleev st., sector 1, 010362 Bucharest, Romania
e-mail: [email protected]
V. Vassilev • L. Milenova
Remote Sensing Application Center (ReSAC), 61 Tzar Assen Str., fl. 2, 1463 Sofia, Bulgaria
e-mail: [email protected]
I. Manakos and M. Braun (eds.), Land Use and Land Cover Mapping in Europe:Practices & Trends, Remote Sensing and Digital Image Processing 18,
DOI 10.1007/978-94-007-7969-3_19, © Springer Science+Business Media Dordrecht 2014
297

for planning and investment, biodiversity, climate change and desertification
control (Di Gregorio and Jansen 1998).
In the 1990s, different groups worked on the development of universally
applicable land-cover and land-use categorisations that would contribute to
standardisation of the criteria used for description and consequently categorisation,
in addition to harmonisation between existing datasets plus harmonisation of
change (Jansen 2010). FAO and UNEP emphasized a parameterised approach,
i.e. using a set of explicit independent criteria resulting in a flexible data model
that can be used as a uniform basis for description, in addition to the use of (part of)
these parameters for change detection and monitoring. Thus not class labels are
vital but the applied explicit set of parameters (Jansen 2010).
Without categorisation, real landscape phenomena would remain merely a
bewildering multiplicity and the precise and unambiguous communication of
ideas and concepts concerning these phenomena would be impossible (Shapiro
1959). Categorisation, or classification, is defined as “the ordering or arrangementof objects into groups or sets on the basis of relationships. These relationships canbe based upon observable or inferred properties” (Sokal 1974). Another, and even
earlier, definition by Shapiro (1959) reads “the sorting of a set of phenomenacomposed of generally-alike units into classes or kinds, each class or kindconsisting of members having definable characteristics in common” is also inter-
esting but does not underline the importance of relationships. It is important to note
that categorisation is an abstraction in the sense that it depicts a representation
of the reality (Di Gregorio and Jansen 2000).
The set of diagnostic criteria for the parameterised categorisation approach
followed in the Land-Cover Classification System (LCCS), developed in the period
1996–2000 at FAO together with UNEP and financed by the Italian Cooperation
(Di Gregorio and Jansen 2000), is based upon examination of criteria commonly
used in existing categorisations that identify and describe land cover in an impartial,
measurable and quantitative manner (Jansen and Di Gregorio 2002). However, the
definition of categorisation provided in FAO (2005) “classification is an abstractrepresentation of the situation in the field using well-defined diagnostic criteria:the classifiers” confuses categorisation with an abstract representation of a
categorisation example given in Kuechler and Zonneveld (1988) and completely
overlooks the fact that categorisation is the basic cognitive process of arrangingobjects into classes or categories, as well as the act of distributing objects into
classes or categories of the same type (Jansen 2010, p. 24–25).
The parameterised LCCS approach to categorisation aims at a logical and
functional hierarchical arrangement of the parameters, thereby accommodating
different levels of information, starting with broad-level classes that allow further
systematic subdivision into more detailed subclasses. At each level the defined
classes are mutually exclusive. Criteria used at one level of the categorisation are
not to be repeated at other levels. The increase of detail in the description of a class
is linked to the increase in the number of parameters used. In other words, the more
parameters are added, the more detailed the class. The class boundary is then
defined either by the different number of parameters, or by the presence of one or
298 L.J.M. Jansen et al.
more different types of parameters. Emphasis is not given to the derived class name,
the traditional method, but to the set of parameters used to define this land-cover
class (Jansen and Di Gregorio 2002; Jansen 2010). The use of parameters and their
hierarchical arrangement is a function of geographic accuracy. The arrangement
of parameters will assure at the highest levels of categorisation, i.e. the most
aggregated levels, a high degree of geographic accuracy. Since land cover deals
with a heterogeneous set of classes, the parameters are tailored to each of the eight
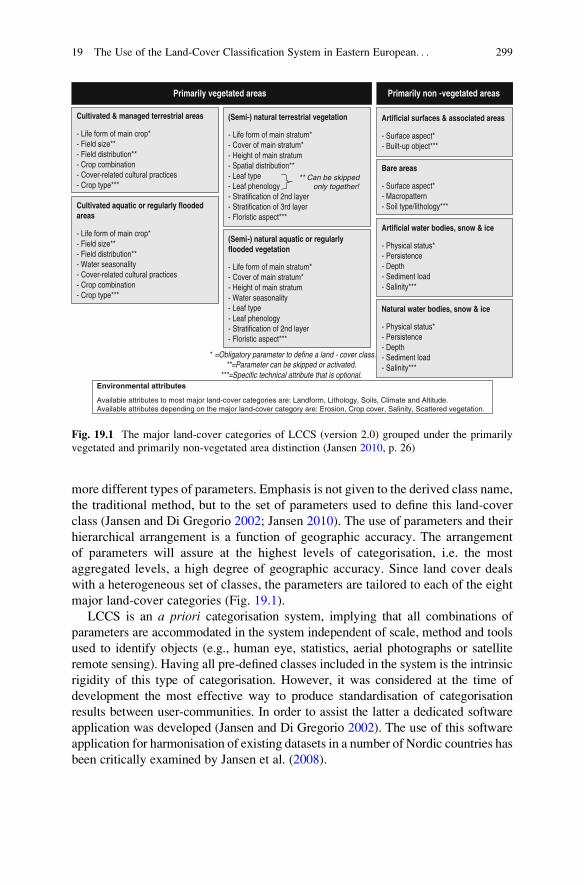
major land-cover categories (Fig. 19.1).
LCCS is an a priori categorisation system, implying that all combinations of
parameters are accommodated in the system independent of scale, method and tools
used to identify objects (e.g., human eye, statistics, aerial photographs or satellite
remote sensing). Having all pre-defined classes included in the system is the intrinsic
rigidity of this type of categorisation. However, it was considered at the time of
development the most effective way to produce standardisation of categorisation
results between user-communities. In order to assist the latter a dedicated software
application was developed (Jansen and Di Gregorio 2002). The use of this software
application for harmonisation of existing datasets in a number of Nordic countries has
been critically examined by Jansen et al. (2008).
Cultivated & managed terrestrial areas
- Life form of main crop*- Field size**- Field distribution**- Crop combination- Cover-related cultural practices- Crop type***
(Semi-) natural terrestrial vegetation
- Life form of main stratum*- Cover of main stratum*- Height of main stratum- Spatial distribution**- Leaf type- Leaf phenology- Stratification of 2nd layer- Stratification of 3rd layer- Floristic aspect***
Artificial surfaces & associated areas
- Surface aspect*- Built-up object***
Cultivated aquatic or regularly floodedareas
- Life form of main crop*- Field size**- Field distribution**- Water seasonality- Cover-related cultural practices- Crop combination- Crop type***
(Semi-) natural aquatic or regularly flooded vegetation
- Life form of main stratum*- Cover of main stratum*- Height of main stratum- Water seasonality- Leaf type- Leaf phenology- Stratification of 2nd layer- Floristic aspect***
Primarily vegetated areas Primarily non -vegetated areas
Bare areas
- Surface aspect*- Macropattern- Soil type/lithology***
Artificial water bodies, snow & ice
- Physical status*- Persistence- Depth- Sediment load- Salinity***
Natural water bodies, snow & ice
- Physical status*- Persistence- Depth- Sediment load- Salinity***
Environmental attributes
Available attributes to most major land-cover categories are: Landform, Lithology, Soils, Climate and Altitude.Available attributes depending on the major land-cover category are: Erosion, Crop cover, Salinity, Scattered vegetation.
* =Obligatory parameter to define a land - cover class.**=Parameter can be skipped or activated.
***=Specific technical attribute that is optional.
** Can be skipped only together!
Fig. 19.1 The major land-cover categories of LCCS (version 2.0) grouped under the primarily
vegetated and primarily non-vegetated area distinction (Jansen 2010, p. 26)
19 The Use of the Land-Cover Classification System in Eastern European. . . 299
The LCCS categorisation methodology has been tested, modified and validated
in several international projects in order to analyse its applicability in different
environmental settings, its use at different data collection scales and with different
means of data collection, its usefulness for data harmonisation and in land-cover
change analysis (Jansen 2010, p. 27–28). The Land Use and Cover Change (LUCC)
project of the International Biosphere-Geosphere Programme (IGBP) and Interna-
tional Human Dimensions Programme (IHDP) on Global Environmental Change
endorsed the methodology (McConnell and Moran 2001). In Europe, it has been
applied in a number of FAO projects in the Central and Eastern European Countries
(CEEC) and the Commonwealth of Independent States (CIS) (e.g., Azerbaijan,
Bulgaria (Travaglia et al. 2001), Romania (Jansen and Veldkamp 2012) and
Moldova) at the time of their economic transition, by the Nordic Council of
Ministers’ Nordic Landscape Monitoring project to examine in detail harmoni-
sation (Groom 2004; Jansen et al. 2008), and by a World Bank financed project in
Albania to study land-cover/use change (Jansen et al. 2006). In this paper the
projects in the CEEC and CIS will be discussed, as they were the first European
countries where LCCS was introduced, to illustrate the experiences with LCCS and,
if applicable, follow-up activities (Sect. 19.2), the lessons learnt (Sect. 19.3), and
further developments in Europe (Sect. 19.4). This is followed by suggestions for the
way forward at the methodological level (Sect. 19.5).
19.2 The Use of LCCS in the Different
CEE and CIS Countries
FAO initiated Technical Cooperation Projects (TCP) in Azerbaijan, Bulgaria,
Romania and Moldova shortly after the transition to a market-oriented economy
started. Transition from a centrally planned to a market-oriented economy involved
‘privatisation’ of agricultural lands meaning the shifting of ownership of land from
collectives and state to private persons. This land reform is either through restitu-
tion, distribution or compensation (Table 19.1). Land is at the centre of sustainable
development; this recognition leads to promoting secure tenure rights and equitable
access to land (FAO 2012).
Governments in the CEEC and CIS implemented a comprehensive package of
social and economic reform policies. Spatial developments were rapid in the period
of transition and such developments are related to the reform choices the govern-
ments made in these countries (Swinnen 1999; Kuemmerle et al. 2008). These land
reforms did not only deal with the transfer of property rights and ownership, they
dealt with the structures of the agrarian economy. In rural areas the relation to land
has profound implications for agricultural productivity, environmental sustainabil-
ity and the social and economic status of the rural households. Matching land use
and land tenure with the aim to reach a better socio-economic structure therefore
becomes crucial (Larsson 2002).
300 L.J.M. Jansen et al.

As FAO had developed the LCCS, it was from the organisational viewpoint the
logical approach to apply in these projects in countries that were at the time not
European Union (EU) Member States1 or accession countries, instead of the
commonly used EU CORINE Land Cover (CLC). The latter serves as a tool for
fulfilling pan-European monitoring needs. The experts worked in more than one
FAO project thereby enhancing the cross-fertilisation in the methodologies used
and experiences gained.2
Land-cover data are seen as a baseline dataset for the understanding of how our
environment is changing. Thus, knowledge of the actual occurrence of land-cover
types (“where” and “what”) is essential in order to be able to monitor environmental
changes (“why” and “how”). Furthermore, understanding land-use change
processes of the past (“what was”) may contribute to model their effects on
land-cover patterns in future (“what may be”). Land cover and land use changed
dramatically in the transition period, thus the demand for current datasets by the
governments was huge to enable them to develop new policy and planning and to
make informed decisions.
In the subsequent sections an overview is provided per country of the projects
and further activities concerning land-cover/land-use mapping from an operational
viewpoint. Especially the efforts to create the technical and human capacities in the
countries are highlighted. The successful use of advanced technologies such as
remote sensing and GIS depend on these capacities. The science and comparative
advantages of the parameterised approach of LCCS are described in more detail
Table 19.1 The privatisation process (Deininger 2003)
Region and
country
Potential private
ownership Privatisation strategy Allocation strategy Transferability
CEE
Albania All land Distribution (phys.) Plots Buy and sell,
leasing
Bulgaria All land Restitution Plots Buy and sell,
leasing
Romania All land Restitution and
distribution (phys.)
Plots Buy and sell,
leasing
CIS
Azerbaijan All land Distribution Plots (from shares) Buy and sell,
leasing
Moldova All land Distribution Plots (from shares) Buy and sell,
leasing
1On 1 January 2007 Bulgaria and Romania joined the EU.2 The authors were involved in LCCS and the projects described in various ways: Louisa
J.M. Jansen is author of LCCS and she was involved in the projects in Albania and Romania;
Alexandru Badea worked in the projects in Azerbaijan, Romania and Moldova; Pavel Milenov
worked in the projects in Bulgaria and Romania and used LCCS at JRC; Cristian Moise was
involved in the projects in Romania; Vassil Vassilev and Ljudmila Milenova were involved in the
projects in Bulgaria; Wim Devos uses LCCS at JRC.
19 The Use of the Land-Cover Classification System in Eastern European. . . 301

elsewhere (Di Gregorio and Jansen 2000; Jansen and Di Gregorio 2002; Jansen
et al. 2008). The analysis techniques used in the beginning in each country
comprised visual onscreen interpretation of satellite imagery. However, especially
in Bulgaria and Romania the approach evolved over time in automated procedures
and object-oriented approaches.
19.2.1 Azerbaijan
Azerbaijan was the first country of the CIS where a new land-cover/land-use inven-
tory was executed by the FAO Technical Cooperation Project “Strengthening Capac-ity in Inventory of Land Cover/Land Use by Remote Sensing” (TCP/AZE/8921)
starting in July 1999. This new inventory was necessary to see how to balance new
owners’ rights with the necessity and capacity of the government to regulate land use
and development for the best interest of society (Van der Molen and Jansen 2010;
Williamson et al. 2010). This new inventory led to a unique georeferenced
parameterised dataset using LCCS version 1.0 comprising 45 classes in five
categories (e.g., Water, Vegetation, Agriculture, Built-up areas and Bare surfaces)
to be used for agricultural planning, forestry and other sectors. In preparing the land-
cover dataset at 1:50,000 scale based upon interpretation of LANDSAT satellite data
acquired in 1998 and 1999, the project acquired a wealth of information on aspects
such as the salt affected areas, destruction of villages and on-going mineral exploi-
tation in the occupied territories. This specific information extracted from the digital
dataset, or newly generated with the acquisition of additional satellite images,
assisted in provision of a first layer of information in de-mining activities.
The usefulness of the generated digital land-cover dataset was shown by the
potential applications, thereby answering requests of different organisations (Badea
and Herisanu 2002). For example, following the invitation of the local government
of the Lenkaran District, and taking into account the uncontrolled urbanisation
(urban sprawl), the land distribution process and the lack of modern measuring
tools, the project team realised by image interpretation an inventory of the classes
‘Tea plantations’, ‘Orchards’, ‘Rice fields’ and ‘Herbaceous crops’ that could be
compared with the results obtained using classical methods by a local team of field
inspectors. Though the year of data collection differs, significant differences in the
perennial crops areas were found (Table 19.2). Thus, the project provided local
government with up-to-date information on which to take informed decisions.
Table 19.2 Comparison of two types of data with certain land-cover classes in the Lenkaran
District in Azerbaijan
Class Data obtained from maps (1995) (in ha) TCP/AZE data (2000) (in ha)
Tea garden 3,3753 8,953
Rice 1,787 927
Orchard 2,826 4,428
Herbaceous crops 956 2,155
302 L.J.M. Jansen et al.

After 17 months the established project created a well-equipped remote sensing
laboratory at the Azerbaijan National Aerospace Agency (ANASA) that allowed
the staff to operate with ease the hardware and software, producing the countrywide
land-cover dataset from satellite image interpretation. The local team was then able
to offer support to important governmental initiatives in the domain of agriculture,
environment and inter-governmental development projects such as the Azerbaijan-
Russia transboundary transport corridor, an important part of the Silk Way global
infrastructure.
19.2.2 Bulgaria
The FAO Technical Cooperation Project “Strengthening Capacity in AgriculturalDevelopment Through Remote Sensing and GIS” (TCP/BUL/8922) was executed
jointly by FAO and Bulgarian experts from the Remote Sensing Application Centre
(ReSAC) at the Bulgarian Aerospace Agency (BASA) from June 1999 onwards.
Bulgaria was the first European country where land-cover mapping using LCCS
version 1.0 was undertaken (Travaglia et al. 2001; see http://www.fao.org/
DOCREP/004/Y0785E/y0785e00.htm).
Land is an important productive resource in Bulgaria. The land reform changed
the structure of the agrarian economy. At the time of the implementation of the
land reforms neither the size, nor form, nor location of land parcels were issues.
As a result, the farm structure deteriorated in most cases. Agricultural, or rural,
development was not the main aim of land reform.
This project aimed at the development and testing of remote sensing and GIS
methodologies for inventory of land cover/land use in selected districts represen-
tative of the agricultural structure and production in the country, to set-up the
strategy for the provision of accurate parameterised baseline information on land
cover/use and associated land characteristics. This approach enabled the relevant
authorities to prepare and implement sound agricultural development plans, includ-
ing criteria for the land redistribution. A second objective was the strengthening
of the remote sensing and GIS capacities at ReSAC, at the time located in BASA.
This resulted in a well-structured ReSAC able to provide accurate and timely
information to the relevant government agencies.
The project produced initially 14 digital land-cover maps at 1:50,000 scale for
selected areas in the country covering an area of 5,600 km2 (an example is shown in
Fig. 19.2). These maps were prepared using LANDSAT satellite data, acquired in
1998 and 1999, as main data source and thus representing the land cover at that
time. This resulted in the three selected areas in a class set comprising 49 classes.
Different from the approach followed in Azerbaijan were two issues:
1. In Bulgaria each land-cover polygon also contained information on soil type and
erosion features from other sources. The resulting comprehensive digital dataset
was unique at that time in Bulgaria.
19 The Use of the Land-Cover Classification System in Eastern European. . . 303

2. The project also applied very high resolution IKONOS satellite images, acquired
in August 2000, for the inventory of vineyards in the area of Sandanski in the
southern part of the Strouma Valley.
The database provided useful information for agriculture, forestry, urban devel-
opment planning, environmental protection and for many other applications. It was
also used for computerised decision-support systems using application-specific
models, for instance to calculate erosion hazard risks or changes in water runoff
(using data from additional sources) associated with land-cover changes (Travaglia
et al. 2001). The project outcome underlined the flexibility and care of the para-
meterised LCCS methodology, as opposed to land-cover categorisations using a
predefined class set such as CLC, commonly used in the Europe Union (EU).
In the years following the FAO project, ReSAC expanded the land-cover
mapping activities over the territory of the country (Nedkov et al. 2000; Milenov
et al. 2004). More than half of the country was covered with digital land-cover data
through various regional projects, such as:
• Biomass assessment in forested areas for the purpose of green energy;
• Impact assessment of the pan-European transport corridors in Bulgaria based on
SPOT 5 (5 m resolution) satellite imagery;
Fig. 19.2 Example of land-cover map at 1:50,000 scale in Bulgaria
304 L.J.M. Jansen et al.

• Flood risk analysis;
• Development of the strategy for the Land Parcel Identification System (LPIS) in
the context of the European Union’s Common Agriculture Policy (CAP)
(see also Sect. 19.4);
• Urban planning using land-cover data at 1:5,000 scale using very high resolution
satellite imagery; and
• Cross border cooperation (CBC) of ReSAC with Romania in the framework of
the FAO and CBC projects.
These initiatives resulted in the decision to develop a national land-cover
database, using LCCS as a reference to support the decision-making process at
national and regional levels. A nation-wide land-cover dataset, compliant with
1:50,000 cartographic scale, was developed on the basis of LANDSAT 5 satellite
images from 2009 with spatial resolution 30 m, using an object-oriented approach.
Each land-cover polygon from the dataset represents an ‘elementary unit’ of the
terrain having common (i.e. homogeneous) land cover, elevation and slope aspect
characteristics. The information for the landform was taken from the Shuttle Radar
Topography Mission (version 4; see http://www2.jpl.nasa.gov/srtm/), available at
the Joint Research Centre (JRC) of the European Commission (EC). The reference
land-cover dataset was entirely prepared by experts from the Agency for Sustain-
able Development and Euro-integration – Ecoregions (ASDE) and ReSAC
supported by FAO experts. The resulting database was delivered to the Executive
Agency Electronic Communication Networks and Information Systems (ECNIS) of
the Ministry of Transport, Information Technology and Communications. It is
currently available through a national geoportal. This reference land-cover dataset
will be used also in accordance with the implementation of the Directive 2/2007/EC
of the European Parliament and of the Council of 14 March 2007 establishing an
Infrastructure for Spatial Information in the European Community (INSPIRE), the
Directive 60/2007/EC of the European Parliament and of the Council of 23 October
2007 on the assessment and management of flood risks and other Directives and EU
programmes, including the international project GLOBCOVER, in which the EU,
USA, Russia, Canada and other countries participate. In future this land-cover
database will be upgraded and enhanced in agreement with the requirements for
the 1:25,000 cartographic scale to efficiently contribute to building-up the opera-
tional capacity to implement the INSPIRE Directive and the Global Monitoring for
Environment and Security (GMES) programme.
In addition to the countrywide BULCOVER dataset (Fig. 19.3), land-cover
mapping was executed for regional cities in Bulgaria on the basis of satellite images
with very high resolution. These maps are at scale 1:5,000 or 1:10,000 using images
with spatial resolution of 0.5–1 m (e.g., IKONOS, Quickbird, Eros andWorldview 1).
The class set for these datasets is LCCS-based but adapted to the specific scale and
user requirements (Fig. 19.4). Digital maps and databases are available from the
beneficiary Ministry of Regional Development and Public Works at the Department
Technical Rules and Regulations. These maps were developed in coordination
with the Executive Agency ECNIS that created an information system for the
harmonisation of spatial data and risk management (Milenova et al. 2003).
19 The Use of the Land-Cover Classification System in Eastern European. . . 305

Fig. 19.3 BULCOVER national land-cover dataset: 2009–2010
Fig. 19.4 Detailed land-cover map at scale 1:10,000 for 27 district centres based on the
BULCOVER LCCS methodology
306 L.J.M. Jansen et al.

In 2012, further research on the application of the LCCS methodology was
carried out by MSc students from the Geology and Geography Faculty of the
Sofia University St Kliment Ohridski and ReSAC. This research concerned the
application of the object-oriented image analysis for land cover and analysis of
land-cover changes (period 2005–2010).
19.2.3 Romania
With the land reform in 1991, a new era started in Romania concerning land
ownership and land use. By imposing a maximum for land restitution and distrib-
uting the remaining collective land to farm workers, Romania attempted to combine
the strong demand for full property rights from those who formally owned the land
(i.e. historical justice) with equity considerations (Swinnen 1999).
Following the successful implementation of the FAO projects in Azerbaijan and
Bulgaria, an ambitious undertaking was started in 2002 for the entire territory of
Romania in the project “Land-Cover/Land-Use Inventory by Remote Sensing for theAgricultural Reform” (FAO/TCP/ROM2801). The project aimed at (1) providing the
Ministry of Agriculture with an objective and accurate countrywide database on land
cover/land use including larger scale information for areas of particular agricultural
interest; (2) strengthening the capacity of the Romanian Centre for Remote Sensing
Applications in Agriculture (CRUTA) and other staff from the Ministry of Agricul-
ture to apply internationally recognized methodologies on land-cover/use mapping
by satellite remote sensing and GIS technologies; and (3) transferring the know-how
and practical applications of high resolution remote sensing, GIS-based metho-
dologies and LCCS to the staff assigned to the project through formal and on-the-job
training (see http://www.fao.org/sd/2002/TCPROM2801/fao_tcp_home.htm).
The specific outputs of the activities undertaken during the 18 months lifespan of
the project facilitated:
1. The production of a comprehensive digital land-cover dataset at 1:50,000 scale
of the whole country and detailed land-cover/use datasets at 1:25,000 scale for
few areas of particular interest, using LCCS version 1.0, through satellite image
interpretation, integrated with field observations and/or additional information.
These outputs became an essential input to the land redistribution and the
improved agricultural planning process as these datasets provided detailed
information on the various sizes of agricultural fields that occur in different
parts of the landscape (Jansen and Veldkamp 2012). To each land-cover polygon
additional information on soil types, erosion features (like in Bulgaria) and
municipal and/or district boundaries were added.
2. Capacity building in remote sensing and GIS.
3. The transfer of modern technology on satellite image interpretation of land
cover/use, based on the considerable FAO experience on this subject, and
constituted a good basis for the sustainable capacity and the development of
remote sensing applications in the country.
19 The Use of the Land-Cover Classification System in Eastern European. . . 307

Currently, the two LCCS databases (2000 and 2003) created with FAO and with
National Research & Development support are used by numerous public institu-
tions and economical agencies for thematic studies. The use of these datasets
underlines the accomplishment of the FAO project (Badea et al. 2007, 2008;
Docan et al. 2007). The joint team ROSA/CRUTA used the vector database
LCCS 2003 for generating a thematic map during the activation of the International
Charter on Major Disaster for the floods affecting the lower basin of Siret river in
2005 (Fig. 19.5). The value of the method used for the first time by Romanian
experts has been positively appreciated by the final users. Thus, in 2008 and 2010,
the maps for flood management included reports about the land-cover/land-use
categories affected by the disasters.
Furthermore, since CLC is the commonly used methodology in EU Member
States, in Romania two separate groups of experts allowed the creation of datasets
based upon CLC and LCCS. Rather than being a duplication of efforts, it allowed
the study of the agricultural and forest dynamics in a manner complementary to
CLC. The conclusions of the dual CLC/LCCS 2000 analysis imposed the contin-
uation in parallel of the LCCS activities. To ensure the actual use of the LCCS
results and their continuity, it was essential to adapt the LCCS 2000 and 2003
databases to be compatible with the INSPIRE Directive requirement that came into
force in 2006 for each EU Member State to document the categorisation
system used.
Fig. 19.5 The use of LCCS dataset of 2005 in Romania for generating a thematic map on flood
management
308 L.J.M. Jansen et al.
As logical continuation, the project “Hybrid Method for Thematic Update ofthe Land-Use Inventory by Remote Sensing/GIS Technology, Support for the Imple-mentation of the European Agriculture and Environment Programs” (see http://
lccs07.rosa.ro) is continuing the activities developed during the previous years
around the group of the Romanian Space Agency (ROSA). This project takes into
account the evolution of data acquired by the new earth observation satellites and
the advanced methods of the semi-automatic and automatic processing of these data
that have become operational. The project allowed both the harmonisation of the
LCCS 2000 and 2003 datasets and the preparation of the interpretation of the SPOT
5 satellite image coverage acquired in 2007 (Mamulea and Dana 2008). The main
target of this project is to develop a second, scientific level of determination of
land-cover/use parameters (Olteanu et al. 2009). This project offered the possibility
to obtain the third series of LCCS databases using recent advanced technologies
adapted to the Romanian conditions. With this step methods and rules will be set up
for processing and validation of data. The first results are expected by late 2013.
Having developed such methods, a new coverage can be made every 3–4 years
based on the available human resources and at low costs. Furthermore, the third
LCCS dataset will enable the testing of mathematical models for the study of
landscape dynamics. An evaluation of the limit to which automation can be reached
without jeopardising the quality of relevant information is foreseen.
To ensure continuation of the built institutional setting and capacities, two
project proposals were submitted to the Seventh Framework Programme in the
spirit of the INSPIRE Directive and GMES, the “Towards an operational GMESLand Monitoring Core Service” (GEOLAND2) and “Services and Applications forEmergency Response” (SAFER). Until present, an important part of the moun-
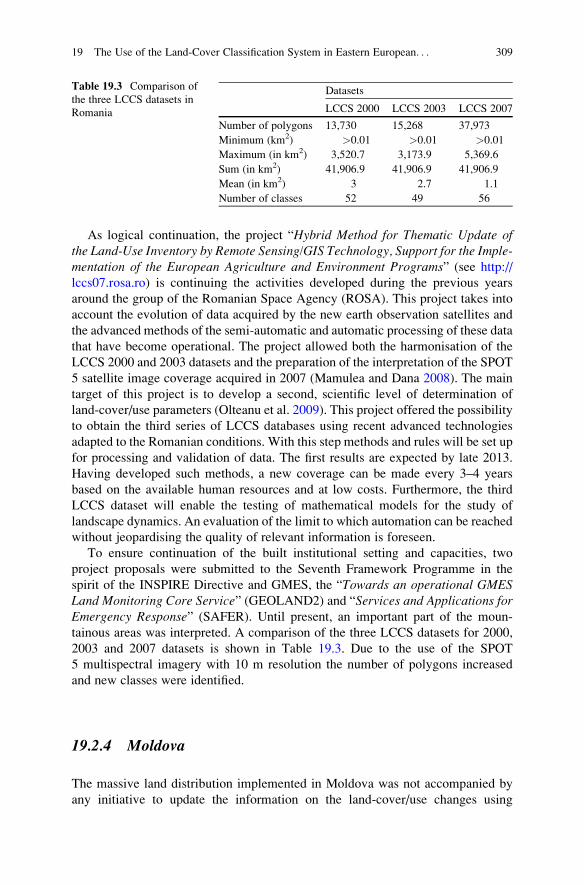
tainous areas was interpreted. A comparison of the three LCCS datasets for 2000,
2003 and 2007 datasets is shown in Table 19.3. Due to the use of the SPOT
5 multispectral imagery with 10 m resolution the number of polygons increased
and new classes were identified.
19.2.4 Moldova
The massive land distribution implemented in Moldova was not accompanied by
any initiative to update the information on the land-cover/use changes using
Table 19.3 Comparison of
the three LCCS datasets in
Romania
Datasets
LCCS 2000 LCCS 2003 LCCS 2007
Number of polygons 13,730 15,268 37,973
Minimum (km2) >0.01 >0.01 >0.01
Maximum (in km2) 3,520.7 3,173.9 5,369.6
Sum (in km2) 41,906.9 41,906.9 41,906.9
Mean (in km2) 3 2.7 1.1
Number of classes 52 49 56
19 The Use of the Land-Cover Classification System in Eastern European. . . 309

modern technologies. For an agricultural country, such as Moldova, knowledge of
the extent and location of the cultivated areas in the different regions has not only a
basic value for development planning, but also prime economic and social impor-
tance. To revitalise the agricultural sector, the Ministry of Agriculture needed
timely and accurate information on the distribution of land-cover/use types in the
country. Data prepared before the land distribution process were of limited use, as
they depicted a situation no longer existent or they were prepared for specific crop
suitability studies, while their production was no longer considered necessary.
The assistance provided through the FAO Technical Cooperation Project
“Building Capacity in Inventory of Land Cover/Land Use by Remote Sensing”(TCP/MOL/2903), started on March 2004, increased the satellite data processing
capacity of the State Agency for Land Relations and Cadastre (SALRC), enabling
provision of inputs to the Ministry of Agriculture concerning provision of relevant
data on land use and the immediate transfer of the generated databases for agricul-
tural planning appropriate to the existing conditions. The specific outputs of the
activities undertaken during the 15 months project period were:
1. The production of land-cover data for the whole country at 1:50,000 scale (based
on LANDSAT TM image interpretation) and detailed land-cover/use data at
1:25,000 scale for specific areas of particular interest (based on SPOT multi-
spectral satellite data) using LCCS version 1.0 for land-cover categorisation.
These outputs constituted an essential input to the land redistribution and the
improved agricultural planning process.
2. Production of a comprehensive database for the whole country, by adding to
each land-cover polygon from other sources additional information on soil types,
erosion features (like in Bulgaria and Romania) and municipal/district bound-
aries (like in Romania).
3. The transfer of modern technology on satellite image interpretation for land
cover/use, specifically based on the considerable FAO experience on this
subject. This constituted a sound basis for the sustainable development of remote
sensing applications in the country.
The on-the-job training increased capacities in remote sensing and GIS enabling
the SALRC staff to provide, through the linkages established by this project,
accurate data and services to the Ministry of Agriculture and other institutions.
This comprised initially the actual land-cover/use situation, while later it comprised
data on water resources, forestry, land degradation and other subjects relevant to the
sustainable development of agriculture and renewable natural resources.
This FAO project benefited from the experiences gained in the projects in
Azerbaijan, Bulgaria and Romania. In Moldova the reference control points for
the satellite imagery were homogenised with those in Romania. In practice, the
LANDSAT TM images for 2000 became, for both projects, the reference in the
orthorectification process. Due to the common natural conditions of Moldova and
the Eastern part of Romania (e.g., geomorphology and vegetation) the class set
used in Eastern Romania was adopted in Moldova. The experience of the local staff
and the usefulness of the land-cover/use inventories convinced the Government to
310 L.J.M. Jansen et al.

implement, under the assistance of the European Environment Agency, the project
“Evaluation of the Impact of Land-Use Changes in Moldova” based on the CLC
methodology. Started in 2011, this project is implemented by SALRC in coopera-
tion with the Technical University of Moldova and the Institute of Geography and
Ecology using WebGIS technologies (see www.geoportal.md).
19.2.5 Albania
In the turmoil of a rapidly changing economy the Albanian government needed
accurate and timely information for management of their natural resources
and formulation of land-use policies. The change to a market-oriented economy
had also an impact on the natural resources and their management, not only due to
privatisation, but also because of the strong land fragmentation as a result of the
land distribution and increased urbanisation. The increasing pastoral economy and
husbandry caused landscape degradation and natural resources depletion in many
regions of the country. Uncontrolled timber harvesting, overgrazing and over-
exploitation of wood (in a country with a permanent energy shortage) and other
forest products have changed environmental assets. The depletion of forest
resources, particularly in accessible areas, had become alarming. Scarce possi-
bilities of control and a lenient policy caused severe, sometimes even irremediable,
damages to the natural resources of Albania (Jansen et al. 2006).
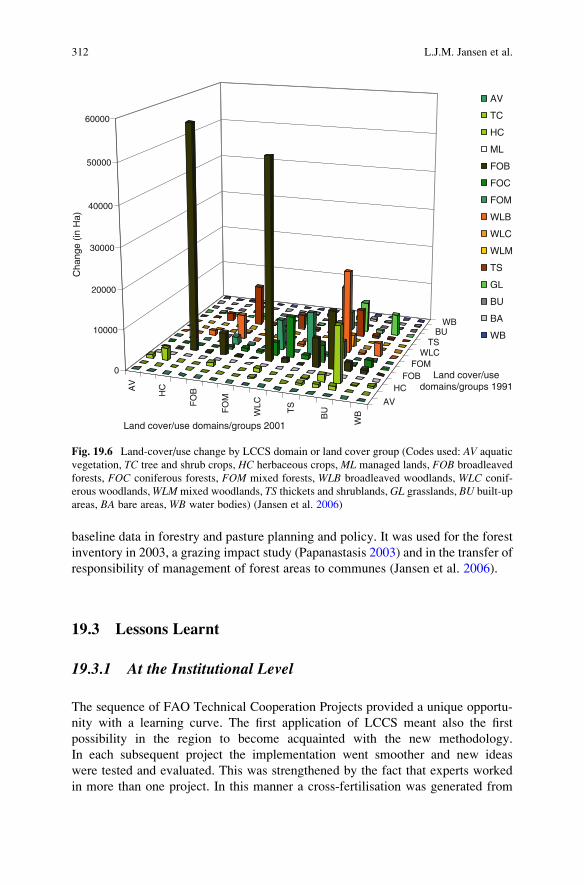
The World Bank financed “Albanian National Forest Inventory” (World Bank
loan/credit 2846 ALB) project, executed in the period 2002–2004, provided a
quantitative analysis of spatially explicit land-cover/use change dynamics at
national (Fig. 19.6) and district levels in the period 1991–2001 using LCCS version
1.0 for codification of classes, satellite remote sensing (digital LANDSAT
7 Enhanced Thematic Mapper imagery for 2001 and LANDSAT 5 Thematic
Mapper for 1991), field survey for data collection and validation of the interpreta-
tion, and elements of the object-oriented geo-database approach to handle changes
as an evolution of land-cover/use objects (i.e. polygons) over time to facilitate
change dynamics analysis. The 1991 polygons are described by what has changed
in their state, i.e. the spatial extent of the polygon formed by a set of land-cover/use
boundaries and/or the polygon label (land-cover/use class) vis-a-vis their state in
the validated 2001 dataset. This allows quick identification of ‘hotspots’ of change
(Jansen et al. 2006). The approach to change analysis was fundamentally different
from approaches that delineate the state of land cover at certain times and analyses
change dynamics by making overlay procedures in a GIS.
The 1991 and 2001 land-cover/use interpretations apply 35 classes described by
LCCS version 1.0. This ensures harmonisation of the data with existing datasets at
international level, while at the same time standardising the method used for
description of land-cover/use features (Jansen 2006; Jansen et al. 2008). Contrary
to the FAO projects previously discussed, the prime focus in this project was on
natural resources and not on agriculture. The 2001 digital database provided the
19 The Use of the Land-Cover Classification System in Eastern European. . . 311
baseline data in forestry and pasture planning and policy. It was used for the forest
inventory in 2003, a grazing impact study (Papanastasis 2003) and in the transfer of
responsibility of management of forest areas to communes (Jansen et al. 2006).
19.3 Lessons Learnt
19.3.1 At the Institutional Level
The sequence of FAO Technical Cooperation Projects provided a unique opportu-
nity with a learning curve. The first application of LCCS meant also the first
possibility in the region to become acquainted with the new methodology.
In each subsequent project the implementation went smoother and new ideas
were tested and evaluated. This was strengthened by the fact that experts worked
in more than one project. In this manner a cross-fertilisation was generated from
AV
HC
FO
B
FO
M
WLC
TS
BU
WB
AV
HCFOB
FOMWLC
TSBU
WB
0
10000
20000
30000
40000
50000
60000
Cha
nge
(in H
a)
Land cover/use domains/groups 2001
Land cover/usedomains/groups 1991
AV
TC
HC
ML
FOB
FOC
FOM
WLB
WLC
WLM
TS
GL
BU
BA
WB
Fig. 19.6 Land-cover/use change by LCCS domain or land cover group (Codes used: AV aquatic
vegetation, TC tree and shrub crops, HC herbaceous crops, ML managed lands, FOB broadleaved
forests, FOC coniferous forests, FOM mixed forests, WLB broadleaved woodlands, WLC conif-
erous woodlands,WLMmixed woodlands, TS thickets and shrublands, GL grasslands, BU built-up
areas, BA bare areas, WB water bodies) (Jansen et al. 2006)
312 L.J.M. Jansen et al.

which the projects that started later have obviously benefited to a greater extent than
those at the start. In 1999 there was, furthermore, the possibility of direct feedback
to the LCCS development team so that changes in the methodology could still be
implemented.
The FAO projects established a baseline dataset in each country that was used in
various, mainly agricultural, applications. With time these applications covered
different sectors and the applications became more detailed in nature. Until this day
the LCCS methodology is in actual use in order to assist decision makers. The latter
have to evaluate what impact a decision may have on future generations. To support
decision-making relevant and up-to-date data and information are essential with:
• The capacity to elaborate spatial data in order to create information (e.g., time-
series analysis, creation of relationships between various thematic layers,
scenario development, impact analysis); and
• The use of powerful models that simulate various scenarios in order to be able to
evaluate the effects, risks and advantages of a choice.
The strength in the set-up of the projects lay also in the fact that the focus was not
solely on collection of the land-cover/use data, but these were immediately used in
an application. In this manner in each country immediate experience was gained in
the use of LCCS data in certain applications and the possibility to check if these
data comprised the essential classes. Thus, the capacity building was not limited to
the use of the LCCS methodology for remote sensing applications, but embraced
the analytical (GIS) capacities in the various institutions involved. With this
approach the sustainability of the projects has been successfully enhanced.
The World Bank project in Albania had a similar approach in that the land-
cover/use data collection was in direct support of the forest inventory and grazing
impact study. The World Bank prescribed the use of LCCS in the project. However,
the remote sensing and GIS capacities in the country could not be substantially
enhanced due to the lack of a dedicated institution or department within the
Ministry that comprised a critical mass of experts. Nonetheless, the data collected
and the various applications have clearly shown the usefulness of a comprehensive
and consolidated approach. The frequency of forest inventories is around 10 years,
therefore the near future will disclose if the methodological approach will be
repeated.
19.3.2 At the Methodological Level
In the period 1999–2005, the use of LCCS in the FAO andWorld Bank projects was
from the organisational viewpoint a logical decision. LCCS is the methodology
developed by FAO and UNEP and therefore an apparent choice in United Nations
projects. The World Bank stipulated in the Terms of Reference for the project in
Albania the use of LCCS. However, the closer some of the countries came to
pre-accession and accession status (e.g., Bulgaria and Romania) the more obvious
19 The Use of the Land-Cover Classification System in Eastern European. . . 313

it would have been to shift the attention, as far as land cover is concerned, to CLC as
that is used not only in the EU Member States but by 39 countries in Europe for
environmental monitoring purposes. However, in both countries LCCS continued
to be used alongside CLC. Since land-cover/use data collection is costly and
requires dedicated resources (e.g., specialist in interpretation of satellite images,
knowledge of hard and software, analytical skills to operate the GIS, etc.) it is
interesting to investigate what the reasons were of using two different
categorisations in parallel other than the use of CLC for fulfilling European
requirements and LCCS for national purposes.
CLC was originally developed for a smaller group of Member States than the
39 European countries that are using CLC nowadays. Since CLC comprises a
pre-defined class set, this meant that over time this set had to be adapted to the
environments of the new(er) countries. CLC is not based on a parameterised
approach in which new combinations of parameters could be used for definition
of new classes. Knowledge and technology have advanced and policy objectives
will also have changed over time (Jansen et al. 2008). This means that with time
insights are gained and new possibilities are within reach that one wants to use.
Therefore, the methodologies applied -independent whether it is general-purpose
categorisations like CLC or LCCS or any other- have to be dynamic over time to
continue monitoring activities at national and pan-European levels.
The same is true for the use of satellite imagery: in the 1990s use was mainly
made of different generations of LANDSAT satellite images, nowadays SENTI-
NEL data from the Copernicus Programme offers a logic continuation from the
LANDSAT type satellites but with improved spatial and temporal resolutions, and
very high resolution satellite imagery has become available that allows more detail
in the applications. Therefore, one observes a shift from countrywide data collec-
tions to studies related to specific areas of interest (e.g., in the examples provided
for Bulgaria and Romania). At certain periods it is useful to have a countrywide
overview and this was certainly the case in the transition period when land-cover/
use dynamics were high. In that respect the projects were timely in providing the
datasets at a time when a lot of decisions had to be taken in each country. Based on
these overviews so-called ‘hotspots’ of change could be identified where more
detailed studies were useful. The projects described show also that the dynamics in
agriculture are higher than in forestry and accordingly request a different frequency
for up-to-date and reliable data.
Whereas CLC allows adding more detailed levels of classes to the pre-defined
class set, LCCS has the advantage that the same concept can be used to generate
more detailed classes and these classes have an intrinsic hierarchical order. The
latter facilitates regrouping of the classes, this is useful when a study requires
various levels of analysis for instance when policies are made at national level
and executed at lower levels (e.g., the change analysis at national and district levels
in Albania). Especially for monitoring and evaluation purposes the parameterised
approach furnishes the parameters that can be measured over time. Thus, it facil-
itates comparison by parameters over time. The CLC methodology has the advan-
tage to cover all Member States and this is of great value in studies at European
314 L.J.M. Jansen et al.

level or cross-border studies. However, for specific purposes it may still be required
to use different dedicated class sets. For example, Lund (1999) made an inventory
of forest definitions all over the world and came across an enormous variety. People
look at the world with different views and all of these views are valuable in better
understanding our environment.
With the experiences gained in the application of LCCS methodology in
land-cover/use data collections, the Eastern European countries can analyse:
• The key factors that may affect the quality of the obtained data (i.e. which
classes are determined with what type of precision? What are the problems in
obtaining a minimum required level of accuracy? How subjective is satellite
image interpretation and does it change over time?); and
• The view and manner of creating the land-cover/use class set, trying to reflect the
real world over time.
It would be of particular interest to examine these questions both for CLC and
LCCS and compare results.
19.4 Further Developments
19.4.1 Data Standardisation and Harmonisation
In practise, results from different surveys will need to be harmonised over time and
space (e.g., in relation to cross-border issues), and reference to existing information
is often required to verify new results (e.g., regarding urban sprawl and landscape
changes). Data harmonisation, being defined as “the intercomparison of datacollected or organised using different classifications dealing with the same subjectmatter” (McConnell and Moran 2001), thus becomes a prerequisite for many data
analyses. However, development of the general-purpose LCCS has led to the
common belief that once such a categorisation system becomes widely adopted
for new surveys the problem of data harmonisation would be overcome because
new data sets would be collected using a single standard system allowing direct
comparison of new class sets, whilst existing class sets could be ‘translated’ into the
adopted system making possible direct class comparison with new class sets
(Jansen et al. 2008). However, this stance that is geared towards data
standardisation, defined as “the use of a single standard basis for classification ofa specific subject” (McConnell and Moran 2001), assumes falsely that the contin-
uous advances in either knowledge, technological developments and/or changing
policy objectives will not have any impact on a categorisation framework or its
application. With each data collection effort lessons are learnt that leave their
imprint on successive efforts (e.g. CLC 1990 versus 2000 (Buttner et al. 2004)).
Data standardisation may thus be an unrealistic expectation and only partly feasible
with the need for data harmonisation always present (Jansen et al. 2008).
19 The Use of the Land-Cover Classification System in Eastern European. . . 315

The main documents available that describe the LCCS 1.0 and 2.0 (Di Gregorio
and Jansen 2000 updated in FAO 2005) lack a formal definition of the cate-
gorisation rules. This represents a problem because, as the software source is not
open, there is no possibility to (easily) understand the behaviour of the software
application. The underlying logic can only be derived experimentally by using the
software intensively and by defining classes step-by-step with the software to know
if they are correct (Jansen et al. 2008). This also means that it is not possible to
propose modifications as the formal definition of classes is missing and thus it is
impossible to adequately describe LCCS (Di Costanzo and Ongaro 2004).
The fundamental structure of LCCS became the International Organization for
Standardization ISO 19144–1 ‘Classification Systems – Part 1: Classification
system structure’ standard in 2009. This standard establishes the structure of a
geographic information categorisation system, together with the mechanism for
defining and registering the parameters. It defines the technical structure of a
register of parameters in accordance with ISO 19135. It is important to differentiate
between this ISO standard and countrywide land-cover/use data collections
executed with LCCS versions 1.0 and 2.0. Furthermore, LCCS was used as the
basis for the ISO 19144–2 ‘Classification Systems – Land Cover Meta Language’
standard established in 2012. LCML comes with a Unified Modelling Language
(UML) diagram. The object-oriented structure of UML is a basis for implementa-
tion in languages like Java or C++. In order to use the LCML as a reference for the
implementation of land-cover categorisation software application, it is necessary to
transform the UML concept model into a computer-oriented format. The Extensible
Mark-up Language (XML) schema language from the World Wide Web Consor-
tium has been selected for its immediate compliance with object-oriented struc-
tures, for its worldwide diffusion and for its soundness in terms of documentation
resources, development and support (see www.glcn.org). With the UML there is
finally a formal description of LCCS that provides insights into the categorisation
rules and that can form the basis for further developments by scientists and the user
community.
As described by Jansen et al. (2008), it may be necessary to ‘translate’ a class set
into a third system, a so-called reference system that functions like a bridge between
two class sets: each class in the original class sets will find its more or less
corresponding class in the reference system. The use of a reference system may
be a sensible choice when many class sets are involved as the number of pair-wise
class combinations becomes excessive with comparison of n class sets requiring
n(n-1)/2 comparisons to be made. As Wyatt and Gerard (2001) point out, the use of
a reference system requires a single ‘translation’ from each original class set into
the reference system and obviates the need for pair-wise class comparisons between
every class set of interest. LCCS would like to function as such a reference system
but, as has been pointed out by Jansen et al. (2008) using a number of class sets
from the Nordic countries, the system falls short in many ways.
Nonetheless, FAO presents efforts that are limited to a crosswalk ‘translation’
effort between categorisation systems and/or class sets that ignore the complexity
of harmonisation. For example, overviews in which FAO shows that country
316 L.J.M. Jansen et al.

land-cover maps are ‘translated’ into LCCS (e.g., as shown by Herold et al. 2006)
offer the wrong impression of data harmonisation as such efforts have been limited
to correspondence of original classes (i.e. legends) with LCCS rather than having
examined the full meaning of the data (Jansen et al. 2008).
19.4.2 Monitoring Agriculture with Remote Sensing (MARS)
The ‘Land-Cover Meta Language’ (LCML) offers ample possibilities to harmonise
different land-cover categorisations and class sets. It is also proposed as one
possible transformation mechanism in the draft INSPIRE data specification.
This will assist to address the need from the EU agricultural policy community
for a unambiguous description of the land, exclusively based on its physical nature
and independent of land-use considerations, linguistic and/or traditional con-
notations. This development is a unique opportunity in Europe to apply LCCS
and LCML.
The GeoCAP action of the Monitoring Agriculture with Remote Sensing
(MARS) Unit of the European Commission Joint Research Centre (JRC), integrated
LCCS as a central component of the common methodology for the annual quality
assessment of the Land Parcel Identification System (LPIS) that is implemented by
all EU Member States. The importance of the LPIS comes from the requirement
that it must channel all area-based subsidies under the Common Agricultural Policy
(CAP; Council Regulation EC 2009R73) totalling around 41 billion Euro in 2011.
For this specific purpose, the LPIS quality can roughly be defined as the ability of
the system to fulfil two explicit LPIS functions:
• The unambiguous identification of all declared agricultural parcels by farmer
and inspectors; and
• The quantification of all eligible area for farmer declarations and cross-checks
during the administrative controls by the Paying Agency in the respective
countries.
Failure of LPIS in the unambiguous identification (i.e. the geographical location)
induces risks for double declarations of land and for ineffective inspections, while
inadequate quantification of eligible area renders the cross-checks ineffective for
preventing and identifying over-declarations by farmers. Both failures involve
financial risks for the EU Funds. The high financial impact calls for a transparent
and pan-European reporting system on the ability of the LPIS to perform these
functions with adequate quality.
The definitions and requirements for the geographic data, related to the Inte-
grated Administration and Control System (IACS) and LPIS, are laid down in the
CAP Regulations. A key parameter is the definition of the eligible hectares required
to activate payment. Council Regulation 73 from 2009 states: “‘Eligible hectare’shall mean any agricultural area of the holding taken up by arable land andpermanent pasture or permanent crops,” or “parcels taken up by arable land,
19 The Use of the Land-Cover Classification System in Eastern European. . . 317
permanent grassland, permanent crops, kitchen gardens or planted with shortrotation coppice shall be eligible”. However, as legal, financial, land-use or
production related criteria can also be considered for granting payment, the key
characterisation of land did not always receive due attention. The EU Member
States were using different conceptual frameworks in order to define and map
eligibility, but all states applied land-cover and land-use related approaches.
This is also due to the variety of landscapes, climate, agricultural practices and
land management approaches across Europe. Currently there is consensus among
the technical actors in the LPIS domain that in the current EU regulation the term
‘eligible hectares’ is clearly land-cover oriented, while other qualifying conditions
for a particular subsidy application are referring to the farmer’s socio-economic
activity and are thus land-use oriented.
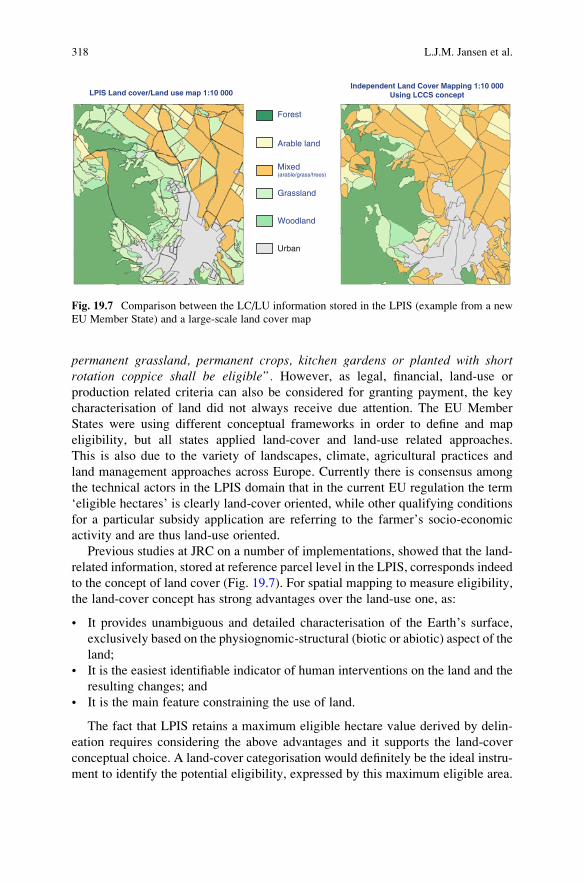
Previous studies at JRC on a number of implementations, showed that the land-
related information, stored at reference parcel level in the LPIS, corresponds indeed
to the concept of land cover (Fig. 19.7). For spatial mapping to measure eligibility,
the land-cover concept has strong advantages over the land-use one, as:
• It provides unambiguous and detailed characterisation of the Earth’s surface,
exclusively based on the physiognomic-structural (biotic or abiotic) aspect of the
land;
• It is the easiest identifiable indicator of human interventions on the land and the
resulting changes; and
• It is the main feature constraining the use of land.
The fact that LPIS retains a maximum eligible hectare value derived by delin-
eation requires considering the above advantages and it supports the land-cover
conceptual choice. A land-cover categorisation would definitely be the ideal instru-
ment to identify the potential eligibility, expressed by this maximum eligible area.
Independent Land Cover Mapping 1:10 000Using LCCS conceptLPIS Land cover/Land use map 1:10 000
Forest
Arable land
Mixed (arable/grass/trees)
Grassland
Woodland
Urban
Fig. 19.7 Comparison between the LC/LU information stored in the LPIS (example from a new
EU Member State) and a large-scale land cover map
318 L.J.M. Jansen et al.

As laid down in Article 17 of Council Regulation 73/2009, the spatial information
stored in the LPIS should be compliant with the cartographic standards applied at a
scale of 1:10,000 or larger. Such large-scale land-cover mapping requires a particular
approach, taking into account that:
• This deals with much higher information contents than the regional land-cover
mapping, traditionally performed at 1:50,000 to 1:100,000 scales.
• There are different landscapes involved, as the EU Member States cover the
major part of the European continent.
• The ‘eligibility’ concept, although applied by the individual EU Member States,
should ensure an equal treatment of all European farmers.
Studies showed that a single land-cover class set cannot be realistically applied
to the 27 EU Member States at the large scale required for LPIS.
For these reasons, a common quality assessment requires a universal identifica-
tion and categorisation of the land-cover types (Milenov and Devos 2009, 2012).
It was necessary to adopt a systematic framework, or a standard categorisation
system, to characterise all agricultural land using a set of well-defined diagnostic
criteria. The definition of the land-cover classes and the respective criteria had to be
independent of data capture technology and (to some extent) scale. JRC decided to
use the LCCS to ‘map’ this land potentially eligible for payment, as it provided a
common language, a common environment and common ‘business rules’. LCCS
provided the conceptual framework for this comprehensive description of any type
of agricultural land cover using a minimum number of parameters. It is flexible in
accommodating the variety of country-specific land-cover types and in enabling
comparisons between land-cover types. The LCCS methodology also comprises
the concept of the variable minimum mapable area and it could handle, in a
standardised manner, intrinsically mixed land-cover units, these are important
issues in the context of LPIS.
In the framework of the LPIS Quality Assessment, the semantic ‘bridge’
between land cover and eligibility was implemented through the concept of the
so-called ‘eligibility profile’ (Devos 2011). It is a conversion table allowing
mapped land-cover features to be expressed as eligibility for agricultural payments.
It quantifies in a single methodology through joining the common class set of land-
cover features with the national rules for support schemes applied to the measured
areas (Fig. 19.8). It converts thus the results of the land-cover mapping into ‘eligible
hectares or eligible features found’, for each land-cover class defined and coded apriori through LCCS in each Member State.
The first year of the LPIS Quality Assessment implementation demonstrated that
the introduction of the consistent approach for quantification of the eligible land
through the use of standardised and concise land-cover semantics provided
extremely valuable feedback to the EC and EU Member States with respect to the
understanding of the agricultural landscapes in Europe and contributed to the
harmonisation of the land-cover concepts for this community at EU level.
19 The Use of the Land-Cover Classification System in Eastern European. . . 319

19.5 The Way Forward to Categorisation
“To classify is human” as Bowker and Star (1999) stated. Few categorisations take
formal shape or any formal algorithm, even fewer categorisations are standardised.
Yet, we all use (in)formal categorisations on a daily basis, intentionally or inad-
vertently. The knowledge about which categorisation will be useful under certain
conditions and at a given moment is embodied in our responsibilities and routines in
a certain context. At the level of policy, categorisation of areas, uses and covers
plays an equally important role. The categorisation of an area as either nature
reserve or industrial will have a clear impact on future economic decisions. Thus,
the relation between categorisation and decision-making may be invisible but is
evidently powerful. Nowadays in the information era, scientists work on the design,
description and choice of categorisation systems embodying choices that create
people’s identities but few people realise how much impact a categorisation may
have. In the context of land cover, in Europe the CLC contributed in creating a
European identity; the LCCS contributes in creating a UN identity (Jansen 2010).
Categorisations embody a worldview and each category and class in it values this
specific viewpoint. This is in itself not critical as long as it is recognized that another
viewpoint may be silenced, which may be the case if a single categorisation becomes
the preferred standard. From the analysis of semantic information and used defini-
tions one can deduce something about this view and the intent of the data producers,
but much more transparency is needed. Also more insights in the design of
categorisation systems is needed and research examining their impact. The effort of
attaching objects to categories and the ways in which those categories are ordered
into systems is often disregarded. In the land-cover domain, for instance, several class
definitions in CLC (CEC 1999; Bossard et al. 2000) or in LCCS (FAO 2005) are
described by taking a bird’s eye view, or map view, rather than a geographic entityview probably because these systems are used in remote sensing (Jansen 2010).
Categorisation facilitates the communication of knowledge concerning specific
phenomena (e.g., land use and land cover) between individuals. Ideally cate-
gorisations are able to travel across the borders of (scientific) communities, of
which the individuals are part, and maintain some sort of constant identity.
Fig. 19.8 Examples of categorisation of LPIS land cover using LCCS
320 L.J.M. Jansen et al.

The tangible results of categorisation are classes and categories that serve as the
vehicles for communication of meaning (Ahlqvist 2008). Parameters used in the
categorisation are usually not tangible, simply because they are usually inexplicit
rather than explicit. The members in each class or category have definable charac-
teristics in common and with the use of categorisation one can discover general
truths related to the distinguished classes or categories rather than to their individ-
ual members (Shapiro 1959). Categorisation is, at the same time, a simplification
because it represents only part of the complexity of reality (like models represent
simplifications of the real world). Different perspectives, or so-called ‘scapes’, to
categorisation can be taken that are all equally valid and valuable (Veldkamp 2009)
One needs to recognise, therefore, that no categorisation reflects accurately the
social or the natural world (Bowker and Star 1999). Categorisations arise out of
social communication needs but they serve specific purposes: not only do they
reflect the ideas of a certain community or institution, but they can also be the
end-result of negotiating and reconciling individual, group and institutional differ-
ences (Ahlqvist 2008). This is particularly true for CLC representing the EU
community and LCCS representing the UN community.
Definitions expressed in natural language associated by sub-type/super-type
relationships, i.e. hierarchical relationships, are called terminological ontologies(Sowa 2000). Almost all land-use and land-cover categorisations to date are
terminological ontologies (e.g., CLC and LCCS). Ontology is an explicit specifi-
cation of a conceptualisation to represent shared knowledge (Gruber 1993; Ahlqvist
2008). Semantic information can be determined from the definitions of the ontology
and the representation of categories can be enriched with semantic properties
(e.g., purpose, time, location, etc.) and relations (e.g., “is-a”, “is-a-part-of”, “asso-
ciated-with”, etc.) in order to reveal similarities and heterogeneities (Kavouras
et al. 2005). Recognition of semantic heterogeneity is the basis for creating sound
data linkages between multiple datasets that are needed for land-change analysis,
monitoring and modelling for land-use planning, land development, policy
(e.g., EU CAP) and informed decision-making.
As Cihlar and Jansen (2001), Comber et al. (2005, 2007) and Ahlqvist (2008)
point out: manifold ways to conceptualise and communicate knowledge exist
according to the disciplines of (groups of) experts, professions, etc., so that there
are necessarily many-to-many relationships between classes and thus inherent
ambiguity in any categorisation. Categorisations contribute to communication of
knowledge and in making joint progress in that knowledge by facilitating com-
munication. However, they can only make such contributions by being dynamic innature. By keeping the voices of parameters and their constituents present, as is the
case in parameterised categorisations, the maximum flexibility of the system is
retained. This includes the key ability to be able to change with changing knowl-
edge, technological developments and changing policy objectives (Jansen 2010).
In this respect LCCS has an advantage over CLC.
Collection of data leads to the creation of categories. Contrary to old hierarchi-
cal class and data sets (or databases), where relations had to be decided once for
all the time of original creation, many class and data sets today incorporate
19 The Use of the Land-Cover Classification System in Eastern European. . . 321
object-oriented views whereby different parameters can be selected and combined
on the fly for different purposes (Bowker and Star 1999). Object-oriented inter-
pretation exists already in remote sensing (as used in Romania and Bulgaria) and
also in the approach to databases (as used in Albania). But what about an object-
oriented approach to categorisation? Parametric Object-Oriented Data Models
(POODM) should take the place of old-fashioned categorisation systems, like
CLC and LCCS, because they allow an unprecedented flexibility and capability
in the design and use of very complex information systems and environmental
change requires such an information system. Such a POODM should use the UML
as standard, something both CLC and LCCS miss (though LCML has) and thereby
neglect fulfilling the ISO 19100 standard. These parameterised multi-level class
and data sets put more emphasis on the parameters to be used than on the structure
in which these are organised. This approach is dynamic, easily adaptable under
changing circumstances (Jansen 2010).
Based on the fact that categorisations are dynamic in nature one could argue that
the definitions of Shapiro (1959), Sokal (1974), and FAO (2005) or even the
definition applied in the documents of ISO/TC 211 should be abandoned in favour
of a modified version of the definition of Bowker and Star (1999): categorisationis a spatial, temporal, or spatio-temporal, and organisational hierarchy basedsegmentation of the world. This definition emphasizes that the dimensions of time
and space are imperative in determining a categorisation, as well as the organi-
sational level. In the case of a non-hierarchical system one could speak of zero
organisational hierarchy, analogue to zero tillage when no tillage occurs.
The most commonly used categorisation systems are hierarchically structured
(e.g., plant taxonomy). To many ecologists it has been long apparent that ecological
systems are structured as such (Egler 1942; Schultz 1967). Early on it was also
acknowledged that “it is not to be assumed that some one classification will one daybe found, and all others will then be abandoned. Each classification serves a certainpurpose, and will continue to exist by its own right” (Egler 1942). Thus, there is notone categorisation that best characterises land cover or land use. In addition, it
seems not fruitful to go in search of the one hierarchy because there is no single,
a priori parameter for developing such a hierarchy. Instead, a number of different
hierarchies may be used to address different problems. With standardisation one
runs the risk of adopting a categorisation with a determined hierarchy that fits a
predetermined purpose. Adopting such a categorisation for another purpose
involves working with a system with a bias that might force our thinking into the
framework that was designed for, and is probably more appropriate for, another
problem area. Currently, there is no a priori designation of hierarchy imposed by
the social and biophysical sciences in such a way that no other manner of looking at
either land use or land cover is feasible or useful. The hierarchy theory also includes
that principles developed at one hierarchical level cannot be transposed to higher
and lower levels. Clear distinction of type and category within the hierarchy will
not lead to more scientific progress. It is the inherent and awkward ambiguities of
land cover and land use that should be included in the more innovative approach
of using fuzzy set theory as the mathematical theory underlying categorisation.
322 L.J.M. Jansen et al.

Thus, to be truly innovative, this means a move away from existing systems like
CLC and from LCCS to LCML (Jansen 2010). Together with the methodological
way forward is also the potential future use by the land monitoring community of
the detailed LPIS datasets (currently these data are unavailable to them), collected
each year, to generate land-cover data sets covering the country or areas of specific
interest.
Acknowledgements The authors gratefully acknowledge Carlo Travaglia, former Technical
Officer at the FAO Environment and Natural Resources Service, who was the driving force for
initiating and managing the projects in Azerbaijan, Bulgaria, Moldova and Romania.
References
Ahlqvist O (2008) In search for classification that supports the dynamics of science: the FAO
Land-Cover Classification System and proposed modifications. Environ Plan B 35:169–186
Badea A, Herisanu Gh (2002) The FAO concept for land-use and land-cover classification
(Sistemul de clasificare Land Use, Land Cover in conceptia FAO). Analele Universitatii
Spiru Haret, Seria Geografie No.4, Editura Fundatiei Romania de Maine
Badea A, Dana IF, Moise C, Badea R, Mamulea A (2007) A method for multi-source data
exploitation, support for crisis situations management. Case study: floods in Romania 2005–
2006. In: Katalinic B (ed) Annals of DAAAM 2007/Proceedings of the 18th international
DAAAM symposium. Published by DAAAM International, Vienna, Austria, 23 pp
Badea A, Dana IF, Moise C, Mamulea AA, Olteanu VG, Poenaru VD (2008) Land cover GIS
databases, support for the implementation of the European agriculture and environment pro-
grams. In: Katalinic B (ed) Annals of DAAAM 2008/Proceedings of the 19th international
DAAAM symposium. Published by DAAAM International, Vienna, Austria, 24 pp
Bossard M, Feranec J, Otahel J (2000) CORINE land cover technical guide – addendum 2000.
Technical report 40. European Environment Agency, Copenhagen, 105 pp
Bowker GC, Star SL (1999) Sorting things out: classification and its consequences. MIT Press,
Cambridge, MA
Buttner G, Feranec J, Jaffrain G, Mari L, Maucha G, Soukup T (2004) The European CORINE
land cover 2000 project. XX Congress of the International Society for Photogrammetry and
Remote Sensing, Istanbul, Turkey, 12–23 July 2004, 12 pp
CEC (1999) CORINE land cover. Brussels
Cihlar J, Jansen LJM (2001) From land cover to land use: a methodology for efficient land-use
mapping over large areas. Prof Geogr 53(2):275–289
Comber A, Fisher P, Wadsworth R (2005) What is land cover? Environ Plan B Plan Des
23:199–209
Comber AJ, Fisher PF, Wadsworth RA (2007) Land cover: to standardise or not to standardise?
Comment on ‘Evolving standards in land-cover characterisation’ by Herold et al. J Land Use
Sci 2(4):283–287
Deininger K (2003) Land policies for growth and poverty reduction. World Bank Policy Research
Report. June 2003. World Bank/Oxford University Press, 239 pp
Devos W (2011) LPIS quality inspection: EU requirements and methodology, European Com-
mission Joint Research Centre. Available at ftp://mars.jrc.ec.europa.eu/LPIS/Documents/
13422_October2011.pdf
Di Costanzo M, Ongaro L (2004) The Land-Cover Classification System (LCCS) as a formal
language: a proposal. J Agric Environ Int Dev 98(3–4):117–164
19 The Use of the Land-Cover Classification System in Eastern European. . . 323
Di Gregorio A, Jansen LJM (1998) A new concept for a land-cover classification system. The Land
2(1):55–65
Di Gregorio A, Jansen LJM (2000) Land-Cover Classification System (LCCS): classification
concepts and user manual. FAO/UNEP/Cooperazione Italiana, Rome, 177 pp. (Incl.
CD-ROM with application software)
Docan DC, Dana IF, Badea A, Moise C, Badea R (2007) Adopted methods of spatial information
analysis developed and implemented in the framework of IACS-LPIS set-up in Romania.
In: Katalinic B (ed) Annals of DAAAM 2007/Proceedings of the 18th international DAAAM
symposium, Published by DAAAM International, Vienna, Austria
Egler FE (1942) Vegetation as an object of study. Philos Sci 9:245–260
FAO (2005) Land-Cover Classification System – classification concepts and user manual.
Software version 2. Environment and Natural Resources Series 8, Rome, 190 pp
FAO (2012) Voluntary guidelines on the responsible governance of tenure of land, fisheries and
forests. Final draft 9 March 2012, Rome, Italy, 34 pp
Groom G (ed) (2004) Developments in strategic landscape monitoring for the Nordic countries.
ANP2004:705. Nordic Council of Ministers, Copenhagen, 167 pp
Gruber TR (1993) Towards principles for the design of ontologies used for knowledge sharing.
Int J Hum Comput Stud 43:907–928
Herold M, Latham JS, Di Gregorio A, Schmullius CC (2006) Evolving standards in land-cover
characterisation. J Land Use Sci 1(2–4):157–168
Jansen LJM (2006) Harmonisation of land-use class sets to facilitate compatibility and compara-
bility of data across space and time. J Land Use Sci 1(2–4):127–156
Jansen LJM (2010) Analysis of land change with parameterised multi-level class sets. Exploring
the semantic dimension. Ph.D. thesis, Wageningen University, Wageningen, The Netherlands,
229 pp
Jansen LJM, Di Gregorio A (2002) Parametric land-cover and land-use classifications as tools for
environmental change detection. Agr Ecosyst Environ 91(1–3):89–100
Jansen LJM, Veldkamp A (2012) Evaluation of the variation in semantic contents of class sets on
modelling dynamics of land-use changes. Int J Geogr Inf Sci 26(4):717–746
Jansen LJM, Carrai G, Morandini L, Cerutti PO, Spisni A (2006) Analysis of the spatio-temporal
and semantic aspects of land-cover/use change dynamics 1991–2001 in Albania at national and
district levels. Environ Monit Assess 119:107–136
Jansen LJM, Groom GB, Carrai G (2008) Land-cover harmonisation and semantic similarity:
some methodological issues. J Land Use Sci 3(2–3):131–160
Kavouras M, Kokla M, Tomai E (2005) Comparing categories among geographic ontologies.
Comput Geosci 31:145–154
Kuechler AW, Zonneveld IS (eds) (1988) Vegetation mapping, vol 10, Handbook of vegetation
science. Kluwer, Dordrecht
Kuemmerle T, Hostert P, Radeloff VC, Van der Linden S, Perzanowski K, Kruhlov I (2008) Cross-
border comparison of post-socialist farmland abandonment in the Carpathians. Ecosystems
11:614–628
Larsson G (2002) Matching land use and land tenure arrangements for developing programmes.
Landnutz Landentwickl 43:71–77
Lund HG (1999) A ‘forest’ by any other name. . .. Environ Sci Policy 2:125–133
Mamulea AA, Dana IF (2008) Combined method for thematic update of the land-use inventory by
remote sensing/GIS technology. Support for the Implementation of the European Agriculture
and Environment Programs, Rev. CAD Journal of Geodesy and Cadastre 8, Alba Iulia,
Romania
McConnell WJ, Moran EF (eds) (2001) Meeting in the middle: the challenge of meso-level
integration. In: An international workshop on the harmonisation of land-use and land-cover
classification, Ispra, Italy. LUCC Report Series No. 5. Anthropological Center for Training and
Research on Global Environmental Change – Indiana University and LUCC International
Project Office, Louvain-la-Neuve, 17–20 Oct 2000
324 L.J.M. Jansen et al.

Milenov P, DevosW (2009) Standardisation of the land-cover classes in the LPIS using FAO Land
Cover Classification System (LCCS). In: 33rd international symposium on remote sensing of
environment, Stresa, Italy, 4–8 May 2009
Milenov P, Devos W (2012) ANNEX III, Executable Test Suite (ETS), The concept of land cover
and ‘eligible hectares’. Version 5.2. EUR 25185 EN. Available at http://mars.jrc.ec.europa.eu/
mars/content/download/2467/12676/file/LBNA25185ENN.pdf
Milenov P, Vassilev V, Radkov R, Samundzhi V, Nakov D (2004) RS/GIS for environmental and
urban management in the Lower Danube region – Rousse pilot study. The Danube and Europe:
Integrated Space Applications in the Danube, Mamaia, Romania
Milenova L, Vassilev V, Spiridonov V, Kolev S, Konstantinov V (2003) Concept of integrated
system for information and management of forest fires in Bulgaria. In: International space
technologies exhibition and conference, Ankara, Turkey, 6–8 May 2003
Nedkov R, Vassilev V, Pironkova Z, Milenov P (2000) Integration of satellite images and GIS
technologies for the purposes of land use. J Probl Geogr 1–4:359–363
Olteanu VG, Badea A, Dana IF, Moise C, Jivanescu IE, Poenaru VD (2009) Change detection land
cover GIS databases. LCCS and CLC. In: Annals of DAAAM 2009/Proceedings of the 20th
international DAAAM symposium, vol 20. Published by DAAAM International Vienna,
Austria
Papanastasis V (2003) Special study on grazing impact on wooded lands, including fuel wood
consumption assessment. Technical report. World Bank Albanian National Forest Inventory
project. Agrotec S.p.A., Rome, 68 pp
Schultz AM (1967) The ecosystem as a conceptual tool in the management of natural resources.
In: Cieriacy-Wantrup SV (ed) Natural resources: quality and quantity. University of California
Press, Berkeley, pp 139–161
Shapiro ID (1959) Urban land-use classification. Land Econ 35(2):149–155
Sokal R (1974) Classification: purposes, principles, progress, prospects. Science 185
(4157):1115–1123
Sowa JF (2000) Knowledge representation: logical, philosophical and computational foundations.
Brooks Cole Publishing Co., Pacific Grove, 594 pp
Swinnen JFM (1999) The political economy of land reform choices in Central and Eastern Europe.
Econ Transit 7(3):637–664
Travaglia C, Milenova L, Nedkov R, Vassilev V, Milenov P, Radkov R, Pironkova Z (2001)
Preparation of land-cover database of Bulgaria through remote sensing and GIS. FAO
environment and natural resources working paper No. 6. FAO, Rome
Van der Molen P, Jansen LJM (2010) Urban and rural land management in the Netherlands: the
role of the State as policy maker and landowner. Keynote speech, ARGE/AdV international
land management symposium land management strategies for improving urban–rural
inter-relationships – best practices and regional solutions, Hanover, Germany, 10–11 May
2010, 20 pp
Veldkamp A (2009) Investigating land dynamics: future research perspectives. J Land Use Sci 4
(1):5–14
Williamson I, Enemark S, Wallace J, Rajabifard A (2010) Land administration for sustainable
development. ESRI Press Academic, Redlands, 487 pp
Wyatt BK, Gerard FF (2001) What’s in a name? Approaches to the inter-comparison of land-use
and land-cover classifications. In: Groom G, Reed T (eds) Strategic landscape monitoring for
the Nordic countries. TemaNord 523. Nordic Council of Ministers, Copenhagen, pp 113–121
19 The Use of the Land-Cover Classification System in Eastern European. . . 325