Rapid assessment of psychosocial well-being: Are computers the way forward in a clinical setting?
25
Southern Cross University ePublications@SCU School of Education School of Education 2002 Rapid assessment of psychosocial well-being: are computers the way forward in a clinical setting? Allison W. Boyes University of Newcastle Sallie Newell Southern Cross University, [email protected] Afaf Girgis University of Newcastle ePublications@SCU is an electronic repository administered by Southern Cross University Library. Its goal is to capture and preserve the intellectual output of Southern Cross University authors and researchers, and to increase visibility and impact through open access to researchers around the world. For further information please contact [email protected]. Suggested Citation Post-print of: Boyes, AW, Newell, S & Girgis, A 2002, 'Rapid assessment of psychosocial well-being: Are computers the way forward in a clinical setting?', Quality of Life Research, vol.11, no. 1, pp. 27-35. The original publication is available at www.springerlink.com Publisher version of article availble at http://dx.doi.org/10.1023/A:1014407819645
Transcript of Rapid assessment of psychosocial well-being: Are computers the way forward in a clinical setting?
Southern Cross UniversityePublications@SCU
School of Education School of Education
2002
Rapid assessment of psychosocial well-being: arecomputers the way forward in a clinical setting?Allison W. BoyesUniversity of Newcastle
Sallie NewellSouthern Cross University, [email protected]
Afaf GirgisUniversity of Newcastle
ePublications@SCU is an electronic repository administered by Southern Cross University Library. Its goal is to capture and preserve the intellectualoutput of Southern Cross University authors and researchers, and to increase visibility and impact through open access to researchers around theworld. For further information please contact [email protected].
Suggested CitationPost-print of: Boyes, AW, Newell, S & Girgis, A 2002, 'Rapid assessment of psychosocial well-being: Are computers the way forwardin a clinical setting?', Quality of Life Research, vol.11, no. 1, pp. 27-35.The original publication is available at www.springerlink.comPublisher version of article availble at http://dx.doi.org/10.1023/A:1014407819645
Computer assessment of psychosocial well-being
1
Rapid assessment of psychosocial well-being:
are computers the way forward in a clinical setting?
Allison Boyes MPH 1
Sallie Newell PhD 1,2,3
Afaf Girgis PhD 1,3
1 Cancer Education Research Program (CERP), The Cancer Council NSW/University of
Newcastle, Australia
2 currently at Health Promotion Unit, Northern Rivers Area Health Services, Lismore,
Australia
3 Faculty of Medicine and Health Sciences, University of Newcastle, Australia
This project was undertaken by the Cancer Council New South Wales' Cancer Education Research
Program. The views expressed are not necessarily those of the Cancer Council. The authors are
grateful to Professor Michael Friedlander and staff of the medical oncology unit at Prince of Wales
Hospital and Professor John Kearsley and staff at the radiation oncology unit at St George Hospital
for their cooperation; the patients who generously gave their time to participate; Cheryl Meiners,
Bev Kevill and Brian Swain for their assistance in undertaking this research and Sally Burrows and
Ian Clare for statistical advice and support.
Correspondence: The Secretary, Cancer Education Research Program, Locked Bag 10, Wallsend,
NSW, 2287, Australia. Phone: 61 2 4924 6372 Fax: 61 2 4924 6208 Email:
Word count: 2,808 (IMRAD)
Computer assessment of psychosocial well-being
2
ABSTRACT
Objective: To compare the agreement between anxiety, depression and supportive care needs
data obtained using a touchscreen computer survey with traditional pen-and-paper surveys.
Methods: 1,304 consecutive patients attending the medical or radiation oncology outpatient
department in two public cancer treatment centres were approached. Of the 357 eligible patients,
355 (99%) consented to participate and 350 (98%) completed both touchscreen computer and
pen-and-paper versions of the Hospital Anxiety and Depression Scale (HADS) and short-form
Supportive Care Needs Survey (SCNS-short).
Results: Simple kappa values indicated moderate agreement ( X =0.57) between the two modes
of survey administration for most HADS items. Simple kappa coefficients indicated only fair
agreement ( X =0.28) when a simplified response option format was used in the computerised
SCNS-short. When the paper and computerised survey used the same response format, simple
kappa coefficients increased and indicated moderate agreement ( X =0.44) for most SCNS-short
items. Kappa coefficients indicated at least moderate agreement (kappa >0.41) in identifying
patients with elevated levels of anxiety and depression; there were no significant differences in
the proportion of patients identified with elevated levels of anxiety and depression according to
computer survey compared to paper survey. PABAK coefficients indicated at least moderate
agreement ( X =0.79) in identifying participants with moderate/high levels of unmet needs.
However, participants tended to report lower levels of unmet needs with a simplified response
format in the computerised SCNS-short compared to the paper survey. This was not observed
when the response format of the computerised SCNS-short replicated the paper survey.
Conclusions: Despite the advantages that computerised surveys offer for simplifying survey
presentation, current results suggest the need to exactly replicate the question and response
option format of the original paper survey to ensure the data collected are equivalent. This
finding is particularly important given the potential application of computerised surveys in the
Computer assessment of psychosocial well-being
3
clinical setting to quickly assess and identify patients’ concerns requiring intervention by health
care providers.
Key words: psychosocial assessment, anxiety, depression, unmet needs, cancer, computer

Computer assessment of psychosocial well-being
4
INTRODUCTION
It has been demonstrated that patients living with cancer experience high levels of anxiety,
depression [1-5] and unmet needs [1,6-10]. Furthermore, physical and psychosocial problems
can have a negative effect on patients' quality of life and compliance with treatment regimes
[11,12]. For example, it has been estimated that up to one-third of patients will abandon
chemotherapy prematurely because of physical and psychosocial symptoms, despite the
potentially life-threatening consequences of such action [12]. Clearly, it is important for
oncologists to detect these issues in their patients and to address them as they occur. However,
several studies have shown that oncologists' awareness of their patients' psychosocial well-being
is less than optimal [3,13,14]. For example, Newell et al [13] found that medical oncologists
tended to overestimate their patients' levels of perceived needs and to underestimate their
patients' levels of anxiety and depression.
The availability of self-report measures assessing cancer patients' anxiety, depression [15] and
supportive care needs [16], provides an opportunity to increase oncologists' awareness of their
patients' psychosocial well-being. For example, patients could complete a survey about their
psychosocial well-being while waiting to see their oncologist, with a summary of their responses
available to the oncologist at the start of the consultation to facilitate clinical interactions and
discussions. However, for such a strategy to be adopted in routine clinical practice, efficient data
collection and feedback strategies need to be identified.
Adapting traditional pen-and-paper surveys to touchscreen computer is a potentially efficient
approach to data collection in the clinical environment. The main advantages of this form of
survey technology include instant data entry and processing [17]; reduced occurrence of missing
data [17-19]; tailored question branching and automatic report production [20]. Previous
Computer assessment of psychosocial well-being
5
research also suggests that despite an overall lack of computer experience and older age,
oncology patients are highly accepting of a touchscreen computer survey to assess psychosocial
well-being [18-21].
However, before the widespread application of automated methods of data collection can be
recommended, it is essential to ensure the quality of the data collected using this form of
computer technology is comparable to that collected by traditional pen-and-paper surveys. A
literature search produced conflicting results when comparing computerised and pen-and-paper
surveys. For example, studies with patients with cancer [18, 20], gastrointestinal disease [17, 22],
diabetes [23] and in psychiatry [24] found the data comparable. However, other studies have
reported differences between the two modes of survey administration [25, 26 ]. It is unknown
whether these findings are survey specific. Therefore, this study aimed to:
(i) compare cancer patients' responses to individual items of a touchscreen computer version of
the Hospital Anxiety and Depression Scale (HADS) and the short-form Supportive Care Needs
Survey (SCNS-short) with validated pen-and-paper versions of the surveys and;
(ii) compare the two modes of survey administration with respect to their accuracy in identifying
patients in need of intervention to address high levels of anxiety, depression or unmet supportive
care needs.
METHODS
Sample
Respondents consisted of people diagnosed with cancer who were in consecutive attendance at
either the medical or radiation oncology outpatients clinic at two major public cancer treatment
centres in the state of New South Wales, Australia. Patient eligibility criteria included: being
aged 18 years or over, attending the clinic for a second or subsequent visit, able to speak and

Computer assessment of psychosocial well-being
6
write English, physically and mentally capable of completing a survey and not having completed
the survey at a previous visit to the clinic.
Procedure
Patients considered eligible by clinic staff were given a written project information sheet and
consent form upon their arrival at the clinic and asked to provide a trained Research Assistant
with their written consent to participate. Consenting patients were asked to complete a pen-and-
paper survey and a touchscreen computer version of the same survey on the same day. The study
received approval from the University of Newcastle's Human Research Ethics Committee and the
ethics committees of participating hospitals.
Measures
Hospital Anxiety and Depression Scale (HADS): The 14-item HADS contains two sub-scales,
containing seven items each [15]. Scores range from 0-21 on each sub-scale and classify
patients’ anxiety and depression levels as low (0-7), borderline (8-10) or clinically significant
(11-21). The instrument has demonstrated validity with cancer patients [27-29].
Short-form Supportive Care Needs Survey (SCNS-short): The SCNS-short was developed from
the existing SCNS [16] and contains 31-items measuring cancer patients’ unmet need for help
across four domains: psychological (8 items), health systems and information (13 items), patient
care and support (7 items), and physical and daily living needs (3 items). For each item, patients
are asked to indicate their level of need for help over the last month as a result of having cancer, by
choosing one of the following response options: ‘no need: not applicable’; ‘no need: already
satisfied’; low need’; ‘moderate need’ or ‘high need’. To preserve the detail of the information
collected, an overall score is not calculated; rather, specific issues where patients require the most

Computer assessment of psychosocial well-being
7
help are identified. The SCNS-short has demonstrated internal reliability and construct validity and
takes approximately 10 minutes to complete.
Demographic and cancer descriptors: An additional 14 questions asked about age, gender,
marital status, level of education, time since diagnosis, remission status, primary cancer site, time
since last received treatment and treatments received in the last month.
Original pen-and-paper and computerised versions of these measures were used. For the HADS,
the instructions, questions and response options were presented exactly the same in both the pen-
and-paper and the computerised survey, with the computerised version presenting one item and
its four response options per screen. In the case of the SCNS-short, two computerised versions
were developed. Consistent with the question and response format of the pen-and-paper survey,
one of the computerised versions presented one item and its five response options per screen. The
other computerised version utilised the flexibility offered by this form of survey administration
by simplifying and tailoring the presentation of questions and response options; initially
presenting one item on a screen to assess whether an unmet need for help was present and if so,
presented a second screen to assess whether the level of need for help for that item was ‘low’,
‘moderate’ or ‘high’.
For all computerised surveys, respondents entered their answers by touching the corresponding
button on the screen. Participants could not move to the next question without answering the
previous one, although it was possible to go back one question and change the response. Three
modes of survey administration with varied order and format were used:
1. CM-P: computer survey (modified version SCNS-short; original version HADS) followed
by the paper survey,

Computer assessment of psychosocial well-being
8
2. P-CM: paper survey followed by computer survey (modified version SCNS-short; original
version HADS) and
3. CO-P: computer survey (original version SCNS-short and HADS) followed by the paper
survey.
Computer assessment of psychosocial well-being
9
Analyses
Item comparisons: To assess the agreement between participants' responses to each item of the
pen-and-paper version and touchscreen computer version of the HADS and SCNS-short, simple
kappa coefficients and the proportion of exact agreement were calculated for each item. Values
of kappa range from 0 to 1. To interpret the kappa coefficients we adopted the widely accepted
but arbitrary indicators where K=0: poor agreement; >0-0.2: slight agreement; 0.21-0.4: fair
agreement; 0.41-0.6: moderate agreement; 0.61-0.8: substantial agreement and 0.81-1.0: almost
perfect agreement [30].
Categorical comparisons: To assess whether the classification of participants as having high
levels of anxiety, depression and supportive care needs varied according to the mode of survey
administration, kappa analyses were undertaken. For each sub-scale of the HADS, participants’
responses were scored and categorised according to the published scoring framework [15] of low
(0-7), borderline (8-10) or clinically significant (11-21). Simple kappa coefficients and the
proportion of exact agreement were calculated for each sub-scale. For the SCNS-short,
participants’ responses were dichotomised as some need versus no need. To correct for the effect
of bias (unbalanced marginal totals) and prevalence (differences in the distribution of data across
the categories), prevalence-adjusted bias-adjusted kappa (PABAK) coefficients and the
proportion of exact agreement [31] were calculated for each item of the SCNS-short.
RESULTS
Sample
Overall, a total of 1,304 outpatients were approached to participate in the study. Of these, 947
(73%) were considered ineligible to participate because they were too ill (n=84), had insufficient
English skills (n=71), were attending the clinic for their first visit (n=63), were aged less than 18

Computer assessment of psychosocial well-being
10
or greater than 85 years (n=22) or had previously completed this survey due to regular visits to
the clinic (n=707). Of the 357 eligible patients, 355 (99%) consented to participate and 350
(98%) completed computer and pen-and-paper surveys.
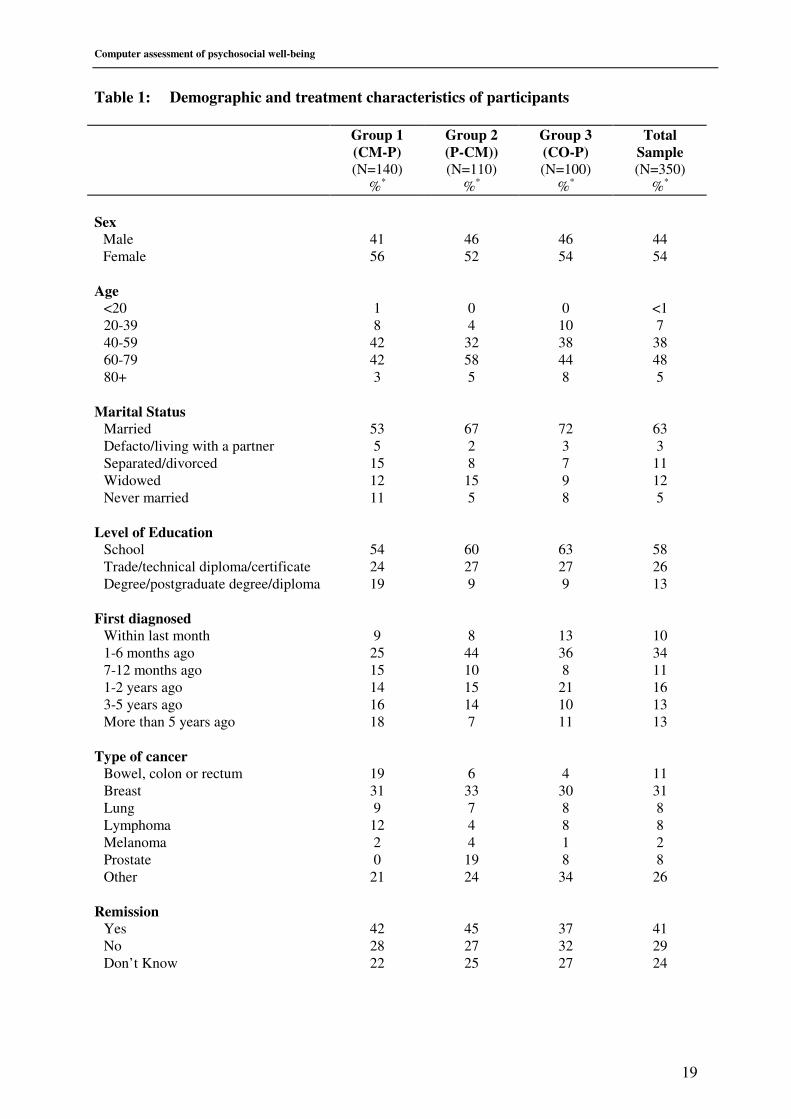
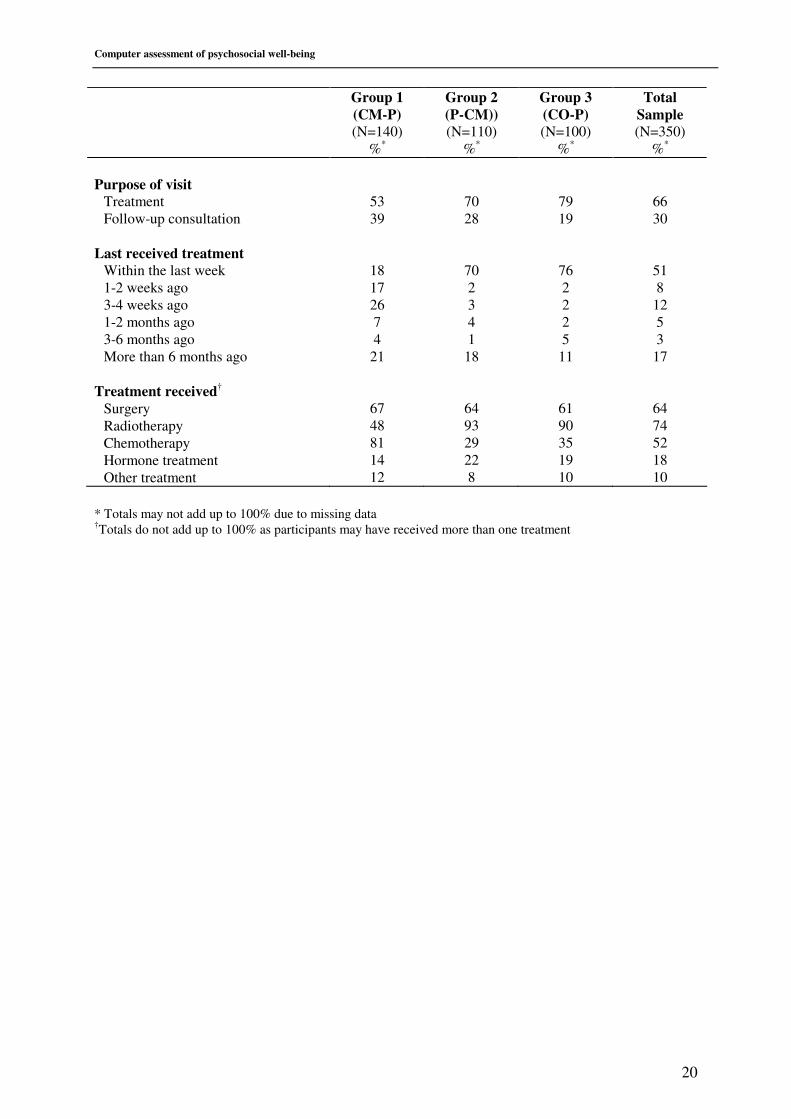
Table 1 summarises the demographic, disease and treatment characteristics of participants.
Given that participants were recruited at various stages of the treatment continuum, some
differences in the distribution of these characteristics between the three groups is expected but
unlikely to affect the way in which participants respond to different modes of survey
administration.
TABLE 1 HERE
Item comparisons
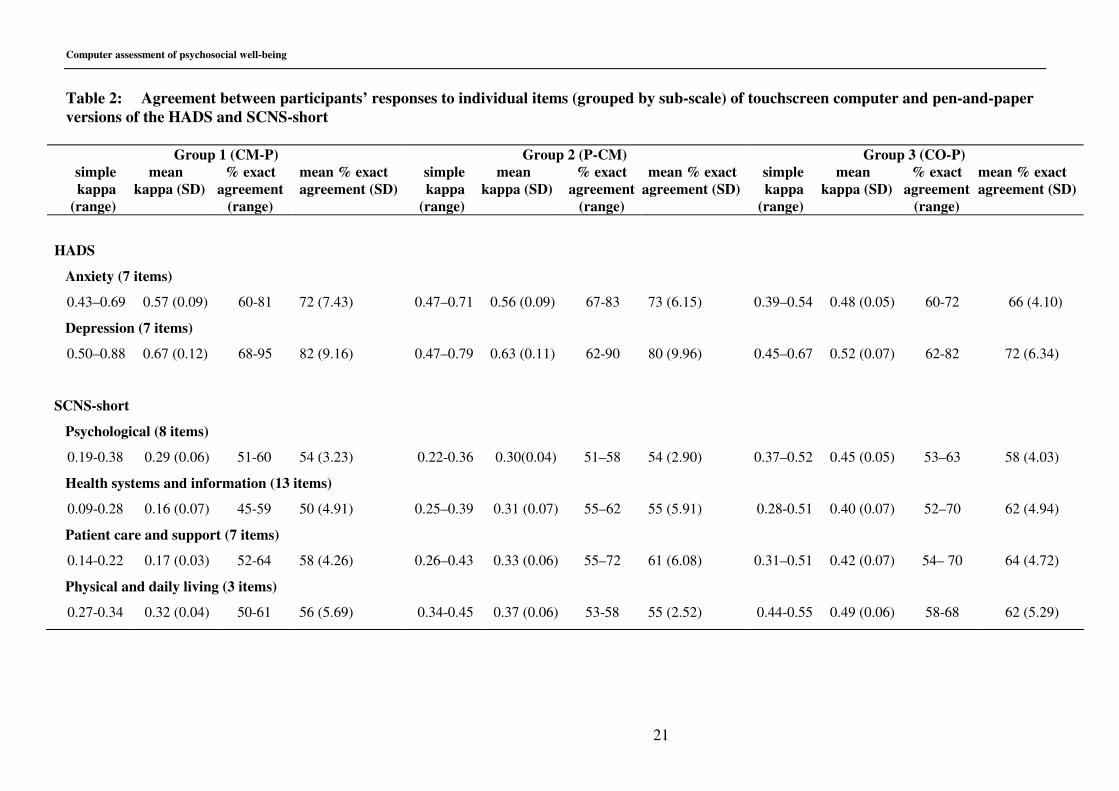
HADS: The agreement between participants' responses to individual items of the computerised
and pen-and-paper versions of the HADS is summarised in Table 2. Overall, the simple kappa
coefficients indicated moderate agreement for most items with values ranging from 0.39-0.88
( X =0.57) and exact agreement from 60% to 95% ( X =74%). For each of the three groups, the
mean kappa values showed moderate agreement (kappa>0.41) or better for both the anxiety and
depression sub-scales.
TABLE 2 HERE
SCNS-short: The agreement between participants' responses to individual items of the
computerised and pen-and-paper versions of the SCNS-short is also summarised in Table 2.
Overall, the simple kappa coefficients for Groups CM-P and P-CM indicated fair agreement for
most of the 31 items with values ranging from 0.09-0.45 ( X =0.28) and exact agreement from
Computer assessment of psychosocial well-being
11
45% to 72% ( X =55%). At the domain level, mean kappa values showed only fair agreement
(≤0.4) at best. In contrast, the simple kappa coefficients for group CO-P were generally higher
overall and indicated moderate agreement for most items with values ranging from 0.28 to 0.55
( X =0.44) and exact agreement from 52%-70% ( X =62%). Furthermore, the mean kappa value
showed moderate agreement (kappa>0.41) for three of the four domains.
Categorical comparisons
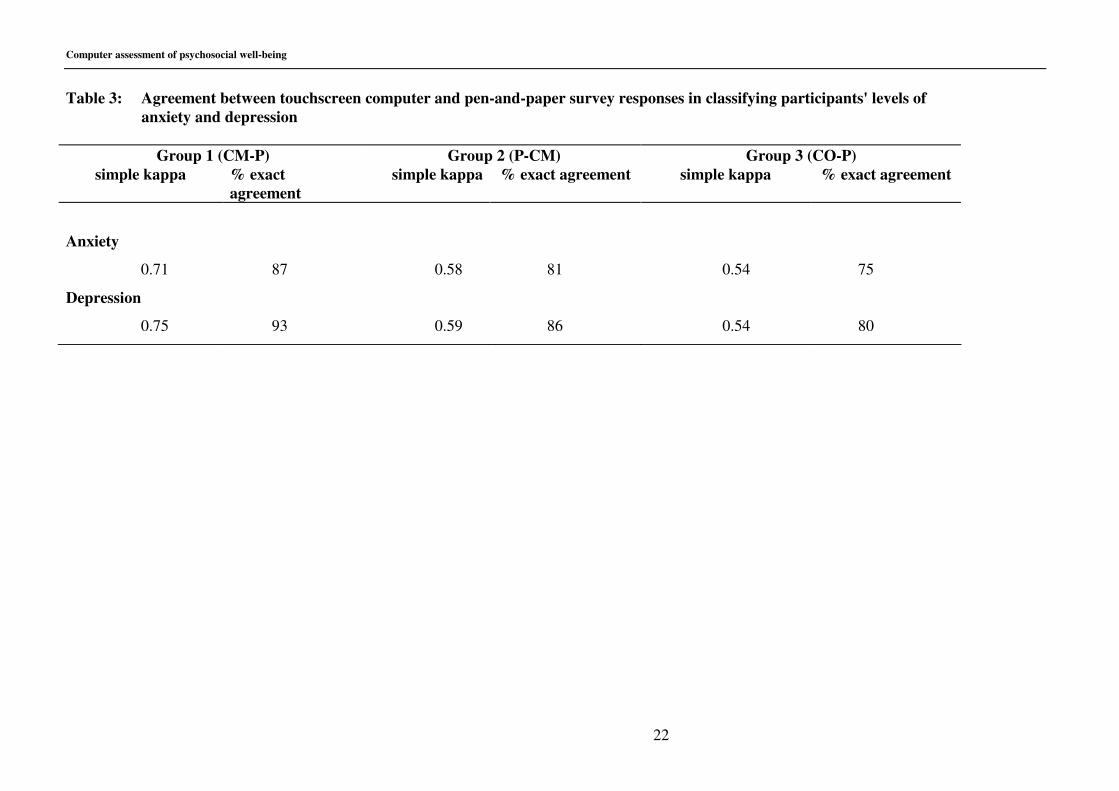
HADS: Table 3 shows the overall level of agreement between the two modes of survey
administration in classifying participants' levels of anxiety and depression. This is based on a
three by three contingency table comparing participants' classification as low, borderline or
clinical according to mode of survey administration. For each sub-scale, the kappa coefficients
showed moderate agreement (kappa>0.41) or better between the two modes of survey
administration in categorising participants' levels of anxiety and depression as low, borderline or
clinical.
TABLE 3 HERE
This is demonstrated further in Table 4 which shows the proportion of participants classified as
clinically anxious or depressed based on responses to the computer survey compared with the
pen-and-paper survey. The proportion of patients identified as having elevated levels of anxiety
and depression according to computer survey responses was similar to that obtained with the
pen-and-paper survey.
TABLE 4 HERE
Computer assessment of psychosocial well-being
12
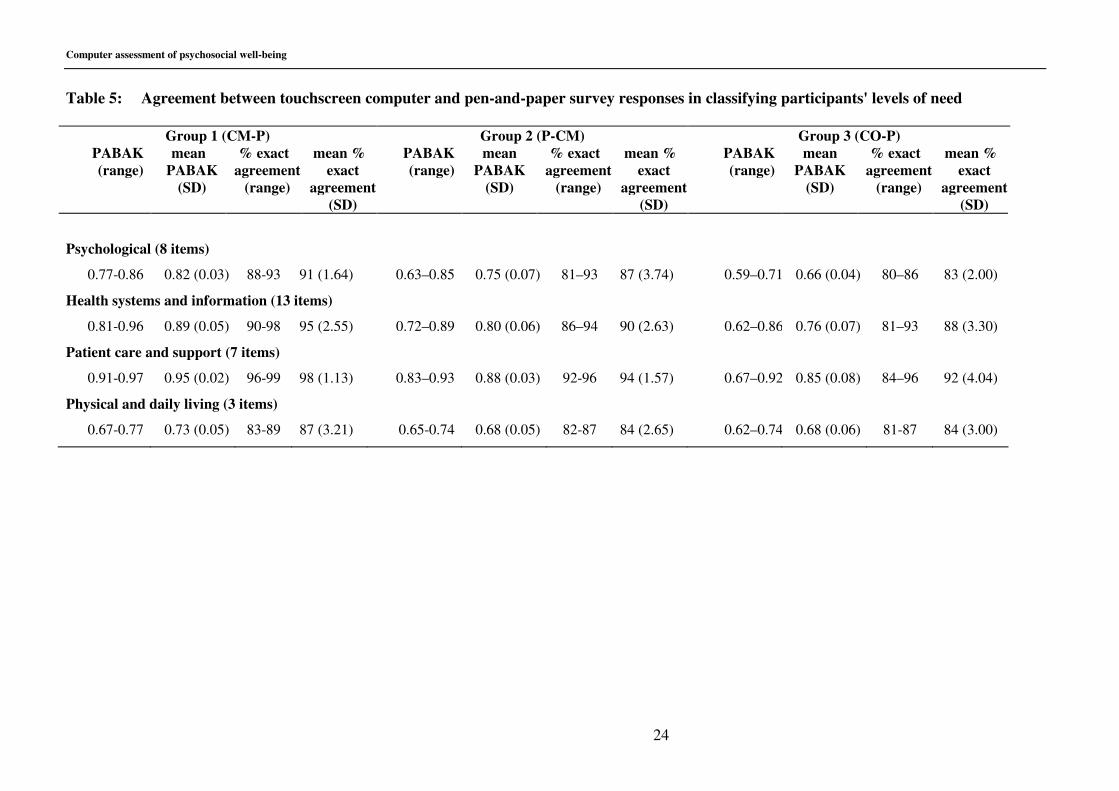
SCNS-short: In order to identify the issues where patients require the most help, participants'
responses to the SCNS are usually dichotomised (moderate/high need versus low/no need) [6].
Table 5 shows the overall level of agreement between the two modes of survey administration in
classifying participants' level of need for help after dichotomising their responses. This is based
on a two by two contingency table for each item, comparing participants' classification as
moderate/high need or low/no need according to mode of survey administration. Overall, the
PABAK coefficients for individual items showed moderate agreement (kappa>0.41) or better
between the two modes of survey administration in categorising participants level of need as
moderate/high or low/no with values ranging from 0.59 to 0.97 ( X =0.79) and exact agreement
from 80% to 99% ( X =89%). Furthermore, for each of the three groups, the mean PABAK
values showed substantial agreement or better (kappa>0.61) for each domain.
TABLE 5 HERE
This is demonstrated further in Table 4 which shows the prevalence of moderate/high needs by
domain for each mode of survey administration. When the modified two-screen question and
answer format was used, participants reported lower levels of need with the computer survey
compared to the pen-and- paper survey. However, when the format of the questions and
responses on the computer survey exactly replicated that of the paper survey, the proportion of
respondents reporting a moderate/high need for help with the computer survey were similar to
that obtained with the pen-and-paper survey, with the exception of the health information domain
where participants tended to report slightly lower levels of need with the touchscreen computer
survey.
DISCUSSION

Computer assessment of psychosocial well-being
13
This study assessed the equivalence of cancer patients' responses to touchscreen computer
versions of the HADS and SCNS-short with pen-and-paper versions of the same surveys. In
keeping with other similar studies [18, 20], the results of the current study suggest that the
collection of data about cancer patients' psychosocial well-being using computerised surveys is
comparable to that collected by pen-and paper surveys.
Given that one of the advantages of touchscreen computer surveys is the ability to simplify and
tailor the presentation of questions and response options, we developed a modified computerised
version of the SCNS-short. This computerised version presented one item on a screen to assess
whether an unmet need for help was present and if so, presented a second screen to assess the
level of need for help. Surprisingly, compared to the original pen-and-paper survey, the
simplified two-screen per item format resulted in lower coefficients of agreement at both the item
and domain level, and a tendency for participants to report fewer moderate/high unmet
supportive care needs. In contrast, when the presentation format of the questions and response
options in the computerised SCNS-short replicated the pen-and-paper survey, agreement
coefficients increased overall and the prevalence of moderate/high unmet needs was similar
between the two modes of survey administration. Furthermore, the computerised version of the
HADS, which replicated the question and response option format of the original pen-and-paper
survey, also showed good agreement coefficients at both the item and sub-scale level and similar
prevalence rates of elevated levels of anxiety and depression.
These findings suggest that the presentation of computerised survey questions and response
options influences participants’ responses. This is in keeping with Velikova et al [18] who found
that patients reported fewer emotional and physical problems when using the touchscreen
computer survey and suggested that this could be due in part to the different format of
Computer assessment of psychosocial well-being
14
presentation. This suggests that despite the advantages that touchscreen computer surveys offer
for filtering and simplifying the presentation of questions and their responses, it is important to
exactly replicate the question and response format of the original paper version to ensure that the
integrity of the instrument is maintained and the data collected are equivalent.
It is without doubt that computerised assessment has great potential in the clinical setting. One
of the most valuable applications of this form of technology is the ability to rapidly assess and
identify patients with high levels of psychological morbidity who may require intervention from
the treatment team. The current study demonstrates that computerised versions of the HADS and
SCNS-short are as accurate as their paper counterparts in identifying patients with clinical and/or
borderline levels of anxiety and depression and moderate/high unmet supportive care needs, but
only when the computerised version exactly replicates the original pen-and-paper survey. This
finding is particularly important to health care providers and other researchers considering using
touchscreen computer surveys as a tool to screen patients on a routine basis.
Some limitations must be kept in mind when considering the present study. Firstly, a randomised
cross-over design is superior to the methodology used in the current study. Furthermore, the
inclusion of a fourth group (P-CO: paper survey followed by computer survey (original version
SCNS-short and HADS) may have provided additional information. It should be pointed out
however, that previous research comparing computerised assessment with pen-and-paper survey
administration found that the order of survey administration did not significantly affect the data
obtained [18]. Secondly, although the study was conducted in only two major cancer treatment
centres in NSW, the high response rate (98%) achieved maximises the representativeness of the
results.

Computer assessment of psychosocial well-being
15
In conclusion, in light of these findings and those of similar studies, and the considerable benefits
of touchscreen computer technology, we recommend the use of this methodology to collect data
about cancer patients' levels of anxiety, depression and unmet supportive care needs. We also
emphasise the need for exact replication of the format of questions and response options when
computerising a survey instrument that has been psychometrically tested in a pen-and-paper
format. Having established the touchscreen computer methodology as a comparable means of
obtaining these data, we are finalising a trial of the feasibility of introducing routine
computerised assessment of cancer patients' needs, anxiety and depression in the hospital setting,
including providing a summary report of individual patients' responses to their clinician for
appropriate intervention.
Computer assessment of psychosocial well-being
16
REFERENCES
1. Newell S, Sanson-Fisher R, Girgis A, Ackland S. The physical and psychosocial
experiences of patients attending an outpatient medical oncology department: a cross-
sectional study. Eur J Cancer Care 1999;8:73-82.
2. Cull AM, Stewart M, Altman DG. Assessment of and intervention for psychosocial
problems in routine oncology practice. Br J Cancer 1995;72:229-235.
3. Ford S, Lewis S, Fallowfield L. Psychological morbidity in newly referred patients with
cancer. J Psychosom Res 1995;39(2):193-202.
4. Carroll BT, Kathol RG, Noyes R, Wald TG, Clamon GH. Screening for depression and
anxiety in cancer patients using the Hospital Anxiety and Depression Scale. General
Hospital Psychiatry 1993;15:69-74.
5. Aass N, Fossa SD, Dahl AA, Moe TJ. Prevalence of anxiety and depression in cancer
patients seen at the Norwegian Radium Hospital. Eur J Cancer 1997;33(10):1597-1604.
6. Sanson-Fisher R, Girgis A, Boyes A, Bonevski B, Burton L, Cook P and The Supportive
Care Review Group. The unmet supportive care needs of patients with cancer. Cancer
2000;88(1):226-237.
7. Whelan TJ, Mohide EA, Willan AR, Arnold A, Tew M, Sellick S, et al. The supportive
care needs of newly diagnosed cancer patients attending a regional cancer center. Cancer
1997;80(8):1518-1524.
8. Girgis A, Boyes A, Sanson-Fisher RW, Burrows S. Perceived needs of women diagnosed
with breast cancer: rural versus urban location. Aust NZ J Public Health 2000;24:166-
173.
9. Gustafson DH, Taylor JO, Thompson S, Chesney P. Assessing the needs of breast cancer
patients and their families. Quality Management in Health Care 1993;2(1):6-17.
10. Siegel K, Raveis VH, Houts P, Mor V. Caregiver burden and unmet patient needs. Cancer
1991;68(5):1131-1140.
11. Colleoni M, Mandala M, Peruzzotti G, Robertson C, Bredart A, Goldhirsch A. Depression
and degree of acceptance of adjuvant cytotoxic drugs. The Lancet 2000;356:1326-1327.
12. Shapiro T. How to help patients get through chemotherapy. Registered Nurse
1987;83(2):58-60.
13. Newell S, Sanson-Fisher R, Girgis A, Bonaventura A. How well do medical oncologists'
perceptions reflect their patients' reported physical and psychosocial problems? Data from
five oncologists. Cancer 1998;8:1640-1651.
14. Hardman A, Maguire P, Crowther D. The recognition of psychiatric morbidity on a
medical oncology ward. J Psychosom Res 1989;33(2):235-239.
15. Zigmond AS, Snaith RP: The Hospital Anxiety and Depression Scale. Acta Psychiatrica
Scandinavica 1983;67:361-370.
Computer assessment of psychosocial well-being
17
16. Bonevski B, Sanson-Fisher R, Girgis A, Burton L, Cook P, Boyes A and The Supportive
Care Review Group. Evaluation of an instrument to assess the needs of patients with
cancer. Cancer 2000;88:217-225.
17. Drummond HE, Ghosh S, Ferguson A, Brackenridge D, Tiplady B. Electronic quality of
life questionnaires: a comparison of pen-based electronic questionnaires with conventional
paper in a gastrointestinal study. Qual Life Res 1995;4:21-26.
18. Velikova G, Wright EP, Smith AB, Cull A, Gould A, Forman D, et al. Automated
collection of quality-of-life data: A comparison of paper and computer touch-screen
questionnaires. J Clin Oncol 1999;17(3):998-1010.
19. Buxton J, White M, Osoba D. Patients' experiences using a computerized program with a
touch-sensitive video monitor for the assessment of health-related quality of life. Qual Life
Res 1998;7:513-519.
20. Taenzer PA, Speca M, Atkinson MJ, Bultz BD, Page S, Harasym P, et al. Computerized
quality-of-life screening in an oncology clinic. Cancer Pract 1997;5(3):168-175.
21. Newell S, Girgis A, Sanson-Fisher R, Stewart J. Are touchscreen computer surveys
acceptable to medical oncology patients? J Psychosoc Oncol 1997;15(2):37-46.
22. Kleinman L, Leidy NK, Crawley J, Bonomi A, Schoenfeld P. A comparative trial of paper-
and-pencil versus computer administration of the Quality of Life in reflux and Dyspepsia
(QOLRAD) questionniare. Med Care 2001 39(2):181-189.
23. Pouwer F, Snoek FJ, van der Ploeg HM, Heine RJ, Brand AN. A comparison of the
standard and the computerized versions of the Well-being Questionniare (WBQ) and the
Diabetes Treatment Satisfaction Questionnaire (DTSQ). Qual Life Res 1998;7:33-38.
24. Schmitz N, Hartkamp N, Brinschwitz C, Michalek S, Tress W. Comparison of the standard
and the computerized versions of the Symptom Check List (SCL-90-R): a randomized trial.
Acta Psychiatr Scan 2000;102:147-152.
25. Clay GE, Lankford JS, Wilson SE. The effects of computerised versus paper-and-pencil
administration on measures of negative affect. Comput Hum Behav 1992;8:203-209
26. Watson CG, Thomas D, Andersen PE. Do computer-administered Minnesota Multiphasic
Personality Inventories underestimate booklet-based scores? J Clin Psychol
1992;48(6):744-748.
27. Ibbotson T, Maguire P, Selby P, Priestman T, Wallace L. Screening for anxiety and
depression in cancer patients: the effects of disease and treatment. Eur JCancer
1994;30A(1):37-40
28. Hopwood P, Howell A, Maguire P. Screening for psychiatric morbidity in patients with
advanced breast cancer: validation of two self-report questionnaires. Br J Cancer
1991;64:353-356.
29. Moorey S, Greer S, Watson M, Gorman C, Rowden L, Tunmore R, et al. The factor
structure and factor stability of the Hospital Anxiety and Depression Scale in patients with
cancer. Br J Psychiatry 1991;158:255-259.

Computer assessment of psychosocial well-being
18
30. Everitt BS. The analysis of contingency tables. 1977 ed. London: Chapman & Hall; 1990.
31. Byrt T, Bishop J, Carlin JB. Bias, prevalence and kappa. J Clin Epidemiol
1993;46(5):423-429.
Computer assessment of psychosocial well-being
19
Table 1: Demographic and treatment characteristics of participants
Group 1
(CM-P)
(N=140)
%*
Group 2
(P-CM))
(N=110)
%*
Group 3
(CO-P)
(N=100)
%*
Total
Sample
(N=350)
%*
Sex
Male
Female
41
56
46
52
46
54
44
54
Age
<20
20-39
40-59
60-79
80+
1
8
42
42
3
0
4
32
58
5
0
10
38
44
8
<1
7
38
48
5
Marital Status
Married
Defacto/living with a partner
Separated/divorced
Widowed
Never married
53
5
15
12
11
67
2
8
15
5
72
3
7
9
8
63
3
11
12
5
Level of Education
School
Trade/technical diploma/certificate
Degree/postgraduate degree/diploma
54
24
19
60
27
9
63
27
9
58
26
13
First diagnosed
Within last month
1-6 months ago
7-12 months ago
1-2 years ago
3-5 years ago
More than 5 years ago
9
25
15
14
16
18
8
44
10
15
14
7
13
36
8
21
10
11
10
34
11
16
13
13
Type of cancer
Bowel, colon or rectum
Breast
Lung
Lymphoma
Melanoma
Prostate
Other
19
31
9
12
2
0
21
6
33
7
4
4
19
24
4
30
8
8
1
8
34
11
31
8
8
2
8
26
Remission
Yes
No
Don’t Know
42
28
22
45
27
25
37
32
27
41
29
24
Computer assessment of psychosocial well-being
20
Group 1
(CM-P)
(N=140)
%*
Group 2
(P-CM))
(N=110)
%*
Group 3
(CO-P)
(N=100)
%*
Total
Sample
(N=350)
%*
Purpose of visit
Treatment
Follow-up consultation
53
39
70
28
79
19
66
30
Last received treatment
Within the last week
1-2 weeks ago
3-4 weeks ago
1-2 months ago
3-6 months ago
More than 6 months ago
18
17
26
7
4
21
70
2
3
4
1
18
76
2
2
2
5
11
51
8
12
5
3
17
Treatment received†
Surgery
Radiotherapy
Chemotherapy
Hormone treatment
Other treatment
67
48
81
14
12
64
93
29
22
8
61
90
35
19
10
64
74
52
18
10
* Totals may not add up to 100% due to missing data †Totals do not add up to 100% as participants may have received more than one treatment
Computer assessment of psychosocial well-being
21
Table 2: Agreement between participants’ responses to individual items (grouped by sub-scale) of touchscreen computer and pen-and-paper
versions of the HADS and SCNS-short
Group 1 (CM-P) Group 2 (P-CM) Group 3 (CO-P)
simple
kappa
(range)
mean
kappa (SD)
% exact
agreement
(range)
mean % exact
agreement (SD)
simple
kappa
(range)
mean
kappa (SD)
% exact
agreement
(range)
mean % exact
agreement (SD)
simple
kappa
(range)
mean
kappa (SD)
% exact
agreement
(range)
mean % exact
agreement (SD)
HADS
Anxiety (7 items)
0.43–0.69 0.57 (0.09) 60-81 72 (7.43) 0.47–0.71 0.56 (0.09) 67-83 73 (6.15) 0.39–0.54 0.48 (0.05) 60-72 66 (4.10)
Depression (7 items)
0.50–0.88 0.67 (0.12) 68-95 82 (9.16) 0.47–0.79 0.63 (0.11) 62-90 80 (9.96) 0.45–0.67 0.52 (0.07) 62-82 72 (6.34)
SCNS-short
Psychological (8 items)
0.19-0.38 0.29 (0.06) 51-60 54 (3.23) 0.22-0.36 0.30(0.04) 51–58 54 (2.90) 0.37–0.52 0.45 (0.05) 53–63 58 (4.03)
Health systems and information (13 items)
0.09-0.28 0.16 (0.07) 45-59 50 (4.91) 0.25–0.39 0.31 (0.07) 55–62 55 (5.91) 0.28-0.51 0.40 (0.07) 52–70 62 (4.94)
Patient care and support (7 items)
0.14-0.22 0.17 (0.03) 52-64 58 (4.26) 0.26–0.43 0.33 (0.06) 55–72 61 (6.08) 0.31–0.51 0.42 (0.07) 54– 70 64 (4.72)
Physical and daily living (3 items)
0.27-0.34 0.32 (0.04) 50-61 56 (5.69) 0.34-0.45 0.37 (0.06) 53-58 55 (2.52) 0.44-0.55 0.49 (0.06) 58-68 62 (5.29)
Computer assessment of psychosocial well-being
22
Table 3: Agreement between touchscreen computer and pen-and-paper survey responses in classifying participants' levels of
anxiety and depression
Group 1 (CM-P) Group 2 (P-CM) Group 3 (CO-P)
simple kappa % exact
agreement
simple kappa % exact agreement simple kappa % exact agreement
Anxiety
0.71 87 0.58 81 0.54 75
Depression
0.75 93 0.59 86 0.54 80

Computer assessment of psychosocial well-being
23
Table 4: Prevalence of elevated levels of anxiety, depression and unmet supportive care needs: Computer versus pen-and paper survey
touchscreen computer
(modified format)
% (95% CI)
pen-and-paper
% (95% CI)
touchscreen computer
(original format)
% (95% CI)
pen-and-paper
% (95% CI)
HADS (n=335 ) (n=335)
Anxiety
clinical
clinical/borderline
N/A N/A
13.4 (9.8-17.1)
31.3 (26.3-36.3)
13.7 (10.0-17.4)
31.0 (26.0-36.0)
Depression
clinical
clinical/borderline
N/A N/A
11.3 (7.9-14.7)
20.9 (16.5-25.3)
11.0 (7.6-14.4)
21.5 (17.1-25.9)
SCNS-short (n=250) (n=250) (n=100) (n=100)
Psychological 8.6 (5.1-12.1) 15.8 (11.3-20.3) 26.0 (17.4-34.6) 26.0 (17.4-34.6)
Health systems and information 4.8 (2.1-7.5) 10.2 (6.4-14.0) 21.5 (13.4-29.6) 25.9 (17.3-34.5)
Patient care and support 3.2 (1.0-5.4) 5.7 (2.8-8.6) 10.1 (4.2-16.0) 10.0 (4.1-15.9)
Physical and daily living 8.5 (5.0-12.0) 20.4 (15.4-25.4) 14.6 (7.6-21.6) 15.2 (8.1-22.3)
N/A as HADS was presented in its original format in both the touchscreen computer and pen-and-paper surveys
Computer assessment of psychosocial well-being
24
Table 5: Agreement between touchscreen computer and pen-and-paper survey responses in classifying participants' levels of need
Group 1 (CM-P) Group 2 (P-CM) Group 3 (CO-P)
PABAK
(range)
mean
PABAK
(SD)
% exact
agreement
(range)
mean %
exact
agreement
(SD)
PABAK
(range)
mean
PABAK
(SD)
% exact
agreement
(range)
mean %
exact
agreement
(SD)
PABAK
(range)
mean
PABAK
(SD)
% exact
agreement
(range)
mean %
exact
agreement
(SD)
Psychological (8 items)
0.77-0.86 0.82 (0.03) 88-93 91 (1.64) 0.63–0.85 0.75 (0.07) 81–93 87 (3.74) 0.59–0.71 0.66 (0.04) 80–86 83 (2.00)
Health systems and information (13 items)
0.81-0.96 0.89 (0.05) 90-98 95 (2.55) 0.72–0.89 0.80 (0.06) 86–94 90 (2.63) 0.62–0.86 0.76 (0.07) 81–93 88 (3.30)
Patient care and support (7 items)
0.91-0.97 0.95 (0.02) 96-99 98 (1.13) 0.83–0.93 0.88 (0.03) 92-96 94 (1.57) 0.67–0.92 0.85 (0.08) 84–96 92 (4.04)
Physical and daily living (3 items)
0.67-0.77 0.73 (0.05) 83-89 87 (3.21) 0.65-0.74 0.68 (0.05) 82-87 84 (2.65) 0.62–0.74 0.68 (0.06) 81-87 84 (3.00)