Indian Agriculture Myths, Challengs and way Forward
32
INDIAN AGRICULTURE Myths, Challenges and Way Forward
-
Upload
khangminh22 -
Category
Documents
-
view
0 -
download
0
Transcript of Indian Agriculture Myths, Challengs and way Forward

INDIAN AGRICULTUREMyths, Challenges and Way Forward

Centre for Environment & Agriculture
Kanta Niwas, Madhu Park, 11th Road, Khar (W), Mumbai 400 052, India. | Email : [email protected] 1
Common myths related to Agriculture and CropProtection chemicals were identified for analysis.
Myths
Indian Agriculture is on a permanent decline.
Indian Agriculture is food-grains centric.
Declining size of Indian farm land leads to low production.
Indian Agriculture is heavily dependent on rainfall.
Organic farming can drive sustainability of Indian Agriculture.
Organic food is chemical free.
Crop protection chemicals are used in excessive quantities in India.
Crop protection chemicals lead to severe imbalance of aquatic ecosystem.
Use of crop protection chemicals has increased cancer cases in India.
Farmer suicides are rampant in Indian Agriculture.
Fruits and Vegetables are injected with colouring chemicals and animal hormones.
1
2
3
4
5
6
7
8
9
10
11
Sr. No.
Centre for Environment & Agriculture
Kanta Niwas, Madhu Park, 11th Road, Khar (W), Mumbai 400 052, India. | Email : [email protected] 2
Facts
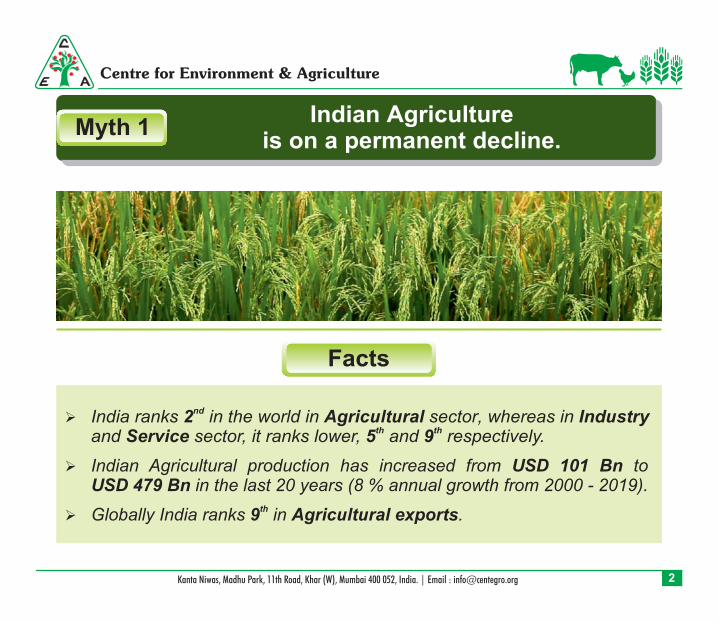
Myth 1Indian Agriculture
is on a permanent decline.
ndIndia ranks 2 in the world in Agricultural sector, whereas in Industryth thand Service sector, it ranks lower, 5 and 9 respectively.
Indian Agricultural production has increased from USD 101 Bn to USD 479 Bn in the last 20 years (8 % annual growth from 2000 - 2019).
thGlobally India ranks 9 in Agricultural exports.
Centre for Environment & Agriculture
Kanta Niwas, Madhu Park, 11th Road, Khar (W), Mumbai 400 052, India. | Email : [email protected] 3
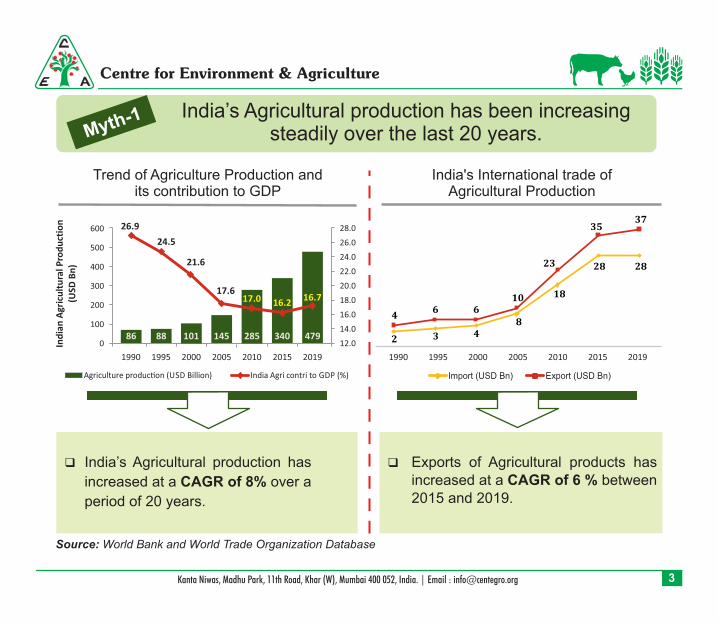
India’s Agricultural production has been increasingsteadily over the last 20 years.Myth-1
Source: World Bank and World Trade Organization Database
Trend of Agriculture Production andits contribution to GDP
India's International trade ofAgricultural Production
Ind
ian
Agr
icu
ltu
ral P
rod
uct
ion
(USD
Bn
)
Exports of Agricultural products has increased at a CAGR of 6 % between 2015 and 2019.
100
0
28.0
26.0
24.0
22.0
20.0
18.0
16.0
14.0
12.0
1990 1995 2000 2005 2010 2015 2019
86 88 101 145 285 340 479
600
500
400
300
200
26.9
24.5
21.6
17.617.0 16.2
16.7
1990 1995 2000 2005 2010 2015 2019
2 3 48
18
28 28
46 6
10
23
3537
India’s Agricultural production has
increased at a CAGR of 8% over a
period of 20 years.
Centre for Environment & Agriculture
Kanta Niwas, Madhu Park, 11th Road, Khar (W), Mumbai 400 052, India. | Email : [email protected] 4
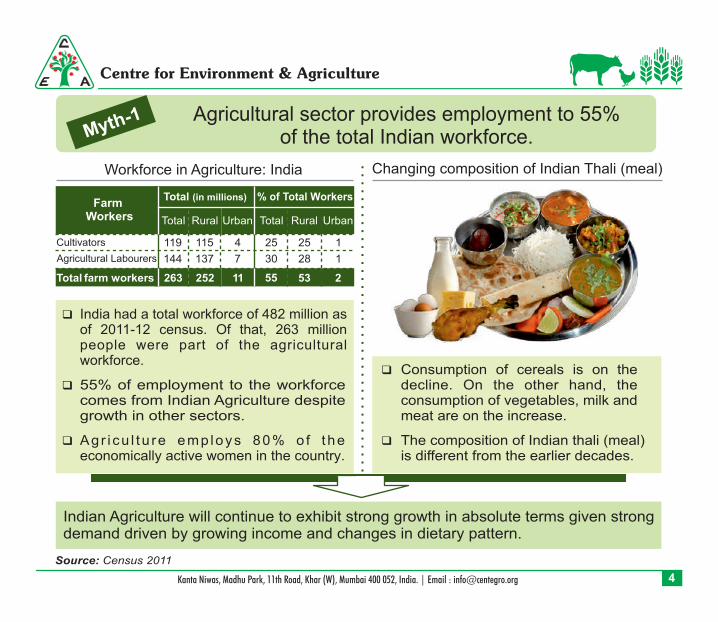
Indian Agriculture will continue to exhibit strong growth in absolute terms given strong demand driven by growing income and changes in dietary pattern.
Farm Workers
Total (in millions) % of Total Workers
Total Rural Urban Total Rural Urban
Cultivators 119 115 4 25 25 1
Agricultural Labourers 144 137 7 30 28 1
Total farm workers 263 252 11 55 53 2
Workforce in Agriculture: India Changing composition of Indian Thali (meal)
Source: Census 2011
Agricultural sector provides employment to 55%of the total Indian workforce.Myth-1
India had a total workforce of 482 million as of 2011-12 census. Of that, 263 million people were part of the agricultural workforce.
55% of employment to the workforce comes from Indian Agriculture despite growth in other sectors.
Agr i cu l tu re emp loys 80% o f the economically active women in the country.
Consumption of cereals is on the decline. On the other hand, the consumption of vegetables, milk and meat are on the increase.
The composition of Indian thali (meal)is different from the earlier decades.
Centre for Environment & Agriculture
Kanta Niwas, Madhu Park, 11th Road, Khar (W), Mumbai 400 052, India. | Email : [email protected] 5
Facts
Myth 2 Indian Agriculture is food-grains centric
Indian Agriculture is multifaceted, with horticulture and animal husbandry contributing to over 60% of India’s agricultural GDP.
ndIndia is largest milk producer, 2 largest in vegetables and fruits rdproduction, 3 largest in fish, egg and poultry production in the world.
Horticulture and livestock production engage a large share of small and marginal farmers, and thus plays a critical role in rural economy.
Centre for Environment & Agriculture
Kanta Niwas, Madhu Park, 11th Road, Khar (W), Mumbai 400 052, India. | Email : [email protected] 6
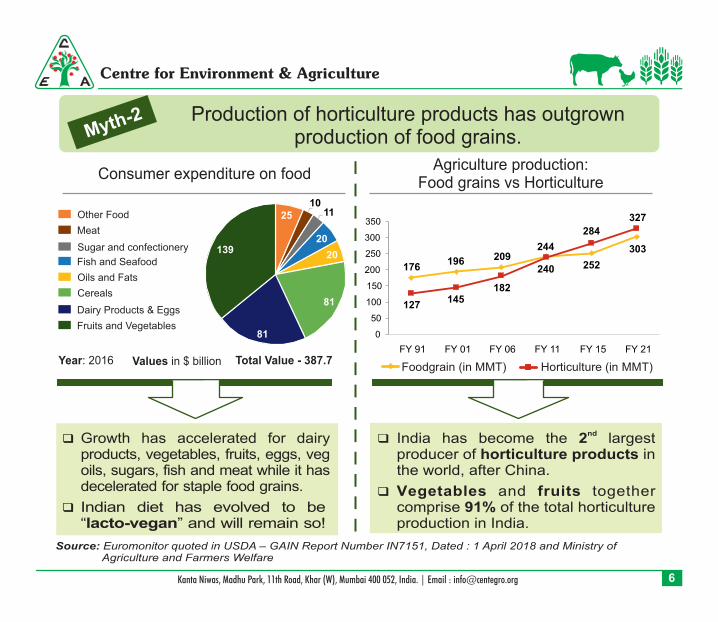
Consumer expenditure on foodAgriculture production:
Food grains vs Horticulture
Foodgrain (in MMT) Horticulture (in MMT)
ndIndia has become the 2 largest producer of horticulture products in the world, after China.
Vegetables and fruits together comprise 91% of the total horticulture production in India.
Source: Euromonitor quoted in USDA – GAIN Report Number IN7151, Dated : 1 April 2018 and Ministry of Agriculture and Farmers Welfare
Production of horticulture products has outgrown production of food grains.Myth-2
2510
11
20
20
81
81
139
Other Food
Meat
Sugar and confectionery
Fish and Seafood
Oils and Fats
Cereals
Dairy Products & Eggs
Fruits and Vegetables
Year: 2016 Values in $ billion Total Value - 387.7
176196 209
244
252
303
127145
182
240
284
327
0
50
100
150
200
250
300
350
FY 91 FY 01 FY 06 FY 11 FY 15 FY 21
Growth has accelerated for dairy products, vegetables, fruits, eggs, veg oils, sugars, fish and meat while it has decelerated for staple food grains.
Indian diet has evolved to be “lacto-vegan” and will remain so!
Centre for Environment & Agriculture
Kanta Niwas, Madhu Park, 11th Road, Khar (W), Mumbai 400 052, India. | Email : [email protected] 7
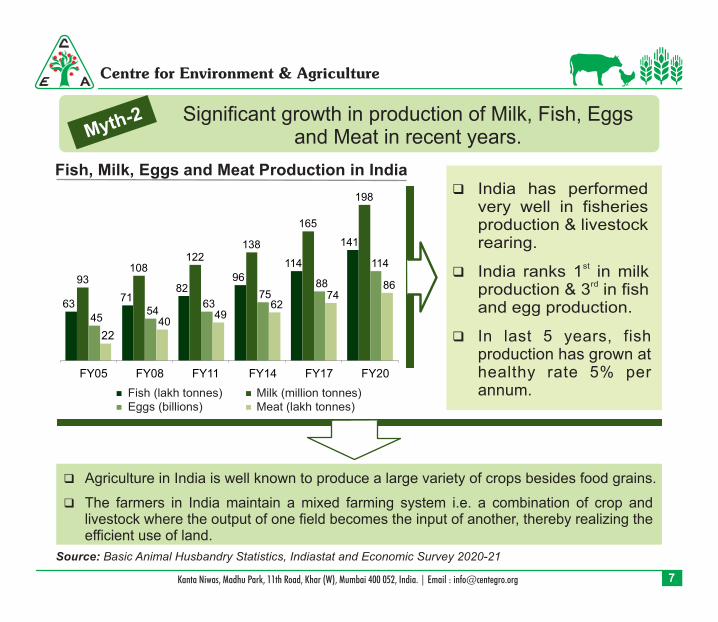
Source: Basic Animal Husbandry Statistics, Indiastat and Economic Survey 2020-21
Fish (lakh tonnes) Milk (million tonnes)Eggs (billions) Meat (lakh tonnes)
Fish, Milk, Eggs and Meat Production in India
Significant growth in production of Milk, Fish, Eggs and Meat in recent years. Myth-2
6371
8296
114
141
93108
122138
165
198
4554
6375
88
114
2240
4962
7486
FY05 FY08 FY11 FY14 FY17 FY20
India has performed very well in fisheries production & livestock rearing.
stIndia ranks 1 in milk rdproduction & 3 in fish
and egg production.
In last 5 years, fish production has grown at healthy rate 5% per annum.
Agriculture in India is well known to produce a large variety of crops besides food grains.
The farmers in India maintain a mixed farming system i.e. a combination of crop and livestock where the output of one field becomes the input of another, thereby realizing the efficient use of land.

Centre for Environment & Agriculture
Kanta Niwas, Madhu Park, 11th Road, Khar (W), Mumbai 400 052, India. | Email : [email protected] 8
Facts
Myth 3Declining size of Indian farm land leads
to low production.
China and India with majority of their small and marginal holding lands are st nd1 and 2 in the world Agriculture production respectively.
The aggregate output/ha/year in small farms is higher on account of multiple cropping intensity, diverse output (crop + livestock) and round the year availability of family labour.
Yield per acre per crop is not an effective measure of Indian farm productivity (Since Indian Agriculture does not follow monoculture like the other western nations).
Centre for Environment & Agriculture
Kanta Niwas, Madhu Park, 11th Road, Khar (W), Mumbai 400 052, India. | Email : [email protected] 9
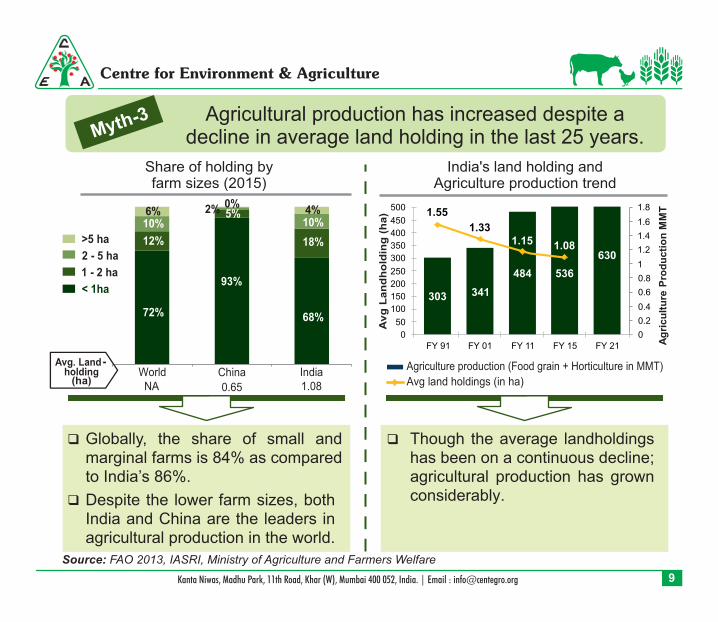
Globally, the share of small and marginal farms is 84% as compared to India’s 86%.
Despite the lower farm sizes, both India and China are the leaders in agricultural production in the world.
Share of holding byfarm sizes (2015)
India's land holding andAgriculture production trend
72% 68%
12%
5%
18%
10%2%
10%6%
0%4%
World China India1.080.65NA
93%
Avg. Land -holding
(ha)
Agriculture production (Food grain + Horticulture in MMT)
Avg land holdings (in ha)
Though the average landholdings has been on a continuous decline; agricultural production has grown considerably.
Source: FAO 2013, IASRI, Ministry of Agriculture and Farmers Welfare
Agricultural production has increased despite a decline in average land holding in the last 25 years.Myth-3
Ag
ric
ult
ure
Pro
du
cti
on
MM
T
Av
gL
an
dh
old
ing
(h
a)
303 341
484 536
630
1.55
1.331.15 1.08
0
0.2
0.4
0.6
0.8
1
1.2
1.4
1.6
1.8
0
50
100
150
200
250
300
350
400
450
500
FY 91 FY 01 FY 11 FY 15 FY 21
1 - 2 ha
2 - 5 ha
>5 ha
< 1ha
Centre for Environment & Agriculture
Kanta Niwas, Madhu Park, 11th Road, Khar (W), Mumbai 400 052, India. | Email : [email protected] 10
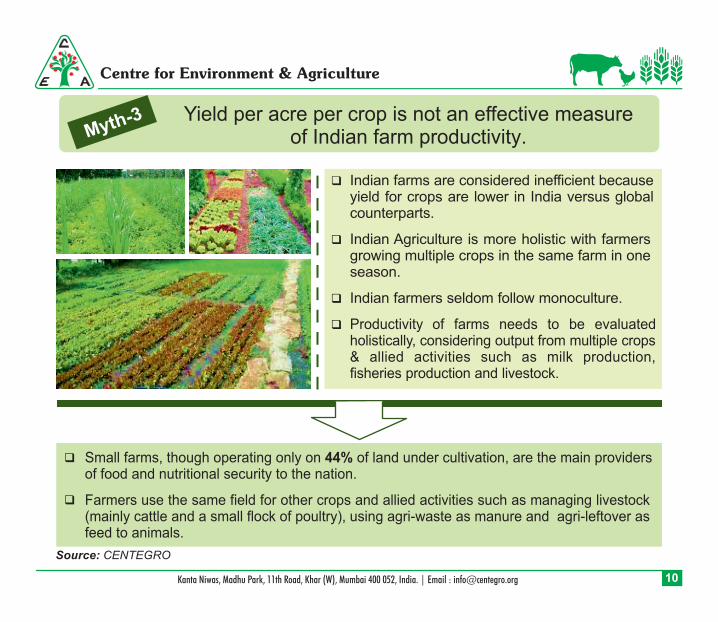
Small farms, though operating only on 44% of land under cultivation, are the main providers of food and nutritional security to the nation.
Farmers use the same field for other crops and allied activities such as managing livestock (mainly cattle and a small flock of poultry), using agri-waste as manure and agri-leftover as feed to animals.
Source: CENTEGRO
Yield per acre per crop is not an effective measureof Indian farm productivity.Myth-3
Indian farms are considered inefficient because yield for crops are lower in India versus global counterparts.
Indian Agriculture is more holistic with farmers growing multiple crops in the same farm in one season.
Indian farmers seldom follow monoculture.
Productivity of farms needs to be evaluated holistically, considering output from multiple crops & allied activities such as milk production, fisheries production and livestock.
Centre for Environment & Agriculture
Kanta Niwas, Madhu Park, 11th Road, Khar (W), Mumbai 400 052, India. | Email : [email protected] 11
Facts
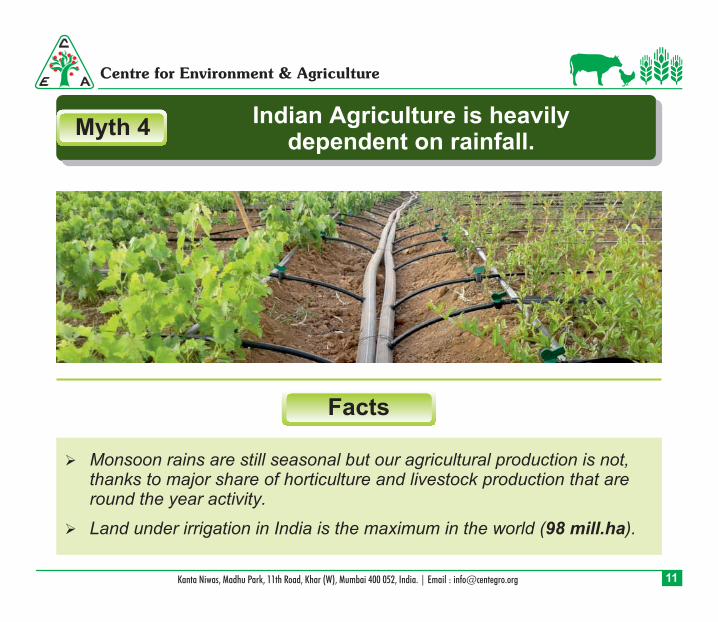
Myth 4Indian Agriculture is heavily
dependent on rainfall.
Monsoon rains are still seasonal but our agricultural production is not, thanks to major share of horticulture and livestock production that are round the year activity.
Land under irrigation in India is the maximum in the world (98 mill.ha).
Centre for Environment & Agriculture
Kanta Niwas, Madhu Park, 11th Road, Khar (W), Mumbai 400 052, India. | Email : [email protected] 12
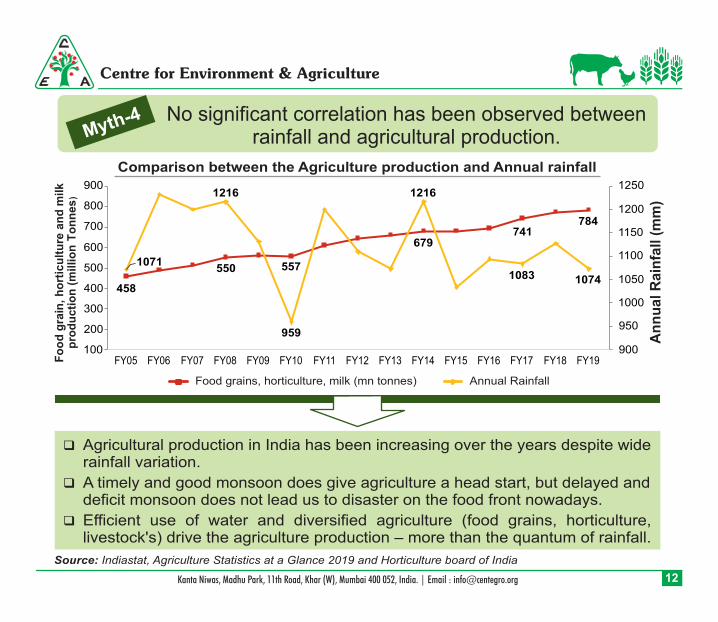
Source: Indiastat, Agriculture Statistics at a Glance 2019 and Horticulture board of India
An
nu
al R
ain
fall (
mm
)
Fo
od
gra
in,
ho
rtic
ult
ure
an
d m
ilk
pro
du
cti
on
(m
illio
n T
on
nes
)
Food grains, horticulture, milk (mn tonnes) Annual Rainfall
Comparison between the Agriculture production and Annual rainfall
No significant correlation has been observed betweenrainfall and agricultural production.Myth-4
900
950
1000
1050
1100
1150
1200
1250
100
200
300
400
500
600
700
800
900
FY05 FY06 FY07 FY08 FY09 FY10 FY11 FY12 FY13 FY14 FY15 FY16 FY17 FY18 FY19
458
1071550
1216
557
959
679
1216
741
1083
784
1074
Agricultural production in India has been increasing over the years despite wide rainfall variation.
A timely and good monsoon does give agriculture a head start, but delayed and deficit monsoon does not lead us to disaster on the food front nowadays.
Efficient use of water and diversified agriculture (food grains, horticulture, livestock's) drive the agriculture production – more than the quantum of rainfall.
Centre for Environment & Agriculture
Kanta Niwas, Madhu Park, 11th Road, Khar (W), Mumbai 400 052, India. | Email : [email protected] 13
Facts
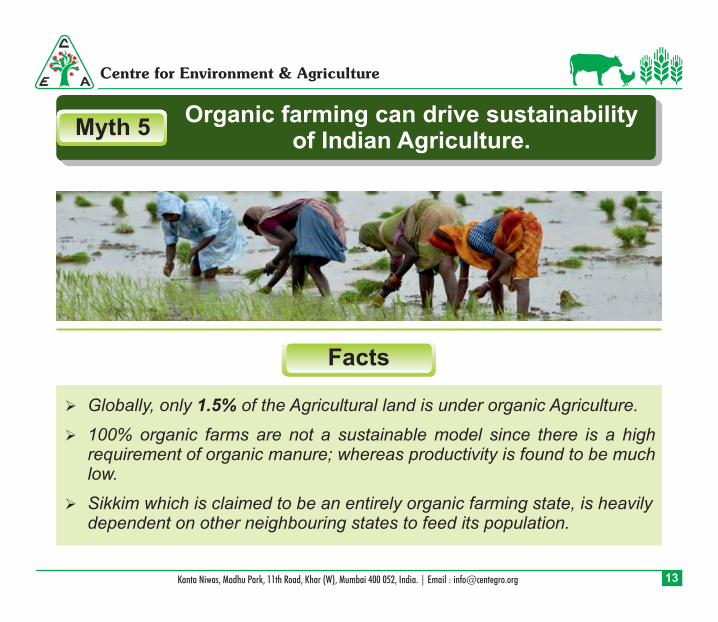
Myth 5Organic farming can drive sustainability
of Indian Agriculture.
Globally, only 1.5% of the Agricultural land is under organic Agriculture.
100% organic farms are not a sustainable model since there is a high requirement of organic manure; whereas productivity is found to be much low.
Sikkim which is claimed to be an entirely organic farming state, is heavily dependent on other neighbouring states to feed its population.
Centre for Environment & Agriculture
Kanta Niwas, Madhu Park, 11th Road, Khar (W), Mumbai 400 052, India. | Email : [email protected] 14
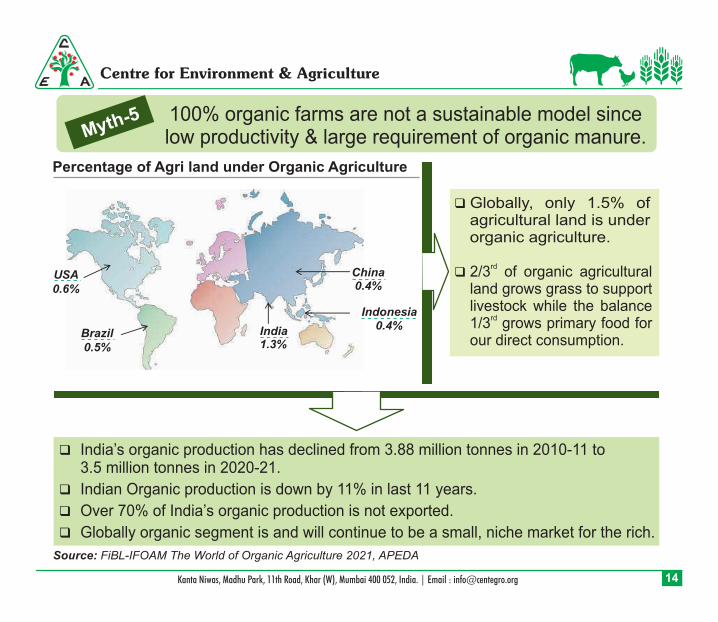
India1.3%
USA0.6%
Brazil0.5%
China0.4%
Indonesia0.4%
Percentage of Agri land under Organic Agriculture
Source: FiBL-IFOAM The World of Organic Agriculture 2021, APEDA
100% organic farms are not a sustainable model sincelow productivity & large requirement of organic manure.Myth-5
Globally, only 1.5% of agricultural land is under organic agriculture.
rd2/3 of organic agricultural land grows grass to support livestock while the balance
rd1/3 grows primary food for our direct consumption.
India’s organic production has declined from 3.88 million tonnes in 2010-11 to 3.5 million tonnes in 2020-21.
Indian Organic production is down by 11% in last 11 years.
Over 70% of India’s organic production is not exported.
Globally organic segment is and will continue to be a small, niche market for the rich.

Centre for Environment & Agriculture
Kanta Niwas, Madhu Park, 11th Road, Khar (W), Mumbai 400 052, India. | Email : [email protected] 15
UN News - 2007The United Nations Food and Agriculture
Organization (FAO)
Myth-5 Organic farming alone will not ensureglobal food security, cautions UN agency.
“We should use organic agriculture and promote it,” said Jacques Diouf (FAO’s Director General). “But you cannot feed six billion people today and nine billion in 2050 without judicious use of chemical fertilizers.”
“While organic farming produces nutritious food and represents a growing source of income for developed and developing countries, it cannot be relied on to ensure global food security.”
https://news.un.org/en/story/2007/12/242782-organic-farming-alone-will-not-ensure-global-food-security-cautions-un-agency
Centre for Environment & Agriculture
Kanta Niwas, Madhu Park, 11th Road, Khar (W), Mumbai 400 052, India. | Email : [email protected] 16
Facts
Myth 6 Organic food is chemical free.
Crop protection chemical residues have been found in vegetable samples of organic produce.
The notion of nutritional superiority provided by organic produce is also debatable.

Centre for Environment & Agriculture
Kanta Niwas, Madhu Park, 11th Road, Khar (W), Mumbai 400 052, India. | Email : [email protected] 17
India does not have law to punish those who falsely label products as organic.
Organic land certification process is very expensive for average Indian farmer.
Source: Monitoring of pesticide residues at National level for year 2017-18 - Ministry of Agriculture & Farmer Welfare
Study finds pesticides residues in organic products, perception proven wrong.Myth-6
CentersOrganic Samples
Analysed
Samples with
detected residues
Anand 59 1
Kalyani 78 6
Bangalore 60 13
Vellayani 82 29
Anand 14 0
Hyderabad 119 22
Delhi 5 1
Hyderabad 86 31
Chennai 97 39
Mumbai 24 0
GrandTotal
624 142 (22.8%)
Vegetable samples (624 samples) were collected from organic outlets across the country.
As high as 22.8% among themhad measurable crop protection chemical residues.
What is sold as organic do not seem to be really organic.
Stanford University Study, USAThey conducted study and found no evidence for differences in nutritional content for over 15 nutrients between conventional and organic produce.
Centre for Environment & Agriculture
Kanta Niwas, Madhu Park, 11th Road, Khar (W), Mumbai 400 052, India. | Email : [email protected] 18
Facts
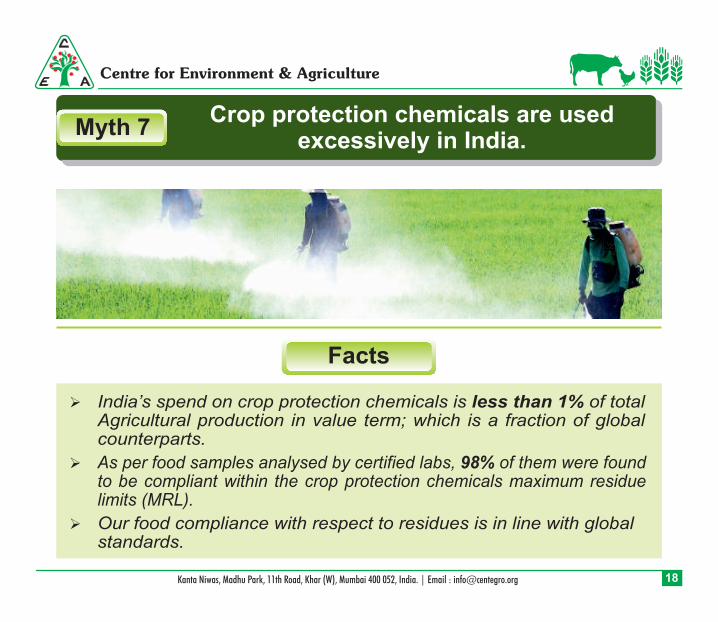
Myth 7Crop protection chemicals are used
excessively in India.
India’s spend on crop protection chemicals is less than 1% of total Agricultural production in value term; which is a fraction of global counterparts.
As per food samples analysed by certified labs, 98% of them were found to be compliant within the crop protection chemicals maximum residue limits (MRL).
Our food compliance with respect to residues is in line with global standards.
Centre for Environment & Agriculture
Kanta Niwas, Madhu Park, 11th Road, Khar (W), Mumbai 400 052, India. | Email : [email protected] 19
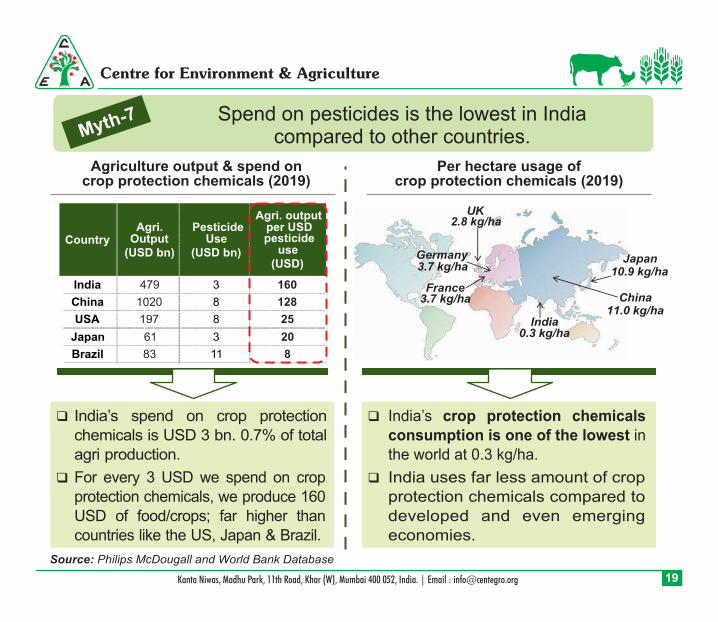
India0.3 kg/ha
UK2.8 kg/ha
Germany3.7 kg/ha
France3.7 kg/ha
Japan10.9 kg/ha
China11.0 kg/ha
Source: Philips McDougall and World Bank Database
India’s spend on crop protection chemicals is USD 3 bn. 0.7% of total agri production.
For every 3 USD we spend on crop protection chemicals, we produce 160 USD of food/crops; far higher than countries like the US, Japan & Brazil.
India’s crop protection chemicals consumption is one of the lowest in the world at 0.3 kg/ha.
India uses far less amount of crop protection chemicals compared to developed and even emerging economies.
Agriculture output & spend oncrop protection chemicals (2019)
Per hectare usage ofcrop protection chemicals (2019)
Spend on pesticides is the lowest in Indiacompared to other countries.Myth-7
CountryAgri.
Output(USD bn)
Pesticide Use
(USD bn)
Agri. output per USD pesticide
use(USD)
India 479 3 160
China 1020 8 128
USA 197 8 25
Japan 61 3 20
Brazil 83 11 8

Centre for Environment & Agriculture
Kanta Niwas, Madhu Park, 11th Road, Khar (W), Mumbai 400 052, India. | Email : [email protected] 20
Notes :Source:
While Indian farmers lack funds to buy inputs to support farming practices effectively, theyare being blamed for using excessive crop protection chemicals.
98% of the Agricultural commodities (food grains,vegetables, fruits, milk) comply with the prescribed
upper limits fixed for crop protection chemical residues.
Myth-7
% of samples aboveMaximum Residue Limit (MRL)
Country 2017 2018 20193 - yearaverage
4.2%EU 4.1 4.5 3.9
USA 3.8 3.2 1.3 2.8%
India 2.1 2.2 3.3 2.6%
UK 3.7 6.4 7.2 5.8%
The popular narrative in the public domain is that pesticide contamination is pervasive in India.
The annual summary of test results show a completely different picture.
The false and negative narratives tarnish the image of our agri. commodities in the domestic and international markets.
Media campaign is required to set this right on the strength of data.
FSSAI (Food Safety and Standard Authority of India) must check all the imported food products for pesticide residues. Consignments found non-complaint with our MRLs should be returned.
MRL is maximum residue that can be found on agri-commodity after safe and authorized use of crop protection chemicals1. All India Co-ordinated Programme on Pesticide Residues ICAR, Delhi.2. Pesticide Residue Monitoring Program Reports and Data - US FDA.3. Report on the pesticide residues monitoring programme by the Expert committee on Pesticide Residues in Food (PRiF).4. European Union report on pesticide residues in food by European Food Safety Authority.

Centre for Environment & Agriculture
Kanta Niwas, Madhu Park, 11th Road, Khar (W), Mumbai 400 052, India. | Email : [email protected] 21
Facts
Myth 8Crop protection chemicals lead to severe
imbalance of aquatic ecosystem.
Fish are highly sensitive to water pollutants.rdIndia is the 3 largest fish producer in the world which shows our soil-
water ecosystem is not contaminated.
Andhra Pradesh and Punjab despite being high users of pesticides, are leaders in fish production and productivity.
Centre for Environment & Agriculture
Kanta Niwas, Madhu Park, 11th Road, Khar (W), Mumbai 400 052, India. | Email : [email protected] 22
Source: Indiastat and Handbook on Fisheries Statistics - 2020
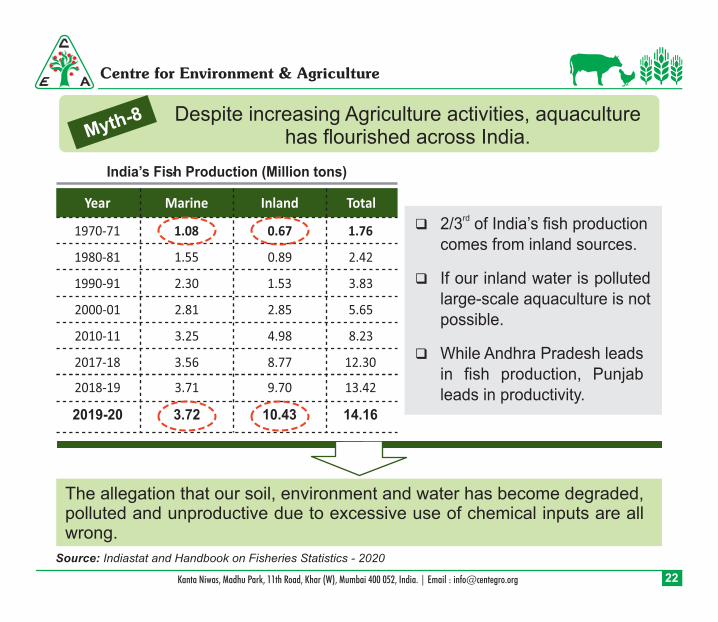
The allegation that our soil, environment and water has become degraded, polluted and unproductive due to excessive use of chemical inputs are all wrong.
’
Despite increasing Agriculture activities, aquaculturehas flourished across India.Myth-8
India’s Fish Production (Million tons)
Year
1970-71
1980-81
1990-91
2000-01
2010-11
2017-18
2019-20
2018-19
Marine
1.08
1.55
2.30
2.81
3.25
3.56
3.72
3.71
Inland
0.67
0.89
1.53
2.85
4.98
8.77
10.43
9.70
Total
1.76
2.42
3.83
5.65
8.23
14.16
12.30
13.42
rd2/3 of India’s fish production comes from inland sources.
If our inland water is polluted large-scale aquaculture is not possible.
While Andhra Pradesh leads in fish production, Punjab leads in productivity.
Centre for Environment & Agriculture
Kanta Niwas, Madhu Park, 11th Road, Khar (W), Mumbai 400 052, India. | Email : [email protected] 23
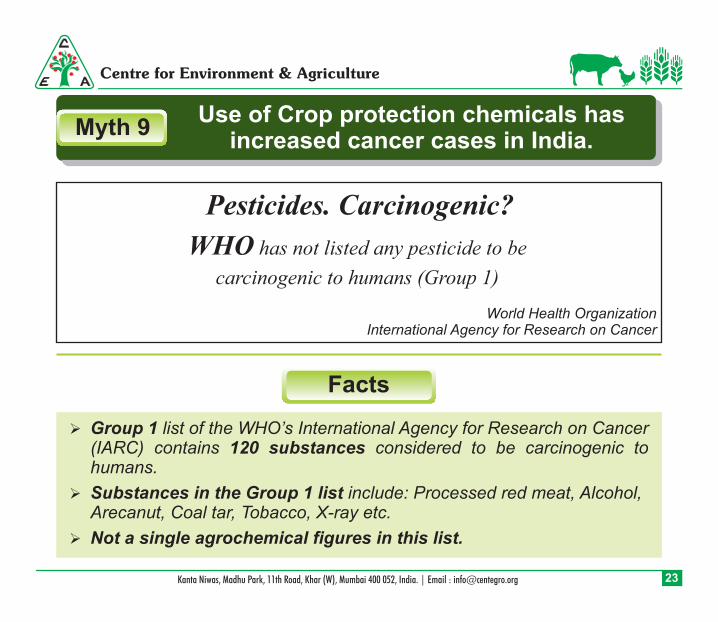
Pesticides. Carcinogenic?
WHO has not listed any pesticide to be
carcinogenic to humans (Group 1)
Facts
Myth 9Use of Crop protection chemicals has
increased cancer cases in India.
World Health OrganizationInternational Agency for Research on Cancer
Group 1 list of the WHO’s International Agency for Research on Cancer (IARC) contains 120 substances considered to be carcinogenic to humans.
Substances in the Group 1 list include: Processed red meat, Alcohol, Arecanut, Coal tar, Tobacco, X-ray etc.
Not a single agrochemical figures in this list.
Centre for Environment & Agriculture
Kanta Niwas, Madhu Park, 11th Road, Khar (W), Mumbai 400 052, India. | Email : [email protected] 24
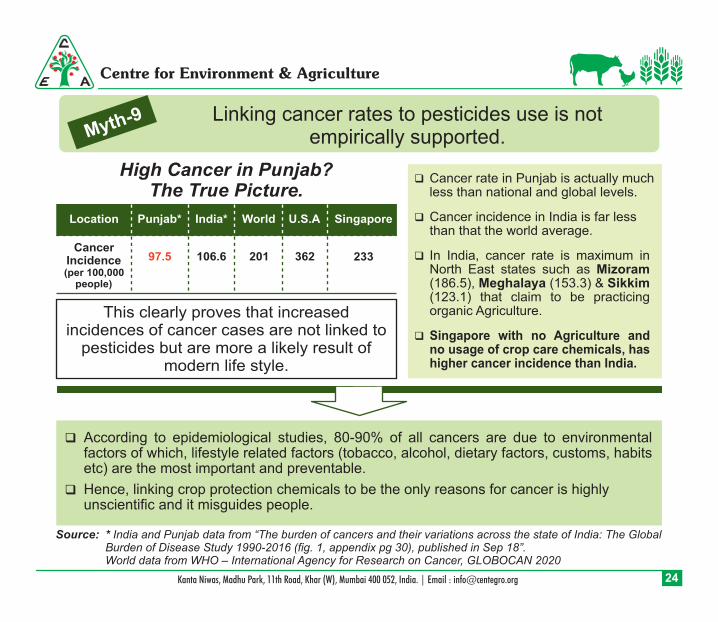
Location
CancerIncidence(per 100,000
people)
Punjab*
97.5
India*
106.6
World
201
U.S.A
362
Singapore
233
This clearly proves that increasedincidences of cancer cases are not linked to
pesticides but are more a likely result ofmodern life style.
High Cancer in Punjab?The True Picture.
Linking cancer rates to pesticides use is notempirically supported.Myth-9
According to epidemiological studies, 80-90% of all cancers are due to environmental factors of which, lifestyle related factors (tobacco, alcohol, dietary factors, customs, habits etc) are the most important and preventable.
Hence, linking crop protection chemicals to be the only reasons for cancer is highly unscientific and it misguides people.
Cancer rate in Punjab is actually much less than national and global levels.
Cancer incidence in India is far less than that the world average.
In India, cancer rate is maximum in North East states such as Mizoram (186.5), Meghalaya (153.3) & Sikkim (123.1) that claim to be practicing organic Agriculture.
Singapore with no Agriculture and no usage of crop care chemicals, has higher cancer incidence than India.
Source: * India and Punjab data from “The burden of cancers and their variations across the state of India: The Global Burden of Disease Study 1990-2016 (fig. 1, appendix pg 30), published in Sep 18”.World data from WHO – International Agency for Research on Cancer, GLOBOCAN 2020
Centre for Environment & Agriculture
Kanta Niwas, Madhu Park, 11th Road, Khar (W), Mumbai 400 052, India. | Email : [email protected] 25
Facts
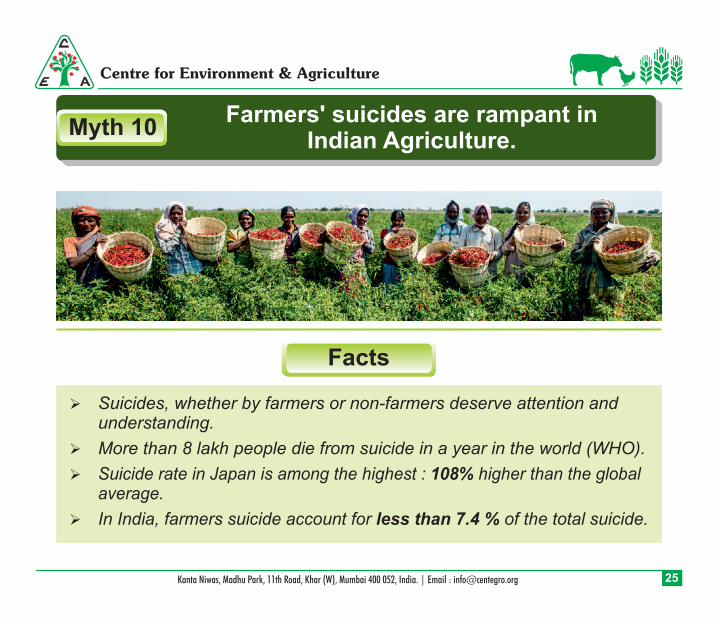
Myth 10Farmers' suicides are rampant in
Indian Agriculture.
Suicides, whether by farmers or non-farmers deserve attention and understanding.
More than 8 lakh people die from suicide in a year in the world (WHO).
Suicide rate in Japan is among the highest : 108% higher than the global average.
In India, farmers suicide account for less than 7.4 % of the total suicide.
Centre for Environment & Agriculture
Kanta Niwas, Madhu Park, 11th Road, Khar (W), Mumbai 400 052, India. | Email : [email protected] 26
Source: National Crime Record Bureau (NCRB)
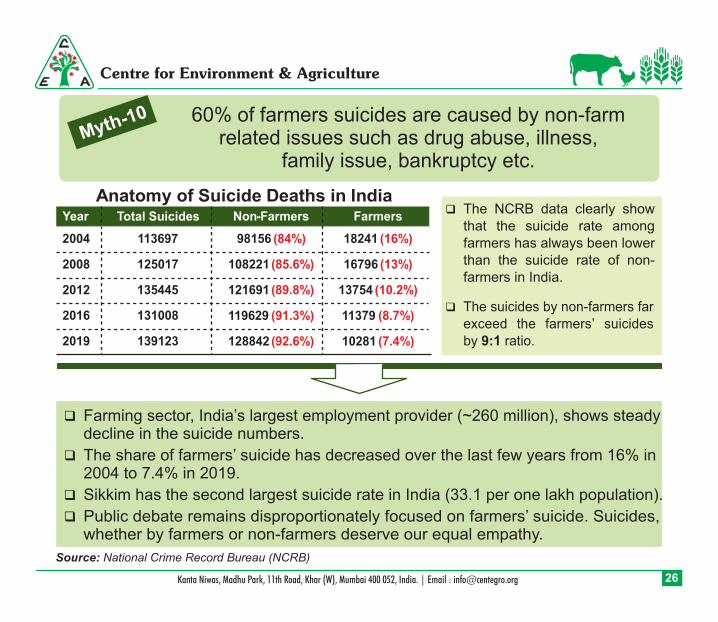
Farming sector, India’s largest employment provider (~260 million), shows steady decline in the suicide numbers.
The share of farmers’ suicide has decreased over the last few years from 16% in 2004 to 7.4% in 2019.
Sikkim has the second largest suicide rate in India (33.1 per one lakh population).
Public debate remains disproportionately focused on farmers’ suicide. Suicides, whether by farmers or non-farmers deserve our equal empathy.
Anatomy of Suicide Deaths in India
60% of farmers suicides are caused by non-farm related issues such as drug abuse, illness,
family issue, bankruptcy etc.
Myth-10
Year Total Suicides Non-Farmers Farmers
2004 113697 98156 (84%) 18241 (16%)
2008 125017 108221 (85.6%) 16796 (13%)
2012 135445 121691 (89.8%) 13754 (10.2%)
2016 131008 119629 (91.3%) 11379 (8.7%)
2019 139123 128842 (92.6%) 10281 (7.4%)
The NCRB data clearly show that the suicide rate among farmers has always been lower than the suicide rate of non-farmers in India.
The suicides by non-farmers farexceed the farmers’ suicidesby 9:1 ratio.
Centre for Environment & Agriculture
Kanta Niwas, Madhu Park, 11th Road, Khar (W), Mumbai 400 052, India. | Email : [email protected] 27
Facts
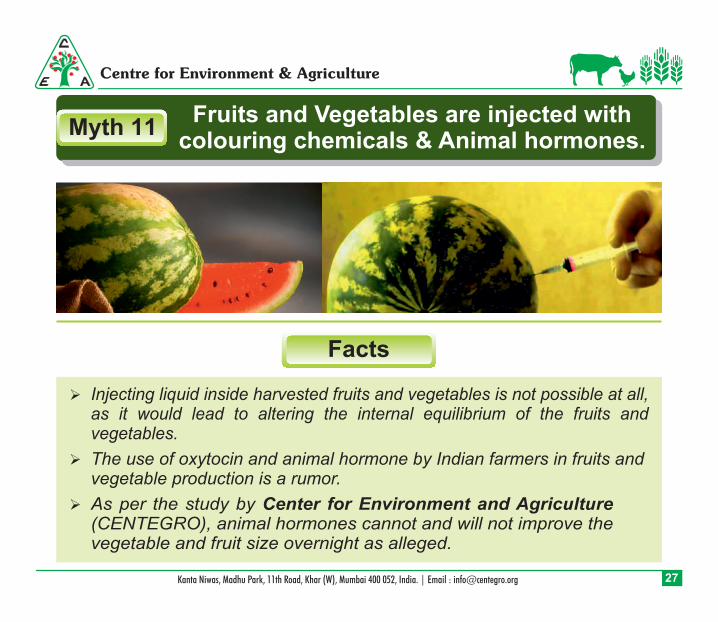
Myth 11Fruits and Vegetables are injected with
colouring chemicals & Animal hormones.
Injecting liquid inside harvested fruits and vegetables is not possible at all, as it would lead to altering the internal equilibrium of the fruits and vegetables.
The use of oxytocin and animal hormone by Indian farmers in fruits and vegetable production is a rumor.
As per the study by Center for Environment and Agriculture (CENTEGRO), animal hormones cannot and will not improve the vegetable and fruit size overnight as alleged.
Centre for Environment & Agriculture
Kanta Niwas, Madhu Park, 11th Road, Khar (W), Mumbai 400 052, India. | Email : [email protected] 28
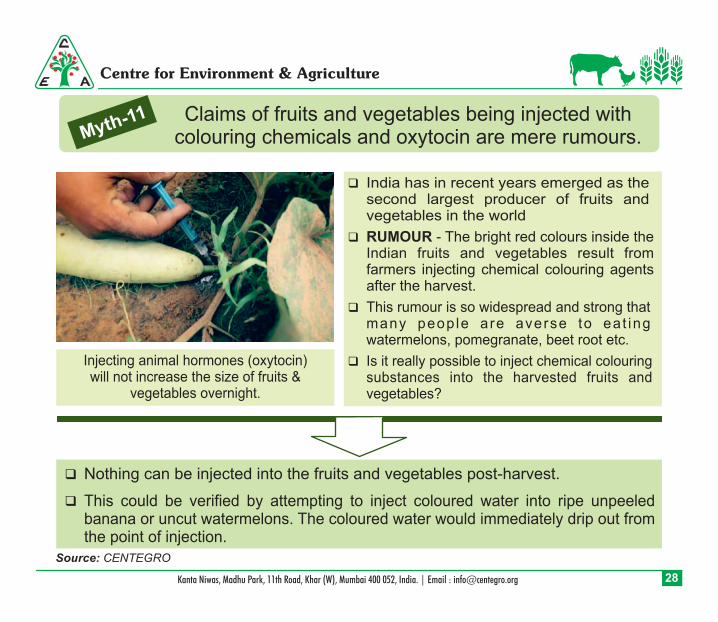
Injecting animal hormones (oxytocin)will not increase the size of fruits &
vegetables overnight.
Source: CENTEGRO
Nothing can be injected into the fruits and vegetables post-harvest.
This could be verified by attempting to inject coloured water into ripe unpeeled banana or uncut watermelons. The coloured water would immediately drip out from the point of injection.
Claims of fruits and vegetables being injected withcolouring chemicals and oxytocin are mere rumours.Myth-11
India has in recent years emerged as the second largest producer of fruits and vegetables in the world
RUMOUR - The bright red colours inside the Indian fruits and vegetables result from farmers injecting chemical colouring agents after the harvest.
This rumour is so widespread and strong that many peop le are averse to ea t ing watermelons, pomegranate, beet root etc.
Is it really possible to inject chemical colouring substances into the harvested fruits and vegetables?
Centre for Environment & Agriculture
Kanta Niwas, Madhu Park, 11th Road, Khar (W), Mumbai 400 052, India. | Email : [email protected] 29
q Initiatives like “Grow in India” campaign should be taken up similar to “Make in India” campaign.
q Focus on improving our agricultural exports to capture markets in all continents.
q Shift the focus from cereals production to cash segments such as Fruits, Vegetables and Livestock products.
q A strong Public Private Partnership (PPP) will accelerate growth in agriculture sector.
First and foremost, we need to take sustained efforts to dispel the strong rooted myths about Indian agriculture.
Way Forward
Centre for Environment & Agriculture
Kanta Niwas, Madhu Park, 11th Road, Khar (W), Mumbai 400 052, India. | Email : [email protected] 30
q Become STANDARD MAKERS from STANDARD TAKERS especially for products in which we are global leaders.
q Popularizing the positive achievements of Indian agriculture in the print, electronic and digital media with active involvement of the industry is the need of the hour.
q Arrest flow of foreign funds to NGOs involved in running covert campaigns against Indian agriculture. They are the major threat to Indian agriculture.
q Educating and training farmers on the timely use of correct pesticides. It would considerably improve the quantity and quality of the output – fetching better revenues.
q Foster R & D investments to drive innovation in agriculture sector.
q Establish a single authority to monitor agricultural production and trade.

Centre for Environment & Agriculture
Kanta Niwas, Madhu Park, 11th Road, Khar (W), Mumbai 400 052, India. | Email : [email protected]
/Centre for Environment and Agriculture
/centegro
Follow us:
/centegro
/centegro
Visit:
indianagriculturalfacts.com
For further information :
Center for Environment & Agriculture (CENTEGRO) is a Mumbai based not
for profit organization active in producing policy advocacy papers focused on
improving India’s farm economy.
About CENTEGRO