
Strengthening E-NAM in India: Way Forward - Naarm
143
Strengthening E-NAM in India: Way Forward Ranjit Kumar Sanjiv Kumar PC Meena B Ganesh Kumar N Sivaramane ICAR-NATIONAL ACADEMY OF AGRICULTURAL RESEARCH MANAGEMENT (ISO 9001:2015 CERTIFIED) Rajendranagar, Hyderabad-500 030, Telangana, India
-
Upload
khangminh22 -
Category
Documents
-
view
3 -
download
0
Transcript of Strengthening E-NAM in India: Way Forward - Naarm

Strengthening E-NAM in India: Way Forward
Ranjit Kumar
Sanjiv Kumar
PC Meena
B Ganesh Kumar
N Sivaramane
ICAR-NATIONAL ACADEMY OF AGRICULTURAL RESEARCH MANAGEMENT
(ISO 9001:2015 CERTIFIED)
Rajendranagar, Hyderabad-500 030, Telangana, India

Recommended Citation:
Ranjit Kumar, Sanjiv Kumar, PC Meena, B Ganesh Kumar & N Sivaramane (2020)
Strengthening E-NAM in India: Way Forward. ICAR-National Academy of Agricultural
Research Management, Hyderabad, India. Pp 1-119.
{This report is a part of study on “Structural Changes in Agricultural Marketing in
India: Effect on Inclusiveness and Smallholders’ Income”}
Published by:
Director
ICAR-National Academy of Agricultural Research Management
Rajendranagar, Hyderabad- 500 030, Telangana, INDIA
Phone: 040-24015070, Fax: 040-24015912
i
PREFACE
Agricultural commodities markets in India are regulated by the Agricultural Produce
Markets Regulation Acts (APMRA), enacted by most the states during the Sixties and
Seventies. All primary wholesale assembling markets were brought under the ambit
of these Acts. It was made compulsory to sell the agricultural produce only at
designated regulated markets (mandis) through registered intermediaries governed
by the Agricultural Produce Market Committee (APMC). Though, the APMC Act has
played profound roles in bringing order in agricultural markets and had several
reforms in the past. However, of-late, these regulated markets seem to fail in evolving
its functioning matching to changing dynamics of agricultural products and value
chain. Presently, there are 7,190 regulated wholesale markets and 22,505 rural
periodical markets in India. To bring greater efficiency in the present system, the
government of India launched a national agriculture market in 2016 by integrating all
the existing APMCs markets in the country through a common electronic platform
called e-NAM (http://www.enam.gov.in). It intends to benefit the farmers by better
price realization and reduced transaction costs, reducing the roles of middlemen and
price manipulation by them.
The present study examined the preparedness of APMC mandis in adopting the e-
NAM, the extent and pattern of participation by the smallholders in the new market
system, benefits arising out from the participation in the ongoing transformation in
the APMC markets in 4 major states (Madhya Pradesh, Maharashtra, Rajasthan, and
Telangana), and suggest plausible interventions to make the initiative inclusive for the
country as a whole. The research team conducted field surveys in these states and
interacted with farmers, traders, commission agents, and mandi officials, besides used
secondary data from published sources and market platforms to understand the
activities and process. The study suggests that to extend the full benefits of the e-
NAM, an innovative marketing model viz. Smart Micro-Mandi has been suggested in
the interest of smallholder farmers in India.
The study team thank all the mandi officials and officials from agricultural
universities in helping us in getting the required data and information from the
APMCs. We also thank all the respondents (farmers & traders) who participated in
the survey. We also put on record the contribution of all the field investigators and
PGDMA students of NAARM who helped in collecting the data. Last but not the least,
the team acknowledges the Director, NAARM for approving this study and guiding
the progress throughout.
ICAR-NAARM, Hyderabad May 2020
PROJECT TEAM


ii
Executive Summary
Agricultural markets in India are regulated by the Agricultural Produce Markets
Regulation Acts (APMRA) which was enacted by most of the states during the Sixties
and Seventies. The APMRA made it compulsory to sell the agricultural produce only
at designated regulated markets (mandis) through registered intermediaries
governed by the Agricultural Produce Market Committee (APMC). Presently, there
are 7,190 regulated wholesale markets in India, which falls under the ambit of the Act.
Although the Act has served its purposes during the past several decades in bringing
certain order in agricultural markets, off-late, complacency and rigidness in evolving
to match to the current needs, led huge dissatisfaction among farmers. Over the years,
several reforms have been introduced in the APMC Act, one of the recent and
important being the APMC Model Act (2003). However, the adoption of these reforms
has been uneven by the states. The National Commission on Agriculture (1976) and the
National Commission on Farmers (2004) have recommended that the regulated market should
be available to the farmers within a radius of 5 Km. The Committee constituted by the
Government of India (GoI) in 2013 for bringing reforms in agricultural markets also
highlighted several challenges in existing agricultural marketing systems, which are
against the interest of smallholder farmers.
Although agriculture and agricultural marketing is a state subject, the GoI decided to
create a national agriculture market (NAM) by integrating all the existing APMCs
markets in the country through a common electronic platform named e-NAM. The e-
NAM was launched in July 2016 and by end of the year, 250 APMC mandis across 10
states were integrated to the e-NAM platform, the number further increased to 1000.
The e-NAM is a compulsory delivery based trading platform, which enables the
farmers to realize the best possible price. The idea is that such an option may help to
reduce the cost of intermediation and to enhance farmers’ price realization by
enhancing marketing efficiency and bringing transparency in agriculture marketing.
In order to understand the effectiveness of e-NAM, particularly on the smallholders'
participation and price realization due to e-NAM, this present study was conducted
during 2017-2020 in 4 major states (Madhya Pradesh, Maharashtra, Rajasthan and
Telangana). The data was collected during field survey from the farmers, traders, and
mandi officials in these states. Besides, secondary data about transactions, live trading
on e-NAM, and prices of the commodities were collected from the websites,
https://agmarknet.gov.in/ and https://www.enam.gov.in/. The field survey was
conducted in two stages- first in 2017 and second in 2019. Specifically, the process flow
that happens at mandis starting from entry to sampling, assaying, auction, weighing,
sale agreement, payment type, and final exit from the market in all the selected e-
NAM mandis were observed.

iii
Status of e-NAM implementation in India
As of 15th May 2020, total 1000 APMC mandis across 18 states and 3 Union Territories
(UTs) have been integrated to the-e-NAM. Among different stakeholders, 1.28 lakhs
traders and 70,969 commission agents are registered in these e-NAM mandis to help
the transaction of 1005 registered FPOs and 1.66 crore registered farmers on the e-
NAM platform. A total of 150 commodities have been identified to be traded through
e-NAM that includes 25 types of cereals and pulses, 13 types of oilseeds, 29 types of
fruits, 40 types of vegetables, 14 types of spices, and the remaining 29 types of
commodities under the miscellaneous category. The list includes almost all types of
agricultural commodities- from green leafy vegetables to tender coconut and flowers
like gladiolus and carnation. On the other hand, more than 5 quality parameters have
been identified as essential to be assayed to categorize the commodity into 3 different
grades before trading on e-NAM. Although, the corresponding infrastructure,
facilities, and manpower could not be created in any of the e-NAM mandis.
Preparedness of e-NAM mandis
The level of preparedness in implementing various components of e-NAM in the
states of Madhya Pradesh, Maharashtra, Rajasthan, and Telangana were studied.
These components were the generation of Unique Lot ID at entry gate, sampling from
heap/lot, e-auction, assaying, best price-SMS sent to the farmers, electronic
weighments, generation of sale receipt, online payment and permit/ gate exit, etc.
The salient observations are:
(i) Unique lot ID: It was observed that the farmers are not issued permanent ID in any market selected in the study. When a farmer enters the market, it is regarded as a fresh entry. Therefore, it is not possible to trace the details of all transactions made by the farmer. Although unique lot ID is generated in most of the cases.
(ii) Sampling & Assaying: It was found that only in few cases, sampling of individual lot is being done. Similarly, these mandis are not well equipped with assaying equipments and technical manpower to conduct assaying of all the lots. Further, assaying is done manually, which at present takes 20-30 minutes for one sample. Hence, it is very difficult to assay all the lots even during the normal season and enter the information in the portal before online bidding starts.
(iii) Online trading: All the markets studied except Nizamabad, were continuing with open auction method in 2017, while the traded price and quantity were entered after the transactions completed offline. However, during the second stage of the survey in 2019, traders were bidding on the e-NAM platform after personally verifying the lots of major commodities only in the mandis.
(iv) Online payment: Most of the farmers and traders are not in favour of online payment. However, on the insistence of market authorities, traders/commission agents are routing some of the payment through the online system by NEFT/RTGS/IMPS. Cash transaction is still predominant in all markets.

iv
Despite of above operational challenges, when the daily transaction on e-NAM
platform in the year 2017 were analyzed for the 4 states, some interesting trend was
observed. It was found that 58 e-NAM mandis in Madhya Pradesh (MP) traded 48
different types of commodities (including different varieties of the same commodity)
through e-NAM. Top 15 e-NAM mandis handled about 61% of total transactions by
volume in the state on e-NAM. In Maharastra, 44 e-NAM mandis reported
transactions of 38 different types of commodities, while the top 10 transacted 84% of
the total commodities in the state. In Rajasthan, 25 e-NAM mandis handled 56 types
of different commodities, while the top 10 mandis handled about 61% of total
commodity in the state. Similarly, in Telangana, 44 registered e-NAM mandis
reported transaction of 202 types of different commodities (including 36 different
varieties of paddy alone), while the top 12 mandis handled about 61% of total
commodity by volume. Two commodities, viz. paddy and turmeric constituted more
than 50% of total transactions on e-NAM in the state.
Above all, there was a huge variation in the average daily prices within each month
in these markets for the same commodity, which indicates the absence of inter-mandi
trade of the commodities. Further, the peak transacted volume of the same commodity
in a month also varied across the mandis within the state. The reported data on the e-
NAM portal were also inconsistent in terms of arrival and traded quantity, prices of
traded commodities (minimum, maximum & modal values), etc. Therefore, it can be
said that these e-NAM mandis has been computerized, but still are far away from its
full implementation.
Live trading on e-NAM
The e-NAM is contemplated to streamline the uniform procedures across the
integrated markets, removing information asymmetry between buyers and sellers and
promoting real-time price discovery, promoting transparency in the auction process,
and access to a nationwide market for the farmer, with prices commensurate with the
quality of his/her produce. Therefore, for e-NAM to be in operation in a true sense, it
is necessary to have live trading through e-NAM platform for which few aspects are
pre-requisites: i) uploading of detailed information (quality and quantity without
seller’s name) of each lot of the commodities on the e-NAM portal, ii) specific pre-
defined timing of opening and closing of each e-NAM mandi, iii) intra-mandi trading
licenses for the buyers/traders, iv) guarantee for quality disclosed on the trading
platform, v) warehouses for pre- or post-trade stocking of the commodity, etc.
However, when live trading information in selected mandis were observed during
April 2020, a mismatch was found between the number of mandis shown as trading
live on a particular day and actual mandis showing live trading in realtime. Such
mismatch in information and non-availability of all the mandis simultaneously on the
live trading platform may defeat the purpose of e-NAM of providing a uniform
national trading platform. Different mandis within state and in some cases, different
commodities within the same mandi showed different trading timing. Besides, there
was no information available on the portal to indicate about opening and closing time

v
of these mandis, which operate in different timings. This might be causing huge
inconveniences/entry barriers for the buyers/traders who are not physically available
in particular mandi.
Benefits from participation of smallholders in e-NAM
The participation of smallholders in e-NAM mandi and the benefits realized in terms
of a better price for their produce was examined from field survey as well as through
comparing the modal price of the commodities reported on the e-NAM portal and that
on AGMARKNET portal for the April 2020 month. To achieve this objective, a total of
446 farmers were randomly selected within a radius of about 50 kilometers from one
major mandi selected in each state. These mandis were APMC Jabalpur in Madhya
Pradesh, APMC Parbhani in Maharashtra, APMC Shadnagar (Rangareddy district) in
Telangana, and APMC Kota in Rajasthan.
There was a clear difference in the selling pattern of the commodities after harvest by
the smallholder farmers vis-à-vis large farmers in Madhya Pradesh state. The majority
of smallholder farmers were found selling their major produce in the e-NAM mandi,
which might be due to the vicinity of the mandi to the farmers. In contrast to this, the
majority of large farmers were selling paddy and wheat outside the mandi. Another
important observation was that on average farmers realized better prices when they
sold their produce in the mandi, barring few exceptions like paddy. In Maharashtra,
the proportion of smallholder farmers selling major commodities in e-NAM mandis
was significantly lower than that of large farmers. The smallholder farmers realized
better farm gate prices outside the mandi. In Rajasthan, all the farmers, irrespective of
farm size category, were found selling most of their harvest in APMC mandi only,
except for some green vegetables. In some commodities, the average selling price was
higher for smallholder farmers, while in commodities like paddy and wheat, large
farmers got a better price. Smallholder farmers in Telangana realized better prices for
their produce in the mandi as compared to that of large farmers, who got better prices
outside mandi due to their better bargaining power. Among all the major crops, cotton
was found sold outside the mandi by the majority of the farmers in the state, while
mandi was the main market place for paddy and maize.
The comparison of the same commodity traded in the same APMC mandis through
non-e-NAM (data collected from Agmarknet) and e-NAM portals indicated that the
expected price advantage through e-NAM was not significant in all the states under
study. It is also observed that still significant number of smallholder farmers could be
out of this structural change in the marketing system in the country, as they are
unaware of the incentives and benefits being offered through e-NAM trade. Therefore,
to extend the full benefit of the structural changes introduced in the agricultural
market in terms of e- NAM, there is a need for revisiting the implementation process
as well as bringing some more additional features into the system in the interest of
smallholder farmers.

vi
Policy recommendations for improving the effectiveness of e-NAM
A. Strategic level
1. The e-NAM should be managed completely as a separate business which shall be responsible for managing the unified electronic trading platform without any glitches, while each mandi should be treated as one of its clients on the pattern of hospitality aggregators such as OYO hotels or Ola/Uber taxi service.
2. Each e-NAM mandi should act as Strategic Business Unit (SBU) i.e. profit center which focuses on product offering and market segment. All the seller-farmers may be made a shareholder in this SBU according to their contribution in sale or share purchase. These mandis should be encouraged to create product differentiation & offering, and marketing plan.
3. All efforts should be made to reduce the role of traders and commission agents (CAs), who take away a major chunk of the values from the farmers and the mandis. The roles offered by the traders and CAs should be performed by the respective mandi itself.
4. Each e-NAM mandi should start with 100% online transaction with only 1 or 2 major commodities initially, and after gaining experience & expertise, it should expand to high value and perishable commodities.
5. All e-NAM mandis shall have essentially own or linked with WDRA accredited warehouses/cold storages according to the major commodities transacted in the mandi.
6. The e-NAM mandi should allow any bulk buyer with proper KYC without
having a trading license as well to have efficient price discovery in favour of farmers.
7. The e-NAM should be fully integrated with Artificial Intelligence and the Internet of Things (IoT) to provide real-time information as well as analytics to different stakeholders when and wherever s/he wants.
8. In the medium to long run, as the government intends to integrate 22,000 mandis including rural markets and APMC mandis, the strategy should be to create new mandis in the line of Smart Micro-Mandi* (brief about it is given at the end).
9. All the unit level (lot-wise) transaction data should be made accessible for academic and research purposes with proper registration.
B. Tactical level
1. Efforts should be made to develop a mobile app in the vernacular language which can be used by the farmer-sellers. Specific slot may be given to the farmers through the app, who intends to sell their commodities. The farmers may input the details of the lot on the mobile app well in advance before coming to the mandi.

vii
2. All information related to mandi timing, online trading timings- opening and closing (commodity-wise, if it is different) should be standardized and well-publicized.
3. All e-NAM mandis should be LIVE at a specific time on all working days, even if there is no seller on a particular day. Prior notification shall be mandatory for the closure of the mandi.
4. Within the state, all e-NAM mandis should have the same opening and closing timing. However, to manage the arrivals, different commodities may be given different opening and closing hours for trade on e-NAM platform.
5. The e-NAM mandi should start a campaign for registration of all the prospective farmer-sellers during lean season.
C. Operational level
1. Entry Gate receipt/ Lot ID may be automatically generated on arrival by QR code scanning, as the details about the commodities and lots along with the grade quality might have been entered into the system through the mobile app.
2. There may be separate gate entry for those farmer-sellers who have not entered the lots’ details in the mobile app.
3. If the farmers bring some more commodities other than e-NAM tradable commodities, they may be allowed to sell conventionally i.e. offline.
4. Minimum quality specifications for each commodity to be traded through the e-NAM platform should be communicated to the farmers. The farmers shall be asked to declare their lots according to the grade standard on the mobile app.
5. On arrival in the mandi, random sampling should be carried out for the lots, and quality assaying should be done. Each farmer shall be rewarded with the Five-Star Quality
Rating System based on deviation from the self-declared quality of the commodities brought to the mandi. Continuous Excellent performers may be rewarded in annual function.
6. The details of the commodities/lots should be automatically and seamlessly uploaded on the e-NAM bidding platform. However, it shall be reflected on the trading platform only after physically approved by the mandi officials.
7. All possible commodities may be listed in the system and high priority commodities should appear on top in the given mandi. It will eliminate the possible error in the manual entering the name.

viii
8. After awarding the highest bidder and ensuring the full payment to the sellers’ account, the commodities may be transported through third party logistic partners or if buyers wish, it may be kept in the warehouse safely on a storage charge basis.
*Smart Micro-Mandi (SMM): According to the estimate, India needs about 28,000
Smart Micro-Mandis to provide accessibility to all the farmer-producers. The four
basic pillars of the model are: 1) Proximity of the SMM to the farmer (proposed 5-6
km), 2) Assaying -based grading and mixing of the lot (milkization), 3)
Dematerialization & Pledge Financing (for instant partial payment to the farmers),
and 4) End-to-end digitization. Application of modern technologies like AI, IoT, Data
Science, Sensor-based imaging would make these micro-mandi smart. Inter-mandi or
national trading of agricultural commodity is only possible, if the quality of each lot
are assayed correctly and displayed on the portal. The brief of Smart Micro-Mandi can
be accessed on https://naarm.org.in/wp-
content/uploads/2018/09/E_Policy_Brief_SMM04082018.pdf.


ix
Table of Contents
Chapters Page No.
Preface i
Executive Summary ii
List of Tables xi
List of Figures xiv
List of boxes xvi
List of Annexures xvii
List of Abbreviations xviii
Chapter 1 Introduction 1
1.1 Objectives of the Study 4
1.2 Limitations of the Study 4
Chapter 2 Data and Methodology 5
2.1 Primary data collection 5
2.2 Sampling procedure and sample size 6
2.3 Data Analysis 8
Chapter 3 e-NAM Implementation in India 10
3.1 Onboarding of APMC mandis on e-NAM platform 10
3.2 Innovations and initiatives in e-NAM 12
3.3 Process flow on e-NAM platform 14
3.4 Coverage of commodities under e-NAM 15
3.5 Inter-state trading license and inter-state trade on e-NAM
17
3.6 Live e-NAM mandi and Live trading on e-NAM portal 17
3.7 Daily transaction through e-NAM in major mandis, 2017 20
3.7.1 e-NAM transaction in Madhya Pradesh state 20
3.7.2 e-NAM transaction in Maharashtra state 32
3.7.3 e-NAM transaction in Telangana state 38
3.7.4 e-NAM transaction in Rajasthan state 47
Chapter 4 Characteristics & Preparedness of e-NAM Mandis 56
4.1 General features of selected e-NAM mandis 56
4.2 Preparedness of e-NAM enabled selected mandis (Round-I survey)
58
4.3 Preparedness of e-NAM mandis (Round-II survey) 62
4.4 Transaction reported on e-NAM platform 65

x
Chapter 5 Benefits from Participation of Smallholders in e-NAM 72
5.1 Socio-economic profile of the sample farmers 73
5.2 Inclusiveness of smallholders in APMC markets 75
5.2.1 Cropping pattern and marketed surplus in Madhya Pradesh
75
5.2.2 Cropping pattern and marketed surplus in Maharashtra 78
5.2.3 Cropping pattern and marketed surplus in Rajasthan 80
5.2.4 Cropping pattern and marketed surplus in Telangana 82
5.3 Farm-gate price reported on e-NAM and Agmarknet platforms
85
Chapter 6 Conclusions & Policy Recommendations 91
References 96
Annexure 99

xi
List of Tables
Table 2.1. Multistage sampling criteria followed during the primary survey
6
Table 2.2. Sample size of different stakeholders during both round of surveys
7
Table 3.1. State-wise number of registered traders and unified licenses issued (as on 31st Dec 2019)
12
Table 3.2. Chronological development on e-NAM 13
Table 3.3. Inter-state licenses approved to the traders till 31st January 2020 17
Table 3.4. Opening and closing time of trade in different mandi for different commodities (as on 17-18 Apr 2020)
20
Table 3.5. Monthly transaction of Chana (Bengal Gram) in top 5 mandis, 2017 (quintals)
22
Table 3.6. Monthly transaction of Tur (Red Gram) in top 5 mandis in 2017 (quintals)
24
Table 3.7. Monthly transaction of Masoor (Lentil) in top 5 mandis in 2017 (quintals)
26
Table 3.8. Monthly transaction of Soyabeans in top 5 mandis in 2017 (quintals)
28
Table 3.9. Monthly transaction of Wheat in top 5 mandis in 2017 (quintals) 30
Table 3.10. Monthly transaction of Soyabeans in top 5 mandis, 2017 (quintals)
34
Table 3.11. Monthly transaction of Chana (Bengal Gram) in top 3 mandis, 2017 (quintals)
34
Table 3.12. Monthly transaction of Wheat in top 5 mandis, 2017 (quintals) 36
Table 3.13. Monthly transaction of Tur (Red Gram) in top 2 mandis, 2017 (quintals)
37
Table 3.14. Monthly transaction of Paddy in top 5 mandis, 2017 (quintals) 39
Table 3.15. Monthly transaction of Turmeric in top 4 mandis, 2017 (quintals) 41
Table 3.16. Monthly transaction of Dry Chillies in top 3 mandis, 2017 (quintals)
42
Table 3.17. Monthly transaction of Tur (Red Gram) in top 5 mandis, 2017 (quintals)
43
Table 3.18. Monthly transaction of Cotton in top 5 mandis, 2017 (quintals) 45
Table 3.19. Monthly transaction of Maize in top 5 mandis, 2017 (quintals) 45
Table 3.20. Monthly transaction of Mustard in top 5 mandis, 2017 (quintals) 49
Table 3.21. Monthly transaction of Guar Seeds in top 5 mandis, 2017 (quintals)
50
Table 3.22. Monthly transaction of Wheat in top 5 mandis, 2017 (quintals) 51
xii
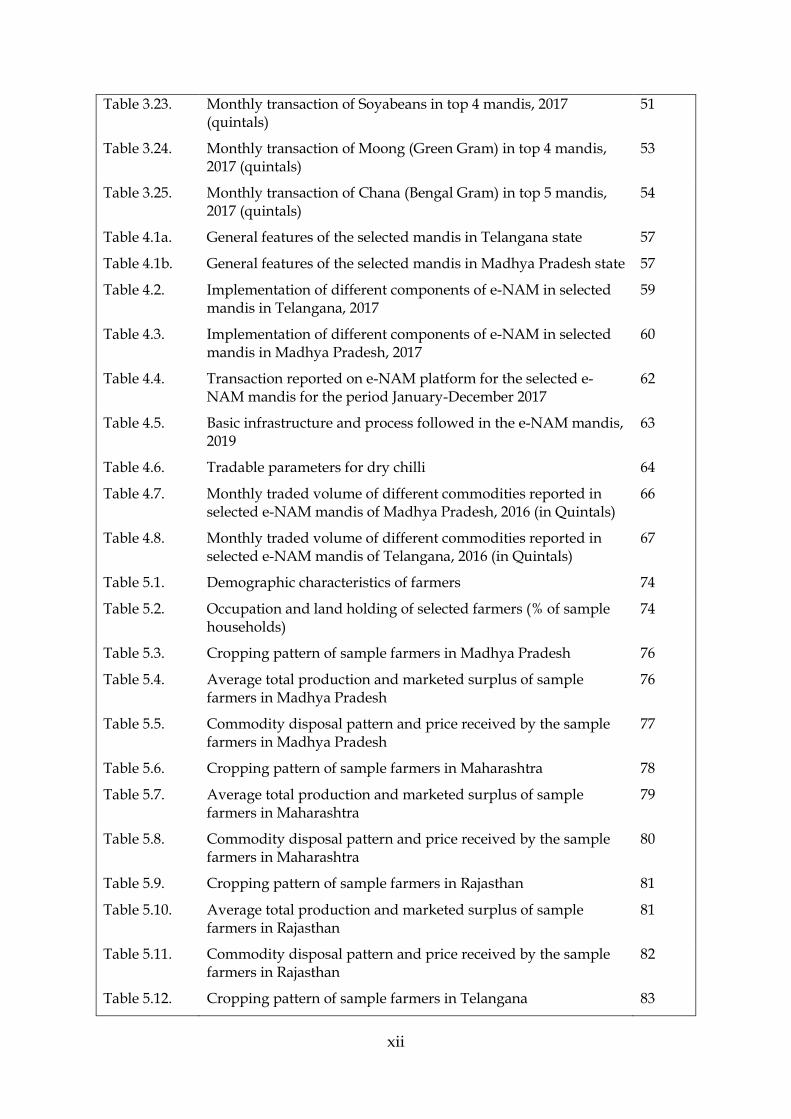
Table 3.23. Monthly transaction of Soyabeans in top 4 mandis, 2017 (quintals)
51
Table 3.24. Monthly transaction of Moong (Green Gram) in top 4 mandis, 2017 (quintals)
53
Table 3.25. Monthly transaction of Chana (Bengal Gram) in top 5 mandis, 2017 (quintals)
54
Table 4.1a. General features of the selected mandis in Telangana state 57
Table 4.1b. General features of the selected mandis in Madhya Pradesh state 57
Table 4.2. Implementation of different components of e-NAM in selected mandis in Telangana, 2017
59
Table 4.3. Implementation of different components of e-NAM in selected mandis in Madhya Pradesh, 2017
60
Table 4.4. Transaction reported on e-NAM platform for the selected e-NAM mandis for the period January-December 2017
62
Table 4.5. Basic infrastructure and process followed in the e-NAM mandis, 2019
63
Table 4.6. Tradable parameters for dry chilli 64
Table 4.7. Monthly traded volume of different commodities reported in selected e-NAM mandis of Madhya Pradesh, 2016 (in Quintals)
66
Table 4.8. Monthly traded volume of different commodities reported in selected e-NAM mandis of Telangana, 2016 (in Quintals)
67
Table 5.1. Demographic characteristics of farmers 74
Table 5.2. Occupation and land holding of selected farmers (% of sample households)
74
Table 5.3. Cropping pattern of sample farmers in Madhya Pradesh 76
Table 5.4. Average total production and marketed surplus of sample farmers in Madhya Pradesh
76
Table 5.5. Commodity disposal pattern and price received by the sample farmers in Madhya Pradesh
77
Table 5.6. Cropping pattern of sample farmers in Maharashtra 78
Table 5.7. Average total production and marketed surplus of sample farmers in Maharashtra
79
Table 5.8. Commodity disposal pattern and price received by the sample farmers in Maharashtra
80
Table 5.9. Cropping pattern of sample farmers in Rajasthan 81
Table 5.10. Average total production and marketed surplus of sample farmers in Rajasthan
81
Table 5.11. Commodity disposal pattern and price received by the sample farmers in Rajasthan
82
Table 5.12. Cropping pattern of sample farmers in Telangana 83

xiii
Table 5.13. Average total production and marketed surplus of sample farmers in Telangana
83
Table 5.14. Commodity disposal pattern and price received by the sample farmers in Telangana
84
Table 5.15. Number of APMCs and commodities traded on eNAM and Non-e-NAM in selected states during April 2020
86
Table 5.16. Number of common APMCs and traded commodities between eNAM and Non-eNAM platforms in selected states during April 2020
86
Table 5.17. Average of daily modal price of traded commodities under eNAM and Non-eNAM mandis during April 2020
89

xiv
List of Figures
Fig. 2.1. APMCs visited during first round of survey 5
Fig. 2.2. APMCs visited during second round of survey 5
Fig. 3.1. State-wise number of APMC mandis integrated to e-NAM platform and different stakeholders registered
11
Fig. 3.2. Process flow of e-NAM mandi 15
Fig. 3.3. Screenshots showing number of e-NAM mandis live trading 19
Fig. 3.4. e-NAM mandis in Madhya Pradesh according to commodity transaction in 2017
21
Fig. 3.5. Share of different commodities transacted in the top 15 e-NAM mandis in Madhya Pradesh, 2017
21
Fig. 3.6. Average daily modal price of Chana (Bengal Gram) in 5 major e-NAM mandis in Madhya Pradesh, 2017
23-24
Fig. 3.7. Average daily modal price of Tur (Red Gram) in 5 major e-NAM mandis in Madhya Pradesh, 2017
25-26
Fig. 3.8. Average daily modal price of Masoor (Lentil) in 5 major e-NAM mandis in Madhya Pradesh, 2017
27-28
Fig. 3.9. Average daily modal price of Soyabeans in 5 major e-NAM mandis in Madhya Pradesh, 2017
29-30
Fig. 3.10. Average daily modal price of Wheat in 5 major e-NAM mandis in Madhya Pradesh, 2017
31-32
Fig. 3.11. e-NAM mandis in Maharashtra according to commodity transaction in 2017
33
Fig. 3.12. Share of different commodities transacted in the top 10 e-NAM mandis in Maharashtra, 2017
33
Fig. 3.13. Average daily modal price of Soyabeans in major e-NAM mandis in Maharashtra, 2017
34
Fig. 3.14. Average daily modal price of Chana/Bengal Gram in major e-NAM mandis in Maharashtra, 2017
35
Fig. 3.15. Average daily modal price of Wheat in major e-NAM mandis in Maharashtra, 2017
36-37
Fig. 3.16. Average daily modal price of Tur/Arhar in major e-NAM mandis in Maharashtra, 2017
37
Fig. 3.17. Different e-NAM mandis in Telangana according to commodity transaction in 2017
38
Fig. 3.18. Share of different commodities transacted in the top 12 e-NAM mandis in Telangana, 2017
39
Fig. 3.19. Average daily modal price of Paddy in major e-NAM mandis in Telangana, 2017
40

xv
Fig. 3.20. Average daily modal price of Turmeric in major e-NAM mandis in Telangana, 2017
41
Fig. 3.21. Average daily modal price of Dry Chillies in major e-NAM mandis in Telangana, 2017
42
Fig. 3.22. Average daily modal price of Tur/Arhar in major e-NAM mandis in Telangana, 2017
43-44
Fig. 3.23. Average daily modal price of Cotton in major e-NAM mandis in Telangana, 2017
44-45
Fig. 3.24. Average daily modal price of Maize in major e-NAM mandis in Telangana, 2017
46
Fig. 3.25. Different e-NAM mandis in Rajasthan according to commodity transaction in 2017
47
Fig. 3.26. Commodities transacted in the top 10 e-NAM mandis in Rajasthan, 2017
47
Fig. 3.27. Major commodities transacted through e_NAM in major e-NAM mandis
48
Fig. 3.28. Average daily modal price of Mustard in major e-NAM mandis in Rajasthan, 2017
49
Fig. 3.29. Average daily modal price of Guar Seeds in major e-NAM mandis in Rajasthan, 2017
50
Fig. 3.30. Average daily modal price of Wheat in major e-NAM mandis in Rajasthan, 2017
51
Fig. 3.31. Average daily modal price of Soyabeans in major e-NAM mandis in Rajasthan, 2017
52
Fig. 3.32. Average daily modal price of Moong/Green Gram in major e-NAM mandis in Rajasthan, 2017
53
Fig. 3.33. Average daily modal price of Chana/Bengal Gram in major e-NAM mandis in Rajasthan, 2017
54
Fig. 4.1. Different marketing activities going on during visit to e-NAM mandis 61
Fig. 4.2. Manual counting of broken/damaged peanut in the assaying lab of one of the e-NAM mandis
63
Fig. 4.3. Traders assessing the quality of Red Gram by personally inspecting the lot
64
Fig. 4.4. Daily lot arrival in various markets of Telangana, 2016-17 64
Fig. 4.5. Red chillies kept in gunny bags or as big heap making it difficult to assay the quality mechanically
65
Fig. 4.6. Daily total transaction reported in the 5 selected e-NAM mandis in Madhya Pradesh
66
Fig. 4.7. Different commodities traded on e-NAM in selected mandis, 2016 66
Fig. 4.8. Daily average modal price of Bengal Gram in 5 selected mandi in Madhya Pradesh
67

xvi
Fig. 4.9. Daily total transaction reported in the selected e-NAM mandis in Telangana
68
Fig. 4.10. Different commodities traded on e-NAM in selected mandis in Telangana, 2016
68
Fig. 4.11. Daily average modal price of Paddy and Maize in selected mandis in Telangana
69
Fig. 4.12. Process flow and the gaps observed at e-NAM mandis under study 71
Fig. 5.1. State-wise distribution of sample farmers 75
Fig. 5.2. Disposal pattern of different crops by sample farmers in Madhya Pradesh (selling after harvest in weeks)
77
Fig. 5.3. Disposal pattern of different crops by sample farmers in Maharashtra (selling after harvest in weeks)
79
Fig. 5.4. Disposal pattern of different crops by sample farmers in Rajasthan (selling after harvest in weeks)
82
Fig. 5.5. Disposal pattern of different crops by sample farmers in Telangana (selling after harvest in weeks)
84
Fig. 5.6. Top 10 Commodities traded by majority of APMCs under eNAM in selected states, April 2020
87
Fig. 5.7. Comparison of average daily modal price (ADMP) of traded commodities through e-NAM and non-e-NAM options in the same mandis (₹/q)
88
List of Boxes
Box 1. Sampling methods recommended for assaying 16
xvii
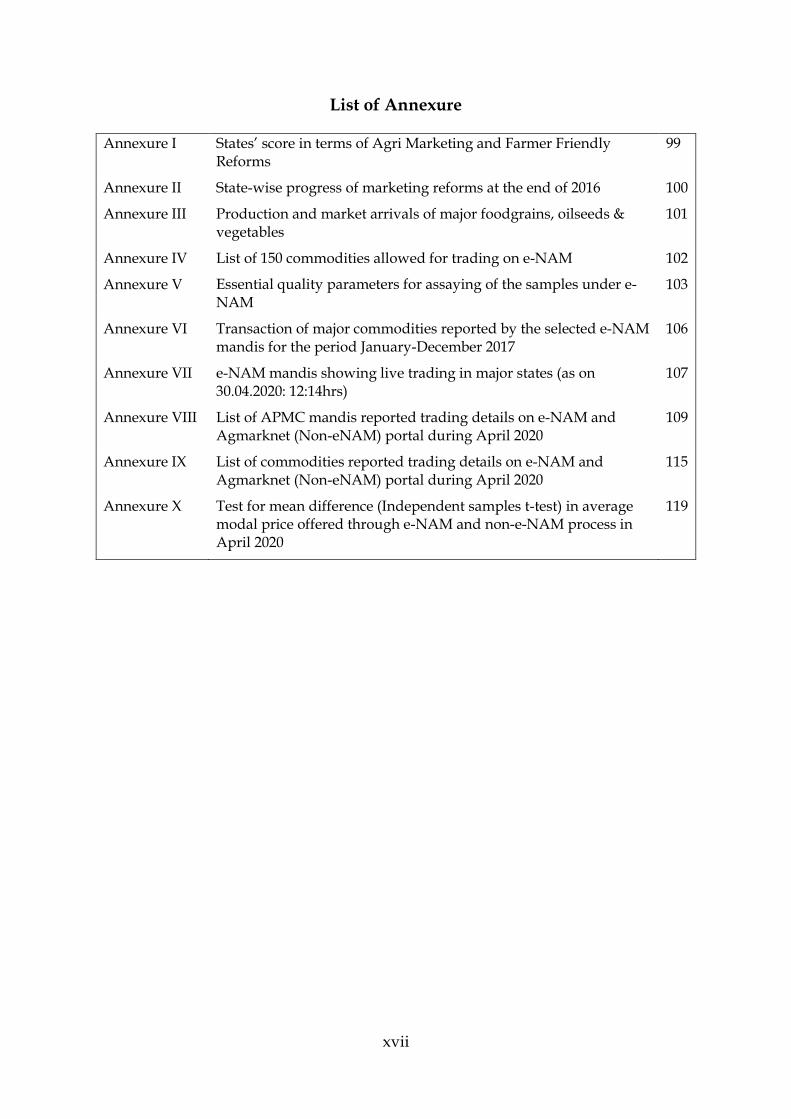
List of Annexure
Annexure I States’ score in terms of Agri Marketing and Farmer Friendly Reforms
99
Annexure II State-wise progress of marketing reforms at the end of 2016 100
Annexure III Production and market arrivals of major foodgrains, oilseeds & vegetables
101
Annexure IV List of 150 commodities allowed for trading on e-NAM 102
Annexure V Essential quality parameters for assaying of the samples under e-NAM
103
Annexure VI Transaction of major commodities reported by the selected e-NAM mandis for the period January-December 2017
106
Annexure VII e-NAM mandis showing live trading in major states (as on 30.04.2020: 12:14hrs)
107
Annexure VIII List of APMC mandis reported trading details on e-NAM and Agmarknet (Non-eNAM) portal during April 2020
109
Annexure IX List of commodities reported trading details on e-NAM and Agmarknet (Non-eNAM) portal during April 2020
115
Annexure X Test for mean difference (Independent samples t-test) in average modal price offered through e-NAM and non-e-NAM process in April 2020
119
xviii
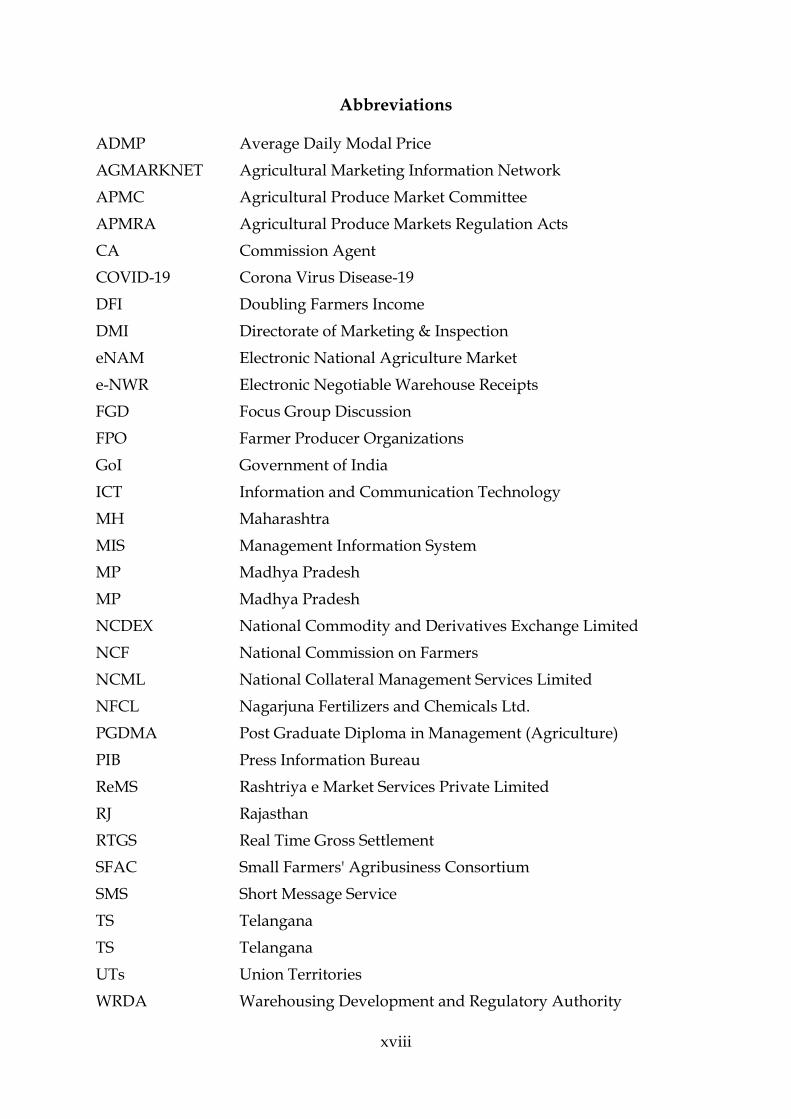
Abbreviations
ADMP Average Daily Modal Price
AGMARKNET Agricultural Marketing Information Network
APMC Agricultural Produce Market Committee
APMRA Agricultural Produce Markets Regulation Acts
CA Commission Agent
COVID-19 Corona Virus Disease-19
DFI Doubling Farmers Income
DMI Directorate of Marketing & Inspection
eNAM Electronic National Agriculture Market
e-NWR Electronic Negotiable Warehouse Receipts
FGD Focus Group Discussion
FPO Farmer Producer Organizations
GoI Government of India
ICT Information and Communication Technology
MH Maharashtra
MIS Management Information System
MP Madhya Pradesh
MP Madhya Pradesh
NCDEX National Commodity and Derivatives Exchange Limited
NCF National Commission on Farmers
NCML National Collateral Management Services Limited
NFCL Nagarjuna Fertilizers and Chemicals Ltd.
PGDMA Post Graduate Diploma in Management (Agriculture)
PIB Press Information Bureau
ReMS Rashtriya e Market Services Private Limited
RJ Rajasthan
RTGS Real Time Gross Settlement
SFAC Small Farmers' Agribusiness Consortium
SMS Short Message Service
TS Telangana
TS Telangana
UTs Union Territories
WRDA Warehousing Development and Regulatory Authority

1
Chapter 1
Introduction
Agricultural marketing usually refers to all the activities involved in the supply of farm inputs
and output- including all those operations which are related to the procurement, collecting,
grading, storing, food and agro-processing, transportation, financing, and selling of the
agricultural produce. All these activities may be divided into pre-cultivation, cultivation, and
post-production activities, or into input marketing and output marketing. Input marketing is
mainly catered by the private sectors, while output marketing rests with the producers, viz.
farmers. In India, out of 14.6 crore farmers, more than 85% are smallholders, which means
they have operational land holding less than 2 hectares. In some states, like Bihar, West Bengal,
and Kerala, the proportion of marginal farmers (<1.0 ha holding) is more than 80 percent.
Despite this, total crop production in India has been increasing consistently. In the last 10 years
(2009/10 to 2018/19), the production of foodgrains has increased from 218 mt to 285 mt, that
of fruits increased from 72 mt to 99 mt, vegetables from 134 mt to 186 mt (Fertilizer Statistics,
2019). Agricultural commodity markets in India are often cited as the archetypal example of
competitive markets, having many price-taking producers, and a small number of buyer-
traders. The farmers, who often live in remote areas with poor infrastructure, face high
transaction costs that significantly reduce their incentives for market participation especially
for agricultural output markets (Barrett, 2008; Key, et al., 2000). The markets and marketing
of these products has not changed efficiently so far.
The most important factor for sustained growth in agricultural productivity is the ‘nature of
incentives offered to agricultural producers’ in agricultural markets (Bates, 2014; Schultz,
1976). If the basic problem is failure to provide proper incentives to farmers for raising
agricultural productivity, then it follows that a principal source of the problem in agricultural
markets lies in its institutional framework administered by the state, which determines returns
to cultivators for their produce in the markets (Bates, 2014). While ability of the agricultural
marketing system to bring steadiness and boost agriculture growth depends on the regulatory
framework for regulations of the agricultural markets which are administered by the state
government (Purohit, 2013).
Farmers in India sell their produce through brokers and commission agents mainly in distress,
due to lack of market connectivity. The small & marginal farmers, with uneconomical sized
marketable lots, find it difficult to sell their produce in APMC regulated market. Transportation
cost is the major cost in marketing due to the distant location of the APMC mandi. Therefore,
instead they sell their produce to local village traders at locally determined prices, who in turn
function as aggregators transact at the APMCs. This intermediation has naturally been
depriving the farmer-producers of aiming for optimal or market-linked price realization (DFI,
2017). Due to this, despite a very high marketed surplus ratio (70 to 95%) for most of the
agricultural commodities, only 30% of the production of cereals, pulses, oilseeds, or vegetables
are sold in APMC mandis (Annexure). Due to their high dependency on farming for their
livelihood and almost negligible saving from the previous crops, they tend to sell their entire

2
surplus immediately after the harvest. Most of them are also inter-locked with the village
traders or traders in the mandi for their financial need. These factors make them vulnerable
when they arrive in the market to sell their produce. Their smaller lot size, mixed quality of
produce, an urgency to sell the produce, lack of storage capacity, etc. further aggravate their
bargaining position in the output market. Several studies in the past have extensively
documented the insufficient infrastructure and lack of reliable information systems, and
reduced market efficiency1 and lowered farmers’ incentives to specialise for market production
(Lele, 1977; Rilay & Staatz, 1981; Acharya 2006; 2009). According to Chand (2016),
agricultural markets are characterized by poor competitiveness, fragmentation, inefficiency,
presence of excessive middlemen, and frequent price manipulations.
Agricultural commodities markets in India are regulated by the Agricultural Produce Markets
Regulation Acts (APMRA) which was enacted by most of the states during the Sixties and
Seventies. All primary wholesale assembling markets were brought under the ambit of these
Acts. The APMRA brought radical changes and made it compulsory to sell the agricultural
produce only at designated regulated markets (mandis) through registered intermediaries
governed by the Agricultural Produce Market Committee (APMC). Moreover, many gains
brought by APMRA to improve competitiveness among the buyers got diffused over time and
market infrastructure didn’t keep pace with the volume of market arrivals (Bisen and Kumar,
2018). These regulated markets became self-serving and failed in resolving the issues like;
monopolization of trade by way of trading licenses to different types of middlemen,
cartelization of traders, late payment to the farmers, scrupulous deductions and non-transparent
system, etc. Price determination is one of the important functions of the market. The method
prescribed for the sale of agricultural produce in regulated markets is mainly by open outcry
auction, which is not only cumbersome but also has high scope of manipulation (Acharya and
Agarwal, 2011; Chengappa, 2012). Presently, there are 7,190 regulated markets in India. Most
of these markets are wholesale markets. Besides, the country has 22,505 rural periodical
markets, about 20% of which function under the ambit of the regulation (GOI, 2013). The
National Commission on Farmers (2007) has recommended that the facility of regulated
markets should be available to the farmer within a radius of 5 km.
The Committee of State Ministers constituted for bringing reforms in marketing highlighted
several basic challenges in present agricultural marketing systems (GoI, 2013). Those were:
i) Limited access to agricultural produce markets: Ideally, a regulated market should be
available to farmers within a radius of 5 km. ii) Licensing barriers: Compulsory requirement
of owning a shop/godown for licensing of commission agents/traders in the APMC mandi led
to the monopoly of these licensed traders. iii) Lack of market infrastructure in agricultural
markets: Covered and open auction platforms exist only in two-thirds of the regulated markets,
while cold storage units exist in less than one-tenth of the markets, etc. iv) High incidence of
market charges: APMCs collect market fees ranging between 0.50 % to 2.0 % of the sale value
of the produce. Besides, there are several other charges farmers are required to pay. v) Low
1 Marketing efficiency can be defined as marketing of agricultural produce with minimum cost ensuring
maximum share of the producer in the consumer’s rupee (Acharya & Agarwal, 2009).

3
price realization by the farmers, vi) Long supply chain with a large number of intermediaries,
vii) High marketing and transaction cost for smallholder farmers.
On the recommendation of the Expert Committee and Inter-Ministerial Task Force set
up by the Ministry of Agriculture, Govt. of India, a Model Act called Agricultural
Produce Marketing (Regulation & Development) Act, 2003 was enacted, though was
not adopted uniformly by all the states/UTs. Other marketing systems like contract
farming, direct marketing, online trading, cooperative retailing, etc. have to some
extent provided alternative options for farmers. The National Commission on Farmers
(NCF), constituted in 2004, had recommended a single market for farmers. The
Commission also recommended that agricultural marketing be placed on the
Concurrent List. Over the years, several reforms in these regulations and acts were
introduced to address the anomalies and problems faced by the farmers. Like, 14
major states took out wholesale trade in fruit, vegetables, and spices from the purview
of the Agriculture Produce Market Committee (APMC) framework in 2016 (Rao,
2017). The Cabinet Committee on Economic Affairs later approved the central sector
scheme for promotion on the national agriculture market on July 1st, 2015. This was a
big structural change in the marketing system for agricultural commodities in India.
The scheme aimed at integrating all existing APMCs markets for all agriculture
commodities at the national level (one nation and one market) and bring all under the
Uniform Platform. The initiative was taken based on the success of the online
marketing platform created in Karnataka known as ReMS2. The average increase in
nominal price realization for the commodities due to ReMS implementation in
Karnataka has been estimated to the tune of 38 per cent (Chand (2017), while the range
of profit improvement for the smallholder farmers is significantly high (36 to 159%)
(Levi et al., 2020).
Thus, structural changes in agricultural marketing system in India in the form of
Electronic National Agriculture Market (e-NAM) initiative may prove a game-
changer in the annals of agricultural marketing. The e-NAM network was officially
launched on 14 April 2016. As of 1st May 2020, a total of 785 APMC mandis across 17
states and 2 union territories (UTs) are integrated into the platform. The official
website of the system is http://www.enam.gov.in which updates the status of
implementation of the scheme. It intends to benefit directly to the farmers by better
price realization and reducing transaction cost, elimination of cartels and price
manipulation by local trading groups (Chand, 2016). However, so far no systematic
investigation has been conducted to examine the effectiveness of e-NAM on the
smallholders' participation and price realization by the farmers due to e-NAM.
2The Government of Karnataka brought amendment in the Karnataka Agricultural Produce Marketing (Regulation
and Development) Act, 1966 in line with the provisions of the Model Agricultural Produce Marketing Committee
(APMC) Act, 2003. These amendments not only allowed for a single unified licence to traders. To implement
these reforms, a Special Purpose Vehicle, Rashtriya e Market Services Private Limited (ReMS) was created. On
27 August 2010, a comprehensive auction system was developed by National Commodity and Derivatives
Exchange Limited (NCDEX) to bring unified electronic platform. ReMS started transacting agricultural
commodities through new platform in the year 2011.

4
Therefore, it was imperative to examine the evolution of the new marketing system in
addressing the long-pending problems of the smallholders in the marketing of their
agricultural produce. The specific objectives put forth for the study are given below:
1.1. Objectives of the Study
• To examine the preparedness of APMC mandi in adopting the e-NAM,
• To determine the extent and pattern of participation by the smallholders in
the new market system,
• To estimate the benefits/ losses arising out from the participation/ not
participation in the ongoing transformation in the APMC market, and
• To suggest plausible interventions to make the initiative inclusive
1.2. Limitations of the Study
The present study is based on field survey in two rounds: March 2017 and March-
April 2019. It may be possible that the current situation in these e-NAM mandis may
be completedly changed as compared to when the survey was conducted. Simialrly,
the observations and findings may also be having the usual limitations of survey-
based study. We could also not access the lot-wise transaction data in any of the e-
NAM mandis visited. Further, when the project started, all the information available
in public domain suggested that actual transactions were happening in e-NAM
enabled mandis. However, when we conducted the survey in several mandis in
different states, the sample farmers were not aware about the nuances of e-NAM.
Therefore, we could not get sufficient number of farmers who had sold their
commodities through e-NAM to compare with those of non-e-NAM to compare the
benefits realised by the farmers due to e-NAM. This also led to another issues of
assessing how these mandis were helpful for smallholder farmers in reducing the
market and price risks.

5
Chapter 2
Data and Methodology
This study is mainly based on both primary and secondary data. The study dwells
into the changes brought about by the e-NAM scheme in the selected markets. It
mainly focuses on the perception, challenges, and benefits of smallholders associated
with the participation in the new market regime. The study was initiated in April 2017
and was aimed to conclude in March 2019. However, with several ongoing initiatives
and inclusion of new APMC mandis into the fold of the e-NAM network, the study
was extended for one more year to examine different dimensions of e-NAM. Thus, the
project pertains to a period of 3 years, 2017-2020. Both primary data, as well as
secondary data, were used for the purpose, which are being discussed in detail.
2.1 Primary data collection
There are several stakeholders in the new regime of agricultural marking.
Accordingly, a survey was conducted of various stakeholders namely, farmers,
traders and commission agents. Additionally, mandi officials were also interviewed
for gaining insight on the implementation status of APMCs.
Fig. 2.1: APMCs visited during first round of survey
Fig. 2.2: APMCs visited during second round of survey
6
The survey was undertaken in two rounds. First-round was conducted in the states of
Madhya Pradesh (MP) and Telangana (TS) during April-May 2017. These were
considered as frontrunner states where e-NAM was implemented during the first
phase in 2016. As it was only one year of implementation in the APMCs during the
first round, not many changes were observed during the survey. Therefore, the second
round of the survey was planned during January-April 2019 in selected APMC
mandis in four states viz. Madhya Pradesh (MP), Maharashtra (MH), Rajasthan (RJ)
and Telangana (TS). During the second round, Maharashtra state was added, as the
state was ranked number one in terms of agricultural marketing and farmers’ friendly
reform (Annexure I). Besides, Rajasthan was also added in the second round, as news
reports were indicating better implementation of e-NAM in Rajasthan state.
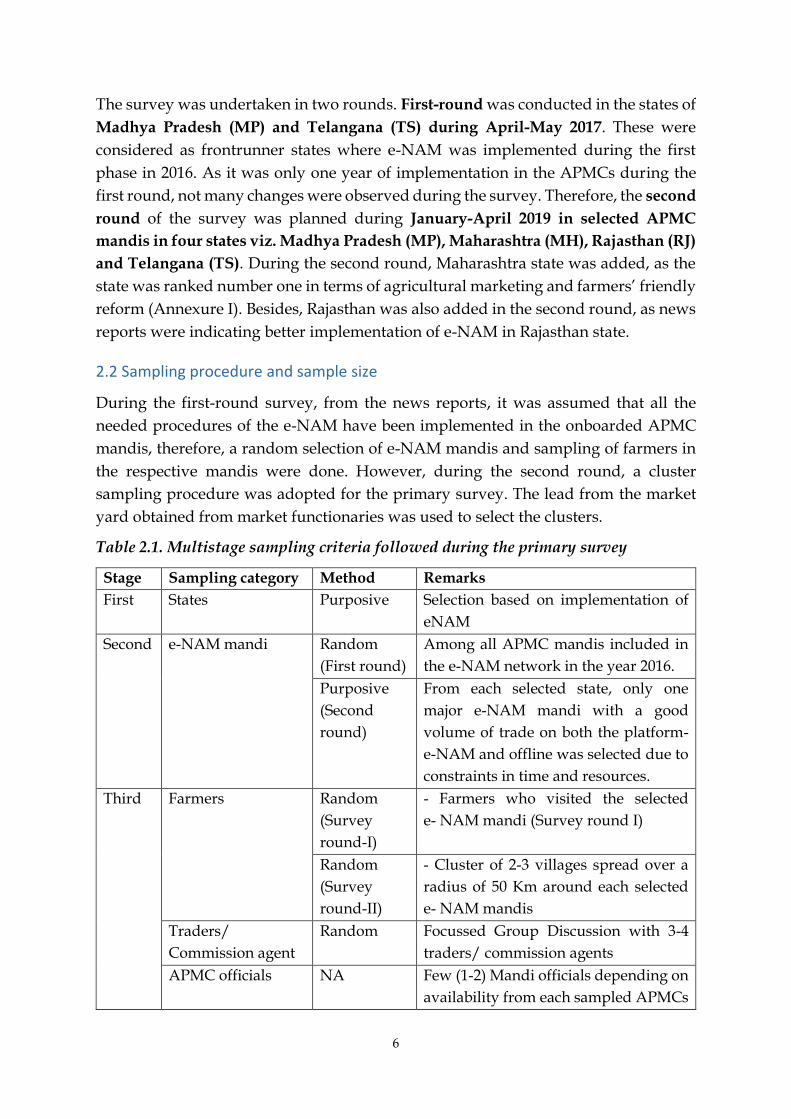
2.2 Sampling procedure and sample size
During the first-round survey, from the news reports, it was assumed that all the
needed procedures of the e-NAM have been implemented in the onboarded APMC
mandis, therefore, a random selection of e-NAM mandis and sampling of farmers in
the respective mandis were done. However, during the second round, a cluster
sampling procedure was adopted for the primary survey. The lead from the market
yard obtained from market functionaries was used to select the clusters.
Table 2.1. Multistage sampling criteria followed during the primary survey
Stage Sampling category Method Remarks
First States Purposive Selection based on implementation of
eNAM
Second e-NAM mandi Random
(First round)
Among all APMC mandis included in
the e-NAM network in the year 2016.
Purposive
(Second
round)
From each selected state, only one
major e-NAM mandi with a good
volume of trade on both the platform-
e-NAM and offline was selected due to
constraints in time and resources.
Third Farmers Random
(Survey
round-I)
- Farmers who visited the selected
e- NAM mandi (Survey round I)
Random
(Survey
round-II)
- Cluster of 2-3 villages spread over a
radius of 50 Km around each selected
e- NAM mandis
Traders/
Commission agent
Random Focussed Group Discussion with 3-4
traders/ commission agents
APMC officials NA Few (1-2) Mandi officials depending on
availability from each sampled APMCs

7
Primary data collection: The survey of the farmers was accomplished using a pre-
tested semi-structured survey schedule developed for the purpose, while FGD (Focus
Group Discussion) was conducted with traders/commission agents. The information
from mandi officials were gathered by informal conversation.
Table 2.2. Sample size of different stakeholders during both round of surveys
State APMC Mandis First Round Second Round
Farmers Trader/CA# Farmers Trader/CA
Madhya
Pradesh
Bhopal
Indore
Sehore
Dewas
96 22
Jabalpur* 121 4
Maharashtra Parbhani* 110 3
Rajasthan Kota* 118 5
Telangana Malakpet
Karimnagar
Thirumulagiri
Nizamabad
Warangal
Suryapet
Badepally
94 60
Rangareddy* 97 4
Total 190 82 446 16 #Commission Agents
*During the second round of the survey, the district was selected in the respective state and major APMC mandi in that district was selected for the study.
As Table 2.2 indicates, during the first round of the survey, a large number of e-NAM
mandis were selected for the study. We deployed PGDMA students of the Academy
for the conduct of the survey in these mandis, and the study became part of their final
project. The survey was conducted during March-April months of 2017. However, the
experiences and observation from the first round of the survey gave the impression
that the implementation of e-NAM in all these selected mandis is still at a nascent
stage. Therefore, it was decided to revisit in limited mandis in these states. We also
changed our approach to selecting farmers in the second round. Instead of surveying
the farmers in mandis, we selected one district with major e-NAM mandi in 4 states-
Madhya Pradesh, Maharashtra, Rajasthan, and Telangana. In each district, a cluster of
villages was selected around the e-NAM mandi. The farmers in these villages were
selected randomly to know about their awareness level, perception, and participation
in the e-NAM.

8
Secondary data collection: Apart from primary survey, extensive secondary data was
collected mainly from the following two websites:
https://agmarknet.gov.in/
https://www.enam.gov.in/
These websites were used to harvest details like daily arrivals, peak prices, and other
trading details of commodities traded in the APMCs selected for the primary survey.
Initially, unit-level transaction data was collected from some of the e-NAM mandis in
2017 through mandi officials. However, that data was quite inconsistent, which may
be due to the initial implementation of e-NAM. Thereafter, transaction data from the
e-NAM portal and Agmarknet were collected during April 2020 after harvest of rabi
season. Although, March-April 2020 is a special situation due to country-level
lockdown announcement by the Government of India to contain the spread of
Coronavirus (Covid-19). However, the central as well as the state government has
given relaxation to agriculture-related activities including crop harvesting and
marketing (GoI, 2020).
The Agmarknet provides electronic connectivity to more than 3200 wholesale markets
(APMC mandis) of the country. More than 2700 markets report market data related to
about 350 commodities and 2000 varieties at the Agmarknet portal regularly. The
scheme is being implemented by the Directorate of Marketing & Inspection (DMI),
Government of India in association with the State Agricultural Marketing
Boards/Directorates and APMCs. For the study, market arrival and traded price of
different agricultural commodities in mandis of selected states have been collected for
the April month of the year 2020 to compare with that of the e-NAM portal.
The live trade data of different agricultural commodities in the selected e-NAM
mandis in the states of Maharashtra, Punjab, Rajasthan, and Uttar Pradesh was also
collected from e-NAM portal for April month 2020. During this period, no e-NAM
mandis were trading live in Telangana state, while very few commodities in few
mandis of Madhya Pradesh were showing live trading. Therefore, live trading data
couldn’t be collected from these two states, which were our original states of interest
in the study. For the same period, arrival and price data for different commodities in
these markets were also collected from agmarknet.gov.in which reports total
commodities traded in the respective mandis.
2.3 Data Analysis
The data collected from both the primary survey and secondary sources were
analyzed using descriptive statistics viz. percentage, mean, range and standard
deviation.

9
Box and whisker charts have been used to present the
comparison between eNAM and Non-eNAM model
prices. The chart shows the variability of a data set
using minimum value, maximum value, and quartiles
of the data set. The following are presented in the
chart:
a) Interquartile range- The middlebox represents the middle 50% data
b) 3rd quartile- 75% data falls below the 3rd quartile
c) 1st quartile- 25% data falls below the 1st quartile.
d) Outlier- Outliers are plotted as individual points. These differ significantly from other data
e) Whisker- These represent variability outside the 1st and 3rd quartile
An independent sample t-test has been used to test the difference in mean value of
average daily modal price (ADMP) under eNAM and non-eNAM for major
commodities. The test compares the means between two unrelated groups on the
same continuous, dependent variable. It follows the following six assumptions:
a) The dependent variable should be measured on a continuous scale.
b) The independent variable should consist of two categorical, independent groups.
c) There is no relationship between the observations in each group or between the
groups themselves.
d) There should be no significant outliers.
e) The dependent variable should be approximately normally distributed.
f) There needs to be a homogeneity of variances.
Levene's Test for Equality of Variances is also measured as a part of the t-test. The test
assesses the equality of variances for a variable calculated for two or more groups.
Maximum
Minimum
3rd
quartile
1st quartile
Median
Mean
Outlier
Whisker
Whisker


10
Chapter 3
e-NAM Implementation in India
Agriculture and agriculture marketing are state subjects, thus is administered by the
respective states as per their agri-marketing regulations through Agricultural Produce
Marketing Committee (APMC). However, this regulation hinders the free flow of agri-
commodities from one market area to another even within the state. Subsequently,
multiple handling of agri-produce and multiple levels of mandi charges ends up
escalating the prices for the consumers without commensurating benefits to the
farmers. Over the years, several market reforms were introduced, though mostly led
to cosmetic change only. In 2003, the Government of India formulated the Model
Agricultural Produce Marketing Committee (Model APMC) Act and advised the
states to implement it to remove the obstacles faced by the farmers in the agricultural
market to sell their farm produce. Several innovative initiatives were suggested under
this, like allowing private markets, promotion of contract farming, etc. However, the
acceptance and adoption of the Model Act remained patchy and uneven across the
states. Therefore, in the budget of 2014, the Government of India announced the need
to create a National Agriculture Market and approved a Central Sector Scheme for
“Promotion of National Agriculture Market” on 1st July 2015 with a budget allocation
of ₹200 crores (PIB, 2015) The scheme envisaged the deployment of a common e-
market platform in 585 selected regulated wholesale agriculture markets by March
2018. The common e-market portal was called e-NAM.
Among various factors, traditional agricultural markets in developing countries has
been one of the major factors affecting farmers’ income. Integrating geographically
distant markets within a common platform is expected to increase market
competition, enable transparency of the price discovery process, and ultimately,
improve farmers’ profitability (Levi et al, 2020). The e-NAM intended to promote
uniformity, streamlining of procedures across the integrated markets, removes
information asymmetry between buyers and sellers and promotes real-time price
discovery, promotes transparency in the auction process, and access to a nationwide
market for the farmer. The Ministry of Agriculture & Farmers' Welfare, Govt. of India
has appointed Small Farmers' Agribusiness Consortium (SFAC) as the lead
implementing agency which maintains the eNAM platform with the help of M/s.
Nagarjuna Fertilizers and Chemicals Ltd. (NFCL), as Strategic Partner.
3.1 Onboarding of APMC mandis on e-NAM platform
There are about 7200 APMC mandis in India. Bringing all to the e-NAM platform in a
single stroke is a humungous task. Therefore, the Government of India (GoI)
incentivized the states to onboard select mandis according to their preferences. Three
conditions were given to the state for inclusion of mandis into e-NAM, on acceptance

11
of which the GoI made provision of grant of ₹30 lakhs for each mandi for
modernization facilitating e-NAM implementation. Those were:
(i) State government should ensure a single trading license to be valid across the
state,
(ii) Single point levy of market fee in the state, and
(iii) Provision for electronic auction as a mode for price discovery.
Fig. 3.1: State-wise number of APMC mandis integrated to e-NAM platform and
different stakeholders registered
Accordingly, e-NAM was launched on 14th April 2016 initially connecting 21 mandis
in 8 states (Gujarat, Telangana, Rajasthan, Madhya Pradesh, Uttar Pradesh, Haryana,
Jharkhand and Himachal Pradesh) for 25 commodities including wheat, maize,
pulses, oilseeds, potatoes, onions, and spices. Later, 2 mandis of Haryana- Shahabad
and Ambala were integrated from June 1st, 2016. As of May 1st, 2020, a total of 785
APMC mandis across 17 states and 2 union territories (UTs) are integrated into the
platform (Fig 3.1). It may be noted that in Karnataka state, there is a separate Unified
Market Platform called ReMS that has been in operation since the year 2014. Recently,
two mandis from ReMS have also been integrated with the e-NAM platform, thus
opening a new vista of inter-operability between two different platforms. Currently,
about 1.7 crore farmers and 942 farmer producer organizations (FPOs) are registered
on the platform, which means that many farmers might have transacted through e-
NAM at least once in the last 4 years. Entire transaction proceeds are facilitated by
about 1.3 lakhs traders and about 71 thousand commission agents registered on e-
NAM across these mandis. As of 30 April 2020, total trade volume of 3.41 crore metric
tonnes & 37 lakh numbers (Bamboo & Coconut) collectively worth approximately ₹
1.0 lakh crore have been recorded on eNAM platform (PIB, 2020).
Stakeholders on board (as on 30.04.2020)
States/UTs 21 (18+3)
Traders 1,28,478
Commission Agents (CAs)
70,969
FPOs 1,005
Farmers 1,66,18,683
Total 1,68,19,135

12
Table 3.1: State-wise number of registered traders and unified licenses issued
(as on 3rd May 2020)
S. No.
Name of State/ UT
*Mandis registered on eNAM
Registered stakeholders on e-NAM
Traders CAs FPOs Farmers
1. Andhra Pradesh
33 3,066 2,253 101 14,33,597
2. Chandigarh 1 63 59 0 7,106
3. Chhattisgarh 14 3,039 227 8 1,34,964
4. Gujarat 122 9,040 6,719 24 8,65,154
5. Haryana 81 10,091 21,398 84 27,17,486
6. Himachal Pradesh
19 1,945 1,101 41 1,20,623
7. Jharkhand 19 1,906 0 24 1,93,620
8. Karnataka 2** n.a. n.a. n.a. n.a.
9. Madhya Pradesh
80 20,260 7 23 30,11,446
10. Maharashtra 118 16,869 13,456 230 11,61,382
11. Odisha 41 801 0 26 55,516
12. Puducherry 2 133 0 0 12,386
13. Punjab 37 1,393 5,267 2 2,10,498
14. Rajasthan 144 11,762 5,187 108 13,06,241
15. Tamil Nadu 63 2,276 4 89 2,05,528
16. Telangana 57 5,379 4,177 54 18,15,588
17. Uttar Pradesh 125 33,451 8,444 91 32,97,728
18. Uttarakhand 16 4,631 2,578 14 53,490
19. West Bengal 18 2,373 92 86 16,330 Total 1000 1,28,478 70,969 1005 1,66,18,683
CAs= Commission Agents; n.a.= Not available *As on 15th May 2020; **ReMS in Karanataka. 2 ReMS mandis got integrated with e-NAM in May 2020.
From Table 3.1, it may be observed that so far 21 percent of registered traders on e-
NAM have unified license, who can trade across the mandis within their respective
states. Among all the 18 states/UTs, 4 states- Odisha, Rajasthan, Telangana, and
Uttarakhand have given unified licenses to all the registered traders. Besides, Andhra
Pradesh has also issued unified licenses to about 80 percent of the registered traders.
On the other hands, states like Gujarat, Haryana, Madhya Pradesh, Maharashtra, and
Uttar Pradesh have 50 to 100 e-NAM mandis with a very high number of registered
traders, but there is a dismal performance in terms of issuing unified licenses, which
would defeat the purpose better price discovery for the farmers’ commodities.
3.2 Innovations and initiatives in e-NAM
Since the launch of e-NAM in the year 2016, several initiatives were taken to improve
the conduct and functions of these e-NAM mandis. Efforts are being put to make the

13
e-NAM platform more inclusive, transparent, easy, and progressive. The ongoing
COVID-19 pandemic (since January 2020) has also pushed for some of the changes,
which may have far-reaching implications to take the business forward. For example,
the Government of India announced complete lockdown in the entire country since
25th March 2020 in two phases, which is expected to end on 3rd May 2020 selectively,
depending upon the severity of the positive cases in the given district of any state.
During this lockdown, complete transportation and supply chain came to standstill.
Labours working in different industries and urban areas started moving back to their
native place. These created a huge labour shortage in the agricultural mandis as well.
Although, the government has relaxed the movement of vehicles and operations for
essential services including handling of agricultural commodities. But, it is at a much
lower level than the normal period. Under such circumstances, the e-NAM has taken
some proactive measures like declaring WRDA registered warehouses as the market
place, so that the farmers need not to transport the commodities stored in these
warehouses to market. Instead, information of these commodities can be uploaded on
the e-NAM portal and the traders/buyers can lift the commodities from the
warehouse directly. The e-NAM has also initiated to bring transporters and logistic
service providers on board to facilitate the transaction. Another important step taken
was- the collection centres of FPOs were also declared as market place to reduce the
transportation cost for the farmers. These initiatives though are taken under special
circumstances (COVID pandemic), however, being proactive measures may be
continued after the pandemic as well. The chronological development of e-NAM in
brief is given in Table 3.2.
Table 3.2: Chronological development on e-NAM
Date Event
April 14, 2016 • Launch of e-NAM
• Commencement of e-NAM connecting 21 mandis in 8 states
June 2016 • 2 more mandis from Haryana integrated to e-NAM
November 2016 • 250 mandis across 10 State and 64 commodities has been integrated.
March 2017 • 417 APMC mandis in 13 states were integrated
March 2018 • 585 mandis across 18 states were integrated.
January 2019 • Govt of Rajasthan notifies the conversion of all existing traders licenses of e-NAM Mandis to unified license with effect from Jan 20, 2019.
• e-NAM reported first inter-state trade through e-NAM. A farmer from Haldwani in Uttarakhand sold his tomato crop to a trader in Bareilly in Uttar Pradesh.
• Similar, inter-State transactions between e-NAM mandis in Uttarakhand and Uttar Pradesh in potatoes, brinjal and cauliflower have also commenced.

14
February 2019 • Government plans to link 22,000 mandis (rural markets) including all 7,500 APMCs mandis with the e-NAM platform by 2022.
March 2019 • The shopping cart is introduced in e-NAM. Traders can create a temporary list of lots from within/different mandis by adding them to cart, so that they can bid in bulk.
• Discount in mandi fee to traders was introduced for making e-payment to the farmers.
• Bunching of selected invoices for a single payment was introduced. It is applicable for inter-mandi and inter-state invoices also.
• Unified trading license system for inter-state introduced.
June 2019 • A new version of e-NAM portal e-NAM 2.0 was launched, which included a mobile app, WDRA integration, multi-lingual facility, inclusion of shopping cart, merging invoices, traders’ incentives on trading through e_NAM, interstate trade, logistics portal, FPO module
July 2019 • 150 commodities were included on e-NAM
August 2019 • The government of Andhra Pradesh state and Telangana state declare WDRA registered CWC warehouses in the state as a market. Farmers can sell their products through e-NAM directly from the warehouse.
April 2020 • Covid-19 makes way for the new normal. Direct marketing from farmers/group of farmers/ FPOs, etc. allowed by bulk buyers/ processors/big retailers, etc.
• Official launch of Warehouse ( e-NWR ) based trading on eNAM from WDRA approved warehouses.
• FPOs can upload their produce for their collection centres for bidding through e-NAM without bringing to the mandis.
May 2020 • Integration of 200 more mandis across 7 states with e-NAM on 1st May 2010, taking the total tally to 785 e-NAM enabled mandis.
• 117more mandis integrated with the e-NAM platform on 15th May 2020➔ 962 e-NAM mandis.
• Integration of e-NAM with the Unified Market Platform (UMP) of Karnataka’s Rashtriya e-Market Services (ReMS).
• 38 new mandis integrated on the e-NAM platform on 15th May 2020,
totaling 1000 e-NAM mandis in India.
Source: https://enam.gov.in/web/events
3.3 Process flow on e-NAM platform
As shown in figure 3.2, all the e-NAM mandis have been mandated to have
computerized registration of farmers and lot entry ID generation at the gate entry level
itself. For each lot of the produce, the farmer brings to the mandi, a unique ID is
generated. The unique ID contains a farmer name, produce, quantity, etc. With unique

15
ID, farmers go to the auction hall, where samples are collected for assaying. After
quality checks, information is entered into the e-NAM portal. Buyers or traders who
want to buy the farmers’ produce are required to get a license by mandi officials.
Mandi officials will give username and password and the license that is issued to them
is applicable at the national level. Before bidding traders are required to keep some
security money in the bank. Traders can bid the required commodity by using mobile
apps or computer kiosks that are available in the market. After bidding, the
farmer/seller requires to give acceptance for the bid. The farmer has the option to
reject or accept the bid, if rejected then the second round of bidding takes place. After
acceptance, the weighment of the commodity will be done. All weighments should be
integrated with the main computer, so that records can be kept in the portal with a
separate unique ID. After completion of weighments sale receipt is generated and
given to the farmers by mandi officials. The money is transferred to the farmer
through RTGS on the same day/next day.
Fig. 3.2: Process flow of e-NAM mandi
3.4 Coverage of commodities under e-NAM
The e-NAM intends to facilitate the trading of agricultural commodities based on
quality. As the process flow in the preceding section exhibits, the commodity lots once
enter into the mandi, first and foremost activities are taking samples and conducting
quality assessment, based on which the lots can be categorized and placed on the e-
NAM portal for bidding purposes. Moreover, e-NAM has identified a total of 150
agricultural commodities to be traded through e-NAM. The complete list is given in
Annexure IV. The list includes 25 types of cereals and pulses, 13 types of oilseeds, 29
types of fruits, 40 types of vegetables, 14 types of spices, and the remaining 29 types
of commodities under the miscellaneous category. The exhaustive list includes almost
all types of agricultural commodities- from green leafy vegetables to tender coconut
and flowers like gladiolus and carnation.

16
A detailed list of quality parameters for all 150 commodities has been given on the
e- NAM portal, which can be accessed at
https://enam.gov.in/web/docs/Quality_Parameters_150_commodities.pdf
For all the commodities, essential and optional quality parameters have been given.
For instance, in case of cereals, essential parameters to be measured are moisture,
foreign matter, admixture/ other edible grains, immature & shriveled grains,
damaged/ discoloured grains, weevilled grains; while optional parameters are uric
acid content, aflatoxin, protein content, minimum test weight, etc. These parameters
vary from commodity to commodity. As per the e-NAM norms, samples shall be
drawn from each lot of the commodities. Sampling methods are also given in the
instruction. A snapshot of quality parameters for a specific range of major
commodities (cereals, pulses, fruits, vegetables, etc.) is given in Annexure V. The
quality assaying shall be done in the lab set up at the mandi, and as per the quality
Box 1. Sampling methods recommended for assaying
For all the commodities, different sampling methods have been recommended by e-NAM. Sampling starts as- 5 % or minimum one container shall be randomly selected for sampling. Therafter, further sampling should be done from the selected container. Foodgrains: (i) 250 gm shall be drawn from each selected container and shall be mixed
homogenously, called as primary sample, and (ii) 250 gm shall be drawn from primary
sample called as Laboratory sample.
Fruits:
(i) 5 (10 for mango) Nos shall be drawn from each selected container and shall be mixed
homogenously, called as primary sample; (ii) 5 (10 for mango) nos. shall be drawn from
primary sample called as Laboratory sample.
TOP Vegetables: (Tomato, Onion & Potato)
(i) 1 Kg shall be drawn from each selected container and shall be mixed homogenously
called as primary sample, (ii) 500 g shall be drawn from primary sample called as
Laboratory sample
Vegetables like bottle gourd, cucumber, bitter gourd, brinjal, cabbage, cauliflower, etc.
(i) 5 Nos (for bottle gourd, ridge gourd, radish, cucumber, cabbage, cauliflower, etc.) or
10 Nos (for bitter gourd) or 15 No. (for brinjal, carrot) shall be drawn from each selected
container and shall be mixed homogenously, called as primary sample (ii) All the primary
samples shall be checked for the assaying.
Leafy vegetables (Spinach, Coriander leaves), green chillies, etc.
(i) 500 g shall be drawn from each selected container and shall be mixed homogenously
called as primary sample. (ii) 100 g (500g for spinach) shall be drawn from primary
sample called as Laboratory sample
Source: https://enam.gov.in/web/docs/Quality_Parameters_150_commodities.pdf

17
assessment, the lots shall be categorized into 3 range- Range 1 for the best quality and
Range 3 for low quality.
It is also made mandatory that all the lots should have a minimum quality standard
which shall be assured by the farmer-sellers, like all the foodgrains should be clean,
wholesome, reasonably uniform in size, shape, and colour characteristic to the variety;
free from obnoxious smell and fungus infestation. Similarly for fruits and vegetables,
it should be intact, firm, clean, of reasonably uniform size & shape, color
(Red/Yellowish/Pinkish Green/Greenish Red) characteristics to the variety, and free
from bruises, soft patches, insect/mechanical injury, visible disorders, fungal
infestation. The assayer is also supposed to mention the name of the Variety of each
lot and upload the photo of the lot on the portal.
3.5 Inter-state trading license and inter-state trade on e-NAM
The-e-NAM is expanding the base of buyers through inviting traders from other
mandis within the state as well as from other states. For this, e-NAM in consultation
with the respective state government initiated the process of issuing inter-state trade
licenses to the traders. So far, the application of 32 traders from 4 states have been
approved for inter-state trade. Maximum number of traders from Telangana state has
got the license to trade in 6 other states (Table 3.3). This may be the beginning, as
several applications from many other states have been rejected. Though, the reasons
for rejection are not reported in the e-NAM portal.
Table 3.3: Inter-state licenses approved to the traders till 31st January 2020
From state Licensed approved for the states
Grand Total
Andhra Pradesh
Madhya Pradesh Maharashtra Punjab Rajasthan Telangana
Uttar Pradesh
Andhra Pradesh
1 1
Madhya Pradesh
3 1 3 7
Rajasthan 2 2 4
Telangana 6* 1 9 2 2 20
Grand Total 6 3 9 2 5 4 3 32
Source: https://enam.gov.in/NAMV2/home/interstateTrade/StateLicense.html Note: * License for 2 traders are still pending for approval
3.6 Live e-NAM mandi and Live trading on e-NAM portal
According to the Report of Committee on Doubling Farmers’ Income, Vol. IV (2017),
some key features that e-NAM must have to realize the intended potential are:
• Auction of the produce takes place simultaneously in the same electronic
platform in all the onboarded regulated markets (APMC markets) in the
country.

18
• Every regulated market is supported by infrastructure for quality assaying of
the produce. Harmonized standards & grades are accepted across markets, to
allow seamless trade across platforms.
• The collection of sale proceeds from the buyer and remit it to the bank
account of the seller is facilitated by the market.
• Restrictions in the transportation of the commodity are removed. A buyer,
irrespective of his location, can participate in any market of choice. The
required agri-logistics infrastructure for storage and transportation is put in
place.
• The institution of an agency to support inter-mandi trade, as also the dispute
resolution mechanism is in place.
Keeping the above points in view and as per industry standard procedures in other e-
trading platforms like NCDEX eMarkets Limited and ReMS (Rashtriya eMarket
Services Pvt. Ltd) in Karnataka, all the integrated markets must be live during trading
hours, irrespective of available farmers selling the produce. Without having real-time
information simultaneously in different markets, the price discovery can not be
possible in an efficient manner. This is one of the major challenges e-NAM is currently
facing. Fig 3.3 shows the actual number of e-NAM mandi available for live trading on
30th April 2020 at 12:14hrs. Two different locations on the e-NAM portal are showing
two different information about the number of live mandis.
Fig 3.3A exhibits 151 mandis out of 841 e- NAM mandis across 15 different states/UTs
doing live trading at the given time. However, when we visited the live trading
platform (Fig 3.3A), not only some of the states were different (as Uttar Pradesh and
Uttarakhand are not shown in Fig 3.3A), but also the number of live mandis in those
states were very different. As can be seen from the right sidebar in Fig 3.3A, only 56
mandis were seen live including those in Uttar Pradesh and Uttarakhand states. The
name of the live mandis observed in some of the major states is given in Annexure-
VII. Such mismatch in information and non-availability of all the mandis
simultaneously on the Live Trading platform may defeat the purpose of e- NAM of
providing uniform national trading platform. In such cases, inter-mandi bidding
may also be a difficult proposition for the traders who might be looking for specific
commodities and could have offered better prices to the seller-farmers. The existing
system again would encourage trading done by the local traders, which may continue
to form a cartel to manipulate the price.
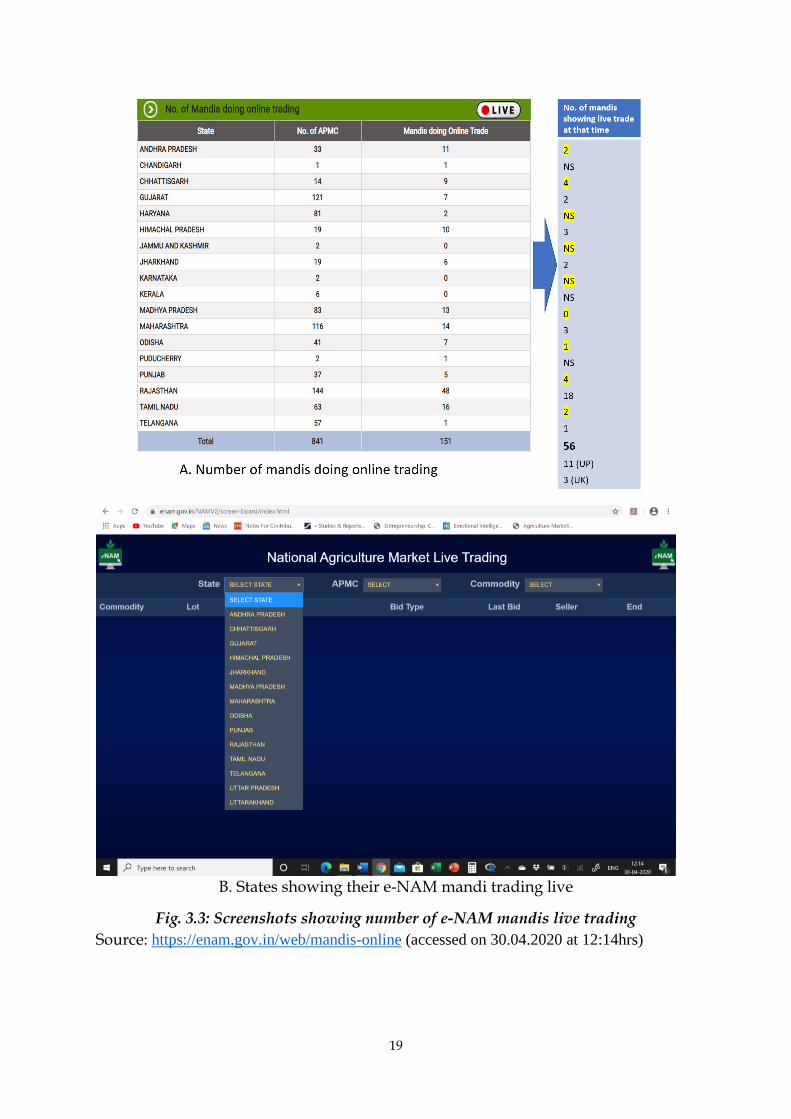
19
B. States showing their e-NAM mandi trading live
Fig. 3.3: Screenshots showing number of e-NAM mandis live trading
Source: https://enam.gov.in/web/mandis-online (accessed on 30.04.2020 at 12:14hrs)
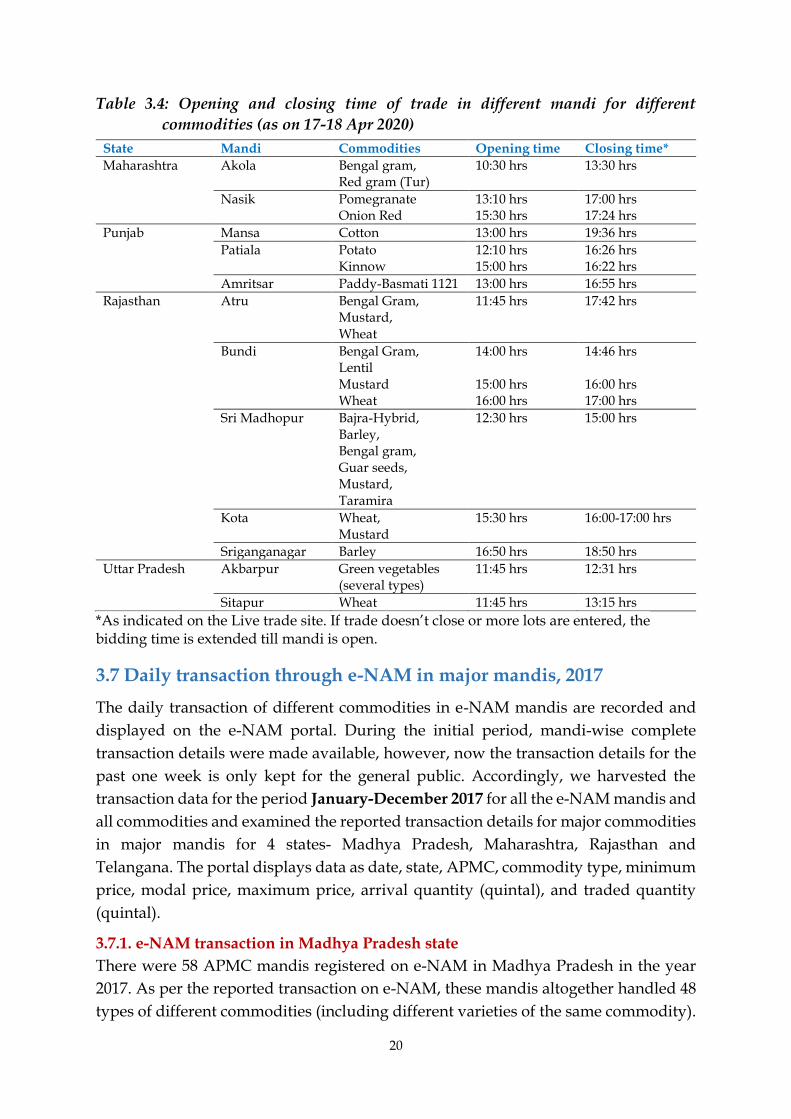
20
Table 3.4: Opening and closing time of trade in different mandi for different
commodities (as on 17-18 Apr 2020)
State Mandi Commodities Opening time Closing time*
Maharashtra Akola Bengal gram, Red gram (Tur)
10:30 hrs 13:30 hrs
Nasik Pomegranate 13:10 hrs 17:00 hrs Onion Red 15:30 hrs 17:24 hrs
Punjab Mansa Cotton 13:00 hrs 19:36 hrs
Patiala Potato 12:10 hrs 16:26 hrs Kinnow 15:00 hrs 16:22 hrs
Amritsar Paddy-Basmati 1121 13:00 hrs 16:55 hrs
Rajasthan Atru Bengal Gram, Mustard, Wheat
11:45 hrs 17:42 hrs
Bundi Bengal Gram, Lentil
14:00 hrs 14:46 hrs
Mustard 15:00 hrs 16:00 hrs Wheat 16:00 hrs 17:00 hrs
Sri Madhopur Bajra-Hybrid, Barley, Bengal gram, Guar seeds, Mustard, Taramira
12:30 hrs 15:00 hrs
Kota Wheat, Mustard
15:30 hrs 16:00-17:00 hrs
Sriganganagar Barley 16:50 hrs 18:50 hrs
Uttar Pradesh Akbarpur Green vegetables (several types)
11:45 hrs 12:31 hrs
Sitapur Wheat 11:45 hrs 13:15 hrs
*As indicated on the Live trade site. If trade doesn’t close or more lots are entered, the bidding time is extended till mandi is open.
3.7 Daily transaction through e-NAM in major mandis, 2017
The daily transaction of different commodities in e-NAM mandis are recorded and
displayed on the e-NAM portal. During the initial period, mandi-wise complete
transaction details were made available, however, now the transaction details for the
past one week is only kept for the general public. Accordingly, we harvested the
transaction data for the period January-December 2017 for all the e-NAM mandis and
all commodities and examined the reported transaction details for major commodities
in major mandis for 4 states- Madhya Pradesh, Maharashtra, Rajasthan and
Telangana. The portal displays data as date, state, APMC, commodity type, minimum
price, modal price, maximum price, arrival quantity (quintal), and traded quantity
(quintal).
3.7.1. e-NAM transaction in Madhya Pradesh state
There were 58 APMC mandis registered on e-NAM in Madhya Pradesh in the year
2017. As per the reported transaction on e-NAM, these mandis altogether handled 48
types of different commodities (including different varieties of the same commodity).
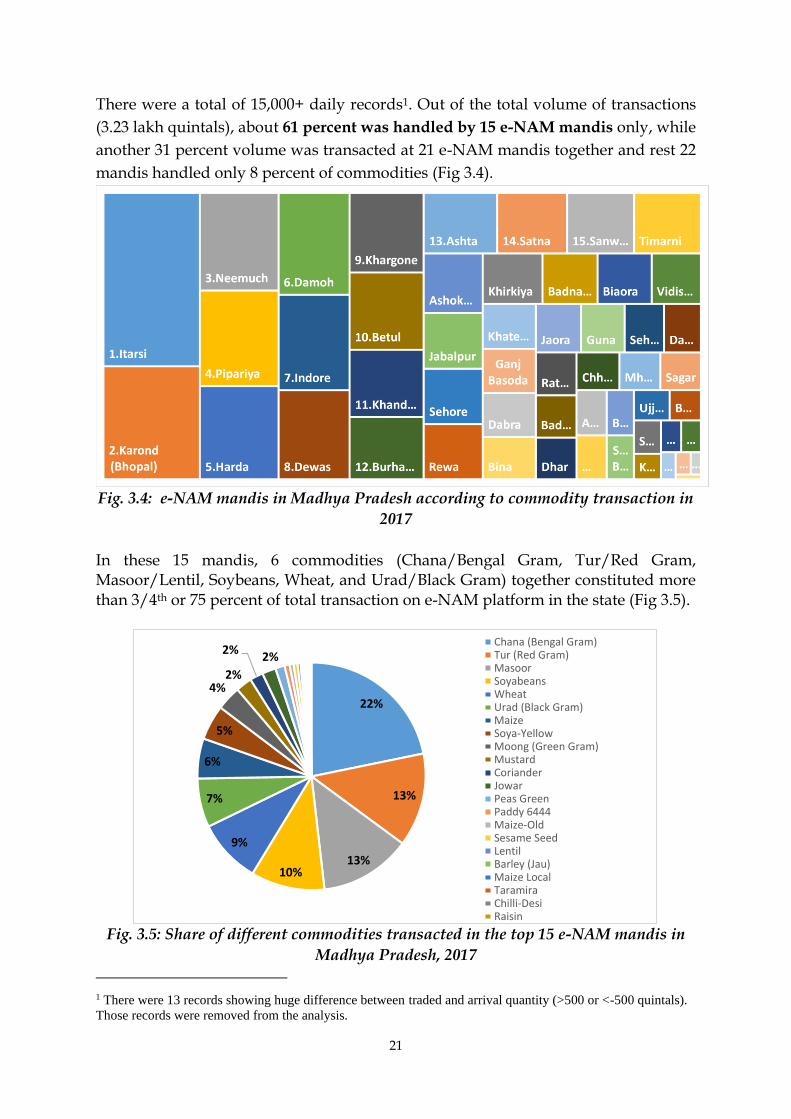
21
There were a total of 15,000+ daily records1. Out of the total volume of transactions
(3.23 lakh quintals), about 61 percent was handled by 15 e-NAM mandis only, while
another 31 percent volume was transacted at 21 e-NAM mandis together and rest 22
mandis handled only 8 percent of commodities (Fig 3.4).
Fig. 3.4: e-NAM mandis in Madhya Pradesh according to commodity transaction in
2017
In these 15 mandis, 6 commodities (Chana/Bengal Gram, Tur/Red Gram, Masoor/Lentil, Soybeans, Wheat, and Urad/Black Gram) together constituted more than 3/4th or 75 percent of total transaction on e-NAM platform in the state (Fig 3.5).
Fig. 3.5: Share of different commodities transacted in the top 15 e-NAM mandis in
Madhya Pradesh, 2017
1 There were 13 records showing huge difference between traded and arrival quantity (>500 or <-500 quintals).
Those records were removed from the analysis.
22%
13%
13%10%
9%
7%
6%
5%
4%2%
2%2%
Chana (Bengal Gram)Tur (Red Gram)MasoorSoyabeansWheatUrad (Black Gram)MaizeSoya-YellowMoong (Green Gram)MustardCorianderJowarPeas GreenPaddy 6444Maize-OldSesame SeedLentilBarley (Jau)Maize LocalTaramiraChilli-DesiRaisin

22
When the transaction pattern of these major traded commodities was analyzed, it was
observed that 5 e-NAM mandis handled about 34% of the total transaction of
Chana/Bengal Gram on the e-NAM platform in the state (Table 3.5). Each of these
mandis had a different quantity of monthly transactions. While 3 states transacted the
highest quantity in March month, APMC Ashoknagar received the highest arrival in
October month.
Table 3.5: Monthly transaction of Chana (Bengal Gram) in top 5 mandis, 2017
(quintals)
In these 5 markets, the daily price movement was quite different. There was huge variability in modal price every month in Dewas and Itarsi markets, while all the markets observed decline in modal price after October month onward. Although traded quantity during the last quarter was comparatively lower than the first quarter of the year (Fig 3.6). This is an interesting trend in the price as during harvest time (March-April), the modal price is higher than the sowing season (October-November). The minimum support price (MSP) for Chana/Bengal Gram was ₹4000/q and ₹4400/q
in 2016-17 and 2017-18, respectively.
APMC Jan Feb Mar Apr May Jun Jul Aug Sep Oct Nov Dec Grand TotalTrend
Khandwa 746 657 1028 595 564 643 184 356 517 730 6020
Itarsi 1443 955 953 185 281 388 205 332 545 429 5716
Dewas 132 674 743 560 691 192 536 402 335 475 407 445 5592
Burhanpur 1697 1030 848 700 502 240 178 83 52 52 5382
Ashoknagar 36 69 379 41 175 30 537 946 1189 1137 622 5161
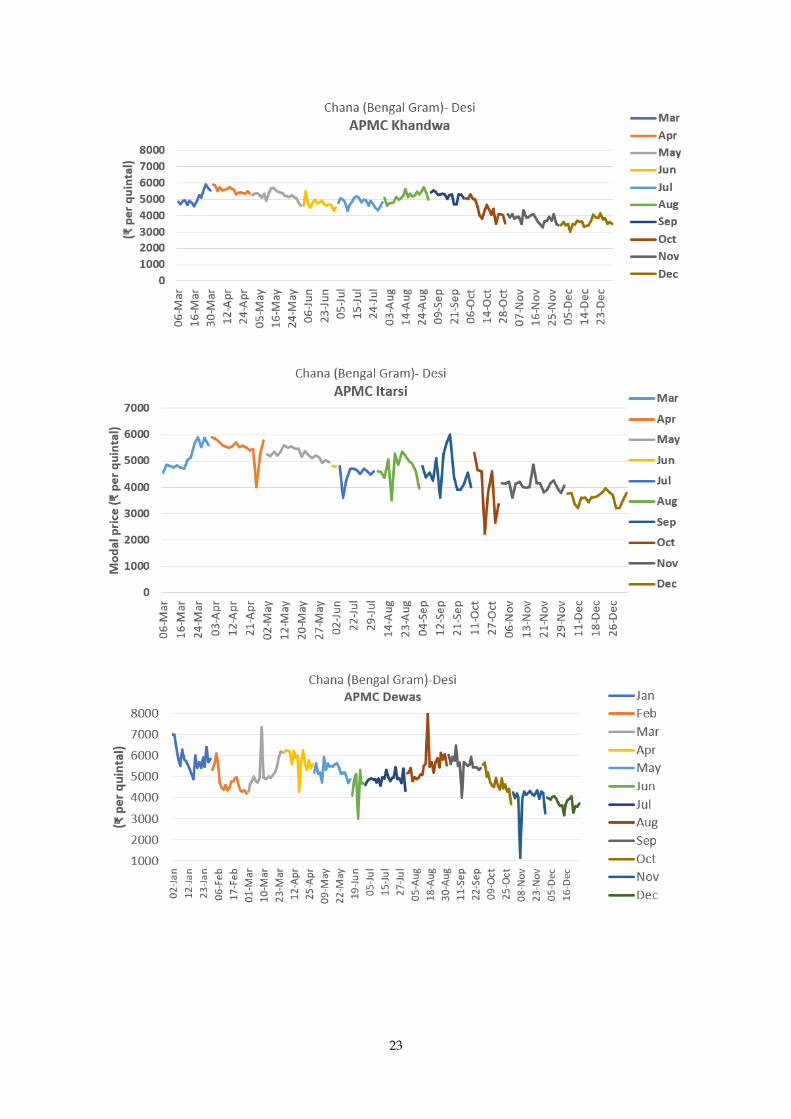
23

24
Fig. 3.6: Average daily modal price of Chana (Bengal Gram) in 5 major e-NAM
mandis in Madhya Pradesh, 2017
In the case of Tur/Arhar/Red Gram, the top 5 e-NAM mandis handled about 68% of
the total transaction of Tur on the e-NAM platform in the state (Table 3.6). The arrival
and trade of the commodity was maximum during March to May month (harvest
month) in these markets.
Table 3.6: Monthly transaction of Tur (Red Gram) in top 5 mandis in 2017 (quintals)
APMC Jan Feb Mar Apr May Jun Jul Aug Sep Oct Nov Dec Total Trend
Khargone 5490 2226 484 168 271 210 115 115 46 90 9215
Damoh 357 554 521 371 659 184 352 445 220 262 127 175 4227
Karond 306 442 142 165 253 93 83 253 255 162 102 157 2413
Indore 291 335 255 322 182 305 245 154 72 162 2323
Harda 121 131 530 624 154 130 84 39 27 18 1858

25
The daily modal price for trade of Tur/Red Gram in major 5 e-NAM mandis are given
in Fig 3.7. It may be observed that except for a few days in March and April, the modal
price remained in between ₹3000/q to ₹4000/q in all these markets. On a few trading
days, the modal price went as low as ₹2000/q in some of the mandis. While the MSP
for Tur/Arhar were ₹5050/q and ₹5450/q in 2016-17 and 2017-18, respectively.

26
Fig. 3.7: Average daily modal price of Tur (Red Gram) in 5 major e-NAM mandis in
Madhya Pradesh, 2017
Masoor/Lentil is the third most important traded commodity on e-NAM in Madhya
Pradesh state. In the case of Lentil, the top 5 e-NAM mandis handled about 54% of the
total transaction of Lentil on the e-NAM platform in the state (Table 3.7). These
markets had different period, when the arrival of the commodity was maximum in
2017. The largest transaction had been reported in APMC Pipariya, where a huge
quantity was traded during May and July months. In other markets as well, a large
quantity was traded between May to August months.
Table 3.7: Monthly transaction of Masoor (Lentil) in top 5 mandis in 2017 (quintals)
APMC Jan Feb Mar Apr May Jun Jul Aug Sep Oct Nov Dec Total Trend
Pipariya 310 306 842 506 2375 29 2530 655 378 258 592 603 9384
Biaora 308 471 570 486 680 663 661 696 603 5138
Ashta 336 135 809 790 682 485 720 608 4565
Neemuch 890 191 1921 142 389 254 210 175 242 110 4524
Sehora 149 203 79 434 646 512 561 429 589 3602

27
The daily modal price for trade of Masoor/Lentil in major 5 e-NAM mandis are given
in Fig 3.8. It may be observed that the price realization in these mandis were very
different. The largest trading mandi, Pipariya offered more than ₹4000/q during the
first quarter of the year, while in other mandis, the trading price remained around
₹3000 3500/q. While the MSP for Masoor/Lentil were ₹3950/q and ₹4250/q in 2016-
17 and 2017-18, respectively.
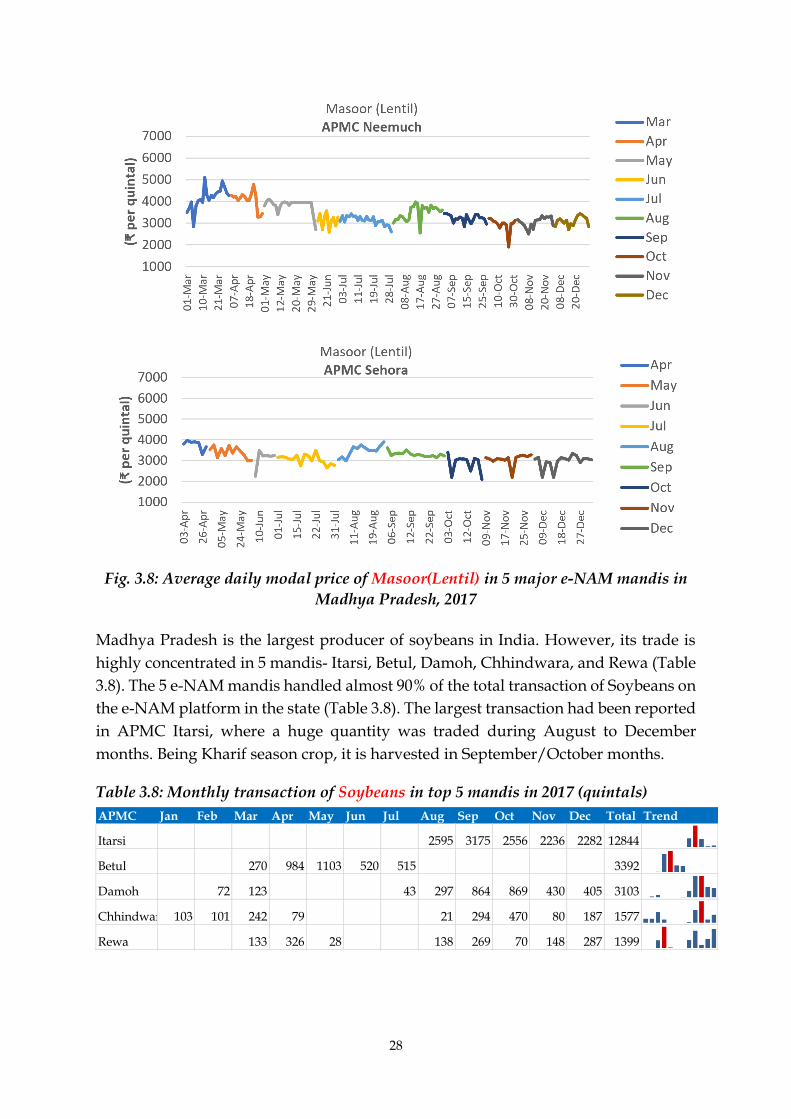
28
Fig. 3.8: Average daily modal price of Masoor(Lentil) in 5 major e-NAM mandis in
Madhya Pradesh, 2017
Madhya Pradesh is the largest producer of soybeans in India. However, its trade is
highly concentrated in 5 mandis- Itarsi, Betul, Damoh, Chhindwara, and Rewa (Table
3.8). The 5 e-NAM mandis handled almost 90% of the total transaction of Soybeans on
the e-NAM platform in the state (Table 3.8). The largest transaction had been reported
in APMC Itarsi, where a huge quantity was traded during August to December
months. Being Kharif season crop, it is harvested in September/October months.
Table 3.8: Monthly transaction of Soybeans in top 5 mandis in 2017 (quintals)
APMC Jan Feb Mar Apr May Jun Jul Aug Sep Oct Nov Dec Total Trend
Itarsi 2595 3175 2556 2236 2282 12844
Betul 270 984 1103 520 515 3392
Damoh 72 123 43 297 864 869 430 405 3103
Chhindwara 103 101 242 79 21 294 470 80 187 1577
Rewa 133 326 28 138 269 70 148 287 1399

29
From Fig 3.9, it is evident that except in APMC Rewa, the modal trading price of
soybeans remained in the range of ₹2500-3000 per quintal. In the Rewa market, the selling
price went below ₹2500 per quintal. While the MSP for Soybeans (yellow) were ₹2775/q and
₹3050/q in 2016-17 and 2017-18, respectively.

30
Fig. 3.9: Average daily modal price of Soybeans in 5 major e-NAM mandis in
Madhya Pradesh, 2017
Madhya Pradesh is also one of the largest producers of wheat in India. However, its
trade is highly concentrated in 5 mandis- Itarsi, Karond, Sanwer, Betul, and Timarni
(Table 3.9). The 5 e-NAM mandis handled almost 97% of the total transaction of Wheat
on the e-NAM platform in the state. The largest transaction had been reported in
APMC Itarsi, where a huge quantity was traded during August to December months.
While in other mandis, the largest quantity was traded either in January or May/ June
months.
Table 3.9: Monthly transaction of Wheat in top 5 mandis in 2017 (quintals)
APMC Jan Feb Mar Apr May Jun Jul Aug Sep Oct Nov Dec Total Trend
Itarsi 1340 1626 1088 1695 2330 8079
Karond 2281 1819 79 4 4183
Sanwer 738 664 467 253 340 197 213 2872
Betul 228 893 440 667 579 2807
Timarni 1070 449 167 1686
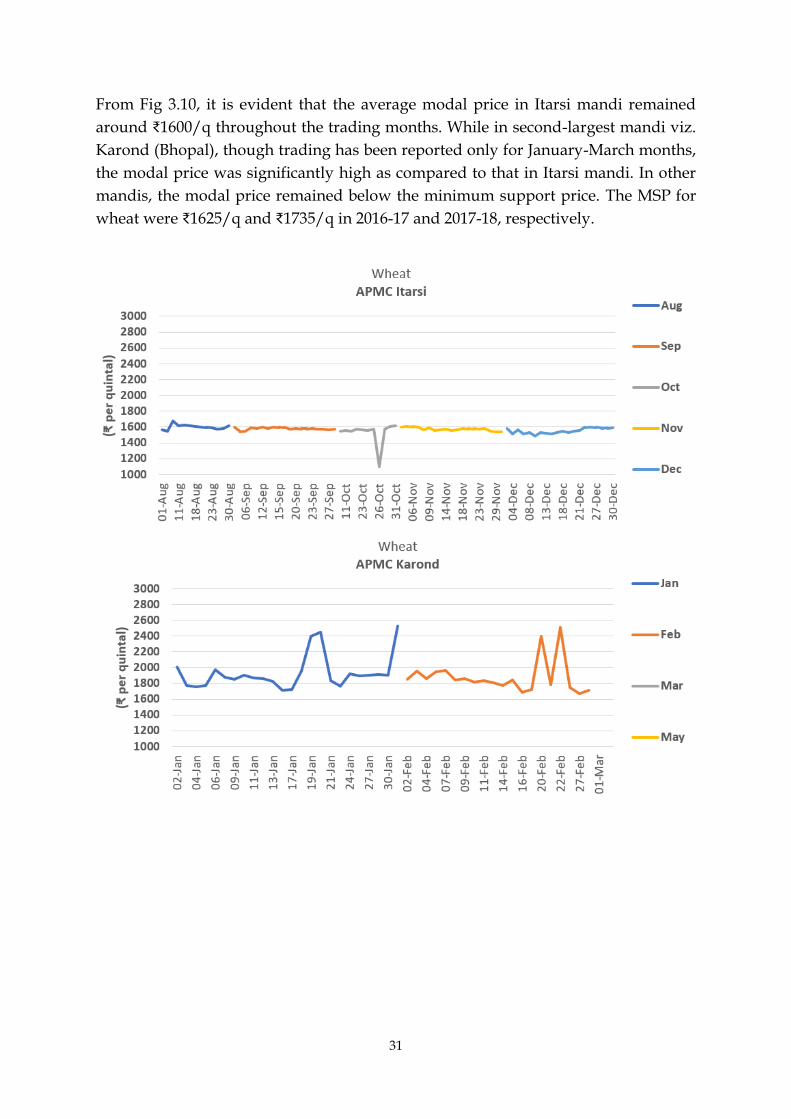
31
From Fig 3.10, it is evident that the average modal price in Itarsi mandi remained
around ₹1600/q throughout the trading months. While in second-largest mandi viz.
Karond (Bhopal), though trading has been reported only for January-March months,
the modal price was significantly high as compared to that in Itarsi mandi. In other
mandis, the modal price remained below the minimum support price. The MSP for
wheat were ₹1625/q and ₹1735/q in 2016-17 and 2017-18, respectively.

32
Fig. 3.10: Average daily modal price of Wheat in 5 major e-NAM mandis in Madhya
Pradesh, 2017
3.7.2. e-NAM transaction in Maharashtra state
There were 44 APMC mandis registered on e-NAM in Maharashtra in the year 2017.
The transaction data was available only for 10 months (March to December). As per
the reported transaction on e-NAM, these mandis altogether handled 38 types of
different commodities (including different varieties of the same commodity). There
were about 2,700 daily records. Out of the total volume of transactions reported (0.88
lakh quintals), about 84 percent was handled by 10 e-NAM mandis only, while
another 14 percent volume was transacted at 10 e-NAM mandis together and rest 24
mandis handled only 2 percent of commodities (Fig 3.11).
Among all the commodities recorded on the e-NAM portal as traded, Soyabean was
the most traded, followed by wheat and Tur/Red Gram. Only 6 commodities together
constituted almost 85% of the total transaction on e-NAM in Maharashtra state (Fig
3.12).

33
Fig. 3.11: e-NAM mandis in Maharashtra according to commodity transaction in
2017
Fig. 3.12: Share of different commodities transacted in the top 10 e-NAM mandis in
Maharashtra, 2017
Among top traded commodities, Soyabeans stand first in the state. Soybeans are
mainly traded in Akola and Latur markets (Table 3.10). The top 5 e-NAM mandis
traded more than 91% of total soybean trade on e-NAM in the state. While in Akola,
soybean was traded from September to December month, in Latur, almost 99% of
trade happened in December month. While in other 3 major markets, the trade
continued slowly over August-December months.
41%
12%8%
7%
6%
10%
4%
3%3%
2%
2%1% 1% Soyabeans
Chana (Bengal Gram)
Wheat
Tur (Red Gram)
Jowar
Maize
Moong (Green Gram)
Urad (Black Gram)
Tomato
Bajra
Cabbage
Cauliflower
Others
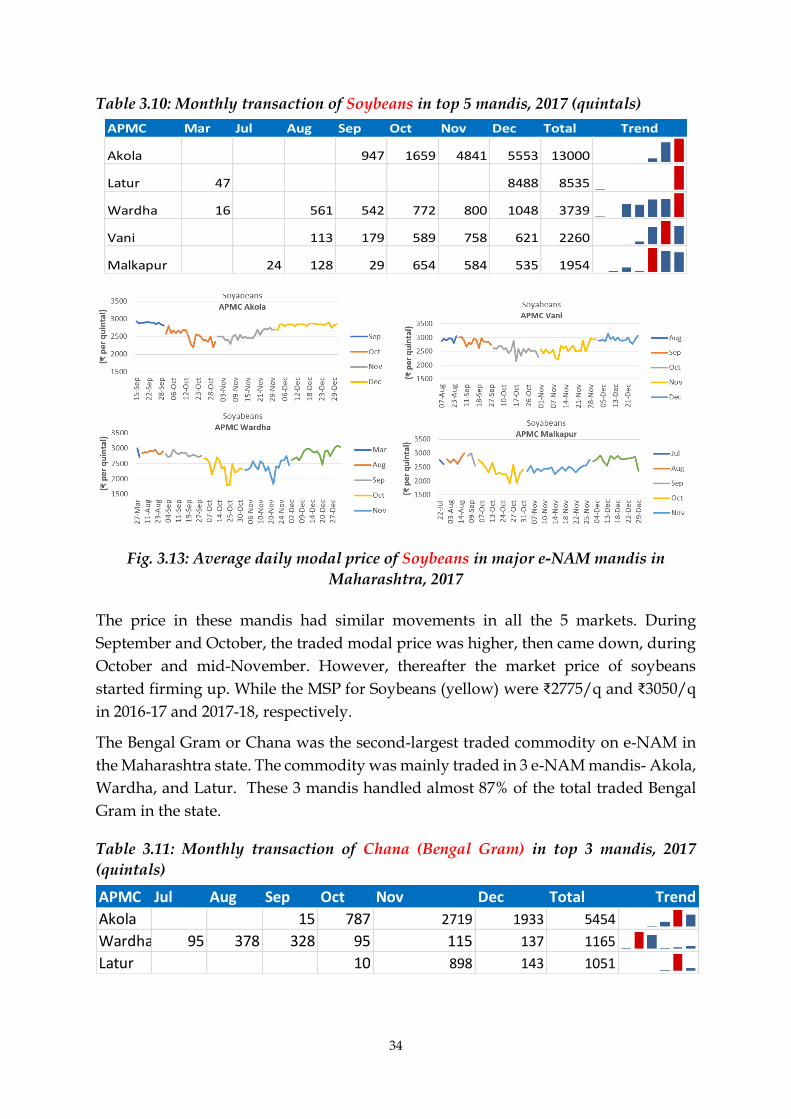
34
Table 3.10: Monthly transaction of Soybeans in top 5 mandis, 2017 (quintals)
Fig. 3.13: Average daily modal price of Soybeans in major e-NAM mandis in
Maharashtra, 2017
The price in these mandis had similar movements in all the 5 markets. During
September and October, the traded modal price was higher, then came down, during
October and mid-November. However, thereafter the market price of soybeans
started firming up. While the MSP for Soybeans (yellow) were ₹2775/q and ₹3050/q
in 2016-17 and 2017-18, respectively.
The Bengal Gram or Chana was the second-largest traded commodity on e-NAM in
the Maharashtra state. The commodity was mainly traded in 3 e-NAM mandis- Akola,
Wardha, and Latur. These 3 mandis handled almost 87% of the total traded Bengal
Gram in the state.
Table 3.11: Monthly transaction of Chana (Bengal Gram) in top 3 mandis, 2017
(quintals)
APMC Mar Jul Aug Sep Oct Nov Dec Total Trend
Akola 947 1659 4841 5553 13000
Latur 47 8488 8535
Wardha 16 561 542 772 800 1048 3739
Vani 113 179 589 758 621 2260
Malkapur 24 128 29 654 584 535 1954
APMC Jul Aug Sep Oct Nov Dec Total Trend
Akola 15 787 2719 1933 5454
Wardha 95 378 328 95 115 137 1165
Latur 10 898 143 1051

35
The price of Bengal Gram in these mandis was highly volatile. While in the major
market of Akola, the traded price for Bengal Gram remained subdued, below ₹4000/q.
While in the other 2 major mandis, prices were volatile. The MSP for Chana/Bengal
Gram were ₹4000/q and ₹4400/q in 2016-17 and 2017-18, respectively.
Fig. 3.14: Average daily modal price of Chana (Bengal Gram) in major e-NAM
mandis in Maharashtra, 2017

36
Wheat is also an important commodity reported to be traded on the e-NAM platform
in several e-NAM mandis in Maharashtra state in the year 2017. The 5 e-NAM mandis
given in Table 3.12 transacted more than 74% of total wheat transactions on e-NAM
in Maharashtra. Except in Achalpur mandi, maximum arrival happened during
August-September month.
Table 3.12: Monthly transaction of Wheat in top 5 mandis, 2017 (quintals)
From Fig 3.15, it is evident that the average modal price in all the 4 mandis remained
around ₹1500-1600/q throughout the trading months. The MSP for wheat were
₹1625/q and ₹1735/q in 2016-17 and 2017-18, respectively.
Although Maharashtra is one of the largest producers of Tur/Arhar/Red Gram in
India, only 2 e-NAM mandis- Akola and Wardha transacted about 82% of total Red
Gram transacted through e-NAM in the state (Table 3.13). Most of the transactions
have been reported during November-December months. The average daily modal
price of Tur/Arhar in both the mandis is presented in Fig 3.16.
APMC Mar Apr Jun Jul Aug Sep Oct Nov Dec Total Trend
Dound 8 159 442 467 408 361 307 2152
Nagpur 195 499 321 451 198 363 2027
Achalpur 1600 1600
Ahmednagar 58 125 79 311 275 338 277 1463
Wardha 8 196 318 247 123 181 191 1264

37
Fig. 3.15: Average daily modal price of Wheat in major e-NAM mandis in
Maharashtra, 2017
Table 3.13: Monthly transaction of Tur (Red Gram) in top 2 mandis, 2017 (quintals)
Fig. 3.16: Average daily modal price of Tur (Red Gram) in major e-NAM mandis in
Maharashtra, 2017
APMC Aug Sep Oct Nov Dec Total Trend
Akola 4 165 1827 1677 3673
Wardha 148 410 141 144 199 1042
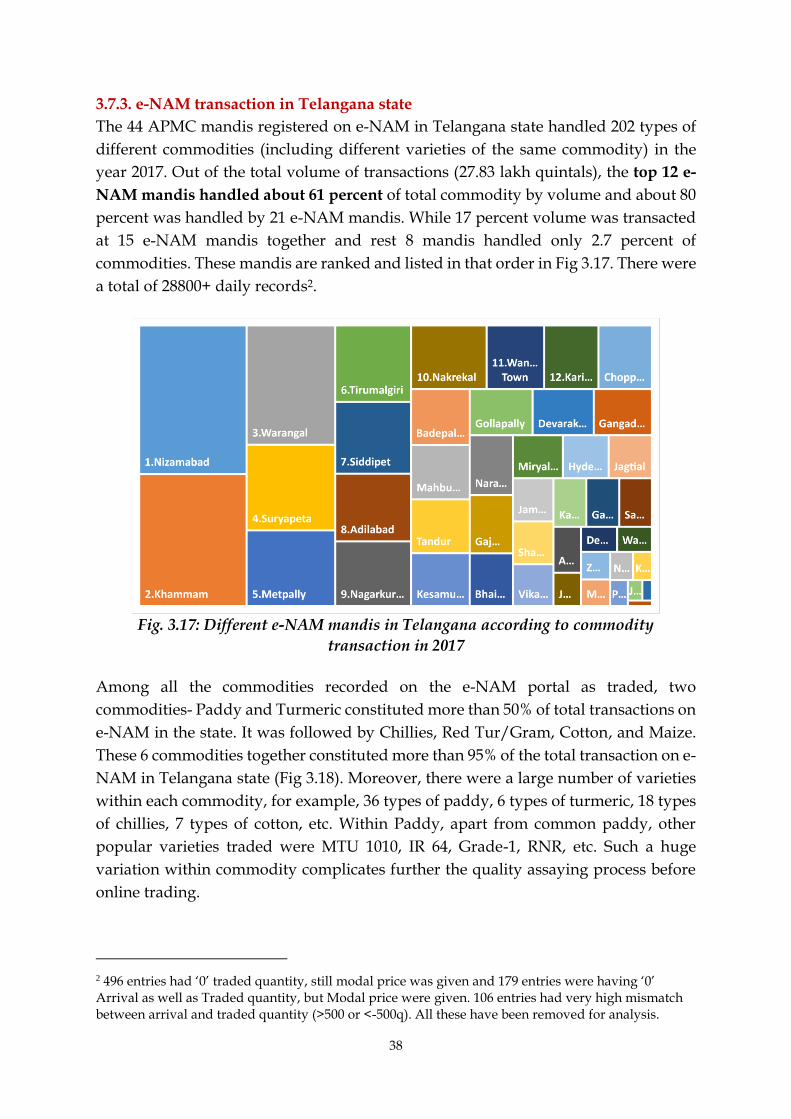
38
3.7.3. e-NAM transaction in Telangana state
The 44 APMC mandis registered on e-NAM in Telangana state handled 202 types of
different commodities (including different varieties of the same commodity) in the
year 2017. Out of the total volume of transactions (27.83 lakh quintals), the top 12 e-
NAM mandis handled about 61 percent of total commodity by volume and about 80
percent was handled by 21 e-NAM mandis. While 17 percent volume was transacted
at 15 e-NAM mandis together and rest 8 mandis handled only 2.7 percent of
commodities. These mandis are ranked and listed in that order in Fig 3.17. There were
a total of 28800+ daily records2.
Fig. 3.17: Different e-NAM mandis in Telangana according to commodity
transaction in 2017
Among all the commodities recorded on the e-NAM portal as traded, two
commodities- Paddy and Turmeric constituted more than 50% of total transactions on
e-NAM in the state. It was followed by Chillies, Red Tur/Gram, Cotton, and Maize.
These 6 commodities together constituted more than 95% of the total transaction on e-
NAM in Telangana state (Fig 3.18). Moreover, there were a large number of varieties
within each commodity, for example, 36 types of paddy, 6 types of turmeric, 18 types
of chillies, 7 types of cotton, etc. Within Paddy, apart from common paddy, other
popular varieties traded were MTU 1010, IR 64, Grade-1, RNR, etc. Such a huge
variation within commodity complicates further the quality assaying process before
online trading.
2 496 entries had ‘0’ traded quantity, still modal price was given and 179 entries were having ‘0’ Arrival as well as Traded quantity, but Modal price were given. 106 entries had very high mismatch between arrival and traded quantity (>500 or <-500q). All these have been removed for analysis.

39
Fig. 3.18: Share of different commodities transacted in the top 12 e-NAM mandis in
Telangana, 2017
Among top traded commodities, the top 5 e-NAM mandis traded about 45% of total
paddy trade on e-NAM in the state (Table 3.14). While in Suryapeta and Tirumalgiri
mandis, Paddy was traded throughout the year, in other 3 major markets, major trade
happened during the first quarter (January-March) of the year.
Table 3.14: Monthly transaction of Paddy in top 5 mandis, 2017 (quintals)
In two major e-NAM mandis, viz. Suryapeta and Tirumalgiri, there was huge
variability in the modal price of traded paddy. During August-September months, the
modal price was higher (around ₹1800/q), while during the rest of the months, it was
relatively less. The variation in price was also due to the varieties. For the other 3
markets, prices reported on the e-NAM portal were not in order, as can be seen in
Nakrekal mandi, the same modal price was entered for the whole month (Fig 3.19).
APMC Jan Feb Mar Apr May Jun Jul Aug Sep Oct Nov Dec Total Trend
Suryapeta 9010 12736 11826 8737 20436 5339 2984 3985 4657 8504 23970 18366 130550
Tirumalgiri 5059 1695 2866 29767 18490 1927 1271 725 3090 13022 18947 9120 105979
Nakrekal 7301 41095 138 4 10887 29048 4353 92826
Metpally 24323 16975 19551 2178 20961 83988
Siddipet 67994 293 918 1601 1499 72305

40
Fig. 3.19: Average daily modal price of Paddy in major e-NAM mandis in Telangana,
2017
Turmeric, the second important transacted commodity was mainly transacted at Nizamabad, Warangal, Metpally, and Vikarabad (Table 3.15). These 4 mandis together constituted more than 96% of total turmeric transacted on e-NAM in the state. Turmeric is traded in the form of bulb, chura, and finger (major). Maximum trade happens in February-Marc months.

41
Table 3.15: Monthly transaction of Turmeric in top 4 mandis, 2017 (quintals)
The price of turmeric was also very much volatile in Nizamabad and Warangal
mandis throughout the year. The average daily modal price for all types of turmeric
in these markets is given in Fig 3.20. The modal price was ranged between ₹3750 to
₹8000/q. During May-June month, the price slipped to almost half of that offered
during February month in these mandis. It may be noted that there is no MSP for
turmeric, which is being demanded by the farmers in the state.
Fig. 3.20: Average daily modal price of Turmeric in major e-NAM mandis in
Telangana, 2017
APMC Jan Feb Mar Apr May Jun Jul Aug Sep Oct Nov Dec Total Trend
Nizamabad 116 150508 60912 1989 798 3650 5067 5438 5029 3118 4833 6357 247815
Warangal 485 106 450 2130 2714 2809 2269 1215 489 12667
Metpally 1077 1766 1552 1784 1164 1 7344
Vikarabad 34 25 17 166 220 412 1251 583 576 401 937 301 4923

42
Chillies also have a similar story as of turmeric. Only 3 e-NAM mandis transacted
almost 100% of total dry chillies in the state. The transaction reported on the e-NAM
portal also shows that in Khammam mandi, which is the largest chilli trading mandi,
had almost 80% of total transactions in a single month (July), while in other two
markets, maximum trading happened during February-March months (Table 3.16).
Table 3.16: Monthly transaction of Dry Chillies in top 3 mandis, 2017 (quintals)
Chilli-farmers also observed huge price volatility. As shown in Fig 3.21, the average
modal price of chillies dropped from ₹9500/q in January month to almost ₹2000/q in
May month and almost hovered around the same level until September-October
months in all 3 markets. During the last quarter of the year, volatility in price also
increased.
Fig. 3.21: Average daily modal price of Dry Chillies in major e-NAM mandis in
Telangana, 2017
APMC Jan Feb Mar Apr May Jun Jul Aug Sep Oct Nov Dec Total Trend
Khammam 172200 9404 1573 694 307 184178
Warangal 2504 9427 21373 5041 8364 4517 2029 2391 3216 1964 2402 1089 64317
Hyderabad 3524 10538 7660 886 58 131 2727 3422 4047 1895 1707 1552 38147
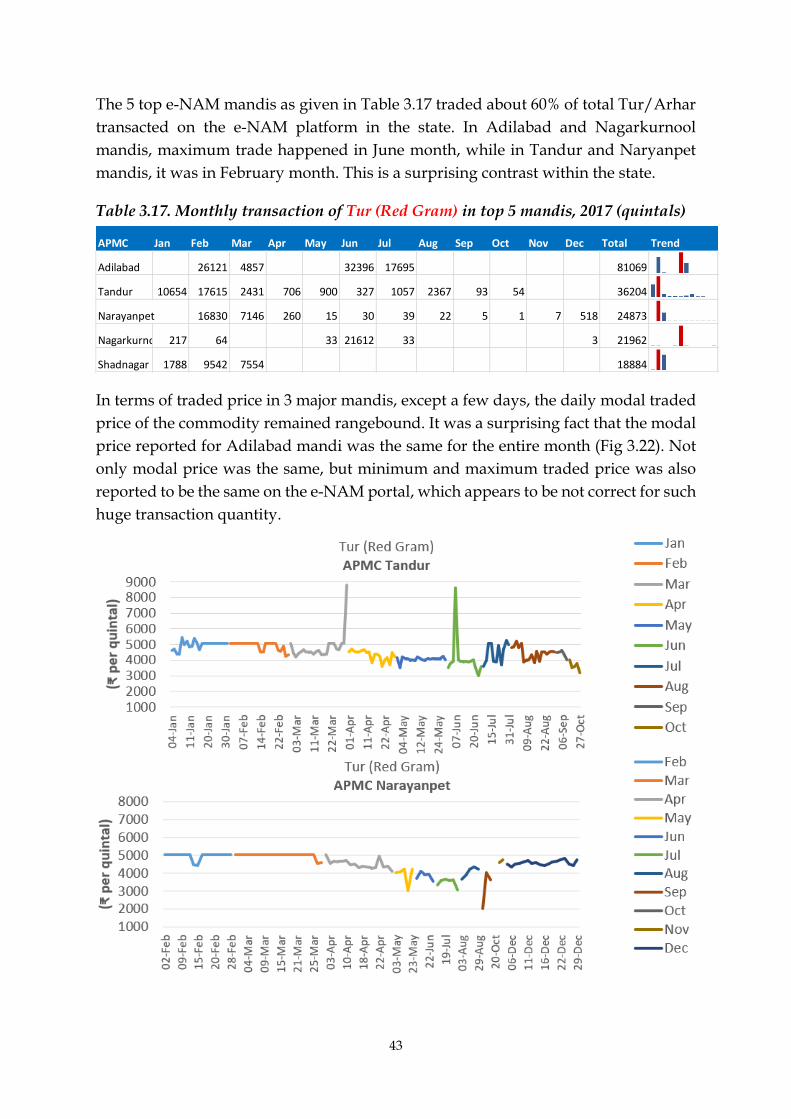
43
The 5 top e-NAM mandis as given in Table 3.17 traded about 60% of total Tur/Arhar
transacted on the e-NAM platform in the state. In Adilabad and Nagarkurnool
mandis, maximum trade happened in June month, while in Tandur and Naryanpet
mandis, it was in February month. This is a surprising contrast within the state.
Table 3.17. Monthly transaction of Tur (Red Gram) in top 5 mandis, 2017 (quintals)
In terms of traded price in 3 major mandis, except a few days, the daily modal traded
price of the commodity remained rangebound. It was a surprising fact that the modal
price reported for Adilabad mandi was the same for the entire month (Fig 3.22). Not
only modal price was the same, but minimum and maximum traded price was also
reported to be the same on the e-NAM portal, which appears to be not correct for such
huge transaction quantity.
APMC Jan Feb Mar Apr May Jun Jul Aug Sep Oct Nov Dec Total Trend
Adilabad 26121 4857 32396 17695 81069
Tandur 10654 17615 2431 706 900 327 1057 2367 93 54 36204
Narayanpet 16830 7146 260 15 30 39 22 5 1 7 518 24873
Nagarkurnool 217 64 33 21612 33 3 21962
Shadnagar 1788 9542 7554 18884

44
Fig. 3.22: Average daily modal price of Tur (Red Gram) in major e-NAM mandis in
Telangana, 2017
Cotton is another cash crop for the Telangna farmers, which are mainly reported to be
traded at 5 e-NAM mandis, as given in Table 3.18. These mandis together transacted
almost 90% of total cotton traded in e-NAM in the state. Further, Khammam and
Warangal are the main two e-NAM mandis for cotton trade, but both the mandis has
reported different month as maximum trade month. In terms of traded price, it
remained in the range of ₹4000-5000/q during the first eight months, thereafter there
was a sudden drop in the modal price (Fig 3.23)

45
Fig. 3.23: Average daily modal price of Cotton in major e-NAM mandis in
Telangana, 2017
Table 3.18: Monthly transaction of Cotton in top 5 mandis, 2017 (quintals)
Different types of maize grain are traded in the mandis of Telangana state. Those are
maize bilt, maize hybrid, maize local, maize-new, maize-old, etc. The top 5 e-NAM
mandis constituted roughly 50% of the total transaction on e-NAM in the state (Table
3.19). Surprisingly, the largest mandi viz. Metpally reported only two months-
November and December for maize trade, while in other mandis, maize was traded
around the year. The trade mainly peaked during October-December months. The
traded price in 3 major e-NAM mandis are given in Fig 3.24.
Table 3.19: Monthly transaction of Maize in top 5 mandis, 2017 (quintals)
APMC Jan Feb Mar Apr May Jun Jul Aug Sep Oct Nov Dec Total Trend
Khammam 2388 3080 2605 3299 2010 1419 12051 31710 11945 70507
Warangal 5320 8208 12995 3483 3766 5395 11384 6505 5276 3140 3131 1702 70305
Peddapalli 4 5 5 221 992 7607 39 6 13 8892
Kesamudram 637 803 652 531 1155 514 582 422 408 569 6273
Gajwel 910 591 950 190 5 613 1088 767 5114
APMC Jan Feb Mar Apr May Jun Jul Aug Sep Oct Nov Dec Total Trend
Metpally 7 1 31388 6886 38282
Warangal 1554 843 2111 1415 1418 669 455 188 637 4122 11457 2383 27252
Badepally 916 587 313 208 490 3634 8815 40 754 1513 236 3079 20585
Kesamudram 572 531 799 668 794 4605 1543 75 476 4606 4819 929 20417
Vikarabad 1183 2160 583 598 855 1379 2901 47 188 4194 5975 20063

46
Fig. 3.24: Average daily modal price of Maize in major e-NAM mandis in Telangana,
2017
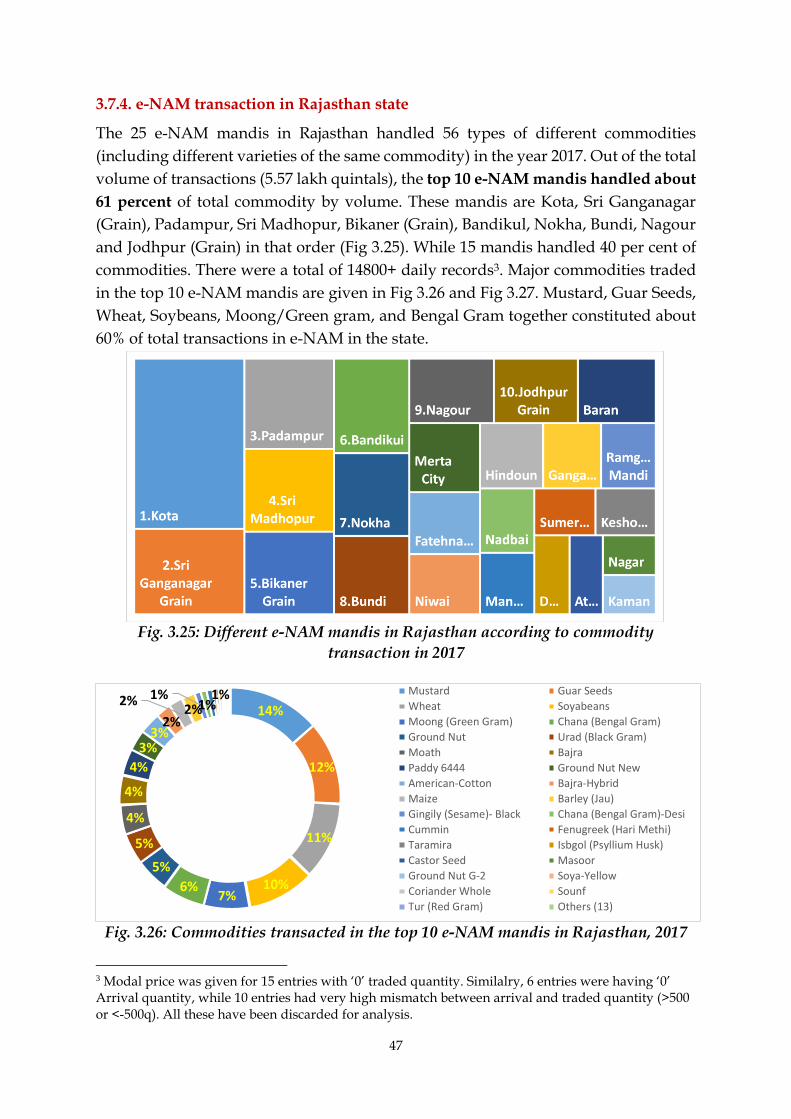
47
3.7.4. e-NAM transaction in Rajasthan state
The 25 e-NAM mandis in Rajasthan handled 56 types of different commodities
(including different varieties of the same commodity) in the year 2017. Out of the total
volume of transactions (5.57 lakh quintals), the top 10 e-NAM mandis handled about
61 percent of total commodity by volume. These mandis are Kota, Sri Ganganagar
(Grain), Padampur, Sri Madhopur, Bikaner (Grain), Bandikul, Nokha, Bundi, Nagour
and Jodhpur (Grain) in that order (Fig 3.25). While 15 mandis handled 40 per cent of
commodities. There were a total of 14800+ daily records3. Major commodities traded
in the top 10 e-NAM mandis are given in Fig 3.26 and Fig 3.27. Mustard, Guar Seeds,
Wheat, Soybeans, Moong/Green gram, and Bengal Gram together constituted about
60% of total transactions in e-NAM in the state.
Fig. 3.25: Different e-NAM mandis in Rajasthan according to commodity
transaction in 2017
Fig. 3.26: Commodities transacted in the top 10 e-NAM mandis in Rajasthan, 2017
3 Modal price was given for 15 entries with ‘0’ traded quantity. Similalry, 6 entries were having ‘0’ Arrival quantity, while 10 entries had very high mismatch between arrival and traded quantity (>500 or <-500q). All these have been discarded for analysis.
14%
12%
11%
10%7%
6%
5%
5%
4%
4%
4%
3%3%
2%
2%2%
1%1%
1% Mustard Guar Seeds
Wheat Soyabeans
Moong (Green Gram) Chana (Bengal Gram)
Ground Nut Urad (Black Gram)
Moath Bajra
Paddy 6444 Ground Nut New
American-Cotton Bajra-Hybrid
Maize Barley (Jau)
Gingily (Sesame)- Black Chana (Bengal Gram)-Desi
Cummin Fenugreek (Hari Methi)
Taramira Isbgol (Psyllium Husk)
Castor Seed Masoor
Ground Nut G-2 Soya-Yellow
Coriander Whole Sounf
Tur (Red Gram) Others (13)

48
Fig. 3.27: Major commodities transacted through e_NAM in major e-NAM mandis
Top 5 e-NAM mandis in Rajasthan traded 42% of total mustard transactions in the
state on the e-NAM platform. The maximum trade in each of these mandis happened
during different months of the year (Table 3.20). The average daily modal price in 3
main e-NAM mandis are presented in Fig 3.28.

49
Table 3.20: Monthly transaction of Mustard in top 5 mandis, 2017 (quintals)
Fig. 3.28: Average daily modal price of Mustard in major e-NAM mandis in
Rajasthan, 2017
APMC Jan Feb Mar Apr May Jun Jul Aug Sep Oct Nov Dec Total Trend
Padampur 799 791 1079 1673 1779 1615 1466 405 1863 828 576 839 13713
Merta City 549 361 588 1055 1287 999 846 1034 1257 803 903 621 10303
Sri Ganganagar Grain 134 87 1469 1301 1132 1852 950 1250 1303 9478
Kota 728 512 1122 1828 1164 1764 1997 9115
Gangapura 392 474 1463 182 500 581 556 777 903 678 761 865 8132

50
Top 5 e-NAM mandis in Rajasthan traded 81% of total Guar seeds transactions in the
state on the e-NAM platform. Arrival of mustard takes place from June month onward
in these mandis. The maximum trade in each of these mandis happened during
November-December months (Table 3.21). The average daily modal price in 3 main e-
NAM mandis are presented in Fig 3.29.
Table 3.21: Monthly transaction of Guar Seeds in top 5 mandis, 2017 (quintals)
Fig. 3.29: Average daily modal price of Guar Seeds in major e-NAM mandis in
Rajasthan, 2017
APMC Jan Feb Mar Apr May Jun Jul Aug Sep Oct Nov Dec Total Trend
Nokha 25 6 13 92 783 1512 1391 1017 1138 3101 9078
Sri Ganganagar Grain 784 738 668 538 1002 2365 1891 7986
Bikaner Grain 160 172 790 1018 750 828 3579 7297
Padampur 107 65 80 99 464 279 128 758 1922 1850 1281 7033
Nagour 159 204 250 348 742 1743 846 4292

51
Top 5 e-NAM mandis in Rajasthan traded 49% of total Guar seeds transactions in the
state on the e-NAM platform. Fatehnagar and Kota are two major e-NAM mandis for
the Guar Seeds trade. The maximum trade in each of these mandis happened during
different months (Table 3.22). The average daily modal price in 3 main e-NAM mandis
are presented in Fig 3.30.
Table 3.22: Monthly transaction of Wheat in top 5 mandis, 2017 (quintals)
Fig. 3.30: Average daily modal price of Wheat in major e-NAM mandis in Rajasthan,
2017
APMC Jan Feb Mar Apr May Jun Jul Aug Sep Oct Nov Dec Total Trend
Fatehnagar 398 485 597 1206 1625 2078 1869 2557 2575 1375 912 838 16515
Kota 51 2287 1584 3060 4240 11222
Bundi 1009 1070 1490 1977 1079 2292 8917
Sri Ganganagar Grain 1935 1875 1742 1215 400 638 439 8244
Sumerpur 61 641 615 1891 1186 112 877 1096 974 593 8046

52
Top 4 e-NAM mandis in Rajasthan traded 92% of total Soybeans transactions in the
state on the e-NAM platform. Kota and Ramganj mandi are two major e-NAM
mandis. The maximum trade in each of these mandis happened during November
month (Table 3.23). The average daily modal price in 3 main e-NAM mandis are
presented in Fig 3.31.
Table 3.23. Monthly transaction of Soybeans in top 4 mandis, 2017 (quintals)
Fig. 3.31: Average daily modal price of Soybeans in major e-NAM mandis in
Rajasthan, 2017
APMC Jan Feb Mar Apr May Jun Jul Aug Sep Oct Nov Dec Total Trend
Kota 286 786 701 954 1411 3442 6247 11265 7489 32581 838 16515
Ramganj Mandi 261 48 13 431 708 1259 1563 4283 4240 11222
Atru 71 26 9 109 376 414 480 706 660 703 3554 2292 8917
Baran 290 1145 1410 2845 439 8244

53
Top 4 e-NAM mandis in Rajasthan traded 43% of total Moong (Green Gram)
transactions in the state on the e-NAM platform. Nagour and Merta City are two major
e-NAM mandis for soybeans trade. The maximum trade in each of these mandis
happened during November month (Table 3.24). The average daily modal price in 3
main e-NAM mandis are presented in Fig 3.32.
Table 3.24: Monthly transaction of Moong (Green Gram) in top 4 mandis, 2017
(quintals)
Fig. 3.32: Average daily modal price of Moong (Green Gram) in major e-NAM
mandis in Rajasthan, 2017
APMC Jan Feb Mar Apr May Jun Jul Aug Sep Oct Nov Dec Total Trend
Nagour 648 1047 1274 912 1377 1291 892 1321 1333 1788 2388 3507 17778
Merta City 713 870 802 754 711 1033 526 907 1207 768 1138 1199 10628
Jodhpur Grain 13 13 15 94 379 673 738 962 920 3807
Sumerpur 109 63 132 802 936 2042

54
Top 5 e-NAM mandis in Rajasthan traded 67% of total Chana (Bengal Gram)
transactions in the state on the e-NAM platform. The maximum trade in each of these
mandis happened in different months of the year (Table 3.25). The average daily
modal price in 3 main e-NAM mandis are presented in Fig 3.33. The traded price in
these 3 major mandis shows that the price was peak during August-September
months when it touched ₹6000/q, it remained in the range of ₹4500-5000/q during
rest of the year.
Table 3.25. Monthly transaction of Chana (Bengal Gram) in top 5 mandis, 2017
(quintals)
Fig. 3.33: Average daily modal price of Chana (Bengal Gram) in major e-NAM
mandis in Rajasthan, 2017
APMC Jan Feb Mar Apr May Jun Jul Aug Sep Oct Nov Dec Total Trend
Bikaner Grain 210 2620 1077 1108 1707 678 317 378 647 8742
Baran 10 93 1363 330 672 675 737 694 343 384 1250 1141 7692
Sri Ganganagar Grain 45 693 1132 676 639 466 582 393 4626
Ramganj Mandi 3 182 669 541 538 448 222 318 288 173 412 229 4023
Padampur 1 3 130 775 805 198 862 211 227 114 3326

55
The preceding discussion explained that there are few e-NAM mandis in each state,
which has a significantly higher volume of transactions in a year. However, the
transaction quantity also varies hugely across different months in a year. Further, in
each of these mandis, less than 5 agricultural commodities, mostly 2-3 commodities,
constitute more than 70-80% of the total transaction. Therefore, it would be better to
standardize the process of implementation mainly for these commodities first and
implement 100% of the transaction of these commodities in these mandis to give
benefits to the maximum number of the farmers selling the commodities in the
respective mandis. Moreover, some of the transaction information (quantity arrivals
& traded, minimum, maximum & modal prices) given on the e-NAM portal appears
to be not authentic, which warrants automated real-time monitoring of e-NAM
implementation in these mandis.

56
Chapter 4
Characteristics & Preparedness of e-NAM Mandis
The e-NAM is contemplated to promote uniformity, streamlining of procedures across
the integrated markets, removing information asymmetry between buyers and sellers
and promoting real-time price discovery, based on actual demand and supply,
promoting transparency in the auction process, and access to a nationwide market for
the farmer, with prices commensurate with the quality of his produce and online
payment and availability of better quality produce and at more reasonable prices to
the consumer. Thus, e-NAM seeks to leverage the physical infrastructure of APMC
mandis through an online trading portal, enabling buyers situated even outside the
state to participate in trading at the local level. Price discovery through e-platform
would ensure a fair price to the farmers. As discussed in the previous chapter, two
rounds of survey was conducted during the study. The primary survey was carried
out in the selected e-NAM enabled mandis in the states of Madhya Pradesh and
Telangana states during the first round in the year 2017, while the survey of farmers
was done in one district each from 4 states viz. Madhya Pradesh, Maharashtra,
Rajasthan, and Telangana in the year 2019. In these 4 states, the farmers were selected
from the villages around the major e-NAM mandi in the district.
4.1 General features of selected e-NAM mandis
The characteristics of these e-NAM mandis are presented in this section. The general
information about the selected mandis in Telangana state has been presented in Table
4.1a. It may be observed that except in the Karimnagar market, in the rest of six
markets in Telangana, e- NAM was launched during the first phase itself. Before the
launch of e- NAM, the Nizamabad market committee implemented the e-tendering
system in collaboration with NCDEX from last two years. In all the selected markets,
almost all commodities were reported to be traded through e- NAM, except in
Malakpet (Hyderabad) yard, whereas of now only one commodity, chillies have been
included into the e-NAM, when the survey was conducted in 2017.
Table 4.1b explains the general features of selected e-NAM mandis in Madhya
Pradesh state. Out of 4 selected APMC mandis in Madhya Pradesh state, three
were integrated with the e-NAM platform during the second round of
expansion of e- NAM, while APMC Bhopal was included in the e-NAM fold
during pilot stage itself. However, it can be seen that during the field survey,
none of these mandis were transacting directly through the e-NAM platform.

57
Table 4.1a: General features of the selected mandis in Telangana state
Particulars APMC mandis registered on e-NAM platform
Malakpet
Karimnagar
Thirumulagiri
Nizamabad
Warangal
Suryapet
Badepally
Date of e-NAM implemented
14-04-2016
06-09-
2016
14-04-2016
14-04-2016
14-04-2016
31-08-2016
16-04-2016
Commodities traded in selected mandi
Chilli, Onion, Tamari
nd
Paddy, Maize, Cotton, Pulses
Paddy, Pulses,
GN
Turmeric,
Maize, Paddy, Onion
Chilli, Maize, Cotton, Turmeric, Pulses
Pulses, Oilseeds, GN
GN, Maize, Castor,
RG, Paddy, Cotton
Commodities traded through e-NAM
Chilli All Commo
dities
All commod
ities
All commodities
All Commo
dities
All commodities
All commodities
Warehousing facilities
No Yes Yes Yes Yes Yes No
Number of stakeholders registered in e-NAM
Traders
128 110 55 420 647 129 98
CA 151 13 43 120 447 134 58
Farmers
9200 NA 18000 61397 NA NA NA
Source: First round of field survey (2017) CA: Commission Agents Commodity: GN- Groundnut, RG: Red Gram/Tur
Table 4.1b: General features of the selected mandis in Madhya Pradesh state
Particulars APMC mandis registered on e-NAM platform
Bhopal Indore Sehore Dewas
Date of e-NAM
implemented
14/04/2016 30/09/2016 15/09/2016 29/09/2016
Commodities traded
in selected mandi
All Crops All crops All crops All crops
Commodities
identified for e-
NAM
Wheat, Chana,
Soyabean, Lentil,
Maize, Mustard,
BG, GG, Red-
chilli etc.
BG, GG, RG,
Jowar, Lentil,
Pea, etc.
Chana, RG,
Lentil, etc.
Chana, BG,
GG, RG, Pea,
Jowar, Maize,
Mustard, etc.

58
Commodities traded
through e-NAM
At present, no commodities were traded through e-NAM
Warehousing
facilities
Yes No Yes Yes
Number of
stakeholde
rs registered
in e-NAM
Traders 851 1477 309 300
CA Madhya Pradesh has no commission agents in APMCs.
Farmer
s 10886 12000 5000 5096
Source: First round of field survey (2017) CA: Commission Agents Commodity: GN- Groundnut, RG- Red Gram/Tur, BG- Black Gram/ Urad, GG- Green Gram/ Moong, Chana- Bengal Gram
4.2 Preparedness of e-NAM enabled selected mandis (Round-I survey)
The successful implementation of e-NAM depends upon the preparedness of these e-
NAM enabled mandis in bringing some changes to facilitate the trading on electronic
platforms. These markets require appropriate infrastructure- efficient standardizing
and grading system, high-quality internet facility, terminals for information
dissemination & bidding, inter-linkage with financial institution, access to other
segments of marketing chain like warehouses, cold storage, well-trained staffs, etc. It
is important to mention here that ReMS in Karnataka is considered to be the role
model for the conceptualization of e-NAM at the national level. The ReMS system of
the unified market model was developed by the National Commodity & Derivative
Exchange Ltd (NCDEX) way back in 2011. The ReMS integrated all the mandis in
Karnataka state and has provided facilities of assaying in mandis, online payment to
farmers, facilitation of warehouse-based sale of produce, and commodity funding for
all stakeholders.
Table 4.2 describes the components that are followed presently in selected mandis in
Telangana state. In Nizamabad market, producers have the option to sell their
produce without a commission agent. The gate entry and generation of unique Id has
been implemented in all the markets, while assaying facilities are not functional in any
of these mandis, except in Nizamabad. In Nizamabad market, the assaying lab is
functional and done by NCML, a subsidiary of NCDEX. Every day assaying agencies
were checking moisture percentage of about 15% of total lots.
At present in all the markets except in Nizamabad direct-purchase center (DPC),
commission agents pay the farmers by cheque/RTGS/cash. In Nizamabad DPC, the
payments were integrated into e-NAM and the farmer is receiving money directly by
traders. In these markets, the electronic weighments are installed but not integrated
into the e-NAM portal.

59
Table 4.2: Implementation of different components of e-NAM in selected mandis in Telangana, 2017
Particulars
Malakpet
Karim-nagar
Thiru-mulagiri
Nizama-bad
Wara-ngal
Surya-pet
Bade-pally
Non DPC
DPC
Generation of Unique Lot ID at entry gate
Sampling from heap
*e-Auction Assaying Best price-SMS sent to the farmers
Electronic weighments
Generation of sale receipt
Online payment Permit/ Gate exist
Source: Field Survey (2017)
Note means followed and means not followed
DPC: Direct Purchase Centre
*Online bidding is not happening and trading happens in traditional ways and data has been entered
in the system after the trade.
The information dissemination about the bidding winner list was not followed as per
the procedure and farmers and traders continue to face information asymmetry. Even
SMS services regarding prices were not implemented. In Nizamabad DPC center
mandi officials were announcing the winner bid lists whereas in other markets manual
receipts were given to the farmers instead of generating sale receipts. In general, the
infrastructure support needed to make the e-NAM platform functional at mandi level
was not available in most of the APMCs under study. Proper internet connectivity,
lack of skilled staff, non-functional assaying facilities, grading, and sorting was not
available in these APMCs. Trainings so far arranged for the mandi staff and traders
for effective implementation were found to be inadequate.
Table 4.3 describes the preparedness of selected mandis in Madhya Pradesh for
implementing online trading on the e-NAM portal. During the survey in these mandis
in March 2017, it was observed that Unique Lot ID is generated and given to farmers
at auction platform. Assaying facilities and e-auction were not implemented in any of
these markets. Best price SMS to farmers facility was also not available except in
Dewas mandi. Farmers had the right to refuse to sell their goods at any time. At

60
present in all the markets, the provision of payment is made through cheque and
RTGS. However, farmers were receiving money in cash directly by the traders. In all
the markets, the electronic weighing is installed, but the weighing is done by the
traders at their shops.
Table 4.3: Implementation of different components of e-NAM in selected mandis in Madhya Pradesh, 2017
Particulars Bhopal (Karond)
Indore Sehore Dewas
Generation of Unique Lot ID at
entry gate*
Sampling from lots
Assaying
e-Auction
Best price-SMS sent to the
farmers
Electronic weighing
Generation of sale receipt**
Mode of Payment (Cashless)
Permit/Gate exist
Assaying equipment, particularly, moisture meters are found to be available in many
markets. However, assaying is not found to be happening in any of these markets.
Farmers’ lots with gate entry kept on the trading platform. Traders check for the
quality themselves by physically visiting the lots before quoting the price for the
traded commodities. In the best-case scenario, traders use Digital Moisture Meter for
moisture content. Based on physical assessment, traders quote the price for a given lot
on the e-NAM portal (Fig 4.1). The highest bidders are declared as winner. From the
above information, it may be concluded that all these APMC mandis in both the states-
Madhya Pradesh and Telangana, were not fully ready for the trading of agricultural
commodities on the e-NAM platform. The only difference was the trade information
is recorded digitally after the trade for the day completes in the market.
* Generated later
** Issued by the traders Followed
Under APMC rule
Not-Followed

61
Commission agent key stakeholder at
Parbhani mandi
Space constraint at Malakpet mandi
Snapshot of Kota mandi
Cash payment is preferred by farmers as
well as traders in the mandi
Trader physically inspecting the lot
Trader putting his bid after physical
inspection of the lots
Fig. 4.1: Different marketing activities going on during visit to e-NAM mandis
However, when transaction data from the e-NAM platform for the period January-
December 20171 was collected, it was observed that various types of commodities
were reported as traded through the e-NAM platform (Table 4.4). From personal
communication with mandi officials in these mandis revealed that transactions done
offline were entered into the system for reporting purposes. From the table, two
important observations appear- 1. Few mandis had huge market arrivals, while in
other mandis, the volume of commodities’ arrivals/traded were very low, and 2. In
1 Earlier the daily transaction data mandi-wise and commodity-wise was avaialble on e-NAM portal. However, now only past one week data is available in public domain. Moreover, lot-wise transaction information is not available in the public domain.

62
each mandi, only 2-3 commodities constituted a major transaction (Annexure VI).
These are discussed in detail in the latter part of this chapter as well.
Table 4.4: Transaction reported on e-NAM platform for the selected e-NAM mandis for the period January-December 2017
State e-NAM Mandi Types of
Commodities
traded in 2017
Total quantity traded on e-NAM, 2017 (tonnes)
Telangana Malakpet/ Hyderabad 7 187,623
Karimnagar 30 14,062
Nizamabad 87 30,882
Warangal 161 20,427
Madhya
Pradesh
Karond/Bhopal 19 2,054
Indore 15 1,279
Dewas 19 1,192
Sehore 8 617
4.3 Preparedness of e-NAM mandis (Round-II survey)
During the second round, the implementation status was studied based on eleven
indicators in 4 states. The indicators are given in Table 4.5. As per guidelines by the
government of India, each mandi that gets integrated with the e-NAM platform would
receive a grant of ₹30 lakhs for its modernization including the creation of additional
facilities, trading platform, internet, etc. The effective way of implementing the
assaying system is through making the process simpler and automatic with provision
for scaling up. The process should be made simpler such that it should take minimum
time so that all the lots during peak season can be assayed. The process should be
automated so that bulk materials during peak can be handled effectively. Assaying
infrastructure should be adequate to handle the peak period rush.
From the Table 4.5 and Figures (4.2 to 4.5) below, it is evident that the current facilities
created at these mandis might not be sufficient to give confidence to the buyer-traders.
In one of the mandis, when we asked about how the assaying lab conduct analysis,
hesitantly they agreed to demonstrate the procedure. The mandi official with the help
of casual semi-skilled labour were counting the damaged grain of one sample of
groundnut manually. It took more than 20-25 minutes in shelling, counting, and
weighing the grains. This makes a case that if the same procedure is followed for all
the commodities, it would be impossible to sample and assay all the lots arriving in
the mandi during peak season. As shown in Fig 4.4, during peak days, the number of
lots arriving at each mandi varies between 500 to 5000.

63
Table 4.5: Basic infrastructure and process followed in the e-NAM mandis, 2019
Sl.no Facilities
(infrastructure +
processes)
e-NAM mandis surveyed during Round -II
Shadnagar
(Telangana)
Jabalpur
(M.P.)
Parbhani
(Maharashtra)
Kota
(Rajasthan)
1. Assaying equipment ✓ ✓ ✓ ✓
2. Warehouse ✓ ✓ ✓ ✓
3. Cold storage
4. Drier (electrical drier,
solar driers, etc.)
5. Only Closed bidding
system
✓/
6. Electronic weighing
machines at yard
✓ ✓ ✓ ✓
7. Gate entry
(computerized)
✓ ✓
8. Inter-mandi trading
system
9. Traded price
communicated to CA &
farmer through SMS
10. Transferring proceeds
through bank
✓ ✓ ✓
11. Cash transactions
permitted
✓ ✓ (₹50K) ✓ ✓
Source: Field survey (2019)
*Basic assaying equipment like digital moisture meter and electronic weighing machines were available.
A comparison among these markets showed that, in all the selected markets except
Kota, the settlement of proceedings takes place through bank account or by cash. In
Rajasthan, only cash transaction is entertained. Further, at Jabalpur mandi, to pay for
immediate needs like payment towards loading and unloading, transportation, etc. an
amount of ₹50,000/- is permitted to pay by cash or cheque, while the rest needs to be
routed through the bank. However, farmers at Jabalpur faced problems in the
collection of cheque. At Jabalpur, both closed and open auction is adopted. In a
separate terminal at Jabalpur mandi, e-NAM is being implemented on a trial basis.
While in all other selected markets, open auction is being adopted and after the
transaction, the data is inputted into the e-NAM portal.
Fig. 4.2: Manual counting of broken/damaged peanut in the assaying lab of one of the
e- NAM mandis

64
Fig. 4.3: Traders assessing the quality of Red Gram by personally inspecting the lot
Fig. 4.4: Daily lot arrival in various markets of Telangana, 2016-17
Table 4.6: Tradable parameters for dry chillies
S.No Tradable Parameters Range-I Range-II Range-III
1 Moisture (% by wt) up to 10.0 10.1-10.5 10.6-11.0
2 Foreign matter (% by wt) up to 0.50 0.51-0.60 0.61-0.85
3 Unripe and marked Fruits (% by wt)
up to 1.0 1.1-1.5 1.6-2.0
4 Broken fruits and fragments (% by wt)
up to 3.0 3.1-4.0 4.1-5.0
5 Insect damaged matter (% by count)
up to 0.10 0.11-0.5 0.6-1.0
6 Capsaicinoid content 0.30 -0.25 0.24-0.20 0.19-0.10
7 Uniformity More uniform Slightly less uniform
Less uniform
8 Luster Normal Medium Poor
0
100
200
300
400
500
600
Nu
mb
er o
f lo
ts/d
ay
Thirumalgiri
0100200300400500600700
Nu
mb
er o
f lo
ts/d
ay Suryapet
0200400600800
100012001400
Nu
mb
er o
f lo
ts/d
ay
Malakpet
0
1000
2000
3000
4000
5000
Nu
mb
er o
f lo
ts /
day Nizamabad Non-DPC

65
Fig. 4.5: Red chillies kept in gunny bags or as big heap making it difficult to assay the
quality mechanically
Further, for a commodity like chillies which are kept in large size bags or heaps and
are voluminous (Fig 4.5), there is no equipment available for grading or testing the
grades. On the other hand, different parameters to define different grades are quite
exhaustive (Table 4.6). Assaying is presently optional and hence, was not followed
except for a few lots traded for the record purposes.
4.4 Transaction reported on e-NAM platform
A. Madhya Pradesh (April – December 2016)
The daily transaction data reported on the e-NAM platform were collected for the
selected states for the period April -December 2016. Although, these data were not
continuous. For instance, for Madhya Pradesh, data was not available from October
2016 to December 2016. In the 5 selected e-NAM mandis in Madhya Pradesh, it may
be observed that there was huge variability in the arrival of the commodity in these
mandis (Table 4.7). Interestingly, data reported in e-NAM portal shows a significantly
high volume of transaction in initial days of April 2016 (immediate after integration
of mandi with e-NAM), which later got tapered down (Fig. 4.6) Total 17 commodities
were reported on e-NAM portal, out of which, Bengal Gram constituted more than
88% (Fig. 4.7). The daily average (of 5 mandis) modal price (per quintal) of Bengal
gram varied from ₹1000-1250 in early April month to peak of ₹9500-10,000 during the
middle of October month.

66
Table 4.7: Monthly traded volume of different commodities reported in selected e-NAM mandis of Madhya Pradesh, 2016 (in Quintals)
Fig. 4.6: Daily total transaction reported in the 5 selected e-NAM mandis in Madhya
Pradesh
Fig. 4.7: Different commodities traded on e-NAM in selected mandis, 2016
APMC Apr May Jun Jul Aug Sep Oct Dec Grand Total Column1
Dewas 52 360 11 423
Indore 2 88 90
Jabalpur 9 121 4 134Karond
(Bhopal) 1001 525 543 275 44 307 262 286 3243
Sehore 10 186 5 201
Grand Total 1001 525 543 275 44 380 1017 306 4091
0
50
100
150
200
250
300
11
-Ap
r
20
-Ap
r
26
-Ap
r
01
-May
11
-May
18
-May
25
-May
01
-Ju
n
08
-Ju
n
15
-Ju
n
21
-Ju
n
29
-Ju
n
06
-Ju
l
14
-Ju
l
20
-Ju
l
26
-Ju
l
26
-Au
g
01
-Se
p
08
-Se
p
16
-Se
p
23
-Se
p
29
-Se
p
05
-Oct
13
-Oct
19
-Oct
25
-Oct
Qu
inta
ls
Year 2016 Apr
May
Jun
Jul
Aug
Sep
Oct
Dec
88%
2%
1% 1%4%4%
Tur/RedGramBengal Gram
Green Gram
Jowar-White
Maize
Lentil

67
Fig. 4.8: Daily average modal price of Bengal Gram in 5 selected mandi in Madhya
Pradesh
B. Telangana (April – December 2016)
The monthly traded commodities in the selected e-NAM mandis in Telangana also
exhibited lots of abruptness (Table 4.8). All these e-NAM mandis have an unusually
very high volume of transactions in different months of the year 2016. There were
more than 50 types of commodities reported on the e-NAM portal, out of which,
Paddy and Maize constituted more than 60% of total trade (Fig. 4.10). The daily
average (of 5 mandis) modal price (per quintal) of Bengal gram varied from ₹1000-
1250 in early April month to peak of ₹9500-10,000 during the middle of October
month.
Table 4.8: Monthly traded volume of different commodities reported in selected e- NAM mandis of Telangana, 2016 (in Quintals)
0
2000
4000
6000
8000
10000
12000
11
-Ap
r
21
-Ap
r
28
-Ap
r
07
-May
16
-May
25
-May
02
-Ju
n
11
-Ju
n
18
-Ju
n
28
-Ju
n
06
-Ju
l
15
-Ju
l
22
-Ju
l
29
-Ju
l
31
-Au
g
08
-Se
p
17
-Se
p
26
-Se
p
03
-Oct
10
-Oct
19
-Oct
26
-Oct
Mo
dal
pri
ce (
₹ p
er q
uin
tal)
Chana (Bengal Gram)- Desi, 2016
Apr
May
Jun
Jul
Aug
Sep
Oct
e-NAM Mandi Apr May Jun Jul Aug Sep Oct Dec* Total Trend
Badepally 140 150 425 160 158 1866 4326 352 7577Hyderabad/
Malakpet 227 129 1614 683 170 780 927 125 4655
Karimnagar 13 889 6825 7727
Nizamabad 191 4239 12996 2786 1310 2744 612 20 24898
Shadnagar 51 456 507
Suryapeta 51 1720 6247 134 8152
Tirumalgiri 513 1837 1114 945 583 6004 11133 528 22657
Warangal 2379 2232 863 3519 1196 3628 8240 22057
Grand Total 3450 8587 17012 8093 3468 16806 32830 7984 98230

68
Fig. 4.9: Daily total transaction reported in the selected e-NAM mandis in Telangana
Fig. 4.10: Different commodities traded on e-NAM in selected mandis in Telangana, 2016
0
1000
2000
3000
4000
5000
6000
10
-Ap
r
20
-Ap
r
28
-Ap
r
09
-May
18
-May
27
-May
06
-Ju
n
15
-Ju
n
23
-Ju
n
01
-Ju
l
14
-Ju
l
23
-Ju
l
23
-Au
g
31
-Au
g
14
-Se
p
23
-Se
p
04
-Oct
14
-Oct
22
-Oct
31
-De
c
Qu
inta
ls
Year 2016
Apr
May
Jun
Jul
Aug
Sep
Oct
Dec
36%
26%
9%
6%
6%
4%
3%
2% 2%
2%
1%
1% 1%
1%Paddy(21) Maize (6)
Turmeric Bulb Turmeric Finger
Green Gram Cotton (6)
Chillies (2) Turmeric Chura
Tur-Red Gram (3) Ground Nut (4)
Castor Seed Soyabeans (7)
Urad (Black Gram) Onion (2)
Jowar(3) Turmeric
Gingily-Sesame (4) Red Chilli-Dry
Chana (Bengal Gram) Bajra (4)
Others
0500
100015002000250030003500400045005000
11-A
pr
20-A
pr
30-A
pr
12-M
ay
25-M
ay
06-J
un
15-J
un
23-J
un
11-J
ul
20-J
ul
28-J
ul
30-A
ug
12-S
ep
20-S
ep
27-S
ep
05-O
ct
14-O
ct
21-O
ct
28-O
ct
Avg
Mo
dal
Pri
ce (
₹ p
er q
uin
tal)
Paddy, 2016
Apr
May
Jun
Jul
Aug
Sep
Oct
Dec
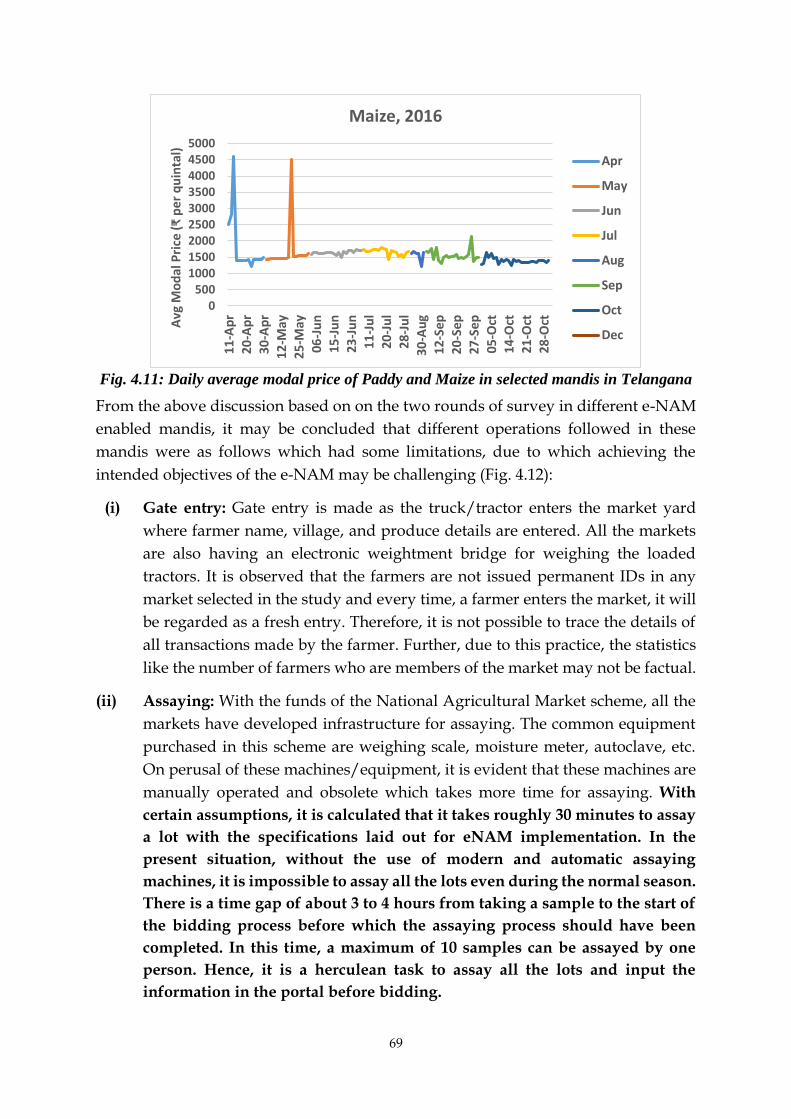
69
Fig. 4.11: Daily average modal price of Paddy and Maize in selected mandis in Telangana
From the above discussion based on on the two rounds of survey in different e-NAM
enabled mandis, it may be concluded that different operations followed in these
mandis were as follows which had some limitations, due to which achieving the
intended objectives of the e-NAM may be challenging (Fig. 4.12):
(i) Gate entry: Gate entry is made as the truck/tractor enters the market yard
where farmer name, village, and produce details are entered. All the markets
are also having an electronic weightment bridge for weighing the loaded
tractors. It is observed that the farmers are not issued permanent IDs in any
market selected in the study and every time, a farmer enters the market, it will
be regarded as a fresh entry. Therefore, it is not possible to trace the details of
all transactions made by the farmer. Further, due to this practice, the statistics
like the number of farmers who are members of the market may not be factual.
(ii) Assaying: With the funds of the National Agricultural Market scheme, all the
markets have developed infrastructure for assaying. The common equipment
purchased in this scheme are weighing scale, moisture meter, autoclave, etc.
On perusal of these machines/equipment, it is evident that these machines are
manually operated and obsolete which takes more time for assaying. With
certain assumptions, it is calculated that it takes roughly 30 minutes to assay
a lot with the specifications laid out for eNAM implementation. In the
present situation, without the use of modern and automatic assaying
machines, it is impossible to assay all the lots even during the normal season.
There is a time gap of about 3 to 4 hours from taking a sample to the start of
the bidding process before which the assaying process should have been
completed. In this time, a maximum of 10 samples can be assayed by one
person. Hence, it is a herculean task to assay all the lots and input the
information in the portal before bidding.
0500
100015002000250030003500400045005000
11
-Ap
r2
0-A
pr
30
-Ap
r1
2-M
ay2
5-M
ay0
6-J
un
15
-Ju
n2
3-J
un
11
-Ju
l2
0-J
ul
28
-Ju
l3
0-A
ug
12
-Se
p2
0-S
ep
27
-Se
p0
5-O
ct1
4-O
ct2
1-O
ct2
8-O
ctAvg
Mo
dal
Pri
ce (
₹ p
er q
uin
tal)
Maize, 2016
Apr
May
Jun
Jul
Aug
Sep
Oct
Dec
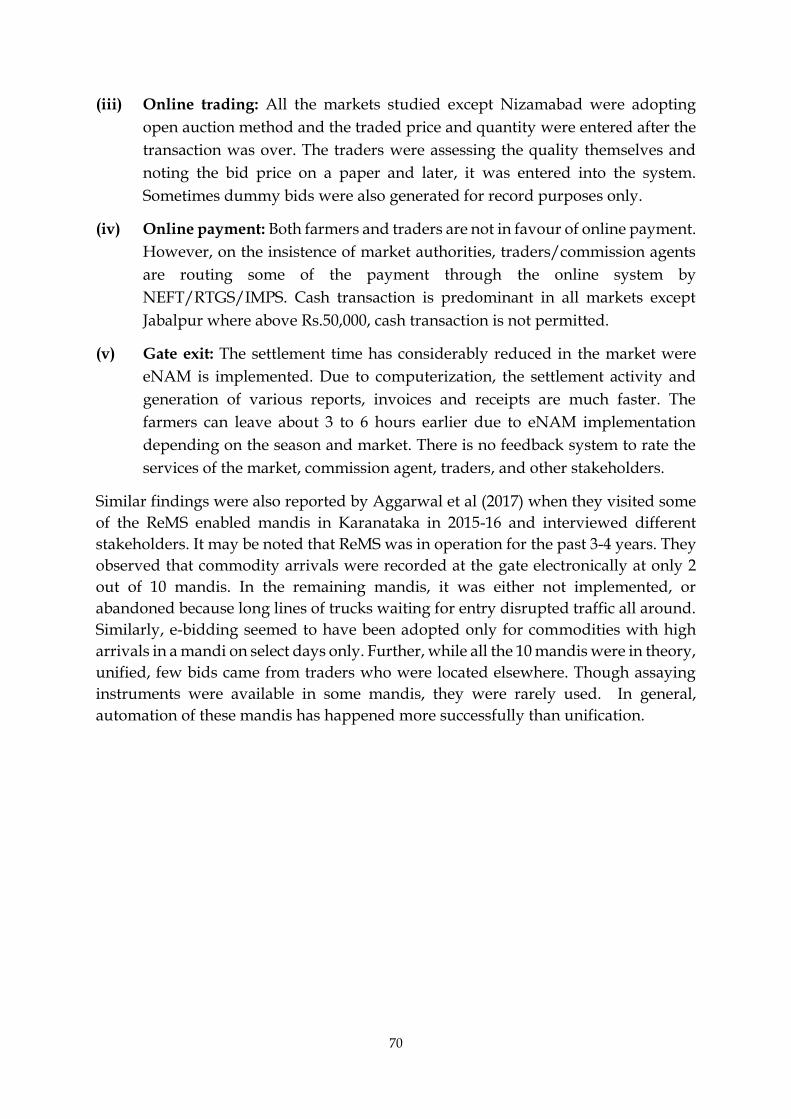
70
(iii) Online trading: All the markets studied except Nizamabad were adopting
open auction method and the traded price and quantity were entered after the
transaction was over. The traders were assessing the quality themselves and
noting the bid price on a paper and later, it was entered into the system.
Sometimes dummy bids were also generated for record purposes only.
(iv) Online payment: Both farmers and traders are not in favour of online payment.
However, on the insistence of market authorities, traders/commission agents
are routing some of the payment through the online system by
NEFT/RTGS/IMPS. Cash transaction is predominant in all markets except
Jabalpur where above Rs.50,000, cash transaction is not permitted.
(v) Gate exit: The settlement time has considerably reduced in the market were
eNAM is implemented. Due to computerization, the settlement activity and
generation of various reports, invoices and receipts are much faster. The
farmers can leave about 3 to 6 hours earlier due to eNAM implementation
depending on the season and market. There is no feedback system to rate the
services of the market, commission agent, traders, and other stakeholders.
Similar findings were also reported by Aggarwal et al (2017) when they visited some
of the ReMS enabled mandis in Karanataka in 2015-16 and interviewed different
stakeholders. It may be noted that ReMS was in operation for the past 3-4 years. They
observed that commodity arrivals were recorded at the gate electronically at only 2
out of 10 mandis. In the remaining mandis, it was either not implemented, or
abandoned because long lines of trucks waiting for entry disrupted traffic all around.
Similarly, e-bidding seemed to have been adopted only for commodities with high
arrivals in a mandi on select days only. Further, while all the 10 mandis were in theory,
unified, few bids came from traders who were located elsewhere. Though assaying
instruments were available in some mandis, they were rarely used. In general,
automation of these mandis has happened more successfully than unification.

71
Fig. 4.12. Process flow and the gaps observed at e-NAM mandis under the study

72
Chapter 5
Benefits from Participation of Smallholders in e-NAM
Long ago, Adam Smith spoke about the importance of markets. Conceptually, the
direct sale of farm produce encourages the system of marketing without the role of
the middleman by the small and marginal producers. The Model Act 2003 provides
the provision of reducing middlemen’s role through the establishment of farmers’
markets1. Improving income of the farmers inter alia mainly depends upon market
participation i.e. produce offered for sale in the proper market, and market orientation
i.e. agricultural production destined for market based on market signals (Pingali and
Rosegrant, 1995; Pingali, 1997). In India, more than 85 per cent of farmers are
smallholders. Their smaller operational holding lead to several other factors
consequently capping of better income realization from farming. These are lower
production, smaller marketed surplus, higher transaction cost, lower bargaining
power in the output market, higher market and price risk, etc.
Smallholder farmers often have a weaker bargaining position in output marketing.
This may be due to lack of options (in terms of alternative buyers), risk aversion, high
transportation costs, and the perishable nature of the crops. The risk of not being able
to sell their produce due to its perishable nature usually weakens the bargaining
power of the farmers, who face Hobson’s choice of taking whatever is available or
nothing at all (Ranjan, 2017). Even if a farmer does manage to get produce directly to
the mandi, there is no guarantee of receiving a better price because these markets are
dominated by large traders and auction-based sales among those traders, which could
be difficult for individual farmers to compete in. In general, the existing literature
relating to middlemen has tended to view middlemen as either fulfilling an important
role in the market (Rubinstein and Wollinsky 1985; Biglaiser and Friedman 1994; Li
1998; Van Raalte and Webers 1998; Jori and Leach 2002), or as being purely
exploitative (Masters 2008). In India, middlemen “cuts” comprise up to 75% of the
agricultural prices, particularly in fruits & vegetables (Bhardwaj and Singh, 2014).
Every market has unique characteristics between farmers and traders. It may be as (a)
traders are better informed about market conditions than farmers; (b) farmers often
trade with the same trader for multiple periods; and (c) the existence of frictions in the
market means it is not costless for the farmers to find a different middleman to trade
with.
Moreover, several studies from different parts of the world reported the benefits of
ICT- and MIS-based services giving advanced market information to the farmers,
however, the results have been mixed. Some studies have found that improved access
to market information has had a positive impact on farm-gate prices (Buxton et al.,
1 Punjab (Apni Mandi), Haryana (Apni Mandi), Rajasthan (Kisan Mandi), Andhra Pradesh (Rythu Bazar), Tamil Nadu (Uzhavar Shandy), Maharashtra (Shetkari Bazar) and Orissa (Krushak Bazar).

73
2014; Courtois and Subervie, 2015; Mitchell, 2017), whereas others have observed no
effect (Fafchamps and Minten 2012). In the same context, other studies also reported
that market information has a positive effect on farm-gate prices for some types of
crops, but no effect for others (Muto and Yamano 2009; Aker and Fafchamps 2015).
Though, delivering market price information to farmers does not provide them with
additional arbitrage opportunities of the sort that Jensen (2007) analyses among Kerala
fishermen or Goyal (2010) finds among soybean farmers in Madhya Pradesh.
Moreover, Mitra et al. (2017) asserts that access to price information to potato growers
in West Bengal does not necessarily benefit farmers in their negotiations because they
have few outside options. The ability of producers to use price information may be
limited due to remaining interlocked with particular middlemen or having limited
outside options for selling their output. The e-NAM envisages resolving both these
issues viz. providing market price information in advance and giving access to the
pan-India market for better price discovery.
In this study, the inclusive aspect of participation in mandi and the benefits realized
in terms of a better price for their produce was examined from the direct survey as
well as through comparing the modal price of the commodities reported on the e-
NAM portal and that on AGMARKNET portal for the April 2020 month. To achieve
this objective, a total of 446 farmers were randomly selected for the study whose farms
fell within a radius of about 50 kilometers from one major mandi selected in each state.
These mandis were APMC Jabalpur in Madhya Pradesh, APMC Parbhani in
Maharashtra, APMC Shadnagar (Rangareddy district) in Telangana, and APMC Kota
in Rajasthan. The category of farmers compared are smallholders (having <5 acres of
land) and large farmers2 (>5 acres of land) and within these groups, selling at e-NAM
mandi and outside e-NAM mandi.
5.1. Socio-economic profile of the sample farmers
A perusal on the profile of the sample farmers across the 4 states revealed that the
family size ranges from four in Telangana (TS) to seven in Rajasthan (RJ). In all the
selected states, the education level of the majority of the sample farmers was below
12th standard (Table 5.1). Telangana state recorded more illiterate farmers, while the
average family size is the lowest among all the states under study.
2 Though, Ministry of Agriculture & Farmers Welfare, Government of India defines Large farmers as having operational holding >10 heactres (25 acres) of land. In the study, since number of farmers with land holding >5 acres were less, we have clubbed all the farmers above >5 acres land in single category and named ‘Large farmers’.

74
Table 5.1: Demographic characteristics of farmers
Sl. No.
District/ District/ State
Sample size
(n)
Average family size
Education level of head of household, %
Illiterate Primary Secondary Graduation & Above
1 Parbhani/ Maharashtra
110 5.5 19 60 11 10
2 Jabalpur/ Madhya Pradesh
121 5.4 13 30 53 4
3 Kota/ Rajasthan
118 6.8 9 77 2 12
4 Rangareddy/ Telangana
97 4.1 42 46 11 1
Crop production is the major occupation of the respondents in these states. In
Maharashtra (MH), it is closer to 100 per cent (Table 5.2). In Telangana (TS), even
though pure crop cultivation is the major occupation, the farmers were also following
poultry and dairy. Few farmers were involved in non-farm occupation in the form of
small business, labour, and service in all the selected states.
Table 5.2: Occupation and land holding of selected farmers (% of sample households)
Sl. Particulars MH MP RJ TS Pooled
I Source of Income
1. Agriculture 99.09 88.89 96.23 82.29 91.90
2. Agri+Poultry+Dairy 0.00 0.00 0.00 2.08 0.48
3. Business 0.91 3.70 1.89 3.13 2.38
4. Labour 0.00 0.93 0.94 1.04 0.71
5. Service 0.00 5.56 0.94 0.00 1.67
II Land Holding
1. Marginal farmers ( <2.5 ac) 27.27 19.83 72.03 32.99 38.34
2. Small farmers (2.5- 5 ac) 43.64 40.50 15.25 42.27 34.98
3. Medium Farmers (5-10 ac) 18.18 17.36 7.63 16.49 14.80
4. Large farmers (≥10 ac) 10.91 22.31 5.08 8.25 11.88
III Sources of Irrigation
1. Bore well 39.25 22.81 11.01 42.86 28.83
2. Tube well + canal 22.43 57.02 75.23 13.39 38.51
3. Open well 4.67 8.77 0.00 0.00 3.38
4. Rainfed 33.64 11.40 13.76 43.75 29.28
IV Possession of Tractors
Yes 0.91 27.27 27.96 12.37 17.71
No 99.09 72.72 72.03 87.62 82.28
In the selected states, smallholders (land holdings up to 5.0 acres) constituted 60 to
87% of total sample households. The marginal farmers constituted over 70 percent in

75
Rajasthan. The average landholding of Madhya Pradesh farmers were found to be
almost double as that of other selected states with an area of about 10 acres (Fig.5.1).
Fig. 5.1: State-wise distribution of sample farmers
5.2 Inclusiveness of smallholders in APMC markets
To examine the participation and inclusiveness of smallholder farmers in selected e-
NAM mandi across 4 states, the production pattern, marketed surplus and disposal
pattern of major crops of the sample farmers were analyzed.
5.2.1 Cropping pattern and marketed surplus in Madhya Pradesh
The farmers in Madhya Pradesh, cultivated mainly 4 crops- paddy, wheat, black gram,
and chickpea (Chana/Bengal Gram), which together occupied 77% of gross cropped
area. Landholding size has not much influence on the choice of the crops, except for
large farmers who mainly prefer wheat over chickpea (Table 5.3). The perusal of total
production and marketed surplus (share of total production sold) of these farmers
presented in Table 5.4 shows that though smallholder farmers produce almost half as
compared to that by the large farmers as far as 4 major crops (except wheat) are
concerned, however, the marketed surplus is almost same for the same
commodities/produce. Wheat being staple cereals, smallholders are retaining about
one-third of the total production for home consumption. It may be inferred in two
ways- one, either the smallholders are consuming very few food items or they are
depending more on the public distribution system for food grains in the region.
0
10
20
30
40
50
60
70
80
90
100
Maharashtra Madhya Pradesh Rajasthan Telangana
Per
cen
t
Marginal farmers Small farmers Medium Farmers Large farmers
(2.28) (4.10) (2.06) (2.24)Average land holdings (acres)

76
Table 5.3: Cropping pattern of sample farmers in Madhya Pradesh
Crops % of gross cropped area
Smallholders (<5 acres)
Medium farmers (5-10 acres)
Large farmers (>10 acres)
Overall
Wheat 27% 27% 35% 32%
Paddy 21% 18% 17% 18%
Black gram 16% 22% 14% 16%
Chickpea 14% 13% 9% 11%
Maize 3% 5% 7% 6%
Green Gram 2% 2% 6% 4%
Field pea 6% 2% 3% 4%
Others* 10% 11% 9% 9%
*include lentil, sugarcane, red gram, finger millet, groundnut, sesamum, mustard, etc.
Table 5.4: Average total production and marketed surplus of sample farmers in Madhya Pradesh
Crop/ Commodity
Smallholder farmers (landholding < 5 acres)
Large farmers (landholding ≥5 acres)
n Average Total
Production (Q)
Average Marketed
surplus (% of col 3)
n Average Total Production
(Q)
Average Marketed
surplus (% of col 6)
1 2 3 4 5 6 7
Black gram 19 12.58 (16.54)
83% 25 28.23 (51.11)
80%
Chickpea 31 10.90 (10.52)
81% 31 23.47 (22.24)
83%
Paddy 23 58.34 (121.37)
90% 32 70.22 (78.01)
87%
Wheat 36 41.56 (75.58)
66% 44 123.69 (226.62)
81%
Figures within parentheses are the standard deviation.
Normally small farmers sell their produce in many installments to meet their urgent
cash needs. Fig 5.2 exhibits a clear difference in the selling pattern of the commodities
after harvest by the smallholder farmers vis-à-vis large farmers in Madhya Pradesh
state. In the case of wheat, more than 55% of smallholders sold the produce within 2-3
weeks after harvest, while 80% of the large farmers sold after 4 weeks of harvest. In
the case of paddy, though the majority sold after 4th weeks, however, the proportion
of farmers selling the produce early is significantly high for smallholder farmers. The
trend is similar for the other two major crops.
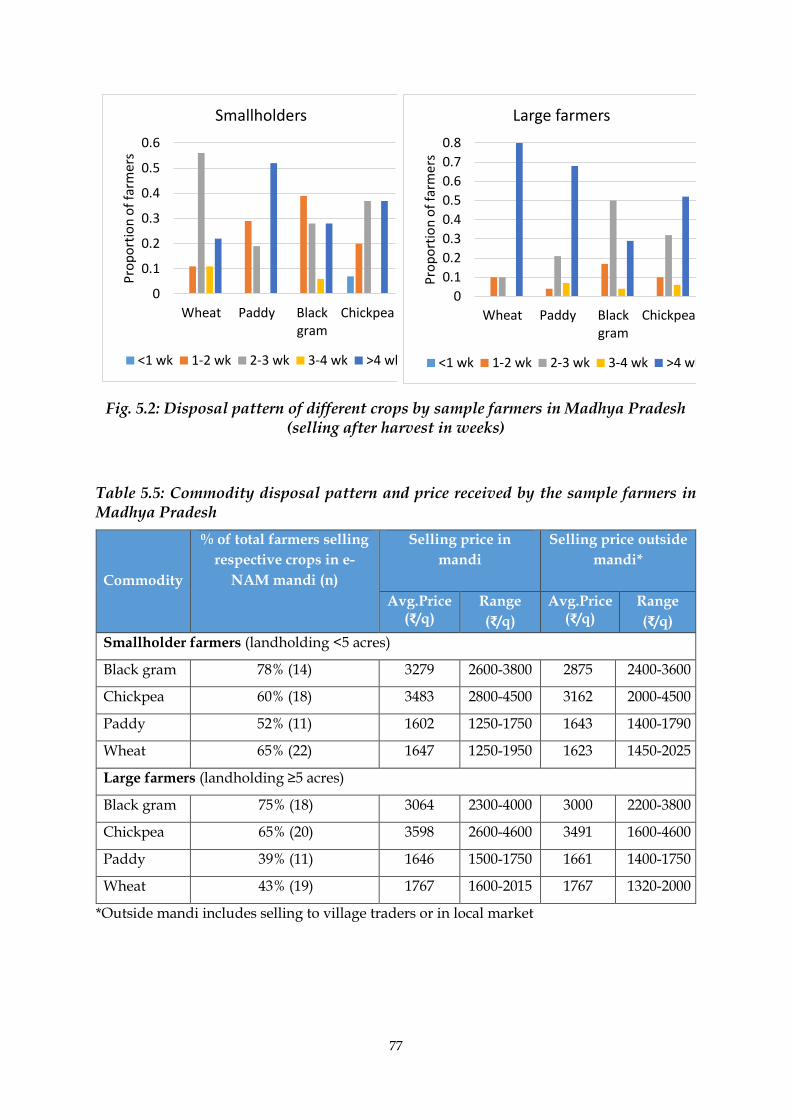
77
Fig. 5.2: Disposal pattern of different crops by sample farmers in Madhya Pradesh (selling after harvest in weeks)
Table 5.5: Commodity disposal pattern and price received by the sample farmers in Madhya Pradesh
Commodity
% of total farmers selling
respective crops in e-
NAM mandi (n)
Selling price in
mandi
Selling price outside
mandi*
Avg.Price (₹/q)
Range
(₹/q)
Avg.Price (₹/q)
Range
(₹/q)
Smallholder farmers (landholding <5 acres)
Black gram 78% (14) 3279 2600-3800 2875 2400-3600
Chickpea 60% (18) 3483 2800-4500 3162 2000-4500
Paddy 52% (11) 1602 1250-1750 1643 1400-1790
Wheat 65% (22) 1647 1250-1950 1623 1450-2025
Large farmers (landholding ≥5 acres)
Black gram 75% (18) 3064 2300-4000 3000 2200-3800
Chickpea 65% (20) 3598 2600-4600 3491 1600-4600
Paddy 39% (11) 1646 1500-1750 1661 1400-1750
Wheat 43% (19) 1767 1600-2015 1767 1320-2000
*Outside mandi includes selling to village traders or in local market
0
0.1
0.2
0.3
0.4
0.5
0.6
Wheat Paddy Blackgram
Chickpea
Pro
po
rtio
n o
f fa
rme
rsSmallholders
<1 wk 1-2 wk 2-3 wk 3-4 wk >4 wk
0
0.1
0.2
0.3
0.4
0.5
0.6
0.7
0.8
Wheat Paddy Blackgram
Chickpea
Pro
po
rtio
n o
f fa
rme
rs
Large farmers
<1 wk 1-2 wk 2-3 wk 3-4 wk >4 wk

78
The disposal pattern of major commodities by two different groups of farmers around
Jabalpur mandi in Madhya Pradesh was studied. It was observed that the majority of
smallholder farmers in the samples are selling their major products in the e-NAM
mandi i.e. Jabalpur (Table 5.5). This may be due to the vicinity of the wholesale mandi
to the farmers. In contrast to this, the majority of large farmers are selling paddy and
wheat outside the mandi. This is an opposite trend than other studies in the past have
reported across the country. Another important observation was that on average
farmers realized better prices when they sold their produce in the mandi, barring few
exceptions like paddy. This may be due to large types of varieties grown by the
farmers, which gets masked in the mandi. Apart from better price in the mandi, the
variation in price realization was higher outside the mandi. Moreover, it may be noted
that we couldn’t get a clear picture of which farmers sold their produce through the
e-NAM platform.
5.2.2 Cropping pattern and marketed surplus in Maharashtra
The farmers in Parbhani district of Maharashtra cultivated mainly 4 crops- sugarcane,
soybean, chickpea (Chana/Bengal Gram), and sorghum, which together occupied
about 80% of the gross cropped area. There was a distinct preference for sugarcane by
the smallholder farmers, while medium and large farmers preferred soybean,
chickpea and pigeon pea (Table 5.6). Although there were more than 15 types of crops
grown by the farmers in the region, which occupied less than 5% of the cropped area
each.
Table 5.6: Cropping pattern of sample farmers in Maharashtra
Crops % of gross cropped area
Smallholders (<5 acres)
Medium farmers (5-10 acres)
Large farmers (>10 acres)
Overall
Sugarcane 45% 10% 12% 25%
Soybean 21% 38% 35% 29%
Chickpea 11% 19% 13% 15%
Sorghum 6% 5% 13% 8%
Cotton 6% 4% 3% 5%
Wheat 4% 6% 3% 4%
Pigeon Pea 3% 10% 5% 5%
Others* 4% 8% 16% 9%
*include green gram, cowpea, horse gram, turmeric, black gram, brinjal, garlic, maize, papaya,
amaranthus, etc.
The perusal of total production and marketed surplus of these farmers presented in
Table 5.7 shows that out of these major crops grown, only sorghum is retained for
home consumption by all the farmers. Other crops are sold almost completely. Fig 5.3
exhibits the selling pattern of the commodities after harvest by the smallholder
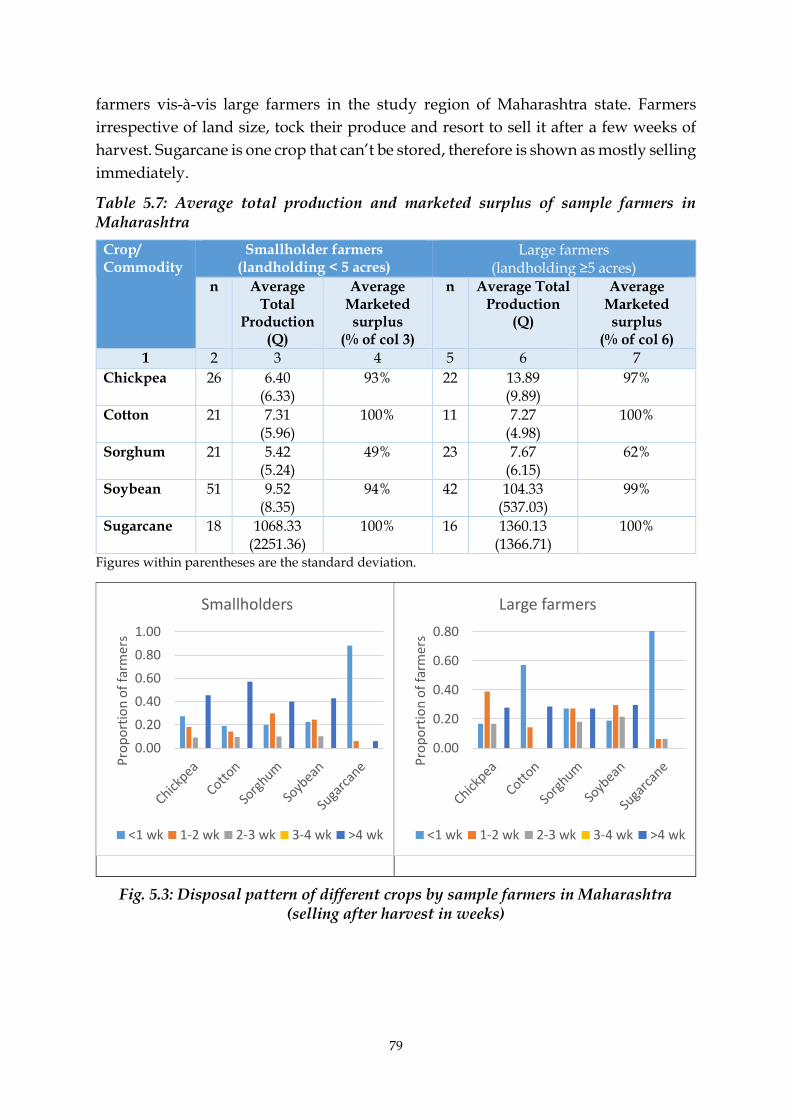
79
farmers vis-à-vis large farmers in the study region of Maharashtra state. Farmers
irrespective of land size, tock their produce and resort to sell it after a few weeks of
harvest. Sugarcane is one crop that can’t be stored, therefore is shown as mostly selling
immediately.
Table 5.7: Average total production and marketed surplus of sample farmers in Maharashtra
Crop/ Commodity
Smallholder farmers (landholding < 5 acres)
Large farmers (landholding ≥5 acres)
n Average Total
Production (Q)
Average Marketed
surplus (% of col 3)
n Average Total Production
(Q)
Average Marketed
surplus (% of col 6)
1 2 3 4 5 6 7
Chickpea 26 6.40 (6.33)
93% 22 13.89 (9.89)
97%
Cotton 21 7.31 (5.96)
100% 11 7.27 (4.98)
100%
Sorghum 21 5.42 (5.24)
49% 23 7.67 (6.15)
62%
Soybean 51 9.52 (8.35)
94% 42 104.33 (537.03)
99%
Sugarcane 18 1068.33 (2251.36)
100% 16 1360.13 (1366.71)
100%
Figures within parentheses are the standard deviation.
Fig. 5.3: Disposal pattern of different crops by sample farmers in Maharashtra (selling after harvest in weeks)
0.00
0.20
0.40
0.60
0.80
Pro
po
rtio
n o
f fa
rme
rs
Large farmers
<1 wk 1-2 wk 2-3 wk 3-4 wk >4 wk
0.00
0.20
0.40
0.60
0.80
1.00
Pro
po
rtio
n o
f fa
rmer
s
Smallholders
<1 wk 1-2 wk 2-3 wk 3-4 wk >4 wk

80
The selling behaviour of smallholder farmers in Maharashtra varies distinctly. Table
5.8 shows that the proportion of smallholder farmers selling the major commodities
in e-NAM mandis is significantly lower than that of large farmers. Almost 30-40% of
sampled smallholders sold their produce outside the mandi. In the region,
smallholder farmers realized better farm gate prices outside the mandi. While the
trend inverse in case of large farmers, who received better prices in the mandi. Besides,
smallholder farmers also received a lower price for the same commodity in the mandi
as compared to that of large farmers.
Table 5.8: Commodity disposal pattern and price received by the sample farmers in Maharashtra
Commodity
% of total farmers
selling respective
crops in e-NAM
mandi (n)
Selling price in mandi Selling price outside
mandi*
Avg.Price (₹/q)
Range
(₹/q)
Avg.Price (₹/q)
Range
(₹/q)
Smallholder farmers (landholding <5 acres)
Chickpea 61% (12) 3617 2400-4300 3667 2900-4000
Cotton 67% (14) 4907 3800-6000 4967 4000-5400
Sorghum 92% (10) 1810 1600-2700 - -
Soybean 59% (29) 3155 2500-5400 3211 2800-3900
Large farmers (landholding ≥5 acres)
Chickpea 81% (17) 3765 2800-5000 3250 3200-3400
Cotton 100% (11) 4850 3200-5400 - -
Sorghum 89% (13) 2008 1400-3900 1700 1600-1800
Soybean 86% (38) 3228 2700-5000 2825 3000-3800
*Outside mandi includes selling to village traders or in local market
5.2.3 Cropping pattern and marketed surplus in Rajasthan
Agriculture in Rajasthan is highly diversified. The survey conducted in Kota district
of Rajasthan revealed that most of the farmers are smallholders, but they cultivate
more than 20 types of crops. Among them, major crops are- paddy, wheat, soybean,
mustard, and garlic, which together occupied 85% of the gross cropped area. With
little variation, these crops are preferred by all the farmers in the region (Table 5.9).
The perusal of total production and marketed surplus of the sample farmers are
presented in Table 5.10. It is evident that except wheat, for all other crops grown by
the farmers are mainly sold, with marketed surplus more than 90%. Wheat being the
staple cereal, about 50% of the produce is retained by the households for home
consumption.

81
Table 5.9: Cropping pattern of sample farmers in Rajasthan
Crops % of gross cropped area
Smallholders (<5 acres)
Medium farmers (5-10 acres)
Large farmers (>10 acres)
Overall
Wheat 29% 32% 32% 30%
Soybean 25% 17% 20% 23%
Paddy 10% 11% 34% 14%
Mustard 14% 11% 3% 12%
Garlic 6% 7% 8% 6%
Chickpea 4% 13% -- 5%
Black gram 3% 7% 1% 3%
Others* 9% -- -- 6%
*include Coriander, Barley, Tomato, Spinach, Cauliflower, Jowar, Cabbage, Maize, Groundnut, Onion,
Potato, Green Gram, Chilli, Okra, Marigold, Linseed, etc.
Table 5.10: Average total production and marketed surplus of sample farmers in Rajasthan
Crop/ Commodity
Smallholder farmers (landholding < 5 acres)
Large farmers (landholding ≥5 acres)
n Average Total
Production (Q)
Average Marketed
surplus (% of col 3)
n Average Total Production
(Q)
Average Marketed
surplus (% of col 6)
1 2 3 4 5 6 7
Garlic 40 17.99 (11.56)
97% 15 31.40 (22.78)
96%
Mustard 47 15.35 (18.83)
98% 10 18.70 (10.87)
90%
Paddy 24 38.83 (23.23)
98% 9 68.28 (64.08)
99%
Soybean 62 12.50 (16.06)
84% 10 29.00 (27.48)
83%
Wheat 84 45.10 (53.83)
52% 18 73.75 (73.79)
45%
Figures within parentheses are the standard deviation.
Moreover, there is a distinct difference in the disposal pattern of these commodities
between smallholder farmers and large farmers. Almost 40-50% of smallholder
farmers sell their produce within a week after harvest, while large farmers retain it
back to sell later avoiding the glut situation in the market (Fig 5.4). However, there is
a silver line in the selling behaviuor of the farmers, which has not been seen in any
other states in India. All the farmers, irrespective of farm size category, they sell most
of their harvest in APMC mandi only, except for some green vegetables (Table 5.11).
Moreover, there is a huge variation in the price realization by the farmers for different

82
commodities. In some commodities, the average selling price is higher for smallholder
farmers, while in commodities like paddy and wheat, large farmers got a better price.
Fig. 5.4. Disposal pattern of different crops by sample farmers in Rajasthan (selling after harvest in weeks)
Table 5.11: Commodity disposal pattern and price received by the sample farmers in Rajasthan
Commodity
% of total farmers
selling respective crops
in e-NAM mandi (n)
Selling price in
mandi
Selling price outside
mandi*
Avg.Price (₹/q)
Range
(₹/q)
Avg.Price (₹/q)
Range
(₹/q)
Smallholder farmers (landholding <5 acres)
Garlic 100% (38) 2693 200-6000 - -
Mustard 100% (44) 3140 2500-3600 - -
Paddy 100% (23) 2291 2000-3000 - -
Soybean 100% (60) 3178 1500-7000 - -
Wheat 100% (79) 1647 1400-3000 - -
Large farmers (landholding ≥5 acres)
Garlic 100% (14) 1336 500-8000 - -
Mustard 100% (9) 2900 1500-3600 - -
Paddy 100% (9) 2333 2000-3000 - -
Soybean 100% (10) 2765 2500-3500 - -
Wheat 100% (17) 2708 - - -
*Outside mandi includes selling to village traders or in local market
5.2.4 Cropping pattern and marketed surplus in Telangana
Telangana falls under semi-arid tropics. The survey was conducted in the Rangareddy
district around Shadnagar e-NAM mandi. The farmers in the study area cultivated
several crops, however, two crops- maize and cotton dominated the cropping pattern
0.00
0.20
0.40
0.60
Pro
po
rtio
n o
f fa
rme
rs
Smallholders
<1 wk 1-2 wk 2-3 wk 3-4 wk >4 wk
0.00
0.20
0.40
0.60
Pro
po
rtio
n o
f fa
rmer
s
Large farmers
<1 wk 1-2 wk 2-3 wk 3-4 wk >4 wk

83
(Table 5.12). Paddy is the third most important crop. These 3 crops are cultivated by
almost all the farmers in the region.
Table 5.12: Cropping pattern of sample farmers in Telangana
Crops % of gross cropped area
Smallholders (<5 acres)
Medium farmers (5-10 acres)
Large farmers (>10 acres)
Overall
Maize 52% 32% 37% 44%
Cotton 35% 58% 48% 43%
Paddy 8% 8% 7% 8%
Tomato 1% 1% 4% 2%
Chilli 1% 1% 4% 1%
Others* 3% 0% 0% 2%
*include red gram, sorghum, horse gram, okra, ridge guard, chickpea, green pea.
The perusal of total production and marketed surplus of the sample farmers given in
Table 5.13 indicated that cotton and maize, both the crops are grown by the farmers
only for marketing purposes. While small farmers keep about two-third of paddy
produced, as compared to 25% by the large farmers. Interestingly, large farmers have
a high variation in the total production of these 3 crops, which may be due to variation
in landholding size.
Table 5.13: Average total production and marketed surplus of sample farmers in Telangana
Crop/ Commodity
Smallholder farmers (landholding < 5 acres)
Large farmers (landholding ≥5 acres)
n Average Total
Production (Q)
Average Marketed
surplus (% of col 3)
n Average Total Production
(Q)
Average Marketed
surplus (% of col 6)
1 2 3 4 5 6 7
Cotton 52 11.94 (13.93)
100% 24 38.23 (45.97)
100%
Maize 59 15.07 (30.89)
90% 21 38.74 (67.12)
100%
Paddy 25 22.75 (24.33)
35% 10 30.80 (20.78)
75%
Figures within parentheses are the standard deviation.
The selling behaviour of the farmers in the study region of Telangana state has
reflected a unique feature. Here, smallholder farmers have shown better maturity than
their counterparts. As some of the smallholders kept some stock to sell their produce
after 2-3 weeks of harvest. Contrastingly, all the large farmers in the region sold their
stock of maize, cotton as well as paddy immediately after harvest. It may be due to
the region that these farmers realized better prices at the time of harvest as compared
to the previous year. Another important feature observed in Telangana was

84
smallholder farmers realized a better price for their produce in the mandi as compared
to that of large farmers. However, when they sold the commodity outside mandi, then
large farmers had better bargaining power than those of smallholders (Table 5.14).
Apart from this, the majority of the cotton growers sold their stock outside the mandi.
For the other two crops, mandi was the main market place for more than 50% of the
farmers.
Fig. 5.5: Disposal pattern of different crops by sample farmers in Telangana (selling
after harvest in weeks)
Table 5.14: Commodity disposal pattern and price received by the sample farmers in Telangana
Commodity
% of total farmers
selling respective
crops in e-NAM mandi
(n)
Selling price in
mandi
Selling price outside
mandi*
Avg.Price (₹/q)
Range
(₹/q)
Avg.Price (₹/q)
Range
(₹/q)
Smallholder farmers (landholding <5 acres)
Cotton 35% (15) 4830 2100-6000 5204 4000-6000
Maize 76% (32) 1461 700-1700 1490 1200-1800
Paddy 55% (6) 1567 1300-1750 1530 1300-1800
Large farmers (landholding ≥5 acres)
Cotton 13% (3) 4267 2000-5400 5036 1600-5500
Maize 59% (10) 1489 1300-1700 1543 1200-1700
Paddy 67% (6) 1467 1250-1600 1483 1350-1600
*Outside mandi includes selling to village traders or in local market
From the above-mentioned observations, it may be concluded that the smallholder
participation in the e-NAM mandis has considerably improved, when we compare the
literature. Although, it is difficult to ascertain the causality relationship from the
current dataset. While selling through traders are the second most preferred channel
0.00
0.20
0.40
0.60
0.80
Maize Cotton PaddyPro
po
rtio
n o
f fa
rme
rs
Smallholder farmers
<1 wk 1-2 wk 2-3 wk >4 wk
0.80
0.90
1.00
Maize Cotton PaddyP
rop
ort
ion
of
farm
ers
Large farmers
<1 wk 1-2 wk 2-3 wk >4 wk
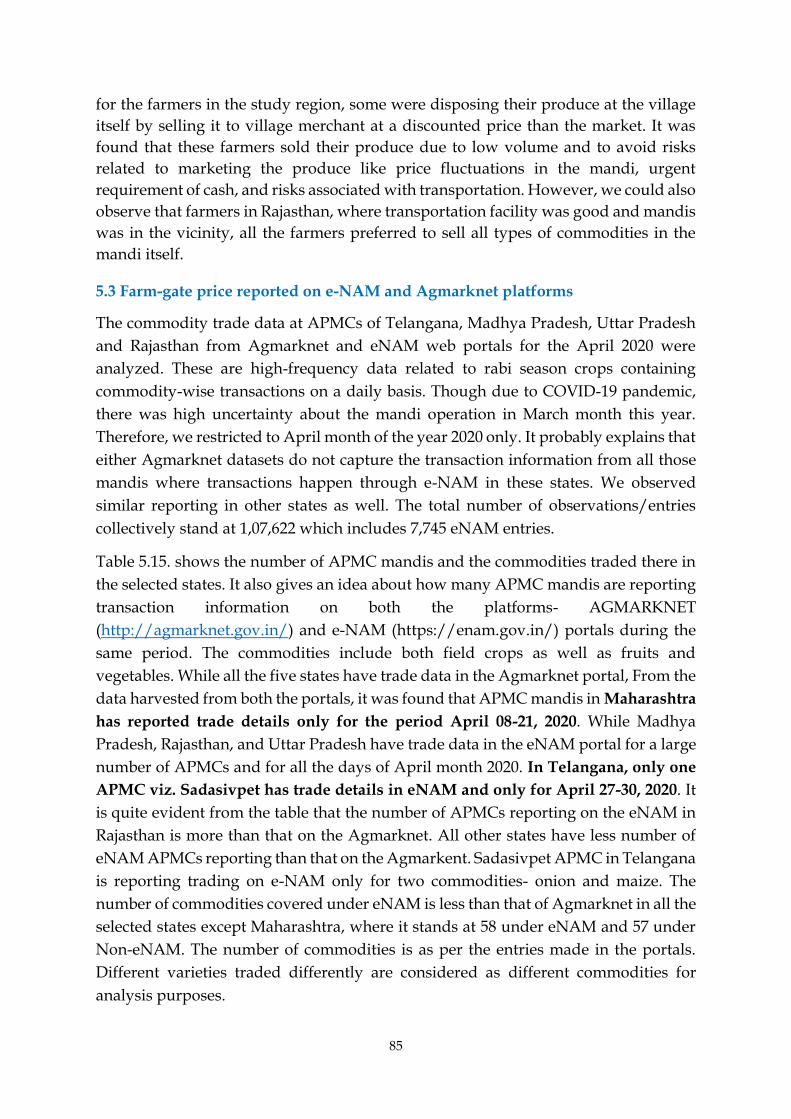
85
for the farmers in the study region, some were disposing their produce at the village
itself by selling it to village merchant at a discounted price than the market. It was
found that these farmers sold their produce due to low volume and to avoid risks
related to marketing the produce like price fluctuations in the mandi, urgent
requirement of cash, and risks associated with transportation. However, we could also
observe that farmers in Rajasthan, where transportation facility was good and mandis
was in the vicinity, all the farmers preferred to sell all types of commodities in the
mandi itself.
5.3 Farm-gate price reported on e-NAM and Agmarknet platforms
The commodity trade data at APMCs of Telangana, Madhya Pradesh, Uttar Pradesh
and Rajasthan from Agmarknet and eNAM web portals for the April 2020 were
analyzed. These are high-frequency data related to rabi season crops containing
commodity-wise transactions on a daily basis. Though due to COVID-19 pandemic,
there was high uncertainty about the mandi operation in March month this year.
Therefore, we restricted to April month of the year 2020 only. It probably explains that
either Agmarknet datasets do not capture the transaction information from all those
mandis where transactions happen through e-NAM in these states. We observed
similar reporting in other states as well. The total number of observations/entries
collectively stand at 1,07,622 which includes 7,745 eNAM entries.
Table 5.15. shows the number of APMC mandis and the commodities traded there in
the selected states. It also gives an idea about how many APMC mandis are reporting
transaction information on both the platforms- AGMARKNET
(http://agmarknet.gov.in/) and e-NAM (https://enam.gov.in/) portals during the
same period. The commodities include both field crops as well as fruits and
vegetables. While all the five states have trade data in the Agmarknet portal, From the
data harvested from both the portals, it was found that APMC mandis in Maharashtra
has reported trade details only for the period April 08-21, 2020. While Madhya
Pradesh, Rajasthan, and Uttar Pradesh have trade data in the eNAM portal for a large
number of APMCs and for all the days of April month 2020. In Telangana, only one
APMC viz. Sadasivpet has trade details in eNAM and only for April 27-30, 2020. It
is quite evident from the table that the number of APMCs reporting on the eNAM in
Rajasthan is more than that on the Agmarknet. All other states have less number of
eNAM APMCs reporting than that on the Agmarkent. Sadasivpet APMC in Telangana
is reporting trading on e-NAM only for two commodities- onion and maize. The
number of commodities covered under eNAM is less than that of Agmarknet in all the
selected states except Maharashtra, where it stands at 58 under eNAM and 57 under
Non-eNAM. The number of commodities is as per the entries made in the portals.
Different varieties traded differently are considered as different commodities for
analysis purposes.

86
Table 5.15: Number of APMCs and commodities traded on eNAM and Non-e-NAM in selected states during April 2020
State eNAM Non-e-NAM
No. of APMCs No. of commodities
No. of APMCs No. of commodities
Madhya Pradesh 26 24 249 64
Maharashtra 44 58 57 57
Rajasthan 149 44 116 58
Telangana 1 2 32 32
Uttar Pradesh 85 66 232 104
Grand Total 304 107 679 135
The entries were processed to find how many entries are common under both the
portals w.r.t. date, APMC, and commodity. So, out of 1,07,622 entries, only 3,269
entries were found to be common, i.e., a particular commodity on a day has been
traded in an APMC on both eNAM and Non-eNAM platforms. There are 209 APMCs
in all in the selected states which are trading 129 commodities under both eNAM and
Non-eNAM platforms as reported in Agmarknet and eNAM portals. A maximum
number of commodities are reported from Uttar Pradesh with 54 in these portals.
Here, fruits and vegetables are also traded which is increasing the number. The
detailed list of APMCs trading under both the platforms, only under eNAM, and only
under Non-eNAM are shown in Annexure VIII. Similarly, the commodities trading
under both the platforms, only under eNAM, and only under Non-eNAM are shown
in Annexure IX. As already mentioned, in Telangana only one APMC, i.e., Sadasivpet
APMC is showing trading of Onion and Maize under both the platforms.
Table 5.16: Number of common APMCs and traded commodities between eNAM and Non-eNAM platforms in selected states during April 2020
State No. of APMCs No. of commodities
Madhya Pradesh 23 17
Maharashtra 13 27
Rajasthan 95 29
Telangana 1 2
Uttar Pradesh 77 54
Grand Total 209 129
Though an APMC is trading under eNAM, it doesn't need to be trading all the eNAM
listed commodities. It was attempted to identify the commodities which are being
traded under eNAM by the maximum number of eNAM APMCs in each of the
selected states. Figure 5.6 shows the top 10 commodities in terms of percent of APMCs
trading under eNAM in the selected states. It may be noted that we could not find any
regular transaction of any commodity in e-NAM mandis of Telangana state. In other

87
states, few commodities are commonly traded in almost all the e-NAM and non-e-
NAM mandis. In Uttar Pradesh, the state with the maximum number of APMC
mandis integrated with e-NAM has mostly green vegetables which have been
reported to be traded commonly in all the e-NAM mandis.
A. Madhya Pradesh
B. Maharashtra
C. Rajasthan
D. Uttar Pradesh
Fig. 5.6: Top 10 Commodities traded by majority of APMCs under eNAM in selected states, April 20203
The daily modal price of major commodities that are traded in both eNAM as well as
non-eNAM platforms are compared and presented as Box and whisker plots for the
selected states (Figures 5.7). In Madhya Pradesh, the average of the daily modal price
(ADMP) for lentil is found to be higher in eNAM than Non-eNAM during April 2020,
whereas for other commodities, it is less. In Maharashtra, tur/red gram and soybean
have higher ADMP under eNAM. In Rajasthan, the ADMP is found to be higher for
barley, moong/green gram and mustard under eNAM. In Telangana, non-eNAM had
3 Pulses mentioned in the report are traded as whole, unless stated otherwise
92%
27%
27%
27%
27%
23%
23%
15%
15%
15%
Wheat
Lentil
Mustard
Bengal Gram (Split)
Red Gram
Maize
Soyabean
Green Gram
Bengal Gram-Desi
Black Gram
61%
59%
48%
43%
39%
34%
18%
18%
16%
11%
Wheat
Red Gram
Bengal Gram (Split)
Soyabean
Jowar (Sorghum)
Maize
Bengal Gram-Desi
Green Gram
Bajra(Pearl Millet)
Onion Red
43%
42%
19%
18%
7%
7%
7%
6%
6%
5%
Wheat
Mustard
Barley (Jau)
Bengal Gram (Split)
Green Gram
Guar
Taramira
Bajra (Pearl Millet)
Bengal Gram-Desi
Cumin Seed
46%
45%
45%
41%
41%
36%
33%
32%
31%
26%
Tomato
Wheat
Cucumber
Bottle gourd
Brinjal
Green Chilli
Potato
Cauliflower
Ladies Finger
Pumpkin
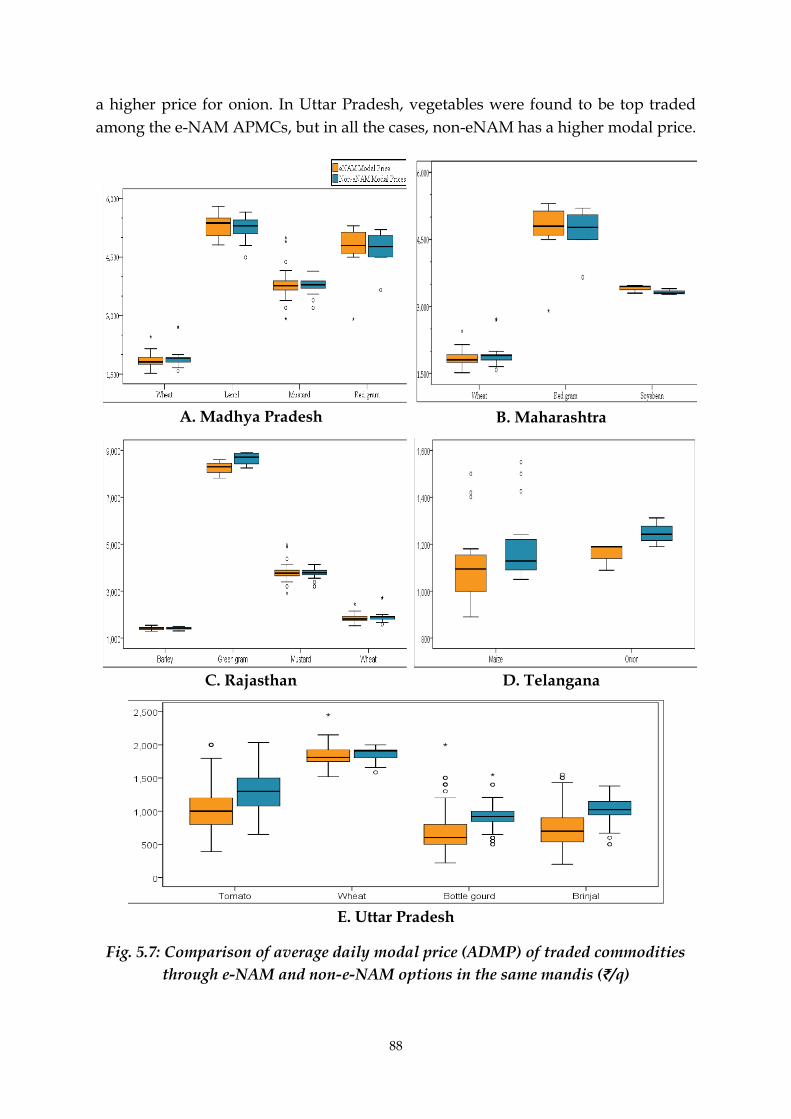
88
a higher price for onion. In Uttar Pradesh, vegetables were found to be top traded
among the e-NAM APMCs, but in all the cases, non-eNAM has a higher modal price.
A. Madhya Pradesh
B. Maharashtra
C. Rajasthan
D. Telangana
E. Uttar Pradesh
Fig. 5.7: Comparison of average daily modal price (ADMP) of traded commodities
through e-NAM and non-e-NAM options in the same mandis (₹/q)

89
An independent sample t-test was used to test the difference in mean value of average
daily modal price (ADMP) under eNAM and non-eNAM for major commodities. The
p-value in the case of mustard in Rajasthan and all major commodities in Uttar
Pradesh viz, bottle gourd, brinjal, tomato, and wheat is less than 0.05 (p<.05). It
indicates a statistically significant difference in ADMP between eNAM and non-
eNAM (Table 5.17). Levene’s test for equality of variances shows that variance
between the two groups i.e., eNAM and non-eNAM are equal for wheat in Rajasthan
and tomato in Uttar Pradesh (p>.05).
Table 5.17: Average of daily modal price of traded commodities under eNAM and Non-eNAM mandis during April 2020
Commodity eNAM Non-eNAM
n* Average of daily
modal Price
(₹/q)
SD n* Average of daily
modal Price (₹/q)
SD
Madhya Pradesh
Lentil 6 4935 95.66 13 4868 180.07
Mustard 8 3532 359.16 19 3567 271.01
Tur (RG) 5 4334 807.29 7 4965 1531.03
Wheat 24 1801 99.55 50 1816 90.30
Maharashtra
Tur (RG) 6 5044 300.46 7 4893 280.15
Soyabean 3 3407 92.92 6 3371 74.86
Wheat 2 1782 26.16 6 1804 105.38
Rajasthan
Barley (Jau) 38 1414 62.18 49 1408 54.40
Moong (GG) 15 8112 663.84 56 8029 775.00
Mustard 99 3802 203.73 141 3789 127.69
Wheat 79 1749 113.30 99 1790 73.11
Telangana
Onion 3 1156 57.74 3 1248 61.70
Uttar Pradesh
Bottle gourd 203 693 258.05 271 934 160.03
Brinjal 195 741 269.96 271 1037 153.85
Tomato 244 994 330.39 323 1305 275.10
Wheat 183 1856 75.40 197 1925 84.48
RG: Red Gram, GG: Green Gram; n*: Number of observations
In all these commodities, the ADMP under eNAM is significantly less than that in non-
eNAM. For instance, in the case of wheat in Rajasthan, the ADMP is ₹1,749/q under
eNAM and ₹1,790 under non-eNAM. Similarly, the difference in the case of vegetables
in Uttar Pradesh is quite high which is up to ₹311/q less under eNAM as in the case
of tomato. The rest of the commodities in each state has a statistically insignificant

90
difference in ADMP (Annexure X). The lower ADMP realization could be attributed
to various factors including the participation of the same traders in the bidding
process, thereby, not promoting competition among the buyers.
From the above discussion based on farmers’ survey as well as analysis of transaction
data reported on e-NAM portal and that on Agmarknet portal, it may be concluded
that the expected price advantage through e-NAM is not yet realized in a significant
and consistent manner in all the e-NAM mandis and all the states. Secondly, although
the survey was conducted in close vicinity of the prominent APMC mandi which is
integrated to e-NAM since the last 3-4 years in 4 states, still a significant number of
smallholder farmers are out of this transformation in the marketing system. This may
be due to either the incentives offered by participating in the e-NAM is significant
enough to trigger interest among them, or they are almost unaware of the benefits
being offered through e-NAM trade. Some e-NAM mandis, particularly in Uttar
Pradesh has shown trading almost all kinds of green vegetables, standardization, and
grading of which is currently a challenging task. In the absence of that the trade is
expected to be limited by the local traders only. This may be the reason that price
outside e-NAM is significantly higher for these vegetables in the same mandis. On the
other hand, staple crops such as cereals and pulses provide less incentive for farmers
to commercialize than high-value crops such as fruits and vegetables. This is because
there is little product differentiation that fetches premium prices (Berdegué, 2002;
Hellin et al., 2009). Still, the commercialization of staple crops is necessary to facilitate
shifts away from a semi-subsistence system to market-based production of high-value
commodities (Barrett, 2008). It is also possible that when the scope of any intervention
is broadened to the whole community, only very few farmers take full advantage of
the intervention while most farmers did not, resulting in an overall negative pattern
of results. Therefore, to extend the full benefit of the structural changes introduced in
the agricultural market in terms of e-NAM, there is a need for revisiting of the
implementation process as well as bringing some more additional features into the
system in the interest of smallholder farmers in India.


91
Chapter 6
Conclusions and Policy Recommendations
Agricultural markets are governed by the Agricultural Produce Market Committee
(APMC) in most of the states in India. It is regulated by the Agricultural Produce
Markets Regulation Acts (APMRA). Over the years, several reforms have been
introduced in the APMC Act, the most important was the APMC Model Act (2003).
However, the adoption of these reforms has been highly skewed across the states.
Although agriculture and agricultural marketing is a state subject, the GoI decided to
create a national agriculture market (NAM) by integrating all the existing APMCs
markets in the country through a common electronic platform named e-NAM. The e-
NAM was launched in July 2016 and by end of the year, 250 APMC mandis across 10
states were integrated to the e-NAM platform, the number further increased to 1000.
The e-NAM is a compulsory delivery based trading platform, which enables the
farmers to realize the best possible price. In order to understand the effectiveness of
e-NAM, particularly on the smallholders' participation and price realization due to e-
NAM, the present study was conducted during 2017-2020 in 4 major states (Madhya
Pradesh, Maharashtra, Rajasthan and Telangana). The field survey was conducted in
two stages- first in 2017 and second in 2019. Besides, secondary data about
transactions, live trading on e-NAM, and prices of the commodities were collected
from the websites, https://agmarknet.gov.in/ and https://www.enam.gov.in/.
Status of e-NAM implementation in India
As of 15th May 2020, total 1000 APMC mandis across 18 states and 3 Union Territories
(UTs) have been integrated to the-e-NAM. Among different stakeholders, 1.28 lakhs
traders and 70,969 commission agents are registered in these E-NAM mandis to help
the transaction of 1005 registered FPOs and 1.66 crore registered farmers on the e-
NAM platform. As of 30 April 2020, a total trade volume of 3.41 crore metric tonnes &
37 lakh numbers (Bamboo & Coconut) worth approximately ₹ 1.0 lakh crore have been
recorded on the e-NAM platform. A total of 150 commodities have been identified to
be traded through e-NAM. The list includes almost all types of agricultural
commodities- from green leafy vegetables to tender coconut and flowers like gladiolus
and carnation. On the other hand, more than 5 quality parameters have been identified
as essential to be assayed to categorize the commodity into 3 different grades before
trading on e-NAM.
Preparedness of e-NAM mandis
The level of preparedness in implementing various components of e-NAM in the
states of Madhya Pradesh, Maharashtra, Rajasthan, and Telangana were studied.
These components were the generation of Unique Lot ID at entry gate, sampling from
heap/lot, e-auction, assaying, best price-SMS sent to the farmers, electronic
weighments, generation of sale receipt, online payment and permit/ gate exit, etc. It

92
was observed that a unique lot ID is generated in most of the cases in these mandis.
But, sampling of a lot is being done in a limited number. These mandis are not well
equipped with assaying machines and technical manpower to conduct assaying of all
the lots. With the given facilities, it is very difficult to assay all the lots even during
normal season and enter the information in the portal before bidding. During the
second stage of the survey in 2019, traders were bidding on the e-NAM platform after
personally verifying the lots of major commodities in the mandis and only for those
farmers who were interested to trade through e-NAM. Regarding online payment,
most of the farmers and traders are not in favour of this. Normally, farmers need cash
to make payment for transportation and/or sundry purchases from the market.
Though on the insistence of market authorities, traders route partial payment through
an online system by NEFT/RTGS/IMPS.
Interestingly, despite above operational challenges, when the daily transaction on e-
NAM platform in the year 2017 was analyzed for the 4 states, it was found that large
number (40 to 200 types, including different varieties of the same commodity) and
volume of commodities were reported as traded through e-NAM in the selected states.
Besides, only 4-5 commodities constituted almost 50% of the total transaction volume
in each mandi. Further, there was a huge variation in the peak transacted volume of
the same commodity in a month across the mandis within the state. The reported data
on the e-NAM portal were also inconsistent in terms of arrival and traded quantity,
prices of traded commodities (minimum, maximum & modal values), etc. Such
information indicates that the transaction information has been manually entered into
the e-NAM portal after the offline transaction completed.
Live trading on e-NAM
The e-NAM is contemplated to streamline the uniform procedures across the
integrated markets, promoting transparency in an auction process, and access to a
nationwide market for the farmer, with prices commensurate with the quality of
his/her produce. It is necessary to have live trading through e-NAM platform for
which few aspects are pre-requisites: 1) uploading of detailed information (quality
and quantity without seller’s name) of each lot of the commodities on the e-NAM
portal, 2) specific pre-defined timing of opening and closing of each e-NAM mandi, 3)
intra-mandi trading licenses for the buyers/traders, 4) guarantee for quality disclosed
on the trading platform, 5) warehouses for pre- or post-trade stocking of the
commodity, etc. However, when live trading information in selected mandis was
observed during April 2020, several mismatch in information was found like several
mandis live trading through e-NAM portal, different trading hours for different
mandis and commodities, absence of quality specification of commodities traded, etc.
Benefits from participation of smallholders in e-NAM
The participation of smallholders in e-NAM mandi and the benefits realized in terms
of a better price for their produce was examined from field survey around one e-NAM
mandi in 4 selected states as well as through comparing the modal price of the

93
commodities reported on the e-NAM portal and that on AGMARKNET portal for the
April 2020 month. There was a clear difference in the selling pattern of the
commodities after harvest by the smallholder farmers vis-à-vis large farmers.
Moreover, the majority of smallholder farmers were found selling their major produce
in the e-NAM mandi, which might be due to the vicinity of the mandi to the farmers.
In some commodities, the average selling price was higher for smallholder farmers
inside mandi as compared to selling outside mandi. However, there was a negative
correlation between lot size and the traded price of the commodity, which reflects that
the smallholders normally received a lower price than the large farmers. Further, the
comparison of the average modal price of the same commodity traded in the same
APMC mandis through non-e-NAM (data collected from Agmarknet) and e-NAM
portals indicated no significant price advantage through e-NAM in all the states under
study. This may be due to the same and limited number of traders bidding for the
commodities through e-NAM as well as through open auction. Therefore, to extend
the full benefit of the structural changes introduced in the agricultural market in terms
of e- NAM, there is a need for revisiting the implementation process as well as
bringing some more additional features into the system in the interest of smallholder
farmers in India.
Policy recommendations for improving the effectiveness of e-NAM
A. Strategic level
1. The e-NAM should be managed completely as a separate business which shall be responsible for managing the unified electronic trading platform without any glitches, while each mandi should be treated as one of its clients on the pattern of hospitality aggregators such as OYO hotels or Ola/Uber taxi service.
2. Each e-NAM mandi should act as Strategic Business Unit (SBU) i.e. profit center which focuses on product offering and market segment. All the seller-farmers may be made a shareholder in this SBU according to their contribution in sale or share purchase. These mandis should be encouraged to create product differentiation & offering, and marketing plan.
3. All efforts should be made to reduce the role of traders and commission agents (CAs), who take away a major chunk of the values from the farmers and the mandis. The roles offered by the traders and CAs should be performed by the respective mandi itself.
4. Each e-NAM mandi should start with 100% online transaction with only 1 or 2 major commodities initially, and after gaining experience & expertise, it should expand to high value and perishable commodities.
5. All e-NAM mandis shall have essentially own or linked with WDRA accredited warehouses/cold storages according to the major commodities transacted in the mandi.

94
6. The e-NAM mandi should allow any bulk buyer with proper KYC without
having a trading license as well to have efficient price discovery in favor of farmers.
7. The e-NAM should be fully integrated with Artificial Intelligence and the Internet of Things (IoT) to provide real-time information as well as analytics to different stakeholders when and wherever s/he wants.
8. In the medium to long run, as the government intends to integrate 22,000 mandis including rural markets and APMC mandis, the strategy should be to create new mandis in the line of Smart Micro-Mandi* (brief about it is given at the end).
9. All the unit level (lot-wise) transaction data should be made accessible for academic and research purposes with proper registration.
B. Tactical level
1. Efforts should be made to develop a mobile app in the vernacular language which can be used by the farmer-sellers. Specific slot may be given to the farmers through the app, who intends to sell their commodities. The farmers may input the details of the lot on the mobile app well in advance before coming to the mandi.
2. All information related to mandi timing, online trading timings- opening and closing (commodity-wise, if it is different) should be standardized and well-publicized.
3. All e-NAM mandis should be LIVE at a specific time on all working days, even if there is no seller on a particular day. Prior notification shall be mandatory for the closure of the mandi.
4. Within the state, all e-NAM mandis should have the same opening and closing timing. However, to manage the arrivals, different commodities may be given different opening and closing hours for trade on e-NAM platform.
5. The e-NAM mandi should start a campaign for registration of all the prospective farmer-sellers during lean season.
C. Operational level
1. Entry Gate receipt/ Lot ID may be automatically generated on arrival by QR code scanning, as the details about the commodities and lots along with the grade quality might have been entered into the system through the mobile app.
2. There may be separate gate entry for those farmer-sellers who have not entered the lots’ details in the mobile app.
3. If the farmers bring some more commodities other than e-NAM tradable commodities, they may be allowed to sell conventionally i.e. offline.
4. Minimum quality specifications for each commodity to be traded through the e-NAM platform should be communicated to the farmers. The farmers shall be asked to declare their lots according to the grade standard on the mobile app.

95
5. On arrival in the mandi, random sampling should be carried out for the lots, and quality assaying should be done. Each farmer shall be rewarded with the Five-Star
Quality Rating System based on deviation from the self-declared quality of the commodities brought to the mandi. Continuous Excellent performers may be rewarded in annual function.
6. The details of the commodities/lots should be automatically and seamlessly uploaded on the e-NAM bidding platform. However, it shall be reflected on the trading platform only after physically approved by the mandi officials.
7. All possible commodities may be listed in the system and high priority commodities should appear on top in the given mandi. It will eliminate the possible error in the manual entering the name.
8. After awarding the highest bidder and ensuring the full payment to the sellers’ account, the commodities may be transported through third party logistic partners or if buyers wish, it may be kept in the warehouse safely on a storage charge basis.
*Smart Micro-Mandi (SMM): According to the estimate, India needs about 28,000
Smart Micro-Mandis to provide accessibility to all the farmer-producers. The four
basic pillars of the model are: 1) Proximity of the SMM to the farmer (proposed 5-6
km), 2) Assaying -based grading and mixing of the lot (milkization), 3)
Dematerialization & Pledge Financing (for instant partial payment to the farmers),
and 4) End-to-end digitization. Application of modern technologies like AI, IoT, Data
Science, Sensor-based imaging would make these micro-mandi smart. Inter-mandi or
national trading of agricultural commodity is only possible, if the quality of each lot
are assayed correctly and displayed on the portal. The brief of Smart Micro-Mandi can
be accessed on https://naarm.org.in/wp-
content/uploads/2018/09/E_Policy_Brief_SMM04082018.pdf.

96
References
Acharya, S.S. & Agarwal, N.L. (2009), Agricultural Marketing in India. New Delhi: Oxford
and IBH Publishing Co. Pvt. Ltd
Acharya, S.S. (2006), Agricultural Marketing Reforms: Status and Road Map. A Paper for
National Institute for Agricultural Marketing, Jaipur. For use by the Working Group
on Agricultural Marketing Reforms, Contract Farming and Agro Processing,
Constituted by the Sub-Committee of National Development Council, Government
of India. . Jaipur: National Institute for Agricultural Marketing.
Acharya, S.S. and N.L. Agarwal (2011), Agricultural Marketing in India, Fifth Edition,
Oxford and IBH Publishing Co., New Delhi, p.12.
Aker, J., and M. Fafchamps. (2015). Mobile Phone Coverage and Producer Markets:
Evidence from West Africa. World Bank Economic Review 29 (2): 262–92.
Barrett, C.B., 2008. Smallholder market participation: concepts and evidence from eastern
and southern Africa. Food Policy 33 (4), 299–317.
Bates, R. H. (2014). Markets and states in tropical Africa: The political basis of agricultural
policies. Berkley/London: University of California Press.
Berdegué, J., (2002). Learning to beat Cochrane’s treadmill. Public Policy, Markets and
Social Learning in Chile’s Small-Scale Agriculture. In: Leeuwis, C., Pyburn, R.
(Eds.), Wheelbarrows Full of Frogs: Social Learning in Rural Resource
Management, pp. 333–348.
Bhardwaj, M., and R. K. Singh. (2014) “India Targets Middlemen in Food Chain as Inflation
Bites.” Reuters. Available online at https://in.reuters.com/article/india-inflation-
farming/indiatargets-middlemen-in-food-chain-as-inflation-bites-
idINKBN0FG0H020140711.
Biglaiser, G., and J.W. Friedman. (1994). Middlemen as Guarantors of Quality. International
Journal of Industrial Organization 12 (4): 509–31.
Bisen JP & Ranjit Kumar. (2018) Agricultural marketing reforms and e-national agricultural
market (e-NAM) in India: a review, Agricultural Economics Research Review.
31(conf.issue): 167-176
Buxton, A., D. Seville, J. Shriver, P. Robbins, R. Best, and S. Ferris (2014). “Linking
Smallholder Farmers to Markets and the Implications for Extension and Advisory
Services | Agrilinks.” MEAS Disccusion Paper Series 4, USAID, Washington, DC.
Available online at https://agrilinks.org/library/linking-smallholderfarmers-markets-
and-implications-extension-and-advisory-services.
Chand R (2016) e-Platform for National Agricultural Market. Economic & Political Weekly
11(28): 15-18
Chand R and Singh J (2016) Study Report on Agricultural Marketing and Farmer Friendly
Reforms across Indian States and UTs. NITI Aayog, New Delhi.

97
Chand R. (2017). Doubling Farmers’ Income: Rationale, Strategy, Prospects, and Action
Plan. NITI Policy paper No. 1/2017. NITI Aayog, Government of India, New Delhi.
Chengappa, P. G., Arun, M., Yadava, C. G., & Kumar, H. M. (2012). IT Application in
Agricultural Marketing Service Delivery—Electronic Tender System in Regulated
Markets. Agricultural Economics Research Review, 25(conf), 359-372.
Courtois, P., and J. Subervie (2015). “Farmer Bargaining Power and Market Information
Services.” American Journal of Agricultural Economics 97:953–977. doi:
10.1093/ajae/aau051.
DFI (2017) Report of the Committee on Doubling Farmers’ Income, Vol IV, Post-production
interventions: Agricultural Marketing. Ministry of Agriculture & Farmers Welfare,
Government of India.
Draganska, M., D. Klapper, and S. B. Villas-Boas (2010). “A Larger Slice or a Larger Pie?
An Empirical Investigation of Bargaining Power in the Distribution Channel.”
Marketing Science 29:57– 74. doi: 10.1287/mksc.1080.0472.
Ebata A and Hernandez MA (2017) Linking smallholder farmers to markets on extensive and
intensive margins: Evidence from Nicaragua. Food Policy, 73: 34-44.
Fafchamps, M., and B. Minten. (2012). Impact of SMS-Based Agricultural Information on
Indian Farmers. World Bank Economic Review 26 (3): 383–414.
FAI (2019). Fertilizer statistics 2018-19. The Fertilizer Association of India, New Delhi.
GOI (2013) Final Report of Committee of State Ministers, In-charge of Agriculture
Marketing to Promote Reforms. Ministry of Agriculture, Government of India.
GOI (2020) Agriculture-farming and allied activities exempted from Lockdown. Press
Information Bureau, Government of India. 28-March-2020.
Goyal, Aparajita. (2010). “Information, Direct Access to Farmers, and Rural Market
Performance in Central India.” American Economic Journal: Applied Economics 2
(3): 22–45.
Hellin, J., Lundy, M., Meijer, M., (2009). Farmer organization, collective action and market
access in Meso-America. Food Policy 34 (1), 16–22
Jensen, Robert.( 2007). “The Digital Provide: Information (Technology), Market
Performance, and Welfare in the South Indian Fisheries Sector.” The Quarterly
Journal of Economics 122 (3): 879–924.
Jori, A., and J. Leach. 2002. Middlemen and the Allocation of Heterogeneous Goods.
International Economic Review 43 (2): 347–61.
Key, N., Sadoulet, E. and de Janvry, A. (2000). Transactions costs and agricultural household
supply response. American Journal of Agricultural Economics, 82(2), 245-259.
Lele, U. (1977). Cooperatives and the Poor: A Comparative Perspective. International
Cooperative Alliance.
Levi R, Rajan M, Singhvi S, and Zheng Y. (2002) The impact of unifying agricultural
wholesale markets on prices and farmers’ profitability. PNAS, 117(5): 2366-2371 (Feb
4, 2020).

98
Li, Y. (1998). Middlemen and Private Information. Journal of Monetary Economics 42 (1):
131–59.
Masters, A. (2008). Unpleasant Middlemen. Journal of Economic Behavior and Organization
68 (1): 73–86.
Mitchell, T.(2017) “Is Knowledge Power? Information and Switching Costs in Agricultural
Markets.” American Journal of Agricultural Economics, 99(5): 1307-1326. doi:
10.1093/ajae/aax035.
Mitra, S., D. Mookherjee, M. Torero, and S. Visaria. (2017) “Asymmetric Information and
Middleman Margins: An Experiment with Indian Potato Farmers.” Review of
Economics and Statistics. doi: 10.1162/REST_a_00699
Muto, M., and T. Yamano. 2009. The Impact of Mobile Phone Coverage Expansion on
Market Participation: Panel Data Evidence from Uganda. World Development 37
(12): 1887–96.
NCF (2007): Report of National Commission on Farmers, Department of Agriculture &
Cooperation, Ministry of Agriculture, Government of India.
Nigel Key, Elisabeth Sadoulet and Alain De Janvry. (2000). Transaction cost and household
supply response. American Journal of Agricultural Economics,82(2):245-259.
doi.org/10.1111/0002-9092.00022
PIB (July 31, 2015). Promotion of National Agricultural Market. Press Information Bureau.
Government of India. Available online at
https://pib.gov.in/newsite/PrintRelease.aspx?relid=123996
Purohit, P. (2013). Regulations of Agricultural Markets and Economic Performance: Evidence
from Indian States. PhD thesis submitted to the University of Manchester, United
Kingdom.
Ranjan R. (2017) Challenges to Farm Produce Marketing: A Model of Bargaining between
Farmers and Middlemen under Risk. Journal of Agricultural and Resource
Economics, 42(3): 386-405 .
Rao NC, Sutradhar R and Reardon T. (2017) Disruptive Innovations in Food Value Chains
and Small Farmers in India. Indian Journal of Agricultural Economics, 72(1): 24-48.
Riley, H. & Staatz, J. (1981), Food System Organisation Problems in Developing Countries.
Agricultural Development Council Report, Michigan State University, New York
ADC Report no. 23
Rubinstein, A., and A. Wollinsky. 1985. Equilibrium in a Market with Sequential Bargaining.
Econometrica 53: 1133–50.
Schultz, T.W. (1976), Transforming Traditional Agriculture: New York: Arno Press.
Van Raalte, C., and H. Webers. 1998. Spatial Competition with Intermediated Matching.
Journal of Economic Behavior & Organization 34: 477–88.

99
ANNEXURE
Annexure I: States’ score in terms of Agri Marketing and Farmer Friendly Reforms
Source: Chand and Singh (2016)
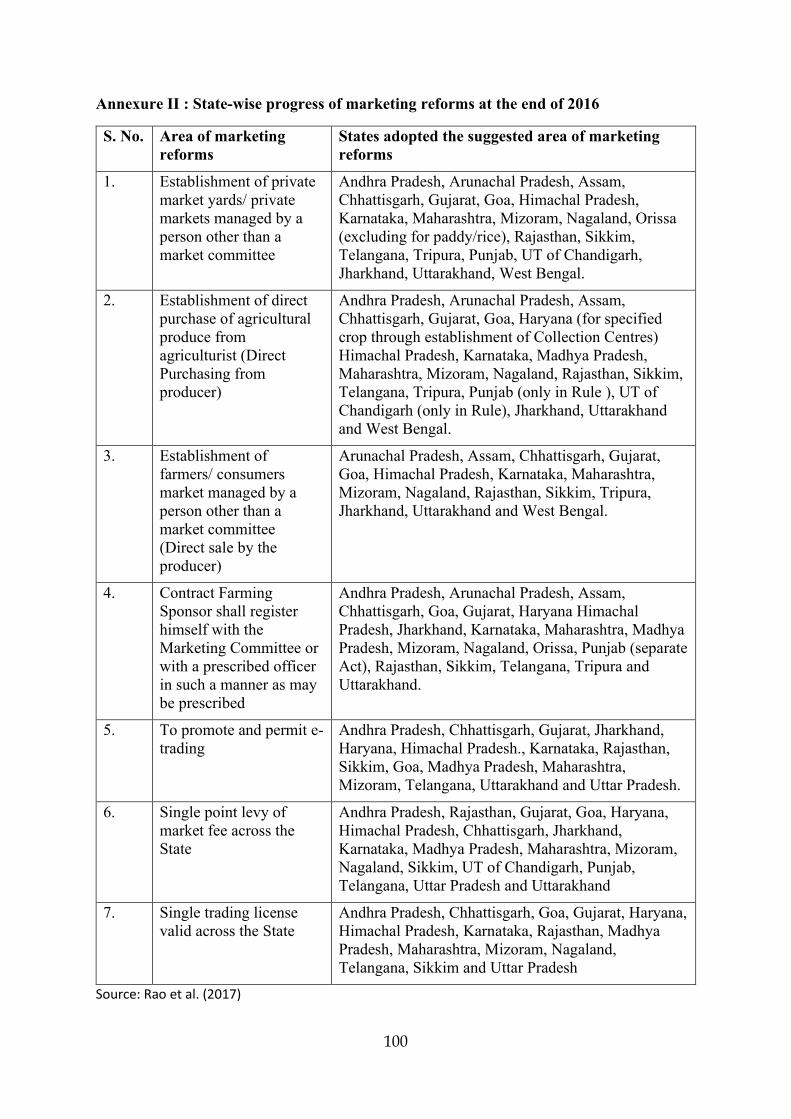
100
Annexure II : State-wise progress of marketing reforms at the end of 2016
Source: Rao et al. (2017)
S. No. Area of marketing reforms
States adopted the suggested area of marketing reforms
1. Establishment of private market yards/ private markets managed by a person other than a market committee
Andhra Pradesh, Arunachal Pradesh, Assam, Chhattisgarh, Gujarat, Goa, Himachal Pradesh, Karnataka, Maharashtra, Mizoram, Nagaland, Orissa (excluding for paddy/rice), Rajasthan, Sikkim, Telangana, Tripura, Punjab, UT of Chandigarh, Jharkhand, Uttarakhand, West Bengal.
2. Establishment of direct purchase of agricultural produce from agriculturist (Direct Purchasing from producer)
Andhra Pradesh, Arunachal Pradesh, Assam, Chhattisgarh, Gujarat, Goa, Haryana (for specified crop through establishment of Collection Centres) Himachal Pradesh, Karnataka, Madhya Pradesh, Maharashtra, Mizoram, Nagaland, Rajasthan, Sikkim, Telangana, Tripura, Punjab (only in Rule ), UT of Chandigarh (only in Rule), Jharkhand, Uttarakhand and West Bengal.
3. Establishment of farmers/ consumers market managed by a person other than a market committee (Direct sale by the producer)
Arunachal Pradesh, Assam, Chhattisgarh, Gujarat, Goa, Himachal Pradesh, Karnataka, Maharashtra, Mizoram, Nagaland, Rajasthan, Sikkim, Tripura, Jharkhand, Uttarakhand and West Bengal.
4. Contract Farming Sponsor shall register himself with the Marketing Committee or with a prescribed officer in such a manner as may be prescribed
Andhra Pradesh, Arunachal Pradesh, Assam, Chhattisgarh, Goa, Gujarat, Haryana Himachal Pradesh, Jharkhand, Karnataka, Maharashtra, Madhya Pradesh, Mizoram, Nagaland, Orissa, Punjab (separate Act), Rajasthan, Sikkim, Telangana, Tripura and Uttarakhand.
5. To promote and permit e-trading
Andhra Pradesh, Chhattisgarh, Gujarat, Jharkhand, Haryana, Himachal Pradesh., Karnataka, Rajasthan, Sikkim, Goa, Madhya Pradesh, Maharashtra, Mizoram, Telangana, Uttarakhand and Uttar Pradesh.
6. Single point levy of market fee across the State
Andhra Pradesh, Rajasthan, Gujarat, Goa, Haryana, Himachal Pradesh, Chhattisgarh, Jharkhand, Karnataka, Madhya Pradesh, Maharashtra, Mizoram, Nagaland, Sikkim, UT of Chandigarh, Punjab, Telangana, Uttar Pradesh and Uttarakhand
7. Single trading license valid across the State
Andhra Pradesh, Chhattisgarh, Goa, Gujarat, Haryana, Himachal Pradesh, Karnataka, Rajasthan, Madhya Pradesh, Maharashtra, Mizoram, Nagaland, Telangana, Sikkim and Uttar Pradesh

101
Annexure III: Production and market arrivals of major foodgrains, oilseeds & vegetables
Commodity Production
during 2016-17 (in ‘million
tonnes)
AGMARKNET arrivals
01/07/2016-30-06/2017 (in ‘000
tonnes)
AGMARKNET mandi arrivals
w.r.t. production (%)
Marketed surplus
ratio (%) Cereals 251.34 76.01 30 67 - 88 Pulses 18.67 5.68 30 86 – 95 Major oilseeds 30.02 9.32 31 71- 94 Major vegetables
87.90 28.35 32 71- 91
Source: DFI (2017)
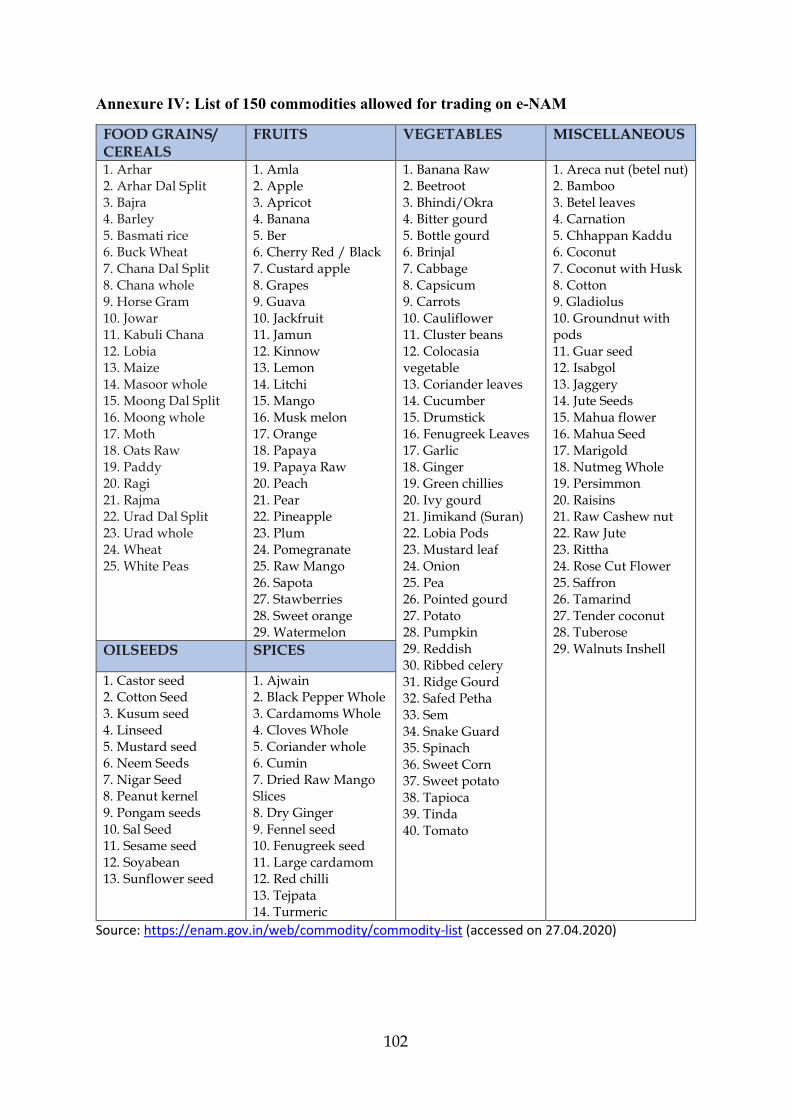
102
Annexure IV: List of 150 commodities allowed for trading on e-NAM
FOOD GRAINS/ CEREALS
FRUITS VEGETABLES MISCELLANEOUS
1. Arhar 2. Arhar Dal Split
3. Bajra 4. Barley
5. Basmati rice 6. Buck Wheat
7. Chana Dal Split
8. Chana whole 9. Horse Gram
10. Jowar 11. Kabuli Chana
12. Lobia 13. Maize
14. Masoor whole 15. Moong Dal Split
16. Moong whole
17. Moth 18. Oats Raw
19. Paddy 20. Ragi
21. Rajma 22. Urad Dal Split
23. Urad whole 24. Wheat
25. White Peas
1. Amla 2. Apple
3. Apricot 4. Banana
5. Ber 6. Cherry Red / Black
7. Custard apple
8. Grapes 9. Guava
10. Jackfruit 11. Jamun
12. Kinnow 13. Lemon
14. Litchi 15. Mango
16. Musk melon
17. Orange 18. Papaya
19. Papaya Raw 20. Peach
21. Pear 22. Pineapple
23. Plum 24. Pomegranate
25. Raw Mango
26. Sapota 27. Stawberries
28. Sweet orange 29. Watermelon
1. Banana Raw 2. Beetroot
3. Bhindi/Okra 4. Bitter gourd
5. Bottle gourd 6. Brinjal
7. Cabbage
8. Capsicum 9. Carrots
10. Cauliflower 11. Cluster beans
12. Colocasia vegetable
13. Coriander leaves 14. Cucumber
15. Drumstick
16. Fenugreek Leaves 17. Garlic
18. Ginger 19. Green chillies
20. Ivy gourd 21. Jimikand (Suran)
22. Lobia Pods 23. Mustard leaf
24. Onion
25. Pea 26. Pointed gourd
27. Potato 28. Pumpkin
29. Reddish 30. Ribbed celery
31. Ridge Gourd 32. Safed Petha
33. Sem
34. Snake Guard 35. Spinach
36. Sweet Corn 37. Sweet potato
38. Tapioca 39. Tinda
40. Tomato
1. Areca nut (betel nut) 2. Bamboo
3. Betel leaves 4. Carnation
5. Chhappan Kaddu 6. Coconut
7. Coconut with Husk
8. Cotton 9. Gladiolus
10. Groundnut with pods
11. Guar seed 12. Isabgol
13. Jaggery 14. Jute Seeds
15. Mahua flower
16. Mahua Seed 17. Marigold
18. Nutmeg Whole 19. Persimmon
20. Raisins 21. Raw Cashew nut
22. Raw Jute 23. Rittha
24. Rose Cut Flower
25. Saffron 26. Tamarind
27. Tender coconut 28. Tuberose
29. Walnuts Inshell OILSEEDS SPICES
1. Castor seed 2. Cotton Seed
3. Kusum seed 4. Linseed
5. Mustard seed 6. Neem Seeds
7. Nigar Seed 8. Peanut kernel
9. Pongam seeds
10. Sal Seed 11. Sesame seed
12. Soyabean 13. Sunflower seed
1. Ajwain 2. Black Pepper Whole
3. Cardamoms Whole 4. Cloves Whole
5. Coriander whole 6. Cumin
7. Dried Raw Mango Slices
8. Dry Ginger
9. Fennel seed 10. Fenugreek seed
11. Large cardamom 12. Red chilli
13. Tejpata 14. Turmeric
Source: https://enam.gov.in/web/commodity/commodity-list (accessed on 27.04.2020)

103
Annexure V: Essential quality parameters for assaying of the samples under e-NAM
A. MAJOR FOODGRAINS
Essential quality parameters
Permissible limit (maximum) for different quality parameters for Range-3 (lowest grade) commodities (% by weight)
Maize Paddy Bajra, Jowar, Ragi
Wheat, barley
Chana, Rajma
Arhar, Moong, Masoor, Urad, White peas
Moisture 16.0 20.0 16.0 14.0 14.0 14.0
Foreign matter 3.0 6.0 1.0 4.0 3.0 2.0
Admixture/Other edible grains
3.0 20.0 6.0 10.0 4.0 3.0
Immature & shrivelled 15.0 7.0 8.0 7.0 3.0
Damaged/Discoloured grains
8.0 10.0 7.0 7.0 5.0
Weevilled grains* 10.0 6.0 10.0 10.0 10.0
* % by count
Optional parameters: Uric acid, Aflatoxin, Protein content, Minimum test weight,
B. MAJOR OILSEEDS
Essential quality parameters
Permissible limit (maximum) for different quality parameters for Range-3 (lowest grade) commodities (% by weight)
Mustard seed
Soybean Peanut Kernel
Sunflower seed
Sesame seed
Oil content 36.0 13.0 22.0 35.0
Moisture 10.0 12.0 7.0 5.0 7.0
Foreign matter 4.0 3.0 2.0 6.0 2.0
Damaged seeds 5.0 7.0 5.0 6.0 3.0
Immature & shrivelled 4.0
Weevilled seeds* 5.0
Other edible seeds 1.0 6.0 20.0#
Argemone seeds Absent
Optional Allyl iso thiocynate
Green seed, Protein
Aflatoxins
* % by count #In case of sesame seeds, it is admixture of other varieties of the seed

104
C. MAJOR FRUITS
Essential quality parameters
Permissible limit (maximum) for different quality parameters for Range-3 (lowest grade) commodities (% by weight)
Apple Orange Pomegranate Mango Jackfruit
(i) Size (Diameter in mm of the equatorial section)
Upto 50 55-80 Upto 65
Size by weight (in gm) Up to 100
(ii) Defects (% by count) (… of total surface area)
- Dry Healed Hail (2-5 sq.cm) 20
- Russetting (2-5 sq.cm) 6
- Soft Patch (2-5 sq.cm) 6
- Cut skin/Bruising (10 to 30 mm)
20%
- Discoloration (0.5 to 5 sq cm)
10%
- Slight bruising/minor cut/ (0.5 to 2 sq cm)
10% 10%
- Irregular Shape & maturity development
6%
- Skin defects 10%
(iii) Range Acceptance 80% 85% 85% 80% 80%
D. TOP VEGETABLES
Essential quality parameters
Permissible limit for different quality parameters for Range- 1 & 3 (best to lowest) commodities
Onion (Range 13)
Potato (Range 13)
Tomato (Range 13)
(i) Defects (% by count) (Max)
- Cut (5-15mm long) 5.0 15.0
- Double split 2.0 Above 8.0
- Sprouted 2.0 Above 8.0
- Rooting 2.0 Above 8.0
- Cracks/cut (5 mm to 20mm) 5% >10% 2.0 >3.0
- Sunburn (for 1-3 sq.cm of surface area)
2.0 >3.0
- Greening (1-3 sq cm of total surface area)
5% >10%
- Holes 1.0 >2.0
- Mechanical injury 2.0 >3.0 2.0 >3.0
- Discolouration (Green /Green Top/ Blotchy) (for 1-4 sq.cm of surface area)
3.0 >5.0
(ii) Size (maximum diameter in mm of the equatorial section)
65 25 70 25 65 45
(iii) Range Acceptance 90% 80% 95% 85%

105
E. GREEN VEGETABLES
Essential quality parameters
Permissible limit for different quality parameters for Range- 1 & 3 (best to lowest) commodities
Bottle gourd (Range 13)
Brinjal (Range 13)
Cabbage (Range 13)
Cauliflower (Range 13)
Green Chillies (Range 13)
(i) Weight (Max) 750 gms <350 gms
(ii) Defects (% by count) (Max)
- shape/color & stains (1-4 sq cm of the surface area)
5.0 15.0
- rubbing and handling (1-4 sq cm of the surface area)
5.0 15.0
- Bruising/ Scars/ Scratches (1-3 sq cm of total surface area)
3.0 7.0 3.0 7.0
- Wooliness (1-10 sq cm of total surface area)
3.0 7.0
- Bruising (5-10 mm of total surface area)
3.0 7.0
- Colour (Including sun spots) (05-10 mm of total surface area)
3.0 7.0
- Burst Head 3.0 7.0
- Mechanical/ Physical Injury
3.0 7.0
(iii) Range Acceptance 95% 85% 95% 85%
95% 85%
95% 85%
95% 85%
Sampling: - (i) 5 % or minimum one container shall be randomly selected for sampling (ii) 10 Nos
shall be drawn from each selected container and shall be mixed homogenously , called as primary
sample (iii) 10 nos. shall be drawn from primary sample called as Laboratory sample.
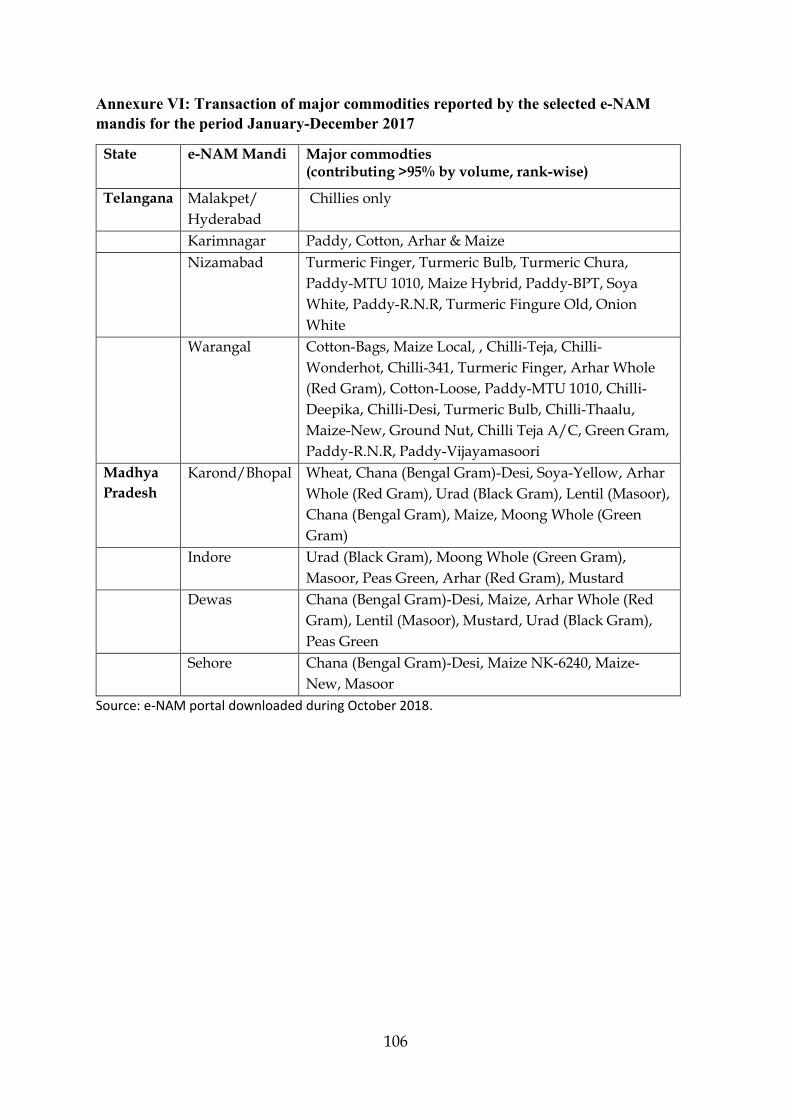
106
Annexure VI: Transaction of major commodities reported by the selected e-NAM mandis for the period January-December 2017
State e-NAM Mandi Major commodties (contributing >95% by volume, rank-wise)
Telangana Malakpet/
Hyderabad
Chillies only
Karimnagar Paddy, Cotton, Arhar & Maize
Nizamabad Turmeric Finger, Turmeric Bulb, Turmeric Chura,
Paddy-MTU 1010, Maize Hybrid, Paddy-BPT, Soya
White, Paddy-R.N.R, Turmeric Fingure Old, Onion
White
Warangal Cotton-Bags, Maize Local, , Chilli-Teja, Chilli-
Wonderhot, Chilli-341, Turmeric Finger, Arhar Whole
(Red Gram), Cotton-Loose, Paddy-MTU 1010, Chilli-
Deepika, Chilli-Desi, Turmeric Bulb, Chilli-Thaalu,
Maize-New, Ground Nut, Chilli Teja A/C, Green Gram,
Paddy-R.N.R, Paddy-Vijayamasoori
Madhya
Pradesh
Karond/Bhopal Wheat, Chana (Bengal Gram)-Desi, Soya-Yellow, Arhar
Whole (Red Gram), Urad (Black Gram), Lentil (Masoor),
Chana (Bengal Gram), Maize, Moong Whole (Green
Gram)
Indore Urad (Black Gram), Moong Whole (Green Gram),
Masoor, Peas Green, Arhar (Red Gram), Mustard
Dewas Chana (Bengal Gram)-Desi, Maize, Arhar Whole (Red
Gram), Lentil (Masoor), Mustard, Urad (Black Gram),
Peas Green
Sehore Chana (Bengal Gram)-Desi, Maize NK-6240, Maize-
New, Masoor
Source: e-NAM portal downloaded during October 2018.

107
Annexure VII: e-NAM mandis showing live trading in major states (as on 30.04.2020: 12:14hrs)

108

109
Annexure VIII: List of APMC mandis reported trading details on e-NAM and Agmarknet (Non-eNAM) portal during April 2020
Madhya Pradesh
APMCs trading through both eNAM and Non-eNAM platform
Ashta
Bareli
Betul
Bina
Chhatarpur
Chhindwara
Dewas
Ganjbasoda
Harda
Indore
Khandwa
Khirakiya
Morena
Obedullaganj
Pipariya
Rewa
Satna
Sehore
Seoni
Shujalpur
Tikamgarh
Timarni
Vidisha
Note: Although these APMCs are reported both in Agmarknet and E-NAM portal, but in most of the cases, the commodities traded differed.
APMCs trading only through eNAM
Mandsaur Surendra Singh Chouhan Uday Farmers Producer Limited
APMCs trading only through Non-eNAM platform
Agar
Ajaygarh
Alampur
Alirajpur
Amarpatan
Amarwda
Ambaha
Anjad
Anuppur
Aron
Ashoknagar
Ashoknagar (F&V)
Babai
Badamalhera
Badarwas
Badnagar
Badnawar
Badnawar (F&V)
Badod
Badwani
Bagli
Baikunthpur
Bakswaha
Baktara
Balaghat
Balwadi
Bamora
Banapura
Banda
Bankhedi
Banmorkalan
Barad
Barghat
Begamganj
Beohari
Berachha
Berasia
Bhander
Bhargat
Bhensdehi
Bhikangaon
Bhind
Bhitarwar
Bhopal
Bhopal(F&V)
Biaora
Bijawar
Binagaj
Binaganj
Budhar
Burhanpur (F&V)
Chaakghat
Chanderi
Chhapiheda
Chhindwara (F&V)
Chhpara
Dabra
Damoh
Damoh (F&V)
Datia
Deori
Devandranagar
Dhar
Dindori
Gadarwada
Gairatganj
Gandhwani
Garhakota
Gautampura
Ghansour
Gohad
Gorakhpur
Gotagaon
Gotegaon
Gulabganj
Guna
Guna(F&V)
Hanumana
Harda(F&V)
Harpalpur
Harsood
Hata
Hoshangabad

110
Ichhawar
Isagarh
Jabalpur(F&V)
Jaisinagar
Jaora
Jatara
Javad
Javera
Jawar
Jeerapur
Jhabua
Jobat
Jora
kailaras
Kalaipal
Kalapipal
Kannod
Kareli
Karera
Karhi
Kasrawad
Katangi
Katia
Katni
Keolari
Khachrod
Khaegaon
Khandwa (F&V)
Khaniadhana
Khargapur
Khategaon
Khatora
Khetia
Khilchipur
Khujner
Khurai
Kolaras
Kotma
Kumbharaj
Kurawar
Kurwai
Lahar
Lakhnadon
Lalbarra
Lashkar
Lashkar(F&V)
Lateri
Loharda
Machalpur
Magroni
Mahidpur
Maksi
Maksudangarh
Manawar
Mandla
Mandsaur (F&V)
Mehar
Mehgaon
Mhow
Momanbadodiya
Morena(F&V)
Mow
Multai
Mungawali
Nagda
Nagod
Nainpur
Nalkehda
Narsinghgarh
Nasrullaganj
Naugaon
Neemuch
Niwadi
Paatan
Pachaur
Palari
Pandhana
Pandhurna
Panna
Patharia
Pawai
Petlawad
Pichhour
Piplya
Piprai
Pohari
Porsa
Porsa(F&V)
Prithvipur
Raghogarh
Rahatgarh
Raisen
Rajgarh
Rajnagar
Ramnagar
Rannod
Ratlam
Ratlam(F&V)
Rehati
Rehli
Sabalgarh
Sanawad
Sanwer
Sarangpur
Satna(F&V)
Saunsar
Segaon
Semriharchand
Sendhwa
Sendwa
Sevda
Shadora
Shahagarh
Shahdol
Shahpura(Jabalpur)
Shajapur
Shajapur(F&V)
Shamshabad
Sheopurbadod
Sheopurkalan
Shepurbadod
Shivpuri
Shivpuri(F&V)
Shyampur
Sidhi
Silvani
Simariya
Siroli
Sironj
Sitmau
Sonkatch
Soyatkalan
Susner
Suthalia
Suvasra
Syopurkalan (F&V)
Udaipura
Ujjain
Ujjain(F&V)
Umariya
Vijaypur

111
Maharashtra
APMCs trading through both eNAM and Non-eNAM platform
Achalpur
Akola
Aurangabad
Bhokardan
Dound
Kolhapur
Pimpalgaon
Rahuri
Sangli(Phale, Bhajipura Market)
Sinner
Vani
Varora
Yeola
APMCs trading only through eNAM
Akot
Amaravathi
Anjangaon Surji
Baramati
Barshi
Basmat
Beed
Chopada
Daryapur
Digras
Dondaicha
Gevrai
Gondiya
Kalamb
Khamgaon
Lonar
Malkapur
Mangrulpeer
Nagpur
Nasik
Parbhani
Shahada
Shegaon
Shirpur
Shirur
Solapur
Surya Farmer Producer Co.Ltd
Tumsar
Udgir
Vaijapur
Wardha
APMCs trading only through Non-eNAM platform
Alibagh
Bhajipura Market)
Gangakhed
Ghansawangi
Hadgaon
Hadgaon (Tamsa
Jalgaon
Jalgaon (Masawat)
Junnar (Narayangaon)
Junnar(Otur)
Kalamnuri
Kalvan
Kalyan
Karjat
Khed
Lasalgaon
Lasur Station
Mumbai
Murbad
Murtizapur
Murud
Nandura
Pachora
Pachora (Bhadgaon)
Paithan
Paranda
Patan
Pen
Pulgaon
Purna
Rahata
Roha
Satara
Shrigonda
Shrirampur
Tasgaon
Umari
Vadgaonpeth
Vai
Varud
Vita
Washim
Washim (Ansing)
ZariZamini
Rajasthan
APMCs trading through both eNAM and Non-eNAM platform
Abu Road
Ajmer(F&V)
Aklera
Alwar
Anoopgarh
Anta
Atru
Balotra
Baran
Barmer
Bayana
Beawar
Bhadara
Bhawani Mandi
Bhinmal
Bijay Nagar
Bijoliya
Bikaner (Grain)
Bikaner(F&V)
Bilara
Bundi
Chaksu
Chhabra
Chirwa
Chomu
Chomu(F&V)
Churu
Dausa
Deeg
Degana
Deoli
Dholpur

112
Fatehpur
Gajsinghpur
Gharsana
Goluwala
Hanumangarh
Hindoun
Itawa
Jaipur(Bassi)
Jaisalmer
Jaitaran
Jaitsar
Jalore
Jhalarapatan
Jhunjhunu
Jodhpur(F&V) (Bhadwasia)
Jodhpur(Grain)(Phalodi)
Kekri
Kesarisinghpur
Khajuwala
Khanpur
Kherli
Kishangarh Renwal
Kota
Kotputli
Kuchaman City
Lalsot(Mandabari)
Lunkaransar
Mahua Mandabar (Mahua)
Merta City
Nadwai
Nagar
Nimbahera
Nohar
Nokha
Padampur
Pali
Pilli Banga
Pratapgarh
Raisingh Nagar
Rajasamand
Ramaganj Mandi
Rawatsar
Rawla
Sadulpur
Sadulshahar
Sanchor
Sangriya
Sawai Madhopur
Sikar
Sojat Road
Sri Karanpur
Sri Madhopur
Sri Vijayanagar
Sriganganagar
Sriganganagar (F&V)
Sujangarh (Churu)
Sumerganj
Surajgarh
Suratgarh
Tonk
Udaipur
Udaipur(F&V)
Uniyara
APMCs trading only through eNAM
Ajmer Grain
Bajju
Bandikui
Banswada
Barisadri
Barodamev
Bassi
Begu
Bhagat Ki Kothi
Bharatpur
Bhilwara
Bonli Samrudhh Agro Producer Company Limited
Chittorgarh
Chomehla
Chottisadri
Deedwana
Dei
Diwak Mata Farmer Producer Company Ltd
Dooni
Dungarpur
Fatehnagar
Gangapur City
Gangapur-Rj
Guda Godji
Jaipur Grain
Kaman
Kapasan
Keshoraipatan
Khairthal
Kota F And V
Krishak Vikas Agro Producer Company Limited
M. Kishangarh
Mahuwa Rj
Malpura
Mandalgarh
Mandawari
Nagour
Navjeevan Farmer Producer Company Limited.
Nawalgarh
Neem Ka Thana
Niwai
Palsana
Phalodi
Piparcity
Rajdhani Mandi Kukarkhera
Rani
Raniwara
Ratangarh
Ridmalsar
Sardar Shahar
Shahpura
Sri Dungargarh
Sumerpur
Vikram Singh Rajawat
APMCs trading only through Non-eNAM platform
Alwar(FV)
Atru(Kawai Salpura)
Bhandara
Bhawani Mandi (Choumehla)
Bhawani Mandi (Raipur)
Bheenmal (Ranlwada)
Bijolia
Chhabra (Chhipabadod)
Hanumangarh Town
Hanumangarh (Urlivas)
Jodhpur(F&V) (Paota)
Jodhpur(Grain) (Bhagat Ki Kothi)
Kakri
Kama
Khedh(Bodaramev)
Khedli(laxmangarh)
Kishan Renwal (Fulera)
Kishan Renwal (Sambhar)
Madanganj Kishanganj
Renwal(Sambhar)

113
Telangana
APMCs trading through both eNAM and Non-eNAM platform
Sadasivpet
APMCs trading only through eNAM - NIL
APMCs trading only through Non-eNAM platform
Amangal
Banswada
Bodhan
Bowenpally
Charla
Chityal
Devarakonda
Devarkonda
Devarkonda(Dindi)
Devarkonda (Mallepalli)
Gadwal
Gudimalkapur
Halia
Huzurnagar
Huzzurabad
Ibrahimputnam
Khanapur
Kodad
Koratla
Kothagudem
Mahboob Manison
Miryalaguda
Nakrekal
Nalgonda
Neredcherla
Pitlam
Sangareddy
Shadnagar
Suryapeta
Varni
Yellareddy
Uttar Pradesh
APMCs trading through both eNAM and Non-eNAM platform
Achalda
Akbarpur
Aligarh
Amroha
Anandnagar
Atarra
Auraiya
Azamgarh
Badayoun
Bahraich
Ballia
Balrampur
Banda
Barabanki
Basti
Bharthna
Bharuasumerpur
Buland Shahr
Chandausi
Chandoli
Chhibramau (Kannuj)
Dadri
Etah
Fatehpur
Firozabad
Golagokarnath
Hapur
Hardoi
Hasanpur
Jahangirabad
Jalalabad
Jalaun
Jaunpur
Kanpur(Grain)
Karvi
khair
Khalilabad
Konch
Kopaganj
Lakhimpur
Lucknow
Mahoba
Mainpuri
Mathura
Meerut
Milak
Mirzapur
Mohamadabad
Muskara
Najibabad
Naugarh
Nautnava
Nawabganj
Noida
Paliakala
Pilibhit
Puranpur
Raibareilly
Rampur
Rasda
Robertsganj
Safdarganj
Sahiyapur
Sambhal
Sandila
Shadabad
shahabad(New Mandi)
shahganj
Shahjahanpur
Sitapur
Tikonia
Tulsipur
Tundla
Ujhani
Unnao
Varanasi(F&V)
Wazirganj

114
APMCs trading only through eNAM
Arif Hasan
Deoria
Hathras
Mahmudabad
Naveen Kisan Producer Company Ltd
Powayan
Rohit Bhatt
Sahjanwa Apmc
APMCs trading only through Non-eNAM platform
Achnera
Agra
Ait
Ajuha
Aliganj
Allahabad
Anoop Shahar
Anwala
Atrauli
Awagarh
Baberu
Babrala
Bachranwa
Badda
Bagpat
Bahedi
Bangarmau
Banthara
Baraut
Bareli
Barhaj
Baruwasagar
Bewar
Bharwari
Bhehjoi
Bijnaur
Billsadda
Bilsi
Bindki
chaandpur
Charra
Chirgaon
Chitwadagaon
Chorichora
Choubepur
Dankaur
Dataganj
Devariya
Devband
Dhanura
Dibiapur
Dudhi
Etawah
Faizabad
Farukhabad
Fatehabad
Fatehpur Sikri
Gadaura
Gangoh
Ganjdudwara
Gazipur
Ghaziabad
Ghiraur
Gonda
Gopiganj
Gopralganj
Gorakhpur
Gulavati
Gurusarai
Haathras
Hamirpur
Hargaon (Laharpur)
Jafarganj
Jagnair
Jahanabad
Jangipura
Jarar
Jasra
Jasvantnagar
Javer
Jayas
Jhansi
Jhijhank
Kadhle
Kairana
Kamlaganj
Kannauj
Kasganj
Katra
Kayamganj
Khairagarh
Khatauli
Khekda
Khurja
Kiratpur
Kishunpur
Kosikalan
Kuara
Kurara
Lalganj
Lalitpur
Madhoganj
Maigalganj
Mau
Maudaha
Mauranipur
Mawana
Mehmoodabad
Mihipurwa
Misrikh
Moth
Mugrabaadshahpur
Muradabad
Muradnagar
Muzzafarnagar
Naanpara
Nakud
Nanuta
Orai
Parikshitgarh
Partaval
Payagpur
Pratapgarh
Pukhrayan
Purwa
Puwaha
Raath
Rampurmaniharan
Richha
Risia
Rudauli
Rura
Saharanpur
Sahpur
Saidpur
Salon
Samsabad
Sandi
Sardhana
Sehjanwa
shahaswan
Shahpur
Shamli
Shikohabad
Sikanderabad
Sikandraraau
Sikarpur
Sirsa
Sirsaganj
Siyana
Soharatgarh
Sultanpur
Sultanpurchilkana
Tanda
Thanabhawan
Tilhar
Utraula
Uttaripura
Varanasi(Grain)
Varipaal
Vilaspur
Vishalpur
Visoli
viswan

115
Annexure IX: List of commodities reported trading details on e-NAM and Agmarknet (Non-eNAM) portal during April 2020
Madhya Pradesh
Commodities traded through both eNAM and non-eNAM
Red Gram (Whole)
Pearl Millet
Barley
Bengal Gram Dal
Bengal Gram (Whole)
Black Gram (Whole)
Green Gram (Whole)
Lak(Teora)
Lentil (Whole)
Linseed
Maize
Mustard
Paddy (Basmati)
Peas(Dry)
Sesamum
Soyabean
Wheat
Commodities traded only through eNAM
Buckwheat
Chana (Bengal Gram)-Desi
Chana Bengal Gram-Dollar
Green Peas
Mustard Leaf
Soya Seeds (White)
White Peas
Commodities traded only through non-eNAM
Ajwan
Amaranthus
Apple
Banana
Banana - Green
Bhindi(Ladies Finger)
Bitter gourd
Bottle gourd
Brinjal
Cabbage
Capsicum
Carrot
Cauliflower
Coriander(Leaves)
Corriander seed
Cotton
Cucumbar(Kheera)
Drumstick
French Beans (Frasbean)
Garlic
Ginger
Grapes
Green Chilli
Guar
Indian Beans (Seam)
Kabuli Chana(Chickpeas-White)
Karbuja(Musk Melon)
Lemon
Mahua Seed(Hippe seed)
Mango
Mango (Raw-Ripe)
Masur Dal
Onion
Orange
Paddy(Dhan)(Common)
Papaya
Peas Wet
Pomegranate
Potato
Pumpkin
Ridgeguard(Tori)
Spinach
Sponge gourd
Tinda
Tomato
Water Melon
Maharashtra
Commodities traded through both eNAM and non-eNAM
Red Gram (Whole)
Pearl Millet
Bitter gourd
Bottle gourd
Brinjal
Cabbage
Cauliflower
Corriander seed
Cotton
Cucumbar(Kheera)
Garlic
Gur(Jaggery)
Jowar(Sorghum)
Lak(Teora)
Maize
Mustard
Onion
Paddy(Dhan)(Common)
Pomegranate
Rice
Ridgeguard(Tori)
Sesamum
Soyabean
Sunflower
Tomato
Turmeric
Wheat

116
Commodities traded only through eNAM
Ajwan
Bengal Gram Dal
Black Gram (Whole)
Black Gram Dal (Urd Dal)
Capsicum
Castor Seed
Chana (Bengal Gram)-Desi
Chana Bengal Gram-Dollar
Chana Gulabi
Chana Pkv3
Green Gram (Whole)
Groundnut
Jowar-White
Jowar-Yellow
Kusum Seed
Mousambi(Sweet Lime)
Onion Red
Onion White
Orange
Paddy 6445
Raisin
Soya Seeds (White)
Tur/Arhar-Mixed
Tur/Arhar-Red
Tur/Arhar-White
Turmeric Bulb
Turmeric Chura
Turmeric Finger
Turmeric Fingure Old
Wheat-Bhansi
White Peas
Commodities traded only through non-eNAM
Apple
Bengal Gram (Whole)
Bhindi(Ladies Finger)
Cardamoms
Carrot
Cashewnuts
Chikoos(Sapota)
Chili Red
Chilly Capsicum
Coconut
Coriander(Leaves)
Cummin Seed(Jeera)
Drumstick
Ginger
Grapes
Green Chilli
Guar
Lime
Linseed
Mango
Mango (Raw-Ripe)
Methi Seeds
Methi(Leaves)
Onion Green
Peas Wet
Potato
Sugar
Tamarind Fruit
Water Melon
Rajasthan
Commodities traded through both eNAM and non-eNAM
Pearl Millet
Barley
Bengal Gram (Whole)
Bhindi(Ladies Finger)
Black Gram (Whole)
Castor Seed
Coriander(Leaves)
Corriander seed
Cotton
Cummin Seed(Jeera)
Garlic
Grapes
Green Gram (Whole)
Groundnut
Guar
Isabgul (Psyllium)
Jowar(Sorghum)
Lemon
Lentil (Whole)
Maize
Methi Seeds
Mustard
Onion
Potato
Sesamum
Soyabean
Taramira
Tomato
Wheat
Commodities traded only through eNAM
Ajwan
Bengal Gram Dal
Chana (Bengal Gram)-Desi
Chana Bengal Gram-Dollar
Fennel Seed
Horsegram - Red
Karbuja(Musk Melon)
Linseed
Methi(Leaves)
Moth
Onion Red
Paddy 1002
Paddy 6445
Paddy(Dhan)(Common)
Wheat-Bhansi
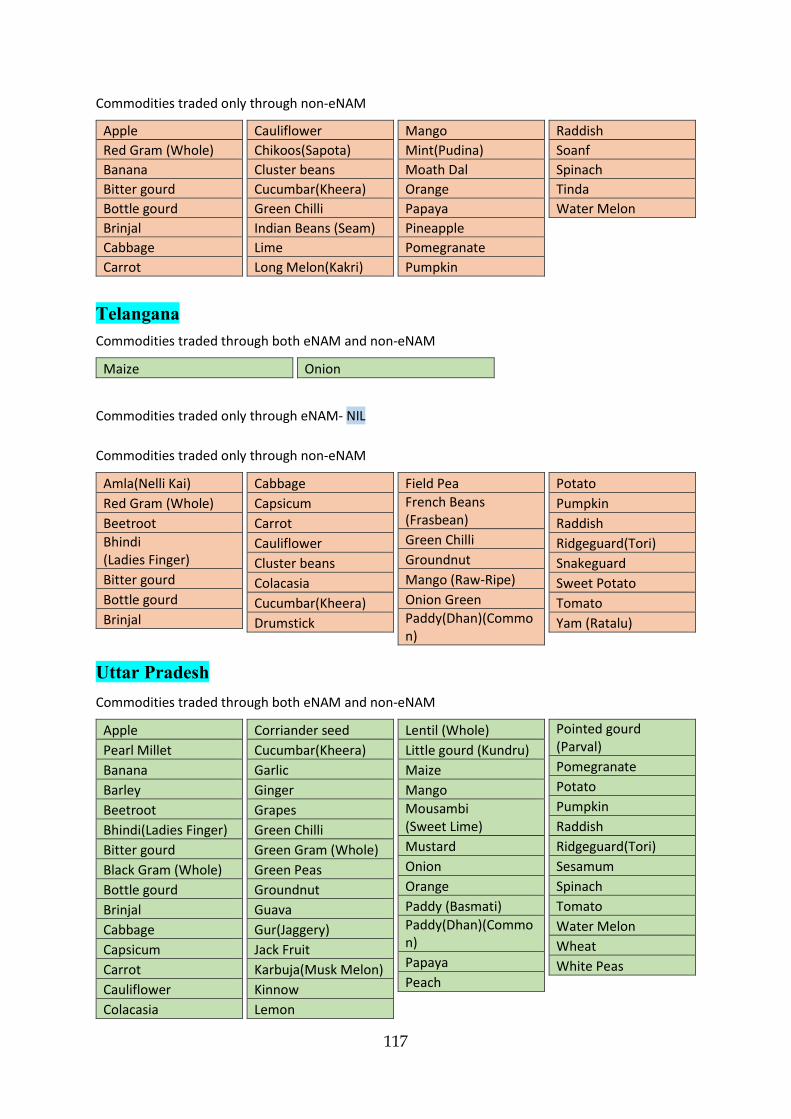
117
Commodities traded only through non-eNAM
Apple
Red Gram (Whole)
Banana
Bitter gourd
Bottle gourd
Brinjal
Cabbage
Carrot
Cauliflower
Chikoos(Sapota)
Cluster beans
Cucumbar(Kheera)
Green Chilli
Indian Beans (Seam)
Lime
Long Melon(Kakri)
Mango
Mint(Pudina)
Moath Dal
Orange
Papaya
Pineapple
Pomegranate
Pumpkin
Raddish
Soanf
Spinach
Tinda
Water Melon
Telangana
Commodities traded through both eNAM and non-eNAM
Maize Onion
Commodities traded only through eNAM- NIL
Commodities traded only through non-eNAM
Amla(Nelli Kai)
Red Gram (Whole)
Beetroot
Bhindi (Ladies Finger)
Bitter gourd
Bottle gourd
Brinjal
Cabbage
Capsicum
Carrot
Cauliflower
Cluster beans
Colacasia
Cucumbar(Kheera)
Drumstick
Field Pea
French Beans (Frasbean)
Green Chilli
Groundnut
Mango (Raw-Ripe)
Onion Green
Paddy(Dhan)(Common)
Potato
Pumpkin
Raddish
Ridgeguard(Tori)
Snakeguard
Sweet Potato
Tomato
Yam (Ratalu)
Uttar Pradesh
Commodities traded through both eNAM and non-eNAM
Apple
Pearl Millet
Banana
Barley
Beetroot
Bhindi(Ladies Finger)
Bitter gourd
Black Gram (Whole)
Bottle gourd
Brinjal
Cabbage
Capsicum
Carrot
Cauliflower
Colacasia
Corriander seed
Cucumbar(Kheera)
Garlic
Ginger
Grapes
Green Chilli
Green Gram (Whole)
Green Peas
Groundnut
Guava
Gur(Jaggery)
Jack Fruit
Karbuja(Musk Melon)
Kinnow
Lemon
Lentil (Whole)
Little gourd (Kundru)
Maize
Mango
Mousambi (Sweet Lime)
Mustard
Onion
Orange
Paddy (Basmati)
Paddy(Dhan)(Common)
Papaya
Peach
Pointed gourd (Parval)
Pomegranate
Potato
Pumpkin
Raddish
Ridgeguard(Tori)
Sesamum
Spinach
Tomato
Water Melon
Wheat
White Peas

118
Commodities traded only through eNAM
Chana (Bengal Gram)-Desi
Chana Bengal Gram-Dollar
Custard Apple
Lobia
Millet
Onion Red
Onion White
Paddy 1002
Paddy 6445
Squash
Wheat-Bhansi
Yam (Ratalu)
Commodities traded only through non-eNAM
Red Gram (Whole)
Arhar Dal(Tur Dal)
Banana - Green
Bengal Gram Dal
Bengal Gram (Whole)
Ber(Zizyphus/Borehannu)
Black Gram Dal (Urd Dal)
Charra
Chikoos(Sapota)
Chili Red
Cock
Coriander(Leaves)
Cowpea(Veg)
Dry Chillies
Dry Fodder
Egg
Field Pea
Firewood
Fish
Forest Products
French Beans (Frasbean)
Ghee
Goat
Gramflour
Green Gram Dal (Moong Dal)
Jowar(Sorghum)
Kabuli Chana(Chickpeas-White)
Khoya
Lime
Linseed
Maida Atta
Masur Dal
Methi(Leaves)
Mustard Oil
Papaya (Raw)
Peas cod
Peas Wet
Peas(Dry)
Rice
Season Leaves
Soji
Soyabean
Sponge gourd
Sugar
Tinda
Turmeric
Wheat Atta
White Pumpkin
Wood

119
Annexure X: Test for mean difference (Independent samples t-test) in average modal price offered through e-NAM and non-e-NAM process in April 2020
Independent Samples Testa
State Levene's Test for Equality of Variances
t-test for Equality of Means
F Sig. t df Sig. (2-tailed)
Mean Difference
Std. Error Difference
95% Confidence Interval of the Difference
Lower Upper
Madhya Pradesh Lentil (Whole) Modal Price
A 1.375 0.257 0.853 17 0.406 67.31 78.93 -99.23 233.85
B 1.062 16 0.304 67.31 63.40 -66.81 201.42
Mustard Modal Price
A 1.635 0.213 -0.280 25 0.782 -35.22 125.73 -294.17 223.74
B -0.249 11 0.808 -35.22 141.39 -348.13 277.70
Red gram (Whole)
Modal Price
A 0.471 0.508 -0.835 10 0.423 -631.20 756.03 -2315.74 1053.34
B -0.925 9 0.378 -631.20 682.06 -2163.34 900.94
Wheat Modal Price
A 0.048 0.828 -0.626 72 0.534 -14.50 23.18 -60.72 31.71
B -0.604 42 0.549 -14.50 24.00 -62.95 33.94
Maharashtra Red gram (Whole)
Modal Price
A 0.005 0.948 0.943 11 0.366 151.98 161.09 -202.59 506.54
B 0.938 10 0.370 151.98 162.04 -207.16 511.11
Soyabean Modal Price
A 0.155 0.705 0.630 7 0.549 35.83 56.88 -98.66 170.32
B 0.580 3 0.598 35.83 61.74 -149.07 220.74
Wheat Modal Price
A 0.657 0.448 -0.287 6 0.784 -22.67 79.03 -216.04 170.70
B -0.484 6 0.646 -22.67 46.83 -137.28 91.94
Rajasthan Barley (Jau) Modal Price
A 0.819 0.368 0.468 85 0.641 5.85 12.52 -19.04 30.75
B 0.460 74 0.647 5.85 12.73 -19.52 31.23
Mustard Modal Price
A 7.149 0.008 0.656 238 0.513 14.05 21.42 -28.15 56.24
B 0.607 151 0.545 14.05 23.13 -31.65 59.74
Wheat Modal Price
A 0.842 0.360 -2.853 176 0.005 -40.07 14.04 -67.79 -12.36
B -2.723 127 0.007 -40.07 14.71 -69.18 -10.96
Telangana Onion Modal Price
A 0.005 0.946 -1.886 4 0.132 -92.00 48.78 -227.45 43.45
B -1.886 4 0.133 -92.00 48.78 -227.68 43.68
Uttar Pradesh Bottle gourd Modal Price
A 28.684 0.000 -12.462 472 0.000 -240.28 19.28 -278.17 -202.40
B -11.689 316 0.000 -240.28 20.56 -280.73 -199.84
Brinjal Modal Price
A 68.952 0.000 -15.006 464 0.000 -296.41 19.75 -335.22 -257.59
B -13.804 284 0.000 -296.41 21.47 -338.67 -254.14
Tomato Modal Price
A 2.602 0.107 -12.228 565 0.000 -311.28 25.46 -361.29 -261.28
B -11.923 467 0.000 -311.28 26.11 -362.59 -259.98
Wheat Modal Price
A 38.527 0.000 -8.293 378 0.000 -68.31 8.24 -84.51 -52.12
B -8.327 377 0.000 -68.31 8.20 -84.44 -52.18
A-Equal variances assumed, B- Equal variances not assumed