FORWARD PINELLAS MOBILITY PROFILE - NET
8
FORWARD PINELLAS MOBILITY PROFILE produced by Florida Department of Transportation Forecasting and Trends Office published 2020
-
Upload
khangminh22 -
Category
Documents
-
view
3 -
download
0
Transcript of FORWARD PINELLAS MOBILITY PROFILE - NET

FORWARD PINELLASMOBILITY PROFILEproduced byFlorida Department of TransportationForecasting and Trends Office
published2020
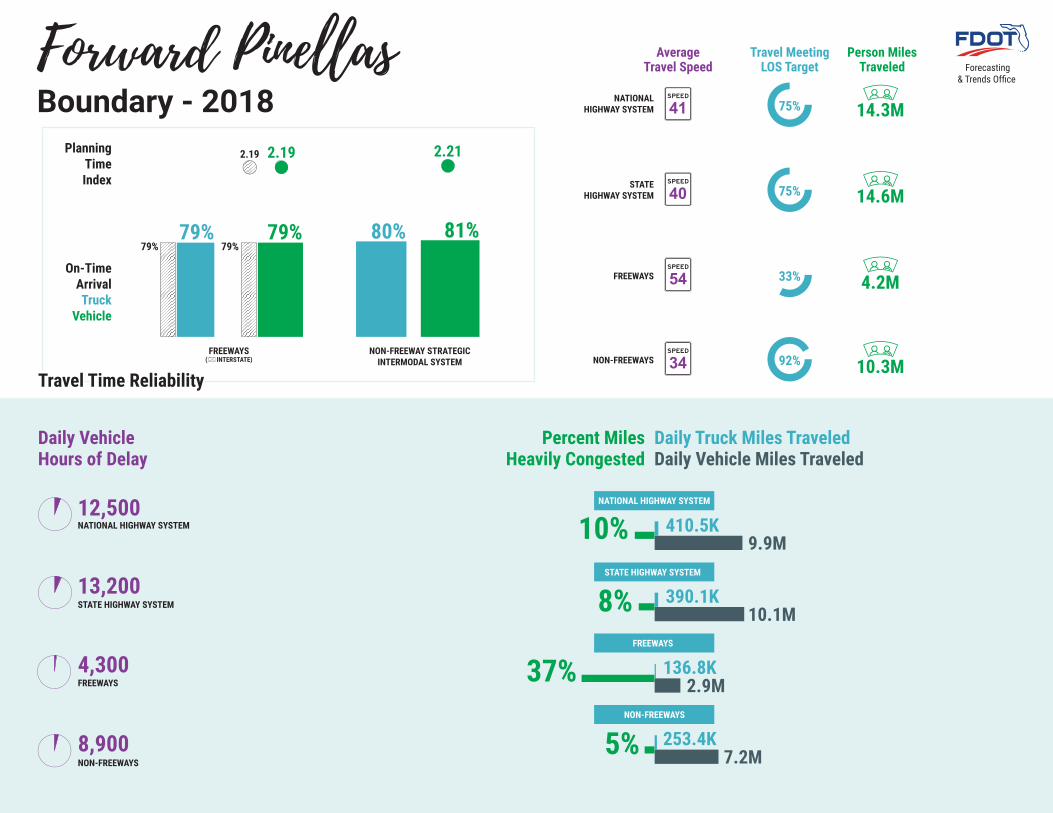
Person MilesTraveled
10.3M
4.2M
14.6M
14.3M
Vehicle
81%79%
Truck
80%79%79% 79%
PlanningTimeIndex
2.19 2.212.19
On-TimeArrival
Travel Time ReliabilityTravel Time Reliability
FREEWAYS NON-FREEWAY STRATEGICINTERMODAL SYSTEM( INTERSTATE)
8%
10%
37%
5%
Percent MilesHeavily Congested
NATIONAL HIGHWAY SYSTEM
STATE HIGHWAY SYSTEM
FREEWAYS
NON-FREEWAYS
Daily Truck Miles Traveled
410.5K
390.1K
136.8K
253.4K
Daily Vehicle Miles Traveled
9.9M
10.1M
2.9M
7.2M
TRAVEL MEETING LOS CRITERIA: IN DATA LEFT COLUMN IS FACILTY TYPE %RIGHT COLUMN IS 100 MINUS FACILITY TYPE %
Travel MeetingLOS Target
92%
33%
75%
75%
AverageTravel Speed
NON-FREEWAYS
NATIONALHIGHWAY SYSTEM
STATEHIGHWAY SYSTEM
41
40
34
FREEWAYS 54
Daily VehicleHours of Delay
12,500NATIONAL HIGHWAY SYSTEM
13,200STATE HIGHWAY SYSTEM
4,300FREEWAYS
8,900NON-FREEWAYS
Forward Pine�asBoundary - 2018
Forecasting& Trends Office
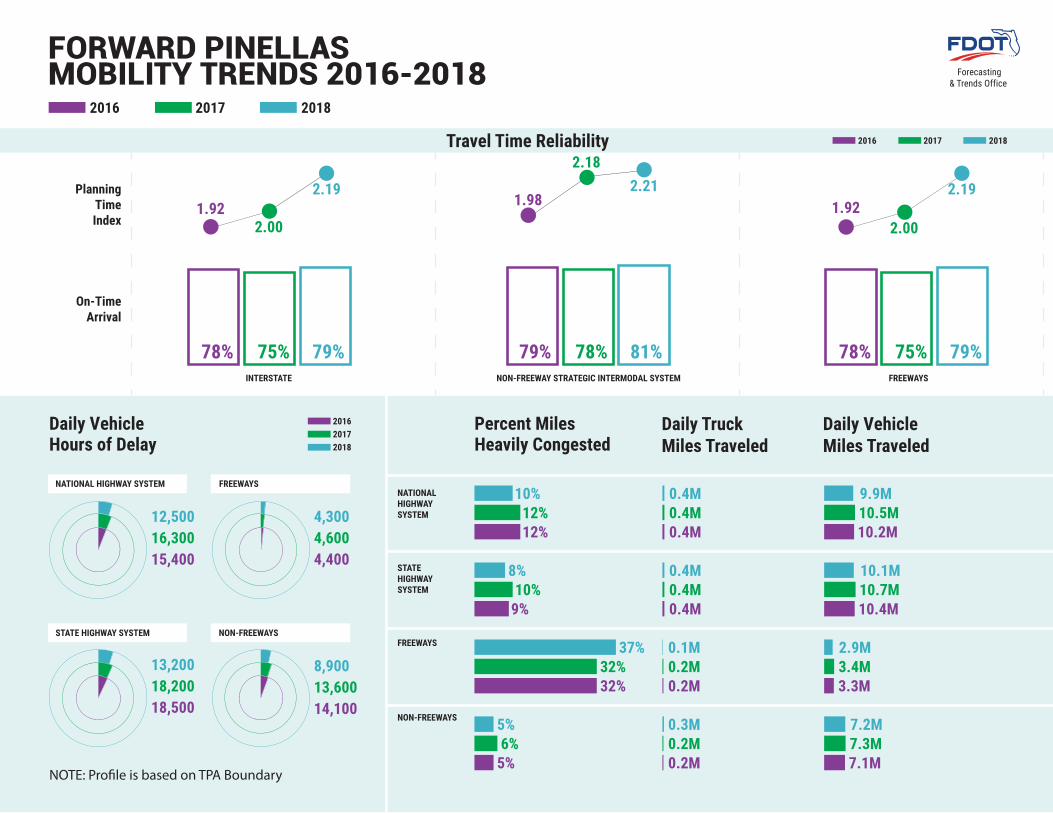
79% 78% 81% 78% 75% 79%78% 75% 79%INTERSTATE NON-FREEWAY STRATEGIC INTERMODAL SYSTEM FREEWAYS
On-TimeArrival
1.922.00
2.191.98
2.182.21
1.922.00
2.19PlanningTimeIndex
12%10%
12%
10%8%
9%
32%37%
32%
6%5%
5%
Percent MilesHeavily Congested
Daily VehicleMiles Traveled
10.5M9.9M
10.2M
10.7M10.1M
10.4M
3.4M2.9M
3.3M
7.3M7.2M
7.1M
Daily TruckMiles Traveled
0.4M0.4M
0.4M
0.4M0.4M
0.4M
0.2M0.1M
0.2M
0.2M0.3M
0.2M
Daily VehicleHours of Delay
12,50016,30015,400
NATIONAL HIGHWAY SYSTEM
STATE HIGHWAY SYSTEM
FREEWAYS
13,20018,20018,500
4,3004,6004,400
8,90013,60014,100
NON-FREEWAYS
201620172018
NATIONALHIGHWAYSYSTEM
STATEHIGHWAYSYSTEM
FREEWAYS
NON-FREEWAYS
Travel Time Reliability 2016 2017 2018
FORWARD PINELLASMOBILITY TRENDS 2016-2018
NOTE: Pro�le is based on TPA Boundary
2016 2017 2018
Forecasting& Trends Office

DEFINITIONSTravel Time Reliability: (1) the percent of trips that succeed in accordance with a predetermined performance standard for time or speed; and/or (2) the variability of travel times that occur on a facility or a trip over a period of time.
Planning Time Index: The 95th percentile travel time divided by free flow travel time. A planning time index of 1.5 means a 20-minute trip at free flow speed takes 30 minutes - an informed traveler should plan for the extra 10 minutes to arrive on time.
Vehicle On-Time Arrival: The percentage of freeway trips traveling at greater than or equal to fi ve mph below the posted speed limit. In the urbanized areas of the seven largest MPOs, on-time arrival is defi ned as the percentage of freeway trips traveling at least 45 mph. For arterials, travel time reliability is defi ned as the percentage of trips traveling greater than or equal to 20 mph.
Truck On-Time Arrival: The percentage of freeway trips by combination trucks traveling at greater than or equal to 5 mph below posted speed limit. In the urbanized areas of the 7 largest MPOs, on-time arrival is defi ned as the percentage of freeway trips by combination trucks traveling at least 45 mph.
Daily Vehicle Hours of Delay: Delay is the product of directional hourly volume and the difference between travel time at “threshold” speeds and travel time at the average speed. The thresholds are based on Level of Service (LOS) B as defi ned by FDOT.
Average Travel Speed: The length of the highway segment divided by the average travel time of all vehicles traversing the segment, including all stopped delay times.
Percent of Travel Meeting LOS Target: The percentage of travel meeting FDOT's LOS standards is determined by summing the vehicle miles traveled on roadways operating acceptably and then dividing by the total system vehicle miles traveled.
Person Miles Traveled Daily: Person miles traveled consists of the total number of miles traveled by people using the SHS or other components of it. This is calculated by adding each roadway segment's vehicle miles traveled multiplied by average vehicle occupancy.
Percent Miles Heavily Congested: Heavy congestion is a situation in which average travel speeds are in the range from 20-44 mph for freeways and equal to or worse than the LOS standards for arterials and highways.
Daily Truck Miles Traveled: (for all trucks class 4 through 13): The total number of miles traveled daily by trucks using a roadway system.
Daily Vehicle Miles Traveled: The total number of miles traveled daily by vehicles using a roadway system.
Three roadway systems are reported: National Highway System (NHS), State Highway System (SHS), and Strategic Intermodal System (SIS)
SIScan
have both SHSand
NHS roads
NHScan
have both SHSand SIS roads
SHScan
have both NHSand SIS
roads
NHS SISSHS
SourcesFDOT Traffi c Characteristics Inventory, FDOT Roadway Characteristics Inventory, 2020 Quality/Level of Service Handbook, and HERE vehicle probe speed

FDOT Supplied MPO Mobility Performance Measure Analyses for 2018 (Forward Pinellas)remove this row when complete -->> VMTD TMTD DelayD PerMSCPH PMTD ASpeedPH PerTLOSPP
Date: 10/13/2020Pinellas (MPO/TPO Boundary)
Networks/Measures
A: Daily vehicle miles traveled(Millions)
B: Daily truck miles traveled (Thousands)
C: On-Time Arrival (Vehicle)3
D: Planning Time Index3
E: Daily vehicle hours of delay(Thousands)
F: Percent miles heavily congested
G: Person miles traveled(Millions)
H: On-Time Arrival (Truck)3
I: Average Travel Speed
J: Percent Travel Meeting LOS Criteria3
A: National Highway System 9.9 410.5 12.5 10% 14.3 41 75%B. State Highway System 10.1 390.1 13.2 8% 14.6 40 75%C: Strategic Intermodal System4 4.9 205.2 81% 2.21 5.6 30% 7.0 80% 49 49%D. Freeways 2.9 136.8 79% 2.19 4.3 37% 4.2 79% 54 33%E. Interstates 2.9 136.8 79% 2.19 4.3 37% 4.2 79% 54 33%F: Non-freeways (SHS) 7.2 253.4 8.9 5% 10.3 34 92%
Pinellas (Urbanized Area)
Networks/Measures
A: Daily vehicle miles traveled(Millions)
B: Daily truck miles traveled (Thousands)
C: On-Time Arrival (Vehicle)3
D: Planning Time Index3
E: Daily vehicle hours of delay(Thousands)
F: Percent miles heavily congested
G: Person miles traveled(Millions)
H: On-Time Arrival (Truck)3
I: Average Travel Speed
J: Percent Travel Meeting LOS Criteria3
A: National Highway System 9.9 410.5 12.5 10% 14.3 41 75%B. State Highway System 10.1 390.1 13.2 8% 14.6 40 75%C: Strategic Intermodal System4 4.9 205.2 81% 2.21 5.6 30% 7.0 80% 49 49%D. Freeways 2.9 136.8 79% 2.19 4.3 37% 4.2 79% 54 33%E. Interstates 2.9 136.8 79% 2.19 4.3 37% 4.2 79% 54 33%F: Non-freeways (SHS) 7.2 253.4 8.9 5% 10.3 34 92%
Pinellas (County Boundary)
Networks/Measures
A: Daily vehicle miles traveled(Millions)
B: Daily truck miles traveled (Thousands)
C: On-Time Arrival (Vehicle)3
D: Planning Time Index3
E: Daily vehicle hours of delay(Thousands)
F: Percent miles heavily congested
G: Person miles traveled(Millions)
H: On-Time Arrival (Truck)3
I: Average Travel Speed
J: Percent Travel Meeting LOS Criteria3
A: National Highway System 10.5 435.2 13.1 11% 15.1 41 73%B. State Highway System 10.6 415.0 13.8 9% 15.3 40 74%C: Strategic Intermodal System4 5.4 229.8 83% 1.84 6.3 30% 7.8 82% 50 49%D. Freeways 3.5 162.2 78% 2.23 5.0 35% 5.0 78% 54 36%E. Interstates 3.5 162.2 78% 2.23 5.0 34% 5.0 78% 54 36%F: Non-freeways (SHS) 7.2 252.8 8.9 5% 10.3 34 92%1These six Annual Measures are reported each year.2These four Rotating Measures change every other year. Odd year measures consist of 1) Percent Sidewalk Coverage, 2) Percent Bicycle Lane Coverage, and 3) Average Job Accessibility within a 30-minute car trip and 4) within a 30-minute transit trip.3Measures C, D, H, and J are captured in the PM peak period (4:00-6:00).4SIS On-Time Arrival and Planning Time Index exclude freeways.
Annual Measures1 Rotating Measures2
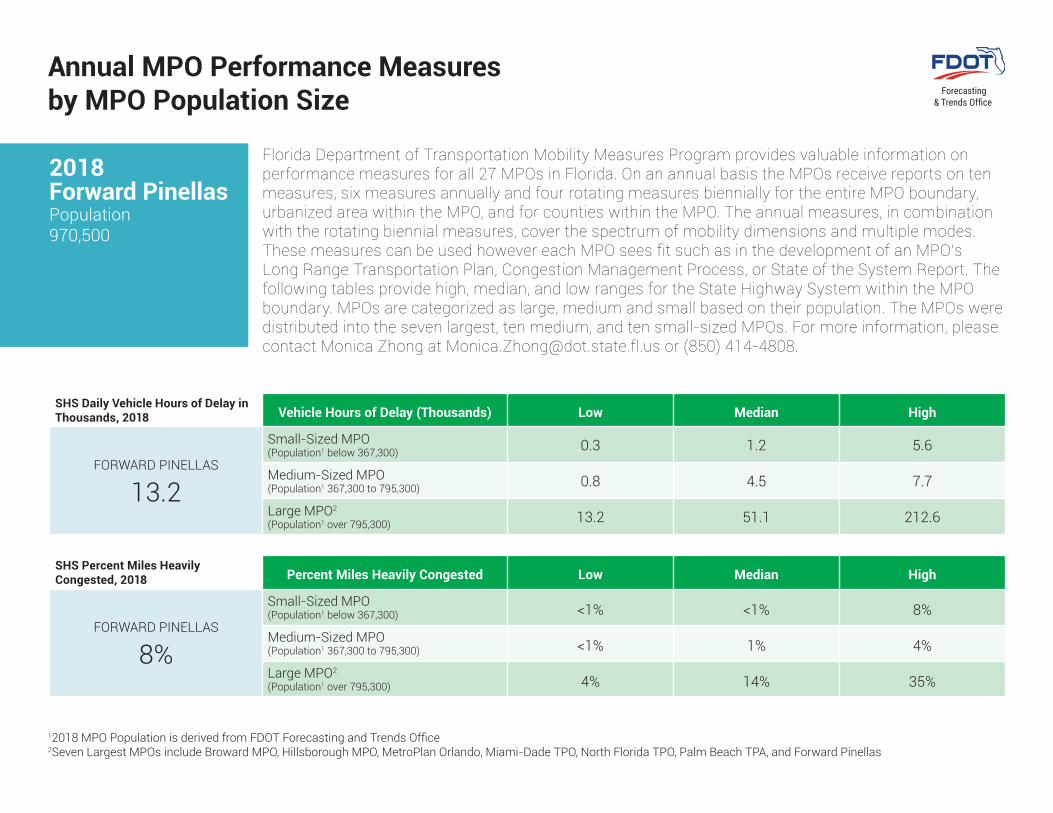
12018 MPO Population is derived from FDOT Forecasting and Trends Office 2Seven Largest MPOs include Broward MPO, Hillsborough MPO, MetroPlan Orlando, Miami-Dade TPO, North Florida TPO, Palm Beach TPA, and Forward Pinellas
Florida Department of Transportation Mobility Measures Program provides valuable information on performance measures for all 27 MPOs in Florida. On an annual basis the MPOs receive reports on ten measures, six measures annually and four rotating measures biennially for the entire MPO boundary, urbanized area within the MPO, and for counties within the MPO. The annual measures, in combination with the rotating biennial measures, cover the spectrum of mobility dimensions and multiple modes. These measures can be used however each MPO sees fit such as in the development of an MPO’s Long Range Transportation Plan, Congestion Management Process, or State of the System Report. The following tables provide high, median, and low ranges for the State Highway System within the MPO boundary. MPOs are categorized as large, medium and small based on their population. The MPOs were distributed into the seven largest, ten medium, and ten small-sized MPOs. For more information, please contact Monica Zhong at [email protected] or (850) 414-4808.
Annual MPO Performance Measures by MPO Population Size
2018Forward PinellasPopulation970,500
SHS Daily Vehicle Hours of Delay in Thousands, 2018 Vehicle Hours of Delay (Thousands) Low Median High
FORWARD PINELLAS
13.2
Small-Sized MPO (Population1 below 367,300) 0.3 1.2 5.6
Medium-Sized MPO (Population1 367,300 to 795,300) 0.8 4.5 7.7
Large MPO2 (Population1 over 795,300) 13.2 51.1 212.6
SHS Percent Miles Heavily Congested, 2018 Percent Miles Heavily Congested Low Median High
FORWARD PINELLAS
8%
Small-Sized MPO (Population1 below 367,300) <1% <1% 8%
Medium-Sized MPO (Population1 367,300 to 795,300) <1% 1% 4%
Large MPO2 (Population1 over 795,300) 4% 14% 35%

SHS Daily Vehicle Miles Traveled in Millions, 2018 Vehicle Miles Traveled (Millions) Low Median High
FORWARD PINELLAS
10.1
Small-Sized MPO (Population1 below 367,300) 1.7 4.2 6.3
Medium-Sized MPO (Population1 367,300 to 795,300) 4.0 8.4 12.5
Large MPO2 (Population1 over 795,300) 10.1 28.0 34.7
SHS Daily Truck Miles Traveled in Thousands, 2018 Truck Miles Traveled (Thousands) Low Median High
FORWARD PINELLAS
390.1
Small-Sized MPO (Population1 below 367,300) 168.1 416.2 893.4
Medium-Sized MPO (Population1 367,300 to 795,300) 377.5 910.8 1,440.5
Large MPO2 (Population1 over 795,300) 390.1 1,797.0 3,006.0
Freeway On-Time Arrival, 2018 On-Time Arrival Low Median High
FORWARD PINELLAS
79%
Small-Sized MPO (Population1 below 367,300) 86% 96% 98%
Medium-Sized MPO (Population1 367,300 to 795,300) 85% 89% 98%
Large MPO2 (Population1 over 795,300) 63% 86% 88%
Freeway Planning Time Index, 2018 Planning Time Index Low Median High
FORWARD PINELLAS
2.19
Small-Sized MPO (Population1 below 367,300) 1.11 1.13 1.34
Medium-Sized MPO (Population1 367,300 to 795,300) 1.12 1.20 1.48
Large MPO2 (Population1 over 795,300) 1.64 1.91 2.63
12018 MPO Population is derived from FDOT Forecasting and Trends Office 2Seven Largest MPOs include Broward MPO, Hillsborough MPO, MetroPlan Orlando, Miami-Dade TPO, North Florida TPO, Palm Beach TPA, and Forward Pinellas
2018 Forward PinellasPopulation 970,500

Forecasting & Trends Offi ce