stauffer chemical company tarpon springs, pinellas county ...
189
STAUFFER CHEMICAL COMPANY TARPON SPRINGS, PINELLAS COUNTY, FLORIDA EPA FACILITY ID: FLD010596013 MARCH 30, 2005
-
Upload
khangminh22 -
Category
Documents
-
view
0 -
download
0
Transcript of stauffer chemical company tarpon springs, pinellas county ...

STAUFFER CHEMICAL COMPANY TARPON SPRINGS, PINELLAS COUNTY, FLORIDA
EPA FACILITY ID: FLD010596013 MARCH 30, 2005

THE ATSDR PUBLIC HEALTH ASSESSMENT: A NOTE OF EXPLANATION
This Public Health Assessment was prepared by ATSDR pursuant to the Comprehensive Environmental Response, Compensation, and Liability Act (CERCLA or Superfund) section 104 (i)(6) (42 U.S.C. 9604 (i)(6)), and in accordance with our implementing regulations (42 C.F.R. Part 90). In preparing this document, ATSDR has collected relevant health data, environmental data, and community health concerns from the Environmental Protection Agency (EPA), state and local health and environmental agencies, the community, and potentially responsible parties, where appropriate.
In addition, this document has previously been provided to EPA and the affected states in an initial release, as required by CERCLA section 104 (i)(6)(H) for their information and review. The revised document was released for a 30-day public comment period. Subsequent to the public comment period, ATSDR addressed all public comments and revised or appended the document as appropriate. The public health assessment has now been reissued. This concludes the public health assessment process for this site, unless additional information is obtained by ATSDR which, in the agency’s opinion, indicates a need to revise or append the conclusions previously issued.
Agency for Toxic Substances & Disease Registry.................................................... Julie L. Gerberding, M.D., M.P.H., Administrator Thomas Sinks, Ph.D., M.S., Acting Director
Division of Health Assessment and Consultation…. ..................................................................... William Cibulas, Jr., Ph.D., Director Sharon Williams-Fleetwood, Ph.D., Deputy Director
Community Involvement Branch ..................................................................................................... Germano E. Pereira, M.P.A., Chief
Exposure Investigations and Consultation Branch....................................................................Donald Joe, M.S., Deputy Branch Chief
Federal Facilities Assessment Branch ........................................................................................................ Sandra G. Isaacs, B.S., Chief
Superfund and Program Assessment Branch ........................................................................................Richard E. Gillig, M.C.P., Chief
Use of trade names is for identification only and does not constitute endorsement by the Public Health Service or the U.S. Department of Health and Human Services.
Additional copies of this report are available from: National Technical Information Service, Springfield, Virginia
(703) 605-6000
You May Contact ATSDR TOLL FREE at 1-888-42ATSDR
or Visit our Home Page at: http://www.atsdr.cdc.gov
Stauffer Chemical Company Final Release
PUBLIC HEALTH ASSESSMENT
STAUFFER CHEMICAL COMPANY TARPON SPRINGS, PINELLAS COUNTY, FLORIDA
EPA FACILITY ID: FLD010596013
Prepared by:
The U.S. Department of Health and Human Services Agency for Toxic Substances and Disease Registry
Division of Health Assessment and Consultation Superfund and Program Assessment Branch
Atlanta, Georgia

STAUFFER CHEMICAL COMPANY PUBLIC HEALTH ASSESSMENT – FINAL RELEASE
TABLE OF CONTENTS
List of Figures . . . . . . . . . . . . . . . . . . . . . . . . . . . . . . . . . . . . . . . . . . . . . . . . . . . . . . . . . . . . . . . . v List of Tables . . . . . . . . . . . . . . . . . . . . . . . . . . . . . . . . . . . . . . . . . . . . . . . . . . . . . . . . . . . . . . . vii List of Abbreviations . . . . . . . . . . . . . . . . . . . . . . . . . . . . . . . . . . . . . . . . . . . . . . . . . . . . . . . . . . . x EXECUTIVE SUMMARY . . . . . . . . . . . . . . . . . . . . . . . . . . . . . . . . . . . . . . . . . . . . . . . . . . . . . . . . . 1
A. Environmental Contaminants . . . . . . . . . . . . . . . . . . . . . . . . . . . . . . . . . . . . . . . . . . . . 1 B. Completed Exposure Pathways . . . . . . . . . . . . . . . . . . . . . . . . . . . . . . . . . . . . . . . . . . . 3 C. Potential Exposure Pathways . . . . . . . . . . . . . . . . . . . . . . . . . . . . . . . . . . . . . . . . . . . . 4 D. Conclusions . . . . . . . . . . . . . . . . . . . . . . . . . . . . . . . . . . . . . . . . . . . . . . . . . . . . . . . . . . 4
1. Historical (Past) Exposures . . . . . . . . . . . . . . . . . . . . . . . . . . . . . . . . . . . . . . . . 5 2. Current Exposures . . . . . . . . . . . . . . . . . . . . . . . . . . . . . . . . . . . . . . . . . . . . . . 13 3. Future Exposures . . . . . . . . . . . . . . . . . . . . . . . . . . . . . . . . . . . . . . . . . . . . . . . 14
E. Recommendations . . . . . . . . . . . . . . . . . . . . . . . . . . . . . . . . . . . . . . . . . . . . . . . . . . . . 14 F. Public Health Action Plan . . . . . . . . . . . . . . . . . . . . . . . . . . . . . . . . . . . . . . . . . . . . . . 15 G. Fact Sheets . . . . . . . . . . . . . . . . . . . . . . . . . . . . . . . . . . . . . . . . . . . . . . . . . . . . . . . . . 17
1. PURPOSE AND STATEMENT OF ISSUES . . . . . . . . . . . . . . . . . . . . . . . . . . . . . . . . . . . . . . . . . . . 18 2. BACKGROUND . . . . . . . . . . . . . . . . . . . . . . . . . . . . . . . . . . . . . . . . . . . . . . . . . . . . . . . . . . . . . . 19
2.1. Site Description and History . . . . . . . . . . . . . . . . . . . . . . . . . . . . . . . . . . . . . . . . . . . 19 2.2. Site Visits . . . . . . . . . . . . . . . . . . . . . . . . . . . . . . . . . . . . . . . . . . . . . . . . . . . . . . . . . 20 2.3. Demographics, Land Use, and Natural Resource Use . . . . . . . . . . . . . . . . . . . . . . . 21
2.3.1. Demographics . . . . . . . . . . . . . . . . . . . . . . . . . . . . . . . . . . . . . . . . . . . . . . 21 2.3.2. Land Use . . . . . . . . . . . . . . . . . . . . . . . . . . . . . . . . . . . . . . . . . . . . . . . . . . 21 2.3.3. Natural Resource Use . . . . . . . . . . . . . . . . . . . . . . . . . . . . . . . . . . . . . . . . 22
3. ENVIRONMENTAL CONTAMINATION AND OTHER HAZARDS . . . . . . . . . . . . . . . . . . . . . . . . . . . 27 3.1 On-Site Contamination . . . . . . . . . . . . . . . . . . . . . . . . . . . . . . . . . . . . . . . . . . . . . . . 28
3.1.1. Soil and Slag-Containing Materials . . . . . . . . . . . . . . . . . . . . . . . . . . . . . . 28 3.1.2. Groundwater . . . . . . . . . . . . . . . . . . . . . . . . . . . . . . . . . . . . . . . . . . . . . . . 31
3.2. Off-Site Contamination . . . . . . . . . . . . . . . . . . . . . . . . . . . . . . . . . . . . . . . . . . . . . . . 33 3.2.1. Soil and Slag-Containing Materials . . . . . . . . . . . . . . . . . . . . . . . . . . . . . 33 3.2.2. Groundwater . . . . . . . . . . . . . . . . . . . . . . . . . . . . . . . . . . . . . . . . . . . . . . . 35 3.2.3. Surface Water and Sediment (Anclote River) . . . . . . . . . . . . . . . . . . . . . . 36 3.2.4. Biota (Fish and Shellfish) . . . . . . . . . . . . . . . . . . . . . . . . . . . . . . . . . . . . . 39
3.3. Air Contamination . . . . . . . . . . . . . . . . . . . . . . . . . . . . . . . . . . . . . . . . . . . . . . . . . . 39 3.3.1. What Were the Air Emissions Sources From Stauffer’s Processes? . . . . . 39 3.3.2. Emissions Data: What Contaminants Were Released to the Air? . . . . . . . 40 3.3.3. Meteorologic Data and Air Quality Modeling Analysis: Where Did the Air
Emissions Go? . . . . . . . . . . . . . . . . . . . . . . . . . . . . . . . . . . . . . . . . . . . . . 42 3.3.4. Ambient Air Monitoring Data: What Were the Levels of Contaminants in
the Air? . . . . . . . . . . . . . . . . . . . . . . . . . . . . . . . . . . . . . . . . . . . . . . . . . . 59 3.4. Physical and Other Hazards . . . . . . . . . . . . . . . . . . . . . . . . . . . . . . . . . . . . . . . . . . . 65
4. EXPOSURE PATHWAYS ANALYSES . . . . . . . . . . . . . . . . . . . . . . . . . . . . . . . . . . . . . . . . . . . . . . 66 4.1. Completed Exposure Pathways . . . . . . . . . . . . . . . . . . . . . . . . . . . . . . . . . . . . . . . . . 66
4.1.1. Breathing Outdoor Air . . . . . . . . . . . . . . . . . . . . . . . . . . . . . . . . . . . . . . . . 66 4.1.2. Drinking On-Site Groundwater . . . . . . . . . . . . . . . . . . . . . . . . . . . . . . . . . 68 4.1.3. Contacting Surface Soil and Slag . . . . . . . . . . . . . . . . . . . . . . . . . . . . . . . 68 4.1.4. Ingesting or Contacting Surface Water and Sediment . . . . . . . . . . . . . . . . 71
4.2. Potential Exposure Pathways . . . . . . . . . . . . . . . . . . . . . . . . . . . . . . . . . . . . . . . . . . 72
STAUFFER CHEMICAL COMPANY PUBLIC HEALTH ASSESSMENT – FINAL RELEASE
4.2.1 Drinking Off-Site Groundwater . . . . . . . . . . . . . . . . . . . . . . . . . . . . . . . . . 72 4.2.2. Contacting On-Site Subsurface Soils . . . . . . . . . . . . . . . . . . . . . . . . . . . . . 73 4.2.3. Eating Fish/Shellfish (Biota) . . . . . . . . . . . . . . . . . . . . . . . . . . . . . . . . . . . 73
4.3. Exposure Pathway Conclusions . . . . . . . . . . . . . . . . . . . . . . . . . . . . . . . . . . . . . . . . 75 5. PUBLIC HEALTH IMPLICATIONS . . . . . . . . . . . . . . . . . . . . . . . . . . . . . . . . . . . . . . . . . . . . . . . . 76
5.1. Introduction . . . . . . . . . . . . . . . . . . . . . . . . . . . . . . . . . . . . . . . . . . . . . . . . . . . . . . . . 76 5.2. Exposure to Sulfur Dioxide in Air and the Possibility of Harmful Effects . . . . . . . 77
5.2.1. Historical Air Exposure When Stauffer Was Operating . . . . . . . . . . . . . . 77 5.2.2. Sulfur Dioxide Levels Near Stauffer . . . . . . . . . . . . . . . . . . . . . . . . . . . . . 79 5.2.3. Possible Harmful Effects from Sulfur Dioxide in Residents . . . . . . . . . . . 82 5.2.4. Results From Modeling Past Exposures . . . . . . . . . . . . . . . . . . . . . . . . . . 86 5.2.5. Demographic Information for Past Exposures . . . . . . . . . . . . . . . . . . . . . . 88 5.2.6. Current Sulfur Dioxide Exposures . . . . . . . . . . . . . . . . . . . . . . . . . . . . . . . 88
5.3. Exposure to Particulate Matter in Air and the Possibility of Harmful Effects . . . . . 88 5.3.1. Background Information About Health Effects From Exposures to
Particulate Matter . . . . . . . . . . . . . . . . . . . . . . . . . . . . . . . . . . . . . . . . . . . 89 5.3.2. TSP, PM10, and PM2.5 Exposures Near Stauffer . . . . . . . . . . . . . . . . . . . . . 92 5.3.3. Chronic Exposures to Estimated Annual Average PM2.5 Levels . . . . . . . . 95 5.3.4. Acute Exposures to 24-Hour Average TSP . . . . . . . . . . . . . . . . . . . . . . . . 97 5.3.5. Acid Aerosol Exposures . . . . . . . . . . . . . . . . . . . . . . . . . . . . . . . . . . . . . . 99 5.3.6 Exposure to Metals and Other Particulates . . . . . . . . . . . . . . . . . . . . . . . 100 5.3.7. Exposures to Particulate Matter since 1981 and Possible Current Health
Effects . . . . . . . . . . . . . . . . . . . . . . . . . . . . . . . . . . . . . . . . . . . . . . . . . . 100 5.4. Exposure to Fluoride in Air and the Possibility of Harmful Effects . . . . . . . . . . . 100
5.4.1. Fluorides . . . . . . . . . . . . . . . . . . . . . . . . . . . . . . . . . . . . . . . . . . . . . . . . . 100 5.4.2. ATSDR Ombudsman’s Report . . . . . . . . . . . . . . . . . . . . . . . . . . . . . . . . 101 5.4.3. Historical Information About Fluoride Levels in Air . . . . . . . . . . . . . . . 101 5.4.4. Health Effects . . . . . . . . . . . . . . . . . . . . . . . . . . . . . . . . . . . . . . . . . . . . . . 102 5.4.5. Current Exposures . . . . . . . . . . . . . . . . . . . . . . . . . . . . . . . . . . . . . . . . . . 103
5.5. Exposure to Ionizing Radiation and the Possibility of Harmful Effects . . . . . . . . . 103 5.5.1. Introduction . . . . . . . . . . . . . . . . . . . . . . . . . . . . . . . . . . . . . . . . . . . . . . . 103 5.5.2. Radiologic Contaminant of Concern . . . . . . . . . . . . . . . . . . . . . . . . . . . . 104 5.5.3. Conclusions About Radiation . . . . . . . . . . . . . . . . . . . . . . . . . . . . . . . . . 105
5.6. Exposures to Contaminants in Private Well Water . . . . . . . . . . . . . . . . . . . . . . . . 105 5.6.1. Arsenic and the Possibility of Noncancerous Effects . . . . . . . . . . . . . . . 106 5.6.2. Arsenic and the Possibility of Cancer . . . . . . . . . . . . . . . . . . . . . . . . . . . 108 5.6.3. Lead and the Possibility of Harmful Effects . . . . . . . . . . . . . . . . . . . . . . 110
5.7. Exposure to Contaminants in Soil and the Possibility of Harmful Effects . . . . . . . 110 5.7.1. Surface Soils, Pond Soils, and Slag at the Stauffer Facility . . . . . . . . . . 111 5.7.2. Arsenic and the Possibility of Noncancerous Harmful Effects . . . . . . . . 112 5.7.3. Arsenic and the Possibility of Cancer . . . . . . . . . . . . . . . . . . . . . . . . . . . 113 5.7.4. Surface Soil at Gulfside Elementary School . . . . . . . . . . . . . . . . . . . . . . 113
5.8. Exposures to Former Stauffer Workers . . . . . . . . . . . . . . . . . . . . . . . . . . . . . . . . . 113 5.8.1. Background . . . . . . . . . . . . . . . . . . . . . . . . . . . . . . . . . . . . . . . . . . . . . . . 113 5.8.2. Asbestos . . . . . . . . . . . . . . . . . . . . . . . . . . . . . . . . . . . . . . . . . . . . . . . . . . 114 5.8.3. Arsenic . . . . . . . . . . . . . . . . . . . . . . . . . . . . . . . . . . . . . . . . . . . . . . . . . . . 116 5.8.4. Carbon Monoxide . . . . . . . . . . . . . . . . . . . . . . . . . . . . . . . . . . . . . . . . . . 117
ii

STAUFFER CHEMICAL COMPANY PUBLIC HEALTH ASSESSMENT – FINAL RELEASE
5.8.5. Hydrogen Sulfide . . . . . . . . . . . . . . . . . . . . . . . . . . . . . . . . . . . . . . . . . . . 117 5.8.6. Lead . . . . . . . . . . . . . . . . . . . . . . . . . . . . . . . . . . . . . . . . . . . . . . . . . . . . . 118 5.8.7. Nickel . . . . . . . . . . . . . . . . . . . . . . . . . . . . . . . . . . . . . . . . . . . . . . . . . . . . 119 5.8.8. Phosphorus and Related Compounds . . . . . . . . . . . . . . . . . . . . . . . . . . . . 120 5.8.9. Sulfur Dioxide . . . . . . . . . . . . . . . . . . . . . . . . . . . . . . . . . . . . . . . . . . . . . 122 5.8.10. Total Dust, Quartz, and Silica . . . . . . . . . . . . . . . . . . . . . . . . . . . . . . . . 122 5.8.11. Total Chromium . . . . . . . . . . . . . . . . . . . . . . . . . . . . . . . . . . . . . . . . . . . 123 5.8.12. Determination of Vital Status and Cause of Death for Former Workers
. . . . . . . . . . . . . . . . . . . . . . . . . . . . . . . . . . . . . . . . . . . . . . . . . . . . . . . . 125 5.8.13. Uncertainty and Limitations . . . . . . . . . . . . . . . . . . . . . . . . . . . . . . . . . 126 5.8.14. Summary of Exposure Findings . . . . . . . . . . . . . . . . . . . . . . . . . . . . . . . 127 5.8.15. Discussion . . . . . . . . . . . . . . . . . . . . . . . . . . . . . . . . . . . . . . . . . . . . . . . 128
6. CHILD HEALTH CONSIDERATIONS . . . . . . . . . . . . . . . . . . . . . . . . . . . . . . . . . . . . . . . . . . . . . 131 7. DISCUSSION OF COMMUNITY CONCERNS . . . . . . . . . . . . . . . . . . . . . . . . . . . . . . . . . . . . . . . . 132
7.1. Health Concerns . . . . . . . . . . . . . . . . . . . . . . . . . . . . . . . . . . . . . . . . . . . . . . . . . . . 132 7.2. Environmental Concerns . . . . . . . . . . . . . . . . . . . . . . . . . . . . . . . . . . . . . . . . . . . . . 136 7.3. Radiation Concerns . . . . . . . . . . . . . . . . . . . . . . . . . . . . . . . . . . . . . . . . . . . . . . . . . 137 7.4. Community Involvement Concerns . . . . . . . . . . . . . . . . . . . . . . . . . . . . . . . . . . . . 140 7.5. Health Education Concerns . . . . . . . . . . . . . . . . . . . . . . . . . . . . . . . . . . . . . . . . . . 140 7.6. Health Studies Concerns . . . . . . . . . . . . . . . . . . . . . . . . . . . . . . . . . . . . . . . . . . . . . 141
8. HEALTH OUTCOME DATA EVALUATION . . . . . . . . . . . . . . . . . . . . . . . . . . . . . . . . . . . . . . . . 143 8.1. Health Statistics Review of Populations Living Near Stauffer . . . . . . . . . . . . . . . . 143
8.1.1. Background . . . . . . . . . . . . . . . . . . . . . . . . . . . . . . . . . . . . . . . . . . . . . . . 143 8.1.2. Methods . . . . . . . . . . . . . . . . . . . . . . . . . . . . . . . . . . . . . . . . . . . . . . . . . . 143 8.1.3. Results . . . . . . . . . . . . . . . . . . . . . . . . . . . . . . . . . . . . . . . . . . . . . . . . . . . 144 8.1.4. Discussion . . . . . . . . . . . . . . . . . . . . . . . . . . . . . . . . . . . . . . . . . . . . . . . . 144
9. CONCLUSIONS . . . . . . . . . . . . . . . . . . . . . . . . . . . . . . . . . . . . . . . . . . . . . . . . . . . . . . . . . . . . . 146 9.1. Past Site Conditions and Exposures . . . . . . . . . . . . . . . . . . . . . . . . . . . . . . . . . . . . 146
9.1.1. Historical (Past) Air Exposures Before 1982 . . . . . . . . . . . . . . . . . . . . . 146 9.1.2. Contaminants in Private Drinking Water Supplies . . . . . . . . . . . . . . . . . 151 9.1.3. Former Gulfside Elementary Students . . . . . . . . . . . . . . . . . . . . . . . . . . 151 9.1.4. Former Stauffer Workers . . . . . . . . . . . . . . . . . . . . . . . . . . . . . . . . . . . . . 153 9.1.5. Health Statistics Review . . . . . . . . . . . . . . . . . . . . . . . . . . . . . . . . . . . . . 153
9.2. Current Site Conditions and Exposures . . . . . . . . . . . . . . . . . . . . . . . . . . . . . . . . . 154 9.2.1. Current Air Exposures . . . . . . . . . . . . . . . . . . . . . . . . . . . . . . . . . . . . . . . 154 9.2.2. Recreational Use of the Anclote River . . . . . . . . . . . . . . . . . . . . . . . . . . 154 9.2.3. Other Current Exposures . . . . . . . . . . . . . . . . . . . . . . . . . . . . . . . . . . . . . 154
9.3. Future Site Conditions and Exposures . . . . . . . . . . . . . . . . . . . . . . . . . . . . . . . . . . 155 9.3.1. Radioactivity in On-Site Slag . . . . . . . . . . . . . . . . . . . . . . . . . . . . . . . . . 155 9.3.2. Contaminants in On-Site Soil . . . . . . . . . . . . . . . . . . . . . . . . . . . . . . . . . 155
10. RECOMMENDATIONS . . . . . . . . . . . . . . . . . . . . . . . . . . . . . . . . . . . . . . . . . . . . . . . . . . . . . . 156 11. PUBLIC HEALTH ACTION PLAN . . . . . . . . . . . . . . . . . . . . . . . . . . . . . . . . . . . . . . . . . . . . . . 157 12. PREPARERS OF REPORT . . . . . . . . . . . . . . . . . . . . . . . . . . . . . . . . . . . . . . . . . . . . . . . . . . . . . 161 13. REFERENCES . . . . . . . . . . . . . . . . . . . . . . . . . . . . . . . . . . . . . . . . . . . . . . . . . . . . . . . . . . . . 163 APPENDIX A – FIGURES . . . . . . . . . . . . . . . . . . . . . . . . . . . . . . . . . . . . . . . . . . . . . . . . . . . . . . A-1 APPENDIX B – TABLES . . . . . . . . . . . . . . . . . . . . . . . . . . . . . . . . . . . . . . . . . . . . . . . . . . . . . . . . B-1
iii
STAUFFER CHEMICAL COMPANY PUBLIC HEALTH ASSESSMENT – FINAL RELEASE
APPENDIX C – DETAILED DISCUSSION OF SITE SAMPLING INVESTIGATIONS AND ENVIRONMENTAL
CONTAMINATION DATA . . . . . . . . . . . . . . . . . . . . . . . . . . . . . . . . . . . . . . . . . . . . . . . . . . . . . . . C-1 APPENDIX D – DESCRIPTION OF COMPARISON VALUES AND OTHER HEALTH-BASED GUIDELINES
. . . . . . . . . . . . . . . . . . . . . . . . . . . . . . . . . . . . . . . . . . . . . . . . . . . . . . . . . . . . . . . . . . . . . . . . . . D-1 APPENDIX E – REVIEW OF PERTINENT HUMAN AND ANIMAL STUDIES FOLLOWING BRIEF
EXPOSURES TO SULFUR DIOXIDE . . . . . . . . . . . . . . . . . . . . . . . . . . . . . . . . . . . . . . . . . . . . . . . . E-1 APPENDIX F – DEFINITIONS FOR TSP, PM10, AND PM2.5 . . . . . . . . . . . . . . . . . . . . . . . . . . . . . . . F-1 APPENDIX G – ESTIMATION OF PM10 AND PM2.5 CONCENTRATIONS FROM MEASURED TSP CONCENTRATIONS . . . . . . . . . . . . . . . . . . . . . . . . . . . . . . . . . . . . . . . . . . . . . . . . . . . . . . . . . . G-1 APPENDIX H – ATSDR GLOSSARY OF ENVIRONMENTAL HEALTH TERMS . . . . . . . . . . . . . . . H-1 APPENDIX I – ATSDR FACT SHEETS . . . . . . . . . . . . . . . . . . . . . . . . . . . . . . . . . . . . . . . . . . . . . I-1 APPENDIX J – PUBLIC COMMENTS ON THE STAUFFER CHEMICAL COMPANY PUBLIC HEALTH
ASSESSMENT AND ATSDR’S RESPONSES . . . . . . . . . . . . . . . . . . . . . . . . . . . . . . . . . . . . . . . . . . J-1
iv

STAUFFER CHEMICAL COMPANY PUBLIC HEALTH ASSESSMENT – FINAL RELEASE
LIST OF FIGURES
Figure 1. Stauffer Chemical Company and Vicinity
Figure 2. General Location and Demographic Information
Figure 3. Private Wells in the Stauffer Area
Figure 4. Soil Sampling Locations
Figure 5. Monitoring Well Locations
Figure 6. Private Well Sample Locations
Figure 7. Surface Water Sampling Locations
Figure 8. Sediment Sample Locations
Figure 9. Wind Rose for PCDEM’s Anclote Road Meteorologic Station: 1979–1996
Figure 10. Wind Rose for PCDEM’s Anclote Road Meteorologic Station: January 1979–May 1981, 8:00 AM–3:00 PM
Figure 11. Wind Rose for Tampa International Airport: 1979–1996
Figure 12. Wind Rose for Tampa International Airport: January 1978–May 1981, 8:00 AM–3:00 PM
Figure 13. Wind Rose for St. Petersburg-Clearwater: 1979–1996
Figure 14. Wind Rose for St. Petersburg-Clearwater: January 1978–May 1981, 8:00 AM–3:00 PM
Figure 15. Average Sulfur Dioxide Concentration, Anclote Road Monitoring Station, by Wind Direction, 1979–1981
Figure 16. Average Sulfur Dioxide Concentration, Anclote Road Monitoring Station, by Wind Direction, 1982–1984
Figure 17. Average TSP Concentration, Anclote Road Monitoring Station, by Wind Direction, 1979–1981
Figure 18. Average TSP Concentration, Anclote Road Monitoring Station, Wind Direction, 1982–1984
Figure 19. Air Modeling Receptor Locations
Figure 20. Hourly Sulfur Dioxide Levels From July 1977 to August 1981
Figure 21. Hourly Sulfur Dioxide Levels on December 18, 1977
Figure 22. Hourly Sulfur Dioxide Levels Over 3 Days in January 1978
Figure 23. Hourly Sulfur Dioxide Levels on December 26, 1977
Figure 24. Location of the Kiln and a Distance of 1,540 Feet
Figure 25. One-Mile Radius From the Kiln and 1980 Demographic Information
v

STAUFFER CHEMICAL COMPANY PUBLIC HEALTH ASSESSMENT – FINAL RELEASE
Figure 26. Predicted Annual Average Sulfur Dioxide Levels
Figure 27. Predicted Maximum Hourly Sulfur Dioxide Levels
vi
STAUFFER CHEMICAL COMPANY PUBLIC HEALTH ASSESSMENT – FINAL RELEASE
LIST OF TABLES
Table 1. Stauffer Chemical Company Site, Former Ponds/Dredged Material Piles Designations
Table 2. On-Site Soil Sampling Summary Data, Pond Soils
Table 3. On-Site Soil Sampling Summary Data, Slag
Table 4. On-Site Soil Sampling Summary Data, Surface Soil
Table 5. On-Site Soil Sampling Summary Data, Surface Soil Contaminants of Potential Concern
Table 6. Stauffer Chemical Company Site, Monitoring Well Identifications (1985 to 2002)
Table 7. On-Site Groundwater Monitoring Summary Data, Surficial Aquifer
Table 8. On-Site Groundwater Monitoring Summary Data, Floridan Aquifer
Table 9. Maximum Contaminant Levels Detected in Potable Water Wells (Wells 5, 12, 13, and 15) at Stauffer Chemical Company, Tarpon Springs, Florida, Before 1979 (When Use of These Wells Ceased)
Table 10. Maximum Contaminant Levels Detected in Backup Potable Water Wells (Wells 7, 10, and 14) at Stauffer Chemical Company, Tarpon Springs, Florida, Before 1979 (When Use of Potable Wells Ceased)
Table 11. Off-Site Soil Sampling Summary Data, Gulfside Elementary School Surface Soils
Table 12. Private Well Sample Locations and Dates Sampled
Table 13. Private Well Summary Data—Contaminants Detected at Levels Above Comparison Values, Residential Wells
Table 14. Private Well Summary Data—Contaminants Detected at Levels Above Comparison Values, Commercial Wells
Table 15. Private Well Summary Data—Contaminants Detected at Levels Above Comparison Values, Irrigation Wells
Table 16. Surface Water Summary Data, Anclote River, Upstream
Table 17. Surface Water Summary Data, Anclote River, Adjacent
Table 18. Surface Water Summary Data, Anclote River, Meyers Cove
Table 19. Surface Water Summary Data, Anclote River, Downstream
Table 20. Sediment Summary Data, Anclote River, Upstream
Table 21. Sediment Summary Data, Anclote River, Adjacent
Table 22. Sediment Summary Data, Anclote River, Meyers Cove
Table 23. Sediment Summary Data, Anclote River, Downstream
Table 24. Surface Water Sampling Location Designations
Table 25. Sediment Sampling Location Designations
vii
STAUFFER CHEMICAL COMPANY PUBLIC HEALTH ASSESSMENT – FINAL RELEASE
Table 26. Meteorological Data Available for the Stauffer Chemical Company Site
Table 27. Contaminant Emission Rates for Air Dispersion Model Inputs
Table 28. Stack Parameters for Air Dispersion Modeling Analysis
Table 29. Descriptions and Coordinates for Locations Included in the Air Dispersion Modeling Analysis
Table 30. Predicted and Observed Sulfur Dioxide Concentrations: Anclote Road Monitoring Station
Table 31. Predicted Percent Decrease in Sulfur Dioxide Concentrations after the 1979 Rotary Kiln Stack Modification
Table 32. Estimated Annual Average Concentrations of “Total Particulates” Resulting from Stauffer Chemical Company’s Air Emissions
Table 33. Estimated Highest 24-Hour Average Concentrations of “Total Particulates” Resulting from Stauffer Chemical Company’s Air Emissions
Table 34. Index of Air Sampling Studies Conducted While the Stauffer Chemical Company Facility Operated (1948–1981)
Table 35. Sulfur Dioxide Levels at the Anclote Road Monitoring Station
Table 36. Index of Air Sampling Studies Conducted after Stauffer Chemical Company Production Operations Ceased (1982–2002)
Table 37. Stauffer Chemical Company Site, Tarpon Springs, Florida, Completed Exposure Pathways
Table 38. Stauffer Chemical Company Site, Tarpon Springs, Florida, Potential Exposure Pathways
Table 39. Hourly Sulfur Dioxide Levels at the Anclote Road Monitoring Station When Stauffer Chemical Company Was Operating, Number of Samples Greater Than ATSDR’s Acute Inhalation MRL of 10 ppb
Table 40. Summary of Studies Showing Effects to the Lung From Sulfur Dioxide Exposure in Persons With and Without Asthma. Pertinent Animal Studies are Also Reported.
Table 41. Hourly Sulfur Dioxide Levels at the Anclote Road Monitoring Station When Stauffer Chemical Company Was Operating, Number of Samples Greater than 100 ppb
Table 42. Frequency of Significantly Elevated Hourly Sulfur Dioxide Levels at the Anclote Road Monitoring Station in Relation to Wind Direction
Table 43. Estimated Number of Hours that Hourly Sulfur Dioxide Levels Might Have Exceeded 100 ppb in Four Areas From January to May 1979
Table 44. Annual Average Sulfur Dioxide Levels From 1977 to 1982
Table 45. Predicted Maximum Hourly Sulfur Dioxide Levels, 1977 to 1981, at Various Locations Around Tarpon Springs
viii
STAUFFER CHEMICAL COMPANY PUBLIC HEALTH ASSESSMENT – FINAL RELEASE
Table 46. Predicted Annual Average Sulfur Dioxide Levels, 1977 to 1981, at Various Locations Around Tarpon Springs
Table 47. Summary of Recent Important Epidemiologic/Controlled Human Particulate Matter Exposure Studies of Specific Physiologic End Points
Table 48. Estimated PM10 Levels Based on TSP Levels Measured at the Anclote Road Monitoring Station From 1977 to 1989
Table 49. Estimated PM2.5 Levels at the Anclote Road Monitoring Station From 1977 to 1989
Table 50. Summary of Epidemiologic Evidence of Health Effects of Acute Exposure to Particulate Matter Air Pollutants
Table 51. Summary of Arsenic and Lead Levels in Private Wells Near the Stauffer Chemical Company Site
Table 52. Summary of Arsenic Levels in On-Site Surface Soils, Pond Soils, and Slag
Table 53. Estimated Dose of Arsenic in Children From Exposure to On-Site Surface Soils, Pond Soils, and Slag
Table 54. Theoretical Risk of Cancer From Arsenic in Soil
Table 55. List of Area/Job Classification Categories for Stauffer Chemical Company, Tarpon Springs
Table 56. Worker Exposure Concentration and Limits From Stauffer Chemical Company, Tarpon Springs, Monitoring Data
Table 57. Contaminants Exceeding an Occupational Standard or ATSDR Comparison Value at Stauffer Chemical Company in Tarpon Springs
Table 58. Theoretical Cancer Risks for Stauffer Occupational Exposures
ix

STAUFFER CHEMICAL COMPANY PUBLIC HEALTH ASSESSMENT – FINAL RELEASE
LIST OF ABBREVIATIONS
ACFM actual cubic feet per minute ACGIH American Conference of Governmental Industrial Hygienists ACM asbestos-containing materials ACS American Cancer Society ATSDR Agency for Toxic Substances and Disease Registry B Detected in the associated laboratory blank and in the sample bgs below ground surface bls below land surface Bq/kg becquerels/kilogram C-EMEG chronic environmental media evaluation guide CAT computed axial tomography CERCLA Comprehensive Environmental Response, Compensation, and Liability Act CLP Contract Laboratory Program COPD chronic obstructive pulmonary disease CRDL contract-required detection level CREG cancer risk evaluation guide CTD conductivity, temperature, and depth CVs comparison values EE&G Evans Environmental & Geological Science and Management, Inc. EGR external gamma radiation EMF Eastern Michaud Flats EP environmental pollutants EPA U.S. Environmental Protection Agency ERG Eastern Research Group ESI expanded site investigation f/cc fibers per cubic centimeter FCDS Florida Cancer Data System FDEP Florida Department of Environmental Protection FDER Florida Department of Environmental Regulation FDOH Florida Department of Health FFWC Florida Fish and Wildlife Conservation Commission GES Gulfside Elementary School HEI Health Effects Institute HRS hazard ranking system HSCS Harvard Six Cities Study HSL hazardous substance list I approximate value between the detection level and quantitation level I-EMEG intermediate environmental media evaluation guide ICRP International Committee on Radiation Protection ISCST3 Industrial Source Complex, Short Term J Estimated quantity below the quantitation limit LOAEL lowest-observed-adverse-effect level LTHA lifetime health advisory
x

STAUFFER CHEMICAL COMPANY PUBLIC HEALTH ASSESSMENT – FINAL RELEASE
m/s m3/s MCL MCLG mg/kg/day mg
m3mg/MRL N N-2-N NA NAAQS NCDC NCRP NESHAP NIOSH NMMAPS NOAEL NPL NSDWRs OSHA PAH PBS&J PCBs PCDEM pCi/g pCi/L PCM PHAP PM10 PM2.5 ppb PPE ppm RBC RBC-C RBC-N RCRA RI RMEG SALP SCC SFWMD SIR SMC STEL
meters per second cubic meters per second maximum contaminant level maximum contaminant level goal milligrams chemical per kilogram body weight per day milligrams milligrams per cubic meter minimal risk level presumptive evidence of presence of material Neighbor-2-Neighbor not available National Ambient Air Quality Standards National Climatic Data Center National Council on Radiation Protection and Measurements National Emission Standards for Hazardous Air Pollutants National Institute for Occupational Safety and Health National Morbidity, Mortality, and Air Pollution Study no-observed-adverse-effect level National Priorities List National Secondary Drinking Water Regulations Occupational Safety and Health Administration polycyclic aromatic hydrocarbon Post, Buckley, Smith and Jernigan polychlorinated biphenyls Pinellas County Department of Environmental Management picocuries per gram picocuries per liter phase contrast microscopy public health action plan particulate matter less than 10 micrometers in diameter particulate matter less than or equal to 2.5 micrometers in diameter parts per billion personal protective equipment parts per million risk-based concentration risk-based concentration, for cancer effects risk-based concentration, for noncancer effects Resource Conservation and Recovery Act remedial investigation reference dose media evaluation guide synthetic precipitation leaching potential Stauffer Chemical Company Southwest Florida Water Management District standardized incidence ratio Stauffer Management Company short-term exposure limit
xi

X
STAUFFER CHEMICAL COMPANY PUBLIC HEALTH ASSESSMENT – FINAL RELEASE
SVOCs T TAL TCL TCLP TEM TLV TOC TSP TWA UNSCEAR VOCs
µg/kg/day
semivolatile organic compounds compound tentatively identified by laboratory during analysis target analyte list total compound list toxicity characteristic leaching procedure transmission electron microscopy threshold-limit value total organic carbon total suspended particulates time-weighted average United Nations Scientific Committee on the Effects of Atomic Radiation volatile organic compounds result is less than the CRDL, but greater than or equal to the instrument detection limit micrograms chemical per kilogram body weight per day
xii

STAUFFER CHEMICAL COMPANY PUBLIC HEALTH ASSESSMENT – FINAL RELEASE
EXECUTIVE SUMMARY
This public health assessment for the Stauffer Chemical Company (Stauffer) site in Tarpon Springs, Florida, is in response to recommendations from the December 2000 Ombudsman Report of Findings and Recommendations Regarding the Stauffer Chemical Company Site, Tarpon Springs, Florida. The report recommended that the Agency for Toxic Substances and Disease Registry (ATSDR) prepare a new public health assessment to more thoroughly address community concerns about the site.
The Stauffer site is ½-mile south of the Pasco-Pinellas county line and 1.6 miles east of the Gulf of Mexico. From 1947 to 1981, the 138-acre site operated as a chemical plant that extracted elemental phosphorus from phosphate ore. The facility included a phosphate ore processing area, elemental phosphorus production facilities, a slag processing area, and a system of settling ponds. Residual wastes from the operation were disposed in on-site settling ponds and in the slag processing area, both of which are groundwater contamination sources.
According to 1980 Census data, almost 6,000 people lived within 1 mile of the site. Approximately 9,200 people lived within 1 mile of the site according to 2000 Census data.
The major surface water in the site area is the Anclote River. The river is primarily used for recreation, including boating and swimming, and support of wildlife.
A. Environmental Contaminants
Following are summaries of data from site–sampling investigations and monitoring programs. More information on these summaries can be found in the Environmental Contamination and Other Hazards section of this document. ATSDR reviewed the environmental data and selected contaminants warranting further evaluation based on (1) the adequacy of the sampling conducted, (2) the maximum concentration and frequency of detection of the contaminants found in various media, and (3) comparison of the maximum detected concentrations with health-based screening values, also known as comparison values (CVs). Contaminants detected at levels above ATSDR’s CVs do not necessarily pose a health hazard. Such detection simply means that further evaluation is needed to determine whether adverse health effects might be expected under site-specific exposure conditions (see Exposure Pathway and Conclusion sections below for the results of these evaluations). Note also that the identification of a particular substance does not imply that it is related to the site; ATSDR also assessed how detected levels of some substances (e.g., naturally occurring elements) compare to typical background concentrations.
< On-site soil/slag samples contained arsenic, cadmium, thallium, fluoride, and radium-226 at concentrations that exceed ATSDR’s comparison values (CVs). On-site surface soil samples from two locations also contained asbestos at very low levels.
< Groundwater samples from the shallow aquifer (on-site) contained a number of contaminants at levels that exceed ATSDR CVs. These contaminants include aluminum, antimony, arsenic, boron, cadmium, chromium, fluoride, iron, lead, lithium, manganese, mercury, nickel, selenium, thallium, vanadium, sulfate, gross alpha, radium-226, and radon-222.
STAUFFER CHEMICAL COMPANY PUBLIC HEALTH ASSESSMENT – FINAL RELEASE
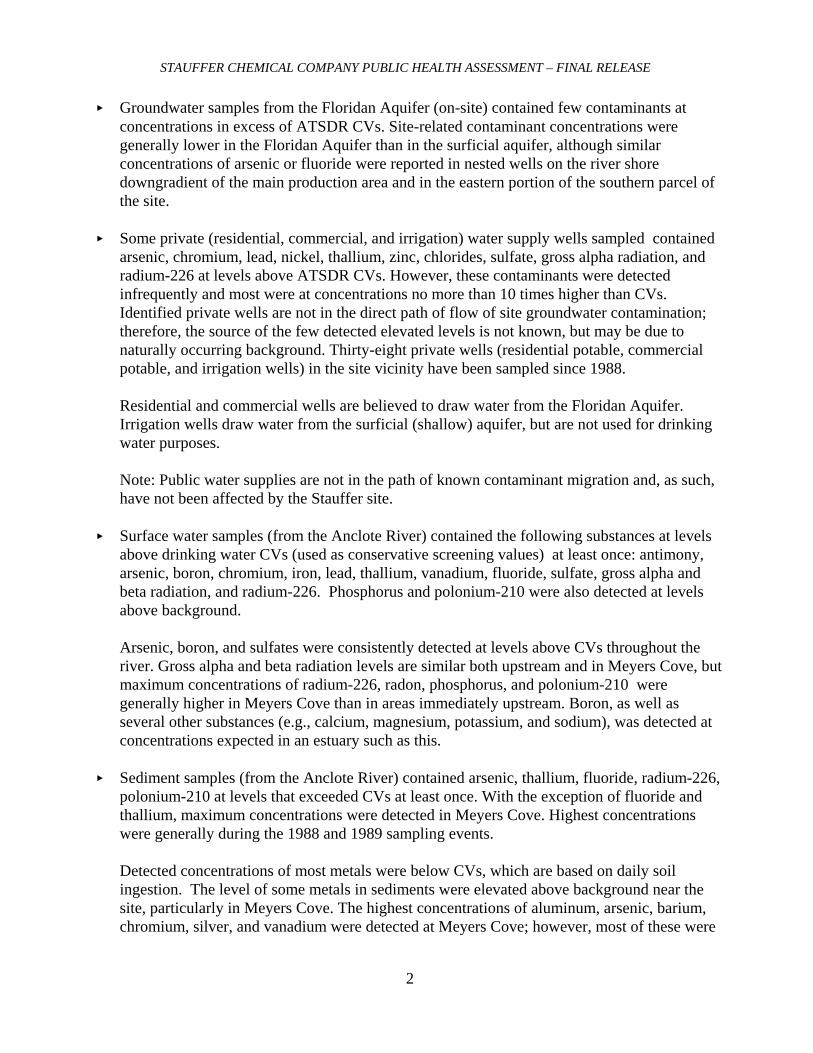
< Groundwater samples from the Floridan Aquifer (on-site) contained few contaminants at concentrations in excess of ATSDR CVs. Site-related contaminant concentrations were generally lower in the Floridan Aquifer than in the surficial aquifer, although similar concentrations of arsenic or fluoride were reported in nested wells on the river shore downgradient of the main production area and in the eastern portion of the southern parcel of the site.
< Some private (residential, commercial, and irrigation) water supply wells sampled contained arsenic, chromium, lead, nickel, thallium, zinc, chlorides, sulfate, gross alpha radiation, and radium-226 at levels above ATSDR CVs. However, these contaminants were detected infrequently and most were at concentrations no more than 10 times higher than CVs. Identified private wells are not in the direct path of flow of site groundwater contamination; therefore, the source of the few detected elevated levels is not known, but may be due to naturally occurring background. Thirty-eight private wells (residential potable, commercial potable, and irrigation wells) in the site vicinity have been sampled since 1988.
Residential and commercial wells are believed to draw water from the Floridan Aquifer. Irrigation wells draw water from the surficial (shallow) aquifer, but are not used for drinking water purposes.
Note: Public water supplies are not in the path of known contaminant migration and, as such, have not been affected by the Stauffer site.
< Surface water samples (from the Anclote River) contained the following substances at levels above drinking water CVs (used as conservative screening values) at least once: antimony, arsenic, boron, chromium, iron, lead, thallium, vanadium, fluoride, sulfate, gross alpha and beta radiation, and radium-226. Phosphorus and polonium-210 were also detected at levels above background.
Arsenic, boron, and sulfates were consistently detected at levels above CVs throughout the river. Gross alpha and beta radiation levels are similar both upstream and in Meyers Cove, but maximum concentrations of radium-226, radon, phosphorus, and polonium-210 were generally higher in Meyers Cove than in areas immediately upstream. Boron, as well as several other substances (e.g., calcium, magnesium, potassium, and sodium), was detected at concentrations expected in an estuary such as this.
< Sediment samples (from the Anclote River) contained arsenic, thallium, fluoride, radium-226, polonium-210 at levels that exceeded CVs at least once. With the exception of fluoride and thallium, maximum concentrations were detected in Meyers Cove. Highest concentrations were generally during the 1988 and 1989 sampling events.
Detected concentrations of most metals were below CVs, which are based on daily soil ingestion. The level of some metals in sediments were elevated above background near the site, particularly in Meyers Cove. The highest concentrations of aluminum, arsenic, barium, chromium, silver, and vanadium were detected at Meyers Cove; however, most of these were
2
STAUFFER CHEMICAL COMPANY PUBLIC HEALTH ASSESSMENT – FINAL RELEASE
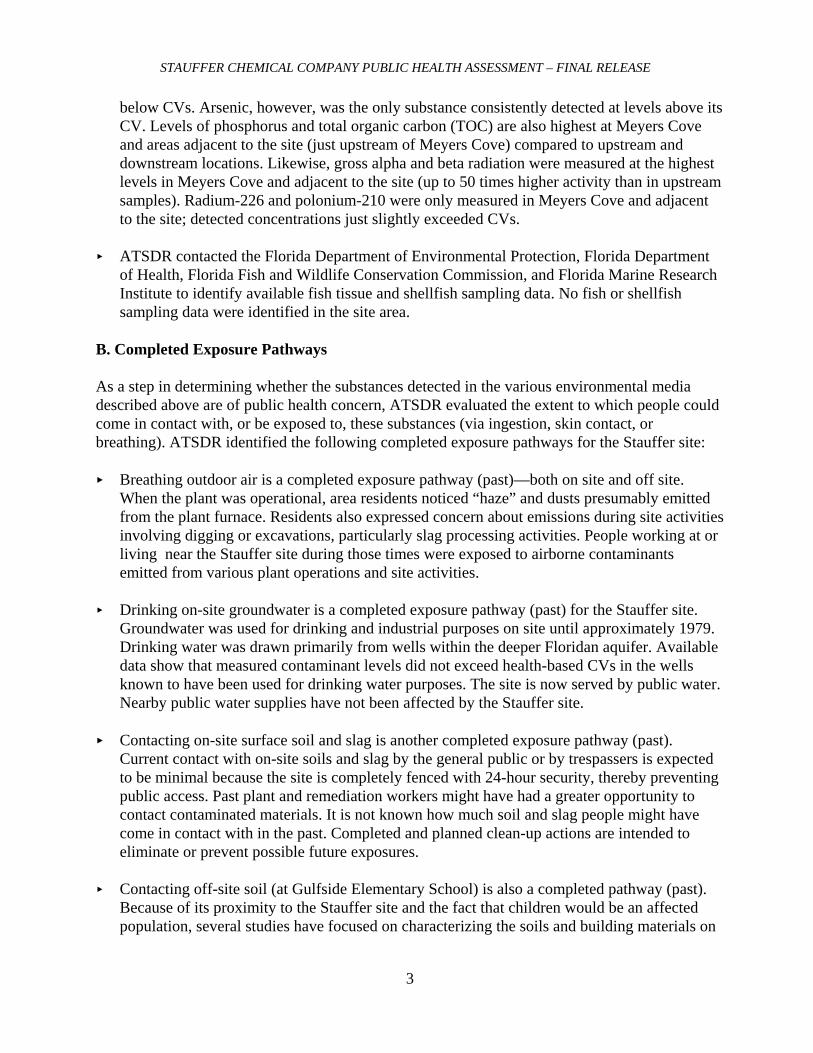
below CVs. Arsenic, however, was the only substance consistently detected at levels above its CV. Levels of phosphorus and total organic carbon (TOC) are also highest at Meyers Coveand areas adjacent to the site (just upstream of Meyers Cove) compared to upstream and downstream locations. Likewise, gross alpha and beta radiation were measured at the highest levels in Meyers Cove and adjacent to the site (up to 50 times higher activity than in upstream samples). Radium-226 and polonium-210 were only measured in Meyers Cove and adjacent to the site; detected concentrations just slightly exceeded CVs.
< ATSDR contacted the Florida Department of Environmental Protection, Florida Department of Health, Florida Fish and Wildlife Conservation Commission, and Florida Marine Research Institute to identify available fish tissue and shellfish sampling data. No fish or shellfish sampling data were identified in the site area.
B. Completed Exposure Pathways
As a step in determining whether the substances detected in the various environmental media described above are of public health concern, ATSDR evaluated the extent to which people could come in contact with, or be exposed to, these substances (via ingestion, skin contact, or breathing). ATSDR identified the following completed exposure pathways for the Stauffer site:
< Breathing outdoor air is a completed exposure pathway (past)—both on site and off site. When the plant was operational, area residents noticed “haze” and dusts presumably emitted from the plant furnace. Residents also expressed concern about emissions during site activities involving digging or excavations, particularly slag processing activities. People working at or living near the Stauffer site during those times were exposed to airborne contaminants emitted from various plant operations and site activities.
< Drinking on-site groundwater is a completed exposure pathway (past) for the Stauffer site. Groundwater was used for drinking and industrial purposes on site until approximately 1979. Drinking water was drawn primarily from wells within the deeper Floridan aquifer. Available data show that measured contaminant levels did not exceed health-based CVs in the wells known to have been used for drinking water purposes. The site is now served by public water. Nearby public water supplies have not been affected by the Stauffer site.
< Contacting on-site surface soil and slag is another completed exposure pathway (past). Current contact with on-site soils and slag by the general public or by trespassers is expected to be minimal because the site is completely fenced with 24-hour security, thereby preventing public access. Past plant and remediation workers might have had a greater opportunity to contact contaminated materials. It is not known how much soil and slag people might have come in contact with in the past. Completed and planned clean-up actions are intended to eliminate or prevent possible future exposures.
< Contacting off-site soil (at Gulfside Elementary School) is also a completed pathway (past). Because of its proximity to the Stauffer site and the fact that children would be an affected population, several studies have focused on characterizing the soils and building materials on
3

STAUFFER CHEMICAL COMPANY PUBLIC HEALTH ASSESSMENT – FINAL RELEASE
the Gulfside Elementary School property. Other than radium-226, no contaminants were detected at elevated levels in school soils. No other off-site soil data are available.
< Contacting off-site slag/building materials is also a completed exposure pathway. Slag was used as roadway and building material throughout nearby communities. The extent to which Stauffer contributed to these materials cannot be determined because other elemental phosphorus plants in the Central Florida area also produced slag. It is not known how much direct contact people have had with slag in these areas, but sampling results show relatively low contaminant concentrations (especially when compared with on-site conditions). External gamma radiation exposures associated with these materials also were measured and determined not to be harmful.
< Ingesting and contacting surface water and sediment (in the Anclote River) are completed exposure pathways because contaminated groundwater from beneath the Stauffer site discharges to the river, and people might come in contact with water and sediment when using the river. The river is used for boating, fishing, swimming, and wading. In general, however, water and sediment samples, especially those collected away from the site (e.g., downstream locations sampled near the mouth of the river) do not show unusually elevated contaminant levels. The highest detected contaminant concentrations in sediment were found in Meyers Cove. In addition, ingestion of surface water contaminants is likely to be minimal because the river is brackish and is not used as a drinking water source.
C. Potential Exposure Pathways
ATSDR identified the following potential exposure pathways for the Stauffer site:
< Drinking off-site groundwater is considered a potential exposure pathway (past, current, and future) because private wells tapping the deep aquifer have and continue to be used by some area residents and businesses for drinking and other purposes. Some nearby shallow groundwater wells are used for irrigation and lawn-watering activities. Available sampling data (1988–2002) show a few contaminants at slightly elevated levels in area private wells. The source of these contaminants, however, has not been linked with the Stauffer site.
< Eating fish and shellfish (biota) is a potential exposure pathway (past, present, and future). While residents may eat fish and shellfish from the Anclote River, fish and shellfish are not likely to be contaminated with chemicals from the Stauffer facility. Chemicals detected in soil, water, and air from the Stauffer facility are not known to concentrate in fish or shellfish. It should be noted, however, that the Florida Department of Health has issued a fish advisory for the Anclote River because of mercury contamination. Mercury contamination in fish is not from the Stauffer facility.
D. Conclusions
Following are findings from ATSDR’s assessment of public health hazards associated with human exposure to contaminants from the Stauffer site. This assessment was conducted primarily
4
STAUFFER CHEMICAL COMPANY PUBLIC HEALTH ASSESSMENT – FINAL RELEASE
in response to concerns expressed by the Tarpons Springs community. These concerns include: (1) past and current air exposures, (2) student exposures at Gulfside Elementary School, (3) using nearby private wells for drinking and agricultural purposes, (4) past exposures of former Stauffer workers, and (5) a perceived excess of cancer and other illnesses in the site area. ATSDR reached its conclusions based on a comprehensive evaluation of available site information and environmental sampling data.
ATSDR has concluded that the following exposure pathways do not pose a public health hazard because people would not be exposed to contaminants from the site at levels known to result in adverse health effects.
< Drinking on-site water (past). < Contacting on-site surface soil and slag (current). < Contacting off-site slag/building materials (past/current/future). < Contacting surface water and sediment in the Anclote River during recreational activities
(past/current/future) < Eating fish and shellfish (past/current/future).
ATSDR’s conclusions regarding the other exposure pathways associated with the Stauffer site are discussed below.
1. Historical (Past) Exposures
i. Air Exposures (Before 1982)
Levels of air pollution in the immediate area of the Stauffer facility while it was operating (i.e., 1947–1981) were likely to be a public health hazard because of the combined emissions from the Stauffer facility and from other sources in the area. The components of air pollution that caused the health hazard were sulfur dioxide and particulate matter. These pollutants reached levels that in the scientific literature were associated with an increased incidence of adverse lung and heart conditions. Populations at greatest risk for suffering adverse health effects include children, the elderly, persons with preexisting heart or lung disease, and persons with asthma who lived or worked near the Stauffer facility. Some uncertainty exists in the health conclusions for long- and short-term exposures to particulate matter and long-term exposure to sulfur dioxide. However, both sulfur dioxide and particulate matter are likely to affect the lungs; therefore, any added particulate matter exposures in combination with sulfur dioxide exposures may have increased the risk of an adverse effect to the lungs. Specific perspective on the public health implications of exposure and uncertainty of exposures to sulfur dioxide and particulate matter follow.
Short-term and long-term exposure to particulate matter
Particulate matter is ubiquitous both in outdoor and indoor environments. Besides the multiple outdoor sources of particulate matter (PM) exposures to the community (including the Stauffer facility, the Florida Power Anclote Plant, automobiles, and others), numerous other indoor sources of PM exposures are present from cooking, cleaning, and other indoor activities. The
5

STAUFFER CHEMICAL COMPANY PUBLIC HEALTH ASSESSMENT – FINAL RELEASE
sampling data clearly demonstrate that air emissions when the Stauffer facility was active caused increases in particulate matter concentrations near the facility. However, the particulate matter levels measured near Stauffer between 1977–1981, though greater than Florida’s previous air quality standards, were not greater than the U.S. EPA standards for PM in place at that time and were similar to particulate matter levels routinely measured in many suburban and urban settings throughout the state. When ATSDR evaluates exposure to environmental contamination, our primary role is to examine whether exposures are at levels associated with adverse health effects. Whether other populations experienced greater or lesser exposures does not factor into our public health evaluations for a given site.
ATSDR relied on the vast epidemiological evidence that strongly suggests that short- and long-term exposure to particulate matter is associated with adverse lung and heart diseases. Specifically, the scientific literature has shown associations with very serious health effects (death) to less serious health effects (e.g., slight lung function changes). A population exposed to particulate matter attributable to Stauffer is more likely to have experienced the less serious health effects of lung and heart diseases and reductions in lung function than other, more serious health effects reported in the literature. Although ATSDR provides this perspective for the community to better understand their risk of the most serious adverse health effect, we do so with some uncertainty. Given that the exposed population may have had a higher percentage of elderly (a likely sensitive population), ATSDR cannot completely rule out any of the adverse health effects that have been associated with PM exposures. In any case, the risk of an adverse cardiopulmonary health outcome was likely reduced once the Stauffer facility ceased operation in 1981 because the levels of exposure to particulate matter, especially the smaller, fine, particles were lowered.
Persons residing in or working in the following areas might have experienced adverse health effects similar to those reported in the literature from their exposures to particulate matter:
< The Flaherty Marina (before 1982), < Residential homes built before 1982 southwest of the Stauffer facility along the shore of the
Anclote River, < Residential homes west of the Stauffer facility built before 1982 and within 1,540 feet of the
kiln, and < Commercial and industrial businesses east of the Stauffer facility along Anclote Road built
before 1982 and within 1,540 feet of the kiln.
Short-term exposure to sulfur dioxide
Air monitoring data are available for 1977 to 1979, and most of the time sulfur dioxide levels were below ATSDR’s health guideline of 10 parts per billion (ppb) for short-term exposures. Periodically, however, hourly sulfur dioxide levels at the Anclote Road monitoring station near the Flaherty Marina showed significantly elevated levels of sulfur dioxide. The highest average sulfur dioxide level detected in a 1-hour monitoring period was 840 parts per billion (ppb). Because valid human studies are available concerning the harmful effects of sulfur dioxide, ATSDR is concerned about the times when sulfur dioxide levels were above 100 ppb, the lowest
6

STAUFFER CHEMICAL COMPANY PUBLIC HEALTH ASSESSMENT – FINAL RELEASE
known level to cause a response in humans. The concern becomes greater at levels above 500 ppb.
People who lived in, worked in, or visited the following areas before when Stauffer was operating were at risk for harmful effects from exposure to sulfur dioxide based on hourly measurements. These areas include < The Flaherty Marina, < Residential homes southwest of the Stauffer facility along the shore of the Anclote River, < Residential homes west of the Stauffer facility, and < Commercial and industrial businesses east of the Stauffer facility along Anclote Road.
People who lived in, worked in, or visited these areas might have experienced the following harmful effects: < changes in lung function (such as, an increase in airway resistance and a narrowing of
airway), < wheezing and shortness of breath, < an increase in heart rate and breathing rate, < cough, and < irritation of the eyes, nose or throat.
It is important to remember that people who are most sensitive to the effects of sulfur dioxide include exercising asthmatics, and that only at the highest hourly levels detected (600 to 800 ppb) will healthy (non-asthmatic) people experience some of the symptoms of sulfur dioxide exposure.
ATSDR used an air dispersion model to predict sulfur dioxide levels in the surrounding community for times when Stauffer had a major release of sulfur dioxide. This model predicted that significant sulfur dioxide levels moved into the surrounding community. The modeling analysis offers a reasonable account of Stauffer’s past air quality impacts, based on the best available information. Like all modeling analyses, ATSDR’s modeling work for the Stauffer site has some uncertainties. Nevertheless, ATSDR believes that its analysis more likely underestimated Stauffer’s air quality impacts rather than overestimated them.
It is important to remember that exposure to relatively low levels of sulfur dioxide (for example, 100-ppb sulfur dioxide) is not likely to cause noticeable symptoms, such as wheezing or shortness of breath. At 100-ppb sulfur dioxide, only exercising asthmatics have shown responses, and these responses were mild changes in the lung’s airways (specifically, an increase in airway resistance). It should also be pointed out that the human studies conducted at 100 ppb had asthmatics breathe through a mouthpiece, thus increasing their exposure to sulfur dioxide but limiting olfactory exposure as well. It is uncertain if exercising asthmatics would experience these mild effects on the lungs if they were exercising and breathing through their mouth and nose. It is also important to know that this increase in airway resistance is temporary and will return to normal shortly after exposure ends. However, as sulfur dioxide levels exceed 500 ppb, some asthmatics will require medication to treat the symptoms of wheezing and shortness of breath.
7
STAUFFER CHEMICAL COMPANY PUBLIC HEALTH ASSESSMENT – FINAL RELEASE
Long-term exposure to sulfur dioxide
Results of air monitoring at the Anclote Road monitoring station and the air dispersion model showed that residents who lived in portions of Tarpon Springs, Holiday Estates, and surrounding areas were likely exposed for many years to elevated yearly sulfur dioxide levels. The sulfur dioxide levels are similar to levels shown in human studies to be associated with a small increase in mortality, particularly in people with pre-existing lung and heart disease. The increased risk of mortality existed while people were being exposed. Because of the low levels of exposure from 1977 to 1981, it is unlikely that people who were exposed in the past are currently at risk of harmful effects. Some uncertainty exists in these conclusions because (1) the sulfur dioxide exposure levels are estimates based on modeling information rather than actual measurements and (2) there is considerable uncertainty in our knowledge of health effects associated with long-term human exposure to sulfur dioxide.
Exposure to fluoride
The limited number of air samples that measured for fluoride did not show fluoride to be a health concern. However, one of the historical air samples showed fluoride levels at Stauffer’s fence line to be slightly above ATSDR’s acute Minimal Risk Level (MRL). Irritant effects from brief exposures to the fluoride level detected seem unlikely because the detected fluoride level was far below the level that caused harmful effects. Firm conclusions, however, cannot be drawn because the sample averaged fluoride levels over 24 hours, which might have masked higher levels of fluoride in a migrating cloud/plume. In addition, too few air samples were taken for fluorides when the Stauffer facility was operating to determine what levels of fluorides were being released. ATSDR’s modeling analysis, which was based on the best available emissions data, suggests that ambient air concentrations of fluorides did not exceed levels of health concern. Although this modeling analysis has limitations (most notably that emissions data were not available for every source at the facility), ATSDR is reassured by its previous evaluations of air quality issues at much larger elemental phosphorus production facilities, with very extensive air sampling data for fluorides, which showed no evidence of fluoride exposures at levels of health concern.
Exposure to Other Air Pollutants
Residents who lived near the Stauffer facility while it was operating were likely exposed to a number of additional contaminants in air (e.g., metals, phosphorus compounds, inorganic acids); however, the magnitude and impact of these exposures could not be evaluated from available site data and information.
Uncertainty in Health Conclusions About Air Pollutants
Some uncertainty exists in ATSDR’s health conclusions, such as
8
STAUFFER CHEMICAL COMPANY PUBLIC HEALTH ASSESSMENT – FINAL RELEASE
< The accuracy of the estimated levels of particulate matter less than 2.5 microns (PM2.5) for the 1970s and 1980s. ATSDR used two approaches that examine two entirely different data sets to estimate PM2.5 ambient air concentrations. One approach was air dispersion modeling and the other was extrapolation from measured total suspended particulates (TSP) levels. Though both approaches have inherent uncertainties, the fact that the approaches had reasonably consistent findings provides some confidence that the estimated PM2.5 concentrations do not grossly misrepresent Stauffer’s past impacts on air quality. Nonetheless, the approaches we used have inherent uncertainties and our estimated PM2.5 concentrations might be lower or higher than what actually occurred in the past. The methods and justifications for developing our PM2.5 concentration estimates are provided in later sections of the PHA.
< Links between exposures to particulate matter and sulfur dioxide and resulting adverse health effects. Some scientists believe that the associations found in epidemiological studies do not provide conclusive evidence that exposure to ambient levels of particulate matter and sulfur dioxide actually cause adverse cardiopulmonary health effects because a biological mechanism, among other things, has yet to be clearly established. While ATSDR acknowledges this uncertainty, based on the strong epidemiological evidence, we feel that a number of health effects were possible because of past exposures to Stauffer particulate matter and sulfur dioxide emissions.
< Types of particulate matter and their associated toxicity. Some studies suggest that certain types of particulate matter may be more or less toxic depending on the size of the particles and the composition. ATSDR has no information to conclude that the particulate matter emitted from Stauffer was any more or less toxic than particulate matter that has been associated with adverse cardiopulmonary health effects in the scientific literature.
< The overall interpretation of the scientific inquiry into the health effects of particulate matter and sulfur dioxide. For example, some suggest that particulate matter and sulfur dioxide can be viewed as a surrogate indicator for the overall mixture of air contaminants, as a specific cause of health effects, or both. Whatever the case, in general, ATSDR believes that reducing particulate matter and sulfur dioxide exposure would be expected to lead to reducing the frequency and severity of the health effects associated with exposure to particulate matter and sulfur dioxide.
< The levels of particulate matter that are considered protective for all segments of the population. ATSDR’s evaluation of the public health implications of exposures to particulate matter incorporates the understanding that no currently established “safe” levels of particulate matter exposure exist.
Review of Community Health Concerns about Past Stauffer Air Emissions
Some of the health concerns expressed by community members in relation to past air exposures related to the Stauffer facility (i.e., asthma, breathing problems, chronic obstructive pulmonary disease [COPD], and other nonspecific lung diseases) are reasonably consistent with adverse health outcomes reported in the epidemiologic literature for both acute and chronic exposures to
9

STAUFFER CHEMICAL COMPANY PUBLIC HEALTH ASSESSMENT – FINAL RELEASE
particulate matter (or sulfur dioxide). For asthma, it is important to note that the scientific literature does not currently suggest that PM causes asthma but that it may exacerbate it. Moreover, there are other known and suspected factors that may trigger asthma. A list of these triggers can be found at http://www.lungusa.org/asthma/astastrig.html and http://www.lungusa.org/asthma/asctriggers.html. The consistency between the community’s health concerns and the epidemiologic studies does not suggest that a specific person’s disease was caused by inhalation exposures to particulate matter. Rather, the cause of any disease is usually a result of multiple factors. For example, smoking is a strong risk factor for many lung and heart diseases. Therefore, smokers make up another population group likely at increased risk for particulate matter-related health effects (EPA 1996). ATSDR has not determined that any of these reported illnesses were elevated in the community in relation to exposures from Stauffer, but only that they are consistent with the findings from the scientific literature.
ii. Contaminants in Private Drinking Water Supplies
Two commercial wells and one private well near the Stauffer facility contained arsenic at levels that exceeded EPA’s drinking water standard of 10 ppb. The elevated arsenic levels are not believed to be related to groundwater contamination beneath the Stauffer site. It is unlikely that children or adults would experience noncancerous harmful effects from drinking water from these wells. However, a small theoretical increase in the risk of cancer can be calculated should someone drink 8 glasses (2 liters) of water from these wells on a daily basis over a lifetime; however, the risk might also be zero. Uncertainty exists in deciding the risk of cancer because only one well sample is available; therefore, the concentration of arsenic in the well throughout someone’s lifetime may vary. ATSDR’s estimate of a small theoretical increase in the risk of cancer assumes a lifetime of exposure at the arsenic concentration in that one sample.
Four private wells near the Stauffer facility contained lead at levels that exceeded EPA’s action level of 15 ppb. The elevated lead levels are not believed to be related to groundwater contamination under the Stauffer site. The highest lead level detected was 270 ppb. This level was detected only one time, which means that the people who used this well were probably only exposed for several months to lead. Lead levels 3 months before and 3 months after the high level were below EPA’s action level. Brief exposures to 270 ppb lead in drinking water for a preschool child might cause changes in blood chemistry, mild effects to the liver, and, for boys, mild effects to the prostate. These effects are also likely for preschool children who used the well that contained 160 ppb lead. For the other two wells that contained 18 and 24 ppb lead, harmful effects are unlikely.
iii. Gulfside Elementary Students
ATSDR determined that two primary exposure pathways could have had an impact on children who attended Gulfside Elementary school from 1978–1981. The two exposure pathways are (1) contact with soil and (2) breathing outdoor air.
Soil sampling at the school showed elevated levels of radionuclides; however, the concentrations of radionuclides did not pose a health hazard at the levels measured. The elevated radionuclide
10

STAUFFER CHEMICAL COMPANY PUBLIC HEALTH ASSESSMENT – FINAL RELEASE
levels may have been associated with wind-blown dust from the Stauffer slag processing and loading operation which was located directly across the street from the school. Arsenic was also detected in soils at the school but not at levels of health concern. In addition, the amount of soil and dust that children in elementary school ingest incidentally during their daily activities is small. Therefore, adverse health effects from exposure of Gulfside Elementary students to contaminants in school soils would not be expected.
Air monitoring and modeling data showed that children could have been exposed for brief periods to high levels of sulfur dioxide on some days. For most of the time, the wind came from a direction that would have blown the pollution away from the school; however, infrequent southerly winds and calm winds caused Stauffer’s air emissions to impact air quality in the vicinity of the school. These intermittent exposures to high levels of sulfur dioxide might have caused the following symptoms in some children at the time of the exposure in 1978 to 1981: irritation of the eyes, nose, or throat; cough; wheezing; and shortness of breath.
In addition to brief periods of exposure to high levels of sulfur dioxide, children who attended Gulfside Elementary School might have been exposed to sulfur dioxide for long periods. Results of air monitoring at the Anclote Road monitoring station and the air dispersion model showed that children and adults at Gulfside Elementary School were likely exposed for many years to slightly elevated yearly sulfur dioxide levels. The yearly sulfur dioxide levels are similar to levels shown in human studies to be associated with a small increase in mortality in adults, particularly in people with pre-existing lung and heart disease. The increased risk of mortality existed while people were being exposed. Using the modeled sulfur dioxide levels from 1977 to 1981, it is unlikely that people who were exposed in the past are currently at risk of harmful effects. The areas most impacted by Stauffer emissions are shown in Figure 27 and include the areas covered by the 10 ppb and 5 ppb contours. Some uncertainty exists in these conclusions because the results are based on modeling information, and some uncertainty exists in the human studies.
The students at Gulfside Elementary School were probably exposed to increased levels of particulate matter (PM) while Stauffer was operating. However, the lack of good information regarding their PM exposures does not allow ATSDR to determine with any certainty if these exposures constituted a hazard. No quality air monitoring data or reliable estimates from computer modeling are available for the school. Because this information is lacking, it was not possible to accurately estimate exposure to particulate matter for children who attended the school. Therefore, it was not possible to determine if particulate matter in air was a hazard to students at the Gulfside school.
It should be noted that the risk of adverse health effects from long-term exposure to sulfur dioxide and particulate matter existed while the students and adults were being exposed. There is uncertainty in estimating health risks for former Gulfside students because the human studies measured sulfur dioxide and particulate matter in the same year that mortality was measured, whereas exposures at Gulfside Elementary School stopped more than 20 years ago. In addition, since 1978 these adults and former students may have had exposures or onset of health conditions unrelated to Stauffer exposures. Because particulate matter yearly average exposures ranged from 14 to 17 ppb for the period 1978 to 1981, elapsed time since exposure stopped, and the likelihood
11
STAUFFER CHEMICAL COMPANY PUBLIC HEALTH ASSESSMENT – FINAL RELEASE
of more plausible acute effects versus chronic effects, ATSDR concludes that a scientific study of former Gulfside students is not appropriate.
In support of the public health assessment process, ATSDR, in collaboration with the University of South Florida, completed a tracing project of former Gulfside Elementary students who attended the school from 1978–1981. The results indicate that 557 (91%) of the 619 former students were located with a mailing address. This information proved to be useful for disseminating health education materials to former students through direct mailing in February 2004.
iv. Former Stauffer Workers
ATSDR reviewed and evaluated available worker exposure data for the Stauffer facility, which operated from 1947 through 1981. The data available for evaluating occupational exposures are limited and cover only the last 10 years that the facility was in operation (1972–1981). (Note: No occupational exposure data were available for the first 25 years that the facility was in operation.) After review and evaluation of the available data, ATSDR has reached the following conclusions:
< Former workers at Stauffer were intermittently exposed to asbestos or asbestos-containing materials at levels that indicate an increased theoretical risk of cancer, but it is unlikely (based on air monitoring data) that former workers are at risk of asbestosis.
< Former workers at Stauffer were intermittently exposed to chromium at levels that indicate an increased theoretical risk of cancer.
< Former workers at Stauffer were intermittently exposed to carbon monoxide, chromium, hydrogen sulfide, lead, nickel, phosphorus compounds, sulfur dioxide, total dust, quartz, and silica at levels that can cause adverse health effects.
< Records indicate that many former Stauffer workers were employed for a relatively short period of time. A majority (79%) worked less than one year, and many of these workers had a work tenure (potential for exposure) of just a few months.
< In response to the PHA public comment release, ATSDR convened a scientific Expert Panel meeting on July 31, 2003, to seek advice regarding the need for and types of follow-up activities that would benefit former workers. A transcript of the meeting was provided to stakeholders and other interested persons in September 2003.
v. Health Statistics Review
At ATSDR’s request, the Florida Department of Health (FDOH) conducted a cancer incidence analysis of populations living near the Stauffer site. ATSDR made the request on behalf of concerned citizens who perceived there to be an excess of cancer and other illnesses among citizens who live(d) near Stauffer. The cancers analyzed included bone, brain, leukemia, lung and bronchus, lymphomas, melanoma, mesothelioma, and thyroid cancers.
12

STAUFFER CHEMICAL COMPANY PUBLIC HEALTH ASSESSMENT – FINAL RELEASE
For the combined years of 1990–1999, standardized incidence ratios (SIRs) for all cancers analyzed were less than or equal to what would be expected for the target area. However, when examining the time periods of 1990–1994 and 1995–1999 separately, mesothelioma in women was significantly elevated during 1990–1994 (3 cases observed, 0.6 cases expected; SIR=5.0; p<0.02).
In response to this excess of disease, further exploration of these three mesothelioma cases was conducted by ATSDR and FDOH to determine how these individuals might have been exposed. More specifically, ATSDR obtained information from the death certificates of the three women diagnosed with mesothelioma and cross-referenced their names with the a list of former Stauffer workers to identify a possible exposure relationship. ATSDR was not able to identify these names on the list of former workers. Therefore, we do not believe that these women or their spouses were Stauffer workers. In addition, information retrieved from public deed records indicated that the three women moved into the site area between 1968 and 1979; two of the women were 60 years old and the other was 55 year old when they bought their homes in the vicinity of Stauffer. The three women lived at their residences for 15 to 26 years before their deaths, and, more significantly, 3 to 13 years while the Stauffer facility was in operation. As such, ATSDR believes that the three women were likely exposed to asbestos prior to moving to the site area and, therefore, the three asbestos cases are not related to the Stauffer site.
2. Current Exposures
Currently, the Stauffer Chemical Company site is not a public health hazard because people are not being exposed to site contaminants at harmful levels. Since the Stauffer plant ceased operations in 1981, access to the site has been restricted. In addition, most buildings, equipment, and chemicals—which could pose a health and safety hazard—have been removed from the site.
i. Current Air Exposures
< The levels of TSP, particulate matter less than 10 microns (PM10), and particulate matter less than 2.5 microns (PM2.5) were reduced after 1981 when the Stauffer plant stopped operating. Since 1981, the estimated and measured levels of particulate matter in the general vicinity of the former Stauffer plant, and subsequent risk of adverse heart and lung health effects, were similar to those in many areas of Florida and the United States.
< Current levels of sulfur dioxide in air are not likely to cause harmful effects in people, including those with asthma.
< Results of air sampling conducted by EPA in the 1990s for fluorides show it is unlikely that fluoride is being released to the air at harmful levels.
ii. Recreational Use of the Anclote River
While a few sediment and surface water samples had levels that exceeded ATSDR comparison values, the levels detected in surface water and sediment are not likely to cause harmful effects
13

STAUFFER CHEMICAL COMPANY PUBLIC HEALTH ASSESSMENT – FINAL RELEASE
because (1) the levels are too low, (2) the frequency of samples with elevated levels are low, (3) people are not likely to drink water from the river consistently, and (4) contact with sediment is limited. Therefore, ATSDR believes that it is safe for people to use the Anclote River for recreational purposes.
iii. Other Current Exposures
The concentrations of radionuclides measured at Gulfside Elementary School do not pose a health hazard to students or staff.
3. Future Exposures
< Long-term exposure to gamma radiation from radium-226 in on-site slag could pose a public health hazard in the future if the Stauffer site were developed into a residential neighborhood.
< Long-term exposure to arsenic in on-site soil could pose a public health hazard in the future if the Stauffer site were developed into a residential neighborhood. This is because accidental ingestion of arsenic-contaminated pond soil over many decades could result in a increase risk of certain cancers.
E. Recommendations
ATSDR is making the following recommendations for the Stauffer site:
< Continue to restrict access to the site to prevent exposure to site contaminants, including radiation in on-site slag and arsenic in on-site soil. Also, establish institutional controls (e.g., deed restrictions) to prevent development of the site for residential use. (Note: In their comments on the initial release public health assessment, Stauffer Management Company indicated that they already agreed to deed-restrict the site so that it is never considered for residential development.)
< Provide health education to former Stauffer workers.
< Provide health education to local health care providers.
< Provide health education to area residents and persons who attended Gulfside Elementary from 1978 through 1981.
< Provide a summary fact sheet about the public health assessment in Greek to meet the needs of the Tarpon Springs community.
< Develop and implement follow-up health activities for former Stauffer workers, including a mortality study and a respiratory health evaluation project.
14
STAUFFER CHEMICAL COMPANY PUBLIC HEALTH ASSESSMENT – FINAL RELEASE
< For public health surveillance and health information purposes, evaluate the incidence of mesothelioma and lung cancer in areas surrounding the Stauffer site.
F. Public Health Action Plan
The public health action plan (PHAP) for the Stauffer site contains a description of actions that have been, are being, or will be taken by ATSDR and other government agencies at the site. The purpose of the PHAP is to ensure that this public health assessment not only identifies public health hazards associated with the site, but also provides a plan of action to prevent or minimize the potential for adverse human health effects from exposure to site-related hazardous substances.
1. Actions Completed
ATSDR completed a number of actions for the Stauffer site during development of this public health assessment, including the following:
< conducted several site visits;
< participated in Town Hall meetings with Congressman Bilirakis;
< met with federal, state, and local officials;
< met with community leaders and community members;
< identified and located former Stauffer workers and former Gulfside Elementary students;
< held an expert panel meeting to discuss follow-up activities for former Stauffer workers;
< distributed site newsletters/community updates and site-specific fact sheets;
< provided health information to area residents and former Gulfside students;
< reviewed information regarding residential and commercial wells that contained elevated levels of arsenic and lead to determine which wells were still in use and to ensure that the users of these wells were aware of the sampling results for their wells; and
< reviewed new data and information from the latest site groundwater and geophysical studies.
A more detailed discussion of these activities is presented in Section 11.2 of the public health assessment.
15

STAUFFER CHEMICAL COMPANY PUBLIC HEALTH ASSESSMENT – FINAL RELEASE
2. Actions In Progress
< ATSDR is conducting a mortality study of deceased former Stauffer workers. The study will evaluate the cause of death for each former worker who died before January 1, 2003. Currently, ATSDR is in the data collection phase of the study. The study report should be available in late 2005.
< ATSDR is conducting respiratory health evaluations for select former Stauffer workers who were employed 5 years or longer in phosphate ore processing or phosphorus production activities. Medical evaluations are being conducted from October 2004 through April 2005 at a clinic in Holiday, Florida. A community report is planned for release in early summer 2005.
< ATSDR is working with the Florida Department of Health (FDOH) to evaluate the incidence of mesothelioma and lung cancer in the four Census Tracts surrounding the Stauffer site for years 2000–2002. This follow-up activity is being conducted for public health surveillance reasons and is not necessarily focused on a particular site or contaminant source. Data analysis is in progress and results should be available by spring 2005.
3. Actions Planned
< ATSDR will provide health education, including information about preventing respiratory disease, to former Stauffer workers by summer 2005.
< ATSDR, by summer 2005, will provide to local health care providers health education, including guidance for taking patients’ environmental exposure histories and contaminant-specific case studies and fact sheets.
< ATSDR will translate the summary fact sheet entitled “ATSDR Final Public Health Assessment for the Stauffer Chemical Company Site, Tarpon Springs, Florida (March 2005)” into Greek and make it available to members of the Tarpon Springs community whose primary language is Greek.
< ATSDR will continue to provide periodic updates regarding its health activities for the Stauffer site, including activities for former Stauffer workers, to federal, state, and local authorities and area residents. These updates will be provided through established communication mechanisms for the Stauffer site, such as, the periodic ATSDR Community Update newsletter.
G. Fact Sheets
In April 2003, ATSDR held public meetings in Tarpon Springs in conjunction with the public release of the Public Health Assessment for the Stauffer Chemical Company Site. During the public meetings, ATSDR distributed plain-English fact sheets that summarize ATSDR’s health and environmental messages for the Stauffer site. These facts sheets, which can be found in Appendix I of this public health assessment, cover the following topics:
16
STAUFFER CHEMICAL COMPANY PUBLIC HEALTH ASSESSMENT – FINAL RELEASE
< Public Health Assessment Summary for Stauffer Chemical Company Site,
< Environmental Health Concerns at Gulfside Elementary School,
< Exposure to Sulfur Dioxide at Stauffer Chemical Company Site,
< Exposures to Particulate Matter (PM) at Stauffer Chemical Company Site,
< Former Worker Exposures at Stauffer Chemical Company Site, and
< Modeling of Air Emissions at the Stauffer Chemical Company Site.
17
STAUFFER CHEMICAL COMPANY PUBLIC HEALTH ASSESSMENT – FINAL RELEASE
1. PURPOSE AND STATEMENT OF ISSUES
ATSDR has been involved with the Stauffer Chemical Company (Stauffer) site since the early 1990s, both to respond to community health concerns and to fulfill the agency’s congressional mandate of conducting public health assessments for all sites on the Environmental Protection Agency’s (EPA’s) National Priorities List (NPL). During the 1990s, ATSDR released a preliminary public health assessment and several health consultations that evaluated levels of environmental contamination at and near the former Stauffer facility. In early 2000, several Tarpon Springs residents contacted the ATSDR Ombudsman regarding the possible health impacts of previous operations at the Stauffer site. In January 2001, the ombudsman released his report (ATSDR 2000a) regarding the Stauffer site. The ombudsman’s report contained a number of recommendations, including that ATSDR prepare a new public health assessment for the Stauffer site. This public health assessment document was prepared in response to the Ombudsman’s recommendation and the concerns of the Tarpon Springs community.
This public health assessment presents a comprehensive review of available environmental sampling data and other site information regarding the levels of contamination at and near the Stauffer site and their potential impact on the surrounding community. In developing this public health assessment, ATSDR collected and compiled a large volume of data and information in order to evaluate whether people were exposed in the past, or are currently being exposed, to contaminants from the Stauffer site at levels that could be harmful to their health. This includes some data and information that were not considered in ATSDR’s previous site evaluations such as (1) Stauffer air emissions data, meteorological data, and ambient air monitoring data; (2) recent private well sampling data; (3) personal air sampling data and occupational exposure information for former Stauffer workers, and (4) updated State of Florida cancer registry statistics. Moreover, in this document, ATSDR addresses issues of particular concern to a number of area residents, specifically, the potential impact of Stauffer’s past air emissions on the health of the surrounding community, including former Gulfside Elementary students, and the potential impact of occupational exposures on the health of persons who worked at Stauffer.
18
STAUFFER CHEMICAL COMPANY PUBLIC HEALTH ASSESSMENT – FINAL RELEASE
2. BACKGROUND
ATSDR is a federal agency within the U.S. Department of Health and Human Services. The agency is authorized by the Comprehensive Environmental Response, Compensation, and Liability Act of 1980 (CERCLA) to conduct public health assessments at hazardous waste sites.
2.1. Site Description and History
The Stauffer site is ½-mile south of the Pasco-Pinellas county line and 1.6 miles east of the Gulf of Mexico. The Anclote River borders the site to the west and southwest. Commercial and residential property borders the remainder of the site and a large residential area is across the river from the site. Land use in the area is mixed, including industrial, commercial, recreational, and residential. The Gulfside Elementary School is directly north of the site, across Anclote Boulevard.
The main plant site, as shown in Figure 1, Appendix A, is south and west of Anclote Road. This area originally included the phosphate ore processing and phosphorus production facilities, waste disposal facilities, office and administration buildings, and several railroad spurs used for receiving raw materials and shipping products. The area to the north, between Anclote Road and Anclote Boulevard, contained production wells for process water and was also used for crushing and storing slag and other waste materials. The railroad lines, many of the buildings, and much of the waste slag were removed after the plant closed. A site manager and a few security guards are now the only site occupants. The entire site, including the northern and southern portions, is surrounded by a chain-link fence, and access to the site is controlled 24 hours a day.
From 1947 to 1981, the 138-acre site operated as a chemical plant that extracted elemental phosphorus from phosphate ore. The facility included a phosphate ore processing area, elemental phosphorus production facilities, a slag processing area, and a system of settling ponds. Residual wastes from the operation were disposed in on-site settling ponds and in the slag processing area, both of which are groundwater contamination sources. Wastes included calcium carbonate, calcium sulfite/sulfate, calcium fluorosilicate, calcium fluoride, calcium hydroxide, phosphate rock, phosphate nodule dust, sand, clay, “phossy” water, slag fines, and other particulates. In addition, a number of pollutants were emitted from the facility into the air including particulate matter, phosphorus pentoxide, sulfur dioxide, fluorides, carbon monoxide, heavy metals, and radionuclides. The Victor Chemical Company opened the operation. Stauffer Chemical Company1
took over the plant in 1960 and operated it until it shut down in 1981. In 1986, activities associated with permanently decommissioning and dismantling the facility began, including a number of investigations to evaluate the nature and extent of environmental contamination. Most of the production facilities were demolished in 1991 and 1992 (Weston 1993; Parsons 2002).
Waste products were disposed of on the property. It is estimated that 500,000 tons of waste were disposed of on site between 1950 and 1979 (NUS 1989). On-site waste was disposed of in many
1Stauffer Management Company (SMC) was formed in 1987 as a result of a divestiture of the Stauffer Chemical Company.
19
STAUFFER CHEMICAL COMPANY PUBLIC HEALTH ASSESSMENT – FINAL RELEASE
ways. Scrubber water was emptied into waste lagoons. The lagoons were 4–8 feet above mean sea level, approximately 40 feet from the river’s edge. The waste scrubber liquid discharging into the lagoons was made up primarily of hydrofluoric, phosphoric, fluorosilic, silic, and sulfuric acids. The waste scrubber discharge into the lagoons is well documented, but it is suspected that phossy water might also have been discharged. Phossy water can have a phosphoric content of up to 1,700 parts per million (ppm). The waste deposited at the bottom of the waste lagoons was periodically dredged and deposited in piles as large as 35 feet high on the side of the lagoons. In addition, furnace dust was disposed of into an isolated pond. There was potential for slag overflow, which might have contained phosphorus pentoxide, arsenic, uranium, phosphate, and elemental phosphorus. Other waste was disposed of by burial or fire. In 1985, it was estimated that 32,400 cubic yards of precipitated material had been removed from the first two waste lagoons (NUS 1991). Before 1978, about nine hundred 55-gallon drums of calcined phosphate sand were reportedly buried on site near the southernmost slag piles.
In May 1994, the site was added to EPA’s NPL. NPL includes those hazardous waste sites that require clean-up action under the Superfund law (CERCLA).
2.2. Site Visits
ATSDR staff visited the site in June 2001 with representatives from SMC. During the site visit, ATSDR observed that the main plant site and the slag processing area were surrounded by chain-link fences topped with barbed wire and posted with warning signs. A guard was present to provide additional security for the site. ATSDR staff observed that the former waste disposal ponds were filled with vegetation and the pond soil piles were also overgrown. ATSDR also observed that the ground in this area contains residual crushed slag and is sparsely vegetated. The railroad spur lines and many of the buildings had been removed from the site. Only the administrative office, guard house, and a few other structures remained. The remainder of the site was well grassed.
The former slag processing area north of Anclote Road was also fenced. The central part of this area contained little vegetation and was covered with crushed slag.
ATSDR staff also took a boat tour to observe the portion of the site next to the Anclote River. It was observed that the river bank was made of slag; erosion of the slag into the river was evident.
ATSDR staff revisited the site in April 2002. At that time, vegetation was being cleared from the site in preparation for the site-wide geophysical study. ATSDR staff observed that much of the vegetation had been cleared and more buildings and structures had been removed from the site since the June 2001 site visit.
In October 2003, ATSDR staff again visited the site. The site conditions were similar to those observed in April 2002 except that much of the vegatation that was cleared previously had grown back and a few additional monitoring wells had been installed as part of the site groundwater study. At that time, ATSDR staff also took a boat tour on the Anclote River and observed that
20
STAUFFER CHEMICAL COMPANY PUBLIC HEALTH ASSESSMENT – FINAL RELEASE
“rip-rap” consisting of large rocks had been placed on the riverbank next to the site to help stabilize the riverbank and to reduce erosion of slag into the river.
2.3. Demographics, Land Use, and Natural Resource Use
To identify and define the size, characteristics, location, and possible unique vulnerabilities of populations near the Stauffer site, ATSDR studied available demographics and land use information. Demographics information helps ATSDR understand the number and makeup of the population. Land use information helps identify possible exposure situations in the area (that is, what activities are occurring, have occurred, or might occur in the future). This study helps determine whether and how people might come in contact with site-related contamination, as well as the characteristics of those people.
2.3.1. Demographics
2000 census data show that the city of Holiday, approximately 1.5 miles northeast of the site, has a population of 21,904 and that Tarpon Springs, 2 miles southeast of the site, is home to 21,003 people (US Census Bureau 2000). Of the people living in these two communities, approximately 5% are children under 5 and 28% are over 65 years of age. Approximately 13% (1,676) of housing units in Holiday and 8% (908) of housing units in Tarpon Springs are categorized as “seasonal, recreational, or occasional use” (US Census Bureau 2000). The local Chamber of Commerce estimates that 750,000 tourists visit the area each year.
According to 2000 census data, approximately 9,200 people live within a 1-mile radius of the site (see Figure 2, Appendix A).
2.3.2. Land Use
Land use near the Stauffer site is mixed, including industrial, commercial, recreational, and residential. The Anclote River is a well-used river system. Activities ranging from agriculture, industry, recreation, and fishing all take place on and near the river.
Subdivided residential areas exist in the vicinity of the site, in both Holiday and Tarpon Springs. Business along the Anclote River within 1 mile of the site include a power-generating plant (Florida Power Anclote Plant), an auto salvage yard, and a boat repair facility and marina. Many of these businesses release small amounts of air contaminants. The Anclote Plant, on the other hand, has released large amounts of sulfur dioxide and particulate matter. These emissions occurred while Stauffer operated and continue to occur today. East of US Route 19, most land is rural with improved pasture, rangeland, agriculture (including citrus and row crops), and tree farming. Most of the remainder of the watershed is vacant or environmentally sensitive areas (tidal and freshwater marshes, flood plain, isolated hardwood swamps, pine flatwoods).
Multiple schools, day care facilities, health care facilities, nursing homes, and day care centers are within 2 miles of the site. Gulfside Elementary School is directly north of the site; the school opened in January 1978, approximately 4 years before the Stauffer facility shut down (November
21
STAUFFER CHEMICAL COMPANY PUBLIC HEALTH ASSESSMENT – FINAL RELEASE
1981). Tarpon Springs Middle School and St. Nicholas Parochial School are within 1 mile southwest and south of the site, across the river. In addition, Sunset Hills Elementary School and Tarpon Springs High School are just over 1 mile south of the site. A nursing home, a rehabilitation center, and multiple assisted living facilities are across the river from the site within the 1-mile boundary. More than 20 other health care facilities, day care centers, and schools are between 1 and 2 miles away from the site, in and around the cities of Tarpon Springs to the south and southeast and Holiday to the northeast of the site.
In addition, several recreational areas are in the general vicinity of the site, including a golf course directly across the river, and several parks and beaches.
2.3.3. Natural Resource Use
2.3.3.1. Groundwater
2.3.3.1.1. Hydrogeology
The hydrogeology of the site area has been well studied. Water levels (including tidal fluctuations), groundwater flow direction, the direction and magnitude of vertical hydraulic gradients, horizontal gradient, flow velocity, and groundwater-surface water interactions were evaluated as part of ongoing site investigations. This section presents an overview of the current understanding of local hydrogeologic conditions.
The region of northwestern Pinellas and southwestern Pasco counties in which the Stauffer site is located is underlain by sand, clay, and limestone. Local hydrogeology is characterized by three hydrostratigraphic units: a surficial aquifer, a semi-confining unit, and the Floridan Aquifer. Water is reached at an average depth of 8 feet below land surface (bls). Investgators have generally characterized the site hydrology as a relatively flat low flow system with overall groundwater flow toward the Anclote River (NUS 1989; Weston 1993; Parsons 2002; Parsons 2004).
The surficial aquifer consists primarily of permeable sands (fine- to medium-grained quartz and shelly sand, with sandy clay at the bottom of the aquifer) and ranges in thickness between approximately 2 and 30 feet on site (Weston 1993; Parsons 2004). Because of its relatively low yield, the surficial aquifer has limited use, primarily as an alternative or supplemental source of water (O’Brien & Gere 2004).
A thin semi-confining unit, ranging in thickness from 1 to 8 feet, exists between the surficial and Floridan Aquifers (Weston 1993; Parsons 2002; Parsons 2004). The unit consists of clay and silty clay, with some limestone fragments. Investigators have concluded that this layer largely restricts the vertical movement of water from the surficial aquifer to the Floridan Aquifer system below. This conclusion is based on the relative lower permeability of this layer compared to the saturated sands in the surficial aquifer and the general lack of water in the semi-confining unit (Weston 1993, Black and Veatch 2000; Parsons 2004). Recent studies have shown, however, that “karst features” exist along the eastern site boundary, adjacent to Anclote Road, and possibly along the
22

STAUFFER CHEMICAL COMPANY PUBLIC HEALTH ASSESSMENT – FINAL RELEASE
northern edge of the Norther Parcel (O’Brien & Gere 2004). No semi-confining layer exists where these conditions are found, allowing contact between the two aquifers (Parsons 2004). This breaching of the semi-confining layer seems to be limited to this portion of the site. These studies conclude that the risk of sinkholes or the deeper collapse of the karst in the subsurface is very low (O’Brien & Gere 2004). The possible impact of sinkholes has been a major concern voiced by community members (ATSDR 2000a).
The Floridan Aquifer consists primarily of limestone. The upper portion of the Floridan Aquifer, referred to as the upper Floridan, Tampa Formation, or Tampa Limestone, has a thickness ranging from 60 to 150 feet in the vicinity of the Stauffer site, starting at 17–37 feet bls in the study area. This aquifer is one of the primary water-bearing formations in the Tarpon Springs area (Seaburn and Robertson 1987; NUS 1989; Weston 1993; Parsons 2002).
Studies conducted to date show that the predominant groundwater flow direction in both aquifers appears to be to the south or southwest, with discharge from both aquifers to the Anclote River. Groundwater studies conducted between July 2002 and November 2003 show a groundwater high in the southwest portion of the North Parcel, extending to the western portion of the South Parcel. As a result, groundwater in this area flows in a south/southeasterly direction toward the paleokarst feature on the South Parcel. However, because the subsurface gradient flattens near this feature, the flow direction shifts toward the south/southwest, turning toward the river (Parsons 2004). These conclusions are based on the interpretation of water level readings—groundwater elevations are higher in the aquifers than in the river. A clear hydraulic connection exists between the aquifers and the river, as demonstrated by a direct relationship measured between tidal fluctuations in the river and the daily water levels in the aquifers (Seaburn and Robertson 1989; Weston 1993; Flow 2001). Because of the tidal influence, conditions in the aquifer are considered “dynamic” with short-term fluctuations in flow rate and directions (Seaburn and Robertson 1987; Black and Veatch 2000). An analysis accounting for this fluctuation still indicated that net groundwater flow direction in both aquifers in the vicinity of the site is southwest toward the Anclote River. Both aquifers rise and fall in a similar manner in response to the tidal cycle and precipitation events. The potentiometric contour lines generated during the RI led to the conclusion that no groundwater movement from the Stauffer site is occurring beneath and across the Anclote River (Weston 1993).
It is unclear whether changes in area water use might have any significant impact on future groundwater flow conditions in the site area. Black and Veatch (2000) report that increasing population size throughout the Tampa Bay area has resulted in an increase in water demand. They warn that this increasing demand could potentially affect groundwater in the Tarpon Springs area (i.e., by producing a cone of depression within the Floridan Aquifer). This points to the need to continue to study site hydrogeologic conditions and to be aware of possible changes that could occur over time.
2.3.3.1.2. Usage (Water Supply Wells)
No known potable wells (containing water suitable for drinking) are currently in use on site or immediately downgradient (south/southwest) of the site (Weston 1993). Some groundwater near
23

STAUFFER CHEMICAL COMPANY PUBLIC HEALTH ASSESSMENT – FINAL RELEASE
the site (cross-gradient areas east and west of the site and on the opposite side of the Anclote River) is used for potable water, lawn irrigation, and commercial and industrial purposes. The surficial aquifer in the area is used primarily for agriculture and irrigation purposes and is not generally used as a drinking water source. Water from the Floridan Aquifer is used for domestic, industrial, and agricultural purposes (Weston 1993). Most private and public potable wells near the site draw water from the deeper Floridan Aquifer (NUS 1989). Well-depth information is documented only for five area residential and commercial potable wells. These well depths range from 35 to 70 feet bls—all in the Floridan Aquifer (FDOH 2002).
Conflicting documentation exists about the number of private wells in the site vicinity. ATSDR’s 1999 health consultation indicated that approximately 230 private wells were located within 1 mile of the site boundary (ATSDR 1999a). Although public water is available, “some” private wells are used in a small residential area west of the site. In addition, approximately 20 homes in the Hickory Lane and Cemetery Lane area within the Holiday Utilities service area use private wells. The nearest residential potable well is 2,500 feet northwest (up gradient) of the site. During the RI, a well inventory was conducted in a 3-mile radius around the site from the Southwest Florida Water Management District’s (SFWMD’s) database of all public and private water wells in southwest Florida: 84 public and private water wells were identified within a 3-mile radius and 31 wells (all privately owned) were within a 1-mile radius (Weston 1993). A more recent review of well permits issued by SFWMD between 1970 and 2000 indicates that 10 private domestic wells are within a 1-mile radius of the site and 23 private domestic wells are within 3 miles of the site (SMC 2001). Although the exact number of private wells in the site area is unknown, most of the wells close to the site – those that could potentially be impacted by site groundwater contaminants – have been identified. The locations of these and other known water supply wells (both private and public) within approximately 1 mile of the site are shown in Figure 3, Appendix A.
Because of community concern regarding the use of private water supplies in the vicinity of the site, ATSDR carefully reviewed groundwater quality data available for nearby wells—including wells located up-gradient, cross-gradient, and on the opposite side of the river from the site (see Section 3.2.2).
Six public utilities have well fields within a 4-mile radius of the site: the closest are Holiday Utilities (2,000 feet upgradient) and Pasco County Utilities (3,000 feet upgradient). The other utilities (City of Tarpon Springs, Aloha Utilities, Forest Hills, and Crestridge Gardens Utility Corporation) are 10,000–13,000 feet from the site. All wells are in the Floridan Aquifer and all are greater than 39 feet in depth. These wells have not been affected by Stauffer groundwater contamination.
Historic use of on-site groundwater is not well documented, but it is known that groundwater was used for both potable and industrial purposes at the Stauffer plant. Drinking water was drawn primarily from wells within the deeper Floridan Aquifer before Stauffer’s connection to the public water supply in late 1979 or early 1980. Weston (1989) reports that at one time the site had 17 wells for potable water use, along with some others of lower quality that were used for facility
24
STAUFFER CHEMICAL COMPANY PUBLIC HEALTH ASSESSMENT – FINAL RELEASE
purposes. Only four of these seventeen wells were regularly used. Other wells were abandoned over the years, mostly because of elevated chloride levels.
2.3.3.2. Surface Water
The major surface water in the site area is the Anclote River. The primary use of the Anclote River is recreation, including boating and swimming, and support of wildlife.
Because of its large sea-grass beds, the river is an ideal habitat and breeding ground for clam and scallop beds, some of which are harvested by local residents. One harvesting area is reportedly less than ½ mile from the Stauffer waste lagoon area (NUS 1989).
Recreational fishing has historically been reported as a local pastime, and a popular fishing spot is less than 1 mile downgradient of the Stauffer site at the Florida Power’s Anclote Plant’s cooling canal (NUS 1989). The Florida Department of Health (FDOH) issued a health advisory suggesting that adults limit their consumption of largemouth bass, bowfin, and gar from the Anclote River to one meal per week (FDOH no date). The advisory, which is based on mercury contamination in fish, is not related to the Stauffer site. FDOH also suggested that children and pregnant and nursing women consume only one meal of these fish per month.
A marina is approximately ¾ mile upstream of the site, and a golf course is across the river (Weston 1993). A number of beaches are on the river near the site. Pasco County Beach, on the north shore 3,500 feet west of the Stauffer site in Anclote River State Park, is the closest. Three beaches in the Gulf of Mexico are within 2 miles of the site (Sunset Beach, Howard Park, and Anclote Gulf Park). Activities at the numerous parks and beaches in the area include boating, fishing, picnicking, swimming, and using the playgrounds.
The land surrounding the river has many uses as well. East of US Route 19, most of the land is rural with improved pasture, rangeland, and agriculture including citrus, row crops, and tree farming. Most of the remainder of the watershed is vacant; many areas are considered environmentally sensitive areas (e.g., tidal and freshwater marshes, flood plain isolated hardwood swamps, pine flatwoods). In addition, an urbanized area parallels US Route 19, consisting of subdivided residential areas, commercial property, and both light and heavy industrial activities, including ship repair, electric power generating, and auto salvage yards along the river (NUS 1989).
Because the river is brackish near the Stauffer site, it is not used as a source of drinking water (NUS 1989). However, the Tampa Bay Water district is currently reviewing plans and proposing sites for a seawater desalination plant in the area.2 Negotiations are underway between the project team and Florida Power to co-locate the new desalination plant with the existing Anclote Plant (approximately ¾ miles downstream of the Stauffer site) (Tampa Bay Water 2002; H. Knight,
2
/
Tampa Bay Water is a special district created by interlocal agreement among member governments—Hillsborough County, Pasco County, Pinellas County, St. Petersburg, New Port Richey, and Tampa. Tampa Bay Water provides wholesale water to member utilities, who in turn provide water to nearly 2 million people in the tricounty area (www.tampabaywater.org/WEB/Htm About-Us/overview.htm).
25

STAUFFER CHEMICAL COMPANY PUBLIC HEALTH ASSESSMENT – FINAL RELEASE
Public Information Project Coordinator for Tampa Bay Water’s Gulf Coast Desalination Project, personal communication).
26
STAUFFER CHEMICAL COMPANY PUBLIC HEALTH ASSESSMENT – FINAL RELEASE
3. ENVIRONMENTAL CONTAMINATION AND OTHER HAZARDS
In this section, ATSDR reviews the environmental data collected at the Stauffer site and selects contaminants warranting further evaluation. ATSDR evaluated the adequacy of the sampling conducted, identified the maximum concentration and frequency of detection of the contaminants found in various media, and compared the maximum detected concentrations with health-based screening values or comparison values (CVs).
ATSDR selected contaminants at this site based on the following specific factors:
< An understanding of contaminant concentrations detected on site and off site.
< A determination of overall data quality (field data quality, laboratory data quality, and sample design).
< A comparison of on-site and off-site contaminant concentrations with appropriate CVs.
< Community health concerns.
The health-based CVs used in this report are concentrations of contaminants that the current public health literature suggest are “safe” or “harmless”. These comparison values are quite conservative because they include ample safety factors that account for most sensitive populations. ATSDR typically uses comparison values as follows: If a contaminant is never found at levels greater than its comparison value, ATSDR concludes the levels of corresponding contamination are “safe” or “harmless.” If, however, a contaminant is found at levels greater than its comparison value, ATSDR designates the pollutant as a contaminant of concern and examines potential human exposures in greater detail. Because comparison values are based on extremely conservative assumptions, the presence of a contaminant at concentrations greater than comparison values does not necessarily suggest that exposure to the contaminant will result in adverse health effects. More information on the comparison values used in this report can be found in Appendix D.
Identification of contaminants of concern narrows the focus of the health assessment to those contaminants most important to public health. When a contaminant of concern in one medium is selected, that contaminant is also reported in all other media. In subsequent sections, ATSDR evaluates whether exposure to these contaminants has public health significance.
In this document, contaminants found on site will be discussed separately from contaminants found off site. Environmental sampling data for contaminants in soil, groundwater, surface water, and sediment, both on site and off site, are summarized in Tables 1-25 of Appendix B and discussed briefly in sections 3.1 and 3.2 below. A more detailed discussion of site sampling investigations and environmental sampling data for these media is provided in Appendix C. Environmental sampling data related to airborne contaminants (i.e., air emissions and ambient air monitoring data) are discussed in section 3.3.
27
STAUFFER CHEMICAL COMPANY PUBLIC HEALTH ASSESSMENT – FINAL RELEASE
3.1 On-Site Contamination
3.1.1. Soil and Slag-Containing Materials
ATSDR gathered surface and subsurface soil data from reports generated by parties involved in site investigations and monitoring, beginning in 1988. Data from the on-site soil sampling studies indicated that the concentrations of six contaminants consistently exceeded the applicable ATSDR CVs: antimony, arsenic, cadmium, thallium, fluoride, and radium-226. Asbestos was found in only two on-site surface soil samples.
This section summarizes surface and subsurface soil data collected at and near the Stauffer site, broken out in the following subsections.
< Former pond soils. Surface and subsurface soils from former ponds, dredged pond material, and an on-site drainage ditch.
< Slag material. Surface soils from slag pits and slag storage area, as well as slag-containing material from an on-site roadway.
< Other on-site soils. Surface and subsurface soils from the main production area, southeast property, northeast property, and unused portions of the site.
< On-site asbestos sampling. Surface and subsurface soils from all areas of the site.
Figure 4 in Appendix A shows the layout of the Stauffer site and soil sample locations. Appendix C provides a detailed account of the site soil sampling investigations and their findings.
3.1.1.1 Former Pond Soils, Dredged Materials, and Drainage Ditch
Process wastes generated by the Stauffer plant were disposed of in seventeen on-site settling ponds and lagoons. Process wastes included scrubber liquor (containing amounts of hydrofluoric, phosphoric, fluorosilic, and sulfuric acids) and precipitated material (containing amounts of calcium sulfate/sulfite, calcium silicate, calcium fluoride, phosphate sand, and calcined phosphate dust). The ponds might have also received discharges of “phossy water,” although clear documentation of this practice is lacking. Phossy water was used to provide protective contact to the phosphorus product. In addition, some of the ponds received overflow from a concrete-lined calcium silicate slag pit. Other potential slag components are phosphorus pentoxide, arsenic, uranium, phosphate, and elemental phosphorus (NUS 1989). All of the former pond areas are now dry. Over the years, large quantities of the precipitated material from several of the ponds were dredged and transferred into piles adjacent to the ponds (NUS 1989). This waste was designated as nonhazardous under the Resource Conservation and Recovery Act (RCRA) (NUS 1991).
All but one of the former ponds and the dredged materials were sampled for metals, other inorganics, and radionuclides. Pond 50 was covered over by growth at the time of sampling in
28
STAUFFER CHEMICAL COMPANY PUBLIC HEALTH ASSESSMENT – FINAL RELEASE
December 1989 and was no longer visible (Weston 1990a). Three of the former ponds and a sample from the former dredging area were also analyzed for VOCs, semivolatile organic compounds (SVOCs), pesticides, and polychlorinated biphenyls (PCBs). Samples included surface soils, subsurface soils, and composite samples taken from multiple depths. Table 2 in Appendix B summarizes the findings of these pond and dredged material soil studies.
Sampling of the surface and subsurface soils in the areas of the former ponds and from dredged pond materials indicates that these areas generally contain the highest levels of contaminants on site. Several of the ATSDR CVs were exceeded in these soil samples, many of which included surface soils. Contaminants that exceeded their respective CVs follow: several SVOCs, arochlor1248, antimony, arsenic, cadmium, chromium, lead, thallium, and fluoride. Radium-226 was the only radionuclide analyzed in the pond soils, and it exceeded the CV in nearly all samples. Maximum concentrations of radium-226 were detected in pond 39 and its dredged material (i.e., pile 1) in the northeast property; pond 42 in the western portion of the main production area; and ponds 44A, 45, 48, 49A, 49C, 49D, and 51 and their dredged material (i.e., pile 2) in the southern portion of the main production area.
ATSDR conducted a more detailed analysis of those substances most frequently detected at levels above CVs (arsenic, cadmium, and thallium) in pond soils and dredged soils. This analysis included a review of the spatial distribution of these metals as well as an assessment of the overall representativeness of the maximum detected concentrations. ATSDR calculated mean and median concentrations for these three metals, grouping pond samples and associated dredge samples based on their general location on site—that is, north ponds (ponds 39 and 52), the west pond (pond 42), and the south ponds (all other ponds).
Contaminant concentrations were generally consistent across the site. Mean concentrations of arsenic in these areas ranged from approximately 113 to 133 ppm, with the maximum reported concentration of 340 ppm in pond 42. The mean cadmium concentration ranged from 32 to 40 ppm, with a reported maximum of 66 ppm in pond 39. Mean concentrations for thallium ranged from 12 to 23 ppm. The maximum concentration of thallium (37 ppm) was found in dredge materials from deeper depths of the southern ponds, although thallium was consistently detected in surface samples as well. Median concentrations for these contaminants are similar to the mean concentrations, which suggests that the concentration ranges were evenly distributed and not overly weighted toward the low or high end of the ranges.
Three samples also were obtained from soils in a drainage ditch running along the northwestern border of the property. All levels of contaminants in the drainage ditch soils were below their respective CVs. These samples also showed lower concentrations of contaminants when compared with the pond or dredged material soils, as well as the other on-site surface soils.
3.1.1.2 Slag and Slag-Containing Material
29
STAUFFER CHEMICAL COMPANY PUBLIC HEALTH ASSESSMENT – FINAL RELEASE
Calcium silicate slag was generated during the processing of phosphate ore at the Stauffer site. Periodically, this slag was tapped from an upper layer of the molten product and discharged to a concrete-lined slag pit. The slag was then sprayed with quenching water, crushed, and transported to a slag processing area north of the main production area (NUS 1989).
The crushed slag was used as a construction material at several locations both on site and off site. For example, it was used as fill in a portion of Meyers Cove, in the construction of roads on site and off site, in residential driveways, and in concrete used in the foundation of several community buildings. Off-site locations believed to have received slag-containing materials include schools, residences, and commercial properties.
Several studies examined the slag material remaining on site, as well as the soil beneath the slag pile. One study also examined on-site road materials that were constructed from the slag. Table 3 in Appendix B summarizes the findings of the on-site slag studies. This table excludes data obtained from the slag-containing road materials.
Sampling of the surface soils found in the areas where slag material was processed (i.e., the slag pits in the main production area and the storage area north of the main production area) generally indicated that these areas contained the lowest concentrations of contaminants found on site. A few contaminants (aluminum, manganese, and radium-226), however, were found at their highest concentrations in these areas. In addition, three contaminants exceeded their respective ATSDR CVs: benzo[a]pyrene (only one sample was analyzed for SVOCs, arsenic (exceeded CV in one sample), and radium-226 (in all 12 samples). Only one sample was analyzed for volatile organic compounds (VOCs). None of the VOCs analyzed for in this sample were detected.
Roadway materials collected along the western border of the site from 1–4 foot depths were analyzed for metals, cyanide, fluoride, total phosphorus, and radionuclides (Weston 1993). Detected level of site-related substances were generally comparable to those detected in on-site slag samples, though some metals and gross beta radiation were detected at slightly higher levels in roadway materials as compared to on-site slag (see Appendix C).
3.1.1.3 Other On-Site Soils
Sampling data for on-site surface and subsurface soils also are available from past site investigations for several locations around the site. Sampling of the surface soils found in the other areas of the site (excluding the ponds, dredged material piles, and slag processing areas discussed previously) revealed the following contaminants at the maximum concentration on site: several VOCs; SVOCs; dieldrin; p,p-DDT; cobalt; iron; nickel; sodium; vanadium; and gross alpha and beta radiation. Several other contaminants were found at the same order of magnitude as the maximum concentrations found in the pond areas. Table 4 in Appendix B presents a summary of the on-site surface soil data, and Table 5 in Appendix B summarizes mean and median concentrations for five contaminants of potential concern. These five contaminants were those detected most frequently at levels above ATSDR CVs or by the greatest margin (e.g., arsenic, cadmium, and thallium), as well as those associated with site operations (e.g., fluoride, total phosphorus) in the on-site surface soils.
30
STAUFFER CHEMICAL COMPANY PUBLIC HEALTH ASSESSMENT – FINAL RELEASE
Sampling of the subsurface soils on site generally showed lower concentrations of contaminants when compared with the on-site surface soils. A few samples, however, show higher concentrations of some contaminants than the maximum concentration found in surface soils. These contaminants are toluene, arsenic, cadmium, magnesium, mercury, thallium, and fluoride. The samples with the highest concentrations of contaminants in the subsurface soils were obtained mainly from the northeast property and along the western portion of the main production area. Five contaminants (antimony, arsenic, cadmium, thallium, and fluoride) exceeded their respective CVs in the subsurface soils.
3.1.1.4 Asbestos
In April 1998, Parsons conducted a comprehensive site-wide study of the presence of asbestos in on-site soils (Parsons 1998). This sampling was performed as a follow-up to the September 1997 sampling. One hundred forty-seven areas (surface and subsurface) of the site were analyzed for asbestos. These areas included all portions of the site, including the slag storage area and the ponds. This analysis found only one “asbestos positive” sample. The sample was obtained from surface soils of the parking lot, near the main office in the main production area, and contained 0.25% chrysotile asbestos (Parsons 1998).
An additional 66 surface and subsurface soils were collected based on historical asbestos uses or storage. Only one of these surface soil samples contained asbestos. The sample, which contained 0.75% chrysotile asbestos, was collected just south of the maintenance building within the main production area (Parsons 1998).
3.1.2. Groundwater
ATSDR gathered groundwater monitoring data from reports generated by parties involved in site investigations and routine monitoring, beginning in 1985. Appendix C provides a detailed list of the site groundwater sampling programs. In general, the objective of each of these programs was to measure the nature and extent of site groundwater contamination, including the potential for off-site migration. Because several sampling events were conducted by different investigators, the designation of the sampling locations has changed over the years. Table 6 in Appendix B describes the well designations used in the various studies. The data summary tables and Figure 5 (monitoring well locations) in Appendix A use the well designations from the RI.
3.1.2.1. Monitoring Wells3
3All of the Stauffer monitoring wells are on site except for MW-11S and MW-04F, which are across the Anclote River. The sampling data for these two wells are not included in the summary tables, but were considered in ATSDR’s evaluation of groundwater quality at and near the site.
31

STAUFFER CHEMICAL COMPANY PUBLIC HEALTH ASSESSMENT – FINAL RELEASE
Table 7 (surficial aquifer) and Table 8 (Floridan Aquifer) in Appendix B summarize groundwater sampling data from on-site monitoring wells. Monitoring wells are not used for drinking water but are used to characterize groundwater quality and possible movement from the site. As described previously, no potable water supplies exist on site; therefore, no one is ingesting or otherwise coming in contact with groundwater beneath the site. Tables 7 and 8 present the range of contaminant concentrations detected in each aquifer during the various sampling rounds. Unless otherwise noted, the number of samples represent a unique sampling event that includes multiple samples from individual monitoring wells. Tables 7 and 8 also compare the maximum detected concentrations to CVs, as a means of identifying contaminants of potential concern or interest.
< Shallow aquifer. The contaminants most frequently exceeding ATSDR CVs (in more than 40%–50% of the samples) were arsenic, fluoride, and radon-222. Other contaminants exceeding ATSDR CVs in one or more samples were aluminum, antimony, boron, cadmium, chromium, iron, lead, lithium, manganese, nickel, selenium, thallium, vanadium, zinc, sulfate, gross alpha, and radium-226.
< Floridan Aquifer. Few detected concentrations of contaminants exceeded ATSDR CVs in tested wells in the Floridan Aquifer. Site-related contaminant concentrations were generally lower in the Floridan Aquifer compared with the surficial aquifer. However, elevated concentrations of fluoride and phosphorus were reported in shallow and deeper wells ("nested" wells) in the southeastern portion of the site. This observation is consistent with the findings of recent geophysical studies, which revealed the absence of a semi-confining unit unique to this portion of the site.
3.1.2.2. Plant Water Supply Wells
As previously discussed, 17 wells were used for potable water at one time or another at the Stauffer plant, along with some other wells of lower quality that were used for facility purposes. Wells 5, 12, 13, and 15 were reportedly the primary sources of potable water for the facility; all were 1,500–2,500 feet to the northeast (away from the river) from most of the other numbered wells. These wells were used for drinking water until February 1979, when Stauffer began distributing bottled drinking water. In late 1979 or early 1980, the facility completed its tie-in to the City of Tarpon Springs’ water supply, and used potable city water until it ceased operations in 1981 (Kelly 2002).
Some of the plant’s on-site wells were abandoned over the years, mostly because of elevated chloride levels. Others (including wells 7, 10, and 14) were used as backup wells or for process water or irrigation. Well 14, in the main plant area, was used for emergency standby. Wells 7 and 10 were 4-inch wells used for supplementary water and were “of poorer quality.” Well 7 was used very little in the years leading up to 1974. Neither well 7 nor well 10 was in use for potable water in 1976. As of 1977, well 10 was restricted to lawn sprinkling for several years; well 14 had been locked since January 14, 1977 because of high chloride levels. Well 12 was also part of the backup potable water system. Well 17 was drilled for the Turbulaire (kiln cooler) scrubber. The office and silo wells were used for irrigation only. The track hopper (slag pit) and roaster wells
32

STAUFFER CHEMICAL COMPANY PUBLIC HEALTH ASSESSMENT – FINAL RELEASE
were used for process water only, and were not considered potable. The kiln-scrubber well was used for scrubber make-up water. ATSDR was unable to identify any documents that explain the use for the “plant tank” mentioned in several laboratory reports.
Available on-site well sampling data are contained in lab reports from the years 1948–1982 (except for the period 1960–1965). These reports include data for the plant’s potable wells as well as the process and irrigation wells. However, ATSDR is evaluating only the sampling data associated with the potable wells. Victor Chemical Works (1948–1960) and SMC (1965–1982) tested on-site wells for a number of analytes, including aluminum, ammonia, bicarbonate, calcium, carbon dioxide (free), carbonate, chloride, dissolved solids from conductance, fluoride, hardness, hydrogen sulfide, hydroxide, iodine demand (Na2SO3), iron, magnesium, nitrate, organic (ether extraction), pH, phosphate, phosphorus, silica, soap hardness (CaCO3), sodium, sulfate, suspended solids, and total solids. Not all analytes were analyzed in every sample, however. Bacteriologic analyses were also routinely conducted. For the purposes of this evaluation, ATSDR focused on fluoride, phosphorus, sulfate, and iron in potable water wells 5, 12, 13, and 15, and backup potable water wells 7, 10, and 14.4
Table 9 in Appendix B lists maximum levels of these four contaminants in the potable water wells. Table 10 in Appendix B shows the maximum levels of these four contaminants in the backup potable water wells.
3.2. Off-Site Contamination
For the purposes of this evaluation, off site is defined as the area outside the property boundary of the Stauffer plant and slag storage area (Figure 1, Appendix A).
3.2.1. Soil and Slag-Containing Materials
Sampling data for off-site soils and road and building materials are available from several studies. These data include surface soil samples from Gulfside Elementary School and other off-site locations and samples of slag-containing materials in roadways, driveways, and foundations in the surrounding community. All of the areas are accessible to the public; they include public roads, private residences, a recreation complex, a government building, and commercial facilities. It should be noted that not all of the samples obtained for each study were analyzed for the same contaminants.
Off-site sampling studies revealed that surface soils and building materials sampled in the surrounding community contained lower concentrations than were found on site. Only arsenic and radium-226 consistently exceeded ATSDR CVs off site, but were generally detected below
4ATSDR also reviewed the reported contaminant concentrations in the plant’s water tank, noting that the reported levels fell below maximum reported concentrations shown in Table 9, Appendix B. The contaminant levels in the backup wells (shown in Table 10, Appendix B) were higher than, or comparable to, the levels shown in Table 9.
33

STAUFFER CHEMICAL COMPANY PUBLIC HEALTH ASSESSMENT – FINAL RELEASE
naturally occurring background levels. None of the off-site sampling studies found conclusive evidence of asbestos.
3.2.1.1. Gulfside Elementary School
Gulfside Elementary School opened in January 1978. The school is approximately 600 feet from the former slag storage area, directly across Anclote Road, north of the Stauffer site (NUS 1991). Several studies have focused on characterizing the soils and building materials on the school property.
The samples obtained from the surface soils surrounding the Gulfside Elementary School were analyzed for metals, other inorganics, and radionuclides. No VOCs, SVOCs, pesticides, or PCBs were analyzed in any of the samples obtained from the school. Table 11 in Appendix B presents a summary of the surface soils analyzed from the Gulfside Elementary School.
Sampling results indicate that the surface soils on the school property contained lower concentrations of virtually all of the contaminants found at the Stauffer site. The only two contaminants detected above ATSDR’s CVs were arsenic and radium-226, though these substances were detected below available “background” levels. More specifically, arsenic, which only slightly exceeded its CV (0.5 ppm) in one sample (0.6 ppm), was also detected at levels at or below reported background arsenic levels. Arsenic concentrations identified in background samples collected during site investigations in wooded areas on the site itself ranged up to 0.91 ppm; geometric average arsenic concentrations in Florida soils have been reported to be0.42 ppm with an arithmetic average of 1.34 ppm (Chen 1999). Maximum detected radium-226 values in the school soils slightly exceeded the state-wide average; it is unclear to what extent, if any, the site contributed to the measured amounts of radium-226 in school soils. The remaining metals, other inorganics, and radionuclides were detected at concentrations below their respective CVs. The 20 surface soil samples that were analyzed for asbestos showed no amount of asbestos present.
Sampling of the road materials around the school property, as well as the soil beneath the roads and roofing material on the school, all showed concentrations of radium-226 that exceeded the CV. The soil beneath the road also showed concentrations of radon-222 that exceededconcentrations found in the on-site surface soils. All of these building materials contained far lower concentrations of the contaminants found in the on-site slag.
3.2.1.2. Other Off-Site Locations
Several other locations in the community surrounding the Stauffer site were examined, mostly in response to residents’ concerns that slag material from the Stauffer site was used in the construction of their homes, driveways, and roadways. Most of the studies only examined external gamma radiation (EGR) levels from these materials; however, a few studies did perform
34
STAUFFER CHEMICAL COMPANY PUBLIC HEALTH ASSESSMENT – FINAL RELEASE
additional analyses of the slag materials. Community exposure to gamma radiation was the subject of a recent ATSDR health consultation (ATSDR 2002).
Only arsenic and radium-226 exceeded the ATSDR CVs in any of the off-site samples. Several other contaminants, although detected at concentrations below their respective CVs, exceeded the maximum on-site slag concentrations. These contaminants were aluminum, antimony, barium, cobalt, copper, mercury, selenium, silver, thallium, and vanadium. The maximum concentrations were generally found in the roadbed or pavement, or both, used to construct Bluff Boulevard and Gulfview Road, as well as in a few residential building slabs and driveways. It is reasonable to expect that other constituents used in the building material formulation might have contributed toward the elevated concentrations in these samples.
In July 1998, core samples obtained from a residential basement, a roadway, and the Stauffer slag storage area were microscopically analyzed to determine whether the off-site building materials were constructed with the slag material from the site. Although the off-site samples were “visually indistinguishable” from the Stauffer slag sample, this did not prove that the slag materials originated at the Stauffer site. This study concluded that slag material from the site was distributed for use as aggregate in roads, road beds, and some building materials. The study also found that a second elemental phosphorus plant, in Nichols, Florida, also distributed slag for these uses (considered a safe practice at the time). No conclusions could be made about the extent to which the Stauffer site slag material is contained in the surrounding community roads and buildings (EPA 1999a).
3.2.2. Groundwater
3.2.2.1. Private Wells
Thirty-eight private wells (residential potable, commercial potable, and irrigation wells) near the site have been sampled since 1988. The Pinellas County Department of Health did most of the sampling in 1990, 1997, and 1999–2001 as part of Florida’s SuperAct Underground Storage Tank Program and at the specific request of area residents. Table 12 in Appendix B lists the wells sampled and the frequency of sampling. Figure 6 in Appendix A shows the locations of each of these wells.
It should be reemphasized that residential and commercial wells are believed to draw water from the Floridan Aquifer. In addition, many of these wells are considered hydrogeologically upgradient of the site. Irrigation wells, some located just west of the site, draw water from the surficial aquifer, but are not used for drinking water purposes. The exact number of residential, commercial, and irrigation wells in the site area and the number currently in use are unknown.
Table 13 (residential potable wells), Table 14 (commercial potable wells), and Table 15 (irrigation wells) in Appendix B present the range of detected concentrations for selected chemical and radiologic parameters in the private wells sampled near the Stauffer site. The tables include only (a) those substances detected at concentrations exceeding ATSDR CVs or (b) substances for which no CV is available.
35
STAUFFER CHEMICAL COMPANY PUBLIC HEALTH ASSESSMENT – FINAL RELEASE
Arsenic, chromium, lead, nickel, thallium, zinc, chlorides, sulfate, gross alpha radiation, and radium-226 were all detected at concentrations above ATSDR CVs, but at relatively low frequencies. Most were also detected at concentrations no more than 10 times higher than CVs. Among these contaminants, arsenic and lead were detected the most frequently at levels above ATSDR CVs and the levels tended to exceed the CVs by the greatest magnitude. Note that fluoride (a known contaminant beneath the Stauffer site) was detected in only 3 of the 30 potable wells—at concentrations well below the ATSDR CV (less than 270 ppb). Further, detected fluoride concentrations were generally comparable or below those detected in “background” wells located in the northeast quadrant of the site (MW 1S and 1F, MW-7ES, and MW-98-1).
3.2.3. Surface Water and Sediment (Anclote River)
This section summarizes surface water and sediment sampling data collected at or near the Stauffer site. Because the Anclote River flows immediately adjacent to the Stauffer site, the river has been the focus of various site-related studies. Data from these studies were collected and summarized to support ATSDR’s health effects evaluation for the surface water and sediment exposure pathways. Separate, detailed data summaries for surface water and sediment are presented in Appendix C of this document.
For the purposes of ATSDR’s evaluation, the sampling areas within the Anclote River were broken into four distinct regions to enable a better assessment of possible impacts of the site on the surrounding surface water and sediments. Sampling locations were classified as < upstream (samples from areas upriver of the easternmost site boundary), < adjacent (samples collected in the Anclote River between both property lines of the Stauffer
site, but not including Meyers Cove), < Meyers Cove (limited exclusively to those samples collected in the cove)5, and < downstream (any sample collected northwest, or downriver, of Meyers Cove).
Locations were grouped to enable a critical assessment of site impact on river quality and to characterize conditions at various exposure points along the stretch of the Anclote River near the site.
Tables 16–23 in Appendix B summarize available surface water and sediment data. The tables list the contaminants detected in each region of the Anclote River and the range of concentrations measured for each contaminant throughout the 15 years of sampling. The tables indicate where and when the highest concentrations were measured and how frequently each contaminant was detected. Because the surface water and sediments were evaluated to characterize human exposure and assess the possibility of adverse effects due to exposure, the tables also list a health-based CV.
5Meyers Cove was evaluated separately for four reasons. First, the cove is slightly downstream of the site but near it. Second, it is protected from wind and current, with the potential to “trap” contaminants. Third, part of it was filled to build an access road during plant operation. Fourth, community members have expressed specific concern about site impact on Meyers Cove.
36
STAUFFER CHEMICAL COMPANY PUBLIC HEALTH ASSESSMENT – FINAL RELEASE
ATSDR used drinking water and soil CVs for screening detected surface water and sediment concentrations. Because the Anclote River is not used as a drinking water source, use of drinking water CVs to evaluate incidental exposures associated with swimming or other recreational exposure scenarios is a conservative screening approach. Similarly, soil CVs are not directly applicable when evaluating sediment exposures in that soil CVs are developed based on the assumptions that quantifiable amounts of soil and associated dust can be incidentally ingested on a daily basis. Sediments, on the other hand, tend to have greater water content, are often submerged, and are relatively inaccessible, making exposure to contaminants in sediment less frequent and likely. As such, use of soil CVs is also a conservative approach to evaluating sediment data.6
Following are summary statements supported by the findings of the sampling studies reviewed in this section. The results of individual sampling studies are discussed in greater depth under the Surface Water Data and Sediment Data sections in Appendix C.
< Surface water (Anclote River) conditions. As part of three site-related studies, surface water has been sampled at and near the site between 1987 and the present. (Table 24, Appendix B, presents the surface water sampling location designations; Figure 7, Appendix A, shows sampling locations.) Most samples were analyzed for metals, phosphorus, fluoride, and radiologic activity. The most extensive sampling for radiologic parameters has been part of an SMC monitoring program in the immediate vicinity of the site. Contaminants detected at concentrations above drinking water CVs at least once during this time frame include antimony, arsenic, boron, chromium, iron, lead, thallium, vanadium, fluoride, sulfate, gross alpha and beta radiation, and radium-226. Contaminants detected and for which no CVs are available include calcium, magnesium, sodium, phosphorus, and polonium-210. Many of the detected substances (e.g., boron, calcium, magnesium, potassium, and sodium) were generally found at levels expected to occur naturally in a brackish estuary such as the Anclote River.
A review of available sampling data from Meyers Cove and areas upstream of, adjacent to, and downstream of the site provides limited insights on temporal and spatial variations of contamination in the different reaches of the river. Generally, the quality of the surface water has remained relatively constant. For some metals and fluoride, however, decreasing concentrations were observed over time in samples collected by SMC (1987 to present) in the immediate vicinity of the site. Spatially, trends (if any) depend on the particular substance detected. Arsenic, boron, and sulfates were consistently detected at concentrations above CVs throughout the river. Although gross alpha and beta radiation are similar both upstream and in Meyers Cove, maximum detected concentrations of radium-226, radon, and polonium-210 are up to three times higher in Meyers Cove than in areas immediately upstream. However, no meaningful spatial analysis for radioactivity is really possible. None of the samples collected
6The CVs used in this analysis only consider direct contact with surface water and sediment. These screening values do not take into account possible effects associated with indirect exposures (e.g., contaminant uptake in fish or shellfish).
37
STAUFFER CHEMICAL COMPANY PUBLIC HEALTH ASSESSMENT – FINAL RELEASE
in far upstream and downstream samples were tested for a full suite of radiologic parameters to enable a comparative analysis.
< Sediment conditions. Four studies evaluated the quality of sediment in the Anclote River between 1988 and 1993. (Table 25, Appendix B, presents the sediment sampling location designations; Figure 8, Appendix A, shows sampling locations.) Sediment samples were generally analyzed for multiple metals, fluoride, phosphorus, and radiologic activity. Arsenic, thallium, fluoride, radium-226, polonium-210 were the only substances detected at least once at concentrations above CVs. The highest concentrations were generally detected in Meyers Cove and during 1988 and 1989 sampling events.
Contaminant-specific spatial trends can be summarized as follows: Detected concentrations of metals, although generally below CVs, were elevated above background near the site, particularly in Meyers Cove. The highest concentrations of aluminum, arsenic, barium, chromium, silver, and vanadium were detected at Meyers Cove. Arsenic, however, was the only substance consistently detected in concentrations above its CV. Levels of phosphorus and total organic carbon (TOC) are also highest at Meyers Cove and areas adjacent to the site (just upstream of Meyers Cove) compared with upstream and downstream locations. Likewise, gross alpha and beta radiation were measured at the highest levels in Meyers Cove and adjacent to the site (up to 50 times higher activity than in upstream samples). Radium-226 and polonium-210 were only detected in Meyers Cove and adjacent to the site, but detected concentrations just slightly exceeded CVs.
Less obvious trends were observed with thallium and fluoride. Thallium was detected in only one sample collected downstream in 1988. Fluoride had one detection above its CV upstream of the site, adjacent to the site, and in Meyers Cove, with the highest concentration detected upstream. All three of these were part of the same study and were laboratory estimated quantities (NUS 1989). With those three exceptions, however, fluoride concentrations are generally higher in Meyers Cove than elsewhere in the river, though below its CV.
Because sediment data are only available for a 5-year period, it is difficult to assess temporal trends in sediment quality. Differences in detected concentrations in this relatively small data set are likely a result of sampling and analysis differences instead of a function of changes over time. For instance, NUS (1989) detected considerably higher fluoride levels throughout the river than were measured in later studies. Although at face value this could indicate an overall decrease in fluoride in Anclote River sediments, it is more likely a sampling artifact.
3.2.4. Biota (Fish and Shellfish)
During development of this public health assessment, ATSDR consulted FDEP, FDOH, the Florida Fish and Wildlife Conservation Commission (FFWC), and the Florida Marine Research Institute to identify available fish tissue and shellfish sampling data and to learn about fish surveys and counts in the local area. However, no fish or shellfish sampling data were identified for the site area. Further, information related to specific fish consumption patterns for the site area are not available; only county/regional statistics have been compiled according to local officials.
38
STAUFFER CHEMICAL COMPANY PUBLIC HEALTH ASSESSMENT – FINAL RELEASE
3.3. Air Contamination
This section of the public health assessment evaluates the nature and extent of contaminants released to the atmosphere from the Stauffer facility. Residents of Tarpon Springs and other communities surrounding the Stauffer facility expressed concerns about the impact of the Stauffer air emissions and asked ATSDR to evaluate whether exposure to these contaminants might have resulted in adverse health effects, especially for persons who lived near the Stauffer facility and for persons who attended Gulfside Elementary School while the Stauffer facility was in operation.
3.3.1. What Were the Air Emissions Sources From Stauffer’s Processes?
The Stauffer facility produced elemental phosphorus from phosphate rock ore mined elsewhere in Florida. The processing began by feeding the ore, which typically contained between 10% and 13% phosphorus, through a rotary kiln that heated and fused the ore into lumps called nodules. The kiln was fired by combustion of both carbon monoxide (generated elsewhere at the facility) and residual fuel oil. The phosphate rock nodules were then crushed and cooled.
The processed nodules, along with feeds of coke and silica, were then melted in an electric arc furnace. After each batch of material processed, operators “tapped” the furnace by pouring out molten liquids. These liquids included slag (calcium silicate) and ferrophosphorus (an iron-rich material). Once poured from the furnace, these liquids cooled and solidified. The resulting solid waste was stored on site and ultimately sold for further reuse. Gaseous outputs from the furnace contained elemental phosphorus, carbon monoxide, and trace contaminants. Most of the gases were captured for further processing. Some waste gases were vented to a venturi scrubber before being emitted to the air. However, all waste gases formed during furnace tapping were not captured by the air pollution control equipment; uncollected gases (such as phosphorus pentoxide, sulfur dioxide, and fluorides) vented directly to the environment. The amount of these fugitive emissions was never characterized at Stauffer.
Most of the gases generated by the furnace were vented to a condenser, which separated the liquid phosphorus product from carbon monoxide gas and an emulsion waste. The phosphorus product was stored in underwater tanks and eventually loaded into tank cars for shipping to various processing plants. The carbon monoxide gas was routed to the rotary kiln for use as fuel. A “rotary roaster” retrieved phosphorus from the emulsion waste, which was composed of phosphorus, water, and dust. The roaster was fired by the fuel oil combustion.
3.3.2. Emissions Data: What Contaminants Were Released to the Air?
This subsection reviews the information available on air emissions from the Stauffer facility, focusing on what chemicals were emitted and in what quantities. The extent of emissions data available for any facility often depends on regulatory requirements. At the time Stauffer operated, local, state, and federal environmental regulations focused primarily on a small number of contaminants and air pollution sources. Consequently, the emissions data available for Stauffer are not comprehensive in terms of the pollutants and sources considered. Many parties investigated Stauffer’s air emissions, but the majority of emissions data reported for the site were
39
STAUFFER CHEMICAL COMPANY PUBLIC HEALTH ASSESSMENT – FINAL RELEASE
generated by periodic stack tests Stauffer conducted in fulfillment of air permit requirements. The emissions data are most complete from 1972 to 1981, presumably because environmental regulations did not require emissions characterization in earlier years.
Following are summary statements about the emissions data.
< Pollutants for which emissions data are available. Emissions data for Stauffer are available for four pollutants: fluorides, particulate matter (size fraction not specified), phosphorus pentoxide, and sulfur dioxide. These emissions data are based almost entirely on stack tests that Stauffer conducted to comply with air permit requirements, which focused exclusively on emissions from point sources (or stacks). As a result, emissions data for fugitive releases are not available. Although emissions data from other phosphorus production facilities provide insight on past emissions from Stauffer, the usefulness of data from other facilities is limited because of differences in raw material composition, production levels, process configurations, operating parameters, and efficiencies of air pollution control devices.
< Fluoride emissions. Stauffer measured fluoride emissions in multiple stack tests from several processes. The best estimate of annual fluoride emissions is 6.06 tons per year, based on stack test results and annual emissions statements submitted by Stauffer to state regulators. This estimate likely understates actual fluoride emissions, because it does not account for fugitive emissions from potentially important unit operations, such as furnace tapping. The extent to which emissions are understated is not known.
< Particulate matter emissions. The available site documents include results from numerous stack tests that measured particulate matter emissions from several of Stauffer’s permitted operations. These stack tests suggest that Stauffer released 242 tons of particulate matter per year, but the particle size distribution of these releases was never quantified. The total particulate matter release estimate (242 tons/year) is based only on emissions measured from stacks at seven unit operations. Although the major point sources were identified and characterized, none of the site documents include estimates of particulate matter emissions from fugitive sources, such as wind-blown dust, materials handling operations, and fumes not captured by the furnace hood. Therefore, even if the stack test results were accurate, the best available estimate of particulate matter emissions understates the actual emission rates by an unknown, and perhaps considerable, amount.
< Sulfur dioxide emissions. Stauffer and environmental regulators extensively studied the facility’s sulfur dioxide emissions, presumably because northern Pinellas County was designated as a nonattainment area for sulfur dioxide. The results of numerous stack tests suggest that Stauffer emitted 1,545 tons of sulfur dioxide to the air per year (based on data compiled for the years before the facility’s boilers began burning low-sulfur-content fuels). Because sulfur dioxide is not expected to have been released in large quantities from the fugitive sources at Stauffer, this estimate is believed to be a reliable account of actual sulfur dioxide emissions. The majority (93%) of the sulfur dioxide emissions were from the rotary kiln.
40

STAUFFER CHEMICAL COMPANY PUBLIC HEALTH ASSESSMENT – FINAL RELEASE
< Phosphorus pentoxide emissions. Unlike fluorides, sulfur dioxide, and particulate matter, all of which were measured in numerous stack tests at Stauffer, phosphorus pentoxide emissions were measured in a single round of stack tests conducted in 1972. This round of stack tests focused on emissions from two sources expected to release the greatest amount of phosphorus pentoxide and suggest that facility-wide phosphorus pentoxide emissions were 11.6 tons per year. Because results from this single test might not be representative of typical operating conditions at Stauffer, confidence in the phosphorus pentoxide emissions data is low.
< Temporal variations in air emissions. The site documents provide no information on how emissions from Stauffer’s sources changed from hour to hour or during specific processing conditions, such as after process start-up and shut-down. Although the stack test results are suitable for making reasonable estimates of annual average emission rates for some pollutants, they do not characterize temporal variations in emissions, which might be considerable for some sources.
< Data quality. Limited information is available on the methods and quality control procedures associated with Stauffer’s stack testing, and on the facility operating conditions during most stack tests. This lack of information raises questions about the quality of emission rates. However, stack tests performed for fluoride, particulate matter, and sulfur dioxide emissions were all conducted according to the specifications of Stauffer’s air permits and typically reviewed by local and state regulators. Moreover, rigorous stack testing methods were available in the 1970s for particulate matter and sulfur dioxide, and the most recent site documents imply that EPA methods were followed for certain measurements (e.g., particulate measurements were made using EPA method 5). These latter observations give greater confidence that the stack test results, particularly for sulfur dioxide and particulate matter, are reasonably representative of Stauffer’s stack air emissions.
< Other contaminants. The Stauffer facility undoubtedly released other contaminants into the air, including metals, radionuclides, and various inorganic phosphorus compounds. However, the available site documents do not present any emissions data, measured or estimated, for these other pollutants because the Stauffer facility was not required to collect such data.
3.3.3. Meteorologic Data and Air Quality Modeling Analysis: Where Did the Air EmissionsGo?
This section reviews meteorologic data and presents an air quality modeling analysis to characterize how Stauffer’s emissions affected air quality in the Tarpon Springs area. Several parties studied the local meteorologic conditions, including the Pinellas County Department of Environmental Management (PCDEM), Stauffer, two local airports, and Florida Power, but the majority of information available is from PCDEM and the National Climatic Data Center (NCDC). This summary focuses on two periods of interest: the years when elemental phosphorus production occurred at Stauffer (up to 1981), and the years after these production activities ceased (since 1981).
41
STAUFFER CHEMICAL COMPANY PUBLIC HEALTH ASSESSMENT – FINAL RELEASE
Following are brief summary statements emphasizing the most notable features of the meteorologic data and air quality modeling analysis:
< The most extensive meteorological data available were collected at three locations: PCDEM’s Anclote Road monitoring station, the St. Petersburg-Clearwater International Airport, and the Tampa International Airport. All three meteorologic stations operated for a common period spanning 18 years (1979 to 1996). During this time, the prevailing wind direction observed at all three stations was roughly from the northeast to the southwest. This trend suggests that long-term pollutant impacts from Stauffer would likely be greatest southwest of the facility. The prevailing wind direction notwithstanding, winds also periodically blew from all other compass directions during certain times of the year. Therefore, Stauffer’s emissions likely had short-term air quality impacts in all compass directions around the site, with the extent of these impacts determined by how often a location was downwind from the facility. The least prevalent wind direction at all three stations was roughly from the south to the north, which is the direction that would blow Stauffer’s emissions toward the Gulfside Elementary School.
< Sulfur dioxide concentrations coupled with wind direction provide compelling evidence that Stauffer’s emissions accounted for a very large portion of the sulfur dioxide levels measured at PCDEM’s Anclote Road monitoring station. Specifically, on hours when winds blew from Stauffer toward the monitoring station, sulfur dioxide levels, on average, were more than five times higher than those when winds blew from other directions. This trend was observed only during years when Stauffer’s production processes operated, thus strengthening the argument that Stauffer’s emissions accounted for the elevated levels.
< Concentrations of total suspended particulates (TSP) coupled with wind direction suggest that many sources in the area, including Stauffer, contributed to the measured levels of air contamination. In general, TSP concentrations on days when winds blew from the Stauffer facility toward the Anclote Road monitoring station were consistently higher than those observed on days when winds blew in other directions. However, substantial TSP levels were measured on days when winds did not blow from Stauffer’s operations toward the monitor, indicating that other sources in the area undoubtedly contributed to the measured TSP concentrations as well. Other factors not evaluated, such as precipitation and wind speed, also likely affected the measured TSP concentrations.
3.3.3.1. Meteorologic Data
ATSDR identified five potential sources of hourly meteorologic data that might be representative of the Tarpon Springs area. Raw data from two of these sources were not available. For the other three stations, ATSDR obtained the entire histories of meteorologic data, some dating back to 1948. Table 26 in Appendix B presents key features of these stations; the corresponding meteorologic data from those stations are presented here. The summaries focus on two distinct time frames. First, prevailing wind directions are presented for the years 1979 to 1996—the longest time frame over which all three stations were operating. Second, prevailing wind directions are presented for all observations collected between 8:00 AM and 3:00 PM between January 1978 and May 1981. This time frame represents the hours that children were most likely
42
STAUFFER CHEMICAL COMPANY PUBLIC HEALTH ASSESSMENT – FINAL RELEASE
at Gulfside Elementary School at the same time that Stauffer’s main production processes were still operating. Daytime hours during summer months are included in this second time frame.
< Data set 1: PCDEM’s Anclote Road Station. From January 1979 to September 1996, PCDEM collected continuous observations of meteorologic conditions at its Anclote Road monitoring station immediately southeast of the former Stauffer facility. The station logged hourly observations of wind speed and wind direction. Over the entire period of record, the station’s completeness ratio was 89.1%, meaning that valid observations for wind speed and wind direction were recorded for 89.1% of the total number of hours in this time frame. This completeness ratio varied from year to year. In the first 3 years this station operated (1979–1981), the completeness ratio was only 77%; for the last 6 years (1991–1996), the ratio was nearly 99%. This difference suggests that PCDEM’s meteorologic station might have experienced operational difficulties during its first years of collecting data, but these difficulties were apparently resolved. For reference, EPA guidance suggests that hourly observations of meteorologic data should be at least 90% complete for use in regulatory dispersion modeling analyses (EPA 2000).
Figures 9 and 10 in Appendix A present wind roses for PCDEM’s Anclote Road meteorologic station. The wind rose in Figure 9 presents the statistical distribution of wind speed and wind direction for the entire period of record for this meteorologic station. The wind rose indicates that winds most frequently blew roughly from northeast to southwest. In fact, wind directions between 15° and 75° accounted for 24% of the hourly observations recorded at this meteorologic station. Although winds predominantly blew from the northeast, winds blowing in all directions at varying speeds were observed throughout the period of record. The least prevalent wind direction was from the south to the north (the wind direction that would most likely blow emissions from Stauffer to the Gulfside Elementary School). Specifically, wind directions between 180° and 210° accounted for only 4% of the hourly observations.
Figure 10 illustrates the distribution of wind speed and wind direction observed between January 1979 and May 1981 during the hours of 8:00 AM–3:00 PM. This time frame is when children were most likely to be at the Gulfside Elementary School. The prevailing wind pattern during this time frame (from the west-northwest) was considerably different than the prevailing wind pattern for the entire period of record. However, the wind rose for the daytime hours again indicates that winds did not frequently blow from south to north.
The average wind speed measured at the Anclote Road monitoring station was 5.1 miles per hour. This average wind speed is lower than those observed at the Tampa and St. Petersburg-Clearwater International Airports. The reason for this inconsistency is not known.
< Data set 2: Tampa International Airport. NCDC provided the entire history of meteorologic data collected at the Tampa International Airport, from 1948 to the present. The Tampa International Airport is approximately 20 miles southeast of the former Stauffer facility, and no significant terrain features are located between the airport and the former facility. In addition to recording hourly observations of wind speed and wind direction, this station logged measurements of temperature, precipitation, barometric pressure, relative humidity,
43
STAUFFER CHEMICAL COMPANY PUBLIC HEALTH ASSESSMENT – FINAL RELEASE
cloud cover, and several other parameters. Between 1979 and 1996, this station recorded valid measurements of wind speed and wind direction for 99.7% of the hours, suggesting that the station rarely experienced operational difficulties.
As the wind rose in Figure 11, Appendix A shows, the prevailing winds observed at the Tampa International Airport were also roughly from northeast to southwest, although this station had more of a east-northeasterly component compared with the prevailing winds at the Anclote Road station. At the Tampa International Airport, wind directions between 15° and 75° accounted for 23% of the valid hourly observations recorded at this station. Although a prevailing wind direction is apparent from Figure 11, winds blew from other compass directions at other times of the year. Consistent with trends observed at the Anclote Road station, winds from south to north—the direction that would blow emissions from Stauffer toward the Gulfside Elementary School—accounted for the lowest fraction of hours at the Tampa International Airport. Specifically, wind directions between 180° and 210° occurred only 7% of the time.
Figure 12 in Appendix A shows how winds varied during the time that children were most likely present at Gulfside Elementary School while Stauffer operated (i.e., between January 1978 and May 1981, during the hours of 8:00 AM and 3:00 PM). A single prevailing wind pattern for this subset of hours is less apparent, although winds blowing from west to east and from east to west account for most of the recorded observations.
The average wind speed reported for the Tampa International Airport over its entire period of record is 8.3 miles per hour. It is not known why this average wind speed is 63% higher than the average wind speed for the Anclote Road monitoring station.
< Data set 3: St. Petersburg-Clearwater International Airport. NCDC also provided the entire history of meteorologic observations recorded at the St. Petersburg-Clearwater International Airport. The meteorologic station at this airport, which is approximately 18 miles south of the former Stauffer facility, has collected hourly observations of numerous meteorologic parameters since 1973. Between 1979 and 1996, this station obtained valid observations for wind speed and wind direction in 97.3% of the possible hours.
The wind rose for the St. Petersburg-Clearwater International Airport (Figure 13, Appendix A) is similar to those for the two other stations. Most notably, the prevailing wind pattern at this station is also from roughly the northeast to the southwest, and wind directions between 15° and 75° accounted for 22% of the total observations. Similarly, the wind directions that would blow Stauffer’s emissions toward Gulfside Elementary School (between 180° and 210°) were relatively infrequent, accounting for only 8% of the total hourly observations. Figure 14 in Appendix A illustrates the wind patterns at St. Petersburg-Clearwater International Airport during the hours when children would most likely be at the Gulfside Elementary School. No clear patterns are apparent from this wind rose.
44
STAUFFER CHEMICAL COMPANY PUBLIC HEALTH ASSESSMENT – FINAL RELEASE
Between 1979 and 1996, the average wind speed at the St. Petersburg-Clearwater International Airport was 9.1 miles per hour, which is reasonably consistent with the average wind speed observed at the Tampa International Airport (8.3 miles per hour).
< Data set 4: Stauffer’s on-site meteorologic stations. Recent site summaries indicate that Stauffer previously operated as many as three “wind speed and directional instruments” (Kelly 2002). Although some of the site documents report meteorologic conditions measured by these devices over short time frames, a complete set of raw data from these stations is apparently not available. According to a recent communication, SMC does “. . . not have a single, comprehensive set of continuous, on-site meteorologic data” (Kelly 2002). Moreover, no information is readily available on the quality of Stauffer’s observations. Based on the lack of measured data and supporting documentation, ATSDR recommends basing all conclusions and inferences regarding meteorology on the data available from the airport and Anclote Road stations.
< Data set 5: Florida Power’s Anclote Plant. When reviewing site documents and discussing Stauffer operations with local and state regulators, ATSDR learned that Florida Power operated at least one continuous meteorologic station either at or near its Anclote power plant in southern Pasco County. Meteorologic data for these stations were not readily available from any of the parties ATSDR contacted, including representatives from Florida Power .
3.3.3.2. Wind Direction Analysis of Ambient Air Monitoring Data
Simultaneous measurements of wind direction and ambient air concentrations (EPA 2002a) allow for detailed analyses of the sources that most likely contribute to air pollution. PCDEM measured ambient air concentrations of sulfur dioxide and TSP at the same time it measured wind direction. ATSDR examined trends among these parameters for two time frames: 1979–1981 and 1982–1984. The first time frame was selected because it is the longest period of record for which simultaneous meteorologic and air quality measurements are available during the time that Stauffer’s production processes were operating. The second time frame was selected to have an equal period of record (i.e., 3 years) after Stauffer’s production processes shut down. The following paragraphs review comparisons of air quality measurements to concurrent wind direction observations:
< Sulfur dioxide. Between 1979 and 1981, PCDEM recorded valid measurements for both wind direction and sulfur dioxide concentration on 21,848 hours (EPA 2002a). Figure 15 in Appendix A illustrates how the sulfur dioxide concentrations, on average, varied with wind direction during this time frame. Sulfur dioxide levels at the Anclote Road monitoring station were highest when winds blew from directions between 300° and 360° (or 0°). These wind directions would have blown emissions from various locations on the former Stauffer facility toward the monitoring station. Of particular note, a wind direction of 315°—the direction which resulted in the highest average sulfur dioxide concentration—would have blown emissions from Stauffer’s rotary kiln stack toward the monitoring station.
45

STAUFFER CHEMICAL COMPANY PUBLIC HEALTH ASSESSMENT – FINAL RELEASE
Although Figure 15 provides compelling evidence that Stauffer’s emissions accounted for the elevated levels of sulfur dioxide measured near the facility, it does not rule out the possibility that emissions from Florida Power’s Anclote Plant might also have contributed to the air pollution levels, because wind directions between 300° and 360° (or 0°) would also blow emissions from this facility to the monitoring station. Figure 16 in Appendix A, however, strongly suggests that emissions from Florida Power had minimal impacts on the sulfur dioxide levels at the Anclote Road monitoring station. Specifically, Figure 16 illustrates how sulfur dioxide concentrations varied with wind direction in the 3 years immediately after Stauffer’s shutdown of major processing operations. Elevated sulfur dioxide concentrations between 300° and 360° (or 0°) are absent from this figure. The most logical explanation for the differences between Figures 15 and 16 is that Stauffer’s emissions accounted for a large fraction of the elevated sulfur dioxide levels at the Anclote Road monitoring station.
< TSP. Examining associations between TSP concentrations and wind direction is not as straightforward as the analysis in the previous section, because the TSP and wind direction measurements were collected over different averaging periods. TSP concentrations are 24hour average measurements, whereas wind directions are 1-hour averages. The impact of wind direction on particulate matter levels was assessed by evaluating how TSP concentrations, on average, vary with the number of hours per day that the Anclote Road monitoring station was downwind from the Stauffer facility.
Between 1979 and 1981, PCDEM collected valid 24-hour average TSP concentrations at the Anclote Road monitoring station on 170 days (EPA 2002a). On 23 of these days, valid wind direction data were not available for at least 20 hours. These days were excluded from this analysis. For the remaining 147 days, Figure 17 in Appendix A shows how TSP concentrations varied with the number of hours downwind from the Stauffer facility. According to Figure 17, on days when winds blew from the Stauffer facility toward the Anclote Road monitoring station for at least 13 hours, the measured TSP concentrations were more than 30 micrograms per cubic meter (µg/m3) higher than the levels measured on days when no winds blew from the facility toward the monitoring station. This increase in concentration was statistically significant.
Between 1982 and 1984, on the other hand, the number of hours per day that winds blew from the Stauffer facility toward the Anclote Road monitoring station had little impact on the measured TSP concentrations (Figure 18, Appendix A), and no statistically significant concentration differences were observed. The contrast between Figures 17 and 18 demonstrates that Stauffer’s particulate emissions affected air quality at the Anclote Road monitoring station, but the magnitude of this impact was considerably less than that for sulfur dioxide levels.
Unlike sulfur dioxide concentrations, whose levels were determined almost entirely by Stauffer’s emissions, TSP concentrations appear to result from many emission sources. As Figure 18 shows, for example, the average TSP concentration at the Anclote Road monitoring station was 69 µg/m3 on days between 1979 and 1981 when winds did not blow from Stauffer’s direction. This observation suggests that other local emissions sources (e.g., other
46
STAUFFER CHEMICAL COMPANY PUBLIC HEALTH ASSESSMENT – FINAL RELEASE
industry, wind-blown dust, mobile sources) accounted for a large portion of the measured TSP levels. Curiously, between 1982 and 1984, the average TSP concentration was only 49 µg/m3
on days when winds did not blow from the direction of Stauffer. It is unclear why this average concentration changed between the two time periods. One possible explanation for this change is that particulate emissions from another facility in the area also decreased considerably after 1981. Another possible explanation is that other meteorologic conditions that affect TSP concentrations (e.g., wind speed, precipitation) might have been significantly different between the 1979–1981 and 1982–1984 time frames.
3.3.3.3. Air Quality Modeling Analysis
ATSDR conducted an air dispersion modeling analysis to better characterize past exposures to air emissions from the Stauffer facility. The goal of the analysis was to predict the magnitude and spatial distribution of ambient air concentrations (both acute and chronic exposure durations) that resulted from Stauffer’s air emissions, especially for locations for which no air monitoring results are available, such as the Gulfside Elementary School. ATSDR will use the predicted ambient air concentrations to estimate past exposures to Stauffer’s air emissions and to make public health conclusions regarding these exposures.
3.3.3.3.1. Modeling Approach
3.3.3.3.1.1. Background
< Site-specific emissions and ambient air monitoring data. ATSDR retrieved all readily available site-specific emissions data and ambient air monitoring data. ATSDR considered the emissions data for modeling inputs, and the ambient air monitoring data for conducting model performance evaluations. Emissions data (both measured and estimated) are available for only four pollutants: sulfur dioxide, fluorides, phosphorus pentoxide, and particulate matter. The particulate matter data do not specify particle size fractions, although the stack test data do report relative amounts of soluble and insoluble particles. The available emissions measurements focus entirely on a limited number of point sources (or stacks) at the former facility. Specifically, stack tests were conducted on Stauffer’s boilers, the rotary kiln stack, the stack from the nodule cooler, the coke dryer, the furnace tap hole scrubber, and the phosphorus condenser. Although Stauffer’s air permits required annual stack tests for most of these sources, only a small subset of the stack test results were retrieved. Later discussions in this modeling approach section present additional information on the available data and identify the many air pollution sources at Stauffer that were never characterized (e.g., all fugitive emissions).
During the time Stauffer operated, ambient air monitoring data of known and high quality are available only for sulfur dioxide and total suspended particulates (TSP). The most reliable data were collected by the PCDEM to assess attainment with EPA’s National Ambient Air Quality Standards. The area surrounding Stauffer was the only sulfur dioxide nonattainment area in the entire state of Florida. Continuous sulfur dioxide monitoring (reported as 1-hour average concentrations) occurred during 4 years of Stauffer’s operation, and TSP monitoring
47

STAUFFER CHEMICAL COMPANY PUBLIC HEALTH ASSESSMENT – FINAL RELEASE
occurred on a 6-day schedule during 4.5 years of Stauffer’s operation. Stauffer measured air concentrations of phosphorus pentoxide and fluorides in several field surveys, but the quality of these sampling results is questionable. Ambient air monitoring data are not available for any other pollutants because collection of such data was not required.
< Other sources of emissions data. In addition to reviewing emissions data specific to the Stauffer facility, ATSDR considered emissions data published for the elemental phosphorus production industry. For instance, ATSDR obtained and reviewed chapters from EPA’s AP42 (EPA 1995b) and corresponding background documents. ATSDR also accessed chemical speciation profiles for relevant source categories from EPA’s SPECIATE database (EPA 2002b). ATSDR also reviewed emission inventory data for two elemental phosphorus production facilities in Idaho that the agency evaluated in the past: a facility previously operated by Monsanto in Soda Springs and a facility previously operated by FMC in Pocatello. ATSDR considered, but did not necessarily use, information from these additional sources when formulating this modeling approach.
3.3.3.3.1.1.1. Source characterization: emissions. In general terms, phosphorus production facilities separate elemental phosphorus from a phosphorus-rich ore. All other components in this ore become waste products, either as solid waste or air emissions. These facilities have multiple unit operations, all of which can release numerous contaminants to the air. Modeling the air quality impacts from these facilities requires detailed emissions data from the various operations. However, a comprehensive emissions inventory has never been prepared for the Stauffer facility, most likely because the facility ceased operations in 1981, several years before environmental regulations focused on air emissions of contaminants other than criteria pollutants.
To characterize air emissions from the Stauffer facility, ATSDR reviewed numerous site documents, including air permits, stack test results, and emissions disclosure statements. A critical issue in this modeling analysis is whether the data in these documents are representative of the actual emissions from Stauffer. This section lists the contaminants that Stauffer likely emitted and reviews the emissions data available for the various sources that released them.
For each contaminant, ATSDR considered whether modeling should be conducted. Although it is desirable for modeling to evaluate as many contaminants as possible, this desire must be weighed against the considerable uncertainties associated with estimating emissions from the former facility.
< Sulfur dioxide. Unit operations that combusted fossil fuels and exposed phosphate rock to high temperatures emitted sulfur dioxide. These emissions occurred almost entirely through stacks, and fugitive emissions were likely insignificant. Several site records document measured and estimated emissions from Stauffer’s boilers, rotary kiln, condenser, and furnace. Emissions from the boilers and rotary kiln account for 99.8% of the facility’s emissions.
ATSDR included sulfur dioxide in the modeling analysis primarily because the emissions have been extensively characterized and because a large volume of ambient air monitoring data are available for model performance evaluations. ATSDR did not consider
48
STAUFFER CHEMICAL COMPANY PUBLIC HEALTH ASSESSMENT – FINAL RELEASE
photochemical reactions, however, because the amount of sulfur dioxide consumed in the reactions over the modeling domain is believed to be insignificant.7 Table 27 in Appendix B lists the emission rates that ATSDR used for this modeling analysis. The modeling focused on the two sources that accounted for the overwhelming majority of Stauffer’s sulfur dioxide emissions.
< Particulate matter. Many sources at Stauffer emitted particulate matter. To fulfill air permit requirements, Stauffer measured particulate matter emissions from its boilers, rotary kiln, nodule cooler, furnace tap hole scrubber, coke dryer, condenser, and a baghouse used to control emissions from materials handling. Emissions data for these sources are reported as “total particulates,” without providing any information on particle sizes. Stack test results are available only in summary form, without descriptions of stack test methods that would allow inferences to be drawn about particle sizes. The only information that might be used to assess particle sizes is the amount of ‘soluble’ and ‘insoluble’ particles in the emissions. Some stack test results not only reported the total amount of particulate matter in the emissions, but indicated the relative amounts of ‘soluble’ and ‘insoluble’ particles. This distinction is made for particles collected in different parts of the stack sampling equipment. Some particulate matter (soluble particles) are captured in impinger solutions, while other particulates (insoluble particles) settle on sampling filters. As a general rule, soluble particles tend to be found in the fine fraction of particulate matter, whereas insoluble particles tend to be found in the coarse fraction. However, no definitive, quantitative statements can be made regarding size cut-offs for soluble and insoluble particles. The available site documents provide no information on fugitive emissions of particulate matter (e.g., wind-blown dust, releases during furnace tapping, materials handling losses), which can be considerable for phosphorus production facilities.
< Fluorides. ATSDR modeled the atmospheric dispersion of fluoride emissions on the basis of emission rates that Stauffer measured and estimated. Table 27 in Appendix B lists the available emissions data, which consider many, but not all, of the unit operations expected to release fluorides. The data in Table 27 translate into an annual fluoride emission rate of 6.06 tons. This is reasonably consistent with estimates of fluoride emissions from the former FMC facility (26.8 tons per year) and the Monsanto facility (24.7 tons per year), considering the different production levels of the facilities, although ATSDR notes that similarities in emission rates would not necessarily be expected given that the Stauffer and Idaho facilities process different ores. Nonetheless, the modeling results based on the available emissions data can be used to qualitatively assess whether inhalation exposures to fluorides were on the same order of magnitude as ATSDR’s corresponding minimal risk levels (MRLs).8
7According to ATSDR’s Toxicological Profile for Sulfur Dioxide (ATSDR 1998), less than 5% of airborne sulfur dioxide converts to other products per hour. Because Tampa has an average wind speed of 8.3 miles per hour, the amount of sulfur dioxide that would chemically convert within the modeling domain (2 square miles) would likely be on the order of 1%.
8The MRLs for inhalation exposures to fluorides are 0.03 ppm or 30 ppb (25.0 µg/m3) for acute exposure durations and 0.02 ppm or 20 ppb (16.6 µg/m3) for intermediate exposure durations.
49
STAUFFER CHEMICAL COMPANY PUBLIC HEALTH ASSESSMENT – FINAL RELEASE
Largely because of the lack of reliable data on reaction rate constants, ATSDR did not model photochemical reactions involving fluorides. ATSDR’s Toxicological Profile for Fluorides, Hydrogen Fluoride, and Fluorine (ATSDR 2001), for instance, states that “no information was found on the reactions of hydrogen fluoride with common atmospheric species or estimates of its overall atmospheric half-life.”
< Phosphorus compounds. Elemental phosphorus production facilities release various forms of phosphorus into the air, including phosphorus pentoxide, phosphates, and phosphine. Other than a single stack test conducted in the early 1970s that measured phosphorus pentoxide emissions from the rotary kiln and the furnace tap hole scrubber, no site-specific information exists for emissions or ambient air concentrations of phosphorus compounds. Moreover, EPA has not published emission factors for these contaminants. The only detailed information available is from the former FMC facility in Idaho, which measured or estimated emissions of total phosphorus and phosphine. Because the representativeness of these data to operations at Stauffer is unknown, ATSDR did not consider phosphorus compounds in the air dispersion modeling analysis.
< Metals. The available site records provide no information on amounts of metals in the phosphate rock, in the air emissions, or in the ambient air surrounding the facility. (Note: The environmental regulations at that time did not require the collection of such information.) Site-specific data are available on concentrations of metals in solid waste disposal areas, but the usefulness of these data are unclear. Therefore, because emission rates for metals cannot be predicted with confidence, ATSDR decided not to model atmospheric dispersion of metals.
< Radionuclides. No detailed site-specific information is available on the levels of radionuclides in the ore or in the emissions. According to EPA’s AP-42, however, phosphate rock ore mined in Florida contains radionuclides at concentrations ranging from 48 to 143 picocuries per gram (pCi/g) (EPA 1995b). The “specific radionuclides of significance” are isotopes of uranium, radium, thorium, polonium, and lead. Every emission factor for radionuclides in AP42 has a poor rating factor, meaning that “there may be reason to suspect that the facilities tested do not represent a random sample of the industry.” EPA gathered additional information on radionuclide emissions when developing the National Emission Standards for Hazardous Air Pollutants (NESHAPs) for this source category, but the representativeness of this information to the closed Stauffer facility is not clear. ATSDR already evaluated potential exposures to radionuclides in Stauffer’s solid waste products that were used for various purposes throughout the Tarpon Springs area.
< Organic compounds. Emission factors are available to estimate releases of organic compounds from the combustion of fuel. However, elemental phosphorus production facilities are primarily involved in processing inorganic chemicals and materials, and organic chemicals have not been the focus of regulatory attention at other phosphorus production facilities. Therefore, ATSDR did not consider organic chemicals in this modeling analysis.
50
STAUFFER CHEMICAL COMPANY PUBLIC HEALTH ASSESSMENT – FINAL RELEASE
3.3.3.3.1.1.2. Source characterization: release parameters. ATSDR included the following emissions sources in the modeling analysis: process boilers, rotary kiln, nodule cooler, coke dryer, materials handling operations, furnace, phosphorus condenser, and phosphorus roaster. ATSDR modeled emissions from the rotary kiln with two separate sets of stack parameters to reflect changes made to this source in 1979. Table 28 in Appendix B lists the stack parameters that ATSDR used for the modeling analysis. These parameters were obtained from various data sources, including stack test results, air permits, and inspection records.
3.3.3.3.1.1.3. Model selection and general inputs. ATSDR used the Industrial Source Complex, Short Term (ISCST3) model to conduct the dispersion modeling analysis. EPA recommends using ISCST3 for modeling continuous releases of air contaminants from multiple sources in areas with simple terrain, much like the conditions at Stauffer. The model was run using surface meteorologic data and mixing heights observed at the Tampa International Airport between 1977 and 1981—the last 5 years that Stauffer operated its major production processes. Unit emission rates (1.0 gram per second) were entered for every source, such that ATSDR could later calculate ambient air concentrations for different groups of air pollutants under different emissions scenarios. The model predicted air concentrations for four averaging periods: annual average, highest 24-hour average, highest 3-hour average, and highest 1-hour average. All concentrations were reported in units of micrograms per cubic meter, as is standard for this model.
Ambient air concentrations were predicted for a grid of receptors that extends approximately 5 miles in every compass direction from the Stauffer facility. Receptors were placed at 10-meter intervals along the fence line, at 100-meter intervals at locations within 1 mile of the facility, and at 1,000-meter intervals at locations further downwind. Overall, concentrations were predicted at more than 4,000 receptors. The modeling was run using typical regulatory default options. Building downwash was considered in this analysis; however, detailed information on the locations and heights of Stauffer’s buildings was not readily available. The building locations were estimated from facility plot plans and heights were estimated from facility photographs. The most prominent structure considered in this analysis was the furnace building.
3.3.3.3.2. Modeling Results
The dispersion modeling analysis evaluated emissions from only those sources that site documents identified and characterized. These sources were the boilers, the rotary kiln, the nodule cooler scrubber, the coke dryer, a materials handling stack, the phosphorus condenser, and the furnace tap hole scrubber. The rotary kiln was modeled as two separate sources: before and after the May 1979 stack modification. Coordinates of all stacks and buildings were inferred largely from visual inspection of aerial photographs and plot plans, which might have introduced slight error in placing individual features at the Stauffer facility. The magnitude of this error is not known, but likely is not greater than 100 feet for each source. As noted previously, fugitive emissions were not considered because site-specific information is not available on the associated emission rates. Fugitive emissions at other elemental phosphorus production facilities accounted for a large fraction of facility-wide emissions for certain contaminants, such as particulate matter.
51

STAUFFER CHEMICAL COMPANY PUBLIC HEALTH ASSESSMENT – FINAL RELEASE
The modeling outputs include a normalized concentration at each receptor (4,289 total), for each source considered (8 total), for each year of meteorologic data (5 total), and for each averaging period (4 total). Multiplying these together means that the modeling outputs include 686,240 total observations that are available for data interpretation. This number of observations can be presented and interpreted in countless different ways. This section highlights general trends and key insights from the modeling analysis.
This section presents modeled concentrations for 12 locations that ATSDR selected for further analysis. These locations were chosen only to demonstrate general trends in the predicted concentrations and to communicate results for receptors of interest (e.g., Gulfside Elementary School). For all pollutants considered, the highest predicted concentrations did not occur at these 12 locations; rather, the points of maximum impact were generally along the facility boundary, where exposures would be limited to passers-by and, perhaps, workers. Figure 19 in Appendix A shows the 12 locations selected for further analysis; Table 29 in Appendix B lists coordinates and text descriptions for these locations. Following are detailed results for the three pollutants considered – sulfur dioxide (before and after the 1979 stack modification), fluorides, and particulate matter:
< Sulfur dioxide (before the 1979 stack modification). Emissions from the rotary kiln accounted for the overwhelming majority of sulfur dioxide emissions from Stauffer. Before May 1979, the kiln stack was approximately 85 feet tall and 22 feet in diameter. In May 1979, Stauffer modified the stack by increasing the height by 75 feet and decreasing the diameter by 18 feet to enhance atmospheric dispersion of the emissions. The following paragraphs present the modeling results for the time frame before the kiln stack was modified.
As specified previously, this analysis considered sulfur dioxide emissions from two sources: the rotary kiln and the boilers. Emissions from the kiln accounted for 97.0% of the total sulfur dioxide released from these sources. To evaluate the performance of the dispersion modeling evaluation, ATSDR compared the sulfur dioxide concentrations estimated for the Anclote Road monitoring station to those that were measured at this location between July 1977 and May 1979. Table 30 in Appendix B summarizes this comparison. As the first row in the table shows, the predicted annual average concentration was 5.1 ppb lower than the measured levels, which likely results from a combination of the following factors:
< The model evaluates Stauffer’s air quality impacts and does not consider impacts from other sources of sulfur dioxide emissions. As the Table 30 notes explain, the annual average sulfur dioxide levels after Stauffer shut down were 1.42 ppb. Thus, it is reasonable to infer that emissions from other sources account for at least 1.42 ppb of the 5.1 ppb difference between the predicted and observed concentrations. However, air modeling studies conducted in the late 1970s by consultants to Stauffer, consultants to Florida Power Corporation, and the Florida Department of Environmental Regulation all concluded that air emissions from Stauffer accounted for the overwhelming majority of sulfur dioxide detected at the time by the Anclote Road monitoring station.
52

< The emission rates entered into the model do not account for all of the sulfur dioxide that Stauffer released to the air. For instance, the actual sulfur dioxide emission rates from the boiler and the rotary kiln might have been higher than those documented in the stack test results. Additionally, and more likely, emissions sources not identified in the site documents (e.g., fugitive emissions from furnace tapping) could explain the discrepancy.
< Air dispersion models have inherent uncertainties and are not perfect portrayals of atmospheric conditions. Even in cases where every model input is known, model predictions will not replicate observed concentrations. Despite these inherent limitations, air quality modeling analyses offer valuable insights into spatial and temporal variations in levels of air pollution, particularly for locations where sampling did not occur.
The second and third rows of Table 30 in Appendix B compare the estimated highest 24-hour average concentration and 1-hour average concentration for the Anclote Road monitoring station to the corresponding measured levels. For the highest 24-hour average concentrations, the comparison is similar to the annual average concentrations, and the differences most likely result for the same reasons listed above. For the highest 1-hour average concentrations, on the other hand, a different trend is observed: the estimated peak concentrations are higher than those predicted. This might have occurred for several reasons:
< It is possible that the modeling analyses are correct and that 1-hour average sulfur dioxide levels at the Anclote Road monitoring station were at times higher than the levels measured between July 1977 and May 1979.
< It is also possible that the predicted 1-hour average concentration is based on a highly unusual meteorologic condition reported at the Tampa International Airport that is not truly representative of the conditions at Stauffer.
< Finally, and most likely, the difference can simply reflect model uncertainty, which increases as concentrations are predicted for shorter averaging periods.
It will never be known exactly what caused the difference between the predicted and observed highest 1-hour average sulfur dioxide levels. However, dispersion models are less reliable at predicting short-term concentrations than at predicting long-term average levels. The fact that the estimated 1-hour peak concentrations ended up being within 30% of the observed levels is actually quite encouraging, as modeled concentrations tend to deviate more and more from observed concentrations for shorter averaging times.
Perhaps the greatest usefulness of this modeling analysis is that the results can be used to estimate ambient air concentrations of sulfur dioxide at locations where they were not measured. ATSDR chose to use the raw model outputs as the estimated concentrations when estimating exposures throughout the Tarpon Springs area. These model outputs were based on emissions data from the boilers and the rotary kiln (e.g., the model predicted that Stauffer’s contribution to annual average sulfur dioxide levels at Gulfside Elementary School was 7.0 ppb).
53

STAUFFER CHEMICAL COMPANY PUBLIC HEALTH ASSESSMENT – FINAL RELEASE
In summary, extensive information is available on the sulfur dioxide modeling results that can be used to estimate ambient air concentrations of sulfur dioxide where they were not measured. Although predicted and observed sulfur dioxide levels at the Anclote Road monitoring station differed, the magnitude of this difference is within the bounds of reasonable model performance.
< Sulfur dioxide (after the 1979 stack modification). ATSDR also modeled sulfur dioxide concentrations for Stauffer’s stack configuration between June 1979 and the time the facility closed. Three key trends are documented here.
First, Table 30 in Appendix B compares the predicted sulfur dioxide concentrations at the Anclote Road monitoring station to the measured levels between June 1979 and November 1981, when Stauffer’s furnace was permanently shut down. Consistent with the time frame before the 1979 stack modification, the predicted annual average and highest 24-hour average concentrations were lower than those that were observed, whereas the predicted highest 1hour average concentration was higher than observed levels. The interpretations of these differences presented earlier in this section also apply here.
Second, ATSDR notes that the model quite reasonably captures the relative changes in sulfur dioxide concentrations (over the long term) caused by the stack reconfiguration. Specifically, the model predicts that the reconfiguration caused annual average sulfur dioxide levels at the Anclote Road monitoring station to decrease by 7.6 ppb; the measurements indicate that sulfur dioxide levels actually decreased by 9.4 ppb. These concentration differences are quite consistent, as far as modeling predictions go, and gives reassurance that the stack reconfiguration truly did account for improvements in air quality after May 1979.
Third, for a sense of the predicted effect of the stack reconfiguration, Table 31 in Appendix B lists the predicted percent decrease in Stauffer’s contribution to sulfur dioxide levels that resulted from this modification. The table shows that Stauffer’s contribution to sulfur dioxide levels, for all averaging times and most locations considered, decreased between approximately 50% and 75%, although smaller and larger decreases were observed for certain circumstances.
< Fluorides. The modeling considered fluoride emissions from four sources: the rotary kiln, the nodule cooler scrubber, the phosphorus condenser, and the furnace tap hole scrubber. Emissions from the rotary kiln accounted for the overwhelming majority (94.3%) of the fluoride emissions. An analysis of Stauffer’s stack test data and annual emissions disclosure statements results in the following estimated ambient air concentrations of fluorides at the maximally impacted off-site location:
Averaging Time Annual average concentration Highest 24-hour average concentration Highest 1-hour average concentration
54
Concentration 0.41 ppb (0.34 µg/m3)
4.6 ppb (3.8 µg/m3) 24.6 ppb (20.5 µg/m3)
STAUFFER CHEMICAL COMPANY PUBLIC HEALTH ASSESSMENT – FINAL RELEASE
In this summary, the annual average concentration is the average concentration for the 5 years of meteorologic data considered. The highest 24-hour average concentration and the highest 1-hour average concentration are the highest predicted levels for the corresponding averaging times, based on the entire 5-year simulation period. These concentrations were predicted using the stack configuration before May 1979; the estimated concentrations for the time frame after May 1979 are more than a factor of three lower than those shown above.
Comparing the modeling results to the MRLs, ATSDR notes that estimated annual-average exposures and 24-hour average exposures are considerably lower than the MRLs, whereas the single highest estimated 1-hour average exposure for the entire vicinity over a 5-year record is less than ATSDR’s acute and intermediate inhalation MRL. This comparison suggests that the amount of fluoride emissions from Stauffer’s stacks were likely not at levels of health concern.
The most notable limitation of this analysis is that fluorides in Stauffer’s fugitive emissions were not considered, because these fugitive emission rates are unknown. To examine this issue further, ATSDR reviewed emissions data from two other elemental phosphorus production facilities that ATSDR evaluated previously. Both facilities are in southeastern Idaho. Emissions data for these facilities suggest that fugitive emissions, particularly from furnace taping, slag handling, and slag cooling, might account for a considerable portion of the facility-wide releases of fluorides. It is not clear, however, how this observation can be factored into this modeling analysis in a scientifically defensible manner.
Although the impact of these fugitive emissions from Stauffer might be impossible to quantify, ambient air monitoring results from one of the elemental phosphorus production facilities in southeastern Idaho provide additional perspective on this matter. These data are available for the Eastern Michaud Flats (EMF) site, which included both an elemental phosphorus production facility and a facility that manufactured phosphate fertilizers. The elemental phosphorus production facility at the EMF site had a production capacity approximately ten times greater than that of Stauffer, and both facilities were believed to emit large quantities of fluorides. During the remedial investigation for the EMF site, 856 air samples were collected and analyzed for fluorides. This sampling spanned an entire year, during which both facilities operated at typical production levels. Samples were collected in areas (including fence line) where air models predicted the highest concentrations would occur. The highest 24-hour average fluoride concentration measured during this extensive sampling program was 13.1 µg/m3, which is below ATSDR’s acute and intermediate MRLs for fluoride.
The air sampling results from the EMF site are somewhat reassuring, because they indicate that ambient fluoride levels in the immediate vicinity of a much larger phosphorus production facility (and a fertilizer manufacturer that also emitted fluorides) were not at levels of health concern. However, a perfect comparison cannot be made between the EMF and Stauffer sites, because several factors determine the amount of fluorides emitted by a given elemental phosphorus production facility. Two factors that have a significant impact on a facility’s
55

STAUFFER CHEMICAL COMPANY PUBLIC HEALTH ASSESSMENT – FINAL RELEASE
fluoride emission rates are (1) the fluoride content of the phosphate rock ore, which can vary greatly across different ore deposits, and (2) the facility’s process design, including the effectiveness of air pollution controls.
In summary, no studies using reliable methods ever extensively characterized ambient air concentrations of fluorides in the vicinity of Stauffer while the facility was in operation. ATSDR’s modeling analysis, which was based on the best available emissions data, suggests that ambient air concentrations of fluorides did not exceed levels of health concern. ATSDR acknowledges that this modeling analysis has limitations, most notably that emissions data were not available for every source at the facility. To evaluate air quality impacts of fluorides further, we also considered our past evaluations of air quality issues at much larger elemental phosphorus production facilities. Very extensive air sampling data for fluorides at these facilities showed no evidence of airborne fluoride concentrations being at levels of concern. This observation is consistent with the findings of our modeling analysis at Stauffer.
< Particulate matter. This section presents modeling data for “total particulates” from Stauffer, based on emissions data available for seven sources at the facility. All emissions data were reported for total particulates, without specifying particle size fractions. Because emissions data were collected during the time when most regulatory efforts focused on TSP, the stack tests likely collected particles with size ranges comparable to TSP. Although general statements can be made about particle size distributions for particular sources9, no site-specific data extensively characterized the actual particle size distribution of Stauffer’s emissions. However, some site reports indicate that air emissions from the kiln and the furnace—two of the largest point sources of particulate matter—were dominated by fine particles. Deposition was not considered in the dispersion modeling analysis, due in part to the lack of information on the particle sizes emitted from the stacks. Omitting deposition is expected to have only marginal effects on the concentrations predicted for receptors nearest the facility. (See ATSDR’s response to Comment #13 from Commentor #1 in Appendix J for further information on the validity of this approach.)
Emissions data for total particulates were available only for selected stack sources. These data suggest that Stauffer emitted 242 tons of total particulates from these stacks per year. This figure has been contested because of questions about a possible positive interference in the stack test methodology used for the rotary kiln. Assuming this interference occurred, it is possible that facility-wide stack emissions were actually as low as 150 tons per year. The model was run to estimate air concentrations for both “low emissions” and “high emissions” from the rotary kiln stack to reflect the impact of this debate.
No information is available from the site documents on fugitive emissions of particulate matter (e.g., wind-blown dust, releases during furnace tapping, materials handling losses),
9 For example, it is reasonable to assume that air emissions from high-temperature sources (e.g., boilers, rotary kiln, furnace) were predominantly fine particles and that emissions from most fugitive sources (e.g., slag crushing, wind-blown dust) were predominantly coarse particles, but no quantitative information is available for the relative amounts of fine and coarse particles.
56
STAUFFER CHEMICAL COMPANY PUBLIC HEALTH ASSESSMENT – FINAL RELEASE
which can be considerable for phosphorus production facilities. At the EMF site, for example, an emissions inventory suggests that fugitive emissions accounted for 31% of the total emissions of particulate matter less than 10 micrometers in diameter (PM10) from the elemental phosphorus production facility. The extent to which this factor applies to Stauffer is not known because of differences in the facilities’ unit operations and air pollution controls.
Table 32 in Appendix B presents estimated annual average concentrations of total particulates resulting from Stauffer’s stack emissions. Predictions are made for two time frames and two categories of rotary kiln emissions. Of the 12 receptor locations selected for this analysis, the highest estimated annual average impacts (10.86 µg/m3 of total particulates, before May 1979, based on the high kiln emission rates) are seen for receptor location 5, which is in the industrial area east of Stauffer. This area, rather than an area downwind, presumably has greater air quality impacts because of building downwash effects. At the Anclote Road monitoring station (receptor location 8), the modeling results suggest that Stauffer’s stack emissions contributed between 1.63 and 4.36 µg/m3 to annual average total particulate levels.
Data ATSDR has accessed from EPA’s SPECIATE emissions database suggest that particulate matter emissions from high temperature sources (kilns and furnaces) contain between 87% and 88% fine particles. If this profile applies to Stauffer, then it is possible that Stauffer’s air emissions from point sources contributed up to 4 :g/m3 of PM2.5 at the Anclote Road monitoring station. This likely understates Stauffer’s actual air quality impacts, because our modeling does not account for all sources of PM2.5 (e.g., fugitive emissions from the furnace), nor does it account for secondary formation of particulate aerosols.
Table 33 in Appendix B presents the highest estimated 24-hour average total particulate concentrations resulting from Stauffer’s stack emissions. The data shown in this table represent the highest incremental effect that Stauffer’s stacks had on air quality in a 24-hour period, based on 5 years of meteorologic observations. For instance, Stauffer’s point source emissions may have accounted for between 27.5 and 75.6 µg/m3 of the total particulate measured at the Anclote Road monitoring station.
The particulate matter modeling analyses suffer from some notable limitations. These limitations include lack of information on particle size distribution and fugitive emission rates, lack of confidence in the stack emissions data for the rotary kiln, the fact that only a small subset of stack results were identified, the lack of data on temporal variability in emission rates, and the possibility that stack emissions data for sources other than the rotary kiln are not representative of actual conditions. Given the uncertainties in this analysis, ATSDR is using key trends from the monitoring data (e.g., the decrease in TSP levels after Stauffer shut down, the fact that the highest levels of TSP exposure generally occurred on the same days as the highest levels of sulfur dioxide exposure, the fact that particulate emissions from other local sources (e.g., the Florida Power Anclote Plant) accounted for more than half of the TSP detected at Anclote Road) to conduct the public health evaluation. We note in Section 5.3.2, however, that our estimates of air quality impacts based on the monitoring data are reasonably consistent with our modeling predictions, thus giving us some reassurance that the estimated exposure concentrations are reasonably representative of actual exposures.
57
STAUFFER CHEMICAL COMPANY PUBLIC HEALTH ASSESSMENT – FINAL RELEASE
A number of community members have asked ATSDR about levels of air pollution at Gulfside Elementary School during the time that Stauffer was operating. Unfortunately, no ambient air monitoring data of a known and high quality were collected in the immediate vicinity of the school. As a result, the only means we have to characterize past exposures to students is through computer modeling. As Table 32 shows, our modeling analysis predicted that Stauffer’s stack emissions added an additional 2 to 3 ug/m3 total suspended particulates to background levels at the school. If we assume that emissions from the facility’s high temperature sources was between 87% and 88% fine particles, then the model predicts that Stauffer’s stack emissions may have caused a 2-3 ug/m3 increase in PM2.5 levels at the school. This likely underestimates the air quality impacts, because the computer modeling does not account for formation of secondary aerosols (which are typically fine particles) nor does it account for fugitive emissions from the furnace (which are likely primarily fine particles). We can not explicitly account for the atmospheric reactions or the fugitive emissions because the site-specific data needed for such analyses are not available and cannot be reconstructed with confidence. Therefore, we do not know the extent to which we have underestimated concentrations, though it is likely that PM2.5 levels at the school were no higher than what we have predicted for the Anclote Road monitoring station, given that the school was typically upwind from Stauffer. This means that the estimated range of PM2.5 at the school is probably somewhere between 2 and 7 ug/m3.
ATSDR realizes that Gulfside Elementary School was located close to Stauffer’s slag processing operations, which might have had emissions that contributed to exposures for students and staff. The site files we reviewed do not include emissions data for this part of the facility, nor do they provide any detailed information that would allow us to derive reasonable estimates of the air emissions. Therefore, emissions from these operations are not included in our analysis. We note, however, that emissions from these operations would likely consist of coarse particles, with relatively small contributions from fine particles. Finally, the frequency with which emissions would blow from the slag processing operations toward the school is relatively low; as Section 3.3.3.1 notes, wind directions from south to north occurred during only 4% of the hours that meteorologic observations were collected.
Although the students and staff at the Gulfside School were probably exposed to some increased levels of PM while Stauffer was operating, the lack of good information regarding their PM exposures does not allow ATSDR to determine with any certainty if these exposures constituted a hazard.
3.3.4. Ambient Air Monitoring Data: What Were the Levels of Contaminants in the Air?
This section reviews the history of ambient air sampling studies conducted in the vicinity of the Stauffer site. The studies identified to date were initiated by various parties, including EPA, PCDEM, Stauffer, the Pasco County District School Board, and Florida Power. The summary is provided for two distinct time frames: the years when elemental phosphorus production occurred at Stauffer, and the years after these production activities ceased. The detailed summaries focus on additional time frames of concern, such as the first years after the Gulfside Elementary School opened and months during which notable demolition activities occurred.
58
STAUFFER CHEMICAL COMPANY PUBLIC HEALTH ASSESSMENT – FINAL RELEASE
The review is based on site reports obtained through July 2002. These reports largely focus on ambient air sampling, although some indoor air sampling results and personal exposure monitoring results were provided as well. This summary does not review a rather large volume of ozone and nitrogen dioxide measurements collected in northern Pinellas County. These measurements are not reviewed because (a) Pinellas County is an attainment area for EPA’s National Ambient Air Quality Standards for these pollutants, (b) sampling data for these pollutants are not available for the time during which Stauffer operated, and (c) because Stauffer emissions alone would likely not have affected local ozone levels.
Following are brief summary statements of the many ambient air sampling studies conducted in the vicinity of the Stauffer facility.
3.3.4.1. Air Quality While the Stauffer Facility Operated (1947–1981)
Table 34 in Appendix B presents key features of the air sampling studies conducted in the vicinity of the Stauffer facility between 1947 and 1981. PCDEM’s sampling of sulfur dioxide and particulate matter used well-tested methods, and the sampling results are of a known and high quality. Many of the other sampling studies conducted prior to 1981 are poorly documented and lack important details on data quality. As a result, caution must be used when interpreting the results of these other studies. The data quality concerns notwithstanding, sampling results from the Anclote Road monitoring station and from other air studies in the area are generally consistent with the following summaries:
< Sulfur dioxide. Air concentrations of sulfur dioxide were measured in the immediate vicinity of the Stauffer facility from 1977 to 1981 at PCDEM’s Anclote Road monitoring station. For sulfur dioxide, the EPA has established a National Ambient Air Quality Standard of 30 ppb for a yearly average. From 1977 to 1981, the yearly average sulfur dioxide levels did not exceed EPA’s NAAQS of 30 ppb. The highest yearly average level detected for sulfur dioxide was 17 ppb. The yearly sulfur dioxide levels at the Anclote Road monitoring station are reported in Table 35.
The yearly average sulfur dioxide concentrations at the Anclote Road monitoring station decreased significantly in 1979 and again in 1981. These decreases coincide with Stauffer’s installation of a taller stack at the rotary kiln scrubber in 1979 and Stauffer’s main production operations shutting down altogether in 1981. In fact, the yearly average concentration of sulfur dioxide at the Anclote Road monitoring station decreased by more than 90% between 1979 and the years after Stauffer shut down. The most plausible explanation for this trend is that air emissions from Stauffer accounted for a large portion of ambient air concentrations of sulfur dioxide southeast of the facility. Although other air emissions sources of sulfur dioxide operate in northern Pinellas County and southern Pasco County, these sources accounted for a very small fraction (likely less than 10%) of the airborne sulfur dioxide detected at the Anclote Road monitoring station in 1979 and earlier.
59
STAUFFER CHEMICAL COMPANY PUBLIC HEALTH ASSESSMENT – FINAL RELEASE
EPA has also established NAAQS sulfur dioxide levels for a 24-hour and a 3-hour period. These air quality standards are 140 ppb as an average level over 24 hours and 500 ppb as an average level over 3 hours. It should be noted that the 3-hour standard is based on impaired visibility and property damage and not on health. Table 35 shows the number of times each year that 24-hour and 3-hour average sulfur dioxide levels exceeded EPA’s 24-hour and 3hour air quality standard for sulfur dioxide. From 1977 to 1979, EPA’s 24-hour NAAQS for sulfur dioxide was exceeded 16 times. From 1977 to 1979, the 3-hour NAAQS for sulfur dioxide was exceeded 9 times. Because of these exceedances, the northwest corner of Pinellas County was designated a nonattainment area for sulfur dioxide. This was the only nonattainment area for sulfur dioxide in the state of Florida. As shown in Table 35, it should be noted that from 1977 to 1981, the 1-hour average sulfur dioxide levels at the Anclote Road station frequently exceeded 100 ppb. The actual number of 1-hour exceedances during this period was 601. There is no NAAQS standard for a 1-hour exposure, but the number is mentioned here because it plays an important part in the health evaluation of exposure to sulfur dioxide. The public health significance of sulfur dioxide levels will be described in more detail later in the report.
In January 2001, EPA published a notice in the Federal Register (EPA 2001) stating that the Agency’s level of concern for 5-minute peak sulfur dioxide levels was 0.6 ppm. The Agency also established 2 ppm as an endangerment level for 5-minute peak sulfur dioxide levels. Because EPA considers peak sulfur dioxide levels to occur locally rather than nationally, the Agency decided not to establish the 5-minute peak level of concern and level o endangerment as national standards. Rather, the agency developed program to help states deal with local sulfur levels where peak levels might be a health concern. In the Federal Register notice EPA highlights that the population of concern is people with mild to moderate asthma who exercise outside (EPA 2001).
Sulfur dioxide monitoring data collected by Stauffer are generally consistent with the PCDEM’s monitoring results, but the quality of Stauffer’s sulfur dioxide measurements is unknown.
The ambient air monitoring data provide limited insights on spatial variations in sulfur dioxide concentrations. The only other sulfur dioxide monitoring data of known and high quality collected before 1982 was from PCDEM’s East Lake Tarpon monitoring station, where sulfur dioxide levels did not change considerably after Stauffer operations shut down. This trend suggests that air emissions from Stauffer had minimal air quality impacts at this location 7 miles southeast of the facility. One sulfur dioxide emissions source identified in many site documents is the Anclote Plant that was previously operated by Florida Power. Although this electricity generating facility clearly emitted far greater amounts of sulfur dioxide than did the Stauffer facility, modeling studies conducted by multiple parties—including consultants to Stauffer—unanimously concluded that the Anclote Plant’s emissions have limited impacts on sulfur dioxide levels measured in the vicinity of the Stauffer facility. This is because emissions from the Anclote Plant disperse greatly from the altitude at which they are released (nearly 500 feet) down to ground level.
60

STAUFFER CHEMICAL COMPANY PUBLIC HEALTH ASSESSMENT – FINAL RELEASE
< Particulate matter. PCDEM, Stauffer, and Florida Power measured ambient air concentrations of particulate matter at many locations in northern Pinellas County and southern Pasco County while Stauffer operated. PCDEM conducted TSP monitoring at its Anclote Road and East Lake Tarpon stations. At PCDEM’s Anclote Road monitoring station, annual geometric mean TSP concentrations ranged from 60.2 to 73.2 :g/m3 between 1977 and 1981. The highest 24-hour average TSP concentration measured at this station was 224 µg/m3. These concentrations reflect the air quality impacts of all local sources, including fugitive emissions from the Stauffer site. No sampling studies measured particle size distribution within TSP while Stauffer operated. Although some samples were analyzed in a laboratory for particle characteristics, those analyses were not designed to quantify air concentrations of different particle size fractions. Our specific concern with the filter inspection data is that particles on the TSP filters could well have evaporated, agglomerated, or otherwise changed in shape and size in the months between sample collection and filter inspection in the laboratory. We believe it is likely that the limited filter inspection results do not characterize the size distribution of the particles that were in the air.
After Stauffer shut down its phosphorus production processes in 1981, TSP concentrations at the Anclote Road monitoring station decreased, on average, by 24 µg/m3. This trend provides two notable insights on air quality in the area. First, emissions sources that ceased operating in 1981 accounted for approximately 32% of the TSP measured at the Anclote Road station. The sources that contributed to this decrease primarily include production-related releases from Stauffer, but might also include sources associated with processing Stauffer’s wastes (e.g., nearby slag processing facilities). Second, the data suggest that approximately 68% of the airborne TSP before 1981 originated from sources other than Stauffer, such as other local industry (e.g., the Florida Power Anclote Plant), mobile sources, and wind-blown dust.
At the Anclote Road monitoring station, airborne particulate levels never exceeded EPA’s former (pre-1987) TSP air quality standards. However, both 24-hour average and annual average concentrations exceeded Florida’s standards. Such elevated levels were measured throughout the state of Florida in the late 1970s and early 1980s. In 1981, for instance, 24hour average concentrations of TSP exceeded Florida’s air quality standard at 45 ambient air monitoring stations across the state. Thus, even though TSP levels at the Anclote Road monitoring station were clearly elevated, these levels were not unusually higher than those routinely measured using similar sampling methods in suburban and urban settings throughout Florida.
The available data provide limited insights on spatial variations in particulate matter concentrations. In 1979 and 1980, annual geometric mean TSP concentrations at PCDEM’s East Lake Tarpon monitoring station were 37.4 and 38.4 µg/m3, respectively. These levels fall within the range of background concentrations reported for rural locations in Florida. Therefore, it is reasonable to infer that Stauffer’s emissions had minimal, if any, air quality impacts on the East Lake Tarpon monitoring station, which is roughly 7 miles southeast of the Stauffer facility.
61
STAUFFER CHEMICAL COMPANY PUBLIC HEALTH ASSESSMENT – FINAL RELEASE
Stauffer and Florida Power also operated particulate sampling devices in northern Pinellas County and southern Pasco County while Stauffer produced elemental phosphorus. However, original documentation of these sampling studies is incomplete, and the quality of the sampling data and accuracy of the measured concentrations are not known.
< Fluorides. Stauffer conducted several air quality surveys between 1964 and 1981 to measure ambient air concentrations of fluorides. Several hundred samples were collected at numerous on-site and off-site locations during this time frame, and only a single 24-hour average fluoride concentration (38.7 ppb) exceeded ATSDR’s MRL for acute inhalation exposures (30 ppb). The public health significance of exceeding the acute MRL for fluoride is described in the Public Health Implication section (section 5.4.3.) The quality of Stauffer’s fluoride measurements is not known and cannot be assessed from the available information, because the site documents provide no insights on measurement precision and accuracy or on quality assurance measures. As a result, drawing firm conclusions based solely on Stauffer’s fluoride measurements is not advised.
< Phosphorus pentoxide. Stauffer measured ambient air concentrations of phosphorus pentoxide in several hundred air samples collected during two air quality surveys—one performed in 1964, the other in 1975. Average phosphorus pentoxide concentrations measured during these studies ranged from 0.45 to 3.30 µg/m3, and the highest 24-hour concentration reported was 18.03 µg/m3. These concentrations were measured from particulate filter samples and therefore do not reflect contributions from any gaseous phosphorus pentoxide. The data collected during these two surveys is of unknown quality, because critical information on the survey design, quality assurance measures, and analytical methods is not documented in the site reports. As a result, drawing firm conclusions based solely on Stauffer’s phosphorus pentoxide measurements is not advised.
< Other pollutants. Although pre-1981 ambient air sampling efforts focused only on the previous four pollutants, elemental phosphorus production facilities like Stauffer emit many additional contaminants. Examples include combustion by-products, additional phosphorus compounds (e.g., phosphoric acid and phosphine), and metals. According to site documents reviewed to date, no ambient air samples were analyzed for these other contaminants during the time when Stauffer manufactured elemental phosphorus in Tarpon Springs.
3.3.4.2. Air Quality After Stauffer Operations Ceased (1982–2002)
Table 36 in Appendix B presents key features of the air sampling study conducted in the Tarpon Springs area since the Stauffer facility ceased production in 1981. Most of the ambient air sampling studies conducted since 1981 are well documented, used sampling and analytical methods developed for or approved by federal environmental and occupational agencies, and followed appropriate quality control and quality assurance procedures. With few exceptions, the data appear to be of a known and high quality. Following are data summaries on sampling results collected during the multiple studies:
62
STAUFFER CHEMICAL COMPANY PUBLIC HEALTH ASSESSMENT – FINAL RELEASE
< Sulfur dioxide. From 1982 to the present, ambient air concentrations of sulfur dioxide at several monitoring locations in northern Pinellas County have not exceeded EPA’s health-based air quality standards. Between 1982 and 2001, annual average concentrations at PCDEM’s three sulfur dioxide monitoring stations ranged from 0.77 to 4.94 ppb, with the highest levels consistently measured at the East Lake Tarpon station. At these stations, 1-hour average concentrations exceeded 100 ppb no more than seven times per year since 1982. Data collected from Florida Power’s ambient air monitoring network also indicate that sulfur dioxide levels have not exceeded EPA’s air quality standards.
< Particulate matter. Since 1981, EPA, PCDEM, and Stauffer contractors collected more than 1,000 ambient air samples from northern Pinellas County to measure concentrations of different sizes of particulate matter. Sampling was conducted on site, at a location adjacent to Stauffer, and at a location several miles away from Stauffer. Routine sampling occurred during periods of inactivity at Stauffer, and focused studies were initiated to assess air quality impacts from specific remediation projects. To date, none of the measured PM10 and TSP concentrations exceeded EPA’s corresponding health-based air quality standards.
< Phosphorus compounds. Both Pasco County District School Board and Stauffer contractors conducted sampling programs to measure ambient air concentrations of phosphorus compounds: elemental phosphorus, phosphoric acid, phosphorus pentoxide. More than 500 measurements have been taken since 1981, primarily during site demolition and remediation activities. Sampling for phosphorus compounds occurred both at on-site locations and at the Gulfside Elementary School. Since 1981, 22 air samples were analyzed for concentrations of elemental phosphorus; it was detected in 4 of these samples, at levels ranging from 2 to 11 µg/m3. Phosphoric acid was detected in 201 of 552 samples measured for this contaminant. The range of detected concentrations (2.01–4.62 µg/m3) is lower than EPA’s reference concentration (10 µg/m3). Phosphoric pentoxide was not detected in any of the 10 air samples collected since 1981 that were analyzed for this contaminant.
< Asbestos. Contractors to the Pasco County District School Board and Stauffer collected more than 100 personal and ambient air samples to determine whether site remediation activities at Stauffer release asbestos to the air. Asbestos structures were not detected in any of the air samples collected at Gulfside Elementary School (detection limit of 0.005 structures per cubic centimeter). Stauffer contractors conducted a more extensive sampling project using more sensitive methods and found an average asbestos concentration of 0.00024 structures per cubic centimeter around the perimeter of the Stauffer facility.
< Arsenic, fluorides, and radon. Only one air sampling study—a month-long EPA site investigation conducted in 1987—analyzed air samples for arsenic, fluorides, and radon at Stauffer. Arsenic and fluorides were not detected in the 12 samples that were analyzed for these contaminants; radon levels in five samples ranged from 0.1 to 2.2 pCi/L. A control sample collected at the site (i.e., analogous to a field blank) contained radon at 1.2 pCi/L.
< Other contaminants. The air contaminants released from Stauffer changed dramatically after 1981 when elemental phosphorus production operations ceased. Since 1981, air emissions are
63

STAUFFER CHEMICAL COMPANY PUBLIC HEALTH ASSESSMENT – FINAL RELEASE
most likely limited to wind-blown dust and contaminants released during site demolition and remediation activities. PCDEM’s routine particulate monitoring adjacent to Stauffer presumably detected any influences from wind-blown dust, and focused sampling projects by multiple parties have characterized air quality during site demolition and remediation activities. Thus, the available data appear to adequately characterize local air quality since Stauffer’s main production operations ceased.
64

STAUFFER CHEMICAL COMPANY PUBLIC HEALTH ASSESSMENT – FINAL RELEASE
3.4. Physical and Other Hazards
ATSDR observed few physical hazards during the most recent site visit. In addition, access to the main plant site and the slag processing area is closely controlled by fencing and by 24-hour security guards. Therefore, ATSDR believes that the risk of injury to trespassers from physical hazards at the Stauffer site is negligible.
65
STAUFFER CHEMICAL COMPANY PUBLIC HEALTH ASSESSMENT – FINAL RELEASE
4. EXPOSURE PATHWAYS ANALYSES
This section summarizes the completed and potential exposure pathways associated with the Stauffer site. As part of the public health assessment process, one of ATSDR’s first goals is to identify exposure pathways. Exposure pathways are studied to understand the different ways that contaminants move within and from a site and the different ways that people might come in contact with those contaminants. In short, the purpose of the exposure pathway evaluation is to determine (a) if anyone might come into contact with the environmental media under study; (b) when (how often, over what time period); (c) where; and (d) how. This information alone does not define exposure—it simply helps us to better understand the likelihood of exposures. The exposure pathway information is used together with the environmental data to support the health effects evaluation.
ATSDR obtained information to support the exposure pathway analysis for the Stauffer site from multiple site investigation reports, previously released ATSDR documents, 2000 U.S. Census data, and through communications with local and state officials and community members. The analysis also draws from available environmental and exposure data for air, groundwater, soil and slag, and surface water and sediment that were presented in previous sections of this document. Refer to those sections for detailed descriptions of available environmental data and medium-specific environmental transport information. Throughout this process, ATSDR also closely examines community concerns to ensure exposures of special concern are adequately addressed.
To determine whether nearby residents are exposed to contaminants migrating from the site, ATSDR evaluated the environmental and human components of exposure pathways. Exposure pathways consist of five elements: a source of contamination, transport through an environmental medium, a point of exposure, a route of human exposure, and a potentially exposed population.
An exposure pathway can be eliminated if at least one of the five elements is missing and will never be present. ATSDR categorizes exposure pathways that are not eliminated as either completed or potential. For completed pathways, all five elements exist and exposure to a contaminant has occurred, is occurring, or will occur. For potential pathways, at least one of the five elements is missing, but could exist. For potential pathways, exposure to a contaminant could have occurred, could be occurring, or could occur in the future. Tables 37 and 38 in Appendix B summarize exposure pathway information related to the Stauffer site.
4.1. Completed Exposure Pathways
Table 37, Appendix B, is a summary of the completed exposure pathways at this site.
4.1.1. Breathing Outdoor Air
< Breathing outdoor air is a completed past exposure pathway both on site and off site. When the plant was operational, area residents noticed “haze” and dusts presumed to be emitted from the plant furnace. Residents also expressed concern about emissions during site activities
66
STAUFFER CHEMICAL COMPANY PUBLIC HEALTH ASSESSMENT – FINAL RELEASE
requiring digging or excavations, particularly slag processing activities. People working at or living near the Stauffer site were exposed to airborne contaminants emitted from the site during those times.
As detailed in ATSDR’s evaluation of the nature and extent of air contamination (in the Air Contamination section), air releases have been linked with Stauffer operations and emissions reached off-site locations.
During the years of plant operations, elevated ambient air concentrations of sulfur dioxide were measured in the immediate vicinity of the Stauffer facility. Particulate matter concentrations measured in northern Pinellas and southern Pasco counties were also elevated. However, in the Anclote Road area, it is estimated that nearly 70% of the airborne particulate matter originated from sources other than Stauffer, such as other local industry (e.g., the Florida Power Anclote Plant), mobile sources, and wind-blown dust. Information about the size of the particulate matter was not recorded, making it more difficult to assess health effects. Measured data related to fluorides, phosphorus pentoxide, and other pollutants such as metals are scant or of questionable or poor quality, and need to be interpreted with caution. Measured concentrations of sulfur dioxide, particulate matter, phosphorus pentoxide, arsenic, fluorides, and radon in air samples collected after 1981 indicate improved air quality in the area.
4.1.1.1. On-Site Air Exposures
Plant workers and site remediation workers on the site came in contact with contaminated air during the years of plant operation and during subsequent demolition and site investigation activities. The extent of worker exposure would have depended on each worker’s work area (some on-site areas might have been subject to more air contamination than others) and the level of activity (more strenuous activities tend to increase a person’s breathing rate). Some worker exposure data (from personal monitors and work area monitors) are available that provide some insights to the type and extent of worker exposures, at least for certain time periods (See section 5.8 for a detailed discussion of these data.)
4.1.1.2. Off-Site Air Exposures
Because emissions from the site blew off site, people living, working, and playing in downwind locations came in contact with Stauffer emissions during its years of operation. Again, the extent of exposure would depend on location and activities being conducted. Children and those with preexisting respiratory conditions (e.g., asthma, emphysema) are potentially more sensitive or susceptible populations. In addition, unlike workers, some area residents had the potential for round-the-clock exposures (e.g., if they stayed at home all day).
Analysis of available emissions, meteorological, and air monitoring data confirm that off-site areas were affected by Stauffer emissions. As previously discussed, meteorologic data from 1979 to 1996 show that prevailing winds blew roughly from the northeast to the southwest. This trend suggests that long-term pollutant impacts from Stauffer would likely be greatest at locations southwest of the facility. The prevailing wind direction notwithstanding, winds also periodically
67

STAUFFER CHEMICAL COMPANY PUBLIC HEALTH ASSESSMENT – FINAL RELEASE
blew from all other compass directions during certain times of the year. Therefore, Stauffer emissions likely had short-term air quality impacts in all compass directions around the site, with the extent of these impacts determined by how often a location was downwind from the facility.
The least prevalent wind direction at all three stations was roughly from the south to the north, which is the direction that would blow Stauffer’s emissions toward the Gulfside Elementary School. Even so, children at the Gulfside school are a sensitive population possibly exposed to Stauffer emissions during the years 1977 to 1981. Some concerns also exist about potential emissions from slag processing activities in the area of the site closest to the school. Air quality was not measured at Gulfside Elementary until after 1981; phosphorus and asbestos were the focus of these studies.
4.1.2. Drinking On-Site Groundwater
< Groundwater was used for drinking and industrial purposes on site in the past (until approximately 1979). Drinking water was drawn primarily from wells within the deeper Floridan aquifer. Therefore, drinking on-site groundwater is considered a completed past exposure pathway. Available data, however, show that measured contaminant levels did not exceed health-based CVs in the wells known to have been used for drinking water purposes. The site is now served by public water supplies, which have not been affected by Stauffer.
It can be assumed that workers and visitors drank and washed with water from the on-site potable water supply until the plant was connected to the City of Tarpon Springs water supply in late 1979 or early 1980. The plant’s potable water was supplied primarily by wells 5, 12, 13, and 15, with wells 7, 10, and 14 serving as backup. Available sampling data for these wells indicate that a number of contaminants were present, including fluoride, phosphorus, sulfate, and iron. However, the contaminant concentrations were below levels of health concern.
4.1.3. Contacting Surface Soil and Slag
4.1.3.1. On-Site Surface Soil and Slag
< Contacting on-site surface soil and slag is another completed exposure pathway (past and current). Contact with on-site soils and slag by the general public or by trespassers is expected to be minimal because the site is completely fenced with 24-hour security. Past plant and remediation workers might have had a greater opportunity to contact contaminated materials. It is not known how much soil and slag people might have come in contact with in the past. Completed and planned cleanup actions are intended to eliminate or prevent possible future exposures. The site is now completely fenced, preventing public access.
Past site activities impacted on-site soils in production, process, and disposal areas. In addition, slag generated during Stauffer operations was stored or disposed of in locations across the site. Soil and slag sampling has been a component of site investigations conducted since 1988, with most sample results from 1988 to 1993.
68
STAUFFER CHEMICAL COMPANY PUBLIC HEALTH ASSESSMENT – FINAL RELEASE
As detailed in the Soil subsection of the On-site Contamination section, the highest concentrations of site-related contaminants were generally detected in soils collected from the former ponds. Contaminants consistently detected at levels above screening values included antimony, arsenic, cadmium, thallium, fluoride, and radium-226 in soils from both the former pond and main production areas. Sampling in slag processing areas generally contained lower concentrations of site-related contaminants, with the exception of radium-226.
Site workers are the population most likely to come in contact with on-site soil and slag. When the site was in use, the pond “soils” were under water and not accessible. No known sampling of the ponds or the materials below were conducted during the years of plant operation. The extent of contact with other soil and slag materials would be dependent on the nature of the worker activities (e.g., was direct contact with soils required), the type of protective clothing (e.g., gloves), and personal hygiene practices following work activities. The occasional trespasser might have contacted and might continue to come in contact with site soils or slag. Site security, however, has likely limited the number of trespassers on site.
Historically, the site has been completely fenced south of Anclote Road and under a security guard’s watch 24 hours per day; however, the area north of Anclote Road (e.g., the slag storage area, ponds 39 and 52) was accessible to the public (NUS 1991). Because the site is now inactive and secure, exposure potential to site soils is limited to remediation workers.
Proposed cleanup activities (now in the planning and negotiation phase) are intended to prevent possible future exposures to elevated or harmful levels of contaminants in soil or slag.
4.1.3.2. Off-Site Soil (Gulfside Elementary School)
< Contact with off-site soils also is a completed pathway. Because of its proximity to the site and the fact that children are an affected population, several studies have focused on characterizing the soils and building materials on the Gulfside Elementary School property. Other than radium-226, no contaminants were detected at elevated levels in school soils. No other off-site soil data are available.
The Gulfside Elementary School opened in 1978. The school is approximately 600 feet from the former slag storage area, directly across Anclote Road north of the Stauffer site. Predominant wind directions were not in the direction of the Gulfside Elementary School. However, its proximity to the Stauffer site, especially to the slag processing area, warrants close examination (see discussion that follows).
As detailed in the Soil and Slag-Containing Materials subsection of the Off-Site Contamination section, Gulfside soils were tested in studies conducted between 1988 and 1997. No earlier soil sample results are available. Sample results indicate that the surface soils collected on the school property contained lower concentrations of virtually all of the contaminants found at the Stauffer site. Metals and fluoride were detected in surface soils at concentrations well below health-based CVs. Radium-226, however, was consistently detected at levels above its CV. No asbestos was detected.
69

STAUFFER CHEMICAL COMPANY PUBLIC HEALTH ASSESSMENT – FINAL RELEASE
Sampling of the road materials around Gulfside Elementary School property, as well as the soil beneath the roads and roofing material on the school, all showed concentrations of radium-226 that exceeded the CV. The soil beneath the road also showed concentrations of radon-222 that exceeded concentrations found in the on-site surface soils. All of these building materials contained far lower concentrations of the contaminants found in the on-site slag.
People (especially children) might accidentally ingest soil and dust generated from soils during normal activities. Everyone ingests some soil or dust every day. Small children (especially those of preschool age) tend to swallow more soil or dust than does any other age group because children of this age tend to have more contact with soil through play activities and their tendency for more hand-to-mouth activity. Children in elementary schools, teenagers, and adults tend to swallow much smaller amounts of soil or dust. The amount of grass cover in an area, the amount of time spent outdoors, and weather conditions also influence how much soil contact people have.
No soil sampling data exist in “downwind” areas. Therefore, no definitive statement can be made about other possible off-site soil conditions.
4.1.3.3. Off-Site Slag/Building Materials
< Slag generated by Stauffer processes was stored on site and used as roadway and building material throughout the nearby communities. Therefore, contact with slag is a completed exposure pathway. The amount of direct contact that people have had with slag in these areas is not fully known, but sampling results show relatively low contaminant concentrations compared with on-site conditions. EGR exposures associated with these materials also were measured and determined not to be harmful.
Slag material generated from Stauffer operations was routinely used in the construction of homes, driveways, and roadways in nearby communities. Studies conducted in the late 1990s focused primarily on the levels of EGR emitted from these materials. A few studies also examined slag materials for chemical and radionuclide contamination.
People can be exposed to gamma radiation just by being near contaminated material. Community exposure to gamma radiation was the subject of a recent ATSDR health consultation, which concluded that the combined gamma radiation doses from homes and pavement with phosphorus slag measured for residents near the former Stauffer chemical plant are consistent with background levels and do not pose a health threat to the community (ATSDR 2002).
Off-site sampling studies revealed that road and building materials sampled in the surrounding community contained lower concentrations of contaminants than were found on site. Only arsenic and radium-226 consistently exceeded CVs in off-site samples. Maximum concentrations of radium-226 were generally found in the roadbed or pavement used to construct Bluff Boulevard and Gulfview Road, as well as in a few residential building slabs and driveways. None of the off-site sampling studies found evidence of asbestos.
70
STAUFFER CHEMICAL COMPANY PUBLIC HEALTH ASSESSMENT – FINAL RELEASE
Because slag was used throughout the community, contact with these materials could occur regularly. However, because most of the slag has generally been bound up in building materials and roadways, any chemical contamination is not expected to be largely bioavailable (that is, in a form that can be easily ingested or absorbed by people). Dusts from these roads and building materials might contain chemicals that were previously found in slag, but the contribution of this to total exposure is believed to be minimal, and would presumably be reflected in the available particulate matter measurements.
4.1.4. Ingesting or Contacting Surface Water and Sediment
< Ingesting or contacting surface water and sediment are completed exposure pathways because contaminated groundwater from beneath the Stauffer site discharges to the river and people might come in contact with water and sediment when using the river. The river is used for boating, fishing, swimming, and wading. However, in general, water and sediment samples, especially those collected away from the site (e.g., downstream locations sampled near the mouth of the river) do not show unusually elevated contaminant levels. Some of the highest detected contaminant concentrations in sediment were detected in Meyers Cove, though not at harmful levels. In addition, contact with surface water contaminants is not of health concern based on levels and types of exposures expected (e.g., occasional contact during recreational activities).
As described in the Surface Water and Sediment (Anclote River) subsection of the Off-Site Contamination section, surface water and sediment in the Anclote River has been tested as part of four site-related investigations beginning in 1988 to determine if groundwater discharge or surface drainage have negatively impacted the river. In addition, SMC has been sampling river water in the immediate vicinity of the site (just upstream of the site and in Meyers Cove) at least two times a year since 1987. These sampling results generally indicate elevated contaminant concentrations in Meyers Cove sediments compared with other reaches of the river. Surface water quality does not vary greatly throughout the river. No sampling data exist to provide a picture of river conditions during the years of plant operations.
Children and adults fishing and swimming in the Anclote River are likely to contact the water and, possibly, sediments. Again, the specific activity will dictate how much water or sediment, if any, might actually be taken into the body. For example, during swimming, people might accidently ingest water from the river. However, the amount of water ingested is expected to be minimal because the brackish nature of the river would cause swimmers to spit out most of the water taken into their mouths. During wading activities or fishing activities (particularly shellfishing activities), people might have some skin contact with sediments. Because sediments are generally submerged in water, prolonged contact with the skin is not likely. Also, the types of contaminants detected (e.g., metals and other inorganics) are not typically well-absorbed through the skin, further reducing possible exposures.
While a few sediment and surface water samples contained contaminants at levels that exceeded ATSDR comparison values, the levels detected in surface water and sediment are not likely to
71
STAUFFER CHEMICAL COMPANY PUBLIC HEALTH ASSESSMENT – FINAL RELEASE
cause harmful effects because (1) the levels are too low, (2) the frequency of samples with elevated levels are low, (3) people are not likely to drink water from the river consistently, and (4) contact with sediment is limited. Therefore, it is safe for people to use the Anclote River for recreational purposes.
4.2. Potential Exposure Pathways
For a summary of the potential exposure pathways at this site, refer to Table 38 in Appendix B.
4.2.1 Drinking Off-Site Groundwater
< Most, if not all, private wells in the site vicinity are not located in the direct path of site contaminant flow. However, private wells serving residences and businesses do exist near the site and community members have expressed concern about the safety of their supplies. ATSDR therefore considered drinking off-site groundwater as a potential exposure pathway (past, current, and future) in its public health evaluation. In addition, some nearby shallow groundwater wells are used for irrigation and lawn-watering activities. Available sampling data (1988–2002) show a few contaminants at slightly elevated levels in area private wells.
< Planned cleanup actions are anticipated to remove or contain on-site contamination and prevent any potential future movement of groundwater contaminants away from the site.
As detailed in the Groundwater subsection of the On-Site Contaminants section, fairly extensive monitoring of the shallow groundwater beneath the Stauffer site (multiple wells tested from 1985 to 2003) reveals the presence of site-related contamination. Less-extensive testing of the deeper Floridan Aquifer (four wells tested from 1988 to 1993) generally shows few elevated levels of pollutants. The predominant direction of groundwater flow in both aquifers beneath the site is to the south/southwest directly into the Anclote River, suggesting limited potential for pollutants to migrate to off-site water supplies. Nonetheless, ATSDR carefully examined the fairly limited set of sampling data from private wells located several directions and distances from the site to address specific community concerns voiced regarding the quality of area groundwater and to evaluate whether any harmful exposures could be occurring.
Groundwater near the site is used for potable water supplies in residential and commercial/industrial locations. Potable wells are believed to draw water from the deeper Floridan Aquifer. Adults and children drink, cook with, and bathe in water from these private wells. The nearest known residential potable well is 2,500 feet northwest of the site (SMC 2001). Because the river is immediately south/southwest of the site, the closest “downgradient” potable wells are on the other side of the Anclote River in Tarpon Springs. Several commercial wells were identified and sampled immediately east of the site on Anclote Road and Savannah Avenue. Although public water is available, some private wells are used in a small residential area west of the site, primarily for irrigation purposes. In addition, approximately 20 homes in the Hickory Lane and Cemetery Lane area of the Holiday Utilities service area use private wells.
72
STAUFFER CHEMICAL COMPANY PUBLIC HEALTH ASSESSMENT – FINAL RELEASE
Contaminant information is available for 38 private wells. Some data were collected as early as 1988 as part of site investigations, but most sampling was conducted between 1999 and 2001 by FDOH in association with its underground storage tank program and in response to private well owner requests. Sampling results revealed arsenic, chromium, lead, nickel, thallium, zinc, chlorides, sulfate, gross alpha radiation, and radium-226 at levels above ATSDR CVs, but at relatively low frequencies and most at concentrations well within an order of magnitude of CVs. Because these wells are not in the direct path of groundwater flow from the site, the source(s) of these substances are not believed to be site-related and could be naturally-occurring background.
4.2.2. Contacting On-Site Subsurface Soils
< Contact with on-site subsurface soil is a potential future exposure pathway. Some contamination has been detected in deeper soils (greater than 6–12 inches below the ground surface) in the main processing area, beneath the slag piles, and near former disposal ponds. No past or current exposures exist because these soils are not accessible. Future excavations could result in exposure to workers; however, site cleanup plans still under negotiation will be developed and implemented to prevent future exposures.
As described in the Other On-Site Soils subsection of the Soil section, sampling of the subsurface soils on site generally showed lower concentrations of contaminants compared with on-site surface soils. However, evidence shows that contaminants associated with site operations, particularly metals and fluoride, are elevated in some subsurface soils. The samples with the highest concentrations of contaminants in the subsurface soil were obtained mainly from the northeast property and along the western portion of the main production area.
People cannot currently come in contact with subsurface soils, but could potentially in the future should site soils be excavated or otherwise disturbed. Remedial workers would be the most likely group of people to come in contact with excavated soils. It is expected that any such excavations would be performed as part of site clean-up activities, under which the proper protection of workers and safe disposal or treatment of contaminated soils would be required.
4.2.3. Eating Fish/Shellfish (Biota)
< Eating fish is a potential exposure pathway (past, present, and future).
Harvesting fish and shellfish from the Anclote River has been, and continues to be, a popular activity. Specific counts on the amount of recreational-caught fish in the site area are not available. Further, no sampling data are available that specifically characterize the quality of the fish and shellfish in the Anclote River or in the Gulf of Mexico near the mouth of the Anclote River. ATSDR contacted FDEP, FDOH, FFWCC, and Florida Marine Research Institute to learn about fish surveys and counts in the local area. None of these contacts were aware of any relevant fish sampling data.
Descriptive surveys of the river have been conducted over the years, but do not provide useful human exposure data. For example, the University of South Florida conducted a study in
73

STAUFFER CHEMICAL COMPANY PUBLIC HEALTH ASSESSMENT – FINAL RELEASE
1970–1974 that evaluated the composition, abundance, and distribution of aquatic life in the Anclote River (ranging from bacteria to plankton to benthic organisms [e.g., worms, clams] to fish) (Weston 1989). More recently, FDEP’s Surface Water and Assessment Monitoring Program conducted a biological assessment of the Anclote River watershed in 1997 that focused primarily on nutrient levels far upstream of the site (FDEP 1998).
FDOH issued a health advisory for the Anclote River including the Tarpon Springs area in Pinellas County (FDOH no date). The advisory, which is based on mercury contamination in fish, is not related to the Stauffer site. FDOH advises that adults should limit consumption to one meal per week. FDOH also advises that children under 15 years of age and nursing or pregnant women should limit consumption to one meal per month. Fish included in this advisory are largemouth bass, bowfin, and gar. FDOH has information about all Florida fish consumption advisories (FDOH no date), and includes more information on the work of FDOH, FFWC, and the FDEP with regard to mercury in freshwater fish around the state.
Some inferences can be made about the potential impacts of water and sediment contamination on fish by reviewing surface water and sediment data to determine the frequency of detection and the concentrations of site-related contaminants. These data can be compared with water or sediment quality criteria,10 and focus on contaminants that are likely to accumulate in edible parts of fish.
While residents may eat fish and shellfish from the Anclote River, fish and shellfish are not likely to be contaminated with chemicals from the Stauffer facility. Chemicals detected in soil, water, and air from the Stauffer facility are not known to concentrate in fish or shellfish. It should be noted, however, that the Florida Department of Health has issued a fish advisory for the Anclote River because of mercury contamination. Mercury contamination in fish is not from the Stauffer facility.
Some people might be concerned about arsenic accumulation in fish. Fish absorb inorganic arsenic from water and sediment and rapidly convert it to an organic arsenic. The most common organic arsenic formed is called arsenobetaine. This is a natural process in fish, and many fish (especially saltwater fish) have high levels of arsenobetaine. Arsenobetaine is not harmful to people because it is easily and quickly eliminated from people’s bodies through urine.
In summary, ATSDR does not believe that contaminants detected in surface water and sediment in samples collected from the Anclote River at and near the Stauffer site are likely to accumulate to harmful levels in fish or shellfish. Though mercury levels are not elevated in available surface water and sediment samples, prudent public health practice would call for following FDOH’s fish advisory, limiting fish intake to one meal per week (adults) and one meal per month (children and pregnant/nursing women).
10EPA recommends pollutant concentrations in water that are considered to ensure the safe consumption of fish living in that water. EPA’s water quality criteria are based on data and scientific judgments on the relationships between pollutant concentrations and human health effects.
74
STAUFFER CHEMICAL COMPANY PUBLIC HEALTH ASSESSMENT – FINAL RELEASE
4.3. Exposure Pathway Conclusions
On the basis of our exposure pathways analyses, ATSDR concludes that no harmful effects are expected to be associated with the following exposure situations:
< Drinking on-site groundwater in the past
< Ingesting or contacting surface water and sediment
< Eating fish and shellfish from the Anclote River
ATSDR’s exposure pathways evaluation also identified several exposure situations requiring a more in-depth analysis to determine whether health hazards exist or existed and whether any public health actions or recommendations are needed:
< Exposure to sulfur dioxide, particulate matter, and fluoride in air
< Exposure to ionizing radiation
< Exposure to contaminants in private well water
< Exposure to contaminants in soil
< Exposure of former Stauffer workers while working at the plant (i.e., occupational exposures).
The findings of ATSDR’s analyses of these pathways are detailed in the Public Health Implications section that follows.
75

STAUFFER CHEMICAL COMPANY PUBLIC HEALTH ASSESSMENT – FINAL RELEASE
5. PUBLIC HEALTH IMPLICATIONS
5.1. Introduction
In conducting the evaluation of exposure to contaminants from the Stauffer facility, ATSDR reviewed the scientific literature for particulate matter, sulfur dioxide, fluorides, and other contaminants. For sulfur dioxide, fluorides, and most other contaminants, ATSDR relied on its toxicological profiles, which summarize pertinent toxicity data from animal and human studies. In addition to the toxicological profiles, ATSDR also used recently published scientific reports. Because ATSDR does not have a toxicological profile for particulate matter, the agency used published scientific literature about the harmful effects of particulate matter.
To evaluate exposure from breathing contaminants in air, ATSDR develops inhalation MRLs when sufficient human or animal studies are available. MRLs are available for three exposure periods: acute for exposure periods up to 14 days, intermediate for exposure periods of 15 to 364 days, and chronic for exposure periods greater than 1 year. Therefore, a chemical can have acute, intermediate, and chronic MRLs if sufficient scientific studies are judged to be available for those periods. An inhalation MRL is the concentration of a chemical in air below which noncancerous harmful effects are unlikely. The concentration unit for an inhalation MRL is either parts of chemical per billion parts of air or milligrams of chemical per cubic meter of air (mg/m3). For example, if ATSDR developed an acute, inhalation MRL of 10 ppb for a chemical and the chemical’s measured concentration in air is 5 ppb, then people could be exposed to 5 ppb of the chemical and noncancerous harmful effects are not likely. It is important to realize that MRLs cover only noncancerous effects, even for chemicals that can cause cancer. For cancer-causing chemicals, ATSDR also uses a mathematical method developed by EPA to estimate a numerical cancer risk as well as biomedical judgement for evaluating cancer risk qualitatively.
Exceeding an MRL, however, does not mean that harmful effects will occur. Exceeding a MRL means that a more thorough toxicological evaluation is necessary. Examples of some factors that are considered as part of a more thorough evaluation include the following:
< Comparing the chemical concentration in air to concentrations that cause harmful effects to determine how close the concentrations are,
< Determining who is exposed and if they are more sensitive to the chemical,
< Evaluating the location of the air sample in relation to where people live,
< Determining if the toxicological effect in study is applicable to the people who are exposed,
< Considering different aspects of exposure in the study (e.g. dosing period, amount, frequency of exposure) and the applicability of those aspect to people who live near the site and their exposure,
76

STAUFFER CHEMICAL COMPANY PUBLIC HEALTH ASSESSMENT – FINAL RELEASE
< Considering the effect of uncertainty in exposure estimates, and
< Considering the effect of uncertainty in deciding possible harmful effects.
After conducting its site-specific toxicological evaluation, ATSDR describes whether people who are exposed to site contaminants might experience harmful effects from that exposure. As part of this discussion, ATSDR also describes the uncertainty that usually exists in making these decisions.
ATSDR has a series of reports that summarize the scientific literature for the interaction of certain groups of chemicals. For instance, ATSDR has an Interaction Profile for Arsenic, Hydraxines, Jet Fuels, Strontium, and Trichoroethylene. ATSDR does not have an interaction profile for particulates and sulfur dioxide. Nevertheless, some information is available about acidic particulates and that information is summarized in section 5.3.5.
In general, the ambient air monitoring data described in the previous sections indicate that some people who lived near the Stauffer facility when it was operating were exposed to some site-related air contaminants, including sulfur dioxide and particulate matter (as measured or estimated by TSP, PM10, and PM2.5). It is important to note that the outdoor air monitoring results are used in this public health assessment as a surrogate for exposure to air pollutants in the area of the Stauffer facility. Actual individual exposure to air pollutants is determined by a complex interplay among human activity, including the locations where time is spent, housing characteristics (as they influence penetration of outdoor pollutants), and other factors.
5.2. Exposure to Sulfur Dioxide in Air and the Possibility of Harmful Effects
ATSDR has outdoor air measurements for sulfur dioxide in the Stauffer area from 1977 through most of the 1990s. These data form the basis of ATSDR’s evaluation to determine the possibility of harmful effects occurring in residents (both adults and children) who live near the Stauffer facility.
5.2.1. Historical Air Exposure When Stauffer Was Operating
Stauffer began operations in the 1940s and stopped production by 1982, and ATSDR has outdoor air monitoring data from the second half of 1977 through 1981 while Stauffer was operating. These data were summarized previously in the Air Contamination subsection of the Environmental Contaminants and Other Hazards section; therefore, this discussion will highlight only certain parts of those data.
5.2.1.1. Sulfur Dioxide Levels and ATSDR’s MRL
Using the hourly data available from the Anclote Road monitoring station, ATSDR has calculated the average sulfur dioxide levels for the following time frames: 1 hour, 3 hours, 24 hours, and 1 year. The data for these measurements are summarized in Table 35, Appendix B.
77

STAUFFER CHEMICAL COMPANY PUBLIC HEALTH ASSESSMENT – FINAL RELEASE
At this time, we will focus on the average sulfur dioxide levels for a 1-hour period. For most of the 4½ years that air monitoring results are available, hourly measurements are available for most of the 24 hours in each day. With 365 days in a year, 8,760 (24 × 365) hourly air measurements are possible in a year. Table 39 in Appendix B highlights the number of hourly measurements for the number of hourly samples and days that sulfur dioxide levels were above 10 ppb, ATSDR’s acute MRL for sulfur dioxide. The number of hourly samples in a given year is less than 8,760 because for some days or for parts of some days, air samples were not collected. In 1977, air samples were collected for only the second half of the year.
ATSDR has an acute (i.e., less than 14 days) inhalation MRL for sulfur dioxide of 10 ppb. The acute MRL is used to determine whether sulfur dioxide levels should be evaluated further. Table 39 in Appendix B is a summary of average hourly sulfur dioxide levels at the Anclote Road monitoring station during the years that Stauffer operated. The information in Table 39 shows that over the 4½ years of monitoring:11
< Average hourly air levels exceeded the acute MRL of 10 ppb for 3,467 hours out of a possible 34,782 hours, or about 1 out of every 10 hours.
< On 809 days (out of a possible 1,642 days) at least 1 average hourly air sample exceeded the acute MRL of 10 ppb.
< On average, the MRL of 10 ppb was exceeded at the Anclote monitoring station on 1 of every 2 days for at least 1 hour.
It should be emphasized that exceeding an MRL does not mean that harmful effects are likely because MRLs are set below the levels that are known to cause harmful effects. Exceeding an MRL means that further toxicological evaluation is needed. To conduct this more thorough toxicological evaluation, ATSDR used data from its Toxicological Profile for Sulfur Dioxide (ATSDR 1998) as well as recently published human and animal studies to determine whether people in the Tarpon Springs area might experience harmful effects from sulfur dioxide. A review of the pertinent human and animal studies on the effects of sulfur dioxide following brief exposures can be found in Appendix E.
A review of the toxicological literature for sulfur dioxide shows that the lowest sulfur dioxide level that is known to cause harmful effects in humans is 100 ppb after exposures of just a few minutes. At 100 ppb, these harmful effects have only been observed in people with asthma who were exercising and breathing through a mouthpiece. The same harmful effects have been observed in exercising asthmatics who were exposed to 250 ppb sulfur dioxide in a chamber (rather than via a mouthpiece). At 100 ppb, the effects observed in exercising asthmatics were an increase in airway resistance in the lungs (that is, bronchoconstriction) It should be noted that these effects are temporary and go away after the exposure stops.
The effects on airway resistance become more pronounced with increasing sulfur dioxide levels to the point that wheezing and shortness of breath can occur when sulfur dioxide levels reach about 500 ppb. It should be noted that some asthmatics who participated in experiments with
11The number of observations in 1977 is less than in 1978 because air monitoring started mid-year in 1977.
78

STAUFFER CHEMICAL COMPANY PUBLIC HEALTH ASSESSMENT – FINAL RELEASE
sulfur dioxide at 500 ppb required the use of bronchodialators to relieve the wheezing and shortness of breath caused by sulfur dioxide exposure. A more detailed review of the harmful effects of sulfur dioxide exposure can be found in Table 40 and Appendix E.
It should be noted that other triggers also exist for asthma. For example, air pollution, tobacco smoke, dust mites, animal dander, molds, and pollen are a few triggers listed at the following websites for the American Lung Association: http://www.lungusa.org/asthma/astastrig.html and http://www.lungusa.org/asthma/asctriggers.html. The American Lung Association specifically lists sulfur dioxide as a trigger for asthma.
5.2.2. Sulfur Dioxide Levels Near Stauffer
Results from the Anclote Road monitoring station show 601 hours out of the 34,782 hours when data are available from July 1977 to December 1981 had hourly average sulfur dioxide levels that exceeded 100 ppb (see Table 41, Appendix B). Table 41 also shows that of the 1,642 days monitored, 210 days had at least 1 hour when average sulfur dioxide exceeded 100 ppb.
Figure 20 in Appendix A shows hourly sulfur dioxide levels at the Anclote Road monitoring station for the 4½ years when the facility was operating and sulfur dioxide levels were being measured. Because such a long time frame is being presented, only levels above 100 ppb are reported in Figure 20.12 The data show that periodically very high sulfur dioxide levels were detected from July 1977, through 1978, and up to May 1979. In May 1979, the stack height for the kiln was raised, and, although significant sulfur dioxide levels were still detected occasionally at the Anclote Road monitoring station, the levels were much lower than those before May 1979. Although it is not clear from Figure 20, several days can elapse between spikes in sulfur dioxide levels. The highest sulfur dioxide level reported was a hourly average of 840 ppb on April 15, 1979.
Several points can be inferred from the hourly average sulfur dioxide data collected from July 1977 to December 1981: < The highest hourly sulfur dioxide levels were more frequent in 1977, 1978, and the first
quarter of 1979 (through April). < Hourly sulfur dioxide levels were less frequently elevated after May 1979. < On days with elevated sulfur dioxide levels, levels were sometimes elevated for several hours
in a row. < Hourly sulfur dioxide levels exceeded 500 ppb on 20 days from July 1977 through May 1979. < Hourly sulfur dioxide levels did not exceed 500 ppb after May 1979. < The highest hourly sulfur dioxide level detected was 840 ppb on April 15, 1979, at the
Anclote Road monitoring station.
12100 ppb is chosen here because it is the lowest level of sulfur dioxide that has been shown to cause an adverse effect in humans. A description of the harmful effects caused by sulfur dioxide at various levels in air can be found in Appendix E.
79
STAUFFER CHEMICAL COMPANY PUBLIC HEALTH ASSESSMENT – FINAL RELEASE
< Elevated sulfur dioxide levels were observed during all months of the year, during all days of the week, and during all hours of the day.
When sulfur dioxide levels were elevated, sometimes they were elevated for several hours at a time. Figure 21 in Appendix A shows sulfur dioxide levels on December 18, 1977, when hourly average levels remained elevated for 14 hours at the Anclote Road monitoring station. During this time, hourly sulfur dioxide levels were elevated from 7:00 AM to 9:00 AM and again from 1:00 PM to 11:00 PM on December 18, with a final spike at 1:00 AM on December 19.
In another incident on January 13–15, 1978, average hourly sulfur dioxide levels remained significantly elevated at the Anclote Road monitoring station, showing a variable pattern with both brief and extended elevations (Figure 22, Appendix A). These exposures to elevated sulfur dioxide levels were significant because high exposures continued for 15 of 19 hours.
At other times, hourly sulfur dioxide levels were elevated for only an hour or for just a few hours. This pattern is evident in Figure 23, Appendix A, when in a 24-hour period, sulfur dioxide levels were significantly elevated only from 2:00 PM to 4:00 PM. It is important to realize the average sulfur dioxide level reported for an hour is likely to represent variable sulfur dioxide levels over 60 minutes. This is the case if a cloud of sulfur dioxide passes the air monitoring station in 15 minutes but the levels are measured and averaged over 60 minutes. It has been reported that particulate clouds impacted the Flaherty Marina in Pinellas County for 5 to 15 minutes at a time (PCDEM 1979). It is reasonable to assume that the same is possible for sulfur dioxide clouds.13
This means that a hourly average sulfur dioxide level of 260 ppb might have a peak concentration in the cloud of about 1,000 ppb if the cloud passed the monitoring station in 15 minutes.
It also is important to realize that the Anclote Road monitoring station would pick up increased levels of sulfur dioxide only when wind was blowing toward the southeast, thus carrying sulfur dioxide from the Stauffer facility to the monitoring station. If wind was blowing in another direction, elevated sulfur dioxide levels were not likely to be detected at the Anclote Road monitoring station but rather in the downwind direction away from the monitoring station.
To determine how frequently sulfur dioxide levels might have been elevated in other areas around Stauffer, ATSDR compared (a) the number of hours that wind blew toward the Anclote Road monitoring station to (b) the number of hours that sulfur dioxide levels exceeded 100 ppb when wind was blowing toward the Anclote Road monitoring station. This comparison allows ATSDR to estimate how often (i.e., the frequency) sulfur dioxide levels were above 100 ppb when wind blew in another direction with sulfur dioxide levels above 100 ppb.
13This assumption is likely to be true if sulfur dioxide emissions from the facility vary during brief periods of the day: for example, if sulfur dioxide emissions from the facility are low for most of the day and because of some activity at the plant, sulfur dioxide emissions increase for very short periods (e.g., 10 minutes, 30 minutes). When air was blowing toward the southeast, these sporadic releases would likely have resulted in a plume of contaminated air passing by the air monitoring station. If the plume passed the station in 30 minutes, then maximum levels in the plume would be significantly greater than the average level measured over 60 minutes.
80
STAUFFER CHEMICAL COMPANY PUBLIC HEALTH ASSESSMENT – FINAL RELEASE
Because of limited data, this comparison could only be made for 1979, 1980, and 1981, the years for which wind direction and hourly sulfur dioxide levels were available. In addition, the frequency was determined for January to May 1979 because at the end of May Stauffer raised the stack for the kiln. Because the kiln was the major source for sulfur dioxide emissions, raising the stack likely affected the frequency at which the Anclote Road monitoring station captured elevated sulfur dioxide levels. Therefore, the frequency of elevated sulfur dioxide levels at the Anclote Road monitoring station before May 1979 was probably higher than after May 1979.
Table 42 in Appendix B shows the number of hours that wind blew toward the Anclote Road monitoring station and the number of hours that average hourly sulfur dioxide levels exceeded 100 ppb. As expected, the frequency that elevated hourly sulfur dioxide levels was highest occurred from January to May 1979; specifically, 48 of the 720 hours (or 6.7% of the time) that wind blew toward the Anclote monitoring station. Another way of thinking about what 6.7% means is that when wind is blowing in a particular direction from Stauffer, about 6 to 7% of the time it will have hourly sulfur dioxide levels above 100 ppb. Stated yet another way, for every 1,000 hours that wind blows in a certain direction, 60 to 70 hours are likely to have hourly sulfur dioxide levels above 100 ppb.
After raising the kiln stack, the percent of time that sulfur dioxide levels exceeded 100 ppb dropped to 57 of the 1,577 hours (or 3.6% of the time) that wind blew toward the monitoring station. Slightly lower percentages are found for 1980 (3%) and 1981 (1.7%) and probably reflect not only the raised stack but also the decreased production at Stauffer.
Figure 24 in Appendix A shows the location of the kiln and the Anclote Road monitoring station, which is about 1,540 feet southeast of the kiln. Figure 24 also shows a circle 1,540 feet away from the kiln in every direction. It is reasonable to assume that sulfur dioxide levels measured at the Anclote Road monitoring station will be similar to levels that might be found at other directions from the kiln and at the same distance of 1,540 feet. As seen in Figure 24, other areas that might have similar sulfur dioxide levels as the Anclote Road monitoring station include the following (only those areas or buildings built before 1982)14: < The Flaherty Marina, < Residential homes southwest of the Stauffer facility along the shore of the Anclote River, < Residential homes west of the Stauffer facility, and < Commercial and industrial businesses east of the Stauffer facility along Anclote Road.
With the information in Table 42, Appendix B, and using known wind direction in other directions, it is possible to estimate the number of hours that sulfur dioxide levels exceeded 100 ppb in other wind directions. It is important to remember that this information applies to a
14The approach used to estimated the frequency of elevated exposures to Stauffer’s emissions assumes that the facility accounted for all of the sulfur dioxide levels measured in the air near the site. To a first approximation, this is a reasonable assumption, and is supported by modeling analyses previously conducted by multiple parties. ATSDR also used outputs from its modeling analyses to assess the public health implications of exposure to sulfur dioxide.
81

STAUFFER CHEMICAL COMPANY PUBLIC HEALTH ASSESSMENT – FINAL RELEASE
distance of 1,540 feet from the kiln—the distance from the Anclote Road monitoring station to the kiln.
Table 43 in Appendix B contains information about the frequency at which these other areas around Stauffer might have been exposed from January to May 1979 to hourly sulfur dioxide levels that exceeded 100 ppb. Table 43 shows the following: < Other areas that are within 1,540 feet of the kiln, < The number of hours that wind blew in those directions, and < The estimated number of hours that wind blew in those directions and sulfur dioxide levels
exceeded 100 ppb.
Only people who lived or visited these areas when Stauffer was operating were at risk for exposure. The 100 ppb exposure level applies to a distance of 1,540 feet from the kiln. Air monitoring data are not available for distances beyond 1,540 feet; therefore, these areas will be evaluated later in this report using an air dispersion model to estimate sulfur dioxide levels farther away from the kiln.
To interpret the information in Table 43, for example, people who lived southwest of the Stauffer facility along the shore of the Anclote River were likely to have been exposed to sulfur dioxide levels greater than 100 ppb for 52 hours between January and May 1979. People who lived farther away were likely exposed less frequently to hourly sulfur dioxide levels exceeding 100 ppb. An estimate of their exposures will be conducted in the air modeling evaluation.
It is important to realize that if a person lived within 1,540 feet of the Stauffer kiln (in any direction), he or she would have been exposed periodically throughout the year to significantly elevated levels of sulfur dioxide. The point is that although some uncertainty exists about the actual number of hours a person was exposed, the values in Table 43 are probably close to the actual number for the 5-month period for which data were available. In previous years, the actual amount of time a person was exposed was probably about twice the number of hours presented in Table 43 because the hours in Table 43 only cover 5 months. These estimates provide insight into the general amount of time that someone might have been exposed to sulfur dioxide levels that cause harmful effects.
5.2.3. Possible Harmful Effects from Sulfur Dioxide in Residents
5.2.3.1. Short-Term Exposures to Sulfur Dioxide
People who lived, worked, or visited the following areas when Stauffer was operating were at risk for harmful effects from exposure to sulfur dioxide (only those areas or buildings built before 1982): < Residential homes southwest of the Stauffer facility along the shore of the Anclote River, < Residential homes west of the Stauffer facility, and < Commercial and industrial businesses east of the Stauffer facility along Anclote Road.
82
STAUFFER CHEMICAL COMPANY PUBLIC HEALTH ASSESSMENT – FINAL RELEASE
These exposures could have lasted for a couple of hours or many hours. Table 43 in Appendix B shows the estimated number of times that hourly sulfur dioxide levels exceeded 100 ppb; Figures 20 and 21 in Appendix A show that: < hourly sulfur dioxide levels on occasion could have been elevated for most of the day (Figure
21), < hourly sulfur dioxide levels on occasion could have been as high as 800 ppb (Figures 20 and
21), and < hourly sulfur dioxide levels on occasion could have been elevated off-and-on for several days
in a row (Figure 20).
Table 40 in Appendix B is a summary of the harmful effects from brief exposures to sulfur dioxide. Data in Table 40 show that people who lived in the areas listed previously that are within 1,540 feet of the kiln might have experienced the following harmful effects: < an increase in airway resistance and bronchoconstriction,15
< wheezing and shortness of breath, < an increase in heart rate and breathing rate, < cough, and < irritation of the eyes, nose, or throat.
Persons most likely to have experienced these symptoms first were those people with asthma who were exercising at the time of exposure to sulfur dioxide; as sulfur dioxide levels rose, persons with asthma who did not exercise as well as persons without asthma would also start to experience symptoms. For instance, at 100 ppb, the only effect that might occur is an increase in airway resistance in exercising asthmatics. As sulfur dioxide levels approached and exceeded 500 ppb, wheezing and shortness of breath might have occurred in some persons with asthma who were exercising during exposure. Exposure at this level may require medication (bronchodialators) to relieve symptoms. Sulfur dioxide levels exceeded 500 ppb at the Anclote Road monitoring station on the following dates:
September 24, 1977 January 13, 1978 February 15, 1978 April 15, 1979 September 28, 1977 January 14, 1978 April 7, 1978 April 16, 1979 September 29, 1977 January 18, 1978 April 9, 1978 April 17, 1979 October 15, 1977 February 6, 1978 September 7, 1978 April 18, 1979 December 18, 1977 February 14, 1978 October 6, 1978 April 19, 1979
Sulfur dioxide levels exceeded 500 ppb and at least 1 hour exceeded 800 ppb on two dates: December 18, 1977 (8 hours over 500 ppb), and April 18, 1979 (5 hours over 500 ppb).
It is important to remember that a reported level of 500 ppb or 800 ppb sulfur dioxide is an average sulfur dioxide level over 1 hour. This means that as a plume of sulfur dioxide passed a
15An increase is airway resistance means that air traveling through the airway passages in the lungs is meeting more resistance; It is a precursor to bronchoconstriction, which is the narrowing of the air passages in the lung. If bronchoconstriction is severe, wheezing and difficulty breathing can occur.
83
STAUFFER CHEMICAL COMPANY PUBLIC HEALTH ASSESSMENT – FINAL RELEASE
populated area, there were likely to be periods within that hour when sulfur dioxide levels were higher than the average level and periods when sulfur dioxide levels were lower than the average level. Therefore, for the 1 hour when sulfur dioxide levels were measured at an average concentration of 800 ppb, there might have been intervals within that hour (for example, 10 minutes or 30 minutes) when sulfur dioxide levels were much higher and much lower. Sulfur dioxide levels for brief periods might have been two to three times the average (e.g., 1,600 ppb or 2,400 ppb) (EPA 1986). This is important because Table 40, Appendix B, shows that brief exposures of 10 to 20 minutes to 1,000 to 8,000 ppb sulfur dioxide can cause more serious damage to the lungs. In addition to shortness of breath and wheezing, persons (those with and without asthma) might experience symptoms such as increased heart and breathing rate, throat irritation, redness in the airways, and increased number of inflammatory cells in fluid from the lungs (Amdur et al. 1953; Frank et al. 1962; Sandstrom et al. 1989; Sheppard et al. 1981). Controlled studies in people with asthma have shown that repeated exposures to sulfur dioxide can reduce the lung’s responsiveness to sulfur dioxide. For instance, lung response was reduced in 10 exercising persons with asthma who were exposed to 1,000 ppb sulfur dioxide in a chamber during repeated exercise. In another study, bronchoconstriction was less severe in exercising persons with asthma on the second day of a 2-day exposure period, thus implying that some people might develop a tolerance to sulfur dioxide (Kehrl et al. 1987; Linn et al. 1984a). This reduced response has been recognized in workers (Department of Labor 1975); however, this tolerance was not observed in other studies of persons with asthma when tested 1 day and 7 days after the initial exposure to sulfur dioxide (Sheppard et al. 1983).
As mentioned previously, exposure to 100 ppb sulfur dioxide in exercising asthmatics can cause a mild increase in airway resistance. This increase can be detected in a clinical setting but is not likely to cause overt symptoms in exercising asthmatics. Airway resistance returns to normal shortly after exposure to sulfur dioxide ends. When exposures approach 500 ppb in exercising asthmatics, symptoms of wheezing and shortness of breath will occur in some asthmatics. In experiments with some asthmatics, medication was required to relieve these symptoms; therefore, they are not always minor symptoms. When exposures approach 1,000 ppb sulfur dioxide, some healthy people will develop an increase in airway resistance along with an increase in heart rate and breathing rate. A more detailed discussion of the adverse effects of sulfur dioxide can be found in Appendix E and summary of human and animal studies is in Table 40 (Appendix B).
5.2.3.2. Long-Term Exposures to Sulfur Dioxide
Two human studies—the Harvard Six Cities Study (HSCS) (Dockery et al. 1993) and the American Cancer Society (ACS) studies (Pope et al. 1995, 2002)—analyzed the effect of long-term exposure to sulfur dioxide on human health. The ACS study is a nationwide study that compares air pollutant levels to rates of various diseases and death. These findings were initially reported in 1995 (Pope et al. 1995) and updated in March 2002 (Pope et al. 2002). An important finding in the 2002 report is that exposure to sulfur dioxide over many years is associated with a small increase in the number of deaths. This increase in the number of deaths was found when looking at people who died from all causes of death, when people died from heart or lung disease, and when people died from lung cancer. The 2002 report found that exposure to ozone, nitrogen dioxide, and carbon monoxide did not increase the number of deaths at the average levels
84

STAUFFER CHEMICAL COMPANY PUBLIC HEALTH ASSESSMENT – FINAL RELEASE
reported in the cities studied. The increase in death rate in this study could be detected because about 500,000 people participated in the study, which allowed the scientists to detect very small increases in the effect of sulfur dioxide exposure.
The ACS study measured sulfur dioxide levels across the United States as part of the study. In 1980, the 24-hour average sulfur dioxide level was 9.7 ppb in 118 U.S. cities. The 24-hour average sulfur dioxide level in 126 cities from 1982 to 1998 decreased to 6.7 ppb.
The results of the 2002 ACS study (Pope et al. 2002) are supported by the 1995 ACS study (Pope et al. 1995) and the HSCS (Dockery et al. 1993). The Health Effects Institute (HEI) re-analyzed the HSCS and the 1995 ACS study results and found that exposure to sulfur dioxide was associated with an increase in the number of deaths (Krewski et al. 2000).
Table 44 in Appendix B shows the annual average sulfur dioxide levels from 1977 to 1981 (the years Stauffer operated) and 1982. Samples were collected from the Anclote Road monitoring station, and the annual average is based on the 24-hour sulfur dioxide levels measured throughout the year. Annual average sulfur dioxide levels ranged from about 17 ppb in 1977 to 4 ppb in 1981. These sulfur dioxide levels are similar to the levels reported in the ACS study (Pope et al. 2002) that was associated with a small increase in the number of deaths from heart and lung disease. It should be noted that these annual sulfur dioxide levels reflect ambient (that is, outdoor) levels that existed at the Anclote Road monitoring station. When deciding whether people who lived farther away from the Stauffer facility might have been at risk, the following factors are important to remember:
< People who lived or worked within 1,540 feet of the kiln before 1982 in the direction of the Anclote Road monitoring station were the only people who were exposed to these levels of sulfur dioxide,
< People who lived or worked within 1,540 feet of the kiln between 1947 and 1981 had the potential for the longest period of exposure to sulfur dioxide and are likely to be at greatest risk,
< People who lived or worked more than 1,540 feet from the kiln before 1982 were probably exposed yearly to lower levels of sulfur dioxide, and
< The farther someone lived or worked from the kiln before 1982, the lower that person’s yearly exposure to sulfur dioxide was likely to have been.
Caution is warranted in trying to make firm conclusions about people’s risk for harmful effects from sulfur dioxide emissions from Stauffer. Except for sulfur dioxide levels measured at the Anclote Road monitoring station, it is not known precisely what levels of sulfur dioxide people were exposed to (a) who lived in other directions from Stauffer, (b) who lived at other distances from Stauffer, and (c) who lived near Stauffer between 1947 and 1976—the years for which air monitoring data are not available.
However, air modeling of sulfur dioxide levels shows that residents who lived near the Stauffer facility might have been exposed to annual sulfur dioxide levels that were similar to the annual levels measured at the Anclote Road monitoring station.
85
STAUFFER CHEMICAL COMPANY PUBLIC HEALTH ASSESSMENT – FINAL RELEASE
5.2.4. Results From Modeling Past Exposures
5.2.4.1. Brief Exposures to Sulfur Dioxide
ATSDR used an air dispersion model to predict sulfur dioxide levels at more than 4,000 locations surrounding the Stauffer facility. The basis for the air dispersion model is described in the Air Contamination subsection of the Environmental Contaminants and Other Hazards section. Figure 19 in Appendix A shows 12 of the locations where the model predicted sulfur dioxide levels; Table 45, Appendix B, describes these locations. The maximum hourly sulfur dioxide level measured at the Anclote Road monitoring station served as the basis for predicting the maximum hourly sulfur dioxide levels at other locations near the Stauffer facility (1) when wind was blowing in that direction and (2) when Stauffer had a release of sulfur dioxide similar to the release that caused the maximum level to be detected at the Anclote Road monitoring station. Therefore, over the 5 years that data are available, the model predicts the highest hourly sulfur dioxide level that might exist at some other location in Tarpon Springs and surrounding areas. It is of particular interest to note that the model predicts that the highest hourly sulfur dioxide level at Gulfside Elementary School was about 1,000 ppb.
The air dispersion model was also used to generate contour maps showing the model’s estimate of the extent of hourly sulfur dioxide levels. Based on the model, Figure 26 shows the extent of sulfur dioxide migration using three levels as marker: 840 ppb, 500 ppb, and 100. The maximum hourly level of 840 ppb is the highest level measured at the Anclote Road monitoring station, and the map shows the extent of that concentration in every direction from the kiln. Similarly, the map shows the extent in every direction for 500 ppb sulfur dioxide, the level at which wheezing and shortness of breath has been observed in exercising asthmatics. Figure 26 also shows the extent of migration using 100 ppb sulfur dioxide, the level at which an increase in airway resistance has been observed in exercising asthmatics.
In conclusion, residents of Tarpon Springs, Holiday Estates, and surrounding areas were probably exposed on occasion to sulfur dioxide levels that might have caused the following harmful effects: < an increase in airway resistance and bronchoconstriction,16
< wheezing and shortness of breath, < an increase in heart rate and breathing rate, < cough, and < irritation of the eyes, nose, or throat.
Persons most likely to have experienced these symptoms first were those with people with asthma who were exercising at the time of exposure to sulfur dioxide; as sulfur dioxide levels rose, persons with asthma who did not exercise as well as persons without asthma would also start to experience symptoms. For instance, at 100 ppb, the only effect that might occur is an increase in
16An increase is airway resistance means that air traveling through the airway passages in the lungs is meeting more resistance; bronchoconstriction is the narrowing of the air passages in the lung.
86
STAUFFER CHEMICAL COMPANY PUBLIC HEALTH ASSESSMENT – FINAL RELEASE
airway resistance in exercising asthmatics. As sulfur dioxide levels approached and exceeded 500 ppb, wheezing and shortness of breath might have occurred in some persons with asthma who were exercising during exposure. Exposure at this level may require medication (bronchodialators) to relieve symptoms.
As described previously, there are likely to be periods shorter than an hour when sulfur dioxide levels were higher than the average hourly level and periods when sulfur dioxide levels were lower than the average hourly level. Therefore, for the 1 hour when sulfur dioxide levels were measured at an average concentration of 791 ppb, there might have been intervals within that hour (for example, 10 minutes or 30 minutes) when sulfur dioxide levels were much higher and much lower. Sulfur dioxide levels for brief periods might have been two to three times the average (e.g., 1,600 ppb or 2,400 ppb), if not more. This is important because Table 40 in Appendix B shows that brief periods of exposure of 10 to 20 minutes to 1,000 to 8,000 ppb sulfur dioxide can cause more serious damage to the lungs. In addition to shortness of breath and wheezing, persons with and without asthma might experience symptoms such as increased heart rate and breathing, throat irritation, red/irritated airways, and cellular damage to the lungs. Also, it is reasonable to assume exposure to sulfur dioxide over many hours or off-and-on for many days might have increased the possibility of harmful effects because of the extended exposure period.
5.2.4.2. Long-Term Exposure to Sulfur Dioxide
Annual sulfur dioxide levels were elevated at the Anclote Road monitoring station when the Stauffer facility was operating (Table 44 in Appendix B) and dropped in 1982, the year the facility no longer produced phosphorus. Using results for the dispersion model, it is possible to predict annual sulfur dioxide levels at the same locations around Tarpon Springs and Holiday Estates (see Table 46, Appendix B) The air dispersion model was also used to generate a contour map that shows the extent of yearly sulfur dioxide levels in the Tarpon Springs area (see Figure 27). Table 46 shows that locations 4, 5, and 7 have significantly higher annual average sulfur dioxide levels compared with the Anclote Road monitoring station, whereas locations 2, 9, and 10 are similar the Anclote station. Location 5 are businesses due east of the Stauffer facility and locations 4 and 7 are residential areas west and southwest of the facility, respectively. It should be noted that the estimated annual average sulfur dioxide levels at Gulfside Elementary School are similar to the levels at the Anclote Road monitoring station. In general, when the Stauffer facility was operating, the air model predicts that residents in Tarpon Springs, Holiday Estates, and the surrounding area were likely to have been exposed on a long-term basis to elevated levels of sulfur dioxide in air based on annual averages. Annual air levels of sulfur dioxide were significantly reduced after the Stauffer facility closed.
The effect of long-term exposure to sulfur dioxide has been reported in several human studies. These studies include the HSCS (Docker et al. 1993) and the recently updated ACS studies (Pope et al. 2002) as well as a re-analysis of these studies by the Health Effects Institute (Krewski et al. 2000). The Pope study (Pope et al. 2002) showed a small, but measurable, increase in the relative risk for cardiopulmonary (heart and lung) mortality from exposure to yearly average sulfur dioxide levels of 6.7 to 9.7 ppb.
87
STAUFFER CHEMICAL COMPANY PUBLIC HEALTH ASSESSMENT – FINAL RELEASE
The predicted annual average sulfur dioxide levels reported in Table 46 when the Stauffer facility was operating are similar to the levels reported in the ACS and HSCS studies at which the authors showed an increase in cardiopulmonary mortality (Docker et al. 1993, Pope et al. 2002). Since the Stauffer facility operated for several decades, it is reasonable to assume that residents in Tarpon Springs and Holiday Estates could have been exposed to elevated levels of sulfur dioxide for that period if their industrial processes were similar. Since these annual sulfur dioxide levels are estimated based on an air dispersion model, some uncertainty exists in the accuracy of the predicted levels thus adding some uncertainty to the conclusions about possible health effects.
5.2.5. Demographic Information for Past Exposures
Figure 25 in Appendix A uses 1980 census information to show estimated demographic information about persons who lived within a 1-mile radius of the Stauffer facility just before the facility closed. Almost 6,000 persons lived within 1 mile of the Stauffer facility before it closed; 240 were children 6 years of age and younger and about 2,300 were persons older than 65 years of age.
5.2.6. Current Sulfur Dioxide Exposures
From 1982 to 1996, yearly average sulfur dioxide levels were about 1 or 2 ppb at the Anclote Road monitoring station. These sulfur dioxide levels are well below the yearly average levels in 17 ppb and 14 ppb in 1977 and 1978, respectively, when Stauffer was operating. Yearly sulfur dioxide levels of 1 to 2 ppb are below the levels that cause harmful effects from long-term exposure over many years.
5.3. Exposure to Particulate Matter in Air and the Possibility of Harmful Effects
ATSDR identified particulate matter for further evaluation in this public health assessment because air data are available for TSP at the Anclote Road monitoring station during the period when the Stauffer facility was operating, 1977 to 1981. TSP data are also available from after the facility closed until 1989, when the Anclote Road monitoring station stopped collecting air samples.
Particulate matter is ubiquitous both in the outdoor and indoor environments. Besides the outdoor sources of PM exposures to the community (including the Stauffer facility), there are numerous other indoor sources of PM exposures from cooking, cleaning, and other indoor activities (EPA 2002c). More-detailed definitions for TSP, PM10, and PM2.5 are in Appendix F.
Before 1987, EPA regulated particulate matter in air by measuring TSP levels. TSPs are small particles of matter suspended in air, a large portion of which persons can breathe into their nasal passages and into their lungs. By 1987, a growing amount of research had shown that the air particles of greatest health concern were actually those termed PM10. At the time, PM10 was
88
STAUFFER CHEMICAL COMPANY PUBLIC HEALTH ASSESSMENT – FINAL RELEASE
shown to be capable of penetrating into sensitive regions of the respiratory tract. Consequently, EPA and the states took action in 1987 to monitor and regulate outdoor levels of PM10. Since 1987, hundreds of additional studies (mostly human epidemiologic studies) have been published on the health effects of particulate matter, particularly PM10. These studies generally suggest that adverse health effects in children and other sensitive populations were associated with exposure to particle levels well below that allowed by EPA’s PM10 standard at the time (EPA 1997). Moreover, it is generally believed that fine particles (PM2.5) can penetrate into the lungs more deeply than can PM10 and that fine particles are more likely to contribute to adverse health effects than are particles larger than PM2.5.
It is important to note some scientific debate is occurring about the levels of PM2.5 or PM10 considered protective for all segments of the population. Threshold concentrations for PM2.5 or PM10 (i.e., levels below which no adverse health effects are likely) have not been established from the scientific literature. Therefore, the following evaluation of the public health implications of exposures to particulate matter incorporates the understanding that no established levels exist below which particulate matter will not cause harmful effects.
5.3.1. Background Information About Health Effects From Exposures to Particulate Matter
Over the past 20 years, numerous investigators have researched the public health implications of inhalation exposures to particulate matter. The following discussion reviews this large volume of research, which provided a basis for much of the evaluation presented later in this section.
According to studies on particulate matter, many health effects were associated with PM2.5
exposures or with PM2.5 exposures coupled with exposures to other pollutants (EPA 1997). A partial list of these health effects follows: < premature death; < respiratory-related hospital admissions and emergency room visits; < aggravated asthma; < acute respiratory symptoms, including aggravated coughing and difficult or painful breathing; < chronic bronchitis; and < decreased lung function that can be experienced as shortness of breath.
These studies indicate that the elderly; children; and persons with pre-existing diseases such as diabetes, respiratory disease and cardiovascular disease are considered to be the most susceptible to effects of exposure to PM (EPA 2002c). Others are susceptible to less-serious health effects such as transient increases in respiratory symptoms, decreased lung function, or other physiologic changes. Chronic exposure studies suggest relatively broad susceptibility to cumulative effects of long-term repeated exposure to fine particulate pollution, resulting in substantive estimates of population loss of life expectancy in highly polluted environments (Pope 2000). It is important to note that susceptibility is dependent on a number of other important exposure factors, including duration of exposure. The degree to which an added particle burden might impact an individual will likely be affected by that person’s age, health status, medication usage, and overall
89
STAUFFER CHEMICAL COMPANY PUBLIC HEALTH ASSESSMENT – FINAL RELEASE
susceptibility to particulate matter inhalation exposures. One factor that might promote increased risk in the older population is that, over their life spans, they might have had more exposure and hence more opportunity to accumulate particles or damage their lungs (EPA 1996). Current epidemiologic research does not provide conclusive evidence of an association between exposure to particulate matter, in general, and cancer. However, because particulate matter is made up of various constituents, depending on the source(s), chemicals that are potential carcinogens are likely to be included in particulate matter.
EPA proposed revisions to its particulate matter standards in 1997 to include a primary (healthbased) annual average PM2.5 standard of 15 µg/m3 and a 24-hour PM2.5 standard of 65 µg/m3 (EPA 1997). EPA’s scientific review concluded that fine particles are a better surrogate for those components of particulate matter most likely linked to mortality (death) and morbidity (disease) effects at levels below the previous standard. Moreover, fine particles and high concentrations of coarse fraction particles are linked to effects such as aggravation of asthma (EPA 1997, 2002c).
The body of scientific knowledge used to set the health-based PM2.5 standard consisted primarily of epidemiologic studies of communities exposed to elevated levels of particulate matter. These epidemiologic studies found consistent associations between exposure and adverse health effects both for (a) short-term or acute particulate matter exposure scenarios (i.e., usually measured in days) and (b) long-term or chronic exposure scenarios (i.e., usually measured in years) (EPA 1996, 2002c). Chronic exposures are best measured using annual average PM2.5 levels (concentrations above 15 µg/m3) for one or several years. Acute exposures are best measured by using the 24-hour average PM10 and PM2.5 levels (concentration above 150 µg/m3 and 65 µg/m,3
respectively). For acute exposures related to the Stauffer facility, 24-hour PM10 and PM2.5 data are not available and, for any given day, it would be difficult to provide a justifiable estimate of these values. Therefore, TSP values will be used to evaluate short-term past exposures to the community. The previous EPA standards for annual average and 24-hour TSP were 75 µg/m3 and 260 µg/m3, respectively. Epidemiologic studies indicate increased health risks associated with particulate matter exposures, either alone or in combination with other air pollutants. Moreover, although particulate matter-related increases in individual health risks are small, they are likely significant from an overall public health perspective because of the many persons in susceptible risk groups that are exposed to ambient particulate matter (EPA 1996).
Although the epidemiologic data provide support for the associations mentioned above, an understanding of the underlying biological mechanisms of exposures to particulate matter has not yet emerged (EPA 1996, 2002c). Much of the toxicological findings related to particulate matter are derived from controlled exposure studies in humans and laboratory animals. However, to date, toxicologic studies on PM have provided important, but limited, evidence for specific PM attributes (constituents) being primarily or essentially responsible for the cardiopulmonary effects linked to ambient PM from epidemiological studies. In most cases, however, exposure concentrations in laboratory studies have been inordinately high as compared to the exposures at which epidemiological studies have found effects (EPA 2002c).
90
STAUFFER CHEMICAL COMPANY PUBLIC HEALTH ASSESSMENT – FINAL RELEASE
These toxicological studies have focused on acidic aerosols (a subclass of particulate matter), namely sulfuric acid aerosols, particle size, inorganic constituents (e.g., various sulfates and nitrates), metals (e.g., transition metals), organic constituents, diesel exhaust particles, and bioaerosols (EPA 2002c). Epidemiological studies have also investigated PM from various sources (e.g., motor vehicles, fuel oil, industrial, etc) to determine if exposure to different types of PM indicate a stronger or weaker association with adverse cardiopulmonary health effects. All of these studies indicated that soil or crustal sources of PM were not associated with adverse health effects, as measured by mortality. This suggests that the components of natural soil may have minimal toxicity unless contaminated by anthropogenic (man-made) or other sources, such as transition metals (EPA 2002c). From ATSDR’s work at another phosphate processing plan in Idado, it was determined that emissions from that plant contained many metals including transition metals (ATSDR 2001b). Although it is likely that there are metals in the Stauffer PM emissions, ATSDR does not have specific information regarding the type and concentrations of these metals. Moreover, ATSDR does not have information that phosphate processing plants, in general, emit PM with any greater or lesser toxicity than other combustion sources of PM that have shown an association with adverse cardiopulmonary health effects in the numerous epidemiological studies in the literature.
Human exposure studies of particles other than acid aerosols generally provide insufficient data to draw conclusions regarding health effects (EPA 1996). A recent study (Godleski et al. 2000) found that concentrated airborne particles had adverse effects on the electrical regulation of the heart in dogs with a preexisting heart condition, while the impact on normal dogs was not clear. Moreover, biological evidence indicates (Schwartz 1999) that urban combustion particles can < penetrate past the primary defense mechanisms of the lung, < elicit inflammatory changes in the lung and systemically (throughout the body), < contain constituents (for example, soluble transition metals) that by themselves can be
demonstrated to produce lung damage, < produce electrocardiogram changes including arrhythmia (heart irregularities), and < kill animals with preexisting heart and lung disease.
Human studies also reported inflammatory changes, including systemic changes and changes to cardiovascular risk factors (Schwartz 1999). A brief summary of some of the epidemiologic and controlled human exposure studies of specific physiologic end points is shown in Table 47, Appendix B. It is important to note that the studies shown in Table 47 are only a sampling of some of the studies that have provided clues into the potential biological mechanism linking PM exposures with adverse health effects, as seen in epidemiological studies. Overall, the human physiologic, toxicological, and other studies have shown changes in either blood plasma viscosity, heart rate, heart rate variability or HRV (HRV refers to the “beat-to-beat” changes in heart rate in relation to changes in physical activity–aging, diseases, and other factors can also effect it), and pulmonary inflamation in relation to particulate matter exposures. In general, it is speculated that interactions among inflamation, abnormal hemostatic function, and altered cardiac rhythm might play an important role in the pathogenesis of cardiopulmonary diseases related to air pollution (particulate matter). An adequate understanding of these relationships is limited and
91
STAUFFER CHEMICAL COMPANY PUBLIC HEALTH ASSESSMENT – FINAL RELEASE
requires further research (Pope 2000). Moreover, although scientific evidence has provided some clues into the biological mechanisms of how particulate matter might elicit adverse health effects in animals and humans, the results of these studies are limited and not always consistent . Therefore, clear evidence of the exact mechanisms has not emerged.
In summary, the epidemiologic evidence strongly suggests that ambient particulate matter exposure is associated with adverse human health effects in many geographic locations in the U.S. (EPA 2002c). However, a great deal of uncertainty remains about many issues related to the overall scientific inquiry into the health effects of particulate matter (EPA 1996, 2002c). For example, some scientists believe that the association found in the epidemiological studies does not provide conclusive evidence that exposure to ambient PM levels actually causes adverse cardiopulmonary health effects because a clear biological mechanism, among other things, has yet to be clearly established . Moreover, several viewpoints exist on how best to interpret the epidemiologic data EPA 1996, 2002c); for example: < using particulate matter exposure indicators as surrogate measures of complex ambient air
pollution mixtures and using reported particulate matter-related effects to represent those of the overall mixture;
< attributing reported particulate matter-related effects to particulate matter components (per se) of the air pollution mixture, therefore, they reflect independent particulate matter effects; and
< viewing particulate matter both as a surrogate indicator as well as a specific cause of health effects.
Although there are some indications that PM effects vary depending on geographic location and source (EPA 2002c), in general, reduction of particulate matter exposure would be expected to lead to reductions in the frequency and severity of particulate matter-associated health effects (EPA 1996).
5.3.2. TSP, PM10, and PM2.5 Exposures Near Stauffer
As previously indicated, during the years Stauffer operated, ambient air monitoring for particulate matter measured concentrations of only TSP. The statistically significant decrease in particulate matter levels at the Anclote Road monitoring station after Stauffer ceased its operations clearly tells us that the facility’s emissions contributed to particulate matter exposures at off-site locations. Unfortunately, the available sampling data do not indicate the relative amounts of PM10 and PM2.5 within the TSP, because the air samples were never analyzed using appropriate methods for their particle size distribution. It is important to have estimates of PM10 and PM2.5 levels, because exposures to these size fractions are far better indicators of adverse health effects than is exposure to TSP.
ATSDR investigated two options for estimating PM2.5 exposures that resulted from Stauffer’s emissions in order to evaluate the public health implications of particulate exposures. Through these options, we have estimated the past outdoor levels of PM2.5 resulting from Stauffer’s emissions. We emphasize that these estimates are based on our understanding of particulate
92
STAUFFER CHEMICAL COMPANY PUBLIC HEALTH ASSESSMENT – FINAL RELEASE
emissions from elemental phosphorus production facilities, and they are not based on actual air quality measurements from the Stauffer area. As a result, there is some uncertainty associated with these estimates, as we acknowledge throughout this section and in our conclusions. However, we note that the two approaches we took to estimate PM2.5 exposures resulted in very similar answers, thus giving us some confidence that we have made reasonable estimates of actual exposures. Our two estimation approaches are described below, followed by a summary of our findings:
< Modeling analysis. As Section 3.3.3.3.2 describes, we used a dispersion modeling analysis to predict how Stauffer’s stack emissions affect off-site concentrations of particulate matter. Our modeling analysis found that the stack emissions likely contributed 4 :g/m3 to annual average PM2.5 levels at the Anclote Road monitoring station.
We have reason to believe that this value understates Stauffer’s actual air quality impacts, largely because fugitive emissions from the facility were not considered. Although fugitive emissions typically occur in larger particle size fractions, fugitives from furnace tapping were reported to be predominantly fine particles of a “submicron nature” (PEDCo 1979). These particles would likely not deposit to the ground and were released near ground level, which would generally cause greater air quality impacts at near-field receptors. Therefore, our modeling predictions likely underestimate Stauffer’s contribution to actual air quality impacts at off-site locations.
< Analysis of ambient air monitoring data. Given the shortcomings of the modeling analysis, ATSDR used information on particle size distributions from areas near other elemental phosphorus production facilities to estimate the PM2.5 levels at the Anclote Road monitoring station. Specifically, extensive air sampling data have been collected near the fence-line of an elemental phosphorus production facility in southeastern Idaho. These data suggest that the average ratio of PM10 to TSP concentrations was 0.5 (with a standard deviation of 0.14) (ATSDR 2001b). Similarly, the average ratio of PM2.5 to PM10 concentrations in the immediate vicinity of this facility was 0.6. ATSDR notes that ratios could also be derived from sampling data collected in Florida after Stauffer closed; however, we decided that particle size distribution data in the vicinity of an active elemental phosphorus production facility is likely more representative of conditions near Stauffer before 1981.
For an estimate of the PM2.5 levels near Stauffer, ATSDR applied the particle size ratios in the previous paragraph to the measured TSP concentrations at the Anclote Road monitoring station. These calculations, which are shown in Tables 48 and 49 of Appendix B, suggest that annual average PM2.5 levels at the Anclote Road monitoring station were likely between 18 and 22 :g/m3. Our calculations also suggest (see Appendix G) that air emissions from Stauffer may have accounted for approximately 7 :g/m3 of PM2.5 at the Anclote Road monitoring station while the facility operated.
93

STAUFFER CHEMICAL COMPANY PUBLIC HEALTH ASSESSMENT – FINAL RELEASE
ATSDR acknowledges that there is considerable uncertainty applying the particle size factors from another facility to the data collected near Stauffer. Though we clearly understand that the magnitude of particulate pollution is expected to differ between the two facilities (since production levels at the Idaho facility were far greater than those at Stauffer), there is reason to believe that the particle size distribution would not vary dramatically between these sites, which used similar production processes.
These analyses actually provide a somewhat consistent account of estimated PM2.5 levels. Our modeling, which we have reason to believe understated fine particulate impacts, suggests that Stauffer’s air emissions contributed 4 :g/m3 to annual average PM2.5 concentrations at the Anclote Road monitoring station. Our review of monitoring data, on the other hand, suggests that Stauffer’s contribution to PM2.5 levels might have been 7 :g/m3. The fact that these estimates, which were generated from two entirely different data sets, are so similar gives some reassurance that the estimated PM2.5 levels do not grossly misrepresent Stauffer’s past air quality impacts.
In summary, the collective evidence suggests that Stauffer’s air emissions definitely impacted local air quality. We are confident in stating that these emissions likely contributed as much as 32% of the TSP measured at the Anclote Road monitoring station, but insufficient data are available to make similar definitive statements about the particle size distribution of Stauffer’s facility-wide emissions. Based on our best estimates, ATSDR believes that Stauffer’s air emissions likely contributed between 4 and 7 :g/m3 to annual average PM2.5 levels at the Anclote Road monitoring station. This estimated range does involve some uncertainty, and the actual contribution to PM2.5 levels at this location might be lower or higher than the stated range. This uncertainty is noted throughout our analyses, and in our conclusions
The sampling data quite clearly demonstrate that air emissions from Stauffer caused increases in particulate matter concentrations near the facility. However, the particulate matter levels measured near Stauffer between 1977-1981, though greater than Florida’s previous air quality standards, were not above the U.S. EPA standards for PM in place at that time and were not unusually higher than particulate matter levels routinely measured in many suburban and urban settings throughout the state. When ATSDR evaluates exposure to environmental contamination, our primary role is to examine whether exposures are at levels associated with adverse health effects. Whether other populations experienced greater or lesser exposures does not factor into our public health evaluations for a given site.
Some of the health concerns expressed by community members in relation to past air exposures related to the Stauffer facility (i.e., asthma, breathing problems, chronic obstructive pulmonary disease [COPD], and other nonspecific lung diseases) are reasonably consistent, with adverse health outcomes reported in the epidemiologic literature for both acute and chronic exposures to particulate matter (or sulfur dioxide). For asthma, it is important to note that the scientific literature does not currently suggest that PM causes asthma but that it may exacerbate it. Moreover, as previously indicated, there are other known and suspected factors that may trigger asthma. The consistency between the community’s health concerns and the epidemiologic
94
STAUFFER CHEMICAL COMPANY PUBLIC HEALTH ASSESSMENT – FINAL RELEASE
studies does not suggest that a specific person’s disease was caused by inhalation exposures to particulate matter. Rather, the cause of any disease is usually a result of multiple factors. For example, smoking is a strong risk factor for many lung and heart diseases. Therefore, smokers make up another population group likely at increased risk for particulate matter-related health effects (EPA 1996). ATSDR has not determined that any of these reported illnesses are elevated in the community in relation to exposures from Stauffer, but only that they are consistent with the findings from the scientific literature.
The following discussion first evaluates the increased risks from exposures to PM2.5 (estimated annual averages) on the basis of results from long-term epidemiologic studies, then evaluates the increased risks from exposures to TSP (24-hour maximum values) on the basis of results from acute epidemiologic studies. The ambient air concentrations of particulate matter reported in these epidemiologic studies are compared to estimated and measured levels of particulate matter in the area of the Stauffer facility. The discussions present a qualitative evaluation of the air data collected near the Stauffer facility and should provide context for understanding the possibility of harmful effects to persons exposed to particulate matter who lived near the facility.
5.3.3. Chronic Exposures to Estimated Annual Average PM2.5 Levels
Three large cohort studies—HSCS (Dockery et al. 1993) and the two ACS studies (Pope et al. 1995, 2002)—found an association between excess mortality in adults and increasing PM2.5 concentrations in various cities and metropolitan areas of the United States. More specifically, HSCS showed a 31% increase in mortality for every 25 µg/m3 increase in PM2.5, and the first ACS study showed a 17% increase in mortality for every 25 µg/m3 increase in PM2.5. The reported ranges of annual average PM2.5 for HSCS and the first ACS study were 11–30 µg/m3 (mean) and 9–34 µg/m3 (median), respectively, for the least to the highest levels of PM2.5 in a given city during the study period. These risks were based on the excess mortality between the least to the most polluted cities (EPA 1996). The second ACS study (Pope et al. 2002) expanded further on the results of the first study by increasing the number of persons in the study, including the effects of gaseous co-pollutants, and controlling for additional factors that might be independent risk factors for cardiopulmonary-related disease. The study looks at exposure to PM2.5 for the time periods 1979–1983, 1999–2000, and the average of all of these years. The results of the study showed that each 10 µg/m3 increase in PM2.5 was associated with, depending on the years of exposure, an approximate 4%–6%, 6%–9%, and 8%–14% increase for all-cause, cardiopulmonary, and lung cancer mortality, respectively (Pope et al. 2002). These percentage risk estimates imply an incremental increase in the mortality rate occurs when comparing long-term exposures to a person residing in a city with lower PM2.5 exposures to a person who lives in a city with higher PM2.5 exposures.
Given the importance of the HSCS and ACS studies, HEI funded a study to re-analyze the results of the HSCS and first ACS studies (Krewski et al. 2000). The first major conclusion of the reanalysis study was that the original results of these two studies was of high quality and that the independent analysis of the data produced essentially the same results as the original studies.
95
STAUFFER CHEMICAL COMPANY PUBLIC HEALTH ASSESSMENT – FINAL RELEASE
Moreover, the study tested the original results against a range of alternative variables and analytic models without substantially altering the original findings of an association between indicators of particulate matter air pollution and mortality. In addition, an association between sulfur dioxide and mortality was observed and persisted when other possible confounding variables were included. The study found relatively stable associations of mortality with fine particles, sulfates, and sulfur dioxide. The final interpretation by the researchers suggested that increased risk of mortality might be attributable to more than one component of the complex mix of ambient air pollutants in urban areas of the United States (Krewski et al. 2000).
The second ACS study (not included in the Krewski et al. [2000] re-analysis) also found an association with all-cause, cardiopulmonary, and lung cancer mortality and sulfur dioxide. No consistent association was found with other gaseous co-pollutants such as ozone, nitrogen dioxide, and carbon monoxide (Pope et al. 2002).
These and other chronic exposure studies, taken together, suggest that increases in mortality in disease categories might occur consistent with long-term exposure to airborne particles and that at least some fraction of these deaths reflect cumulative particulate matter impacts above and beyond those exerted by acute exposures events (EPA 1996). The HSCS and the two ACS studies controlled for subject-specific information about other relevant risk factors (such as cigarette smoking and occupational exposure); thus, these studies appear to provide reliable information about the effects of long-term exposures to particulate matter (EPA 1996; Pope et al. 2002). The findings of an independent re-analysis by HEI of HSCS and the first ACS study strengthen the conclusions of the original studies and show that they were based on sound science. Overall, the weight of epidemiologic data suggests long-term, repeated particulate matter exposure (especially fine particulate matter) has been associated with increased population-based mortality rates as well as a small increased risk of mortality in broad-based cohorts or samples of adults and children.
The epidemiologic evidence, available monitoring data from the Anclote Road monitoring station between 1977 and 1981, and the estimates of historic levels of PM2.5 during this time frame show that the community residing in or working in the following areas might have experienced adverse health effects similar to those reported in the literature from chronic exposures to PM2.5: < The Flaherty Marina (before 1982), < Residential homes built before 1982 southwest of the Stauffer facility along the shore of the
Anclote River, < Residential homes west of the Stauffer facility built before 1982 and within 1,540 feet of the
kiln, and < Commercial and industrial businesses east of the Stauffer facility along Anclote Road built
before 1982 and within 1,540 feet of the kiln.
The estimated average levels of PM2.5 during the years 1977 to 1981 ( about 18-22 µg/m3) is similar to the mid to upper outdoor levels reported in the HSCS and the two ACS studies. In addition, the estimated increase in average PM2.5 levels due to Stauffer emissions during the years
96
STAUFFER CHEMICAL COMPANY PUBLIC HEALTH ASSESSMENT – FINAL RELEASE
1977–1981 (about 7 µg/m3) is associated with a measurable increase in adverse cardiopulmonary health outcomes as reported in the HSCS and the two ACS studies. However, to put this into more perspective for the population exposed to long-term levels of PM2.5 likely attributable to Stauffer emissions, let us look closer at the findings of the second ACS study. If one considers the U.S. death rate as the background risk, the ASC study can be interpreted in a different way. That is, for every 2,000-4,000 persons exposed to an increase of 10 ug/m3 PM2.5, one additional death, due to cardiopulmonary disease, may be expected. In addition, for every 14,000 persons exposed, to an increase of 10 ug/m3 PM2.5, one might expect an additional death due to lung cancer. Many of these deaths from the second ASC study are likely in the most susceptible populations; that is, the elderly and those with pre-existing heart and lung illnesses. Given that the population exposed to PM2.5 attributable to Stauffer may have been lower that 2,000 persons, it is unlikely that exposure to Stauffer emissions alone resulted in an excess death. However, it is important to note that for every death attributable to a long-term increase in PM2.5 outdoor levels from the HSCS and the two ACS studies, there are likely many more cases of individual symptoms of lung and heart diseases and reductions in lung function. Although ATSDR offers the above perspective for the community to better understand their risk of the most serious adverse health effect, we do so with some uncertainty. Given that the exposed population may have had a higher percentage of elderly (a likely sensitive population), ATSDR cannot completely rule-out any of the adverse health effects that have been associated with PM exposures. In any case, the risk of an adverse cardiopulmonary health outcome was likely reduced once the Stauffer facility ceased operation in 1981 because the levels of exposure to fine particulate matter were lowered.
5.3.4. Acute Exposures to 24-Hour Average TSP
Early indications that fine particles are likely important contributors to observed particulate matter-mortality and morbidity (disease) effects came from evaluations of past serious air pollution episodes in Britain and the United States. The more severe episodes were characterized by several days of calm winds, during which large coarse particles rapidly settled out of the atmosphere and concentrations of fine mode particles dramatically increased (EPA 1996). Most of the epidemiologic studies of particulate matter to date focus on acute exposures (usually daily) and their association with various health end points such as mortality counts, hospitalizations, symptoms, and lung function. Unfortunately, until recently (after publication of the new proposed PM2.5 standards), very little daily monitoring of fine particles occurred, and most of the studies used other methods of measuring particulate concentrations, like PM10 and TSP (Pope 2000). Table 50 in Appendix B provides a summary of the epidemiologic evidence of health effects of acute exposure to particulate matter (Pope 2000).
The results of a major U.S. study that evaluated the association of short-term exposures to PM10 and other pollutants, as related to mortality and morbidity (as measured by hospitalizations), were released in 2000 (Samet et al. 2000). HEI’s National Morbidity, Mortality, and Air Pollution Study (NMMAPS) used several new and innovative approaches to overcome some of the limitations of previous studies of daily exposures to air pollutants and their relationship to death
97

STAUFFER CHEMICAL COMPANY PUBLIC HEALTH ASSESSMENT – FINAL RELEASE
and hospitalizations. The approach used was to characterize the effects of PM10 alone or in combination with gaseous air pollutants in a consistent way, in a large number of cities, using the same statistical approach. The study looked at the effects of PM10 and other pollutants on mortality in up to 90 of the largest U.S. cities. In addition, the study looked at morbidity, as measured by daily PM10 effects on hospitalization among those 65 years of age and older, in 14 U.S. cities. HEI concluded that the study made substantial contributions in addressing major limitations of previous studies. The results of the mortality studies were generally consistent with an average approximate 0.5% increase in overall mortality for every 10 µg/m3 increase in PM10 measured the day before death. This effect was slightly higher for deaths due to heart and lung disease than for total deaths. The PM10 effect on mortality also did not appear to be affected by other pollutants in the model. The 14-city hospital admission study of persons 65 years or older showed a consistent approximate 1% increase in admissions for cardiovascular diseases and about a 2% increase in admissions for pneumonia and COPD for each 10 µg/m3 increase in PM10 (Samet et al. 2000). The results of the NMMAPS study have been brought into question because of an apparent issue with the software used to estimate the risks associated with exposure to air pollutants. Dominici, F., et al. 2002 re-evaluated the NMMAPS mortality results and has determined that the results are still positive, but it is likely that the actual risk originally calculated will be lowered by about one-half. The re-analysis of the hospital admissions portion of the study is still on-going. In other studies of hospital admissions and visits, a 50 µg/m3
increase in PM10, resulted in a 3-25% increase in admission and visits for cardiopulmonary diseases (EPA 2002c).
Overall, the particulate matter risk estimates from total mortality epidemiologic studies suggest that an increase of 10 µg/m3 in the 24-hour average PM10 level (or an increase of 5–6 µg/m3 in PM2.5) is associated with increased risks of adverse health effects of 0.5%–1.5% (Pope 2000), with even higher risks possible for elderly subpopulations and for those persons with preexisting respiratory conditions (EPA 1996). Although data are not available to determine the levels of short-term PM10 exposures attributable to the Stauffer facility, it is likely that the facility did contribute to increased PM10 exposures to persons living near the Stauffer facility. That is, on any given day, it would be difficult to provide a precise estimate using available TSP data of what the PM10 levels would have been. However, over the long term, about 50% of the TSP measurement is PM10. Therefore, it is reasonable to assume that on some days PM10 levels were appreciably elevated due to Stauffer emissions. These increases in short-term PM10 levels would likely result in an increased risk for adverse cardiopulmonary health outcomes listed in Table 50 (Appendix B) for those exposed (especially the elderly and those persons with preexisting heart and lung illnesses).
TSP is not the best measure of particulate matter that is likely to reach the deeper parts of the lung and result in an adverse cardiopulmonary health outcome. However, several studies, predominantly in the 1980s and 1990s, evaluated TSP exposures in relation to deaths and other health outcomes like hospital admissions. Although the results are mixed, the analyses generally showed a 1% to 5% increase in total deaths for every 100 µg/m3 increase in TSP. Moreover, for
98
STAUFFER CHEMICAL COMPANY PUBLIC HEALTH ASSESSMENT – FINAL RELEASE
total respiratory or COPD hospital admissions in the elderly (aged 65+ years), an approximate 10%–50% increase occurred for every 100 µg/m3 increase in TSP (EPA 1996; Schwartz 1995).
The results of these epidemiologic studies suggest that the maximum 24-hour levels of TSP measured at the Anclote monitoring station during the years 1977–1981 exceeded concentrations, on several occasions, that are associated with adverse respiratory health effects. According to the epidemiologic literature, some of the adverse health effects associated with the range of maximum 24-hour TSP levels are increased total acute mortality, increased hospital admissions for the elderly (aged 65+ years) for lung disease, including COPD (EPA 1996). The greatest concern for adverse health effects for short-term exposures to the higher levels of TSP would be the elderly and those persons with preexisting heart and lung illnesses. Moreover, as indicated above in the evaluation of PM2.5 exposures, the population exposed to Stauffer emissions was relatively small; therefore, it is unlikely that the most severe health outcome (death) would occur in the population exposed to levels of PM associated with Stauffer emissions. It is far more likely that persons exposed in the susceptible populations would experience lung and heart symptoms and reduced lung function that may lead to a doctor’s visit, emergency room visit, or hospitalization.
5.3.5. Acid Aerosol Exposures
Several acids, such as sulfuric acid, phosphoric acid, and hydrofluoric acid, were released from the Stauffer phosphorus processing plant. In addition, phosphorous pentoxide (a signature constituent of phosphorus-processing emissions) and sulfur dioxide can be transformed in the atmosphere into phosphoric acid and sulfuric acid, respectively. All of these acids are considered potential respiratory irritants and could contribute to the overall increased risk of adverse cardiopulmonary health effects.
Studies of past episodes of air pollution suggest that both acute and chronic health effects are associated with inhalation exposures to strongly acidic particulate matter. For example, studies of historical pollution episodes, notably the London Fog episodes of the 1950s and early 1960s, indicate that acute exposures to extremely elevated levels of acid aerosols might be associated with excess human mortality. Studies evaluating present-day U.S. levels of acid aerosols have not found associations between acid aerosols and acute and chronic mortality, but the series of hydrogen ion (H+) data used might not have spanned a long enough time to detect H+ associations. However, several morbidity studies associated H+ concentrations with increased bronchitis and reduced lung function in children and an increase in respiratory hospital admissions (EPA 1996). Furthermore, animal studies have shown that sulfuric acid aerosols exert their action throughout the respiratory tract, with the site of deposition dependent on the particle size and the response dependent on mass and number concentration of specific deposition sites (EPA 1996). However, animal studies on acid aerosols provide no evidence that ambient acidic particulate matter components contribute to mortality and essentially no quantitative guidance as to ambient acidic particulate matter levels at which mortality would be expected to occur in either healthy or diseased humans. Furthermore, the effects seen in these animal studies were at acid levels that
99
STAUFFER CHEMICAL COMPANY PUBLIC HEALTH ASSESSMENT – FINAL RELEASE
exceed worst-case ambient concentrations by more than an order of magnitude (EPA 1996). There is relatively little new information on the effects of acid aerosols since EPA released it’s 1996 PM Air Quality Criteria Document (EPA 2002c).
5.3.6 Exposure to Metals and Other Particulates
ATSDR thoroughly reviewed the available air data for particulate matter, sulfur dioxide, phosphorous pentoxide, and fluorides. However, air data for acids, metals, and other pollutants released from Stauffer were not available for review. Current science provides little evidence as to whether the mix of these air contaminants may increase or decrease their toxicological effects because of cumulative exposures. However, the epidemiological evidence does indicate that PM, a measure of a mix of contaminants present in air, including many of the acids and metals that may have been released from Stauffer, is generally a good surrogate measure for estimating the short-term and long-term adverse cardiopulmonary health effects from exposure. From this standpoint, ATSDR evaluated and made definitive public health statements regarding the cumulative health effects of the past exposure to the mix of acid aerosols and particulate metal contaminants, that may have been present in the air around the Stauffer, as measured by PM.
5.3.7. Exposures to Particulate Matter since 1981 and Possible Current Health Effects
As previously indicated, the levels of TSP, PM10 and PM2.5 were reduced after 1981 when the Stauffer plant stopped operating. The estimated average level of PM2.5 at the Anclote Road monitoring station for the period 1982-1989 (14 µg/m3) is slightly below the current PM2.5 standard of 15 µg/m3. Like the trend in many areas of the U.S. in the 1990s, PM2.5 levels in the Tarpon Springs area were further reduced during those years. Moreover, since 1981, the levels of TSP and PM10 in northern Pinellas County have not exceeded any of the respective health-based air quality standards. Since 1981, the estimated and measured levels of PM in the general vicinity of the former Stauffer plant, and subsequent risk of an adverse heart and lung health outcome, were similar to those in many areas of Florida and the U.S.
5.4. Exposure to Fluoride in Air and the Possibility of Harmful Effects
5.4.1. Fluorides
In this discussion, “fluorides” will refer to a group of compounds that include the element fluorine. This includes fluorine gas, hydrogen fluoride (hydrofluoric acid), sodium fluoride, and fluoride complexes such as silicon tetrafluoride. Fluorine is extremely reactive and is unlikely to disperse any distance from its source as fluorine and, therefore, is unlikely to be a concern to the residents around Stauffer. The main fluorides emitted in the production of phosphate fertilizers are hydrogen fluoride, silicon tetrafluoride, and particulates containing fluoride (ATSDR 2001).
5.4.2. ATSDR Ombudsman’s Report
100
STAUFFER CHEMICAL COMPANY PUBLIC HEALTH ASSESSMENT – FINAL RELEASE
The ATSDR ombudsman’s report (ATSDR 2000a) commented on the need for further evaluation of fluorides. The report also stated that a concerned citizen reported pine trees south of the plant turning brown and that another citizen reported that in 1948 he noticed trees with red leaves that looked burned. In 1948, tests of vegetation near the plant showed high fluorine levels. Unfortunately, specific levels were either unknown or were unstated.
5.4.3. Historical Information About Fluoride Levels in Air
Air sampling has been performed for fluorides a limited number of times on the Stauffer property, off site while the facility was operating, and when the facility was idle. Two types of data sets exist: (1) data from stack emissions and (2) data collected at remote sampling locations. It is important to realize that both data sets are severely limited in scope and quality to allow accurate predictions of exposure in the community. Estimates of fluoride released into the environment from the Stauffer stack data show that approximately 6 tons per year were released from the facility. This value, however, only includes stack emissions and does not consider other emissions from different parts of the facility. Stauffer processed ore containing approximately 7,000 tons of fluoride per year, and only 6 tons is accounted for as stack emissions, thus leaving the vast majority of fluoride unaccounted. Although most of the “missing” fluoride is likely solid waste, it illustrates the limitations of using just stack data to estimate community exposures and leads to the assumption that fluoride exposures could be underestimated.
Fluoride levels at air sampling stations remote from the stack both on site and off site might be more indicative of community exposures. It should be noted, however, that all the data sets collected to date (with the exception of an EPA study conducted in 1987 after the plant was closed (EPA 1987)) suffer from severe data quality issues including the methods used to determine fluoride levels and documentation problems. Following is a summary of sampling dates for fluoride: < In 1964 and 1976, 10 air sampling stations on site and in the community sampled fluoride
emissions. < In 1976, sampling was performed at five on-site locations mostly at the north and west
perimeters of the site. < In 1979 and 1981, two on-site locations were sampled. < In 1987, EPA conducted fluoride testing after the facility closed.
From the limited sampling conducted from 1964 to 1987, one 24-hour air sample was measured at 38.7 ppb, which exceeded ATSDR’s acute inhalation MRL of 30 ppb. The remaining air samples were below the acute and intermediate inhalation MRLs. It should be noted that no chronic inhalation MRL exists because no reliable human or animal studies exist.17 The air sample that
17ATSDR’s acute inhalation MRL covers exposure periods up to 2 weeks; ATSDR’s intermediate inhalation MRL covers exposure periods from 2 weeks to 1 year; and ATSDR’s chronic inhalation MRL covers exposure periods greater than 1 year. When air levels are below the MRL, harmful effects are not likely for that exposure period. Exceeding an MRL, however, means that further toxicological evaluation is necessary to determine whether harmful effects might be possible.
101
STAUFFER CHEMICAL COMPANY PUBLIC HEALTH ASSESSMENT – FINAL RELEASE
exceeded the acute inhalation MRL was collected in 1981 near the southern boundary of the Stauffer facility. No air sample results from off-site areas contained fluoride at levels that exceeded an MRL.
ATSDR’s ombudsman report refers to two personal communications where damage to vegetation was noted. It is quite possible for fluoride, especially hydrogen fluoride, to cause the type of damage noted. However, considering the complex nature of the emissions from the Stauffer plant, including high sulfur dioxide levels and the unreliability of the off-site sampling, it would be difficult to conclude that the damage was due to hydrogen fluoride, other acidic pollutants, natural processes, or a combination of all three.
5.4.4. Health Effects
The acute inhalation MRL of 30 ppb is based on the irritant effects of hydrogen fluoride to the nose and lungs. The lowest level that causes irritation in humans after acute (less than 2 weeks) exposure is 120,000 ppb, which causes irritation after a 60-minute exposure period. This LOAEL can be adjusted to a human equivalent exposure level of 34,392 ppb using methods developed by the US EPA (US EPA 1994). The measured level at the Stauffer facility fenceline of 38.7 ppb (measured over 24 hours) is about 900 times lower than the level known to cause harmful effects. Based on this difference, it is unlikely that harmful effects would occur in someone exposed to 38.7 ppb. However, some uncertainty exists in this conclusion because the 38.7 ppb was an average level over 24 hours of sampling and the LOAEL established by the animal study was a 1hour exposure.
It may be that the 24-hour measurement of 38.7 ppb is masking a plume that migrated from the facility rather quickly. Evidence exists for this assumption from hourly sulfur dioxide measurements, which show that at times a plume of sulfur dioxide will pass an air monitoring station within a few hours or an hour or two. If the fluoride plume passed the air monitoring station in 60 minutes, fluoride levels in the plume would be about 900 ppb (38.7 x 24). This level is now about 37 times lower than the human equivalent level of 34,392 ppb that is thought to cause mild irritation to the nose. However, from the environmental data available, it is not possible to actually determine whether the 24-hour level of 38.7 ppb might have short periods of high fluoride levels. Added to this uncertainty is the fact that the plume would have to migrate across the river or to some other residential area before residents would be exposed. This migration would further dilute the fluoride levels.
In conclusion, although irritant effects seem unlikely from the one sample that exceeded the acute inhalation MRL of 30 ppb, firm conclusions cannot be drawn because the sample averaged fluorides levels over 24 hours, which might have masked higher levels of fluorides in a migrating plume. In addition, too few air samples were taken for fluorides when the Stauffer facility was operating to determine what levels of fluorides were being released. It is important to remember that extensive samples for fluorides at other phosphate production facilities did not show fluorides to be a public health issue.
102
STAUFFER CHEMICAL COMPANY PUBLIC HEALTH ASSESSMENT – FINAL RELEASE
5.4.5. Current Exposures
The Stauffer plant is now closed and is no longer producing elemental phosphorus. In 1987, several years after the Stauffer plant ceased operations, EPA conducted an air sampling study (EPA 1987). No fluoride was detected in any of the 12 samples collected for the study. Because conditions at the closed facility have not changed since this study, there is no reason to suspect that fluoride levels have increased.
5.5. Exposure to Ionizing Radiation and the Possibility of Harmful Effects
5.5.1. Introduction
In conducting the evaluation of exposure to ionizing radiation from the Stauffer facility, ATSDR reviewed the scientific literature for radium-226 and ionizing radiation. ATSDR relied on its toxicological profiles for radium and ionizing radiation (ATSDR 1990, 1999b), which summarize pertinent toxicity data from animal and human studies. In addition to the agency’s toxicological profiles, ATSDR also used recently published scientific reports and consensus scientific recommendations from the International Committee on Radiation Protection (ICRP), the National Council on Radiation Protection and Measurements (NCRP), the United Nations Scientific Committee on the Effects of Atomic Radiation (UNSCEAR), and the National Academy of Sciences reports.
To evaluate exposure from ionizing radiation and radioactive contaminants, ATSDR develops MRLs when sufficient human or animal studies are available. ATSDR’s MRL for ionizing radiation is 100 millirem (mrem) above background.18 ATSDR uses a weight-of-evidence methodology when selecting MRLs.
Exceeding an MRL, however, does not mean that harmful effects will occur. Rather, exceeding an MRL means that a more thorough radiologic evaluation is necessary. Some factors that are considered as part of a more thorough evaluation include the following: < Compare radiation levels to those that cause harmful effects to determine how close the levels
are; < Determine who is exposed and if those persons are more sensitive to the radiation than others
are; < Evaluate the location of radiation samples in relation to where people live; < Determine if the radiologic effect in a study is applicable to the people who are exposed; < Consider different aspects of exposure in the study (e.g. dosing period, amount, frequency of
exposure) and its applicability to people who live near the site and their exposure; < Consider the effect of uncertainty in exposure estimates; and < Consider the effect of uncertainty in deciding possible harmful effects.
18A mrem (millirem) is a measure of radioactive dose.
103

STAUFFER CHEMICAL COMPANY PUBLIC HEALTH ASSESSMENT – FINAL RELEASE
After conducting a site-specific radiologic evaluation, ATSDR describes whether people who are exposed to site contaminants might experience harmful effects from that exposure. As part of this discussion, ATSDR also describes the uncertainty that usually exists in making these decisions.
5.5.2. Radiologic Contaminant of Concern
Radium-226 is the only radiologic contaminant of concern at or near the former Stauffer site. Radium-226 levels exceed ATSDR’s CVs at both on-site and off-site locations. ATSDR used REDRAD version 6.2 computer code to estimate dose rates to future occupants of the former Stauffer site with a residential scenario and assumed no remediation (Yu et al. 2000). The radium is part of a glasslike slag, even in dust, and is not bioavailable; therefore, the radium toxicity is not important, only exposure to external gamma radiation from radium (ATSDR 1990).
Using the maximum on-site concentration of 1,800 Bq/kg19 would correspond to an annual dose of 300 mrem/year above background from direct gamma radiation, plus inadvertent ingestion and inhalation of contaminated dusts. The dose was almost exclusively from EGR, and is three times ATSDR’s MRL for ionizing radiation and would be inappropriate for residential development. Even though it is elevated, it would not likely result in any adverse health effects (ATSDR 1999b); and, to put the radiation dose in perspective, it is less than one-third of the dose a person receives during a diagnostic chest computed axial tomography (CAT) scan (Wall and Hart 1997).
The maximum radium-226 concentration measured at the Gulfside Elementary School was 59 Bq/kg, which, using the same assumptions as above, corresponds to an annual dose of only 10 mrem above background. This dose is 10 times less than ATSDR’s MRL of 100 mrem/year above background and does not represent any health threat to any child who attended the school.
The radium concentration on the school grounds does prove that wind-blown dusts did blow to the school from the former Stauffer site. No air monitoring information was available to model air concentrations when the site was in operation. Even though the CV for radium-226 in river sediment was exceeded, no completed exposure pathway existed for river sediments. The public would not receive any dose from the sediments.
5.5.3. Conclusions About Radiation
As the site now exists, it is not suitable for residential use. On-site soil would pose a public health hazard should the site be developed for residential use. As expected, radium-226 was the principal radiologic contaminant of concern both on site and off-site. Surface soil on-site is the most contaminated because of the sheer volume of slag on site. Of primary concern is that gamma radiation from the slag would result in significantly elevated radiation doses if the land is developed as residential without removing the slag.
19Becquerel per kilogram is equivalent to one radioactive decay per second in a kilogram of material.
104
STAUFFER CHEMICAL COMPANY PUBLIC HEALTH ASSESSMENT – FINAL RELEASE
The only off-site location with elevated concentrations of radionuclides is the Gulfside Elementary School, which likely received it from wind-borne dust. Directly across the street from the school, trucks were loaded with slag. Off-site concentrations of radionuclides in soil at the school do not pose a health hazard at the levels measured. However, ATSDR was unable to model the air pathway for radioactive exposures because of lack of emissions data from the Stauffer facility.
External gamma radiation exposures associated with off-site slag found outdoors (in area roads and driveways) and indoors (in home building materials) do not pose a health hazard.
Radium-226 and its decay products were detected in river sediments upstream and downstream from the site. However, the sediments do not appear to pose any health risk because the contaminant levels are low and the potential for human exposure is minimal.
5.6. Exposures to Contaminants in Private Well Water
As discussed in previous sections, site contamination does not appear to be affecting nearby private wells. In response to community concerns, however, ATSDR has evaluated the quality of the water in tested wells and presents the findings of our evaluation below.
Although a few private and commercial wells near Stauffer were tested as early as 1988, most of the 38 private and commercial wells for which data are available were tested between 1999 and 2001. Table 51 in Appendix B summarizes the contaminants and maximum levels found and provides some comments for added insight. Because safety factors are used in setting drinking water standards and comparison values (i.e., screening levels), exceeding one of these values means that a more thorough evaluation is needed to determine whether harmful effects might occur. To determine whether harmful effects might occur, ATSDR does the following: < Estimates a dose (the amount someone drinks) for someone who drinks water from a
commercial well and from a residential well, < Compares the estimated dose to health guidelines (usually, ATSDR’s chronic MRL). < Concludes that noncancerous harmful effects are unlikely if the MRL is not exceeded, < Compares the estimated dose to levels that cause harmful effects if the MRL is exceeded. < Considers children or sensitive groups in its evaluation. < Decides whether harmful effects might be possible, and < Describes the harmful effects that might be expected.
It is important to realize that the previous evaluation covers noncancerous effects. To evaluate the possibility of cancer, ATSDR uses two approaches: a quantitative approach developed by EPA to provide a numerical estimate of cancer risk, and a qualitative weight-of-evidence approach that factors in other scientific information. This weight-of-evidence might include such things as what is known about: < the chemical’s mechanism of action for causing cancer, < the chemical’s metabolism in humans versus metabolism in animals,
105
STAUFFER CHEMICAL COMPANY PUBLIC HEALTH ASSESSMENT – FINAL RELEASE
< the exposure pattern in human and animal studies versus the exposure pattern at this site, < the duration of exposure, and < the chemical’s ability to cause cancer in humans versus cancer in animals.
These nonquantitative factors might help to determine whether cancer is possible and might help to put the quantitative risk in better perspective.
Studies found that most adults drink less than 8 glasses of water a day, or about 2 liters.20 This estimate includes not only tap water but also beverages, such as soda, citrus drinks, milk, or coffee. Therefore, when ATSDR estimates exposure from drinking, we are assuming that a person gets all of his or her daily fluid intake from tap water. Another step in estimating a person’s exposure is to include body weight so the dose looks like this: micrograms chemical per kilogram body weight per day (µg/kg/day) or milligrams chemical per kilogram body weight per day (mg/kg/day).
A similar approach is used to determine if children are at risk for harmful effects. In this case, it is possible to estimate the dose for preschool children and school children because they drink about two to four 8-ounce glasses of tapwater every day.
5.6.1. Arsenic and the Possibility of Noncancerous Effects
As Table 51 in Appendix B shows, arsenic was found in two commercial wells and one private well at levels that exceed EPA’s drinking water standard of 10 ppb. It should be pointed out that arsenic in these wells is probably not coming from the Stauffer facility. If an adult were to drink, on average, three glasses of water a day from the residential or commercial wells described in Table 51, that person’s estimated dose would be below ATSDR’s chronic MRL of 0.3 µg/kg/day, and he or she would not be at risk for harmful effects. If, however, an adult drank 4 to 8 glasses of water a day from the wells described in Table 51, that person’s estimated dose would be between 0.4 µg/kg/day and 0.8 µg/kg/day, thus exceeding ATSDR’s chronic MRL. To determine whether harmful effects are possible, it is important now to compare the estimated dose in these adults to doses in human studies where harmful effects were observed.
ATSDR’s chronic MRL is based on a study of 40,000 Chinese persons in Taiwan who unknowingly used groundwater with arsenic for roughly 45 years (ATSDR 2000b). Because arsenic contamination was so high, people of all ages experienced harmful effects to the skin (specifically small blotches of increased skin pigmentation known as hyperpigmentation and a scaly skin condition known as keratosis), skin cancer, and several types of internal cancer.21
20A glass of water in this case contains 8 ounces.
21Arsenic-induced keratosis is a skin condition found most often on the feet and palms. Many small depressions occur in the skin with small, hard, outgrowths of skin in the center of each depression. Keratosis can also appear as scaling skin. Hyperpigmentation of the skin occurs as small brown areas or blotches on the skin around the eyelids, temples, neck, nipples, and groin. In severe cases, pigmentation might cover the chest, back, and
106
STAUFFER CHEMICAL COMPANY PUBLIC HEALTH ASSESSMENT – FINAL RELEASE
Arsenic is also known to cause adverse effects to the heart and blood vessels (i.e., cardiovascular effects). Specifically, exposure to low levels of arsenic for many decades has been shown to cause an increase in blood vessel disease in the brain (i.e., cerebral vascular disease), stroke (i.e., cerebral infarction), cyanosis of the extremities, palpitations, and chest discomfort (Chiou et al.1997, Lianfang and Jianzhong 1994).
The typical level of arsenic in drinking water was about 500 ppb, although some wells had as little as 50 ppb and some had more than 1,000 ppb. From these studies, ATSDR selected an estimate of the lowest dose that is most likely to result in noncancerous harmful effects. This dose is referred to as the lowest-observed-adverse-effect level (LOAEL). The LOAEL selected in the Chinese study was 14 µg/kg/day for effects on the skin. The Chinese study also identified a dose at which no harmful effects were seen. This no-observed-adverse-effect level (NOAEL) was 0.8 µg/kg/day (ATSDR 2000b).
It is now possible to compare the estimated dose of arsenic in people who used the wells described in Table 51 (Appendix B) to the estimated dose of arsenic in the Chinese study that caused harmful effects to the skin.
LOAEL for skin effects in adults from Chinese study 14.0 µg/kg/day NOAEL for skin effects in adults from Chinese study 0.8 µg/kg/day Estimated dose to Tarpon Spring residents
who drank 8 glasses of water a day (about 2 liters) 0.8 µg/kg/day Estimated dose to Tarpon Spring residents
who drank 4 glasses of water a day (about 1 liter) 0.4 µg/kg/day
For people who drank 4 to 8 glasses of water a day, their estimated dose was similar to the dose in the Chinese study that did not show harmful effects. The estimated dose is also well below the levels that cause noncancerous harmful effects to the skin. It is important to realize that daily arsenic intake of 14 µg/kg/day has to occur for 10 to 40 years before damage to the skin occurs. Knowing that 10 to 40 years of exposure is needed adds some uncertainty in deciding whether harmful effects might occur because ATSDR only has information about arsenic levels in the wells for 1 year (March 2000). Should arsenic levels in the wells go down, the risk of harmful effects would decrease; should arsenic levels in the wells go up, the risk of harmful effects might be increased should the same people continue to drink the water for several decades. It is important to know that drinking the water one time, a few times, or even for a few years is not likely to cause the noncancerous skin problems mentioned because the exposure period is too short (ATSDR 2000b). Arsenic-induced skin problems have been seen in children from exposure to moderate levels of arsenic in drinking water (for example, several hundred ppb) after about 10 years of exposure (Mazumder et al. 1998). Skin problems have been shown in children after only a few years of exposure but arsenic levels in water have to be much higher than what was detected in the one residential well in Tarpon Springs (ATSDR 2000b). Although the estimated
stomach. It sometimes appears as mottling on the skin and has been described as looking like raindrops. If mottling occurs, it is more frequent on the chest, back, and stomach.
107
STAUFFER CHEMICAL COMPANY PUBLIC HEALTH ASSESSMENT – FINAL RELEASE
dose in adults remains relatively constant throughout adulthood, the estimated dose in children changes as they grow older because their body weight increases. This change in body weight makes it difficult to determine a constant dose over their preschool and school years. To evaluate children, therefore, ATSDR estimated an average dose for preschool children and an average dose for elementary school children. Like adults, these average doses are shown in comparison to the LOAEL and NOAEL:
LOAEL for skin effects in adults from Chinese study 14.0 µg/kg/day NOAEL for skin effects in adults from Chinese study 0.8 µg/kg/day Estimated dose for preschool children who drank 4 glasses of water a day 1.6 µg/kg/day Estimated dose for elementary school children who drank 4 glasses of water a day 0.7 µg/kg/day Estimated dose for teenagers who drank 4 glasses of water a day 0.4 µg/kg/day Estimated dose for teenagers who drank 8 glasses of water a day 0.8 µg/kg/day
It is difficult to determine whether children are at risk for harmful effects from arsenic because their estimated dose varies as they grow older, decreasing from 1.6 to 0.7 to 0.4 µg/kg/day (or 0.8 µg/kg/day depending on how much water they drink). Nevertheless, the estimated dose for children is still below the LOAEL and is near the NOAEL. It is important to remember that for someone to be at risk, that person would have to drink 4 glasses of water a day from the well for 10 years or more. Drinking the water just a few times or for a few years would not be a problem. In conclusion, it is unlikely that children or adults would experience noncancerous harmful effects from drinking water from the commercial wells or the one private well that contained elevated levels of arsenic.
5.6.2. Arsenic and the Possibility of Cancer
To evaluate whether arsenic in the three wells described in Table 51, Appendix B, could increase the risk of cancer, it is necessary to (a) quantitatively estimate a numerical cancer risk and (b) consider other weight-of-evidence information available for arsenic. EPA developed a mathematical equation that can be used to estimate a quantitative cancer risk. The equation has three components: < an estimate of dose (i.e., how much someone is exposed to and subsequently absorbs into their
body), < assumptions about how long someone will be exposed, and < a cancer slope factor developed from human studies.
The mathematical equation looks like this:
Cancer risk = estimated dose × cancer slope factor × number of years of exposure.
EPA recently lowered the drinking water standard for arsenic from 50 ppb to 10 ppb. If someone were to drink 2 liters (8 glasses of water at 8 ounces per glass) of water every day for most of his or her life and this water contained 10 ppb arsenic, that person would have a small increased risk of cancer. Described quantitatively, if 10,000 people drank 2 liters of water every day that
108
STAUFFER CHEMICAL COMPANY PUBLIC HEALTH ASSESSMENT – FINAL RELEASE
contained 10 ppb arsenic, between 0 and 4 extra cases of cancer might be expected. EPA acknowledges the uncertainty in their quantitative estimate of cancer risk, which is why the risk is described as 0 to 4. Another way of expressing this risk is 0 in 10,000 people exposed to 4 in 10,000 people exposed might get cancer if they drank the water daily throughout their lifetime.
When people drink water that contains 26 ppb arsenic (Table 51 in Appendix B), they, too, have a small increased risk of cancer. This cancer risk can be described as
If 10,000 people drank 2 liters of water every day that contained 26 ppb arsenic, between 0 and 10 extra cases of cancer might be expected. Another way of expressing this risk is 0 in 10,000 people exposed to 10 in 10,000 people exposed might get cancer if they drank 2 liters of water every day from these wells over a lifetime.
Human studies of people exposed to arsenic in drinking water showed that usually 20 years of exposure to relatively high levels of arsenic in drinking water is needed before cancer can be detected in people. Because of the low levels in the three wells at Tarpon Springs, however, someone would have to drink the water for several decades before they would have a significantly increased risk of arsenic-induced cancer. For this reason, children are not likely to develop cancer from drinking water for short periods that contained low levels of arsenic.
The theoretical estimates of cancer risk presented in this discussion assumes many decades of exposure. For the three wells in which arsenic tested above EPA’s drinking water standard, information about arsenic contamination comes from only one sample collected in March 2000. Because information is only available for one sample period, it is not possible to know whether people who drank from these wells are actually at risk for arsenic-induced cancers because arsenic levels in these wells could vary over time.
5.6.3. Lead and the Possibility of Harmful Effects
Lead was found in four residential wells at levels that exceeded EPA’s action level of 15 ppb. The levels detected were 18, 24, 160, and 270 ppb. At the property with the highest lead level in well water (270 ppb), the well water showed varying levels of lead, as shown below:
March 2000 4.2 ppb December 2000 1.2 ppb March 2001 270.0 ppb May 2001 1.5 ppb
Therefore, lead levels in water were elevated only one time. ATSDR staff members spoke with Pinellas County officials who reported that the well was sampled during a dry period and that the water was cloudy. Pinellas County officials also reported that the sample came from the well head or from near the well head and not from a faucet inside the house. No samples were taken after
109
STAUFFER CHEMICAL COMPANY PUBLIC HEALTH ASSESSMENT – FINAL RELEASE
May 2001 and no tests are planned for the future. Pinellas County officials also reported that the well depth was not certain but that it was probably screened in the deeper Floridan Aquifer. The other wells that had lead at levels above EPA’s proposed action level were sampled one time in either 2000 or 2001. It should be pointed out that lead in these private wells is probably not coming from the Stauffer site.
Generally, exposure to excessive levels of lead is a concern for preschool children and this concern results from exposure to lead throughout their preschool years. Because lead was elevated at 270 ppb only one time, the concern is whether exposure for just a few months could be a problem. Therefore, it is necessary to estimate how much a preschool child will be exposed to lead should that child drink water containing 270 ppb for a few months. To estimate a child’s exposure, it is customary to assume that a preschool child will drink 2 to 4 glasses of tapwater a day with each glass having 8 ounces of water. The estimated exposure to lead for a preschool child drinking from the private well containing 270 ppb lead might cause changes in blood chemistry and mild effects to the liver. In boys, the exposure might cause mild effects to the prostate. These effects might also occur in preschool children who used the water containing 160 ppb lead but are probably not likely for preschool children who drank water containing 18 or 24 ppb lead (ATSDR 1999f).
5.7. Exposure to Contaminants in Soil and the Possibility of Harmful Effects
To evaluate soil contamination, ATSDR divided the soils data into on-site soil and off-site soil. Within on-site soils, the data are further divided into surface soil, pond soils, and slag. The soils data are presented in Table 2 (pond soils), Table 3 (slag), and Table 4 (surface soils) in Appendix B. Off-site soil data consists of samples from Gulfside Elementary School and are summarized in Table 11, Appendix B.
Adults and particularly children can be exposed to chemicals in soil from dust or dirt clinging to their hands. When people put fingers in their mouth or around their lips, they can swallow the dust and dirt clinging to their hands. Preschool children ingest the largest amounts of dust and dirt because their play activity brings them into close contact with soil and they usually have the greatest amount of hand-to-mouth activity. Therefore, ATSDR pays close attention to the exposure that preschool children get from playing in soil. Elementary school children, teenagers, and adults also swallow small amounts of soil, so ATSDR also evaluates their exposure.
In addition, some workers might accidentally come into contact with contaminated soils. As an example, contractors and utility workers might work on job sites with contaminated soils. If these workers got arsenic-contaminated soils on their hands, then engaged in hand-to-mouth activity, they too could be exposed to the contaminants in the area.
5.7.1. Surface Soils, Pond Soils, and Slag at the Stauffer Facility
5.7.1.1. SVOCs
110
STAUFFER CHEMICAL COMPANY PUBLIC HEALTH ASSESSMENT – FINAL RELEASE
Several chemicals referred to as SVOCs or polycyclic aromatic hydrocarbons (PAHs) were detected in surface soils, pond soils, and slag from the Stauffer facility. The chemicals found were benzo[a]anthracene, benzo[a]pyrene, benzo[b]fluoranthene, dibenzo[a,h]anthracene, and indeno[1,2,3-cd]pyrene. About half of the 33 or so soil samples contained PAHs, with the highest level detected being 4.3 ppm. A few of the samples contained PAHs at levels above ATSDR’s CVs; the data from these samples are further evaluated below. The levels detected in pond soils, slag, and surface soil can be found in Tables 2, 3, and 4, respectively, in Appendix B.
When deciding whether a chemical can cause harmful effects in people, it is important to realize that for long periods of exposure the average chemical concentration is used to estimate how much someone is exposed. When the few samples above a CV are averaged with the other soil samples that were below a CV value, the resulting average concentration of a chemical in soil is below ATSDR’s CV. More importantly, the estimated dose for adults and children is far below levels that cause harmful effects. This conclusion applies to past exposures for workers who might have come in contact with soil, for people who might trespass on the property, and for future exposures should the site become residential.
5.7.1.2. Inorganic Metals
Several inorganic metals were detected in on-site pond soils, slag, and surface soils, and are summarized in Tables 2, 3, and 4, respectively, in Appendix B. A similar situation exists with most of the metals as with the PAHs discussed previously. For the metals antimony, cadmium, thallium, and vanadium, once the average concentration is determined, the concentration of the metal in soil is below ATSDR’s CV and the estimated dose for people is far below levels that might be harmful. Therefore, these metals in soil are not harmful.
Arsenic was found in surface soils, pond soils, and slag. A summary of arsenic levels in each media is shown in Table 52 in Appendix B.
5.7.2. Arsenic and the Possibility of Noncancerous Harmful Effects
As mentioned previously, children and adults accidentally ingest small amounts of soil every day. Because nearby residents could not have come in contact with soils on the Stauffer facility, arsenic in soil could not have caused harmful effects in nearby residents. It is possible, however, that the Stauffer facility could become a residential neighborhood some day. Therefore, ATSDR will evaluate exposure to arsenic in soil from hand-to-mouth activity in adults and children based on this future scenario.
Children typically ingest less than 1/16 of a teaspoon of soil every day. Using the metric system, the typical preschool child ingests at most about 200 milligrams (mg) of soil every day, elementary school children and teenagers ingest at most 100 mg each day. These estimated intake levels for soil ingestion are believed to apply to only a small group of children; on average, most children typically ingest much smaller amounts of soil, for example, probably only 30 to 50 mg
111
STAUFFER CHEMICAL COMPANY PUBLIC HEALTH ASSESSMENT – FINAL RELEASE
every day. Using 200 mg as a soil intake, it is possible to estimate how much some children will be exposed to arsenic in soil from hand-to-mouth activity. The estimated dose in children exposed to arsenic in surface soils, pond soil, and slag are shown in Table 53, Appendix B.
As a reminder, ATSDR’s chronic MRL for arsenic is the dose below which harmful effects are not likely. For arsenic, the chronic MRL is 0.3 µg/kg/day arsenic; therefore, whenever someone’s estimated dose is below 0.3 µg/kg/day, harmful effects are not likely. As can be seen in Table 53 in Appendix B, all of the estimated doses from surface soil and slag for children and adults are below the chronic MRL; therefore, arsenic in surface soil and slag are not likely to cause harmful effects. The same is true for pond soils except for the estimated dose for preschool children and 1-year-old children. The estimated dose in these two groups is 1.7 µg/kg/day for some 1-year-old children and 1 µg/kg/day for some preschool children. The estimated dose decreases as preschool children age and would eventually fall below the chronic MRL as those children enter elementary school. This occurs because children gain weight as they grow older and this lowers the estimated dose they receive.
The question to answer now is whether preschool children are truly at risk for harmful effects. The range of their estimated doses (1 to 1.7 µg/kg/day) is similar to the dose in human studies where no harmful effects were seen in people exposed to arsenic for 10 to 40 years. The estimated dose is also about 14 times lower than the dose in human studies that caused harmful effects to the skin. Should the site be developed, it is unlikely that children exposed to arsenic would actually develop skin problems from coming in contact with arsenic in pond soils because < children would be exposed for only 5 or so years compared with the 10 to 40 years shown in
the Chinese study to cause skin problems, and < after 5 years of exposure, the estimated dose would be below the chronic MRL.
5.7.3. Arsenic and the Possibility of Cancer
Should the site become residential, it is necessary to determine whether arsenic in soil might increase the risk of some people getting cancer. As described previously, children and adults accidentally ingest small amounts of soil every day. Therefore, it is necessary to determine if people would have an increased risk of cancer should their exposure continue for many decades. It is important to realize that a theoretical increase in the risk of cancer can be calculated from the naturally occurring arsenic soil. Table 54 in Appendix B shows the theoretical background risk for cancer from naturally occurring arsenic along with the increased risk from arsenic in pond soils and surface soil.
As Table 54 in Appendix B shows, as the average concentration of arsenic in soil increases, the theoretical increase in the risk of cancer for someone who lives in certain parts of the Stauffer property would increase. The risk of cancer is greatest for a home that would be built on the pond soils (an estimated 0 to 300 cancers for every 1,000,000 people exposed for their lifetime) and decreases for homes built in other parts of the Stauffer property. It is important to note that these estimates of cancer risk are very conservative because they assume that someone lives at a
112
STAUFFER CHEMICAL COMPANY PUBLIC HEALTH ASSESSMENT – FINAL RELEASE
property their entire life and ingests the highest amounts of soil their entire life. If someone were to live at a property for half their life, that person’s estimated risk of cancer would be half the risk shown in Table 54.
5.7.4. Surface Soil at Gulfside Elementary School
Arsenic was found in surface soil samples from Gulfside Elementary School at levels ranging from 0.13 to 0.6 ppm. ATSDR’s CV (i.e., screening level) for arsenic in soil is 0.5 ppm, which means that whenever a level is higher than 0.5 ppm, ATSDR evaluates the chemical further. Arsenic occurs naturally in all soils; typical levels in soil from the Eastern United States are about 7 ppm, while background levels for arsenic in soil from Florida are about 5 ppm. As discussed in Section 3.2.1.1, detected arsenic levels in Gulfside Elementary School soils are generally at or below these background soil levels; therefore, the arsenic levels are not a public health threat and no harmful effects are likely because of arsenic in soil at the school.
5.8. Exposures to Former Stauffer Workers
5.8.1. Background
Stauffer Chemical Company (Stauffer) operated in Tarpons Springs, Florida from 1947 through 1981 as a chemical plant that extracted elemental phosphorus from phosphate ore. The facility included a phosphate ore processing area, elemental phosphorus production facilities, a slag processing area, and a system of settling ponds. At the Stauffer facility, elemental phosphorus was extracted by combining coke and silica with phosphate rock in an electric arc furnace.
ATSDR was asked to evaluate past exposures to workers from Stauffer to determine whether past exposure might cause adverse health effects. To do this, ATSDR reviewed exposure monitoring data from the facility for the years 1975 through 1981. These data were collected using personal monitors (devices carried by workers) and area monitors from various departments and job classifications throughout the facility (Table 55 in Appendix B). No quality assurance or quality control information was available for these data. The following reports were reviewed: < Industrial Hygiene Program, Valid Area Data, Tarpon Springs, Volume II; < Tarpon Springs, Employee Exposure Data, Reports 3–12, Historic + Current; < Stauffer Industrial Records, Stauffer in Violation Even While Shut Down; and < some additional data packages that contained written correspondence between EPA (Region
4) and Tarpon Springs community members, transcripts of meetings between Stauffer employees and OSHA officials, summaries of monitoring data, monitoring schedules, assorted raw monitoring data, internal memos from Stauffer, notifications of proposed OSHA penalties against the company, and safety instructions to Stauffer employees.
ATSDR screened the data provided to find the minimum concentration, maximum concentration, and frequency (Table 56 in Appendix B) for which Stauffer employees might have been exposed. This list of contaminants and their maximum concentrations were then compared to both
113
STAUFFER CHEMICAL COMPANY PUBLIC HEALTH ASSESSMENT – FINAL RELEASE
occupational standards (Occupational Safety and Health Administration [OSHA], American Conference of Governmental Industrial Hygienists [ACGIH], and National Institute for Occupational Safety and Health [NIOSH]) and ATSDR’s CVs to determine whether employees might have been exposed to levels of contaminants that might cause adverse health effects. ATSDR found several contaminants at levels that exceeded an occupational standard or an ATSDR CV (Table 57 in Appendix B). Each of these contaminants is evaluated further in the following sections.
5.8.2. Asbestos
From accounts of former workers and from Stauffer interoffice correspondence, we know that asbestos was used in several forms (rope asbestos, loose bag asbestos, and asbestos pipe insulation). Unfortunately, very little data are available on asbestos use at the facility. Interoffice correspondence from the early 1970s indicates that Stauffer was aware of OSHA’s regulations about the hazards of working with asbestos and began work to identify asbestos exposure in the workplace, determine whether monitoring or employees examinations were needed, investigate alternatives for asbestos use in its operations, and inform employees that OSHA-approved respirators were required when working with asbestos-containing materials (ACM). Stauffer in Tarpon Springs was issued a citation by OSHA on April 7, 1975, for failure to comply with standards covering the proper handling and use of asbestos, failure to provide employee monitoring and medical examinations, and failure to post appropriate caution signs. Interoffice correspondence from April 8, 1975, describes actions taken or to be taken by the company to comply with OSHA regulations (i.e., monitoring, examinations, wet-handling methods, etc.).
Asbestos data available for ATSDR review were collected by Stauffer’s industrial hygiene program in 1975 and 1976. ATSDR reviewed 13 area or personal samples collected in various locations within the plant. Some of these samples were collected while employees performed job tasks such as installing asbestos rope for electrode packing or cutting asbestos-containing gaskets. Most of the industrial hygiene reports indicate that OSHA-approved respirators were worn during these sampling periods. Asbestos fiber counts ranged from 0 (no fibers detected) to 0.33 fibers per cubic centimeter (f/cc), which were below the OSHA permissible exposure limit (PEL)22 of 0.5 f/cc during this time. The current OSHA PEL for asbestos is 0.1 f/cc, so some of the samples taken in 1975 and 1976 exceed the present standard (NIOSH 2001, OSHA 1991).
From personal accounts of former employees and from interoffice communications, we know that ACM was used at the Stauffer plant as insulation for piping, as a gasket material, and in both loose and rope forms. Stauffer employees were likely exposed to ACM during plant operations and maintenance, especially before development and implementation of OSHA standards for
22The PEL can be expressed as a time-weighted average (TWA) or a short-term exposure limit (STEL) that legally must never be exceeded instantaneously even if the TWA exposure limit is not violated. TWA is the maximum TWA concentration of a chemical to which an employee can be exposed for a normal 8-hour workday or 40-hour workweek.
114

STAUFFER CHEMICAL COMPANY PUBLIC HEALTH ASSESSMENT – FINAL RELEASE
handling and use of ACM in the early to mid 1970s. It is difficult for ATSDR to assess past environmental exposures at Stauffer because of the lack of data, especially before 1975. What is known about the manufacturing and maintenance processes at Stauffer makes it likely that former employees were intermittently exposed from 1948 to the mid 1970s to ACM at levels above the current TWA of 0.1 f/cc. During the early 1970s, ACM continued to be used at Stauffer, but the company began requiring respiratory protection when handling ACM beginning in 1974 or 1975, according to interoffice correspondence. If employees were using respiratory protection in accordance with OSHA and company guidelines, exposure to ACM after 1975 should have been greatly reduced.
ATSDR used conservative assumptions to evaluate increased cancer risk (Table 58 in Appendix B) based on the maximum asbestos concentration found in the storeroom and asbestos room. ATSDR’s evaluation indicates there might be a moderate increased risk of cancer due to worker exposures to asbestos at Stauffer (Table 58). The maximum concentration of asbestos exceeded ATSDR’s CV of 0.000004 ug/m3, but it was more than 100 times lower than the lowest level known to cause non-cancerous effects (ATSDR 2001b); therefore, it is unlikely (based on air monitoring data) that workers are at risk when it comes to non-cancerous effects, such as asbestosis.
Workers who breathe in asbestos might develop a slow buildup of scar-like tissue in the lungs and in the membrane that surrounds the lungs. The scar-like tissue does not expand and contract like normal lung tissue and so breathing becomes difficult. Blood flow to the lung might decrease and cause the heart to enlarge, a disease called asbestosis. People with asbestosis have shortness of breath, often accompanied by a cough. This is a serious disease and can eventually lead to disability or death in people exposed to high amounts of asbestos. Changes in the membrane surrounding the lung, called pleural plaques, are quite common in people occupationally exposed to asbestos and are sometimes found in people living in areas with high environmental levels of asbestos, but effects on breathing are usually not serious.
Asbestos workers have increased chances of getting two types of cancer: cancer of the lung tissue itself and mesothelioma, a cancer of the thin membrane that surrounds the lung and other internal organs. Lung cancer is usually fatal, whereas mesothelioma is invariably fatal within a few months of diagnosis. These diseases do not develop immediately, but appear years after exposure. Studies of workers provide some evidence that breathing asbestos can increase the chances of getting cancer in other locations (for example, stomach, intestines, esophagus, pancreas, kidneys), but this is less certain.
The levels of asbestos in air that lead to lung disease depend on a number of factors. The most important of these are (a) how long a worker was exposed, (b) how long it has been since exposure began, and (c) whether a worker smoked cigarettes. Interactions between cigarette smoke and asbestos increase the chance of getting lung cancer. Also, scientific debate is occurring concerning the differences in the extent of the disease caused by different fiber types and sizes. Some of the differences might be due to physical and chemical properties of the
115
STAUFFER CHEMICAL COMPANY PUBLIC HEALTH ASSESSMENT – FINAL RELEASE
different fiber types. For example, several studies suggest that the amphiboles (tremolite, amosite, and especially crocidolite) might be more harmful than chrysotile. However, most data indicate that fiber size (length and diameter) is the most important factor for cancer-causing potential, particularly for mesothelioma. Most studies indicate that long fibers (greater than about 1/5,000th of an inch) are more likely to cause injury than short fibers (less than about 1/10,000th of an inch). Generally, smaller fiber diameters or widths are associated with mesothelioma and larger widths are associated with lung cancer.
5.8.3. Arsenic
ATSDR found that approximately 43 personal or area samples were taken for arsenic between 1975 and 1978 at Stauffer. No data are available before 1975 for arsenic exposure. The maximum concentration of arsenic reported, in a personal sample from the furnace department, was below the level of detection (0.0005 mg/m3). This concentration did not exceed an occupational standard, but it did exceed the ATSDR CV of 0.0000002 mg/m3. Arsenic is classified as a known human carcinogen by EPA (ATSDR 2000b).
Based on ATSDR’s evaluation it appears unlikely that adverse health effects, including cancer, would occur as a result of any arsenic exposures related to Stauffer.
116
STAUFFER CHEMICAL COMPANY PUBLIC HEALTH ASSESSMENT – FINAL RELEASE
5.8.4. Carbon Monoxide
ATSDR found approximately 96 samples taken for carbon monoxide between 1974 and 1980 at Stauffer. No data were available before 1974 for carbon monoxide exposure. The maximum concentration of carbon monoxide, in a grab sample collected in the furnace department, was approximately 700 ppm. According to Stauffer Management Company records, this sample was taken in a confined space and may not be representative of actual worker exposure. This concentration exceeds the threshold-limit value (TLV) of 25 ppm (ACGIH 2002). ATSDR has no toxicological profile or CV for carbon monoxide.
Repeated exposures to carbon monoxide at levels above the TLV, without respiratory protection, might cause adverse health effects in workers.
Carbon monoxide is a colorless, odorless gas that is about 3% lighter than air. When inhaled, carbon monoxide combines with hemoglobin in the blood, preventing absorption of oxygen and resulting in asphyxiation. Carbon monoxide is formed whenever carbon or substances containing carbon are burned with an insufficient air supply. Even when the amount of air is theoretically sufficient, the reaction is not always complete, so that the combustion gases contain some free oxygen and some carbon monoxide. Carbon monoxide produces headache, nausea, or fatigue, followed by unconsciousness.
Acute cases of poisoning resulting from brief exposures to high concentrations seldom result in any permanent disability, if recovery occurs. Chronic effects as the result of repeated exposure to lower concentrations can occur. Cardiac damage, auditory disturbances, and contraction of the visual fields have been seen. Studies of workers have found that where poisoning has been long and severe, cerebral congestion and edema (swelling of tissue) might occur, resulting in long-lasting mental or nervous system damage.
5.8.5. Hydrogen Sulfide
ATSDR found that three samples were taken for hydrogen sulfide in 1978 at Stauffer. No data are available before 1978 for hydrogen sulfide exposure. The maximum concentration of hydrogen sulfide, in a grab sample from the phosphorus handling department, was approximately 60 ppm. According to Stauffer Management Company records, this sample was taken in a confined space and may not be representative of actual worker exposure. This concentration exceeds the TWA of 10 ppm for an 8-hour workday and the 15 ppm STEL (NIOSH 2001, OSHA 1991).
Repeated exposures to hydrogen sulfide at levels above the TWA or STEL, without respiratory protection, would likely cause adverse health effects in exposed workers. The maximum concentration of hydrogen sulfide also exceeded ATSDR’s CV, so ATSDR compared the maximum concentration to intermediate inhalation studies in its Toxicological Profile for Hydrogen Sulfide (ATSDR 1999c). The maximum concentration exceeded the LOAEL for animals of 20 ppm. This LOAEL is based on a study of rat dams (female rats) exposed to 20, 50,
117

STAUFFER CHEMICAL COMPANY PUBLIC HEALTH ASSESSMENT – FINAL RELEASE
or 75 ppm hydrogen sulfide for 7 hours per day for 21 days. Repeated exposures to hydrogen sulfide at the levels found at Stauffer might cause adverse health effects if respiratory protection was not used (ATSDR 1999c).
Breathing hydrogen sulfide at concentrations greater than 500 ppm can be fatal within just a few minutes. Death is usually preceded by a loss of consciousness after one or more breaths, although a loss of consciousness does not necessarily mean that death will follow. Hydrogen sulfide is considered a “broad spectrum” poison. This means that it can poison several different systems in the body. The variety of activity might be the reason that no single antidote, or treatment, has been found for hydrogen sulfide poisoning. Hydrogen sulfide can be especially dangerous because at concentrations over 100 ppm it is difficult to smell. Deaths due to breathing large amounts of hydrogen sulfide were reported in a variety of different work settings, including sewers, animal processing plants, waste dumps, sludge plants, oil and gas well drilling sites, and tanks and cesspools. Lower concentrations of hydrogen sulfide exposure might cause eye irritation, a sore throat and cough, shortness of breath, and fluid in the lungs. Breathing of hydrogen sulfide on a long-term basis might result in fatigue, loss of appetite, headaches, irritability, poor memory, and dizziness.
5.8.6. Lead
ATSDR found that four samples were taken at Stauffer for lead in 1981. No data are available before 1981 for lead exposure. The maximum concentration of lead, in a personal sample from the mechanical department, was 0.423 mg/m3. This concentration exceeds the TWA of 0.05 mg/m3 (NIOSH 2001, OSHA 1991). ATSDR has no CV for inhalation of lead.
ATSDR compared the maximum concentration of lead found in air to intermediate inhalation exposure information in its Toxicological Profile for Lead (ATSDR 1999f). The maximum concentration was above the LOAEL of 0.01 mg/m3 for less serious effects in humans (ATSDR 1999f). This LOAEL is based on a study of adult male volunteers exposed to particulate lead in air at 0.003 or 0.01 mg/m3 for 23 hours a day for 3–4 months that caused hematologic23 changes (ATSDR 1999f). Repeated exposures without respiratory protection to lead at the levels found at Stauffer might cause adverse health effects in exposed workers.
Lead can affect almost every organ system in the body. The most sensitive is the central nervous system, particularly in children. Lead might also damage the kidneys, the male reproductive system (the organs responsible for sperm production), and cause spontaneous abortion. The effects are the same whether lead is inhaled or swallowed. At high levels, exposure to lead might decrease reaction time; cause weakness in fingers, wrists, and ankles; and possibly affect memory. Lead can also cause anemia, a disorder of the blood.
23Changes in the formation of blood or blood cells.
118
STAUFFER CHEMICAL COMPANY PUBLIC HEALTH ASSESSMENT – FINAL RELEASE
Inadequate evidence exists to clearly determine lead’s carcinogenicity in people. Kidney tumors have developed in rats and mice given large doses of lead, but these studies were criticized for using very high doses and should not be used to predict what might happen in humans. The Department of Health and Human Services determined on the basis of animal studies that lead acetate and lead phosphate might be anticipated to be carcinogens, but again inadequate evidence exists for the carcinogenicity of these lead compounds in humans.
5.8.7. Nickel
ATSDR found that eight samples were taken for nickel in 1981 at Stauffer. No data are available before 1981 for nickel exposure. The maximum concentration of nickel, in a personal sample collected in the mechanical department, was 0.26 mg/m3. This concentration exceeded the TWA of 0.10 mg/m3 and the ATSDR chronic MRL24 of 0.0002 mg/m3 (ATSDR 1997b; NIOSH 2001, OSHA 1991). Nickel is considered possibly carcinogenic to humans by the International Agency for Research on Cancer and the Department of Health and Human Services.
ATSDR compared the maximum concentration of nickel found in air to chronic inhalation exposure information in its Toxicological Profile for Nickel (ATSDR 1997b). The maximum concentration was below the Cancer Effect Level of 10 mg/m3 established for an occupationally exposed population, but exceeded the lowest Cancer Effect Level of 0.11 mg/m3 established in a 2-year rat study. The CEL is based on an epidemiological study of refinery workers exposed to nickel compounds at concentrations greater than 1 mg/m3 that found an increased incidence of lung and nasal cancer (ATSDR 1997b).
The maximum level of nickel detected at Stauffer also exceeded the chronic LOAEL of 0.06 mg/m3 for less serious (non-cancerous) effects in animals (ATSDR 1997b). The LOAEL is based on a study of rats exposed to 0.06 mg/m3 of nickel oxide 23 hours per day, 7 days per week for life that caused increased lung weight, congestion, and alveolar proteinosis (ATSDR 1997b). Repeated exposures without respiratory protection to nickel at the levels found at Stauffer could potentially cause adverse health effects in exposed workers.
The most common adverse effect of nickel in humans is an allergic reaction. People can become sensitive to nickel when jewelry or other things containing nickel are in direct contact with the skin. Once a person is sensitized to nickel, further contact with the metal will produce a reaction. The most common reaction is a skin rash at the site of contact. People who are sensitive to nickel have reactions when nickel comes into contact with the skin. Some sensitive persons might have a reaction when they eat nickel in food or water, or breathe dust containing nickel. More women are sensitive to nickel than are men. The difference between men and women is thought to be a result of greater exposure to women to nickel through jewelry and other metal items. The most serious effects of nickel, such as cancer of the lung and nasal sinus, occurred in people who breathed
24The MRL is an estimate of daily human exposure to a dose of a chemical that is likely to be without an appreciable risk of adverse noncancerous health effects over a specified duration of exposure.
119

STAUFFER CHEMICAL COMPANY PUBLIC HEALTH ASSESSMENT – FINAL RELEASE
nickel dust while working in nickel refineries or in nickel processing plants. EPA determined that nickel refinery dust and nickel subsulfide are human carcinogens.
5.8.8. Phosphorus and Related Compounds
ATSDR found that 62 samples were taken at Stauffer for phosphorus (including data listed as phosphorus or yellow-phosphorus) between 1976 and 1981. No data exist before 1976 on phosphorus. The maximum concentration of phosphorus, in a personal sample from the phosphorus handling department, was 255.67 µg/m3 or 0.255 mg/m3. This concentration exceeded the TLV of 0.10 mg/m3 for occupational exposure, but it was below the ATSDR CV of 20 mg/m3
(ATSDR 1997a; NIOSH 2001, OSHA 1991).
Repeated exposures without respiratory protection to phosphorus at levels above the TLV might cause adverse health effects in workers. However, ATSDR compared the maximum concentration of phosphorus found in air to intermediate inhalation exposure information in its Toxicological Profile for White Phosphorus (ATSDR 1997a). The maximum concentration was thousands of times lower than the LOAEL (884 mg/m3), indicating that adverse health effects are not likely from exposure at this level (ATSDR 1997a).
Breathing in white phosphorus can cause the development of a cough or a condition known as phossy jaw that involves poor wound healing in the mouth and breakdown of the jawbone. Phossy jaw generally occurs following long term exposure to airborne white phosphorus. Damage to the blood vessels of the mouth has been seen in rats breathing air containing white phosphorus. Breathing white phosphorus smoke can damage the lungs and throat. Most of what is known about the health effects of breathing this compound is from studies of workers. Eating or drinking white phosphorus can cause vomiting; stomach cramps; or liver, heart, or kidney damage. Ingestion can also cause extreme drowsiness or death. Skin contact with white phosphorus can result in severe burns (ATSDR 1997a).
Phosphine and phosphoric acid are two other phosphorus-related compounds evaluated using data available from Stauffer.
120

STAUFFER CHEMICAL COMPANY PUBLIC HEALTH ASSESSMENT – FINAL RELEASE
5.8.8.1. Phosphine
ATSDR found that 10 samples were taken for phosphine between 1975 and 1978 at Stauffer. No data are available before 1975 for phosphine exposure. The maximum concentration of phosphine, in a grab sample collected in the phosphorus handling department, was approximately 7 ppm or 9,893 µg/m3. According to Stauffer Management Company records, this sample was taken in a confined space and may not be representative of actual worker exposure. This concentration exceeds the TLV of 0.30 ppm for occupational exposure and exceeds the ATSDR CV of 0.30 µg/m3 (ATSDR 1997a, NIOSH 2001, OSHA 1991). ATSDR does not have a toxicological profile for phosphine, but information can be found in the Toxicological Profile for White Phosphorus (ATSDR 1997a).
Repeated exposures without respiratory protection to phosphine at levels above the TLV might cause adverse health effects in workers.
Phosphine is a highly toxic gas generated from phosphide. When phosphine is inhaled, it can react with moisture in the lungs to form phosphoric acid, which can cause blistering and edema (fluid in the lungs). These effects can be serious or even fatal. Exposure to phosphine has also been linked with other health effects such as chest tightness, headache, dizziness, and nausea. Intermittent, low concentrations of phosphine gas (probably 0.08 to 0.03 ppm) have been associated with mild headaches. Higher intermittent concentrations (0.40 to 35 ppm) have been linked to diarrhea, nausea, abdominal pain, vomiting, tightness of chest, headache, dizziness, staggering and skin irritation (NIOSH 1999).
5.8.8.2. Phosphoric Acid
ATSDR found that approximately 15 samples were taken for phosphoric acid between 1977 and 1979 at Stauffer. No data are available before 1977 for phosphoric acid exposure. The maximum concentration of phosphoric acid, in a grab sample from the phosphorus handling department, was 4.06 mg/m3. This concentration exceeded the TLV of 1 mg/m3 and exceeded the ATSDR CV of 0.01 mg/m3 (ATSDR 1997a, NIOSH 2001, OSHA 1991). ATSDR does not have a toxicological profile for phosphoric acid, but information can be found in the Toxicological Profile for White Phosphorus (ATSDR 1997a).
Repeated exposures without respiratory protection to phosphoric acid at levels above the TLV might cause adverse health effects in workers.
Phosphoric acid is formed when phosphorus reacts with oxygen and water. Inhalation effects are similar to those of phosphorus and phosphine.
121

STAUFFER CHEMICAL COMPANY PUBLIC HEALTH ASSESSMENT – FINAL RELEASE
5.8.9. Sulfur Dioxide
ATSDR found that 59 samples were taken for sulfur dioxide between 1979 and 1981 at Stauffer. No data were available before 1979 for sulfur dioxide exposure. The maximum concentration of sulfur dioxide, in a personal sample collected in the mechanical department, was 1.39 ppm or 1,390 ppb. This concentration did not exceed an occupational standard, but it did exceed the ATSDR CV of 10 ppb.
ATSDR compared the maximum concentration of sulfur dioxide found in air to chronic inhalation exposure information in its Toxicological Profile for Sulfur Dioxide (ATSDR 1998). The LOAEL for animal studies was 5.7 ppm (ATSDR 1998). This LOAEL is based on a study of guinea pigs that were exposed by inhalation to 5.7 ppm sulfur dioxide for 22 hours per day, 7 days per week, for 52 weeks. These guinea pigs experienced cardiovascular, hematological, and hepatic effects (ATSDR 1998). Former Stauffer workers are not likely to have experienced these same effects because they were not exposed to sulfur dioxide at the levels or frequencies experienced by the animals in this study, however long-term exposure to sulfur dioxide can cause adverse health effects, i.e., lung function changes have been observed in some workers exposed to 0.30–0.40 ppm sulfur dioxide for 20 years or more. However, these workers were exposed to other chemicals, making it difficult to attribute their health effects to sulfur dioxide exposure alone (ATSDR, 1998).
Additionally, exercising asthmatics are sensitive to the respiratory effects of low concentrations (0.25 ppm) of sulfur dioxide. Inhalation of sulfur dioxide at high levels can be life-threatening. Exposure to 100 ppm of sulfur dioxide in air is considered immediately dangerous to life and health.
5.8.10. Total Dust, Quartz, and Silica
ATSDR found that approximately 66 samples were taken for nuisance dust, respirable dust, or total dust between 1972 and 1975 at Stauffer. Approximately 63 samples were also taken for quartz between 1979 and 1980 and approximately 63 samples taken for silica between 1975 and 1980. These samples were a mix of both personal and area samples collected from the furnace, yard, phosphorus handling, and kiln departments. No data are available before 1972 for dust, quartz, or silica.
Maximum values for dust, quartz, and silica all exceeded either a current or former occupational standard (NIOSH 2001, OSHA 1991). ATSDR has no CVs for dust, quartz, or silica.
On the basis of this information, it is likely that former workers at Stauffer were periodically exposed to levels of dust, quartz, and silica above occupational standards. Repeated exposures, without respiratory protection, might cause adverse health effects in former workers.
122
STAUFFER CHEMICAL COMPANY PUBLIC HEALTH ASSESSMENT – FINAL RELEASE
Inhalation of dust, quartz, and silica may all cause irritation of the respiratory tract. In occupational settings most samples for total dust contain some quartz or silica. Quartz is one of the three most common types of silica. To cause respiratory effects the particles of dust, quartz and silica must be small enough to be inhaled and deposited in the respiratory tract.
Occupational exposures to respirable crystalline silica25 (or silica) are associated with the development of silicosis, lung cancer, pulmonary tuberculosis, and airway diseases (i.e. chronic obstructive pulmonary disease, such as, bronchitis or emphysema). These exposures may also be related to the development of autoimmune disorders, chronic renal disease, and other adverse health effects. Recent epidemiologic studies demonstrate that workers have a significant risk of developing chronic silicosis when they are exposed to silica over a working lifetime at the current OSHA permissible exposure limit (NIOSH 2002).
Silicosis is the disease most commonly associated with crystalline silica exposure. Silicosis is a fibrosis of the lungs resulting in shortness of breath caused by inhalation of silica dusts. There are two types of silicosis: acute and chronic. Acute silicosis may develop shortly after exposure to high concentrations of respirable crystalline silica, while chronic silicosis usually develops years after exposure to relatively low concentrations. Some studies have found that chronic silicosis can develop even after occupational exposure has ceased. Probably the most important factor in development of silicosis is the “dose” of respirable silica-containing dust in the workplace setting. The dose is the product of the concentration of dust containing respirable silica in the workplace air and the percentage of respirable silica in the total dust. Other important factors are the particle size, the nature of the silica (crystalline or noncrystalline), the duration of the dust exposure, and the varying time period from first exposure to diagnosis (NIOSH 2002).
Silicosis may sometimes be complicated by severe mycobacterial or fungal infections. About half of these infections are caused by Mycobacterium tuberculosis and result in TB. Epidemiologic studies have firmly established that silicosis is a risk factor for developing TB. The carcinogenicity of silica in humans has been strongly debated in the scientific community. Several studies suggest that crystalline silica be considered a potential occupational carcinogen, but further research is needed to determine the relationship between silica dust exposure and increased lung cancer risk (NIOSH 2002).
5.8.11. Total Chromium
ATSDR found that eight samples were taken in 1981 at Stauffer for total chromium. No data are available before 1981 for chromium exposure. The maximum concentration of total chromium, in a personal sample from the mechanical department, was 0.46 mg/m3or 460 µg/m3. This concentration did not exceed the occupational standard for total chromium (0.5 mg/m3), however
25Respirable crystalline silica is that portion of airborne crystalline silica that is capable of entering the gas-exchange regions of the lungs, if inhaled.
123
STAUFFER CHEMICAL COMPANY PUBLIC HEALTH ASSESSMENT – FINAL RELEASE
it did exceed the occupational standard for chromium(VI)26 of 0.01 mg/m3 and the ATSDR CV of 0.10 µg/m3 (ATSDR 2000c, NIOSH 2001, OSHA 1991). Chromium (VI) is considered a human carcinogen by EPA.
ATSDR used conservative assumptions to calculate increased cancer risk based on the maximum concentration of chromium. Using these assumptions, ATSDR considers a significant increased risk for cancer as a result of exposure to chromium (Table 58 in Appendix B). However, it is unlikely that a worker would have been exposed to chromium in the workplace as frequently as ATSDR assumed in its calculations; also, ATSDR assumed that the exposure was to chromium(VI) (the more toxic form). ATSDR also compared the maximum concentration of total chromium found in air at Stauffer to chronic inhalation exposure information in its Toxicological Profile for Chromium (ATSDR 2000c). The maximum concentration was above the LOAEL of 0.004 mg/m3. This LOAEL was based on a study of chrome platers exposed to 0.004 mg/m3 of chromium (VI) compound, via inhalation, for an average of 5.3 years that affected renal function (ATSDR 2000c). Repeated exposures to chromium [especially chromium (VI)] at the levels found at Stauffer, without respiratory protection, would likely cause adverse health effects in exposed workers.
Health effects resulting from exposure to chromium(III) and chromium(VI) are fairly well described in literature. Breathing high levels (greater than 2 µg/m3) of chromium(VI) can cause irritation to the nose, such as runny nose, sneezing, itching, nosebleeds, ulcers, and holes in the nasal septum. These effects have primarily occurred in factory workers who make chromium(VI) for several months to many years. Long-term exposure to chromium has been associated with lung cancer in workers exposed to levels in air that were 100 to 1,000 times higher than those found in the natural environment. Lung cancer can occur long after exposure to chromium has ended. It is not clear which forms of chromium are capable of causing lung cancer in workers. Chromium(VI) is believed to be primarily responsible for the increased lung cancer rates observed in workers who were exposed to high levels of chromium in workroom air. Breathing in small amounts of chromium(VI) for short or long periods does not cause a problem in most people. However, high levels of chromium in the workplace have caused asthma attacks in people who are allergic to chromium. Ingesting small amounts of chromium(VI) will generally not cause harm, but ingestion of larger amounts might cause stomach upsets, ulcers, convulsions, kidney and liver damage, or death. Workers handling liquids or solids that have chromium(VI) in them have developed skin ulcers.
Breathing in chromium(III) does not generally cause irritation to the nose or mouth in most people. Chromium(III) in small amounts is an important nutrient needed by the body but, as with chromium(VI), ingesting large amounts of chromium(III) might cause health problems.
26The most common forms of chromium are chromium(III) and chromium(VI). Generally, chromium(VI) is considered the more toxic form and therefore has a lower occupational exposure limit. Because the samples for chromium were not speciated, ATSDR used the most conservative standard [chromium(VI)] for comparisons.
124
STAUFFER CHEMICAL COMPANY PUBLIC HEALTH ASSESSMENT – FINAL RELEASE
Some people have been found to be extremely sensitive to chromium(VI) or chromium(III). Allergic reactions consisting of severe redness and swelling of the skin have been noted.
5.8.12. Determination of Vital Status and Cause of Death for Former Workers
In 2003, the University of South Florida School of Public Health conducted a tracing project of former Stauffer workers. The project was done using a list constructed of Stauffer company records. Cause of death was determined using multiple official records.
The former worker database contains the names of approximately 2420 individuals of which 2318 (95%) were male. Vital status and mailing address were determined by a variety of methods. Cause of death information for former workers was identified by use of a National Death Index (NDI) Plus Search. Results show that 933 (38%) alive former workers were located by either full or partial address. A total of 864 (35%) were identified as deceased. This totals 1797 (74%) individuals as either located or identified as deceased.
The efforts made to locate former workers were extensive and included using such things as telephone directories, real estate records, Social Security Death Index (SSDI), and the NDI. Many of the workers were at the facility more than 30 years ago making it very difficult to locate them with such old information. In addition, some of the databases do not cover the entire time period or persons of interest. For example, the NDI started in 1979 and the SSDI only includes those deaths for which a claim was filed.
Cause of death was identified for 551 (63%) of the 864 deceased former workers. Age of the decedents was found in the Stauffer Chemical Company Plant former worker database. For all decedents, mean age of death was 59 years and the median age was 64 years. Malignant neoplasms (various cancers) were the cause of 28% (157) of the deaths. There were no reported cases of mesothelioma or bone cancer. For non-cancer causes of death, ischemic heart disease was the leading cause of death (19%), followed by respiratory disease (9%), other forms of heart disease (7%), and cerebrovascular disease (5%). In comparison, leading cause of death for Florida males age 65 and older (1999-2000) was heart disease, followed by malignant neoplasm (various cancers), chronic lower respiratory diseases, cerebrovascular diseases, and diabetes mellitus. There was some similarity for the order of ranking for cause of death between the worker cohort and Florida older males.
125
STAUFFER CHEMICAL COMPANY PUBLIC HEALTH ASSESSMENT – FINAL RELEASE
5.8.13. Uncertainty and Limitations
Uncertainty exists for several reasons in ATSDR’s evaluation of exposure and the possibility of harmful effects in workers from Stauffer in Tarpon Springs, Florida. Following are the some of the uncertainties or limitations in estimating exposure for former workers:
1. Arguably, the biggest limitation is the lack of exposure information for the period 1947 through 1971 — the first 25 years of Stauffer’s operations.
2. ATSDR based its evaluation of estimated exposure on the maximum level detected for each contaminant and assumed that some workers were exposed to these levels for up to 20 years. Workers are likely to have been intermittently exposed to levels above and below the maximum level detected over the course of their employment at Stauffer. ATSDR used the maximum concentration rather than average concentration in its calculations because (1) there was limited data from Stauffer for worker exposures and no practical way to generate or model past exposures, (2) it is a protective, conservative approach; and (3) qualitative information regarding plant operation suggests that levels were likely higher in the past, so there is reason to be conservative.
A vast majority (79%) of workers were employed at Stauffer for less than one year. Many workers had a work tenure lasting only one to three months and, therefore, their potential exposure was limited. Approximately 13% of the workforce was employed for five years or longer including some workers employed beyond 20 years..
3. ATSDR has no specific information to determine the length of worker exposures in certain departments or duties. To determine non-carcinogenic risk, ATSDR assumed a worst-case scenario: that workers were exposed to the maximum concentration of a contaminant for eight hours per day, 40 hours per week. In evaluating carcinogenic risk, ATSDR assumed that workers were exposed to the maximum concentration 8 hours per week for 50 weeks per year over a period of 20 years. However, in most occupational settings, workers are not exposed to a maximum contaminant concentration for eight hours per day, 40 hours per week. A more reasonable assumption is that a worker might perform a particular task (i.e., cutting asbestos gaskets) once or twice per week for 20–30 minutes at a time. Accurate information on the length of actual exposure to contaminants at Stauffer would probably lower the length of exposure used in ATSDR’s calculations, thereby reducing the possibility of adverse health effects associated with some contaminants.
4. ATSDR has very little information on the use of respiratory protection or other personal protective equipment (PPE) at Stauffer. As a worst-case scenario, ATSDR assumed that no respiratory protection or PPE was worn by workers. However, it is likely that, beginning in the 1970s, workers began wearing respiratory protection and PPE per company and OSHA guidelines. The use of respiratory protection and PPE beginning in the mid 1970s would most likely have lowered worker exposures from that time until the plant was closed in 1981.
126

STAUFFER CHEMICAL COMPANY PUBLIC HEALTH ASSESSMENT – FINAL RELEASE
5. ATSDR assumed that all of the data provided for its review was accurate, even though there was no quality assurance or quality control information provided to support this assumption.
6. ATSDR used its CVs to determine whether adverse health effects in former workers at Stauffer might have resulted from exposures to contaminants. ATSDR’s CVs are based on 24-hour-per-day exposures and were not meant to be used in assessing occupational exposures, which are generally 8-hour-per-day exposures. Therefore, any conclusions reached from using the CVs to estimate worker exposures must be interpreted with caution.
7. The only pathway evaluated by ATSDR was inhalation exposure for former workers at Stauffer, because only air monitoring data were available. It is likely that former workers at Stauffer might also have been exposed to some contaminants by dermal contact, but ATSDR has no data to evaluate this potential pathway. Any additional exposure to contaminants via dermal contact (absorption) would increase the possibility of adverse health effects in former workers at Stauffer.
8. Approximately 26% of former workers could not be successfully traced or found to determine vital status.
5.8.14. Summary of Exposure Findings
ATSDR reviewed and evaluated available worker exposure data for the Stauffer Tarpon Springs plant, which operated from 1947 through 1981. The data available for evaluating occupational exposures are limited and covers only the last 10 years that the facility was in operation (1972–1981).
The data and interoffice correspondence reviewed support the fact that workers were exposed to many contaminants during the process of extracting phosphorus from phosphate ore and during maintenance activities. However, it is difficult to assess, on the basis of the limited data, whether these exposures might have been at sufficient levels and of sufficient duration to cause possible adverse health effects. The data reviewed indicate exposures to some contaminants at Stauffer between 1972 and 1981 were in excess of current OSHA standards (Table 57). Because worker exposures occurred during this time in excess of OSHA regulations, we can probably assume these exposures would extend back through the years for which no data exists.
It is apparent, through interoffice correspondence, that Stauffer began evaluating worker exposures in the 1970s to comply with regulations from the Occupational Safety and Health Act, which became effective in April 1971. Correspondence indicates that Stauffer began recommending respiratory protection for handling ACM around 1974 or 1975 and then began implementing a respiratory protection program for other contaminants in the mid to late 1970s, as need was identified. It is unlikely that respiratory protection was used before the mid 1970s for working with ACM or chemicals at Stauffer. Therefore, workers using ACM or handling
127
STAUFFER CHEMICAL COMPANY PUBLIC HEALTH ASSESSMENT – FINAL RELEASE
chemicals in the facility before the mid 1970s had a much higher probability of being overexposed, especially in job classifications in which documented exposures at levels above occupational standards occurred in later years.
On the basis of the review of data and information provided, ATSDR concludes the following:
1. Former workers at Stauffer were intermittently exposed to asbestos or ACM at levels that indicate an increased theoretical risk for lung cancer, but it is unlikely (based on air monitoring data) that workers are at risk for asbestosis.
2. Former workers at Stauffer were intermittently exposed to chromium at levels that indicate an increased theoretical risk of lung or nasal cancer.
3. Former workers at Stauffer were intermittently exposed to carbon monoxide, chromium, hydrogen sulfide, lead, nickel, phosphorus compounds, sulfur dioxide, total dust, quartz, and silica at levels that can cause adverse health effects.
5.8.15. Discussion
Various studies of worker groups and populations in the vicinity of Florida phosphate mining area have been reported in the scientific literature. Three relevant studies are discussed below. Altough these three studies are not comparable methodologically, they do provide insight as to possible excess risks.
Checkoway et al. (1996) conducted a mortality follow up study of a previously studied cohort of 18,440 white and 4,546 nonwhite male workers in the Florida phosphate industry. The cohort consisted of workers identified in the 16 Florida Phosphate Council companies including some former Stauffer Tarpon Springs plant workers. Roughly, a two-part eligibility requirement was minimum 12 months employment for the period 1949-1987, including at least 3 months continuous service during the years 1949-1978. Person-years were determined for 1949 to 1992. Exposure levels were assigned using an job exposure matrix for 8 selected agents including alpha & gamma radiation, total dust, and crystalline silica. For most of the study, industrial hygiene measurements were nonexistent. Regarding study results, no healthy worker effect was found for white males, total number of deaths was nearly identical to what was expected based on U.S. mortality rates. Lung cancers standardized mortality ratios (SMRs), relative to national rates, were computed for workers in the highest joint exposure category. Excesses of skin cancer and lung cancer in white males, using national rates, diminished to not elevated when compared to county level rates. There were two observed cases of pleural mesothelioma, and none for peritoneal mesothelioma. Perhaps the most notable finding for lung cancer was the elevation among white males (17 observed cases, SMR=1.94, 95% CI 1.13-3.11) with 30 or more years of employment, based on a comparison against national rates. The small elevations (roughly 20%) of lung cancer mortality compared to national rates found in the original study during the period
128

STAUFFER CHEMICAL COMPANY PUBLIC HEALTH ASSESSMENT – FINAL RELEASE
1949-1978 persisted on extended follow-up through 1992. There was no information for workers’ indoor radon levels or cigarette smoking to examine associations with either factor.
Block et al. (1998) studied 3,451 male workers employed for at least 6 months between 1950 and 1979 at a phosphate company. Dust exposure by job was measured and used as a proxy measure of radiation exposure. In white workers, cancer of the respiratory system and emphysema showed significant increase based on U.S. (SMR of 1.62 and 2.19, respectively). and state rate (SMR of 1.5). There was no evidence of excess head or neck cancer, which, in theory, might be increased due to exposure to radioactive dust. For workers with 20 year latency, there was a trend to increasing lung cancer risk with increasing employment duration (SMR of 2.48). Among white workers, smoking might have contributed to the increase in lung cancer risk but could not fully explain it.
Stockwell et al. (1988) researched lung cancer in Florida and for risks associated for residence in the central Florida phosphate mining region. The study design could be characterized as a population based case-control study in areas with phosphate deposits containing natural radioactivity. The cohort consisted of all cases of lung cancer 1981-1983 first diagnosed among Florida residents living near phosphate mining areas (Hardee, Hillsborough, Polk counties). Comparison to lung cancer in the other counties for the same period. In total, nearly 25,000 primary lung cancer cases were studied. For results, males living in the 3-counties area of interest who were nonsmokers had a significant two-fold risk of developing lung cancer relative to the comparison area (squamous cell carcinoma, adenocarcinoma, small cell carcinoma). Current smokers had slight nonsignificant elevated risks for cancer compared to the rest of the state (squamous cell and small cell carcinomas). No clear pattern of excess risk occurred among females. Contrary to these positive morbidity study findings, Dutton and investigators studied serial lung function, via cross-sectional annual spirometry/lung function testing over 3 to 7 years, for 131 workers refining elemental phosphorous and found no residual significant effect of industrial exposure after adjusting for age and smoking.
Because ATSDR’s evaluations indicate that some former Stauffer workers were occupationally exposed to asbestos or other contaminants at levels that might cause adverse health effects, including certain cancers, ATSDR set out to identify appropriate health conditions or diseases to study. This task proved difficult because (1) former workers were exposed to a number of different chemicals and substances, (2) no exposure data is available for a majority of years of the plant’s operations (i.e., late 1940s to early 1970s), (3) no specific information regarding job duties or assignments, (4) the available exposure data are limited and contain uncertainties, and (5) about 62% of former workers are either deceased or their vital status or whereabouts is unknown. (Note: ATSDR acknowledges that some former Stauffer workers were likely overexposed to various chemicals prior to the time workplace monitoring began, that is, before the early 1970s.)
Based on several factors including limited industrial hygiene data and time elapsed since last exposure, ATSDR does not believe that a scientifically rigorous morbidity study of living former Stauffer workers is feasible, i.e., provides definitive results. ATSDR will re-evaluate this decision
129
STAUFFER CHEMICAL COMPANY PUBLIC HEALTH ASSESSMENT – FINAL RELEASE
if new exposure data become available. However, ATSDR is conducting a mortality study of deceased former Stauffer workers. In addition, as a medical service to living former workers, ATSDR is offering a lung evaluation to some former ore processing and phosphorus production workers. The purpose of this follow-up activity is to provide (1) a meaningful service for former workers that may improve workers' preventive health practices and choices, e.g., annual vaccinations to prevent certain respiratory diseases; and (2) results of lung function testing to inform the individual worker and his/her personal physicians in support of future medical decision making.
130

STAUFFER CHEMICAL COMPANY PUBLIC HEALTH ASSESSMENT – FINAL RELEASE
6. CHILD HEALTH CONSIDERATIONS
To ensure that the health of the nation’s children is protected, ATSDR implemented an initiative requiring that public health assessments specifically evaluate the potential for children being exposed to site-related hazardous waste and whether the health of children might be affected.
This public health assessment reflects ATSDR’s concern about protecting children’s health from toxic chemicals in the environment. Specifically, ATSDR evaluated the potential for harmful effects occurring in children in the following scenarios:
< children being exposed to contaminants in air, especially particulate matter and sulfur dioxide, and the possibility of harmful effects;
< children with asthma as a sensitive subpopulation; < children exposed to contaminants in drinking water; < children’s exposure to contaminants in soil; < children who attended Gulfside Elementary School; and < children who eat large amounts of dirt (children with soil-pica behavior) and the possibility of
harmful effects.
These six topics are described in more detail in the Public Health Implications section.
131

STAUFFER CHEMICAL COMPANY PUBLIC HEALTH ASSESSMENT – FINAL RELEASE
7. DISCUSSION OF COMMUNITY CONCERNS
ATSDR established a community group called the Neighbor-2-Neighbor (N-2-N) Forum to help ATSDR solicit community concerns and inform and educate residents living near the Stauffer site. The N-2-N Forum consists of community representatives (and their technical advisers) who have volunteered to serve as champions for their community. ATSDR staff members met several times with the N-2-N Forum and other interested stakeholders to discuss health and environmental concerns about the Stauffer site. Additional concerns about the site were received from the ATSDR Ombudsman report (ATSDR 2000a), community-wide meetings, and telephone calls received via the ATSDR toll-free line. These concerns and ATSDR’s responses are listed below.
7.1. Health Concerns
1. ATSDR should provide medical treatment to former Stauffer workers.
ATSDR Response: ATSDR does not have the legal authority to provide medical care or treatment to people who were exposed to hazardous substances, even if their exposure has made them ill.
2. ATSDR needs to consider children’s exposures and health effects separately from adults.
ATSDR Response: ATSDR agrees. As mentioned previously in the Child Health Considerations section, ATSDR evaluated children’s exposure for numerous scenarios involving exposure to contaminants in air, water, and soil. These areas are discussed in more detail in the Public Health Implications section.
3. Can ATSDR evaluate arsenic exposure, especially to children?
ATSDR Response: Yes. ATSDR reviewed environmental data specifically for arsenic, estimating how much arsenic children might be exposed to should they come in contact with arsenic in soil or drinking water. Using these estimates, ATSDR determined whether harmful effects might be possible. Children and the potential for arsenic exposure and harmful effects are described in more detail in the Public Health Implications section.
4. Can ATSDR address the risk of multiple exposures to the same or different chemicals?
ATSDR Response: Yes, to a limited extent. When evaluating air emissions from the Stauffer facility while it was operating, ATSDR evaluated the combination of exposures that occur in air contaminated with particulate matter, sulfur dioxide, and other pollutants. Some information shows that particulate matter and sulfur dioxide are both involved somehow in heart and lung disease. What is uncertain is whether the chemicals actually cause heart and lung disease or increase the severity of preexisting heart and lung disease.
132
STAUFFER CHEMICAL COMPANY PUBLIC HEALTH ASSESSMENT – FINAL RELEASE
5. Can exposure to chemicals coming from the Stauffer site cause Hodgkin disease, Parkinson disease, tumors, migraines, cancers (colon, bone), thyroid disease, neurologic problems, nosebleeds, joint pains, strokes, asthma, diabetes, lung disease, headaches, ulcers, problems breathing, skin lesions, pulmonary lung disease, upper respiratory problems, high blood pressure, severe allergies, and shortness of breath?
ATSDR Response: Exposure to these chemicals emitted while Stauffer was operating are associated with some of these health problems. More specially, exposure to particulate matter and sulfur dioxide are associated with the following: < cancer, < asthma, < lung disease, < headaches, < problems breathing, < pulmonary lung disease, < upper respiratory problems, and < shortness of breath.
A description of the possible harmful effects that might occur from past or future exposures to hazardous chemicals associated with the Stauffer facility can be found in the Public Health Implications section.
6. I have a friend who lived at Holiday Estates and wants to know if her miscarriage could have been caused by exposure to chemicals from Stauffer?
ATSDR Response: The most likely way residents of Holiday Estates could have been exposed to contaminants from Stauffer is by breathing polluted air coming from the facility. Available information indicates that the following contaminants were released into the air by the facility: particulate matter, sulfur dioxide, and fluoride. None of these contaminants are known to cause miscarriages. Whether other chemicals that could cause miscarriages were released by Stauffer is unknown.
7. Can residents eat fish from the Anclote Pier? Could past releases of fluoride contaminate fish today?
ATSDR Response: ATSDR has reviewed the environmental data from the Stauffer facility and none of the chemicals present at the site are at levels that might contaminate fish for human consumption, including fluoride.
However, FDOH issued a health advisory related to eating fish from the Anclote River in Pasco and Pinellas County because of mercury contamination. The advisory is not related to the Stauffer site. FDOH advises that adults should limit fish consumption to one meal per week. It also advises that children under 15 years of age and nursing or pregnant women
133
STAUFFER CHEMICAL COMPANY PUBLIC HEALTH ASSESSMENT – FINAL RELEASE
should limit consumption to one meal per month. Fish included in this advisory are largemouth bass, bowfin, and gar. Therefore, ATSDR suggests that people who fish from the Anclote Pier should follow FDOH recommendations in its fish advisory.
FDOH has information about all Florida fish consumption advisories (FDOH no date), and includes more information on the work of FDOH, FFWC, and the FDEP with regard to mercury in freshwater fish around the state. More information can be found at this website: http://floridafisheries.com/health.html.
8. Are there any medical problems with residents who lived near Stauffer during the years of operations and what are those problems?
ATSDR Response: The ATSDR Ombudsman report about the Stauffer facility (ATSDR 2000a) recounts several incidents by local residents who reported health problems (for example, coughing and sneezing) because of airborne plumes from the facility. Although medical problems have been reported by people who lived around the former Stauffer facility, it is not possible to determine whether those problems resulted from the Stauffer facility. It is possible to evaluate past exposure and determine if medical problems could have resulted from past exposure to those airborne contaminants migrating from the Stauffer facility. Exposure to sulfur dioxide and particulate matter could have caused harmful effects to the heart and lung (that is, cardiovascular disease) in some residents who lived close to the facility. These effects are discussed in more detail in the Public Health Implications and Conclusions sections of this report.
9. What is the solubility of arsenic and how does its solubility affect toxicity levels with regard to drinking water wells and ground water supplies?
ATSDR Response: The solubility of arsenic depends on its chemical form. Arsenic in water tends to have high solubility, which means that when people drink water with arsenic, much of it will get into their system. Arsenic in soil, on the other hand, tends to be less soluble compared with arsenic in drinking water, and tends to be less well-absorbed compared with arsenic in drinking water.
10. What is the health hazard of arsenic in the soil?
ATSDR Response: If arsenic levels in soil are high enough, ingestion of arsenic from hand-to-mouth activity might increase the risk of cancer should that exposure continue for several decades. The Stauffer facility contains arsenic in pond soil that is a concern for an increased risk of cancer should that portion of the site be developed as residences. The cancers of concern are skin cancer and certain internal cancers, including cancer of the lung, bladder, kidney, and liver. It is unlikely that levels are high enough in soil to cause other harmful effects. The hazards of arsenic in soil are discussed in more detail in the Public Health Implications section.
134
STAUFFER CHEMICAL COMPANY PUBLIC HEALTH ASSESSMENT – FINAL RELEASE
11. Is fluoride in the slag bioavailable and how could it affect a child with pica behavior?
ATSDR Response: At this time, it is not known whether fluoride in slag can be absorbed across the gut into the human body (that is, whether it is bioavailable). This can only be determined by feeding slag to animals, for instance, young pigs, and measuring its absorption. Because these studies are expensive, ATSDR usually assumes that chemicals are bioavailable. It seems reasonable to assume that some of the fluoride would be available to cross the human gut should a person swallow slag.
For those who might not know, pica behavior is the consumption of non food items. ATSDR is particularly interested in children who eat large amounts of soil and refers to these children as having soil-pica behavior: this term distinguishes them from other types of pica behavior, for instance, eating paint chips. Probably somewhere between 4 and 20 of every 100 children (or 4% to 20%) will experience soil-pica behavior sometime during their preschool years. Soil-pica behavior occurs mostly frequently in 1- and 2-year-old children, and gradually decreases in older preschool children. Soil-pica behavior can occur just one time or it might occur several times a week. Children with soil-pica behavior can eat up to a teaspoon or more of soil, so it is possible to estimate how much of chemical a child might ingest should he or she eat soil from a contaminated area. Whether children would be tempted to eat slag is uncertain. Slag has the consistency of rock, not soil, so it might be unappealing to children with pica behavior. On the other hand, some children with pica behavior might be tempted to put slag in their mouth but not actually eat it.
Analytical measurements of fluoride content in slag showed that fluoride levels ranged from 30 to 1,920 ppm. Because of the uncertainty in how much fluoride is bioavailable (that is, will cross the gut if someone swallows slag), it is difficult to estimate a dose that can be used to decide if harmful effects might occur in children with soil-pica behavior. If one assumes that all the fluoride in slag crosses the gut, then for slag with 30 ppm fluorides, the dose for a 1-year-old child with soil-pica behavior is estimated as 0.01 mg/kg/day, whereas slag with 1,920 ppm fluorides will have an estimated dose of 1 mg/kg/day. These estimates are for a child eating soil one time. If a child has habitual soil-pica behavior, he or she could eat slag three times a week. The estimated dose in this case is 0.004 mg/kg/day for slag with 30 ppm fluorides and 0.4 mg/kg/day for slag with 1,920 ppm fluorides.
At 30 ppm fluorides in slag, a preschool child with soil-pica behavior is not likely to get sick from fluorides. At 1,920 ppm fluorides in slag, the estimated one-time dose of 1 mg/kg/day is too close to doses that caused harmful effects in animals to be safe. The lethal dose in children is 16 mg/kg/day from a one-time exposure. The estimated dose of 0.4 mg/kg/day for a child with habitual soil-pica behavior is also too close to doses in animal studies that cause harmful effects. A dose of 0.5 mg/kg/day in rats for 2 months affects their endocrine system by decreasing levels of the hormone thyroxine. A dose of 0.8 mg/kg/day in mice for 4 weeks has
135

STAUFFER CHEMICAL COMPANY PUBLIC HEALTH ASSESSMENT – FINAL RELEASE
shown damage to the bone in the form of increased bone formation and a small decrease in bone calcium levels.
It is important to remember, however, that some uncertainty exists in actually deciding whether children with soil-pica behavior might actually get sick from fluorides should they eat slag because it is not known how much of the slag will be digested to release fluorides. It also seems unlikely that children would actually eat slag.
12. Why is water from shallow water wells unfit to drink, water plants, or use for filling pools for children?
ATSDR Response: Table 7 in Appendix B shows contaminant levels in the shallow aquifer from which some wells draw their water. Groundwater from the shallow aquifer has elevated levels of several metals (arsenic, cadmium, lead, and thallium), which make it unfit to drink. Because children swallow small amounts of water while swimming, this water should also not be used to fill pools. The water is, however, safe for watering plants.
7.2. Environmental Concerns
1. Will air dispersion modeling be done as part of the past air emissions evaluation?
ATSDR Response: Yes (see the Air Contamination section).
2. Will the public health assessment conduct a thorough evaluation of asbestos? What data are available for asbestos in the Stauffer plant?
ATSDR Response: Asbestos sampling data are discussed and evaluated in the public health assessment.
3. Will ATSDR evaluate the original 32 contaminants of concern?
ATSDR Response: ATSDR evaluated all contaminants found at levels exceeding ATSDR health-based CVs.
4. How can people avoid current exposure to site contaminants?
ATSDR Response: People are not likely to be exposed to contaminants from the site at levels of health concern.
5. Could residents have their well water tested for safety?
136
STAUFFER CHEMICAL COMPANY PUBLIC HEALTH ASSESSMENT – FINAL RELEASE
ATSDR Response: Yes. Pinellas County residents who may have concerns about their well water should contact Ms. Bonnie Bergen at the Pinellas County Health Department, while Pasco County residents should contact the Pasco County Health Department.
6. During Stauffer’s operations thick, clouds of ground-level dust were emitted from the plant. What might have been contained in the dust?
ATSDR Response: Available sampling data are not adequate to allow ATSDR to determine all of the contaminants in Stauffer’s air releases. However, ATSDR’s review of available data shows the emissions likely contained a number of contaminants including phosphorus pentoxide, fluorides, sulfur dioxide, metals, and radionuclides.
7. Can ATSDR evaluate likely exposures to families who lived close to the Stauffer facility while it was in operation?
ATSDR Response: Yes. ATSDR’s public health assessment includes evaluation of exposure of residents who lived near the Stauffer plant to airborne releases from the Stauffer facility.
8. Has ATSDR evaluated runoff water from ditches and culverts from the site into the Anclote River?
ATSDR Response: Yes. Contaminants in surface water runoff are evaluated in the sections of the public health assessment dealing with Anclote River surface water and sediment.
7.3. Radiation Concerns
1. What are the health effects of multiple radiation exposures and potential cumulative effects?
ATSDR Response: The potential for multiple radiation exposures posing an increased risk for adverse health effects depends on four things: < the exposure level or dose, < the type of radiation, < the exposure pathway (external or internal), and < the time between exposures.
When a person is repeatedly exposed to radiation, it can cause cumulative effects (also known as additive effects) to his or her body. These are effects that build up over time. The main adverse effect of radiation to the human body is damage to the DNA, the genetic recipe for a cell. Minor damage to DNA can be repaired. However, the damage also can be serious enough to cause cell death. Between these two extremes, a mutation, or permanent change in the DNA, can occur. The change is the result of a DNA repair that has gone wrong. This is called incorrect repair. Mutations can be passed on to offspring. These changes in the DNA might not kill someone, but mutations might build up in cells. This buildup can increase the chance
137
STAUFFER CHEMICAL COMPANY PUBLIC HEALTH ASSESSMENT – FINAL RELEASE
the person might become ill. Cell mutations in the human body have been linked to an increased risk for cancer. Mutations in reproductive cells might also occur; this type of mutation has been linked to heritable disease, which can be passed on from parents to offspring. The chance for this type of mutation increases with each exposure to radiation.
Because cancer cells divide more rapidly and are more sensitive to radiation than are healthy cells, radiation is used to treat cancer. Other rapidly growing cells that are likely to react to radiation are the cells that make blood and skin. Cells in the stomach, intestines, eyes, ovaries, and testes are also more likely to be affected by radiation than are other cells.
Cells can repair damage caused by radiation. However, being exposed to radiation time and time again before the body can repair itself might result in more damage. Effects can build up and can increase the chance for illness. Doses necessary to overwhelm repair are orders of magnitude higher than those found at the Stauffer site.
2. What are the health effects of radon?
ATSDR Response: Radon is a colorless and odorless radioactive gas that is and always has been a natural component of the air we breathe. Radon is produced by the radioactive decay of radium, a naturally occurring radioactive element found in trace amounts in all soils as well as in building materials, plants, animals, and the human body. Although scientists have been aware of radon for many years, it was not until recently that it was realized that the largest radiation exposures received by most persons comes from natural sources of radiation, primarily radon and its radioactive decay products. Radon decay products increase the risk of lung cancer, primarily among active tobacco smokers. Limited data exist to suggest that radon might increase the risk of lung cancer among nonsmokers.
3. Has ATSDR evaluated radium-226 in the private wells in the Tarpon Springs area?
ATSDR Response: The Pinellas and Pasco County Health Departments have done some limited sampling of selected drinking water wells within about a 1/4-mile radius of the site. The analysis included three radionuclides: gross alpha, radium-226, and radium-228. Sampling of these wells is ongoing on a quarterly basis, data analysis is being compiled, and trends are being evaluated.
4. Why is off-site slag not considered a public health concern while on-site slag is considered a concern?
ATSDR Response: In regards to the relative health hazards from on-site vs. off-site slag, the main issue is the gamma radiation dose rate that a person would receive from the slag. This dose rate is related to the amount of radiation emitted from the slag which is a function of the concentration of radium in the slag (pCi/kg) and the amount of slag present in a given area (kg/m2). Since there is much more slag on-site than off-site, and the on-site slag is confined to
138
STAUFFER CHEMICAL COMPANY PUBLIC HEALTH ASSESSMENT – FINAL RELEASE
a relatively small area, the total amount of radioactivity emitted is much higher on-site than off-site. The result is that on-site gamma dose rates are orders of magnitude higher than off-site.
5. Can ATSDR ask EPA to identify the off-site slag?
ATSDR Response: Without testing every home and piece of land in the community, it cannot be said that no one is being exposed to radiation from the slag at levels above the guidelines. However, the FDOH’s Bureau of Radiation Control performed many surveys and tests on the slag throughout the Tarpon Springs/Holiday area. The results assured ATSDR that the outdoor areas of slag (in roads and driveways) are not a health hazard. The slag varies little from place to place. Also, slag found in building materials of homes showed only a few areas that are near levels of any concern. The bureau will survey homes for radiation on request. Please call the Environmental Laboratory in Orlando at 407-297-2095. Private consultants can also be contacted to do surveys.
6. How much radium is on site?
ATSDR Response: Nearly 100 times the concentration found off site.
7. Can ATSDR use whole-body testing to measure the total radiation body burden of former workers and area residents?
ATSDR Response: Yes, but ATSDR believes that it would not be appropriate. A total body burden test measures levels of radioactive material inside the body. The levels of radioactivity are measured using external detectors or by analyzing biological samples, such as urine or blood.
It is rare that a person will be exposed to radioactive materials at levels that require a total body burden test. This test can be used when radioactive material has entered someone's body by inhalation, ingestion, or when it enters the body through the skin or by other means. A body burden test is not a way to measure radiation exposure from sources outside the body. The test is not appropriate after external exposure to x-ray or gamma radiation. After such exposures, no radiation remains in the body. However, although radiation does not remain in the body after an exposure, effects from the radiation exposure might remain.
This test might not be one a general practice physician would know about. However, if someone has been exposed to excessive amounts of radioactive materials from occupational exposure, a doctor can refer a patient to a specialist for such a test.
8. Previous radiation evaluations did not include information about exposure to radionuclides by inhalation and ingestion and their possible health effects. Will inhalation and ingestion be considered in future evaluations?
139
STAUFFER CHEMICAL COMPANY PUBLIC HEALTH ASSESSMENT – FINAL RELEASE
ATSDR Response: These exposures were considered in the August 1999 Public Health Assessment Addendum for Stauffer Chemical Company (ATSDR 1999e) and in the July 2002 Health Consultation Concerning Individual Dose Measurements In and Around Tarpon Springs, Florida (ATSDR 2002).
7.4. Community Involvement Concerns
1. Can ATSDR provide a time line of ATSDR’s site activities?
ATSDR Response: After consulting with the N-2-N Committee, ATSDR has been including updated projected time lines in the ATSDR Community Update/Newsletter to keep residents informed.
2. Can ATSDR provide information on its products and services in Greek?
ATSDR Response: The majority of ATSDR's products and services (i.e., documents, fact sheets, etc.) are produced in English and some in Spanish. However, based on community needs, documents can be translated into other languages. At the Tarpon Springs site, ATSDR raised this issue with the Neighbor to Neighbor (N-2-N) group. The N-2-N members indicated that the majority of residents in Tarpon Springs and surrounding areas use English as their primary language and that it was not necessary for ATSDR to translate it’s documents for the Stauffer site into Greek. Nevertheless, ATSDR will make available a Greek-version of the PHA summary fact sheet to area residents whose primary language is Greek. In addition, ATSDR will consider, on a case-by-case basis, requests to provide other site documents in Greek.
7.5. Health Education Concerns
1. Can ATSDR provide environmental health education to the medical community treating people with environmental/industrial exposure?
ATSDR Response: Yes. ATSDR staff will develop environmental education packets for local health care providers.
2. Can ATSDR provide education in schools with distribution of fact sheet specifically for children and a presentation at schools for parents/PTO meeting, or both?
ATSDR Response: ATSDR has provided and will continue to provide environmental health education materials to local schools and library repositories. We will continue to provide updated information on site-related activities through the Neighbor-2-Neighbor newsletter, fact sheets, and community meetings.
140

STAUFFER CHEMICAL COMPANY PUBLIC HEALTH ASSESSMENT – FINAL RELEASE
3. Can ATSDR provide health education to former Stauffer workers?
ATSDR Response: ATSDR, in consultation with partnering occupational health agencies, will provide health education to former Stauffer workers
4. Will ATSDR consider doing a “health day” at Gulfside Elementary, in conjunction with the local health department, to educate students and their parents about Stauffer?
ATSDR Response: ATSDR will accept invitations from community-sponsored health events including local schools. We will provide environmental health education materials to address site-specific health concerns, including those that involve children.
7.6. Health Studies Concerns
1. Will ATSDR release the names of the former Stauffer Chemical Company workers and cause of death for the 700 deceased workers?
ATSDR Response: ATSDR does not release individual information because of confidentiality agreements and to protect the privacy of families. Information about the former workers, including cause of death, will be released in ATSDR reports as aggregate data only.
2. Why is ATSDR not conducting a health study of former Stauffer workers?
ATSDR Response: In response to community concern and in consideration of advice from the ATSDR-convened Expert Panel meeting held on July 31, 2003, ATSDR’s Division of Health Studies is conducting follow-up activities for former Stauffer workers, including (1) a mortality cause of death analysis for deceased former workers, and (2) a medical pulmonary evaluation for some former ore processing and phosphorus production workers. ATSDR will provide further information about these activities as they develop.
3. Will ATSDR release the names of former Gulfside Elementary students who attended the school during the time of the plant operations?
ATSDR Response: ATSDR does not release information on individuals because of privacy and confidentiality issues. Information about the former Gulfside Elementary students will be released in ATSDR reports only as aggregate data.
4. How do we get NIOSH involved?
ATSDR Response: ATSDR consulted with NIOSH’s Hazard Evaluations and Technical Assistance Branch in 2003 regarding the conclusions reached in the PHA. Dr. D. Trout of NIOSH participated in the ATSDR-convened Expert Panel meeting that was held on July 31,
141

STAUFFER CHEMICAL COMPANY PUBLIC HEALTH ASSESSMENT – FINAL RELEASE
2003 (after release of the PHA report for public comment.) ATSDR is also consulting with NIOSH in regard to follow-up activities for former Stauffer workers (i.e., the medical screening project and the mortality study).
142

STAUFFER CHEMICAL COMPANY PUBLIC HEALTH ASSESSMENT – FINAL RELEASE
8. HEALTH OUTCOME DATA EVALUATION
8.1. Health Statistics Review of Populations Living Near Stauffer
8.1.1. Background
At the request of ATSDR, the Florida Department of Health (FDOH) conducted a cancer incidence analysis of populations living near the Stauffer Chemical Company (Stauffer) site. ATSDR made the request on behalf of concerned citizens who perceived there to be an excess of cancer and other illnesses among citizens who live(d) near the Stauffer facility. Therefore, based on the substances and radioactive matter that were utilized at the site during the years of operation, ATSDR and the University of South Florida staff selected specific cancer types for analysis. These cancers were chosen because they represent groupings that are associated with substances used at the site and because some cancers may be more sensitive to the effects of radiation. The cancers analyzed included: bone, brain, leukemia, lung and bronchus, lymphomas, melanoma, mesothelioma, and thyroid cancers.
8.1.2. Methods
The target area consisted of four combined census tracts: the census tract where the Stauffer facility was located (103027308) and three surrounding, adjacent census tracts (101030400, 103027501, and 103027401). The period analyzed consisted of three five-year time periods: 1985-1989, 1990-1994, and 1995-1999. These were chosen because they represent all of the years of data available from the Florida Cancer Data System (FCDS). The population analyzed consisted of those residents who lived within the combined census tracts during 1985-1999. Standardized incidence ratios (SIRs) were calculated for the eight site-specific cancers mentioned above by sex and time period. SIRs are the observed number of specified cancer cases for the residents of the target area divided by the expected number of cancer cases for the population of the target area, assuming the rate was the same as elsewhere in Florida. An SIR of exactly one indicates that the target area’s incidence is equal to what is expected. An SIR less than one indicates that the target area’s incidence is lower than what is expected. An SIR greater than one indicates that the target area’s incidence is higher than what is expected. Expected numbers were calculated using average state incidence rates for whites from 1985 to 1999. The rates of whites in Florida were used because there were fewer than one percent of blacks living in the target area during the time period analyzed. For the state of Florida and county populations, official intercensal estimates were generated by the governor’s office, while the intercensal target area population was estimated by linear extrapolation from the U.S. census data for Florida. Significance tests—p-values and 95% confidence intervals—were also used to determine whether the generated SIRs were statistically significant.
143

STAUFFER CHEMICAL COMPANY PUBLIC HEALTH ASSESSMENT – FINAL RELEASE
8.1.3. Results
For the time period 1985-1989, all of the SIRs were less than what would be expected for the target area, many of which were statistically significantly lower. The most likely explanation for this was that the FCDS was just getting established in the early 1980s, possibly resulting in an under reporting of cases to the registry for the time period 1985-1989. For this reason, it was decided by ATSDR and FDOH to focus on the cancer incidence for the combined years 19901999, and also separately for 1990-1994 and 1995-1999. For the combined years of 1990-1999, the SIRs for all cancers examined were less than or equal to what one would have expected to see for the target area. However, when examining the time periods of 1990-1994 and 1995-1999 separately, mesothelioma in women was found to be significantly elevated during 1990-1994 (3 cases observed, 0.6 cases expected; SIR=5.0; p<0.02). In comparison, mesothelioma in men was not significantly elevated for these same time periods (4 cases observed, 3.1 cases expected, SIR=1.3, p<0.28; and 1 case observed, 3 cases expected, SIR=0.3; respectively).
8.1.4. Discussion
Mesothelioma, a rare form of cancer, is a disease in which cancer cells are found in the sac lining the chest or abdomen. Mesothelioma has a long latency period—usually 30 to 40 years—yet is almost always fatal by the time it is diagnosed. Mesothelioma occurs predominately in men and is usually acquired through an occupational exposure to asbestos (e.g., ship-building). Researchers have found associations of environment asbestos exposure and pleural malignant mesothelioma and non-malignant conditions based on case series and population based case-control study designs (Magnani et al 2001, Garner and Saracci 1989). However, the scientific literature is inconsistent with regard to environmental asbestos exposure and malignant mesothelioma (McDonald and McDonald 1996). What is unusual about the significant elevation found in the census tracts is that the excess occurred in women. This finding could be the result of an occupational or other exposure that occurred decades ago from a nearby facility(s) that used asbestos. Another possibility for this excess could be due to take-home exposure from asbestos-contaminated clothing from a spouse or household member who worked in a facility(s) that used asbestos. It is also possible that this excess could be due to a community exposure via ambient air from a nearby facility(s) that used asbestos; however, given that the Stauffer-vicinity disease appears to be limited to females only, this possibility is not likely.
In response to this excess of disease, further exploration of these three mesothelioma cases was conducted by ATSDR and the FDOH to determine how these individuals might have possibly been exposed. ATSDR requested—and received—select information on these three individuals from the FCDS for verification. The information requested included name, sex, date of birth, diagnosis date, age at diagnosis, occupational industry, and address at diagnosis in order to determine if these individuals were Stauffer workers or spouses of workers. ATSDR cross-referenced these three individuals with a worker list that was provided by Stauffer Management Company to identify a possible exposure relationship. ATSDR was not able to identify these names on the list of former workers. Therefore, we do not think that these women or their spouses
144

STAUFFER CHEMICAL COMPANY PUBLIC HEALTH ASSESSMENT – FINAL RELEASE
were Stauffer workers. ATSDR reviewed the death certificates for these three women. The occupational status listed on these death certificates was either blank or coded simply as “retired.” Given that Florida is a frequent retirement destination, it is possible that these three women were exposed to asbestos elsewhere. To investigate the time frame that these three women lived in the site area, ATSDR retrieved information from public deed records. The deed records indicated that the three women moved into the site area between 1968 and 1979; two of the women were 60 years old and the other was 55 years old when they bought their homes in the vicinity of Stauffer Chemical Company. The three women lived at their residences for a total of 15 to 26 years prior to their deaths, and more significantly, 3 to 13 years while the Stauffer facility was in operation. As such, ATSDR believes that the three women were likely exposed to asbestos prior to moving to the vicinity of Stauffer Chemical Company, and, therefore, the three asbestos cases are not related to the Stauffer site.
145
STAUFFER CHEMICAL COMPANY PUBLIC HEALTH ASSESSMENT – FINAL RELEASE
9. CONCLUSIONS
9.1. Past Site Conditions and Exposures
9.1.1. Historical (Past) Air Exposures Before 1982
Levels of air pollution in the immediate area of the Stauffer facility while it was operating (i.e., 1947-1981) were likely to be a public health hazard because of the combined emissions from the Stauffer facility and from other sources in the area. The components of air pollution causing the health hazard are sulfur dioxide and particulate matter. These components reached levels that in the scientific literature were associated with an increased incidence of adverse lung and heart conditions. Populations at greatest risk for suffering adverse health effects include children, the elderly, persons with preexisting heart or lung disease, and persons with asthma who lived or worked near the Stauffer facility. In making this hazard determination, some uncertainty exists in the health conclusions for long- and short-term exposures to particulate matter and long-term exposure to sulfur dioxide. However, both sulfur dioxide, as well as particulate matter, are likely to affect the lungs; therefore, any added particulate matter exposures in combination with sulfur dioxide exposures may have increased the risk of an adverse effect to the lungs. Specific perspective on the public health implications of exposure and uncertainty of exposures to sulfur dioxide and particulate matter follow.
9.1.1.1. Short-term and long-term exposure to particulate matter
Particulate matter is ubiquitous both in outdoor and indoor environments. Besides the multiple outdoor sources of PM exposures to the community (including the Stauffer facility, the Florida Power Anclote Plant, automobiles, and others), there are numerous other indoor sources of PM exposures from cooking, cleaning, and other indoor activities. The sampling data quite clearly demonstrate that air emissions when the Stauffer facility was active caused increases in particulate matter concentrations near the facility. However, the particulate matter levels measured near Stauffer between 1977–1981, though greater than Florida’s previous air quality standards, were not above the U.S. EPA standards for PM in place at that time and were similar to particulate matter levels routinely measured in many suburban and urban settings throughout the state. When ATSDR evaluates exposure to environmental contamination, our primary role is to examine whether exposures are at levels associated with adverse health effects. Whether other populations experienced greater or lesser exposures does not factor into our public health evaluations for a given site.
ATSDR relied on the vast epidemiological evidence that strongly suggests that short- and long-term exposure to particulate matter is associated with lung and heart diseases. Specifically, the scientific literature has shown associations with very serious health effects (death) to less serious health effects (e.g., slight lung function changes). Using our best estimates, particulate matter exposures from all sources and those attributable to Stauffer could have resulted in one of the adverse health effects shown in the scientific literature. Moreover, the population exposed to particulate matter attributable to Stauffer are more likely to have experienced the less serious
146
STAUFFER CHEMICAL COMPANY PUBLIC HEALTH ASSESSMENT – FINAL RELEASE
health effects of lung and heart diseases and reductions in lung function than other, more serious health effects reported in the literature. Although ATSDR provides this perspective for the community to better understand their risk of the most serious adverse health effects, we do so with some uncertainty. Given that the exposed population may have had a higher percentage of elderly (a likely sensitive population), ATSDR cannot completely rule out any of the adverse health effects that have been associated with PM exposures. In any case, the risk of an adverse cardiopulmonary health outcome was likely reduced once the Stauffer facility ceased operation in 1981 because the levels of exposure to particulate matter, especially the smaller, fine particles, were lowered.
Persons residing in or working in the following areas might have experienced adverse health effects similar to those reported in the literature from their exposures to particulate matter:
< The Flaherty Marina (before 1982), < Residential homes built before 1982 southwest of the Stauffer facility along the shore of the
Anclote River, < Residential homes west of the Stauffer facility built before 1982 and within 1,540 feet of the
kiln, and < Commercial and industrial businesses east of the Stauffer facility along Anclote Road built
before 1982 and within 1,540 feet of the kiln.
9.1.1.2 Short-term exposure to sulfur dioxide
Air monitoring data are available for 1977 to 1979 and most of the time sulfur dioxide levels were below ATSDR’s health guideline of 10 parts per billion (ppb). Periodically, however, hourly sulfur dioxide levels at the Anclote Road monitoring station near the Flaherty Marina showed significantly elevated levels of sulfur dioxide. The highest average sulfur dioxide level detected in a 1-hour monitoring period was 840 parts per billion (ppb). Because valid human studies are available concerning the harmful effects of sulfur dioxide, ATSDR is concerned about the times when sulfur dioxide levels were above 100 ppb, the lowest known level to cause a response in humans. The concern becomes greater at levels above 500 ppb.
People who lived in, worked in, or visited the following areas before 1981, when Stauffer was operating were at risk for harmful effects from exposure to sulfur dioxide based on hourly measurements. These areas include: < The Flaherty Marina, < Residential homes southwest of the Stauffer facility along the shore of the Anclote River, < Residential homes west of the Stauffer facility, and < Commercial and industrial businesses east of the Stauffer facility along Anclote Road.
Persons who lived in, worked in, or visited these areas might have experienced the following harmful effects: < changes in lung function (such as, an increase in airway resistance and a narrowing of lung’s
airways,
147
STAUFFER CHEMICAL COMPANY PUBLIC HEALTH ASSESSMENT – FINAL RELEASE
< wheezing and shortness of breath, < increase in heart rate and breathing rate, < cough, and < irritation of the eyes, nose, or throat.
It is important to remember that people who are most sensitive to the effects of sulfur dioxide are those with asthma who were exercising while being exposed to sulfur dioxide. Only at the higher hourly levels detected (600 to 800 ppb) will healthy (non-asthmatic) people experience some of the symptoms of sulfur dioxide exposure.
ATSDR used an air dispersion model to predict sulfur dioxide levels in the surrounding community for times when Stauffer had a major release of sulfur dioxide. This model predicted that significant sulfur dioxide levels moved into the surrounding community. The modeling analysis offers a reasonable account of Stauffer’s past air quality impacts, based on the best available information. Like all modeling analyses, ATSDR’s modeling work for the Stauffer site has some uncertainties. Nevertheless, ATSDR believes that its analysis more likely underestimated Stauffer’s air quality impacts rather than overestimated them.
It is important to remember that exposure to relatively low levels of sulfur dioxide (for example, 100 ppb sulfur dioxide) is not likely to cause noticeable symptoms, such as wheezing or shortness of breath. At 100 ppb sulfur dioxide, only exercising asthmatics have shown responses, and these responses were mild changes in the lung’s airways (specifically, an increase in airway resistance). It should also be pointed out that the human studies conducted at 100 ppb had asthmatics breathe through a mouthpiece, thus increasing their exposure to sulfur dioxide. It is uncertain if exercising asthmatics would experience these mild effects on the lungs if they were exercising and breathing through their mouth and nose. It is also important to know that this increase in airway resistance is temporary and will return to normal shortly after exposure ends. However, as sulfur dioxide levels exceed 500 ppb, some asthmatics will require medication to treat the symptoms of wheezing and shortness of breath.
9.1.1.3 Long-term exposure to sulfur dioxide
Results of air monitoring at the Anclote Road monitoring station and the air dispersion model showed that residents who lived in portions of Tarpon Springs, Holiday Estates, and surrounding areas were likely exposed for many years to elevated yearly sulfur dioxide levels. The sulfur dioxide levels are similar to levels shown in human studies to be associated with a small increase in mortality, particularly in persons with pre-existing lung and heart disease. The increased risk of mortality existed while people were being exposed. Because of the low levels of exposure from 1977 to 1981, it is unlikely that people who were exposed in the past are currently at risk of harmful effects. The areas most impacted by Stauffer emissions are shown in Figure 27 and include the areas covered by the 10 ppb and 5 ppb contours. Some uncertainty exists in these conclusions because (1) the sulfur dioxide exposure levels are estimates based on modeling information rather than actual measurements, and (2) there is considerable uncertainty in our knowledge of health effects associated with long-term human exposure to sulfur dioxide.
148
STAUFFER CHEMICAL COMPANY PUBLIC HEALTH ASSESSMENT – FINAL RELEASE
9.1.1.4. Exposure to fluoride
The limited number of air samples that measured for fluoride did not show fluoride to be a health concern. However, one of the historical air samples showed fluoride levels at Stauffer’s fence line to be slightly above ATSDR’s acute Minimal Risk Level (MRL). Irritant effects from brief exposures to the fluoride level detected seem unlikely because the detected fluoride level was far below the level that caused harmful effects. Firm conclusions, however, cannot be drawn because the sample averaged fluoride levels over 24 hours, which might have masked higher levels of fluoride in a migrating plume. In addition, too few air samples were taken for fluorides when the Stauffer facility was operating to determine what levels of fluorides were being released. ATSDR’s modeling analysis, which was based on the best available emissions data, suggests that ambient air concentrations of fluorides did not exceed levels of health concern. Although this modeling analysis has limitations (most notably that emissions data were not available for every source at the facility), ATSDR is reassured by its previous evaluations of air quality issues at much larger elemental phosphorus production facilities—with very extensive air sampling data for fluorides—which showed no evidence of fluoride exposures at levels of health concern.
9.1.1.5. Exposure to Other Air Pollutants
Residents who lived near the Stauffer facility while it was operating were likely exposed to a number of additional contaminants in air (e.g., metals, phosphorus compounds, inorganic acids); however, the magnitude and impact of these exposures could not be evaluated from available site data and information.
9.1.1.6. Uncertainty in Health Conclusions About Air Pollutants
Some uncertainty exists in ATSDR’s health conclusions, such as
< The accuracy of the estimated levels of PM2.5 for the 1970s and 1980s. Using the limited TSP data from 1977–1981, ATSDR developed our best estimate of what exposures to fine particulates may have been. The methods used and justifications for developing these estimates are provided by ATSDR in the public health assessment.
< Some scientists believe that the associations found in epidemiological studies do not provide conclusive evidence that exposure to ambient levels of particulate matter and sulfur dioxide actually cause adverse cardiopulmonary health effects because a clear biological mechanism, among other things, has yet to be clearly established. While ATSDR acknowledges this uncertainty, using the strong epidemiological evidence, we feel that a number of health effects were possible because of past exposures to Stauffer particulate matter and sulfur dioxide emissions.
< Some studies suggest that certain types of particulate matter may be more or less toxic depending on the size of the particles and the composition. ATSDR has no information
149

STAUFFER CHEMICAL COMPANY PUBLIC HEALTH ASSESSMENT – FINAL RELEASE
to conclude that the particulate matter emitted from Stauffer was any more or less toxic than particulate matter that has been associated with adverse cardiopulmonary health effects in the scientific literature.
< The overall interpretation of the scientific inquiry into the health effects of particulate matter and sulfur dioxide. For example, some suggest that particulate matter and sulfur dioxide can be viewed as a surrogate indicator for the overall mixture of air contaminants, as a specific cause of health effects, or both. Whatever the case, in general, ATSDR believes that reducing particulate matter and sulfur dioxide exposure would be expected to lead to reducing the frequency and severity of the health effects associated with exposure to particulate matter and sulfur dioxide.
< The levels of particulate matter that are considered protective for all segments of the population. ATSDR’s evaluation of the public health implications of exposures to particulate matter incorporates the understanding that no currently established “safe” levels of particulate matter exposure exist.
< The effects on the lungs caused by exposure to 100 ppb sulfur dioxide occurred in subjects who breathed through a mouthpiece while exercising. Whether the same effects would occur in subjects who breathed through their mouth and nose while exercising is uncertain. However, this and other effects were seen in subjects exposed in a chamber to higher levels of sulfur dioxide.
9.1.1.7. Review of Community Health Concerns about Past Stauffer Air Emissions
Some of the health concerns expressed by community members in relation to past air exposures related to the Stauffer facility (e.g., asthma, breathing problems, chronic obstructive pulmonary disease [COPD], and other nonspecific lung diseases) are reasonably consistent, with adverse health outcomes reported in the epidemiologic literature for both acute and chronic exposures to particulate matter (or sulfur dioxide). For asthma, it is important to note that the scientific literature does not currently suggest that PM causes asthma, but that it may exacerbate it. Moreover, there are other known and suspected factors that may trigger asthma. A list of these triggers can be found at http://www.lungusa.org/asthma/astastrig.html and http://www.lungusa.org/asthma/asctriggers.html. The consistency between the community’s health concerns and the epidemiologic studies does not suggest that a specific person’s disease was caused by inhalation exposures to particulate matter. Rather, the cause of any disease is usually a result of multiple factors. For example, smoking is a strong risk factor for many lung and heart diseases. Therefore, smokers make up another population group likely at increased risk for particulate matter-related health effects (EPA 1996). ATSDR has not determined that any of these reported illnesses are elevated in the community in relation to exposures from Stauffer, but only that they are consistent with the findings from the scientific literature.
9.1.2. Contaminants in Private Drinking Water Supplies
150
STAUFFER CHEMICAL COMPANY PUBLIC HEALTH ASSESSMENT – FINAL RELEASE
Two commercial wells and one private well near the Stauffer facility contained arsenic at levels that exceeded EPA’s drinking water standard of 10 ppb. The elevated arsenic levels are not believed to be related to groundwater contamination beneath the Stauffer site.
It is unlikely that children or adults would experience noncancerous harmful effects from drinking water from these wells. A small theoretical increase in the risk of cancer can be calculated should someone drink 8 glasses (2 liters) of water from these wells on a daily basis over a lifetime; however, the risk might also be zero. Uncertainty exists in deciding the risk of cancer because only one well sample is available; therefore, the concentration of arsenic in the well throughout someone’s lifetime may vary. ATSDR’s estimate of a small theoretical increase in the risk of cancer assumes a lifetime of exposure at the arsenic concentration in that one sample.
Four private wells near the Stauffer facility contained lead at levels that exceeded EPA’s action level of 15 ppb. The elevated lead levels are not believed to be related to groundwater contamination beneath the Stauffer site. The highest lead level detected was 270 ppb. This level was detected only one time, which means that those who used this well were probably only exposed to lead for a few months. Lead levels 3 months before and 3 months after the high level were below EPA’s action level. Brief exposures to 270-ppb lead in drinking water for a preschool child might cause changes in blood chemistry, mild effects to the liver, and, for boys, mild effects to the prostate. These effects are also likely for preschool children who used the well that contained 160-ppb lead. For the other two wells that contained 18 and 24- ppb lead, harmful effects are unlikely.
9.1.3. Former Gulfside Elementary Students
ATSDR determined that two primary exposure pathways could have had an impact on children who attended Gulfside Elementary school from 1978–1981. The two exposure pathways are (1) contact with soil and (2) breathing outdoor air.
Soil sampling at the school showed elevated levels of radionuclides; however, the concentrations of radionuclides did not pose a health hazard at the levels measured. The elevated radionuclide levels may have been associated with wind-blown dust from the Stauffer slag processing and loading operation, which was located directly across the street from the school. Arsenic was also detected in soils at the school but not at levels of health concern. In addition, the amount of soil and dust that children in elementary school ingest incidentally during their daily activities is small. Therefore, adverse health effects from exposure of Gulfside Elementary students to contaminants in school soils would not be expected.
Air monitoring data showed that children could have been exposed for brief periods to high levels of sulfur dioxide on some days. However, on most days the wind came from a direction that would have blown the pollution away from the school. These intermittent exposure to high levels of sulfur dioxide might have caused the following symptoms in some children at the time of the exposure in 1978 to 1981: throat irritation, cough, wheezing, and shortness of breath.
151

STAUFFER CHEMICAL COMPANY PUBLIC HEALTH ASSESSMENT – FINAL RELEASE
In addition to brief periods of exposure to high levels of sulfur dioxide, children who attended Gulfside Elementary School might have been exposed to sulfur dioxide for long periods. Results of air monitoring at the Anclote Road monitoring station and the air dispersion model showed that children and adults at Gulfside Elementary School were likely exposed for many years to slightly elevated yearly sulfur dioxide levels. The yearly sulfur dioxide levels are similar to levels shown in human studies to be associated with a small increase in mortality, particularly in people with pre-existing lung and heart disease. The increased risk of mortality existed while people were being exposed. Because of the low levels of exposure from 1977 to 1981, it is unlikely that people who were exposed in the past are currently at risk of harmful effects. The areas most impacted by Stauffer emissions are shown in Figure 27 and include the areas covered by the 10 ppb and 5 ppb contours. Some uncertainty exists in these conclusions because the results are based on modeling information, and some uncertainty exists in the human studies.
The students at Gulfside Elementary School were probably exposed to increased levels of particulate matter (PM) while Stauffer was operating. However, the lack of good information regarding their PM exposures does not allow ATSDR to determine with any certainty if these exposures constituted a hazard. No quality air monitoring data or reliable estimates from computer modeling are available for the school. Because this information is lacking, it was not possible to estimate accurately exposure to PM for children who attended the school. Therefore, it was not possible to determine if particulate matter in air was a hazard to students at the Gulfside school.
It should be noted that the risk of adverse health effects from long-term exposure to sulfur dioxide and particulate matter existed while the students and adults were being exposed. There is uncertainty in estimating health risks for former Gulfside students. The human studies measured sulfur dioxide and particulate matter in the same year that mortality was measured, whereas exposures at Gulfside Elementary School stopped over 20 years ago. Because of the relatively low levels of exposure from 1978 to 1981, it is unlikely that former students and adults who were exposed in the past are currently at risk of harmful effects. Because of the above limitations, ATSDR believes that a scientific study of former Gulfside students would not provide definitive results and, therefore, is not appropriate at this time.
In 2003, ATSDR, in collaboration with the University of South Florida, traced former Gulfside Elementary students who attended the school from 1978 to 1981 (i.e, while the Stauffer plant was in operation.). Nearly 91% of the 615 former students or their family were located by an address. This information will be useful for future dissemination of health information and health education to former students. Note: ATSDR mailed information regarding the findings of the PHA to these former students in February 2004.
9.1.4. Former Stauffer Workers
With regard to exposures of former workers at the Stauffer facility, ATSDR concludes the following:
152
STAUFFER CHEMICAL COMPANY PUBLIC HEALTH ASSESSMENT – FINAL RELEASE
< Former workers at Stauffer were intermittently exposed to asbestos or ACM at levels that indicate an increased theoretical risk of cancer, but it is unlikely (based on air monitoring data) that workers are at risk of asbestosis.
< Former workers at Stauffer were intermittently exposed to chromium at levels that indicate an increased theoretical risk of cancer.
< Former workers at Stauffer were intermittently exposed to carbon monoxide, chromium, hydrogen sulfide, lead, nickel, phosphorus compounds, sulfur dioxide, total dust, quartz, and silica at levels that can cause adverse health effects.
< A majority (78%) of former Stauffer workers were employed for a relatively short period of time. About 22% of the Stauffer workforce was employed for more than 1 year; of these, about 13% worked 5 years or longer.
< ATSDR enumerated the worker cohort as follows: 39% of workers were traced with a full or partial mailing address, 36% of workers were determined to be deceased, and a large percentage of former workers live in the greater Tarpon Springs-New Port Richey area. ATSDR does not have vital status information for about 240 former workers.
< Cause of death was available for 65% of the 864 deceased former workers.
< The leading cause of death was cancer (28%), followed by ischemic heart disease (19%), and then respiratory diseases (9%). Because many death records were not available, this information should be interpreted with caution.
9.1.5. Health Statistics Review
At ATSDR’s request, FDOH conducted a cancer incidence analysis of populations living near Stauffer. ATSDR made the request on behalf of concerned citizens who perceived there to be an excess of cancer and other illnesses among residents who live or lived near the Stauffer facility. The cancers analyzed included bone, brain, leukemia, lung and bronchus, lymphomas, melanoma, mesothelioma, and thyroid cancers.
For the combined years of 1990–1999, SIRs for all cancers examined were less than or equal to what would be expected for the geographic area of interest. However, when examining five year time periods of 1990–1994 and 1995–1999 separately, the rate of mesothelioma in women was significantly elevated during 1990–1994 (3 cases observed, 0.6 cases expected; SIR=5.0; p<0.02). Upon further review, there was no apparent relationship with the Stauffer site for these female cases (and for a spouse with the same last name). In addition, cause of death information for deceased former workers did not show an unusual number of deaths due to lung diseases plausible for Stauffer site contaminants, (e.g., asbestosis).
9.2. Current Site Conditions and Exposures
153
STAUFFER CHEMICAL COMPANY PUBLIC HEALTH ASSESSMENT – FINAL RELEASE
Currently, the Stauffer Chemical Company site is not a public health hazard because people are not being exposed to site contaminants at harmful levels. Since the Stauffer plant ceased operations in 1981, access to the site has been restricted. In addition, most buildings, equipment, and chemicals—which could pose a health and safety hazard—have been removed from the site.
9.2.1. Current Air Exposures
< The levels of TSP, PM10, and PM2.5 were reduced after 1981 when the Stauffer plant stopped operating. Since 1981, the estimated and measured levels of particulate matter in the general vicinity of the former Stauffer plant, and subsequent risk of an adverse heart and lung health outcome, were similar to those in many areas of Florida and the United States.
< Current levels of sulfur dioxide in air are not likely to cause harmful effects in people, including those with asthma.
< Results of air sampling conducted by EPA in the 1990s for fluorides show it is unlikely that fluoride is being released to the air at harmful levels.
9.2.2. Recreational Use of the Anclote River
While a few sediment and surface water samples had levels that exceeded ATSDR comparison values, the levels detected in surface water and sediment are not likely to cause harmful effects because (1) the levels are too low, (2) the frequency of samples with elevated levels are low, (3) people are not likely to drink water from the river consistently, and (4) contact with sediment is limited. Therefore, ATSDR believes that it is safe for people to use the Anclote River for recreational purposes.
9.2.3. Other Current Exposures
The concentrations of radionuclides measured at Gulfside Elementary School do not pose a health hazard to students or staff.
154
STAUFFER CHEMICAL COMPANY PUBLIC HEALTH ASSESSMENT – FINAL RELEASE
9.3. Future Site Conditions and Exposures
9.3.1. Radioactivity in On-Site Slag
Long-term exposure to gamma radiation from radium-226 in on-site slag could pose a public health hazard in the future if the Stauffer site were developed into a residential neighborhood.
9.3.2. Contaminants in On-Site Soil
Long-term exposure to arsenic in on-site soil could pose a future public health hazard if the Stauffer site were developed into a residential neighborhood. This is because accidental ingestion of arsenic-contaminated pond soil over many decades could result in an increased risk of certain cancers.
155

STAUFFER CHEMICAL COMPANY PUBLIC HEALTH ASSESSMENT – FINAL RELEASE
10. RECOMMENDATIONS
ATSDR’s recommendations for the Stauffer site are as follows:
1. Continue to restrict access to the site to prevent exposure to site contaminants, including radiation in on-site slag and arsenic in on-site soil. Also, establish institutional controls (e.g., deed restrictions) to prevent development of the site for residential use. (Note: In their comments on the initial release public health assessment, Stauffer Management Company indicated that they already agreed to deed-restrict the site so that it is never considered for residential development.)
2. Provide health education to former Stauffer workers.
3. Provide health education to local health care providers.
4. Provide health education to area residents and persons who attended Gulfside Elementary from 1978 through 1981.
5. Provide a summary fact sheet about the public health assessment in Greek to meet the needs of the Tarpon Springs community.
6. Develop and implement follow-up health activities for former Stauffer workers, including a mortality study and a respiratory health evaluation program.
7. For public health surveillance and health information purposes, evaluate the incidence of mesothelioma and lung cancer in areas surrounding the Stauffer site.
Note: Some of the above recommendations may have already been implemented, as discussed under Actions Completed in the Public Health Action Plan that follows.
156
STAUFFER CHEMICAL COMPANY PUBLIC HEALTH ASSESSMENT – FINAL RELEASE
11. PUBLIC HEALTH ACTION PLAN
The public health action plan (PHAP) contains a description of public health actions that have been, are being, or will be taken by ATSDR and others at the Stauffer site. The purpose of the PHAP is to ensure that this public health assessment not only identifies public health hazards associated with the site, but also provides a plan of action to prevent or minimize the potential for adverse human health effects from exposure to site-related hazardous substances.
11.1 Actions Completed
1. In June 2001, ATSDR staff visited the Stauffer Chemical site and Tarpon Springs area, discussed the agency’s proposed public health response plan for the site at a town hall meeting sponsored by Congressman Michael Bilirakis, and met with community members one-on-one to listen to their health concerns.
2. In August 2001, ATSDR met with community representatives to introduce the overall Neighbor-2-Neighbor (N-2-N) plan and to discuss specific ATSDR activities to deal with radiation/slag concerns.
3. In fall 2001, ATSDR contracted with the University of South Florida, Department of Epidemiology, to identify and locate former employees of Stauffer plant and persons who attended Gulfside Elementary School from 1978–1981 for possible followup health study or health education activities.
4. In January 2002, ATSDR developed and distributed the first site newsletter (“ATSDR Community Update: Stauffer Chemical Co. Site, Tarpon Springs, FL, Winter 2002"). The purpose of the newsletter was to provide area residents with up-to-date information regarding ATSDR’s activities for the Stauffer site.
5. In January 2002, ATSDR released a draft public health consultation that evaluated exposure of area residents to radiation from phosphorus slag in their communities. The health consultation concluded that radiation exposures of area residents to off-site slag is not a public health hazard.
6. In January 2002, ATSDR staff and a radiation expert from outside the government met with community members in Tarpon Springs to discuss ATSDR’s radiation consult and issues related to radiation and off-site slag.
7. In April 2002, ATSDR staff met with community representatives to provide an update on our public health assessment and health consultation activities.
8. In August 2002, ATSDR developed and distributed the second site newsletter (summer 2002).
9. In November 2002, ATSDR submitted the draft Stauffer public health assessment to five external peer reviewers and to appropriate government agencies (e.g., EPA, FDOH) for review and comment.
157
STAUFFER CHEMICAL COMPANY PUBLIC HEALTH ASSESSMENT – FINAL RELEASE
10. In late 2002 and early 2003, ATSDR, in conjunction with the Florida Department of Health, reviewed information from the Florida cancer registry and death certificates for the three cases of mesothelioma that were identified in the site area.
11. In late 2002 and early 2003, ATSDR, with the assistance of the University of South Florida, identified and located former employees of the Stauffer plant and persons who attended Gulfside Elementary School from 1978–1981 for possible followup health study or health education activities.
12. In early 2003, ATSDR reviewed the peer reviewers’ comments on the PHA and revised the PHA, where necessary, in response to those comments.
13. On April 2, 2003, ATSDR released the PHA for public comment and sent copies of the document via overnight mail to elected officials and to federal, state, and county agencies, community representatives, and the Tarpon Springs Library.
14. On April 7 and 8, 2003, ATSDR held meetings and poster sessions with community representatives, SMC officials, the community-at-large, and local news media to explain the findings of the PHA and to answer related questions.
15. On July 31, 2003, ATSDR held a 1-day scientific panel meeting in Atlanta, GA, to identify possible follow-up health activities for former Stauffer workers. Selected community representatives and news reporters attended the meeting as observers. The expert panel provided two suggestions for ATSDR to consider regarding possible follow-up activities for former Stauffer production workers: (1) conduct a mortality study, and (2) conduct medical screening for those who were employed at Stauffer for several years.
16. In October 2003, ATSDR staff (1) visited the Stauffer Chemical site and Tarpon Springs area, and (2) participated in a town hall meeting sponsored by Congressman Michael Bilirakis. At the town hall meeting, ATSDR staff discussed the agency’s current and future activities for the site and distributed the agency’s third site newsletter (fall 2003).
17. In early 2004, ATSDR mailed a letter to students who attended Gulfside Elementary School from 1978 through 1981 (the years that students were at the school while the Stauffer plant was in operation.) The purpose of the letter was to inform these students of the findings of ATSDR’s public health assessment related to Gulfside Elementary. Included with the letter were several site-related fact sheets, including a fact sheet regarding exposures at Gulfside Elementary.
18. ATSDR reviewed information provided by the Pinellas County Department of Health regarding residential and commercial wells that contained elevated levels of arsenic and lead. This information, which was received subsequent to release of the public health assessment for public comment, was used to determine which wells were still in use and to ensure that the users of these wells were aware of the sampling results for their wells.
19. ATSDR reviewed the Final Groundwater Studies Report (Parsons, July 2004) and the Final Geophysical Studies Report (O’Brien & Gere, July 2004) and incorporated information from
158

STAUFFER CHEMICAL COMPANY PUBLIC HEALTH ASSESSMENT – FINAL RELEASE
these two reports into the final public health assessment, where appropriate. These two reports were not available when the public health assessment was released for public comment.
20. ATSDR provided health information to area residents and former Gulfside students through (1) distribution of community newsletters (in January 2002, July 2002, October 2003, and December 2004); (2) distribution of chemical-specific and exposure-related fact sheets and booklets; and (3) discussions at community meetings, public availability/poster sessions, and town-hall meetings (in August 2001, January 2002, May 2002, April 2003, and October 2003). As previously noted, in February 2004, ATSDR mailed a letter and several exposure-related fact sheets to former Gulfside students who attended the school while the Stauffer plant was in operation (i.e., from 1978 through 1981).
11.2 Actions In Progress
1. ATSDR is conducting a mortality study of deceased former Stauffer workers. The study will look at the cause of death for each former worker who died before January 1, 2003. Currently, ATSDR is in the data collection phase of the study. The study report should be available in late 2005.
2. ATSDR is conducting respiratory health evaluations for select former Stauffer workers who were employed 5 years or longer in phosphate ore processing or phosphorus production activities. Medical evaluations are being conducted from October 2004 through April 2005 at a clinic in Holiday, Florida. A community report is planned for release in early summer 2005.
3. ATSDR is working with the Florida Department of Health (FDOH) to evaluate the incidence of mesothelioma and lung cancer in the four Census Tracts surrounding the Stauffer site for years 2000–2002. This follow-up activity is being conducted for public health surveillance reasons and is not necessarily focused on a particular site or contaminant source. Data analysis is in progress and results should be available by spring 2005.
11.3. Actions Planned
1. ATSDR will provide health education, including information about preventing respiratory diseases, to former Stauffer workers by summer 2005.
2. ATSDR, by summer 2005, will provide to local health care providers health education, including guidance for taking patients’ environmental exposure histories and contaminant-specific case studies and fact sheets.
3. ATSDR will translate the fact sheet entitled “ATSDR Final Public Health Assessment for the Stauffer Chemical Company Site, Tarpon Springs, Florida (March 2005)” into Greek and make it available to members of the Tarpon Springs community whose primary language is Greek.
4. ATSDR will continue to provide periodic updates regarding its health activities for the Stauffer site, including activities for former Stauffer workers, to federal, state, and local authorities and area residents. These updates will be provided through established
159

STAUFFER CHEMICAL COMPANY PUBLIC HEALTH ASSESSMENT – FINAL RELEASE
communication mechanisms for the Stauffer site, such as, the periodic ATSDR Community Update newsletter.
160
STAUFFER CHEMICAL COMPANY PUBLIC HEALTH ASSESSMENT – FINAL RELEASE
12. PREPARERS OF REPORT
Stephen C. Richardson, B.S. Environmental Health Scientist Division of Health Assessment and Consultation, ATSDR
David N. Mellard, Ph.D. Toxicologist Division of Health Assessment and Consultation, ATSDR
Greg Ulirsch, M.S. Environmental Health Engineer Division of Health Assessment and Consultation, ATSDR
Michael Brooks, CHP Health Physicist Division of Health Assessment and Consultation, ATSDR
Robert B. Knowles, M.S., REHS Environmental Health Scientist Division of Health Assessment and Consultation, ATSDR
John Wheeler, Ph.D. Toxicologist Division of Health Assessment and Consultation, ATSDR
La Freta Dalton, BBA Health Communications Specialist Division of Health Assessment and Consultation, ATSDR
PerStephanie Thompson, B.A. Health Communications Specialist (currently with National Center for Chronic Disease Prevention and Health Promotion; formerly with Division of Health Assessment and Consultation, ATSDR)
Azania Heyward-James, M.Ed. Health Education Specialist Division of Health Education and Promotion, ATSDR
Steve Inserra, M.P.H., RS Environmental Health Scientist Division of Health Studies, ATSDR
161

STAUFFER CHEMICAL COMPANY PUBLIC HEALTH ASSESSMENT – FINAL RELEASE
Betty Phifer, M.S. Environmental Health Scientist (retired; formerly with Division of Health Studies, ATSDR)
ATSDR Regional Representative:
Carl Blair Public Health Advisor ATSDR Region IV
Technical Consultants:
Naida Gavrelis Senior Public Health Scientist Eastern Research Group Lexington, MA
John Wilhelmi Senior Chemical Engineer Eastern Research Group Lexington, MA
162

STAUFFER CHEMICAL COMPANY PUBLIC HEALTH ASSESSMENT – FINAL RELEASE
13. REFERENCES
[AAS Inc] Ambient Air Services, Inc. 1995. Annual Report: Anclote Site Ambient Air Monitoring Program (January 1, 1994 - December 31, 1994).
[AAS Inc] Ambient Air Services, Inc. 1996. Annual Report: Anclote Site Ambient Air Monitoring Program (January 1, 1995 - December 31, 1995).
[AAS Inc] Ambient Air Services, Inc.1997. Annual Report: Anclote Site Ambient Air Monitoring Program (January 1, 1996 - December 31, 1996).
[AAS Inc] Ambient Air Services, Inc.1998. Annual Report: Anclote Site Ambient Air Monitoring Program (January 1, 1997 - December 31, 1997).
[AAS Inc] 1999. Ambient Air Services, Inc Annual Report: Anclote Site Ambient Air Monitoring Program (January 1, 1998 - December 31, 1998).
[ACGIH] American Conference of Governmental Industrial Hygienists. 2002. Threshold limit values for chemical substances and physical agents and Biological Exposure Indices. Cincinnati, OH: American Conference of Governmental Industrial Hygienists.
[ATSDR] Agency for Toxic Substances and Disease Registry. 1990. Toxicological profile for radium. Atlanta: US Department of Health and Human Services.
[ATSDR] Agency for Toxic Substances and Disease Registry. 1993. Preliminary Public Health Assessment for Stauffer Chemical Company/Tarpon Springs, Pinellas County, Tarpon Springs, Florida. Atlanta: ATSDR, August 4, 1993.
[ATSDR] Agency for Toxic Substances and Disease Registry. 1997a. Toxicological profile for white phosphorus. Atlanta: US Department of Health and Human Services.
[ATSDR] Agency for Toxic Substances and Disease Registry. 1997b. Toxicological profile for nickel. (update) Atlanta: US Department of Health and Human Services.
[ATSDR] Agency for Toxic Substances and Disease Registry. 1998. Toxicological profile for sulfur dioxide. Atlanta: US Department of Health and Human Services.
[ATSDR] Agency for Toxic Substances and Disease Registry. 1999a. Health consultation, Tarpon Springs private wells. Stauffer Chemical Company (Tarpon Springs), Tarpon Springs, Pinellas County, Florida. Atlanta: US Department of Health and Human Services.
[ATSDR] Agency for Toxic Substances and Disease Registry. 1999b. Toxicological profile for ionizing radiation. Atlanta: US Department of Health and Human Services.
[ATSDR] Agency for Toxic Substances and Disease Registry. 1999c. Toxicological profile for hydrogen sulfide. Atlanta: US Department of Health and Human Services.
163

STAUFFER CHEMICAL COMPANY PUBLIC HEALTH ASSESSMENT – FINAL RELEASE
[ATSDR] Agency for Toxic Substances and Disease Registry. 1999d. Health consultation, Holiday Utilities. Tarpon Springs, Pinellas County, Florida. Atlanta: US Department of Health and Human Services.
[ATSDR] Agency for Toxic Substances and Disease Registry. 1999e. Public Health Assessment Addendum for Stauffer Chemical Company, Tarpon Springs, Florida.
[ATSDR] Agency for Toxic Substances and Disease Registry. 1999f. Toxicological profile for lead (update). Atlanta: US Department of Health and Human Services
[ATSDR] Agency for Toxic Substances and Disease Registry. 2000a. Ombudsman report of findings and recommendations regarding the Stauffer Chemical Company site, Tarpon Springs, Florida. Atlanta: US Department of Health and Human Services.
[ATSDR] Agency for Toxic Substances and Disease Registry. 2000b Toxicological profile for arsenic (update). Atlanta: US Department of Health and Human Services.[ATSDR] Agency for Toxic Substances and Disease Registry.
[ATSDR] Agency for Toxic Substances and Disease Registry. 2000c. Toxicological profile for chromium (update). Atlanta: US Department of Health and Human Services.
[ATSDR] Agency for Toxic Substances and Disease Registry. 2001a. Toxicological profile for fluorides, hydrogen fluoride, and fluorine [draft]. Atlanta: US Department of Health and Human Services.
[ATSDR] Agency for Toxic Substances and Disease Registry. 2001b. Health Consultation. Eastern Michaud Flats Contamination–Air Contamination. Pocatello, Bannock and Power Counties, Idaho, March 6, 2001. Atlanta: US Department of Health and Human Services.
[ATSDR] Agency for Toxic Substances and Disease Registry. 2001c. Toxicological profile for asbestos (update). Atlanta: US Department of Health and Human Services.
[ATSDR] Agency for Toxic Substances and Disease Registry. 2002. Health Consultation. Evaluating Dose Measurements of Gamma Radiation for Residents near the Stauffer Chemical Company Superfund Site and Vicinity Properties. Tarpon Springs and Holiday, Florida. July 1, 2002. Atlanta: US Department of Health and Human Services.
Amdur MO, Melvin WW, Drinker P. 1953. Effects of inhalation of sulphur dioxide by man. Lancet 2:758–9.
Black and Veatch Special Projects Corp. 2000. Final data evaluation report. Stauffer Chemical Company Superfund site, Tarpon Springs, Florida. Kansas City, MO: Black and Veatch Special Projects Corp.
Balmes JR, Fine JM, Sheppard D. 1987. Symptomatic bronchoconstriction after short-term inhalation of sulfur dioxide. Am Rev Respir Dis 136:1117–21.
164
STAUFFER CHEMICAL COMPANY PUBLIC HEALTH ASSESSMENT – FINAL RELEASE
Bethel RA, Erle DJ, Epstein J, Sheppard D, Nadel JA, Boushey HA. Effect of exercise rate and route of inhalation on sulfur dioxide induced bronchoconstriciton in asthmatic subjects. 1983. American Reviews Respiratory Disease 128:592-596.
Bethel RA, Shepard D, Epstein J, Tam E, Nadel JA, Boushey HA. 1984. Interaction of sulfur dioxide and dry cold air in causing bronchoconstriction in asthmatic subjects. J Appl Physiol 57:419–23.
Bethel RA, Shepard D, Geffroy B, Tam E, Nadel JA, Boushey HA. 1985. Effects of 0.25 ppm sulfur dioxide on airway resistance in freely breathing, heavily exercising, asthmatic subjects. Am Rev Respir Dis 131:659–61.
Block G, Matanoski GM, Selster R, and Mitchell T.1988. Morbidity and mortality in phosphate workers. Cancer Research, 48:7298-7303
Centers for Disease Control and Prevention. 2003. Pneumoconiosis prevalence among working coal miners in Federal chest radiograph surveillance programs.1996-2002. Morbidity and Mortality Weekly Report (MMWR). US Department of Health and Human Services. April 18, 2003. 52(15);336-340.
Checkoway H, Heyer, NJ, Demers, PA. 1996. An updated mortality follow-up study of Florida phosphate industry workers. Am J Ind Med 30:452–60.
Checkoway H, Ravi MM, John MS, Hickey LS, Shy CM, Harris RL, Hunt EW, and Waldman GT. 1985. Mortality among workers in the Florida phosphate industry: cause-specific mortality relationships with work areas and exposures. Journal of Occupational Medicine, Vol. 72 12:893-896.
Checkoway H, Ravi MM, John MS, Hickey LS, Shy CM, Harris RL, Hunt EW, and Waldman GT. 1995. Mortality among workers in the Florida phosphate industry: industry-wide cause-specific mortality patterns. Journal of Occupational Medicine, Vol. 72 12:885-892.
Chen M, MA LQ, Harris WG. 1999. Baseline Concentrations of 15 Elements in Florida Surface Soils. J Environ Qula 28:1173-81.
Chiou H-Y, Huang W-I, Su C-L. 1997. Dose-response relationship between prevalence of cerebrovascular disease and ingested inorganic arsenic. Stroke 28(9):1717-1723.
Dames and Moore. 1978. Dispersion Modeling Analyses of Atmospheric Emissions from the Stauffer Chemical Company Phosphate Processing Facility near Tarpon Springs, Florida. Prepared for the Stauffer Chemical Company. August 15, 1978.
Davis, B.C. 1980. Interoffice Memorandum from B.C. Davis, Stauffer Chemical Company, to J. Stark (and others). June 27, 1980
165
STAUFFER CHEMICAL COMPANY PUBLIC HEALTH ASSESSMENT – FINAL RELEASE
Dockery DW, Pope CA, Xu X, Spengler JD, Ware JH, Fay ME, et al. 1993. An association between air pollution and mortality in six U.S. cities. N Engl J Med 329(24):1753–9.
Dodge R, Solomon, P, Moyers J, et al. 1985. A longitudinal study of children exposed to sulfur oxides. American Journal of Epidemiology 1985;121:730-736.
Dominici, F, et al. 2002. A Report to the Health Effects Institute: Reanalysis of the NMMAPS Database. Baltimore, MD: Available from URL: http://www.biostat.jhph.edu/fdominic/HEI/ nmmaps.html [accessed February 4, 2002].
[DOL] Department of Labor. 1975. Occupational exposure to sulfur dioxide. Fed Reg 1975;40:54520–34.
[EE&G] Evans Environmental & Geological Science Management, Inc. 1997a. Gulfside Elementary School Environmental Monitoring Program 1997. Evans Environmental & Geological Science and Management, Inc. Prepared for the District School Board of Pasco County. Summer 1997.
George, J.1978. Interoffice Memorandum from Larry George (State of Florida Department of Environmental Regulation) to Dave Puchaty. "North Pinellas County Sulfur Dioxide Ambient Air Violations - Review of Recent Reports and Recommendations for Further Action." October 23, 1978.
Guderman WJ, McConnell R, Gilliand F, London L, Thomas D, Avol E et al. 2000. Association between air pollution and lung function growth in southern California children. American Journal of Respiratory and Critical Care Medicine. Volume 162:1383-1390.
[EE&G] Evans Environmental & Geological Science Management, Inc (EE&G) 1997b. Results of Radionuclide Analysis on Construction Materials, Gulfside Elementary School (Letter Report). October 29, 1997.
[EPA] US Environmental Protection Agency. 1986. Review of the National Ambient Air Quality Standards for sulfur oxides: updated assessment of the scientific and technical information, addendum to the 1982 OAQPS Staff Paper. Research Triangle Park, NC: US Environmental Protection Agency, Office of Air Quality Planning and Standards.
[EPA] U.S. Environmental Protection Agency. 1987. Air Monitoring Study: Stauffer Chemical Company Site, Tarpon Springs, Florida. EPA Region IV: Environmental Services Division. November 16–20, 1987.
[EPA] U.S. Environmental Protection Agency. 1994. Methods for Derivation of Inhalation Reference Concentrations and Application of Inhalation Dosimetry. Research Triangle Park, NC: US Environmental Protection Agency, Environmental Criteria and Assessment Office, EPA/600/8-90/066F.
166
STAUFFER CHEMICAL COMPANY PUBLIC HEALTH ASSESSMENT – FINAL RELEASE
[EPA] US Environmental Protection Agency. 1995a. 1995 national air quality: status and trends. Washington, DC: US Environmental Protection Agency. Available from URL: www.epa/gov/oar/aqtrnd95/so2.html [accessed May 2002].
[EPA] US Environmental Protection Agency. 1995b. Compilation of Air Pollutant Emission Factors AP-42, Fifth Edition, Volume I: Stationary Point and Area Sources. U.S. Environmental Protection Agency, Research Triangle Park, NC, January 1995.
[EPA] US Environmental Protection Agency. 1996. Air quality criteria for particulate matter. Washington, DC: US Environmental Protection Agency, National Center for Environmental Assessment. Rpt. No.: EPA/600/P-95/001aF.
[EPA] US Environmental Protection Agency. 1997. Fact sheet: EPA’s revised particulate matter standards. Washington, DC: US Environmental Protection Agency, Office of Air Quality Planning and Standards.
[EPA] U.S. Environmental Protection Agency. 1999a. Slag Sampling in Tarpon Springs and Surrounding Counties. Region 4. Waste Management Division. January 12, 1999.
[EPA] U.S. Environmental Protection Agency. 1999b. Technical Support Document: Federal Implementation Plan for the FMC Facility in the Fort Hall PM10 Nonattainment Area. EPA Region 10. January 20, 1999.
[EPA] U.S. Environmental Protection Agency 2000. Meteorological Monitoring Guidance for Regulatory Modeling Applications. U.S. EPA, Office of Air Quality Planning and Standards. U.S. Environmental Protection Agency EPA-454/R-99-005. February 2000.
[EPA] U.S. Environmental Protection Agency 2001. National Ambient Air Quality Standards for Sulufr Oxides (Sulfur Dioxide); Availability of Information. Federal Register 66(6):1665-1668. January 9, 2001.
[EPA] U.S. Environmental Protection Agency 2002a. Ambient air monitoring data downloaded from EPA’s Aerometric Information Retrieval System (AIRS). Query performed in March 2002.
[EPA] U.S. Environmental Protection Agency 2002b. EPA’s SPECIATE v3.1 database. [accessed in June 2002.]
[EPA] U.S. Environmental Protection Agency. 2002c. Draft Air quality criteria for particulate matter. Washington, DC: US Environmental Protection Agency, National Center for Environmental Assessment. Rpt. No.: EPA/600/P-99/002bC.
[FDEP] Florida Department of Environmental Protection. 1998. Biological assessment of the Anclote River watershed, March 5, 1997. Tallahassee, FL: Florida Department of Environmental Protection. Report No.: 98-002. Available from URL: www.dep.state.fl.us/water/bioassess/docs/biorepts/otherepts/anclote.pdf.
167
STAUFFER CHEMICAL COMPANY PUBLIC HEALTH ASSESSMENT – FINAL RELEASE
[FDOH] Florida Department of Health. No date. Health advisories. Tallahassee, FL: Florida Department of Health. Available from URL: floridafisheries.com/health.html.
[FDOH] Florida Department of Health.1997. Water Quality Analysis (results and letters). 1997.
[FDOH] Florida Department of Health. 2002a. Bureau of Radiation Control. Radiological Incident Final Reports in Response to Citizen Concerns (Letter Report). May 28, 2002.
[FDOH] Florida Department of Health. 2002b. Well information. Pasco and Pinellas Counties. wells in pasco & pinellas county_G.Hoover.xls. Received June 5, 2002.
[Flow] Flow Science Inc. 2001. On-site and Off-site Groundwater Investigations. Stauffer Tarpon Springs Site. July 24, 2001.
Frank NR, Amdur MO, Worcester J, Whittenberger TL. 1962. Effects of acute controlled exposure to sulfur dioxide on respiratory mechanics in healthy male adults. J Appl Physiol 17(2):252–8.
Gauderman, W.J., McConnell, R., Gillidand, F., London, S., Thomas, D., Avol, E., Vora, H., Berhane, K., Rappaport, E.B., Lurmann, F., Margolis, H.G., Peters, J. 2000. Association between Air Pollution and Lung Function Growth in Southern California Children. American Journal of Respiratory and Critical Care Medicine 162: 1383-1390.
Ghio, A.J., Kim, C., Devlin, R.B. 2000. Concentrated Ambient Air Particles Induce Mild Pulmonary in Health Human Volunteers. American Journal of Respiratory Critical Care Medicine 162: 981-988.
Godleski JJ, Verrier RL, Koutrakis P, Catalano P. 2000. Mechanisms of morbidity and mortality from exposure to ambient air particles. Cambridge, MA: Health Effects Institute.
Gold, D.R., Litonjua, A., Schwartz, J. 2002. Ambient Air Pollution and Heart Rate Variability. Circulation 10(11): 1267-1273.
Ha EH, Lee JT, Kim H, Hong YC, Lee BE et al. 2003. Infant susceptibility of mortality to air pollution in Seoul, South Korea. Pediatrics Volume 111, 2:284-290.
Horstman D, Roger LJ, Kehrl H, Hazucha M. 1986. Airway sensitivity of asthmatics to sulfur dioxide. Toxicol Ind Health 2:289–98.
Islam MS, Neuhann HF, Grzegowski E, et al. 1992. Bronchomotoric effect of low concentration of sulfur dioxide in young healthy volunteers. Fresenius Envir Bull 1:541–6.
Kehrl HR, Roger LJ, Hazucha MJ, Horstman DH. 1987. Differing response of asthmatics to sulfur dioxide exposure with continuous and intermittent exercise. Am Rev Respir Dis 135:350–5.
168

STAUFFER CHEMICAL COMPANY PUBLIC HEALTH ASSESSMENT – FINAL RELEASE
Kelly. 2002. Letter from Mike Kelly (McCarter & English, LLP) to Steve Richardson (ATSDR). June 14, 2002.
Koenig JQ, Pierson WE, Korike M, Frank R. 1982. Effects of inhaled sulfur dioxide (SO2) on pulmonary function in healthy adolescents: exposure to SO2 alone or SO2 + sodium chloride droplet aerosol during rest and exercise. Archives of Environmental Research 37:5-9.
Koenig JQ; Pierson We, Horike M, Frank R. 1981. Effects of SO2 plus NaCl aerosol combined with moderate exercise on pulmonary function in asthmatic adolescents. Environmental Research 25:340-48.
Koenig JQ, Morgan MS, Horike M, Pierson WE. 1985. The effects of sulfur oxides on nasal and lung function in adolescents with extrinsic asthma. J Allergy Clin Immunol 76(6):813–8.
Koenig JQ, Covert DS, Pierson WE. 1989. Effects of inhalation of acidic compounds of pulmonary function in allergic adolescent subjects. Environ Health Perspect 79:173–8.
Koenig JQ, Dumler K, Rebolledo V, Williams PV, Pierson WE. 1993. Respiratory effects of inhaled sulfuric acid on senior asthmatics and nonasthmatics. Arch Environ Health 48:171–5.
Krewski D, Burnett RT, Goldberg MS, Hoover K, Siemiatycki J, Jerrett M, et al. 2000. Reanalysis of the Harvard Six Cities study and the American Cancer Society study of particulate matter air pollution and mortality. A special report of the Institute’s Particle Epidemiology Reanalysis Project. Cambridge, MA: Health Effects Institute.
Lawther PJ, Macfarlane AJ, Waller RE, Brooks AG. 1975. Pulmonary function and sulfur dioxide, some preliminary findings. Environ Res 10:355–67.
Lianfang W, Jianzhong H. 1994. Chronic arsenism from drinking water in some areas of Xinjiang, China. In: Nriagu JO, ed. Arsenic in the Environment: Part II: Human health and ecosystem effects. New York, NY: John Wiley and Songs, Inc., 159-172.
Liao, D., Creason, J., Shy, C., Williams, R., Watts, R., Zweidinger, R. 1999. Daily Variation of Particulate Air Pollution and Poor Cardiac Autonomic Control in the Elderly. Environmental Health Perspectives 107: 521-525.
Linn WS, Vinet TG, Shamoo DA, Valencia LM, Anzar UT, Spier CE, et al. 1983. Respiratory effects of sulfur dioxide in heavily exercising asthmatics. Am Rev Respir Dis 127:278–83.
Linn WS, Avol EL, Shamoo DA, Vinet TG, Anderson KR, Whynot JD, et al. 1984a. Asthmatics ’ responses to 6-hr sulfur dioxide exposures on two successive days. Arch Environ Health 39:313–9.
Linn WS, Shamoo DA, Vinet TG, et al. 1984b. Combined effect of sulfur dioxide and cold in exercising asthmatics. Arch Environ Health 39:339-46.
169

STAUFFER CHEMICAL COMPANY PUBLIC HEALTH ASSESSMENT – FINAL RELEASE
Linn WS, Shamoo DA, Vinet TG, Bailey RM, Wightman LH, Hackney JD. 1984c. Comparative effects of sulfur dioxide exposures at 5 degrees C and 22 degrees C in exercising asthmatics. Am Rev Respir Dis 129:234–9.
Linn WS, Shamoo DA, Anderson KR, Whynot JD, Avol EL, Hackney JD. 1985. Effects of heat and humidity on the responses of exercising asthmatics to sulfur dioxide exposure. Am Rev Respir Dis 131:221–5.
Linn WS, Avol EL, Peng RC, Shamoo DA, Hackney JD. 1987. Replicated dose-response study of sulfur dioxide effects in normal, atopic, and asthmatic volunteers. Am Rev Respir Dis 136(5):1127–34.
Magnani C, Dalmasso P, Biggeri A, Ivaldi C, Mirabelli D, and Terracini B. 2001. Increased risk of malignant mesothelioma of the pleura after residential or donestic exposure to asbestos: A case-control study in Casale Monferrato, Italy. Environ Health Perspectives, Volume 109, No. 9:915-919.
Mazumder DHG, Haque R, Ghosh N, De BK, Santra A, Chakraborty D, Smith AH. 1998. Arsenic levels in drinking water and the prevalence of skin lesions in West Bengal, India. International Journal of Epidemiology 27:871-877. Myers DJ, Bigby BG, Boushey HA. 1986a. The inhibition of sulfur dioxide-induced bronchoconstriction in asthmatic subjects by cromolyn is dose dependent. Am Rev Respir Dis 133:1150-3.
Myers DJ, Bigby BG, Calvayrac P, Sheppard D, Boushey HA. 1986b. Interaction of cromolyn and a muscarinic antagonist in inhibiting bronchial reactivity to sulfur dioxide and to eucapnic hyperpnea alone. Am Rev Respir Dis 133:1154–8.
[NCDC] National Climatic Data Center. 2002. Meteorological data for St. Petersburg/Clearwater Airport and Tampa International Airport. Electronic file received May 14, 2002.
[NIOSH] National Institute for Occupational Safety and Health. 1999. Preventing phosphine poisoning and explosions during fumigation. Washington, DC: US Department of Health and Human Services.
[NIOSH] National Institute for Occupational Safety and Health. 2001. Pocket guide to chemical hazards. Washington, DC: US Department of Health and Human Services.
[NIOSH] National Institute for Occupational Safety and Health. 2002. Health effects of occupational exposure to respirable crystalline silica. Washington, DC: US Department of Health and Human Services.
[NUS] NUS Corporation. 1989. Final expanded site inspection report. Stauffer Chemical Company Site. Tarpon Springs, Pinellas County, Florida Volume 1. Revision 1. Rockville, MD: NUS Corporation. Apr 5.
170

STAUFFER CHEMICAL COMPANY PUBLIC HEALTH ASSESSMENT – FINAL RELEASE
[NUS] NUS Corporation. 1991. Interim final listing site inspection report. Stauffer Chemical Company Site. Tarpon Springs, Pinellas County, Florida. Revision 2. Rockville, MD: NUS Corporation. Mar 11.
[O’Brien & Gere] O’Brien & Gere Engineers, Inc. Geophysical Studies Report (Final). Stauffer Management Company. Tarpon Springs, Florida. July 2004.
[OSHA] Occupational Safety and Health Administration. 1991. Air contaminants, 29 C.F.R. Part 1910, Table Z-1-A. Washington: U.S. Government Printing Office.
[Parsons] Parsons Engineering Science, Inc. 1997. Soil/Slag Leachability Report. Volume I. Technical Report. November 1997.
[Parsons] Parsons Engineering Science, Inc. 1999. Baseline groundwater monitoring report. Stauffer Management Company. Tarpon Springs, Florida. Volume I. Pasadena, CA: Parsons Engineering Science, Inc.
[Parsons] Parsons Engineering Science, Inc. 2002. Groundwater studies work Plan. Stauffer Chemical Company Superfund Site, Tarpon Springs, Florida. Pasadena, CA: Parsons Engineering Science, Inc.
[Parsons] Parsons Engineering Science, Inc. 2004. Groundwater Studies Report (Final). Stauffer Management Company. Tarpon Springs, Florida. July 2004.
[PBS&J] Post, Buckley, Schuh, and Jernigan. 1982. Stauffer Chemical Company. Waste sludge management study, phase 1: evaluation of existing waste sludge lagoon system.
[PBS&J] Post, Buckley, Schuh, and Jernigan. 1990. Radiological Evaluation of the ICI Americas Property, Tarpon Springs, Florida. November 1990.
[PCDEM] Pinellas County Department of Environmental Management. 1979. Letter to P. David Puchaty, Florida Department of Environmental Regulation, from Stephen Peacock concerning particulate clouds an Flaherty Marina. Clearwater, Florida. August 13, 1979.
[PCDEM] Pinellas County Department of Environmental Management. 2002. Meteorological data provided by PCDEM. Electronic file received June 6, 2002.
[PEDCo] PEDCo Environmental. 1972. Emission Testing Report; Project Number 72MM05. PEDCo Environmental Specialists, Inc. Prepared for EPA.
[PEDCo] PEDCo Environmental. 1979. Field Inspection Report, Stauffer Chemical Company, Tarpon Springs, Florida. Prepared by PEDCo Environmental, Inc. Prepared for U.S. Environmental Protection Agency. December 1979.
Peters, A., Doring, A., Wichmann, H.E., Koenig, W. 1997. Increased Plasma Viscosity During an Air Pollution Episode: A Link to Mortality? Lancet 349: 1582-1587.
171
STAUFFER CHEMICAL COMPANY PUBLIC HEALTH ASSESSMENT – FINAL RELEASE
Peters, A., Perz, S., Doring, A., Stieber, J., Koenig, W., Wichmann, H.E. 1999. Increases in Heart Rate During an Air Pollution Episode. American Journal of Epidemiology 150: 1094-1098.
Peters, A., Liu, E., Verrier, R.L., Schwartz, J., Gold, D.R., Mittleman, M.., Baliff, J., Oh, J.A., Allen, G., Monahan, K., Dockery, D.W. 2002. Air Pollution and Incidence of Cardiac Arrhythmia. Epidemiology 11: 11-17.
Pinellas County Health Department. 1990. Memo/hard copy results of 1990 private well sampling.
Pinellas County Health Department. 2002. Results of private well sampling 1999, 2000, and 2001. Smcpwells99_00_01.xls. Received February 13, 2002.
Pope C.A, Thun MJ, Namboodiri MM, Dockery DW, Evans JS, Speizer FE, et al. 1995. Particulate air pollution as a predictor of mortality in a prospective study of U.S. adults. Am J Respir Crit Care Med 151:669–74.
Pope, C.A., Verrier, R.L., Lovett, E.G., Larson, A.C., Raizenne, M.E., Kanner, R.E., Schwatz, J., Villegas, G.M., Gold, D.R., Dockery, D.W. 1999. Heart Rate Variability Associated with Particulate Air Pollution. American Heart Journal 138: 890-899.
Pope C.A. 2000. Epidemiology of fine particle air pollution and human health: biological mechanisms and who’s at risk? Environ Health Perspect 108(suppl 4):713–23.
Pope C.A., Burnett RT, Thun MJ, Calle EE, Krewski D, Ito K, et al. 2002. Lung cancer, cardiopulmonary mortality, and long-term exposure to fine particulate air pollution. JAMA 287(9):1132–41.
Roger LJ, Kehrl HR, Hazucha M, Horstman DH. 1985. Bronchoconstriction in asthmatics exposed to sulfur dioxide during repeated exercise. J Appl Physiol 1985; 59:784–91.
Salvi, S., Blomberg, A., Rudell, B., Kelly, F., Sandstrom, T., Holgate, S.T., Frew, A.1999. Acute Inflammatory Responses in the Airways and Peripheral Blood after Short-Term Exposure to Diesel Exhaust in Healthy Human Volunteers. American Journal of Respiratory Critical Care Medicine 159:702-709.
Samet JM, Zeger SL, Dominici F, Curriero F, Coursac I, Dockery DW, et al. 2000. The National Morbidity, Mortality, and Air Pollution Study, number 94, part II: morbidity, mortality, and air pollution in the United States. Cambridge, MA: Health Effects Institute.
Sandstrom T, Stjernberg N, Andersson M, Kolmodin-Hedman B, Lundgren R, Rosenhall L, et al. 1989. Cell response in bronchoalveolar lavage fluid after exposure to sulfur dioxide: a time-response study. Am Rev Respir Dis 140:1828–31.
172
STAUFFER CHEMICAL COMPANY PUBLIC HEALTH ASSESSMENT – FINAL RELEASE
Schachter EN, Witek TJ Jr, Beck GJ, Hosein HB, Colice G, Leaderer BP, et al. 1984. Airway effects of low concentrations of sulfur dioxide: dose-response characteristics. Arch Environ Health 39:34–42.
Schwartz, J. 1995. Health Effects of Air Pollution from Traffic: Ozone and Particulate Matter. In: Fletcher, T., ed. Health at the Crossroads: Transportation Policy and Urban Health, Proceedings of the Fifth Annual Public Health Forum of the London School of Hygiene and Tropical Medicine; April; London, United Kingdom. New York, NY: John Wiley and Sons, Inc.
Schwartz, J. 1999. Air pollution and hospital admissions for heart disease in eight U.S. counties. Epidemiology 10(1):17–22.
Seaton, A., Souton, A., Crawford, V., Elton, R., McNerlan, S., Cherrie, J., Watt, M., Agius, R., Stount, R. 1999. Particulate Air Pollution and the Blood. Thorax 54: 1027-1032.
Sheppard D, Saisho A, Nadel JA, Boushey HA. 1981. Exercise increases sulfur dioxide-induced bronchoconstriction in asthmatic subjects. Am Rev Respir Dis 123:486–91.
Sheppard D, Epstein J, Bethel RA. 1983. Tolerance to sulfur dioxide-induced bronchoconstriction in subjects with asthma. Environmental Research 1983; 30:412-419.
Sheppard D. Eschenbacher WL, Boushey HA, Bethel RA. 1984. Magnitude of the interaction between the bronchomotor effects of sulfur dioxide and those of dry (cold) air. Am Rev Respir Dis 130:52–5.
Seaburn __, Robertson __. 1987. Hydrogeologic assessment. Stauffer Chemical Company, Tarpon Springs Plant, Tarpon Springs, Florida.
Sholtes & Kolger Environmental Consultants. 1978. An Investigation of Excessive Sulfur Dioxide in the Ambient Air of Northern Pinellas County. Prepared for Florida Power Corporation. September 20, 1978.
SIP, no date. Excerpts from Florida's State Implementation Plan for Sulfur Dioxide. Copies provided to ATSDR by Stauffer counsel on June 14, 2002
[SMC] Stauffer Management Company. 2001. Stauffer Management Company LLC’s Written comments regarding ATSDR’s June 18, 2001, draft public health response plan for the Stauffer Chemical Company Site, Tarpon Springs, Florida. Tarpon Springs, FL: Stauffer Management Company. Jul 26.
[SMC] Stauffer Management Company. 2002. Semiannual groundwater monitoring program report. Stauffer Management Company. Tarpon Springs, Florida. Tarpon Springs, FL: Stauffer Management Company. Apr 5.
Stark. 1975. Letter from John Stark, Assistant to Plant Manager of the Stauffer Chemical Company, to Warren Smith, Florida Department of Pollution Control. February 12, 1975.
173
STAUFFER CHEMICAL COMPANY PUBLIC HEALTH ASSESSMENT – FINAL RELEASE
Stockwell HG, Lyman GH, Waltz J, and Peters JT. 1988. Lung cancer in Florida: risks associated with residence in the central Florida phosphate mining region. J Epidemiology Volume 128, 1:81-85.
Tampa Bay Water. 2002. Fact Sheet. Clearwater, FL: Tampa Bay Water.
Tan, W.C., Qiu, D., Liam, B.L., Ng, T.P., Lee, S.H. 2000. The Human Bone Marrow Response to Acute Air Pollution Causes by Forest Fires. American Journal of Respiratory Critical Care Medicine 16(4 pt.1): 1213-1217.
US Census Bureau. 2000. 2000 Census of population. Redistricting data file (Public Law 94-171). Washington, DC: US Census Bureau. Available from URL: factfinder.census.gov.
Wall BF, Hart D. 1997. Revised radiation doses for typical x-ray examinations. Br J Radiol 70: 437–9.
[Weston] Roy F. Weston. 1989. Stauffer Management Company, Tarpon Springs, Florida. Site Background Information Review. September 1989.
[Weston] Roy F. Weston. 1990a. Stauffer Management Company, Tarpon Springs, FL Plant Site Sampling Report. August 1990.
[Weston] Roy F. Weston. 1990b. Site Soil Characterization Study, Tarpon Springs, FL. November 1990.
[Weston] Roy F. Weston. 1990c. September 1990 Environmental Sampling of Tarpon Springs, FL (Letter Report). November 12, 1990.
[Weston] Roy F. Weston Inc. 1993. Stauffer Management Co. Tarpon Springs, Florida, final site remedial investigation report. West Chester, PA: Roy F. Weston, Inc.
[Weston] Roy F. Weston Inc. 1996. Additional Soil Sampling Program, Gulfside Elementary School Analytical Results. April 1996.
[WHO] World Health Organization. 1979. Environmental Health Criteria 8: sulfur oxides and suspended particulate matter. Geneva: World Health Organization.
Yu C, LePoire D, Gnanapragasam EK, et al. 2000 Development of probabilistic RESRAD 6.0 and RESRAD-BUILD 3.0 computer codes. Argonne, IL: Argonne National Laboratory. Rpt. No.: ANL/EAD/TM-98, NUREG/CR-6697.
174