2020 CO Springs CAFR
322
-
Upload
khangminh22 -
Category
Documents
-
view
0 -
download
0
Transcript of 2020 CO Springs CAFR


Annual ComprehensiveFinancial Report
City of Colorado SpringsColorado
For the fiscal year endedDecember 31, 2020
Finance DepartmentCharae McDaniel, Chief Financial OfficerKerry George, Assistant Finance Director
Tracy Peters, Accounting Manager
Accounting StaffRochelle Kennedy, Accounting Supervisor
Jim Adams, Senior AccountantMelanie McFarlane, Senior Accountant
Erin Phillips, Senior AccountantAmy Tuten, Senior AccountantGiovanni Villarreal, Accountant
A special thanks to the Budget Division


I. INTRODUCTORY SECTION
Letter of Transmittal iGFOA Certificate of Achievement viCity Organizational Chart viiCity Leadership viiiCity Council ix
II. FINANCIAL SECTION
Independent Auditor’s Report 1
A. Management’s Discussion and Analysis (MD&A) 5
B. Basic Financial Statements
Government-wide Financial StatementsStatement of Net Position 1 29Statement of Activities 2 31
Fund Financial Statements
Governmental Fund Financial StatementsBalance Sheet and Reconciliation of the Balance Sheet - Governmental
Funds to the Statement of Net Position 3 32Statement of Revenues, Expenditures and Changes in Fund Balances 4 34Reconciliation of the Statement of Revenues, Expenditures and Changes in
Fund Balances of Governmental Funds to the Statement of Activities 5 35Statement of Revenues, Expenditures and Changes in
Fund Balance – Budget and Actual – General Fund 6 36
Proprietary Fund Financial StatementsBalance Sheet 7 40Statement of Revenues, Expenses and Changes in Net Position 8 43Statement of Cash Flows 9 44
Fiduciary Fund Financial StatementsStatement of Net Position 10 47Statement of Changes in Net Position 11 48
Component Unit Financial StatementsCombining Statement of Net Position – Governmental Fund Component Units 12 50Combining Statement of Activities – Governmental Fund Component Units 13 52Combining Balance Sheet – Proprietary Fund Component Units 14 54Combining Statement of Activities – Proprietary Fund Component Units 15 56
TABLE OF CONTENTS
Exhibit Page

Notes to Financial Statements 59
C. Required Supplementary Information Other than MD&ASchedule of the City’s Proportionate Share of the Net Pension Liability
and Contributions – Colorado PERA 16 182Schedule of the Changes in the City’s Net Pension Liability
and Contributions – Old Hire Fire and Police Pension Plans 17 185Schedule of the Changes in the City’s Net Pension Liability
and Contributions – New Hire Fire and Police Pension Plans 18 189Schedule of the City’s Proportionate Share of the Net Pension Liability (Asset)
and Contributions – Fire and Police Pension Plan – Statewide 19 193Schedule of the City's Proportionate Share of the Net OPEB Liability
and Contributions – Colorado PERA 20 196Schedule of the Changes in the City's Total OPEB Liability – The City of
Colorado Springs OPEB Plan 21 199Schedule of the Changes in the City's Total OPEB Liability – Colorado Springs
Utilities OPEB Plan 22 200
D. Combining and Individual Fund Statements and Schedules
Major Proprietary FundsSchedule of Revenues and Expenses – Budget and Actual Comparison A-1 202
Non-Major Governmental FundsCombining Balance Sheet B-1 206Combining Statement of Revenues, Expenditures and Changes
in Fund Balances B-2 207
Special Revenue FundsCombining Balance Sheet – All Special Revenue Funds C-1 212Combining Statement of Revenues, Expenditures and Changes in Fund
Balances – All Special Revenue Funds C-2 214Combining Balance Sheet – Intergovernmental Grant Special Revenue Funds C-3 216Combining Statement of Revenues, Expenditures and Changes in Fund
Balances - Intergovernmental Grant Special Revenue Funds C-4 217Combining Balance Sheet – Capital, Operations and Maintenance
Special Revenue Funds C-5 218Combining Statement of Revenues, Expenditures and Changes in Fund
Balances – Capital, Operations and Maintenance Special Revenue Funds C-6 220Combining Balance Sheet – Improvement and Maintenance District
Special Revenue Funds C-7 222Combining Statement of Revenues, Expenditures and Changes in Fund
Balances – Improvement and Maintenance District Special Revenue Funds C-8 224Combining Balance Sheet – Public Improvements Special Revenue Funds C-9 226
TABLE OF CONTENTS
Exhibit Page

Combining Statement of Revenues, Expenditures and Changes in Fund
Balances – Public Improvements Special Revenue Funds C-10 227Combining Balance Sheet – Other Public Improvements Special Revenue Funds C-11 228Combining Statement of Revenues, Expenditures and Changes in Fund
Balances – Other Public Improvements Special Revenue Funds C-12 229Combining Balance Sheet – Other Special Revenue Funds C-13 230Combining Statement of Revenues, Expenditures and Changes in Fund
Balances – Other Special Revenue Funds C-14 231Schedule of Revenues and Expenditures – Budget and Actual
– All Special Revenue Funds C-15 232
Capital Projects FundBalance Sheet D-1 236Statement of Revenues, Expenditures and Changes in Fund Balance – Budget and Actual D-2 237Annual Statement of Receipts and Expenditures for Roads, Bridges and Streets D-3 238
Permanent FundsCombining Balance Sheet E-1 242Combining Statement of Revenues, Expenditures and Changes in Fund Balances E-2 243Schedule of Revenues and Expenditures – Budget and Actual E-3 244
Non-Major Proprietary Funds - Enterprise FundsCombining Balance Sheet F-1 246Combining Statement of Revenues, Expenses and Changes in Net Position F-2 250Combining Statement of Cash Flows F-3 252Schedule of Revenues and Expenses – Budget and Actual – Budget Basis F-4 256
Non-Major Proprietary Funds - Internal Service FundsCombining Balance Sheet G-1 258Combining Statement of Revenues, Expenses and Changes in Net Position G-2 260Combining Statement of Cash Flows G-3 262Schedule of Revenues and Expenses – Budget and Actual – Budget Basis G-4 266
Fiduciary FundsCombining Statement of Fiduciary Net Position H-1 268Combining Statement of Changes in Net Position H-2 269
III. STATISTICAL SECTION
Net Position by Component Table 1 272Changes in Net Position Table 2 274Fund Balances of Governmental Funds Table 3 278Changes in Fund Balances of Governmental Funds Table 4 280Sales and Use Tax Revenue Table 5 282Direct and Overlapping Sales and Use Tax Rates Table 6 283Principal Taxpayers Table 7 284
TABLE OF CONTENTS
Exhibit Page

Ratios of Outstanding Debt by Type Table 8 285Ratios of General Bonded Debt Outstanding Table 9 286Direct and Overlapping Governmental Activities Debt Table 10 287Legal Debt Margin Information Table 11 288Pledged Revenue Coverage Table 12 289Demographic and Economic Statistics Table 13 290Principal Employers Table 14 291Full-time Equivalent City Government Employees by Function/Program Table 15 292Operating Indicators by Function/Program Table 16 294Capital Asset Statistics by Function/Program Table 17 296Sales and Use Tax Revenue Collection Costs and Required Refunds Table 18 297Assessed Valuations, Property Tax Levies and Collections Table 19 298Direct and Overlapping Mill Levy Rates – Within City Limits Table 20 299Municipal Solid Waste Landfill Closure and Postclosure Care Costs Table 21 300
TABLE OF CONTENTS
Exhibit Page

INTRODUCTORY SECTION


FINANCE DEPARTMENT30 South Nevada Avenue, Suite 202
Colorado Springs, CO 80903719-385-5919
June 11, 2021
The Honorable Mayor and Members of City CouncilCity of Colorado Springs107 North Nevada AvenueColorado Springs, Colorado 80903
Dear Honorable Mayor and Members of City Council:
The Annual Comprehensive Financial Report of the City of Colorado Springs for the fiscal year ended December 31, 2020, is hereby presented. State law requires that every general-purpose local government publish a complete set of audited financial statements within six months of the close of each fiscal year. This report fulfills this requirement.
Management assumes full responsibility for the completeness and reliability of the information contained in this report, based upon a comprehensive framework of internal control established for this purpose. Because the cost of internal control should not exceed anticipated benefits, the objective is to provide reasonable, rather than absolute, assurance that the financial statements are free of any material misstatements.
BKD, LLP, Certified Public Accountants, have issued unmodified (“clean”) opinions on the City of Colorado Springs’ financial statements for the year ended December 31, 2020. The independent auditor’s report is located at the front of the financial section of this report.
Generally accepted accounting principles (GAAP) require that management provide a narrative introduction, overview and analysis to accompany the basic financial statements in the form of Management’s Discussion and Analysis (MD&A). This letter of transmittal is designed to complement the MD&A and should be read in conjunction with it. The MD&A can be found immediately following the report of the independent auditors.
PROFILE OF THE CITY OF COLORADO SPRINGSFounded on July 31, 1871, the City of Colorado Springs (the City) became a home-rule city, organized under provisions of the Colorado Constitution on May 11, 1909. With a population of approximately 490,000, the City is the second most populated city in Colorado and covers approximately 195 square miles.
Major industries located within the government’s boundaries or in close proximity include aerospace, defense, homeland security, cybersecurity, life sciences, sports and related organizations. The City also has a significant military presence with Peterson Air Force Base, the Air Force Academy, Fort Carson, Cheyenne Mountain Air Station, and Schriever Air Force Base located within or in close proximity to the City.
City of Colorado Springs 2020 Annual Comprehensive Financial Report i

The City provides a full range of municipal government services. These services include, but are not limited to, police and fire protection, traffic and street construction and maintenance, parks, recreation, cultural services, municipal court, planning and zoning, building and code enforcement, mass transit, and economic development.
Additionally, the City owns and operates major enterprise activities that include electric generation and distribution, natural gas distribution, waterworks, sewage collection and treatment, health system, municipal airport, parking facilities, golf courses, tourist highway, cemeteries, stormwater operations, and a development review activity.
Pursuant to the City Charter, the Mayor of the City is the chief executive, exercising all administrative and executive powers granted to the City, except as otherwise delegated by the City Charter. Policy-making and legislative authority are vested in the governing council (Council) consisting of nine members, all elected on a non-partisan basis.
The Council also has significant control over several legally separate entities. These entities are component units of the City and, accordingly, their financial data have been included in this report. The entities included as Governmental-type component units are the General Improvement Districts (Spring Creek, Briargate, and Market Place at Austin Bluffs), Colorado Springs Health Foundation, Colorado Springs Urban Renewal Authority, Colorado Springs Downtown Development Authority, and Business Improvement Districts (Barnes & Powers North, Barnes & Powers South, Briargate Center, Creekwalk Marketplace, First & Main, First & Main No. 2, First & Main North, Greater Downtown Colorado Springs, Interquest North, Interquest South, Interquest Town Center, MW Retail, Powers & Woodmen Commercial, Southwest Downtown, and USAFA Visitor's Center). MW Retail BID has not yet commenced activity and therefore is not displayed in the City’s attached financial statements. USAFA Visitor’s Center has been removed from the attached financial statements due to immaterial financial activity during 2020. Public Authority for Colorado Energy (PACE), Fountain Valley Authority, Aurora-Colorado Springs Joint Water Authority and Twin Lakes, Lake Meredith, Colorado Canal and Lake Henry Reservoir companies, and the Pikes Peak Regional Communications Network are included as Business-type component units.
LOCAL ECONOMYIn March 2020, the COVID-19 pandemic reached Colorado. A state of emergency was declared by the Governor and by the end of March non-essential businesses were either closed or their operations were limited per the Stay at Home order that was put into place to slow the spread of COVID-19. Near the end of April, the Stay at Home order was lifted, and business were allowed to slowly begin operating with varying degrees of restrictions. The shutdown of the economy created an economic recession that negatively impacted much of the revenue for the City.
Legislation was approved by Congress and signed into law by President Trump on March 27, 2020, in response to the economic impact of the COVID-19 pandemic. This legislation is the Coronavirus Aid, Relief, and Economic Security Act (CARES Act) and authorized more than $2 trillion to address COVID-19 and its economic effects.
As part of the CARES Act, El Paso County received funding directly from the U.S. Department of the Treasury and elected to distribute a portion of that funding to jurisdictions within the county, based on population. The City of Colorado Springs received $37.5 million of CARES funding from El Paso County, which was used to address eligible expenses.
In the November 2020 election, the voters overwhelmingly approved Issue 2A, which allows the City to retain and spend all revenues received in 2019 and 2020, with the 2019 amount of $1.9 million dedicated to Public Safety. It also allows the City to avoid the 'ratchet down' effect of the Taxpayers Bill of Rights (TABOR) in future years, caused by the COVID-19 business disruption. Beginning in 2021, Issue 2A
ii City of Colorado Springs 2020 Annual Comprehensive Financial Report

establishes the amount of total revenue and property tax revenues allowed to be retained by TABOR to be the total revenue received by the City in 2019 and property tax revenue received by the City in 2020, adjusted in each year thereafter for inflation and City growth as provided by City Charter, which will continue to limit future revenue growth.
Colorado Springs has been ranked in the top 4 best places to live in the United States by U.S. Newsand World Report for three years in a row, based on affordability, job market, net migration and quality oflife indicators, including health care and education.
Important contributing factors in achieving our current national status are the various ways in which we have experienced a renewed investment in public infrastructure:
• In 2013, under state legislation known as the Regional Tourism Act, Colorado Springs applied to the Colorado Economic Development Commission and secured $120.5 million in state sales tax increment financing to support four local projects:
◦ the U.S. Olympic and Paralympic Museum opened on July 30th, 2020, where people near and far can experience leading-edge technology and immerse themselves in the Olympic movement;
◦ the Hybl Sports Medicine and Performance Center at UCCS opened in August 2020, a state-of-the-art facility that will attract physicians, researchers, athletes and students to explore human potential for excellence and injury recovery;
◦ two downtown area stadiums, Weidner Field, which will be completed in the Spring of 2021 and will be the home of the Colorado Springs Switchbacks Football Club and other sports and community events; also Robson Arena at Colorado College will be home of the Colorado College hockey team beginning in 2021 and will host many other events;
◦ the new Air Force Academy Visitor Center adjacent to I-25, and situated on a 59 acre development surrounded by office, hotel, recreation and dining amenities; the project has been impacted and delayed due to the COVID-19 pandemic, but will be back on track in 2021.
• In November of 2015, voters in Colorado Springs passed Issue 2C, agreeing to invest in our roads with $250 million over 5 years. In November of 2019, voters approved a renewal of 2C for an additional 5 years, through 2025, at a reduced sales tax rate of 0.57%, down from 0.62%. This renewal is projected to generate $57 million per year over the 5 year period. This funding is used exclusively for road, sidewalk, curb and gutter improvements within the City of Colorado Springs.
• In November of 2017, voters passed Issue 2A, agreeing to invest in our stormwater program, including reinstating a stormwater fee which will allow us, over the following 20 years, not only to meet our various legal obligations, but to create the best stormwater program in Colorado.
General Fund dollars freed up by the passage of the stormwater fee will allow the City to hire 120 police officers and 32 firefighters by 2022. The additional sworn personnel are essential to reducing critical incident response times and making our public safety capabilities among the best in the country.
City of Colorado Springs 2020 Annual Comprehensive Financial Report iii

LONG-TERM STRATEGIC AND FINANCIAL PLANNINGAs stated in the City Charter, the Mayor maintains a Strategic Plan (Plan) that prioritizes goals for the City and establishes measurable outcomes. The 2020 Plan encompasses the years 2020 through 2024. The Plan details four platform goals, with objectives for each goal, and initiatives to achieve each objective. The Plan and initiatives incorporate the City’s fervent commitment to delivering “best in class” municipal government and offer game-changing new ideas with real, measurable outcomes.
Promoting Job Creation - Collaborate with regional partners to attract a diverse economic base to Olympic City USA. This focus includes corporate and small businesses, entrepreneurial start-ups and Opportunity Zones to create diverse and sustainable economic growth.
Investing in Infrastructure - Continue to address infrastructure and transportation needs by providing smart and innovative mobility solutions to create a connected, safe, and accessible community. This should include trails and multi-modal access, as well as traditional modes of transit.
Excelling in City Services - Provide excellent and sustainable delivery of core services by making data driven investments and decisions. Support continuous improvement and cross departmental collaboration to improve service delivery to residents and provide for their public safety.
Building Community & Collaborative Relationships - Provide strategic city services and community partnerships to improve citizen quality of life by reducing crime, reducing the number of persons experiencing chronic homelessness, increasing affordable housing opportunities, and facilitating community investment. Collaborate with other governmental agencies and military installations.
As a budgeting and financial planning best-practice, the City develops a five-year financial forecast and includes that as part of its annual budget document. The forecast is useful to understand what the future financial condition of the City could be based upon a set of reasonable assumptions. However, actual experience will differ from the assumptions - impacting financial results. The City will make strategic adjustments to changing conditions. For example, if revenue is trending under budget, the City will take actions to modify expenditures mid-year.
FINANCIAL POLICIESThe City has administratively approved financial policies that are included in the annual budget document. Included are policies concerning: budget, debt, cash management, investments, fund balance, capital improvement program, revenue, expenditures, and grants. The financial policies that had a significant impact to the City’s financial statements this year include:
• The City has a General Fund unrestricted fund balance goal of 16.7% to 25% of the following year’s expenditure budget.
• The City annually prepares a five-year capital improvement plan included in the annual budget document.
• Current operating expenditures will be funded with current operating revenues, approved grants, or the use of fund balance in accordance with fund balance policies.
• The City is limited by City Charter Amendment #3, “Taxpayers Bill of Rights” and similar statewide constitutional amendments. These provisions limit the growth of “fiscal year spending” as defined in the amendments. These amendments also require voter approval for the issuance of general fund debt.
iv City of Colorado Springs 2020 Annual Comprehensive Financial Report

AWARDS AND ACKNOWLEDGEMENTSThe Government Financial Officers Association of the United States and Canada (GFOA) awarded a Certificate of Achievement for Excellence in Financial Reporting to the City for its annual comprehensive financial report (ACFR) for the fiscal year ended December 31, 2019. This was the 30th consecutive year that the City has received this prestigious award. To receive this Certificate of Achievement award, the City must publish an easily readable and effectively organized ACFR. This report must satisfy both generally accepted accounting principles and applicable legal requirements.
A Certificate of Achievement is valid for a period of one year only. We believe that our current ACFR continues to meet the Certificate of Achievement Program’s requirements and are submitting it to GFOA to determine its eligibility for another certificate.
The preparation of this report is due to the effective and dedicated efforts of the staff of the Accounting Office. Beyond these efforts, this report is representative of the excellence of the financial processes existing in Colorado Springs City government. Each department and agency of the City must be credited for the excellence of its individual systems of financial administration. For the efforts of all of these people, we wish to express our sincere gratitude.
Sincerely,
Charae McDaniel, Chief Financial Officer Kerry George, Assistant Finance Director
Tracy Peters, Accounting Manager
City of Colorado Springs 2020 Annual Comprehensive Financial Report v

vi City of Colorado Springs 2020 Annual Comprehensive Financial Report

City Organizational ChartCitizens of Colorado Springs
Executive Branch Legislative Branch
MayorJohn Suthers City Council
Interim City AuditorJacqueline Rowland
AirportGreg Phillips
Chief of StaffJeff Greene
City Attorney's OfficeWynetta Massey
City Clerk's OfficeSarah Johnson
Deputy Chief of StaffBret Waters
CommunicationsJamie Fabos
EconomicDevelopment
Bob CopeInformation Technology
Carl Nehls
FireTed Collas
FinanceCharae McDaniel
Municipal Court Administration
HayDen W. Kane II
PoliceVincent Niski
Human ResourcesMike Sullivan
Office of Emergency Management
Jim Reid
Parking System EnterpriseScott Lee
Procurement ServicesNicole Spindler
Parks, Recreation and Cultural Services
Karen PalusSupport Services
Ryan Trujillo
Planning and Community
DevelopmentPeter Wysocki
Public WorksTravis Easton
City of Colorado Springs 2020 Annual Comprehensive Financial Report vii

City Leadership Mayor’s Office
John Suthers
Mayor
Mayor John Suthers
Chief of Staff/Chief Administrative Officer Jeff Greene
Deputy Chief of Staff Bret Waters
Department Heads
Chief Communications Officer Jamie Fabos
Chief Financial Officer Charae McDaniel
Chief Human Resources and Risk Officer Mike Sullivan
Chief Information Officer Carl Nehls
City Attorney Wynetta Massey
City Clerk Sarah Johnson
Director of Aviation Greg Phillips
Fire Chief Ted Collas
Office of Emergency Management Regional Director Jim Reid
Parks, Recreation and Cultural Services Director Karen Palus
Planning and Community Development Director Peter Wysocki
Public Works Director Travis Easton
Police Chief Vincent Niski
Presiding Municipal Court Judge/Court Administrator HayDen W. Kane II
viii City of Colorado Springs 2020 Annual Comprehensive Financial Report

City Council
Colorado Springs City Council Council District MapFront Row (from left to right):
Council Member David Geislinger, District 2
Council Member Yolanda Avila, District 4
Council Member Bill Murray, At-Large
Council Member Andy Pico, District 6
Back Row (from left to right):
Council Member Don Knight, District 1
Council President Pro-Tem Tom Strand, At-Large
Council President Richard Skorman, District 3
Council Member Jill Gaebler, District 5
Council Member Wayne Williams, At-Large
City Council’s Direct Report
Interim City Auditor Jacqueline Rowland
Utilities Chief Executive Officer Aram Benyamin
City Council Administrator Emily Evans
City of Colorado Springs 2020 Annual Comprehensive Financial Report ix

x City of Colorado Springs 2020 Annual Comprehensive Financial Report

FINANCIAL SECTION


City of Colorado Springs 2020 Annual Comprehensive Financial Report 1

2 City of Colorado Springs 2020 Annual Comprehensive Financial Report

City of Colorado Springs 2020 Annual Comprehensive Financial Report 3

4 City of Colorado Springs 2020 Annual Comprehensive Financial Report

The following discussion and analysis of the City of Colorado Springs’ (City) financial performance provides an overview of the City’s financial activities for the fiscal year ended December 31, 2020. Please read the information presented here in conjunction with the transmittal letter, located at the front of this report, and the City’s financial statements, which follow this section.
FINANCIAL HIGHLIGHTS
• On the government-wide financial statements, the City’s assets and deferred outflows of resources exceeded its liabilities and deferred inflows of resources at December 31, 2020, by $3.6 billion (net position). The City’s net position increased by $5.3 million or 0.1% as a result of current year activity.
◦ The governmental net position increased by $72.6 million or 5.3%. This is primarily due to capital assets donated by the Pikes Peak Rural Transportation Authority and developers.
◦ The business-type net position decreased by $67.3 million or 3.0%, which was due to the net impact of a Utilities' capital asset impairment related to the decision to decommission power plants, offset by a decrease in net pension liability.
• The City’s governmental funds reported combined ending fund balances of $246.4 million. This was an increase of $39.0 million or 18.8%, largely due to the receipt of Federal COVID-19 relief funds and expenditure savings. The expenditure savings were the result of budget reductions enacted during the economic shutdown amid revenue loss resulting from the COVID-19 pandemic.
• The General Fund, the City’s primary operating fund presented on a current financial resources basis, ended 2020 with a total fund balance of $126.5 million or 40.2% of 2020 total General Fund expenditures and other financing uses. Of this, $106.4 million was “unrestricted” which the Government Finance Officers Association (GFOA) defines as the sum of committed, assigned and unassigned fund balances. GFOA adopted a recommended best practice to maintain an unrestricted fund balance of at least 16.7% of expenditures and the City has adopted a target range of 16.7% to 25% of expenditures. For 2020 the $106.4 million in unrestricted fund balance represents 33.8% of 2020 total General Fund expenditures and other financing uses. Unrestricted fund balance increased from 2019 by $43.3 million. Restricted fund balance decreased by $1.7 million due to the removal of $1.8 million Taxpayer’s Bill of Rights (TABOR) refund/retention from 2019. Additional information on TABOR is presented in Note IV.D.3 in the notes to the financial statements. See General Fund Budgetary Highlights for additional information on other General Fund changes.
• The City’s total long-term debt is $2.7 billion. This is a $77.5 million or 2.8% decrease from 2019. Governmental activity debt decreased by $4.2 million due to debt repayments. The City’s business-type activity debt decreased by $73.3 million largely due to Utilities debt repayments exceeding new issuances.
MANAGEMENT’S DISCUSSION AND ANALYSIS December 31, 2020(unaudited)
City of Colorado Springs 2020 Annual Comprehensive Financial Report 5

OVERVIEW OF THE FINANCIAL STATEMENTS
This discussion and analysis is an introduction to the City’s basic financial statements. The City’s basic financial statements are comprised of three components:
1) Government-wide financial statements2) Fund financial statements 3) Notes to the financial statements
In addition to the basic financial statements, this report also contains certain other supplementary information.
The following table summarizes the major features of the City’s financial statements, including the portion of the City government they cover and the types of information they contain. The remainder of this overview section of management’s discussion and analysis explains the structure and contents of each of the statements.
Major Features of the City’s Government-wide and Fund Financial Statements
Fund Statements
Government-wide Statements Governmental Funds Proprietary Funds Fiduciary Funds
Scope Entire City government (except fiduciary funds) and the City’s component units
The activities of the City that are not proprietary or fiduciary, such as police, fire, and parks
Activities the City operates similar to private businesses; the utilities system, airport, and parking system
Instances in which the City is the trustee or agent for someone else’s resources
Required financial statements
• Statement of net position
• Statement of activities
• Balance sheet• Statement of
revenues, expenditures, and changes in fund balances
• Statement of net position
• Statement of revenues, expenses, and changes in net position
• Statement of cash flows
• Statement of fiduciary net position
• Statement of changes in fiduciary net position
Accounting basis and measurement focus
Accrual accounting and economic resources focus
Modified accrual accounting and current financial resources focus
Accrual accounting and economic resources focus
Accrual accounting and economic resources focus
Type of asset/liability information
All assets and liabilities, both financial and capital, and short-term and long-term
Only assets expected to be used up and liabilities that come due during the year or soon thereafter; no capital assets or long-term liabilities included
All assets and liabilities, both financial and capital, and short-term and long-term
All assets and liabilities, both short-term and long-term
Type of inflow/outflow information
All revenues and expenses during year, regardless of when cash is received or paid
Revenues for which cash is received during or soon after the end of the year; expenditures when goods or services have been received and payment is due during the year or soon thereafter
All revenues and expenses during year, regardless of when cash is received or paid
All revenues and expenses during the year, regardless of when cash is received or paid
MANAGEMENT’S DISCUSSION AND ANALYSIS December 31, 2020(unaudited)
6 City of Colorado Springs 2020 Annual Comprehensive Financial Report

Government-wide Financial StatementsThe government-wide financial statements are designed to provide readers with a broad overview of the City’s finances, using the accrual basis of accounting, the basis of accounting used by most private-sector businesses. These two reports include:
Statement of net position – This statement presents information on all of the City’s assets and deferred outflows of resources and liabilities and deferred inflows of resources, with the difference between the two reported as net position. Over time, increases or decreases in net position may serve as a useful indicator of whether the financial position of the City is improving or deteriorating.
Statement of activities – This statement presents information showing how the City’s net position changed during the year. All changes in net position are reported as soon as the underlying event giving rise to the change occurs, regardless of the timing of related cash flows. Thus, revenues and expenses reported in this statement for some items will result in cash flows in future fiscal periods.
The government-wide financial statements of the City are divided into three categories:
Governmental activities – Most of the City’s basic services are included here, such as public safety, public works, parks, planning/housing, and general government. Taxes, intergovernmental revenues, and surplus revenue transfers finance most of these activities.
Business-type activities – Other services such as water, sewer, gas, and electricity system, health system, airport, parking facilities, golf courses, cemeteries, tourist highway, development review program, and stormwater are intended to recover all or a significant portion of their costs through user fees and charges.
Component units – Component units are legally separate entities for which the City is financially accountable. The City reports the following as component units: Fountain Valley Authority, Aurora-Colorado Springs Joint Water Authority, and several canal and reservoir companies: Twin Lakes, Lake Meredith, Colorado Canal, and Lake Henry; the Pikes Peak Regional Communications Network, the Colorado Springs Health Foundation and several business improvement districts: Barnes & Powers North, Barnes & Powers South, Briargate Center, Creekwalk Marketplace, Colorado Springs Downtown Development Authority, Colorado Springs Urban Renewal Authority, First & Main, First & Main No. 2, First & Main North, Greater Downtown Colorado Springs, Interquest North, Interquest South, Interquest Town Center, MW Retail, Powers & Woodmen Commercial, Southwest Downtown, and USAFA Visitor's Center Business Improvement Districts. While MW Retail was created in 2019, this district had no financial activity to be reported. USAFA Visitor's Center had immaterial financial activity during 2020 and has been removed from this report. It will be included when financial activity warrants inclusion.
MANAGEMENT’S DISCUSSION AND ANALYSIS December 31, 2020(unaudited)
City of Colorado Springs 2020 Annual Comprehensive Financial Report 7

Fund Financial Statements
A fund is a grouping of related accounts used to maintain control over resources that have been segregated for specific activities or objectives. The City, like other state and local governments, uses fund accounting to ensure and demonstrate compliance with finance-related legal requirements. All of the funds of the City can be divided into three categories: governmental funds, proprietary funds, and fiduciary funds.
Governmental funds – Governmental funds are used to account for essentially the same functions reported as governmental activities in the government-wide financial statements. However, unlike the government-wide financial statements, governmental fund financial statements focus on near-term inflows and outflows of spendable resources, as well as on balances of spendable resources available at the end of the fiscal year. Such information may be useful in evaluating a government’s near-term financing requirements.
Because the focus of governmental funds is narrower than that of the government-wide financial statements, it is useful to compare the information presented for governmental funds with similar information presented for governmental activities in the government-wide financial statements. By doing so, readers may better understand the long-term impact of the government’s near-term financing decisions. Both the governmental fund balance sheet and the governmental fund statement of revenues, expenditures, and changes in fund balances provide a reconciliation to facilitate this comparison between governmental funds and governmental activities.
The City maintains several individual governmental funds. Information is presented separately in the governmental fund balance sheet and in the governmental fund statement of revenues, expenditures, and changes in fund balances for the General Fund which is considered to be a major fund. Data from the other governmental funds are combined into a single, aggregated presentation. Individual fund data for each of these non-major governmental funds is provided in the form of combining statements elsewhere in this report.
The City adopts an annual appropriated budget for its governmental funds and budgetary comparisons have been provided to demonstrate compliance with these budgets.
Proprietary funds – The City maintains two different types of proprietary funds: Enterprise funds, used to report the same functions presented as business-type activities in the government-wide financial statements, and Internal Service funds, used as an accounting device to accumulate and allocate costs internally among the City’s various functions. The City uses internal service funds to account for its printing, self-insurance and various other activities of the City. Because these services predominantly benefit governmental rather than business-type functions, they have been included within governmental activities in the government-wide financial statements. However, the change in net position for internal service funds has been allocated between governmental activities and business-type activities on the statement of activities.
MANAGEMENT’S DISCUSSION AND ANALYSIS December 31, 2020(unaudited)
8 City of Colorado Springs 2020 Annual Comprehensive Financial Report

Proprietary fund financial statements provide the same type of information as the government-wide financial statements, but with more detail. The proprietary fund financial statements provide separate information for Utilities, Public Authority for Colorado Energy (PACE), and Memorial Health System (MHS) which are considered to be major proprietary funds of the City. Both non-major enterprise funds and internal service funds are combined into single, aggregated presentation in the proprietary fund financial statements. Individual fund data for the non-major enterprise funds and the internal service funds are provided in the form of combining statements elsewhere in this report.
The City adopts an annual appropriated budget for its proprietary funds and budgetary comparisons have been provided to demonstrate compliance with these budgets.
Fiduciary funds – Fiduciary funds are used to account for resources held for the benefit of parties outside the government. Fiduciary funds are not reflected in the government-wide financial statements because the resources of those funds are not available to support the City’s own programs. The accounting used for fiduciary funds is much like that used for proprietary funds. The City has two fiduciary funds that are categorized as pension trust funds. The basic fiduciary fund financial statements provide combined information, while individual fund data are provided in the form of combining statements elsewhere in this report.
The City does not adopt an annual appropriated budget for its fiduciary funds.
Notes to the Financial Statements
The notes provide additional information essential to the full understanding of the data provided in the government-wide and fund financial statements. The notes to the financial statements can be found following the fund financial statements.
Other Information
Following the basic financial statements and accompanying notes, this report also presents certain required supplementary information (RSI) and combining, individual fund statements and schedules, and statistical tables.
Remainder of page intentionally blank
MANAGEMENT’S DISCUSSION AND ANALYSIS December 31, 2020(unaudited)
City of Colorado Springs 2020 Annual Comprehensive Financial Report 9

GOVERNMENT-WIDE FINANCIAL ANALYSIS
As noted earlier, net position may serve over time as a useful indicator of the government’s financial position. In the case of the City, assets and deferred outflows of resources exceeded liabilities and deferred inflows of resources by $3.6 billion at the close of 2020 which is $5.3 million more than at the close of 2019.
The following table reflects the condensed Statement of Net Position for 2020 with comparative information for 2019:
City of Colorado SpringsStatement of Net Position (in 000's)
GovernmentalActivities
Business-typeActivities Total
2020 2019 2020 2019 2020 2019
Current and other assets $ 359,517 $ 313,691 $ 1,351,705 $ 1,257,608 $ 1,711,221 $ 1,571,298 Capital assets 1,544,257 1,476,812 4,287,481 4,443,285 5,831,737 5,920,097
Total assets 1,903,773 1,790,502 5,639,185 5,700,893 7,542,959 7,491,395 Deferred outflows of resources 89,941 133,444 118,586 158,692 208,527 292,136
Total assets and deferred outflows of resources 1,993,714 1,923,946 5,757,771 5,859,585 7,751,485 7,783,531
Long-term liabilities 376,075 437,473 3,289,119 3,418,231 3,665,194 3,855,704 Other liabilities 80,291 80,193 211,489 210,606 291,780 290,799
Total liabilities 456,366 517,666 3,500,608 3,628,837 3,956,974 4,146,503 Deferred inflows of resources 96,329 37,843 97,017 3,309 193,346 41,152
Total liabilities and deferred inflows of resources 552,695 555,508 3,597,625 3,632,146 4,150,320 4,187,654
Net positionNet investment in capital assets 1,480,807 1,413,603 2,090,953 2,229,703 3,571,761 3,643,307 Restricted 40,763 36,633 67,324 57,213 108,087 93,845 Unrestricted (80,551) (81,798) 1,869 (59,477) (78,682) (141,275) Total net position $ 1,441,019 $ 1,368,438 $ 2,160,146 $ 2,227,439 $ 3,601,165 $ 3,595,877
Note: Immaterial differences may occur due to rounding.
The City’s investment in capital assets, less any related debt used to acquire those assets that is still outstanding, is substantially the same as its total net position, at $3.6 billion. The City uses capital assets to provide services to citizens; consequently, these assets are not available for future spending. Although the City’s investment in capital assets is reported net of related debt, it should be noted that the resources needed to repay this debt must be provided from other sources, since the capital assets themselves cannot be liquidated to satisfy these liabilities.
MANAGEMENT’S DISCUSSION AND ANALYSIS December 31, 2020(unaudited)
10 City of Colorado Springs 2020 Annual Comprehensive Financial Report

Restricted net position increased by $14.2 million, due to increased restricted net position for Utilities, partially offset by the removal of $1.8 million TABOR refund/retention between 2019 and 2020. Additional information on TABOR is presented in Note IV.D.3 in the notes to the financial statements.
The unrestricted net position shows a deficit of $78.7 million. While certain unrestricted funds are designated for specific, future purposes such as encumbrances and subsequent year expenses, significant net pension and OPEB liabilities offset these amounts, resulting in negative unrestricted net position.
The net position of the business-type activities is $2.2 billion. This net position can only be used for the continuing operations of the utilities, airport, downtown parking facilities, golf courses, cemeteries, tourist highway, development review program, and stormwater activities. This amount cannot be used to make up for any decrease reported in governmental activities.
The following table shows revenues and expenses for both governmental and business-type activities for 2020 with comparative information for 2019. As noted earlier, the City’s net position increased from 2019 to 2020 by $5.3 million. Governmental activities increased the City’s net position by $72.6 million or 5.3%, which accounts for 1372.5% of the City’s overall change in net position. Business-type activities decreased the City’s net position by $67.3 million or 3.0%, which accounts for 1272.5% of the City’s overall change in net position.
Remainder of page intentionally blank
MANAGEMENT’S DISCUSSION AND ANALYSIS December 31, 2020(unaudited)
City of Colorado Springs 2020 Annual Comprehensive Financial Report 11

City of Colorado SpringsChanges in Net Position (in 000's)
GovernmentalActivities
Business-typeActivities Total
2020 2019 2020 2019 2020 2019Revenues:Program revenues:
Charges for services $ 61,013 $ 55,179 $ 989,733 $ 1,001,926 $ 1,050,746 $ 1,057,105 Operating grants and
contributions 73,427 36,420 — — 73,427 36,420 Capital grants and
contributions 81,129 82,049 81,514 87,203 162,643 169,251 General revenues:
Property taxes 27,478 23,841 — — 27,478 23,841 Sales and other taxes 299,560 296,648 — — 299,560 296,648 Investment earnings 8,414 8,122 12,067 17,151 20,482 25,273 Gain on sale of capital assets 1,266 1,243 2,406 1,264 3,672 2,506 Contributions to endowments 67 62 — — 67 62
Total revenues 552,353 503,563 1,085,720 1,107,543 1,638,073 1,611,107
Expenses:General government 99,254 75,780 — — 99,254 75,780 Public safety 245,421 230,131 — — 245,421 230,131 Public works 138,423 118,033 — — 138,423 118,033 Parks 27,733 29,426 — — 27,733 29,426 Planning 11,967 12,198 — — 11,967 12,198 Interest on long-term debt 2,414 2,047 — — 2,414 2,047 Utilities — — 764,323 741,238 764,323 741,238 PACE — — 58,949 59,525 58,949 59,525 MHS — — 2,945 2,987 2,945 2,987 Non-major enterprises — — 53,260 54,212 53,260 54,212 Special item - asset impairment — — 228,095 — 228,095 —
Total expenses 525,213 467,615 1,107,572 857,963 1,632,785 1,325,578
Change in net position before transfers 27,140 35,948 (21,852) 249,581 5,288 285,529 Transfers 45,441 36,045 (45,441) (36,045) — — Change in net position 72,581 71,993 (67,293) 213,536 5,288 285,529 Net position - beginning 1,368,438 1,296,445 2,227,439 2,013,903 3,595,877 3,310,348 Net position - ending $ 1,441,019 $ 1,368,438 $ 2,160,146 $ 2,227,439 $ 3,601,165 $ 3,595,877
Note: Immaterial differences may occur due to rounding.
MANAGEMENT’S DISCUSSION AND ANALYSIS December 31, 2020(unaudited)
12 City of Colorado Springs 2020 Annual Comprehensive Financial Report

Governmental Activities
Governmental ActivitiesRevenue by Source
$552.4 million
Charges for Services: 11%
Operating Grants andContributions: 13%
Capital Grants andContributions: 15%
Property Taxes: 5%
Sales and Other Taxes: 54%
Other: 2%
Note: Exclusive of transfers.
Governmental ActivitiesExpenses and Program Revenue
(in 000's)
Program Revenue Expenses
GeneralGovernment
Public Safety Public Works Parks Planning$0
$50,000
$100,000
$150,000
$200,000
$250,000
Note: Exclusive of transfers.
MANAGEMENT’S DISCUSSION AND ANALYSIS December 31, 2020(unaudited)
City of Colorado Springs 2020 Annual Comprehensive Financial Report 13

For 2020, governmental activities revenues increased resulting in an increase in net position based upon current year activity. Revenue was up from 2019 by $48.8 million primarily as a result of the receipt of $37.5 million of Federal COVID-19 relief funds. El Paso County received funding directly from the U.S. Department of the Treasury and elected to distribute a portion of that funding to jurisdictions within the county, based on population. Expenses increased $57.6 million from 2019. The most significant changes to expenses were the following:
• General government expenses increased $23.5 million primarily due to increased pension expenses.
• Public safety expenses increased $15.3 million primarily due to increased staffing, operations, and pension expenses.
• Public works expenses increased $20.4 million primarily due to roadway maintenance and repairs.
• Parks and Planning and community development expenses decreased by $1.7 million and $231,000, respectively, as a result of budget reductions due to the economic shutdown and revenue loss amid the COVID-19 pandemic.
• Pension plan expenses impacted other categories as pension expense for the City’s civilian pension plan, PERA, increased $17.8 million.
Remainder of page intentionally blank
MANAGEMENT’S DISCUSSION AND ANALYSIS December 31, 2020(unaudited)
14 City of Colorado Springs 2020 Annual Comprehensive Financial Report

Business-type ActivitiesBusiness-type Activities
Revenue by Source$1,085.7 million
Charges for Services: 91%
Capital Grants &Contributions: 8%
Investment Earnings: 1%
Note: Exclusive of transfers.
Business-type ActivitiesExpenses and Program Revenue
(in 000's)
Program Revenue Expenses
Utilities PACE Other$0
$200,000
$400,000
$600,000
$800,000
$1,000,000
Note: Exclusive of transfers.
MANAGEMENT’S DISCUSSION AND ANALYSIS December 31, 2020(unaudited)
City of Colorado Springs 2020 Annual Comprehensive Financial Report 15

For 2020, business-type activities revenue decreased $21.8 million, while expenses increased $249.6 million. In 2020, Utilities’ revenue experienced a net decrease of $9.4 million primarily due to decreases in electric and natural gas revenues, partially offset by an increase in water revenues. Meanwhile the Airport experienced a decrease in operating revenues and capital contributions due to severe declines in passenger activity as a result of the economic shutdown from the COVID-19 pandemic. Business-type activities net expenses increased $249.6 million. In 2020, Utilities’ operating expenses increased $18.4 million driven primarily by increases in net pension and OPEB expenses. Additionally, Utilities recorded a $233.5 million asset impairment due to the decision to decommission power plants.
Remainder of page intentionally blank
MANAGEMENT’S DISCUSSION AND ANALYSIS December 31, 2020(unaudited)
16 City of Colorado Springs 2020 Annual Comprehensive Financial Report

FINANCIAL ANALYSIS OF THE CITY’S FUNDS
Governmental funds
As of the end of 2020, the City’s governmental funds reported total combined fund balances of $246.4 million of which $82.3 million or approximately 33.4%, is unassigned. Unassigned fund balance serves as a useful measure of a government’s net resources available for spending at the end of the fiscal year. The nonspendable portion of fund balance, $15.0 million, is primarily comprised of endowments; and the restricted portion of fund balance, $77.9 million, is primarily comprised of $57.7 million in special revenue funds restricted balances and the $9.2 million TABOR emergency reserve.
The General Fund is the principal operating fund of the City. At the end of 2020, the General Fund’s total fund balance was $126.5 million. The unrestricted fund balance of the General Fund was $106.4 million. As a measure of the General Fund’s liquidity, it is useful to compare both total fund balance and unrestricted fund balance to total fund expenditures including other financing uses. Total fund balance represents 40.2% of 2020 total General Fund expenditures and other financing uses while unrestricted fund balance represents 33.8% of 2020 total General Fund expenditures and other financing uses.
Proprietary funds
The City’s proprietary fund statements provide the same type of information found in the government-wide financial statements, but in more detail. Unrestricted net position as of December 31, 2020 and 2019 for the proprietary funds are as follows:
Unrestricted Net Position(in 000's)
2020 2019 ChangeUtilities $ 128,659 $ 56,934 $ 71,725 PACE (163,655) (156,142) (7,513) Non-major enterprise funds 48,865 50,892 (2,027) Internal service funds (26,910) (24,300) (2,610)
Note: Immaterial differences may occur due to rounding.
Utilities' unrestricted net position increased, while PACE, non-major enterprise funds, and the internal service funds each experienced declines in 2020. Utilities increase was due to fluctuations in pension and OPEB amounts. The decrease for non-major enterprise funds was largely due to declines in activity as a result of the economic shutdown associated with the COVID-19 pandemic. The internal service funds showed decreased unrestricted net position due to an actuarially required increase in the Claims Reserve fund. PACE's decrease, as in prior years, was primarily due to significant interest expense.
MANAGEMENT’S DISCUSSION AND ANALYSIS December 31, 2020(unaudited)
City of Colorado Springs 2020 Annual Comprehensive Financial Report 17

GENERAL FUND BUDGETARY HIGHLIGHTS
Over the course of the year, City Council typically revises the City budget several times. However, non-Federal revenue was negatively impacted due to the economic shutdown resulting from the COVID-19 pandemic. Therefore, there were no significant revisions to the budget during 2020.
Per City Code, the City rolled over unspent project budgets and encumbrances from the previous year totaling $26.9 million.
Total revenues, excluding Federal COVID-19 relief funds and other financing sources, fell short of the final budget by 2.6% or $7.3 million as the number of revenues short of budget outpaced those that exceeded budget. Fines fell short of budget by $5.6 million due to greatly reduced traffic due to the economic shutdown. Intergovernmental revenue, excluding Federal COVID-19 funds, were below budget by $1.5 million, primarily due to the reduction in collections from the highway user tax fund. The charges for services for public works exceeded budget by $2.0 million due to continued strong local development activity. Investment earnings exceeded budget by $2.2 million largely due to the effective management of the investment portfolio. Sales and use tax revenue (including penalty and interest), while increased from 2019, fell short of budget by $1.1 million.
Total expenditures, excluding other financing uses, were $45.0 million less than the final budget. Budget reductions were implemented during 2020 in response to decreased revenue experienced during the pandemic induced economic shutdown. Additionally, projects can span across more than one fiscal year resulting in current year expenditures less than budget. Vacancies across the organization also resulted in salary and benefit cost savings.
Remainder of page intentionally blank
MANAGEMENT’S DISCUSSION AND ANALYSIS December 31, 2020(unaudited)
18 City of Colorado Springs 2020 Annual Comprehensive Financial Report

CAPITAL ASSETS AND DEBT ADMINISTRATION
Capital assets
At the end of 2020, the City had $5.8 billion invested in a broad range of capital assets and infrastructure (net of accumulated depreciation). This investment in capital assets included land, buildings and improvements, equipment and other vehicles, infrastructure (including streets, alleys, traffic signals and signs, bridges, and drainage systems), enterprise plants, construction in process and intangible capital assets. This amount represented a net decrease (including additions, deletions, and an impairment) of $88.4 million.
City of Colorado SpringsCapital Assets (in 000's)
(net of accumulated depreciation)
GovernmentalActivities
Business-typeActivities Total
2020 2019 2020 2019 2020 2019
Land $ 400,858 $ 369,645 $ 232,821 $ 244,846 $ 633,679 $ 614,491 Buildings 112,761 117,825 37,345 40,104 150,106 157,929 Improvements other
than buildings 54,915 51,798 185,005 180,564 239,920 232,361 Machinery and
equipment 60,601 54,237 15,447 15,988 76,048 70,225 Infrastructure 862,048 847,186 42,492 40,359 904,540 887,545 Utilities plant — — 3,471,591 3,669,055 3,471,591 3,669,055 Construction in
progress 43,392 25,722 234,899 185,791 278,291 211,513 Intangible capital assets 9,682 10,399 67,881 66,579 77,563 76,978 Total $ 1,544,257 $ 1,476,812 $ 4,287,481 $ 4,443,285 $ 5,831,737 $ 5,920,097
Note: Immaterial differences may occur due to rounding.
The change in capital assets for 2020 was due to both governmental and business-type activities. Governmental activities showed a modest increase due to donated infrastructure as well as land acquisitions for parks and open space. Business-type activities offset this increase with a significant decrease in assets. Specifically, in 2020, Utilities’ capital assets decreased $198.0 million or 4.8% primarily due to an asset impairment related to the decision to decommission power plants. The $233.5 million loss was recorded as a special item on the statement of activities.
In 2020, Pikes Peak Rural Transportation Authority donated $25.2 million of infrastructure and developers donated of $19.3 million of infrastructure to governmental activities. These donated amounts remain strong as a result of continued local development.
Additional information on the City’s capital assets is presented in Note III.G. in the notes to the financial statements.
MANAGEMENT’S DISCUSSION AND ANALYSIS December 31, 2020(unaudited)
City of Colorado Springs 2020 Annual Comprehensive Financial Report 19

Long-term debt
The following schedule provides the debt outstanding at the end of 2020 and 2019. Total long-term debt outstanding at the end of 2020 is $2.7 billion.
City of Colorado SpringsOutstanding Debt (in 000's)
GovernmentalActivities
Business-typeActivities Total
2020 2019 2020 2019 2020 2019
General obligation bonds $ 5,130 $ 6,985 $ — $ — $ 5,130 $ 6,985 Certificates of participation 37,145 38,140 — — 37,145 38,140 Revenue bonds — — 2,642,904 2,721,679 2,642,904 2,721,679 Lease/lease purchase 8,495 9,835 — — 8,495 9,835 Notes payable — — 14,490 8,981 14,490 8,981 Total $ 50,770 $ 54,960 $ 2,657,394 $ 2,730,660 $ 2,708,164 $ 2,785,620
Note: Immaterial differences may occur due to rounding.
During 2020, long-term debt for the governmental activities decreased $4.2 million, due to debt repayments. Business-type activities decreased $73.3 million primarily due to debt repayments exceeding the issuance of refunding and improvement revenue bonds.
The City’s latest long-term bond ratings are as follows:
DescriptionMoody'sRating
Standard & Poor'sRating
FitchRating
Certificates of Participation Aa2 AA N/APikes Peak America's Mountain Revenue Bonds N/A A N/AParking Revenue Bonds N/A N/A N/AUtilities Revenue Bonds Aa2 AA+ AAPACE Revenue Bonds A2 A- A+
The current debt limitation for the City is $628.1 million or 10% of the assessed property valuation. The City has no outstanding general obligation debt as it relates to this debt limit. The general obligation debt shown in the financial statements relate to the City’s blended component units.
Additional information on the City’s long-term debt is presented in Note III.J. in the notes to the financial statements.
MANAGEMENT’S DISCUSSION AND ANALYSIS December 31, 2020(unaudited)
20 City of Colorado Springs 2020 Annual Comprehensive Financial Report

ECONOMIC FACTORS AND NEXT YEAR’S BUDGETS AND RATES
Local Economic Indicators
Portions of the local economy experienced dramatic impacts due to the pandemic induced economic shutdown in 2020. The local unemployment rate began the year at 3.3%, then spiked in April at 12.5% before declining and ending the year at 7.4%. Hotel occupancy (12-month moving average) began the year at 69.7% and dropped to 49.6% for December. Other portions of the economy experienced continued strength, particularly the home building industry. The number of home sales grew by 7.9%, and the number of residential building permits increased 26.6%.
2019 | 2020
% U
nem
ploy
men
t
El Paso County Unemployment Rate
Jan
Feb
Mar Apr
May Jun Jul
Aug
Sep Oct
Nov
Dec Jan
Feb
Mar
Apr
May Jun
Jul
Aug Sep Oct
Nov
Dec
0123456789
10111213
Source: US Bureau of Labor Statistics - Local Area Unemployment Statistics
Remainder of page intentionally blank
MANAGEMENT’S DISCUSSION AND ANALYSIS December 31, 2020(unaudited)
City of Colorado Springs 2020 Annual Comprehensive Financial Report 21

Colorado Springs Hotel Occupancy Rate(12 Month Moving Average)
2019 | 2020
Jan
Feb
Mar Apr
May Jun
Jul
Aug
Sep Oct
Nov Dec Jan
Feb
Mar Apr
May Jun
Jul
Aug
Sep Oct
Nov Dec
45%
50%
55%
60%
65%
70%
75%
Source: University of Colorado Colorado Springs Economic Forum Dashboard
Pikes Peak RegionResidential Building Permits
2019 | 2020
# of
Dw
ellin
g U
nits
Gai
ned
Total Single Family Dwellings (detached and attached)Total Multi-Family Dwellings
Jan
Feb
Mar Apr
May Jun
Jul
Aug
Sep Oct
Nov
Dec Jan
Feb
Mar Apr
May Jun
Jul
Aug
Sep Oct
Nov
Dec
0
250
500
750
1,000
Source: Pikes Peak Regional Building Department
MANAGEMENT’S DISCUSSION AND ANALYSIS December 31, 2020(unaudited)
22 City of Colorado Springs 2020 Annual Comprehensive Financial Report

Pikes Peak RegionHome Sales
(Single Family/Patio Homes)
2019 | 2020
# of
Hom
es S
old
Jan
Feb
Mar Apr
May Jun
Jul
Aug
Sep Oct
Nov
Dec Jan
Feb
Mar Apr
May Jun
Jul
Aug
Sep Oct
Nov
Dec
0
200
400
600
800
1,000
1,200
1,400
1,600
1,800
2,000
2,200
Source: Pikes Peak Association of Realtors
Remainder of page intentionally blank
MANAGEMENT’S DISCUSSION AND ANALYSIS December 31, 2020(unaudited)
City of Colorado Springs 2020 Annual Comprehensive Financial Report 23

Sales and use tax revenue
The City’s General Fund sales and use tax revenue was up $3.0 million or 1.7% from 2019. The pandemic induced economic downturn greatly impacted the hotel/motel and restaurant industries. These reduced revenues were offset by two primary areas of growth. The Building Materials category saw increases as the local building market, both residential and industrial, continued trending in a positive direction. Additionally, in late 2019, the City began to see increases due to sales tax collections by many internet retailers who, as a result of the 2018 Supreme Court decision in South Dakota v. Wayfair, began collecting and remitting City sales tax on online purchases. City sales and use tax collections are primarily dependent upon the level of local economic activity, consumer confidence, tourist activity, and inflationary growth.
General FundSales and Use Tax Revenue
$ (Millions)
2020
2019
2018
2017
2016
— 50.0 100.0 150.0 200.0
Remainder of page intentionally blank
MANAGEMENT’S DISCUSSION AND ANALYSIS December 31, 2020(unaudited)
24 City of Colorado Springs 2020 Annual Comprehensive Financial Report

2021 Budget
The 2021 General Fund budget of approximately $348.9 million is 5.3% higher than the 2020 original General Fund budget. At 53.5%, sales and use tax is the largest single source of General Fund revenue. 2021 sales and use tax is budgeted at $186.2 million.
The 2021 budget addresses important strategic and operational goals which are reflected in the following important funding decisions:
• $2.0 million of increased funding for 10 new sworn Police positions and 8 new sworn Fire positions and equipment, including re-establishing a dedicated Hazardous Materials response team and the transition of a medical squad to an engine company for the Fire Department
• $600,000 of increased funding for park maintenance, tree planting and initiation of the street tree inventory per the Urban Forest Management Plan
• $1.7 million continued funding for the City’s Americans with Disabilities Act operating and capital programs
• $2.0 million of increased funding for city fleet and equipment replacement• $500,000 of continued funding to support shelter bed operations for the homeless
population• $760,000 increased funding to Mountain Metro Transit, including a route to the
Airport and to the Amazon facility to be established in the 2nd half of 2021• $1.6 million continuing support to address Information Technology core infrastructure,
applications, and cybersecurity improvements and sustainment• $2.0 million for Police and Fire sworn step increases, pay progression for civilian
employees, and full-year funding for the portion of compensation that was phased in during 2020
• $1.1 million increased operating and capital funding for snow/ice removal operations• $3.4 million for critical facility maintenance - spread across the City’s many facilities
including police and fire stations, parks facilities, public works facilities, and fuel infrastructure
• $670,000 increased funding for city-wide Capital Improvement Projects• $850,000 increased funding for the state-mandated 811 utility locate team
In 2021, the world continued experiencing the impacts of the novel coronavirus. Economic uncertainty remains and may negatively affect the financial position, results of operations and cash flows of the City. The duration of these uncertainties and the ultimate financial effects cannot be reasonably estimated at this time.
MANAGEMENT’S DISCUSSION AND ANALYSIS December 31, 2020(unaudited)
City of Colorado Springs 2020 Annual Comprehensive Financial Report 25

REQUEST FOR INFORMATION
This financial report is designed to provide our citizens, taxpayers, customers, investors, and creditors with a general overview of the City’s finances and to show the City’s accountability for the money it receives. If you have questions about this report or need additional financial information, contact the Finance Department at City of Colorado Springs, 30 S. Nevada Avenue, Suite 202, Colorado Springs, Colorado, 80903, www.coloradosprings.gov, or 719-385-5224.
Remainder of page intentionally blank
MANAGEMENT’S DISCUSSION AND ANALYSIS December 31, 2020(unaudited)
26 City of Colorado Springs 2020 Annual Comprehensive Financial Report

BASIC FINANCIAL STATEMENTS
City of Colorado Springs 2020 Annual Comprehensive Financial Report 27

28 City of Colorado Springs 2020 Annual Comprehensive Financial Report

STATEMENT OF NET POSITION CITY OF COLORADO SPRINGSDecember 31, 2020 COLORADO
Exhibit 1(PAGE 1 of 2)
Primary Government Component UnitsGovernmental
ActivitiesBusiness-type
Activities TotalGovernmental
ActivitiesBusiness-type
Activities
ASSETS
Cash and investments $ 222,534,234 $ 361,016,698 $ 583,550,932 $ 170,356,281 $ 12,803,225
Receivables (net of allowance for uncollectibles) 106,286,843 128,800,398 235,087,241 21,088,287 1,751,212
Lease receivable — 90,929,433 90,929,433 — — Due from component unit — 1,572 1,572 — —
Due from other governments — — — 926 —
Due from primary government — — — — 6,549,727
Inventories 325,491 58,591,899 58,917,390 — 239,618
Prepaids 29,349 394,618,000 394,647,349 211,630 409,797
Other — 124,180,000 124,180,000 — 332,022
Restricted assets (temporarily):
Cash and investments 25,785,415 192,615,013 218,400,428 53,665,315 2,054,075
Interest receivable — 44,000 44,000 — —
Net pension asset 4,555,409 9,692 4,565,101 — —
Investment in joint ventures — 898,000 898,000 — —
Capital assets nondepreciable:
Land 400,857,823 232,821,018 633,678,841 865,977 65,147
Intangibles — 41,288,000 41,288,000 — —
Construction in progress 43,392,236 234,898,509 278,290,745 36,699,414 1,285,332
Capital assets (net of accumulated depreciation):
Buildings 112,761,233 37,344,529 150,105,762 1,749,669 —
Improvements other than buildings 54,914,763 185,005,441 239,920,204 7,737,185 —
Machinery and equipment 60,600,576 15,447,100 76,047,676 18,071 35,510
Infrastructure 862,048,442 42,491,940 904,540,382 35,570,994 —
Utility plant — 3,471,591,000 3,471,591,000 — 66,297,280
Intangibles 9,681,673 26,592,983 36,274,656 — —
Total assets 1,903,773,487 5,639,185,225 7,542,958,712 327,963,749 91,822,945
DEFERRED OUTFLOWS OF RESOURCES
Deferred cash flow hedges - unrealized
loss on derivative instruments — 37,986,000 37,986,000 — —
Loss on debt refundings 1,182,684 36,124,032 37,306,716 5,651,014 —
Pension-related amounts 82,142,172 40,307,924 122,450,096 — —
OPEB-related amounts 6,615,886 4,168,024 10,783,910 — —
Total deferred outflows of resources $ 89,940,742 $ 118,585,980 $ 208,526,722 $ 5,651,014 $ —
(continued)
The notes to the financial statements are an integral part of this statement.
City of Colorado Springs 2020 Annual Comprehensive Financial Report 29

STATEMENT OF NET POSITION CITY OF COLORADO SPRINGSDecember 31, 2020 COLORADO
Exhibit 1(PAGE 2 of 2)
Primary Government Component UnitsGovernmental
ActivitiesBusiness-type
Activities TotalGovernmental
ActivitiesBusiness-type
Activities
LIABILITIES
Accounts payable and other liabilities $ 66,279,587 $ 84,321,108 $ 150,600,695 $ 10,483,645 $ 5,159,144
Contingent liabilities and promise to CSHF — 95,678,067 95,678,067 — —
Deposits payable 424,038 — 424,038 — —
Funds held for others 60,997 — 60,997 — —
Accrued interest payable 156,073 15,324,407 15,480,480 2,152,699 35,662
Due to component unit 6,469,817 79,910 6,549,727 — —
Due to other governments — — — 357,608 —
Due to primary government — — — — 1,572
Internal balances (10,863,879) 10,863,879 — — —
Unearned revenue:
Grants 12,669,789 — 12,669,789 — —
Other 5,094,368 5,221,694 10,316,062 — 5,336,538
Noncurrent liabilities:
Due within one year 9,544,549 119,309,331 128,853,880 5,881,748 5,332,200
Due in more than one year 366,530,304 3,169,809,635 3,536,339,939 233,818,682 3,567,797
Total liabilities 456,365,643 3,500,608,031 3,956,973,674 252,694,382 19,432,913
DEFERRED INFLOWS OF RESOURCES
Gain on debt refundings — 10,744,000 10,744,000 — —
Property taxes 29,316,148 — 29,316,148 13,094,824 —
Pension-related amounts 63,595,835 80,693,305 144,289,140 — —
OPEB-related amounts 3,417,477 5,579,500 8,996,977 — —
Total deferred inflows of resources 96,329,460 97,016,805 193,346,265 13,094,824 —
NET POSITION
Net investment in capital assets 1,480,807,235 2,090,953,267 3,571,760,502 (5,568,921) 59,639,986
Restricted for:
Debt service 1,333,045 23,163,013 24,496,058 9,199,624 1,968,978
Endowments:
Expendable 467,964 — 467,964 — —
Nonexpendable 14,680,338 — 14,680,338 — —
Emergency reserve (TABOR) 9,211,165 — 9,211,165 109,960 —
Capital improvement 10,515,085 — 10,515,085 16,575,932 —
Pension-related 4,555,409 9,692 4,565,101 — —
Other — 44,151,313 44,151,313 — —
Unrestricted (80,551,115) 1,869,084 (78,682,031) 47,508,962 10,781,068
Total net position $ 1,441,019,126 $ 2,160,146,369 $ 3,601,165,495 $ 67,825,557 $ 72,390,032
The notes to the financial statements are an integral part of this statement.
30 City of Colorado Springs 2020 Annual Comprehensive Financial Report

STATEMENT OF ACTIVITIES CITY OF COLORADO SPRINGS
For the year ended December 31, 2020 COLORADO
Exhibit 2
Program Revenues Net (Expense) Revenue and Changes in Net Position
Charges for Services
Operating Grants and
Contributions
Capital Grants and
Contributions
Primary Government Component Units
Governmental Activities
Business-type Activities
Governmental Activities
Business-type
ActivitiesExpenses Total
Functions/Programs
Primary government
Governmental activities
General government $ 99,253,639 $ 25,017,621 $ 6,113,223 $ 419,948 $ (67,702,847) $ — $ (67,702,847) $ — $ —
Public safety 245,421,258 6,500,328 40,467,252 2,128,537 (196,325,141) — (196,325,141) — —
Public works 138,423,494 21,772,133 19,933,795 71,746,305 (24,971,261) — (24,971,261) — —
Parks 27,732,987 2,220,471 2,922,547 6,834,417 (15,755,552) — (15,755,552) — — Planning and community development 11,967,295 5,502,211 3,989,683 — (2,475,401) — (2,475,401) — —
Interest on long-term debt 2,414,226 — — — (2,414,226) — (2,414,226) — —
Total governmental activities 525,212,899 61,012,764 73,426,500 81,129,207 (309,644,428) — (309,644,428) — —
Business-type activities
Utilities 764,323,344 884,352,000 — 73,222,000 — 193,250,656 193,250,656 — —
PACE 58,949,000 50,567,000 — — — (8,382,000) (8,382,000) — —
MHS 2,945,094 — — — — (2,945,094) (2,945,094) — —
Other non-major enterprises 53,259,512 54,813,785 — 8,291,770 — 9,846,043 9,846,043 — —
Total business-type activities 879,476,950 989,732,785 — 81,513,770 — 191,769,605 191,769,605 — —
Total primary government $ 1,404,689,849 $ 1,050,745,549 $ 73,426,500 $ 162,642,977 $ (309,644,428) $ 191,769,605 $ (117,874,823) $ — $ —
Component units
Governmental activities $ 67,571,871 $ 503,941 $ 27,437,091 $ — $ — $ — $ — $ (39,630,839) $ —
Business-type activities 12,417,873 21,184,220 — — — — — — 8,766,347
Total component units $ 79,989,744 $ 21,688,161 $ 27,437,091 $ — $ — $ — $ — $ (39,630,839) $ 8,766,347
General revenues
Property taxes $ 27,477,739 $ — $ 27,477,739 $ 12,549,189 $ —
Sales taxes 295,619,090 — 295,619,090 — —
Specific ownership taxes 3,358,601 — 3,358,601 586,052 —
Occupational liquor taxes 324,337 — 324,337 — —
Admissions tax 157,444 — 157,444 — —
Bicycle excise tax 100,802 — 100,802 — —
Miscellaneous — — — 11,513,530 —
Investment earnings 8,414,431 12,067,326 20,481,757 22,280,689 126,990
Gain on sale of capital assets 1,265,590 2,406,216 3,671,806 — —
Special items — (228,095,000) (228,095,000) — —
Contributions to endowments 66,576 — 66,576 — —
Transfers 45,440,871 (45,440,871) — — —
Total general revenues and transfers 382,225,481 (259,062,329) 123,163,152 46,929,460 126,990
Change in net position 72,581,053 (67,292,724) 5,288,329 7,298,621 8,893,337
Net position - January 1, as previously stated 1,368,438,073 2,227,439,093 3,595,877,166 60,428,891 63,496,695
Prior period adjustment — — — 98,045 —
Net position - January 1, restated 1,368,438,073 2,227,439,093 3,595,877,166 60,526,936 63,496,695
Net position - December 31 $ 1,441,019,126 $ 2,160,146,369 $ 3,601,165,495 $ 67,825,557 $ 72,390,032
The notes to the financial statements are an integral part of this statement.
City of Colorado Springs 2020 Annual Comprehensive Financial Report 31

GOVERNMENTAL FUNDS CITY OF COLORADO SPRINGSBALANCE SHEET COLORADODecember 31, 2020 Exhibit 3
(PAGE 1 OF 2)
General Fund
Non-Major Governmental
Funds
Total Governmental
Funds
ASSETS
Cash and investments $ 115,592,370 $ 100,756,888 $ 216,349,258
Accounts receivable (net of allowance for uncollectibles) 8,945,562 19,926,148 28,871,710
Sales tax receivable 21,127,280 12,043,600 33,170,880
Loans receivable (net of allowance for uncollectibles) 236,668 12,937,020 13,173,688
Property taxes receivable
Current 25,361,893 3,954,255 29,316,148
Delinquent 20,394 — 20,394
Inventories 294,093 — 294,093
Prepaid expenses — 29,349 29,349
Due from other funds 7,943,121 943,560 8,886,681
Restricted cash and investments 10,605,077 15,180,338 25,785,415
Total assets $ 190,126,458 $ 165,771,158 $ 355,897,616
LIABILITIES, DEFERRED INFLOWSOF RESOURCES AND FUND BALANCES
LiabilitiesAccounts payable $ 11,927,140 $ 9,331,018 $ 21,258,158
Funds held for others 60,997 — 60,997
Accrued salaries and benefits 3,455,791 611,713 4,067,504
Due to other funds 1,281,757 5,854,520 7,136,277
Due to component unit 6,469,817 — 6,469,817
Deposits payable — 424,038 424,038
Escrow deposits 10,015,999 — 10,015,999
Unearned revenue
Grants — 12,669,789 12,669,789
Other 5,094,368 — 5,094,368
Total liabilities 38,305,869 28,891,078 67,196,947
Deferred inflows of resourcesUnavailable revenue - loans (net of allowance for uncollectibles) — 12,937,020 12,937,020
Unavailable revenue - property taxes 25,361,893 3,954,255 29,316,148
Total deferred inflows of resources 25,361,893 16,891,275 42,253,168
Fund balancesNonspendable 314,487 14,709,687 15,024,174
Restricted 19,726,250 58,126,794 77,853,044
Committed 16,606,280 42,929,762 59,536,042
Assigned 7,516,635 4,222,562 11,739,197
Unassigned 82,295,044 — 82,295,044
Total fund balances 126,458,696 119,988,805 246,447,501
Total liabilities, deferred inflows of resources and fund balances $ 190,126,458 $ 165,771,158 $ 355,897,616
The notes to the financial statements are an integral part of this statement.
32 City of Colorado Springs 2020 Annual Comprehensive Financial Report

GOVERNMENTAL FUNDS CITY OF COLORADO SPRINGS
RECONCILIATION OF THE BALANCE SHEET COLORADO
GOVERNMENTAL FUNDS TO THE STATEMENT OF NET POSITION Exhibit 3December 31, 2020 (PAGE 2 OF 2)
Total fund balances - governmental funds $ 246,447,501
Amounts reported for governmental activities in the statement of net position are different because:
Capital assets used in governmental activities are not financial resources and, therefore, are not reported in the funds.
Capital assets, at historical cost $ 2,494,282,386
Less: Accumulated depreciation (950,025,640)
Less: Internal service fund net capital assets included above (337,116)
1,543,919,630
Loans and assessments - certain long-term receivables are not available to pay for current-period expenditures because they are not collected within the prescribed time period after year-end and, therefore, are unavailable in the funds. 12,937,020
Interest on investments that is not available to pay for current-period expenditures is not reported in the funds. 755,410
Internal service funds are used by management to charge the costs of support services and insurance to individual funds. The assets and liabilities of the internal service funds are included in governmental activities in the statement of net position. (14,573,440)
Long-term liabilities, including bonds payable and net pension-related amounts, are not due and payable in the current period and, therefore, are not reported in the funds.
Bonds payable (44,318,672)
Accrued interest payable (156,073)
Lease/lease purchase payable (8,495,000)
Capital lease payable (21,002,872)
Drainage fees payable (2,978,804)
Compensated absences (19,909,037)
Municipal solid waste landfill (346,090)
Pension-related amounts (214,679,942)
OPEB-related amounts (36,580,505)
(348,466,995)
Net position of governmental activities $ 1,441,019,126
The notes to the financial statements are an integral part of this statement.
City of Colorado Springs 2020 Annual Comprehensive Financial Report 33

GOVERNMENTAL FUNDS CITY OF COLORADO SPRINGSSTATEMENT OF REVENUES, EXPENDITURES COLORADOAND CHANGES IN FUND BALANCES Exhibit 4For the year ended December 31, 2020
General Fund
Non-Major Governmental
Funds
Total Governmental
Funds
RevenuesTaxes $ 211,644,141 $ 115,393,872 $ 327,038,013
Licenses, permits and fines 8,702,782 — 8,702,782
Intergovernmental 52,796,164 54,760,185 107,556,349
Charges for services 17,577,254 15,749,098 33,326,352
Endowments and donations — 3,005,744 3,005,744
Interfund services provided 8,045,494 — 8,045,494
Investment earnings 3,460,124 4,779,315 8,239,439
Other revenue 6,266,678 1,454,918 7,721,596
Rental income 62,617 205,920 268,537
Total revenues 308,555,254 195,349,052 503,904,306
ExpendituresCurrent
General government 77,505,471 10,276,728 87,782,199
Public safety 163,786,440 46,280,527 210,066,967
Planning and community development 5,916,950 5,928,911 11,845,861
Public works 19,240,368 38,009,851 57,250,219
Parks 13,727,280 9,209,228 22,936,508
Debt service
Principal 6,566,883 3,649,464 10,216,347
Interest 1,792,378 658,927 2,451,305
Capital outlay 21,464,657 87,799,450 109,264,107
Total expenditures 310,000,427 201,813,086 511,813,513
Deficiency of revenues over expenditures (1,445,173) (6,464,034) (7,909,207)
Other financing sources (uses)Transfers - in 35,724,541 4,547,444 40,271,985
Transfers - out (4,422,444) (674,983) (5,097,427)
Capital lease financing 10,515,217 — 10,515,217
Sale of capital assets 1,265,590 — 1,265,590
Total other financing sources 43,082,904 3,872,461 46,955,365
Net change in fund balances 41,637,731 (2,591,573) 39,046,158
Fund balances - January 1 84,820,965 122,580,378 207,401,343
Fund balances - December 31 $ 126,458,696 $ 119,988,805 $ 246,447,501
The notes to the financial statements are an integral part of this statement.
34 City of Colorado Springs 2020 Annual Comprehensive Financial Report

RECONCILIATION OF THE STATEMENT OF REVENUES, EXPENDITURES CITY OF COLORADO SPRINGSAND CHANGES IN FUND BALANCES OF GOVERNMENTAL FUNDS COLORADOTO THE STATEMENT OF ACTIVITIES Exhibit 5For the year ended December 31, 2020
Net change in fund balances - total governmental funds $ 39,046,158
Amounts reported for governmental activities in the statement of activities are different because:
Governmental funds report capital outlays as expenditures. However, in the statement of activities, the cost of those assets is allocated over their estimated useful lives and reported as depreciation expense.
Capital outlay $ 75,474,967
Depreciation expense (60,374,307)
15,100,660
The net effect of various miscellaneous transactions involving capital assets. (i.e., sales, trade-ins, donations, and transfers)
In the statement of activities, only the gain or loss on the sale of capital assets is reported. However, in the governmental funds, the proceeds from the sale increase financial resources. Thus, the change in net position differs from the change in fund balance by the net book value of the capital assets sold. (5,793,931)
Donations of capital assets increase net position in the statement of activities, but do not appear in the governmental funds because they are not financial resources. 46,038,248
Capital assets transferred from enterprise funds are not recorded in the governmental funds. 12,038,548
52,282,865
The issuance of long-term debt (i.e., bonds, leases) provides current financial resources to governmental funds, while the repayment of the principal of long-term debt consumes the current financial resources of governmental funds. Neither transaction, however, has any effect on net position. Also, governmental funds report the effect of premiums, discounts, and similar items when debt is first issued, whereas these amounts are deferred and amortized in the statement of activities.
Debt incurred:Capital lease financing (10,515,217)
Principal repayments:
Bond premium 129,522
General obligation debt 1,855,000
Certificates of participation 995,000
Lease/lease purchase 1,340,000
Capital leases 6,026,347
(169,348)
Some expenses reported in the statement of activities do not require the use of current financial resources and, therefore, are not reported as expenditures in governmental funds.
Accrued interest 37,079
Drainage fees 150,000
Compensated absences (1,554,291)
Landfill closing costs (6,119)
Net pension-related amounts (32,210,973)
Net OPEB-related amounts (1,291,554)
(34,875,858)
Revenues in the statement of activities that do not provide current financial resources are not reported as revenues in the funds. 2,906,894
Internal service funds are used by management to charge the costs of insurance and other services to individual funds. The net revenue of certain activities of internal service funds is reported with governmental activities. (1,710,318)
Change in net position of governmental activities $ 72,581,053
The notes to the financial statements are an integral part of this statement.
City of Colorado Springs 2020 Annual Comprehensive Financial Report 35

GENERAL FUND CITY OF COLORADO SPRINGSSTATEMENT OF REVENUES, EXPENDITURES COLORADOAND CHANGES IN FUND BALANCE Exhibit 6BUDGET AND ACTUAL (PAGE 1 OF 4)For the year ended December 31, 2020
Variance WithFinal Budget
Budgeted Amounts 2020 PositiveOriginal Final Actual (Negative)
Revenues Taxes General property taxes Current $ 23,410,000 $ 23,410,000 $ 23,479,175 $ 69,175 Penalty and interest — — 18,719 18,719
23,410,000 23,410,000 23,497,894 87,894
Sales and use taxes 185,834,000 185,834,000 182,332,529 (3,501,471) Penalty and interest — — 2,410,658 2,410,658 Specific ownership taxes 2,927,455 2,927,455 2,921,279 (6,176) Occupational liquor taxes 315,000 315,000 324,337 9,337 Admission taxes 655,000 655,000 157,444 (497,556)
Total taxes 213,141,455 213,141,455 211,644,141 (1,497,314)
Licenses, permits and fines Business licenses and permits 3,556,970 3,556,970 3,431,353 (125,617) Fines 10,873,210 10,873,210 5,271,429 (5,601,781)
Total licenses, permits and fines 14,430,180 14,430,180 8,702,782 (5,727,398)
Intergovernmental State shared revenue Cigarette tax 970,000 970,000 880,936 (89,064) Highway users tax-regular 19,098,580 19,098,580 17,640,713 (1,457,867) Highway users tax-added fees 1,575,000 1,575,000 1,559,186 (15,814) Severance tax 130,000 130,000 62,909 (67,091)
21,773,580 21,773,580 20,143,744 (1,629,836)
Other governmental units Federal COVID-19 relief funds — — 31,557,778 31,557,778 El Paso County road and bridge 775,000 775,000 904,761 129,761 El Paso County shared fines 225,000 225,000 189,881 (35,119)
1,000,000 1,000,000 32,652,420 31,652,420
Total intergovernmental $ 22,773,580 $ 22,773,580 $ 52,796,164 $ 30,022,584 (continued)
The notes to the financial statements are an integral part of this statement.
36 City of Colorado Springs 2020 Annual Comprehensive Financial Report

GENERAL FUND CITY OF COLORADO SPRINGSSTATEMENT OF REVENUES, EXPENDITURES COLORADOAND CHANGES IN FUND BALANCE Exhibit 6BUDGET AND ACTUAL (PAGE 2 OF 4)For the year ended December 31, 2020
Variance WithFinal Budget
Budgeted Amounts 2020 PositiveOriginal Final Actual (Negative)
Charges for services General government $ 3,707,465 $ 3,707,465 $ 3,745,343 $ 37,878 Public safety 6,484,641 6,484,641 5,778,572 (706,069) Planning 1,210,075 1,210,075 1,218,890 8,815 Public works 3,483,414 3,483,414 5,492,199 2,008,785 Parks 2,213,915 2,213,915 1,342,250 (871,665)
Total charges for services 17,099,510 17,099,510 17,577,254 477,744
Miscellaneous Interfund services provided 8,223,675 8,223,675 8,045,494 (178,181) Investment earnings 1,310,000 1,310,000 3,460,124 2,150,124 Other revenue 6,751,924 7,081,752 6,266,678 (815,074) Rental income 208,065 208,065 62,617 (145,448)
Total miscellaneous 16,493,664 16,823,492 17,834,913 1,011,421
Total revenues $ 283,938,389 $ 284,268,217 $ 308,555,254 $ 24,287,037 (continued)
The notes to the financial statements are an integral part of this statement.
City of Colorado Springs 2020 Annual Comprehensive Financial Report 37

GENERAL FUND CITY OF COLORADO SPRINGSSTATEMENT OF REVENUES, EXPENDITURES COLORADOAND CHANGES IN FUND BALANCE Exhibit 6BUDGET AND ACTUAL (PAGE 3 OF 4)For the year ended December 31, 2020
Variance WithFinal Budget
Budgeted Amounts 2020 PositiveOriginal Final Actual (Negative)
Expenditures General government City attorney $ 6,572,468 $ 6,572,468 $ 6,146,447 $ 426,021 City auditor 1,699,108 1,699,108 1,455,088 244,020 City clerk 1,066,158 1,066,158 982,429 83,729 City council 866,588 866,588 702,603 163,985 Communications 1,422,135 1,422,135 1,382,140 39,995 Economic development 544,017 544,017 499,345 44,672 Finance 4,256,883 4,256,883 3,876,293 380,590 General costs 39,588,144 39,655,529 34,643,495 5,012,034 Human resources 2,708,264 2,738,879 2,492,920 245,959 Information technology 17,884,918 17,884,918 16,443,264 1,441,654 Innovation, fleet and facilities 3,627,367 3,627,367 3,365,339 262,028 Mayor 1,813,132 1,813,132 1,450,011 363,121 Municipal court 4,274,417 4,274,417 4,066,097 208,320
Total general government 86,323,599 86,421,599 77,505,471 8,916,128
Public safety Fire/OEM 59,704,094 59,704,094 57,090,092 2,614,002 Police 113,190,724 113,190,724 106,696,348 6,494,376
Total public safety 172,894,818 172,894,818 163,786,440 9,108,378
Planning and community development 6,394,606 6,394,606 5,916,950 477,656
Public works 24,409,375 24,010,613 19,240,368 4,770,245
Parks $ 15,477,429 $ 15,477,429 $ 13,727,280 $ 1,750,149 (continued)
The notes to the financial statements are an integral part of this statement.
38 City of Colorado Springs 2020 Annual Comprehensive Financial Report

GENERAL FUND CITY OF COLORADO SPRINGSSTATEMENT OF REVENUES, EXPENDITURES COLORADOAND CHANGES IN FUND BALANCE Exhibit 6BUDGET AND ACTUAL (PAGE 4 OF 4)For the year ended December 31, 2020
Variance WithFinal Budget
Budgeted Amounts 2020 PositiveOriginal Final Actual (Negative)
Debt service expenditures Principal payments $ 6,745,669 $ 6,745,669 $ 6,566,883 $ 178,786 Interest payments 1,595,848 1,595,848 1,792,378 (196,530)
Total debt service 8,341,517 8,341,517 8,359,261 (17,744)
Capital outlay 39,724,530 42,318,002 21,464,657 20,853,345
Total expenditures 353,565,874 355,858,584 310,000,427 45,858,157
Deficiency of revenues over expenditures (69,627,485) (71,590,367) (1,445,173) 70,145,194
Other financing sources (uses) Transfers - in Utilities surplus 36,115,600 36,115,600 35,153,778 (961,822) Other funds — — 570,763 570,763 Transfers - out City funded capital improvement projects (4,422,444) (4,422,444) (4,422,444) — Capital lease financing 10,300,000 10,300,000 10,515,217 215,217 Sale of capital assets 915,000 915,000 1,265,590 350,590
Total other financing sources (uses) 42,908,156 42,908,156 43,082,904 174,748
Net change in fund balance (26,719,329) (28,682,211) 41,637,731 70,319,942
Fund balance - January 1 84,820,965 84,820,965 84,820,965 —
Fund balance - December 31 $ 58,101,636 $ 56,138,754 $ 126,458,696 $ 70,319,942
The notes to the financial statements are an integral part of this statement.
City of Colorado Springs 2020 Annual Comprehensive Financial Report 39

PROPRIETARY FUNDS CITY OF COLORADO SPRINGS
BALANCE SHEET COLORADO
December 31, 2020 Exhibit 7
(PAGE 1 OF 3)
Business-type Activities Enterprise FundsGovernmental
Activities
UtilitiesPublic Authority for
Colorado Energy MHSOther Non-Major Enterprise Funds Total
Internal Service Funds
ASSETS AND DEFERRED
OUTFLOWS OF RESOURCESCurrent assets
Cash and investments - unrestricted $ 289,264,000 $ 59,000 $ 7,375,844 $ 64,317,854 $ 361,016,698 $ 6,184,976
Cash and investments - restricted 43,615,000 — — — 43,615,000 —
Accounts receivable (net of allowance
for uncollectibles) 113,955,921 7,296,000 — 4,438,403 125,690,324 978,613
Lease receivable — — 2,911,769 43,464 2,955,233 —
Notes receivable — — — 288,535 288,535 —
Interest receivable 355,000 — — — 355,000 —
Due from other funds 3,460,507 — — 1,677,324 5,137,831 43,839
Due from component unit 1,572 — — — 1,572 —
Inventories 57,709,000 — — 882,899 58,591,899 31,398
Prepaids 14,500,000 19,810,000 — — 34,310,000 —
Total current assets 522,861,000 27,165,000 10,287,613 71,648,479 631,962,092 7,238,826
Noncurrent assets
Cash and investments - restricted 140,189,000 6,860,000 — 1,951,013 149,000,013 —
Interest receivable - restricted 44,000 — — — 44,000 —
Lease receivable - net — — 85,919,954 2,054,246 87,974,200 —
Notes receivable — — — 2,466,539 2,466,539 —
Net pension asset — — — 9,692 9,692 —
Due from other funds — — — 1,198,321 1,198,321 —
Investment in joint ventures 898,000 — — — 898,000 —
Prepaids — 360,308,000 — — 360,308,000 —
Other 124,180,000 — — — 124,180,000 —
Capital assets nondepreciable:
Land 210,202,000 — — 22,619,018 232,821,018 13,000
Intangibles 41,288,000 — — — 41,288,000 —
Construction in progress 160,979,000 — — 73,919,509 234,898,509 —
Depreciable capital assets:
Buildings — — — 95,684,828 95,684,828 201,250
Improvements other than buildings — — — 343,069,575 343,069,575 310,198
Machinery and equipment — — — 43,136,693 43,136,693 592,817
Infrastructure — — — 60,685,508 60,685,508 —
Utility plant 6,160,992,000 — — — 6,160,992,000 —
Intangibles 82,264,000 — — 652,943 82,916,943 —
Less accumulated depreciation
and amortization (2,745,224,000) — — (262,788,554) (3,008,012,554) (780,149)
Total noncurrent assets 4,175,812,000 367,168,000 85,919,954 384,659,331 5,013,559,285 337,116
Total assets 4,698,673,000 394,333,000 96,207,567 456,307,810 5,645,521,377 7,575,942
Deferred outflows of resources
Deferred cash flow hedges - unrealized
loss on derivatives 37,986,000 — — — 37,986,000 —
Loss on debt refundings 36,056,000 — — 68,032 36,124,032 —
Pension-related amounts 34,082,000 — — 6,225,924 40,307,924 —
OPEB-related amounts 3,217,000 — — 951,024 4,168,024 —
Total deferred outflows of resources 111,341,000 — — 7,244,980 118,585,980 —
Total assets and deferred outflows of resources $ 4,810,014,000 $ 394,333,000 $ 96,207,567 $ 463,552,790 $ 5,764,107,357 $ 7,575,942
(continued)
The notes to the financial statements are an integral part of this statement.
40 City of Colorado Springs 2020 Annual Comprehensive Financial Report

PROPRIETARY FUNDS CITY OF COLORADO SPRINGS
BALANCE SHEET COLORADO
December 31, 2020 Exhibit 7
(PAGE 2 OF 3)
Business-type Activities Enterprise FundsGovernmental
Activities
UtilitiesPublic Authority for
Colorado Energy MHSOther Non-Major Enterprise Funds Total
Internal Service Funds
LIABILITIES, DEFERRED INFLOWS OF
RESOURCES AND NET POSITION
Current liabilities
Accounts payable $ 62,836,387 $ — $ 529,500 $ 11,202,576 $ 74,568,463 $ 2,474,242
Accrued liabilities 371,000 — — — 371,000 —
Accrued salaries and benefits 6,880,000 — — 328,645 7,208,645 43,684
Claims payable — — — — — 19,100,000
Compensated absences 13,195,000 — — 62,861 13,257,861 14,056
Due to other funds 5,124,703 — — 75,740 5,200,443 2,929,952
Due to component unit 79,910 — — — 79,910 —
Unearned revenue — — — 2,333,811 2,333,811 —
Accrued interest payable 10,378,000 4,541,000 — 405,407 15,324,407 —
Matured bonds payable 89,174,000 14,120,000 — 1,250,000 104,544,000 —
Notes payable 431,000 — — 984,790 1,415,790 —
Capital lease payable — — — 91,680 91,680 —
Other 2,173,000 — — — 2,173,000 —
Total current liabilities 190,643,000 18,661,000 529,500 16,735,510 226,569,010 24,561,934
Noncurrent liabilities
Claims payable — — — — — 9,320,000
Contingent liabilities and promise to CSHF — — 95,678,067 — 95,678,067 —
Compensated absences 6,235,000 — — 1,194,389 7,429,389 267,036
Customer deposits 3,695,000 — — — 3,695,000 —
Unearned revenue — — — 2,887,883 2,887,883 —
Revenue bonds payable, net 2,184,770,000 537,009,000 — 35,259,569 2,757,038,569 —
Notes payable 4,400,000 — — 8,674,630 13,074,630 —
Customer advances for construction 19,057,000 — — — 19,057,000 —
Capital lease payable — — — 286,642 286,642 —
Municipal solid waste landfill closure
and postclosure care 5,085,000 — — — 5,085,000 —
Derivative instruments 121,371,000 — — — 121,371,000 —
Net pension liability 172,136,000 — — 15,068,036 187,204,036 —
Net OPEB liability 41,423,000 — — 2,806,369 44,229,369 —
Other long-term liabilities 11,339,000 — — — 11,339,000 —
Total noncurrent liabilities 2,569,511,000 537,009,000 95,678,067 66,177,518 3,268,375,585 9,587,036
Total liabilities 2,760,154,000 555,670,000 96,207,567 82,913,028 3,494,944,595 34,148,970
Deferred inflows of resources
Gain on debt refundings 10,744,000 — — — 10,744,000 —
Pension-related amounts 74,725,000 — — 5,968,305 80,693,305 —
OPEB-related amounts 5,226,000 — — 353,500 5,579,500 —
Total deferred inflows of resources $ 90,695,000 $ — $ — $ 6,321,805 $ 97,016,805 $ —
(continued)
The notes to the financial statements are an integral part of this statement.
City of Colorado Springs 2020 Annual Comprehensive Financial Report 41

PROPRIETARY FUNDS CITY OF COLORADO SPRINGS
BALANCE SHEET COLORADO
December 31, 2020 Exhibit 7
(PAGE 3 OF 3)
Business-type Activities Enterprise FundsGovernmental
Activities
UtilitiesPublic Authority for
Colorado Energy MHSOther Non-Major Enterprise Funds Total
Internal Service Funds
Net position
Net investment in capital assets $ 1,767,570,000 $ — $ — $ 323,383,267 $ 2,090,953,267 $ 337,116
Restricted for passenger facility charges — — — 109,313 109,313 —
Restricted for pension-related — — — 9,692 9,692
Restricted for debt service 18,894,000 2,318,000 — 1,951,013 23,163,013 —
Restricted for other 44,042,000 — — — 44,042,000 —
Unrestricted 128,659,000 (163,655,000) — 48,864,672 13,868,672 (26,910,144)
Total net position 1,959,165,000 (161,337,000) — 374,317,957 2,172,145,957 (26,573,028)
Total liabilities, deferred inflows
of resources and net position $ 4,810,014,000 $ 394,333,000 $ 96,207,567 $ 463,552,790 $ 7,575,942
Adjustment to reflect the consolidation of internal service fund activities related to enterprise funds. (11,999,588)
Net position of business-type activities $ 2,160,146,369
The notes to the financial statements are an integral part of this statement.
42 City of Colorado Springs 2020 Annual Comprehensive Financial Report

PROPRIETARY FUNDS CITY OF COLORADO SPRINGSSTATEMENT OF REVENUES, EXPENSES COLORADOAND CHANGES IN NET POSITION Exhibit 8For the year ended December 31, 2020
Business-type Activities Enterprise FundsGovernmental
Activities
Utilities
Public Authority for Colorado
Energy MHSOther Non-Major Enterprise Funds Total
Internal Service Funds
Operating revenuesCharges for services $ 884,352,000 $ 50,567,000 $ — $ 54,813,785 $ 989,732,785 $ 50,178,376
Total operating revenues 884,352,000 50,567,000 — 54,813,785 989,732,785 50,178,376
Operating expensesSalaries and benefits 200,759,000 — — 23,188,072 223,947,072 3,342,912
Other operating expenses 286,819,000 19,705,000 — 20,811,730 327,335,730 49,506,239
Depreciation and amortization 161,258,000 — — 20,215,406 181,473,406 33,756
Total operating expenses 648,836,000 19,705,000 — 64,215,208 732,756,208 52,882,907
Operating income (loss) 235,516,000 30,862,000 — (9,401,423) 256,976,577 (2,704,531)
Nonoperating revenues (expenses)Derivative instruments (13,615,000) — — — (13,615,000) —
Investment earnings 5,917,000 1,028,000 156,380 2,177,232 9,278,612 155,596
Lease interest income — — 2,788,714 — 2,788,714 —
Interest expense (96,999,000) (38,424,000) — (1,870,977) (137,293,977) —
Passenger facility charges — — — 1,473,010 1,473,010 —
Customer facility charges — — — 855,725 855,725 —
Amortization expense — (820,000) — — (820,000) —
Gain on disposal of capital assets — — — 2,406,216 2,406,216 —
Change in contingent liabilities — — (3,401,369) — (3,401,369) —
Miscellaneous (16,256,000) — 456,275 12,452,898 (3,346,827) —
Total nonoperating revenues (expenses) (120,953,000) (38,216,000) — 17,494,104 (141,674,896) 155,596
Income (loss) before contributions and transfers 114,563,000 (7,354,000) — 8,092,681 115,301,681 (2,548,935)
Capital contributions 73,222,000 — — 8,291,770 81,513,770 —
Transfers - in — — — 310,442 310,442 —
Transfers - out (35,154,000) — — — (35,154,000) —
Transfers - other (331,000) — — — (331,000) —
Special items (228,095,000) — — — (228,095,000) —
Change in net position (75,795,000) (7,354,000) — 16,694,893 (66,454,107) (2,548,935)
Total net position - January 1 2,034,960,000 (153,983,000) — 357,623,064 (24,024,093)
Total net position - December 31 $ 1,959,165,000 $ (161,337,000) $ — $ 374,317,957 $ (26,573,028)
Adjustment to reflect the consolidation of internal service fund activities related to enterprise funds. (838,617)
Change in net position of business-type activities $ (67,292,724)
The notes to the financial statements are an integral part of this statement.
City of Colorado Springs 2020 Annual Comprehensive Financial Report 43

PROPRIETARY FUNDS CITY OF COLORADO SPRINGSSTATEMENT OF CASH FLOWS COLORADOFor the year ended December 31, 2020 Exhibit 9
(PAGE 1 OF 3)
Business-type Activities Enterprise FundsGovernmental
Activities
UtilitiesPublic Authority for
Colorado Energy MHSOther Non-Major Enterprise Funds Total
Internal Service Funds
CASH FLOWS FROM OPERATING ACTIVITIESReceipts from customers $ 859,788,000 $ 50,502,000 $ — $ 51,664,138 $ 961,954,138 $ 9,646,877
Receipts from interfund services provided 16,327,000 — — 2,404,727 18,731,727 39,883,647
Receipts from lease receivable — — 2,823,398 — 2,823,398 —
Payments to suppliers (328,246,000) (78,000) — (15,597,130) (343,921,130) (41,680,719)
Payments to employees (212,640,000) — — (20,772,299) (233,412,299) (2,891,015)
Payments for interfund services used (21,874,000) — — (6,119,378) (27,993,378) (3,737,471)
Other receipts 4,155,000 — 114,664 — 4,269,664 —
Net cash provided by operating activities 317,510,000 50,424,000 2,938,062 11,580,058 382,452,120 1,221,319
CASH FLOWS FROM NONCAPITALFINANCING ACTIVITIES
Intergovernmental non-operating revenues provided (34,955,000) — — — (34,955,000) —
Transfers - in 37,000 — — 310,442 347,442 —
Repayment of advance from other funds — — — — — (2,622,196)
Advance from other funds — — — — — 2,929,952
Repayment of long-term debt — (12,860,000) — — (12,860,000) —
Interest payments on long-term debt — (37,098,000) — — (37,098,000) —
Interest payments - other — (1,424,000) — — (1,424,000) —
Operating grants 229,000 — — 10,812,458 11,041,458 —
Net cash provided (used) by noncapitalfinancing activities (34,689,000) (51,382,000) — 11,122,900 (74,948,100) 307,756
CASH FLOWS FROM CAPITAL AND RELATEDFINANCING ACTIVITIES
Capital contributions and advances 49,554,000 — — — 49,554,000 —
Payments from accounts payable incurred for capital asset additions — — — (10,391,297) (10,391,297) —
Bond issuance proceeds 337,140,000 — — — 337,140,000 —
Premium related to bond issuance 84,044,000 — — — 84,044,000 —
Bond issuance costs and other related costs (4,650,000) — — — (4,650,000) —
Repayment and refunding of revenue bonds (398,509,000) — — — (398,509,000) —
Purchases of capital assets (150,461,000) — — (49,047,750) (199,508,750) (95,202)
Repayment of capital lease obligations — — — (262,014) (262,014) —
Principal paid on capital debt — — — (2,774,823) (2,774,823) —
Interest paid on capital debt (107,245,000) — — (1,698,402) (108,943,402) —
Interest paid - other (80,000) — — (2,619) (82,619) —
Proceeds received on capital debt — — — 7,500,000 7,500,000 —
Proceeds from the sale of capital assets 4,431,000 — — 3,898,059 8,329,059 —
Capital grant 7,007,000 — — 11,121,872 18,128,872 —
Passenger facility charges — — — 1,857,739 1,857,739 —
Customer facility charges — — — 938,041 938,041 —
Insurance settlement — — — 2,138 2,138 —
Miscellaneous — — — 204,806 204,806 —
Net cash used by capital and relatedfinancing activities $ (178,769,000) $ — $ — $ (38,654,250) $ (217,423,250) $ (95,202)
(continued)
The notes to the financial statements are an integral part of this statement.
44 City of Colorado Springs 2020 Annual Comprehensive Financial Report

PROPRIETARY FUNDS CITY OF COLORADO SPRINGSSTATEMENT OF CASH FLOWS COLORADOFor the year ended December 31, 2020 Exhibit 9
(PAGE 2 OF 3)
Business-type Activities Enterprise FundsGovernmental
Activities
UtilitiesPublic Authority for
Colorado Energy MHSOther Non-Major Enterprise Funds Total
Internal Service Funds
CASH FLOWS FROM INVESTING ACTIVITIESProceeds from sales and maturities of investments $ 140,945,000 $ — $ — $ 34,407,061 $ 175,352,061 $ 447,265
Purchases of investments (37,042,000) (60,000) (3,033,776) (21,941,614) (62,077,390) (2,090,279)
Interest and dividends received 6,091,000 1,028,000 — 965,279 8,084,279 86,926
Distributions from joint ventures 205,000 — — — 205,000 —
Principal received on lease/note receivable — — — 246,653 246,653 —
Interest received on lease/note receivable — — — 280,212 280,212 —
Principal received from interfund loan — — — 80,170 80,170 —
Interest received from interfund loan — — — 53,018 53,018 —
Net cash provided (used) by investing activities 110,199,000 968,000 (3,033,776) 14,090,779 122,224,003 (1,556,088)
Net change in cash and cash equivalents 214,251,000 10,000 (95,714) (1,860,513) 212,304,773 (122,215)
Cash and cash equivalents - January 1 150,180,000 49,000 196,782 2,741,835 153,167,617 206,964
Cash and cash equivalents - December 31 $ 364,431,000 $ 59,000 $ 101,068 $ 881,322 $ 365,472,390 $ 84,749
Cash and cash equivalents $ 364,431,000 $ 59,000 $ 101,068 $ 881,322 $ 365,472,390 $ 84,749
Investments 108,637,000 6,860,000 7,274,776 65,387,545 188,159,321 6,100,227
Total cash and investments $ 473,068,000 $ 6,919,000 $ 7,375,844 $ 66,268,867 $ 553,631,711 $ 6,184,976
Reconciliation of operating income to netcash provided by operating activities
Operating income (loss) $ 235,516,000 $ 30,862,000 $ — $ (9,401,423) $ 256,976,577 $ (2,704,531)
Adjustments to reconcile operating income (loss) to net cash provided by operating activities
Depreciation and amortization expense 161,258,000 — — 20,215,406 181,473,406 33,756
Other expense (44,190,000) — — — (44,190,000) — Decrease (increase) in assets and outflows of resources
Accounts receivable (14,927,000) (65,000) — (364,884) (15,356,884) (663,448)
Lease receivable — — 2,823,398 — 2,823,398 —
Due from other funds — — — (404,398) (404,398) 13,698
Inventories (3,840,000) — — (41,473) (3,881,473) 2,355
Prepaids (3,174,000) 19,627,000 — — 16,453,000 1,900
Other assets (3,766,000) — 78,388 — (3,687,612) —
Deferred outflows of resources - pensions 40,010,000 — — 1,669,425 41,679,425 —
Deferred outflows of resources - OPEB 111,000 — — (350,853) (239,853) —
Net pension asset — — — (9,692) (9,692) — Increase (decrease) in liabilities and inflows of resources
Accounts and other payables 8,341,000 — (1,434,695) (893,408) 6,012,897 4,625,447
Accrued expenses (3,294,000) — (126,763) (574,660) (3,995,423) (87,528)
Due to other funds — — — 30,102 30,102 (330)
Contingent liability — — 1,597,734 — 1,597,734 —
Other liabilities 3,846,000 — — 24,365 3,870,365 —
Deferred inflows of resources - pensions 73,743,000 — — 5,770,443 79,513,443 —
Deferred inflows of resources - OPEB 4,441,000 — — 266,667 4,707,667 —
Net pension liabilities (133,139,000) — — (4,586,133) (137,725,133) —
Net OPEB liabilities (3,426,000) — — 230,574 (3,195,426) —
Net cash provided by operating activities $ 317,510,000 $ 50,424,000 $ 2,938,062 $ 11,580,058 $ 382,452,120 $ 1,221,319
The notes to the financial statements are an integral part of this statement.
(continued)
City of Colorado Springs 2020 Annual Comprehensive Financial Report 45

PROPRIETARY FUNDS CITY OF COLORADO SPRINGSSTATEMENT OF CASH FLOWS COLORADOFor the year ended December 31, 2020 Exhibit 9
(PAGE 3 OF 3)
Business-type Activities Enterprise FundsGovernmental
Activities
UtilitiesPublic Authority for
Colorado Energy MHSOther Non-Major Enterprise Funds Total
Internal Service Funds
Noncash investing, capital and financing activitiesAmortization, charge-off of debt discount and expense $ 6,013,000 $ 820,000 $ — $ — $ 6,833,000 $ —
Noncash acquisition of capital assets
(incurrence of payable/capital lease obligation) 32,233,000 — — 10,130,282 42,363,282 —
Noncash capital contributions 20,234,000 — — 4,710,990 24,944,990 —
Change in fair value of derivatives (13,615,000) — — — (13,615,000) —
Change in fair value of investments — — 88,040 641,608 729,648 68,668
Noncash adjustments of plant in service (228,095,000) — — — (228,095,000) —
The notes to the financial statements are an integral part of this statement.
46 City of Colorado Springs 2020 Annual Comprehensive Financial Report

FIDUCIARY FUNDS CITY OF COLORADO SPRINGSSTATEMENT OF FIDUCIARY NET POSITION COLORADODecember 31, 2020 Exhibit 10
PensionTrustFunds
ASSETS
Pension assets held by Fire and Police Pension AssociationPooled investment funds $ 132,020,700
Total pension assets held for pension benefits $ 132,020,700
NET POSITION
Net position restricted for pensions $ 132,020,700
The notes to the financial statements are an integral part of this statement.
City of Colorado Springs 2020 Annual Comprehensive Financial Report 47

FIDUCIARY FUNDS CITY OF COLORADO SPRINGSSTATEMENT OF CHANGES IN FIDUCIARY NET POSITION COLORADOFor the year ended December 31, 2020 Exhibit 11
PensionTrustFunds
Additions
City contributions $ 4,179,380 Total contributions 4,179,380
Investment earnings:Net increase in fair value of investments 12,227,467 Interest, dividends, and other 1,567,723
Total investment earnings 13,795,190 Less investment costs 957,931
Net investment earnings 12,837,259 Total additions 17,016,639
Deductions
Benefits paid to participants or beneficiaries 16,117,399 Administrative expense 73,989
Total deductions 16,191,388
Net increase in fiduciary net position 825,251
Net position restricted for pensions - January 1, as restated 131,195,449
Net position restricted for pensions - December 31 $ 132,020,700
The notes to the financial statements are an integral part of this statement.
48 City of Colorado Springs 2020 Annual Comprehensive Financial Report

City of Colorado Springs 2020 Annual Comprehensive Financial Report 49

GOVERNMENTAL FUND COMPONENT UNITSCOMBINING STATEMENT OF NET POSITIONDecember 31, 2020
Barnes & PowersNorthBID
Barnes & PowersSouthBID
BriargateCenter
BID
Creekwalk Marketplace
BID
CSDowntown
DevelopmentAuthority
CSHealth
Foundation
CS Urban Renewal Authority
First & Main BID
ASSETS
Cash and investments - unrestricted $ 54,300 $ — $ 124,343 $ — $ 885,551 $ 167,551,729 $ 479,965 $ —
Cash and investments - restricted 8,944 101,645 993,061 5,363,492 374,057 — 29,762,846 158,210
Accounts receivable (net of allowance
for uncollectibles) 3,646 588 4,401 516 146,200 — 3,585,754 1,550
Due from other governments — — — — — — 926 —
Note receivable — — — — 760,677 — — —
Assessments receivable — — 3,295,856 — — — — —
Property taxes receivable 333,339 62,824 478,510 42,676 1,885,006 — 6,907,421 172,218
Prepaids 3,751 — 145,987 — 15,779 1,814 8,128 —
Capital assets (non-depreciable):
Construction in progress — — — 19,210,644 — — — —
Land — — — — — — — —
Capital assets (net of accumulated depreciation):
Buildings — — — — 1,749,669 — — —
Machinery and equipment — — — — — — — —
Improvements other than buildings 992,538 — 1,459,801 — 355,313 — — —
Infrastructure 221,070 68,684 9,719,404 — — — — 978,099
Total assets 1,617,588 233,741 16,221,363 24,617,328 6,172,252 167,553,543 40,745,040 1,310,077
DEFERRED OUTFLOWS OF RESOURCES
Loss on refunding — — — — — — 5,651,014 —
Total deferred outflows of resources — — — — — — 5,651,014 —
LIABILITIES
Accounts payable 6,467 588 803 9,924 53,536 22,619 5,498,441 1,550
Escrows — — — — 9,653 — 85,743 —
Grants payable — — — — — 1,705,654 — —
Due to other governments — — — — — — 357,608 —
Accrued interest payable 16,954 2,085 24,138 112,417 — — 1,183,642 9,633
Noncurrent liabilities:
Due within one year 115,000 55,000 596,000 — — — 4,583,158 35,000
Due in more than one year 3,209,503 330,000 11,207,105 27,370,782 1,350,000 — 110,772,340 1,325,000
Total liabilities 3,347,924 387,673 11,828,046 27,493,123 1,413,189 1,728,273 122,480,932 1,371,183
DEFERRED INFLOWS OF RESOURCES
Property taxes 333,339 62,824 478,510 42,676 1,883,463 — 6,907,421 172,218
Total deferred inflows of resources 333,339 62,824 478,510 42,676 1,883,463 — 6,907,421 172,218
NET POSITION
Net investment in capital assets (556,523) 269 161,032 — 754,982 — — (381,901)
Restricted for:
Debt service — 99,560 3,625,834 125,697 308,557 — 641,890 148,577
Emergency reserve 1,800 — 3,480 100 65,500 — — —
Capital improvement — — — — — — 7,958,343 —
Unrestricted (1,508,952) (316,585) 124,461 (3,044,268) 1,746,561 165,825,270 (91,592,532) —
Total net position $ (2,063,675) $ (216,756) $ 3,914,807 $ (2,918,471) $ 2,875,600 $ 165,825,270 $ (82,992,299) $ (233,324)
The notes to the financial statements are an integral part of this statement.
50 City of Colorado Springs 2020 Annual Comprehensive Financial Report

COLORADO Exhibit 12
First & MainBID No 2
First & MainNorthBID
Greater Downtown
CS BID
InterquestNorthBID
InterquestSouthBID
Interquest Town Center
BID
Powers & Woodmen
CommercialBID
Southwest Downtown
BID Total
$ 203,895 $ 8,218 $ 494,671 $ 406,935 $ — $ 5,001 $ 90,098 $ 51,575 $ 170,356,281
1,818,005 8,540 — 1,585,615 471,657 1,057,945 540,411 11,420,887 53,665,315
77,775 1,807 16,600 76,943 6,980 1,735 3,019 7,873 3,935,387
— — — — — — — — 926
— — — — — — — — 760,677
— — — — — — — — 3,295,856
539,947 207,819 523,636 1,318,292 138,388 77,135 344,382 64,774 13,096,367
4,010 1,839 18,993 1,843 1,779 2,621 — 5,086 211,630
— — — — — — — 17,488,770 36,699,414
— — — — 865,977 — — — 865,977
— — — — — — — — 1,749,669
— — 18,071 — — — — — 18,071
4,289,719 632,013 — — 7,801 — — — 7,737,185
9,034,856 455,513 — 9,019,994 2,069,397 1,802,012 2,201,965 — 35,570,994
15,968,207 1,315,749 1,071,971 12,409,622 3,561,979 2,946,449 3,179,875 29,038,965 327,963,749
— — — — — — — — 5,651,014
— — — — — — — — 5,651,014
9,886 5,664 40,744 144,388 17,729 55,701 7,085 2,807,470 8,682,595
— — — — — — — — 95,396
— — — — — — — — 1,705,654
— — — — — — — — 357,608
44,003 42,732 — 74,727 16,135 1,026 11,369 613,838 2,152,699
190,000 62,590 — 160,000 50,000 — 35,000 — 5,881,748
26,624,252 1,586,109 — 11,847,719 4,194,075 2,942,430 3,636,502 27,422,865 233,818,682
26,868,141 1,697,095 40,744 12,226,834 4,277,939 2,999,157 3,689,956 30,844,173 252,694,382
539,947 207,819 523,636 1,318,292 138,388 77,135 344,382 64,774 13,094,824
539,947 207,819 523,636 1,318,292 138,388 77,135 344,382 64,774 13,094,824
(2,220,204) (351,720) 18,071 (1,433,735) (451,842) 262,243 (1,369,593) — (5,568,921)
1,829,772 — — 1,535,371 23,486 333,438 527,442 — 9,199,624
3,100 800 22,580 5,400 2,600 400 1,600 2,600 109,960
— — — — — — — 8,617,589 16,575,932
(11,052,549) (238,245) 466,940 (1,242,540) (428,592) (725,924) (13,912) (10,490,171) 47,508,962
$ (11,439,881) $ (589,165) $ 507,591 $ (1,135,504) $ (854,348) $ (129,843) $ (854,463) $ (1,869,982) $ 67,825,557
City of Colorado Springs 2020 Annual Comprehensive Financial Report 51

GOVERNMENTAL FUND COMPONENT UNITSCOMBINING STATEMENT OF ACTIVITIESFor the year ended December 31, 2020
Program Revenues Changes in Net Position
Expenses
Chargesfor
Services
OperatingGrants and
Contributions
Barnes & Powers North
BID
Barnes & Powers South
BID
BriargateCenter
BID
Creekwalk Marketplace
BID
CS Downtown Development
AuthorityCS Health
Foundation
General GovernmentBarnes & Powers North BID $ 128,963 $ — $ 11,703 Barnes & Powers South BID 15,937 — — Briargate Center BID 561,016 — 184,324 Creekwalk Marketplace BID 65,960 — — CS Downtown Development Authority 3,089,469 — 942,481 CS Health Foundation 5,155,111 — 5,523,917 CS Urban Renewal Authority 6,458,555 448,640 20,498,811 First & Main BID 76,794 — — First & Main BID No. 2 641,566 — 22,625 First & Main North BID 98,386 — — Greater Downtown CS BID 749,217 17,744 165,000 Interquest North BID 787,419 — — Interquest South BID 134,303 — — Interquest Town Center BID 186,271 — — Powers & Woodmen Commercial BID 131,037 — — Southwest Downtown BID 332,058 37,557 88,230 Subtotal $ (117,260) $ (15,937) $ (376,692) $ (65,960) $ (2,146,988) $ 368,806
Public WorksCS Urban Renewal Authority 37,210,488 — — Subtotal — — — — — —
Interest on long-term debtBarnes & Powers North BID 228,621 — — Barnes & Powers South BID 28,943 — — Briargate Center BID 353,195 — — Creekwalk Marketplace BID 1,409,873 — — CS Urban Renewal Authority 5,195,225 — — First & Main BID 120,523 — — First & Main BID No. 2 1,250,141 — — First & Main North BID 104,287 — — Interquest North BID 940,269 — — Interquest South BID 211,009 — — Interquest Town Center BID 4,716 — — Powers & Woodmen Commercial BID 281,779 — — Southwest Downtown BID 1,620,740 — — Subtotal (228,621) (28,943) (353,195) (1,409,873) — —
Totals by component unitBarnes & Powers North BID 357,584 — 11,703 Barnes & Powers South BID 44,880 — — Briargate Center BID 914,211 — 184,324 Creekwalk Marketplace BID 1,475,833 — — CS Downtown Development Authority 3,089,469 — 942,481 CS Health Foundation 5,155,111 — 5,523,917 CS Urban Renewal Authority 48,864,268 448,640 20,498,811 First & Main BID 197,317 — — First & Main BID No. 2 1,891,707 — 22,625 First & Main North BID 202,673 — — Greater Downtown CS BID 749,217 17,744 165,000 Interquest North BID 1,727,688 — — Interquest South BID 345,312 — — Interquest Town Center BID 190,987 — — Powers & Woodmen Commercial BID 412,816 — — Southwest Downtown BID 1,952,798 37,557 88,230
Total component units $ 67,571,871 $ 503,941 $ 27,437,091 (345,881) (44,880) (729,887) (1,475,833) (2,146,988) 368,806
General revenues: Property taxes 344,969 67,050 499,735 54,190 822,406 — Specific ownership taxes 37,925 7,288 54,588 6,399 98,210 — Miscellaneous — — 8,561 1,039 270,930 — Investment earnings 2,318 962 4,110 70,261 55,721 21,792,476 Total general revenues 385,212 75,300 566,994 131,889 1,247,267 21,792,476 Change in net position 39,331 30,420 (162,893) (1,343,944) (899,721) 22,161,282 Net position - January 1, restated (2,103,006) (247,176) 4,077,700 (1,574,527) 3,775,321 143,663,988 Net position - December 31 $ (2,063,675) $ (216,756) $ 3,914,807 $ (2,918,471) $ 2,875,600 $ 165,825,270
The notes to the financial statements are an integral part of this statement.
52 City of Colorado Springs 2020 Annual Comprehensive Financial Report

CITY OF COLORADO SPRINGS COLORADO
Exhibit 13
Changes in Net Position
CS Urban Renewal Authority
First & MainBID
First & MainBID No 2
First & MainNorth BID
Greater Downtown CS
BIDInterquest North BID
InterquestSouth BID
Interquest Town Center
BID
Powers & Woodmen
Commercial BID
Southwest Downtown
BID Total
$ (117,260) (15,937) (376,692) (65,960) (2,146,988) 368,806 14,488,896 (76,794) (618,941) (98,386) (566,473) (787,419) (134,303) (186,271) (131,037) (206,271)
$ 14,488,896 $ (76,794) $ (618,941) $ (98,386) $ (566,473) $ (787,419) $ (134,303) $ (186,271) $ (131,037) $ (206,271) 9,328,970
(37,210,488) (37,210,488) — — — — — — — — — (37,210,488)
(228,621) (28,943) (353,195) (1,409,873) (5,195,225) (120,523) (1,250,141) (104,287) (940,269) (211,009) (4,716) (281,779) (1,620,740)
(5,195,225) (120,523) (1,250,141) (104,287) — (940,269) (211,009) (4,716) (281,779) (1,620,740) (11,749,321)
(345,881) (44,880) (729,887) (1,475,833) (2,146,988) 368,806 (27,916,817) (197,317) (1,869,082) (202,673) (566,473) (1,727,688) (345,312) (190,987) (412,816) (1,827,011)
(27,916,817) (197,317) (1,869,082) (202,673) (566,473) (1,727,688) (345,312) (190,987) (412,816) (1,827,011) (39,630,839)
7,303,609 175,832 604,996 206,976 516,719 1,352,445 132,317 54,609 344,447 68,889 12,549,189 — 19,218 65,944 22,415 61,719 147,004 14,452 5,936 37,440 7,514 586,052 10,333,901 — 334,375 — 252 416,577 130,279 13,702 — 3,914 11,513,530 294,309 1,804 16,366 875 3,882 14,718 7,397 1,909 6,093 7,488 22,280,689 17,931,819 196,854 1,021,681 230,266 582,572 1,930,744 284,445 76,156 387,980 87,805 46,929,460 (9,984,998) (463) (847,401) 27,593 16,099 203,056 (60,867) (114,831) (24,836) (1,739,206) 7,298,621 (73,007,301) (232,861) (10,592,480) (616,758) 491,492 (1,338,560) (793,481) (15,012) (829,627) (130,776) 60,526,936 $ (82,992,299) $ (233,324) $ (11,439,881) $ (589,165) $ 507,591 $ (1,135,504) $ (854,348) $ (129,843) $ (854,463) $ (1,869,982) $ 67,825,557
City of Colorado Springs 2020 Annual Comprehensive Financial Report 53

PROPRIETARY FUND COMPONENT UNITSCOMBINING BALANCE SHEETDecember 31, 2020
FountainValley
Authority
Aurora - ColoradoSprings
Joint WaterAuthority
The Twin LakesReservoirand CanalAuthority
The LakeMeredithReservoirAuthority
ASSETS
Current assetsCash and investments $ 7,548,449 $ 167,626 $ 3,246,293 $ 837,430
Accounts receivable (net of allowance
for uncollectibles) 1,273,474 — 637 —
Inventories 239,618 — — —
Due from primary government — — — —
Prepaids 40,448 — 336,645 3,923
Total current assets 9,101,989 167,626 3,583,575 841,353
Noncurrent assetsRestricted cash and cash equivalents 1,968,978 — — 85,097
Other — — 274,279 —
Capital assets nondepreciable:
Land 65,147 — — —
Construction in progress 825,061 154,750 — —
Depreciable capital assets
Machinery and equipment — — — —
Utility plant 93,209,337 9,940,819 14,590,560 3,447,774
Less accumulated depreciation (43,774,403) (3,293,573) (8,026,087) (1,121,362)
Total noncurrent assets 52,294,120 6,801,996 6,838,752 2,411,509
Total assets $ 61,396,109 $ 6,969,622 $ 10,422,327 $ 3,252,862
LIABILITIES AND NET POSITION
Current liabilitiesAccounts payable $ 581,916 $ 77,982 $ 27,576 $ 1,760
Due to primary government — — — —
Unearned revenue 5,336,538 — — —
Accrued interest payable 18,244 — — 17,418
Notes payable 168,097 — — 50,546
Capital lease payable 5,113,557 — — —
Total current liabilities 11,218,352 77,982 27,576 69,724
Noncurrent liabilitiesNotes payable 554,721 — — 806,168
Capital lease payable 2,206,908 — — —
Total noncurrent liabilities 2,761,629 — — 806,168
Total liabilities 13,979,981 77,982 27,576 875,892
Net positionNet investment in capital assets 42,281,859 6,801,996 6,564,473 2,326,412
Restricted
Debt service 1,968,978 — — —
Unrestricted 3,165,291 89,644 3,830,278 50,558
Total net position 47,416,128 6,891,640 10,394,751 2,376,970
Total liabilities and net position $ 61,396,109 $ 6,969,622 $ 10,422,327 $ 3,252,862
The notes to the financial statements are an integral part of this statement.
54 City of Colorado Springs 2020 Annual Comprehensive Financial Report

CITY OF COLORADO SPRINGSCOLORADO
Exhibit 14
TheColorado
CanalCompany
The LakeHenry
ReservoirCompany
Pikes PeakRegional
CommunicationsNetwork Total
$ 722,807 $ 280,620 $ — $ 12,803,225
44,597 719 431,785 1,751,212
— — — 239,618
— — 6,549,727 6,549,727
26,848 1,933 — 409,797
794,252 283,272 6,981,512 21,753,579
— — — 2,054,075
25,334 32,409 — 332,022
— — — 65,147
— 305,521 — 1,285,332
— — 35,510 35,510
2,793,706 1,275,012 — 125,257,208
(2,158,883) (581,366) (4,254) (58,959,928)
660,157 1,031,576 31,256 70,069,366
$ 1,454,409 $ 1,314,848 $ 7,012,768 $ 91,822,945
$ 16,464 $ 36,489 $ 4,416,957 $ 5,159,144
— — 1,572 1,572
— — — 5,336,538
— — — 35,662
— — — 218,643
— — — 5,113,557
16,464 36,489 4,418,529 15,865,116
— — — 1,360,889
— — — 2,206,908
— — — 3,567,797
16,464 36,489 4,418,529 19,432,913
634,823 999,167 31,256 59,639,986
— — — 1,968,978
803,122 279,192 2,562,983 10,781,068
1,437,945 1,278,359 2,594,239 72,390,032
$ 1,454,409 $ 1,314,848 $ 7,012,768 $ 91,822,945
City of Colorado Springs 2020 Annual Comprehensive Financial Report 55

PROPRIETARY FUND COMPONENT UNITSCOMBINING STATEMENT OF ACTIVITIESFor the year ended December 31, 2020
ProgramRevenues Changes in Net Position
Expenses
Chargesfor
Services
FountainValley
Authority
Aurora -ColoradoSprings
Joint Water Authority
The TwinLakes
Reservoirand CanalCompany
Fountain Valley AuthorityGeneral government $ 7,631,853 $ 16,673,545 $ 9,041,692
Aurora-Colorado Springs JointWater Authority
General government 182,426 200,000 $ 17,574
The Twin Lakes Reservoir andCanal Company
General government 1,639,958 1,495,506 $ (144,452)
The Lake Meredith Reservoir CompanyGeneral government 110,029 248,026
The Colorado Canal CompanyGeneral government 602,921 884,880
The Lake Henry Reservoir CompanyGeneral government 63,945 164,029
Pikes Peak RegionalCommunications Network
General government 2,186,741 1,518,234
Total component units $ 12,417,873 $ 21,184,220
Investment earnings 4,054 84 1,076
Total general revenues 4,054 84 1,076
Change in net position 9,045,746 17,658 (143,376)
Total net position - January 1 38,370,382 6,873,982 10,538,127
Total net position - December 31 $ 47,416,128 $ 6,891,640 $ 10,394,751
The notes to the financial statements are an integral part of this statement.
56 City of Colorado Springs 2020 Annual Comprehensive Financial Report

CITY OF COLORADO SPRINGSCOLORADO
Exhibit 15
Changes in Net Position
The LakeMeredithReservoirCompany
TheColorado
CanalCompany
TheLake HenryReservoirCompany
Pikes PeakRegional
CommunicationsNetwork Total
$ 9,041,692
17,574
(144,452)
$ 137,997 137,997
$ 281,959 281,959
$ 100,084 100,084
$ (668,507) (668,507)
8,766,347
257 288 94 121,137 126,990
257 288 94 121,137 126,990
138,254 282,247 100,178 (547,370) 8,893,337
2,238,716 1,155,698 1,178,181 3,141,609 63,496,695
$ 2,376,970 $ 1,437,945 $ 1,278,359 $ 2,594,239 $ 72,390,032
City of Colorado Springs 2020 Annual Comprehensive Financial Report 57

58 City of Colorado Springs 2020 Annual Comprehensive Financial Report

NOTES TO FINANCIAL STATEMENTS
City of Colorado Springs 2020 Annual Comprehensive Financial Report 59

60 City of Colorado Springs 2020 Annual Comprehensive Financial Report

TABLE OF CONTENTS
I. SUMMARY OF SIGNIFICANT ACCOUNTING POLICIES.......................................................................... 63A. Reporting Entity......................................................................................................................................................... 63
1. Governmental Fund Type Component Units...................................................................................................... 632. Proprietary Fund Type Component Units........................................................................................................... 643. Fiduciary Funds.................................................................................................................................................. 664. Joint Ventures..................................................................................................................................................... 67
B. Government-wide and Fund Financial Statements................................................................................................... 68C. Basis of Accounting.................................................................................................................................................... 69D. Assets, Liabilities, Deferred Outflows/Inflows of Resources, and Net Position or Fund Balance............................... 71
1. Deposits and Investments.................................................................................................................................. 712. Receivables and Payables................................................................................................................................. 713. Inventories and Prepaid Items............................................................................................................................ 714. Restricted Assets................................................................................................................................................ 725. Capital Assets..................................................................................................................................................... 726. Deferred Outflows/Inflows of Resources............................................................................................................ 737. Compensated Absences..................................................................................................................................... 748. Long-term Obligations........................................................................................................................................ 749. Net Position/Fund Balance................................................................................................................................. 7410. Municipal Solid Waste Landfill Closure and Postclosure Care Costs................................................................. 7611. Derivative Instruments........................................................................................................................................ 76
II. STEWARDSHIP, COMPLIANCE AND ACCOUNTABILITY...................................................................... 77A. Budgetary Information................................................................................................................................................ 77B. Excess of Expenditures over Appropriations.............................................................................................................. 77C. Deficit Fund Equity..................................................................................................................................................... 78
III. DETAILED NOTES ON ALL FUNDS......................................................................................................... 79A. Unrestricted and Restricted Cash and Investments................................................................................................... 79
1. Deposits.............................................................................................................................................................. 802. Investments........................................................................................................................................................ 803. Component Unit Deposits and Investments....................................................................................................... 844. Fair Value Measurement.................................................................................................................................... 85
B. Receivables................................................................................................................................................................ 88C. Interfund and Component Unit Receivables, Payables and Transfers....................................................................... 89D. Transfer of Surplus..................................................................................................................................................... 90E. Unavailable/Unearned Revenue................................................................................................................................. 91F. Inventories................................................................................................................................................................... 91G. Changes in Capital Assets......................................................................................................................................... 92H. Leases........................................................................................................................................................................ 98
1. Operating Leases............................................................................................................................................... 982. Operating Leases (Component Units)................................................................................................................ 983. Capital Leases.................................................................................................................................................... 984. Capital Leases (Component Units)..................................................................................................................... 1005. Lease and Integration Agreements..................................................................................................................... 100
NOTES TO FINANCIAL STATEMENTS December 31, 2020
City of Colorado Springs 2020 Annual Comprehensive Financial Report 61

I. Revolving Loan Agreement/Letter of Credit................................................................................................................. 104J. Long-term Debt........................................................................................................................................................... 104
1. Summary of Long-term Debt.............................................................................................................................. 1072. Changes in Long-term Liabilities........................................................................................................................ 1103. Annual Debt Service Requirements of Long-term Debt...................................................................................... 112
K. Industrial Development Revenue Bonds and Other Instruments Issued under the Colorado County and Municipal Development Revenue Bond Act............................................................................................................................... 118
L. Fund Balance.............................................................................................................................................................. 119M. Derivatives and Interest Rate Swaps......................................................................................................................... 120
1. Utilities Derivative Instruments........................................................................................................................... 1202. Colorado Springs Urban Renewal Authority Derivative Instruments.................................................................. 125
N. Tax Abatements.......................................................................................................................................................... 125O. Restatement of Net Position...................................................................................................................................... 126
IV. OTHER INFORMATION............................................................................................................................. 127A. Risk Management....................................................................................................................................................... 127B. Donor-restricted Endowments.................................................................................................................................... 128C. Postemployment Benefits Other than Pensions......................................................................................................... 129
1. Colorado PERA Health Care Trust Fund............................................................................................................ 1292. The Colorado Springs OPEB Plan..................................................................................................................... 1383. Colorado Springs Utilities OPEB Plan................................................................................................................ 144
D. Commitments and Contingent Liabilities.................................................................................................................... 1461. Construction and Purchase Commitments......................................................................................................... 1462. Refunded Bonds................................................................................................................................................. 1473. Charter Amendments.......................................................................................................................................... 1474. Litigation............................................................................................................................................................. 1485. Contingent Liabilities.......................................................................................................................................... 1486. Environmental Matters........................................................................................................................................ 149
E. Passenger Facility Charges........................................................................................................................................ 149F. Customer Facility Charges.......................................................................................................................................... 149G. Joint Ventures - Utilities.............................................................................................................................................. 149H. Retirement Plans........................................................................................................................................................ 150
1. Non-Uniformed Employees................................................................................................................................ 1512. Uniformed Employees........................................................................................................................................ 160
I. Accounting Changes.................................................................................................................................................... 179J. Subsequent Events..................................................................................................................................................... 180
NOTES TO FINANCIAL STATEMENTS December 31, 2020
62 City of Colorado Springs 2020 Annual Comprehensive Financial Report

I. SUMMARY OF SIGNIFICANT ACCOUNTING POLICIES
The City of Colorado Springs (City) is a home-rule city, organized under provisions of the Colorado Constitution. In 2011, the City transitioned to a “council-mayor” form of government as the result of the November 2, 2010, municipal election. Historically, the City had been managed by a “council-manager” form of government. The City provides services, as authorized by its Charter, to advance the welfare and safety of the City and its residents.
The financial statements of the City have been prepared in conformity with generally accepted accounting principles (GAAP) as applied to units of local government and promulgated by the Governmental Accounting Standards Board (GASB). The following is a summary of the more significant policies.
A. Reporting Entity
As required by accounting principles generally accepted in the United States of America, these financial statements present the primary government and its component units, those entities for which the City is considered to be financially accountable. Blended component units are those entities, which while legally separate, are, in substance, part of the City’s operation and the financial data for which are combined with that of the City and reported at both the government-wide and fund financial reporting level. Discretely presented component units are legally separate entities for which the financial data are presented separately from the financial data of the City. The City has blended the General Improvement Districts and Public Authority for Colorado Energy. All other component units are discretely presented.
1. Governmental Fund Type Component Units
General Improvement Districts – Spring Creek, Briargate, and Market Place at Austin Bluffs. General Improvement Districts (GIDs) were created under provisions of Colorado state statutes. Each district has the power to acquire, construct or install public improvements within its own boundaries and to finance such improvements by levying a general property tax upon the benefiting property. The GIDs are legally separate entities from the City. Because City Council sits as the Board of Directors for each of the GIDs, and the City can impose its will over the GIDs, their financials are blended in the City financial statements. Services provided by the GIDs are entirely for the benefit of the citizens of each respective district. The fiscal year-end for each of these districts is December 31.
Colorado Springs Health Foundation – Colorado Springs Health Foundation (CSHF) was established in 2012 under the provisions of City Council Resolution No. 121-12, resulting from the lease of Memorial Health System (MHS System) by University of Colorado Health (UCH). CSHF is a 501(c)(3) nonprofit corporation which receives funds from the City originating from the lease which are not held for other purposes in accordance with the agreements (see Note III.H.5). The CSHF will make distributions from those funds for the purpose of addressing health issues in the MHS System service area. CSHF is discretely presented in the City’s financial statements. CSHF is a legally separate entity from the City. The City does, however, appoint a voting majority of CSHF's board and is able to impose its will on CSHF. The City’s board and CSHF’s board are not substantively the same. The fiscal year-end for CSHF is December 31.
Colorado Springs Urban Renewal Authority – The Colorado Springs Urban Renewal Authority (CSURA) was formed under the provisions of Colorado state statutes. The CSURA has the power to issue tax increment financing in order to acquire property and fund improvements. CSURA is discretely presented in the City’s financial statements. CSURA is a legally separate
NOTES TO FINANCIAL STATEMENTS December 31, 2020
City of Colorado Springs 2020 Annual Comprehensive Financial Report 63

entity from the City. The City does, however, appoint a voting majority of CSURA’s board and is able to impose its will on CSURA. The City’s board and CSURA’s board are not substantively the same. Services provided by CSURA are entirely for the benefit of the citizens. The fiscal year-end for CSURA is December 31.
Colorado Springs Downtown Development Authority – The Colorado Springs Downtown Development Authority (the Authority) was established in 2007 by the City of Colorado Springs City Council. The Authority was organized for the public health, safety, prosperity, security and welfare in order to halt or prevent deterioration of property values or structures within the central business district. Operations are financed primarily by tax revenues collected on real and personal property located within the central business district. The Authority is a separate legal entity and is discretely presented in the City’s financial statements. An eleven-member board, as provided by the City of Colorado Springs, Colorado Ordinance 07-15, governs the Authority. The fiscal year-end for the Authority is December 31.
Business Improvement Districts – Barnes & Powers North, Barnes & Powers South, Briargate Center, Creekwalk Marketplace, First & Main, First & Main No. 2, First & Main North, Greater Downtown Colorado Springs, Interquest North, Interquest South, Interquest Town Center, MW Retail, Powers & Woodmen Commercial, Southwest Downtown, and USAFA Visitor's Center. Business Improvement Districts (BIDs) were created under provisions of Colorado state statutes. The BIDs have the power to acquire, construct or install public improvements within their own boundaries and to finance such improvements by levying a general property tax upon the benefiting property. The BIDs are discretely presented in the City’s financial statements. The BIDs are legally separate entities from the City. The City does, however, approve the budgets and is able to impose its will on the BIDs. The City’s board and the BID boards are not substantively the same nor does the City appoint a voting majority of the BIDs board. Services provided by the BIDs are entirely for the benefit of the business communities in the districts. The fiscal year-end for the BIDs is December 31. MW Retail BID has not yet commenced activity and therefore is not displayed in the City's financial statements. USAFA Visitor's Center BID applied for an audit exemption from the state of Colorado due to immaterial financial activity and therefore is not displayed in the City's financial statements.
The financial statements of each of these entities may be obtained at the following address:
City of Colorado SpringsChief Financial Officer30 South Nevada Avenue, Suite 202Colorado Springs, CO 80903
2. Proprietary Fund Type Component Units
Public Authority for Colorado Energy (PACE) – In June 2008, the City contracted to purchase approximately 20.0% of Utilities’ natural gas supply needs for 30 years through a natural gas prepayment transaction with Merrill Lynch Commodities, Inc., Bank of America Corporation and Royal Bank of Canada that is financed by PACE non-recourse revenue bonds. PACE is obligated to pay the principal and interest on the PACE Bonds. Utilities is obligated to purchase and pay for natural gas tendered for delivery by PACE at an index price minus a predetermined discount and is not obligated to make payments in respect to debt service on the PACE Bonds. PACE is a legally separate entity and provides services entirely to Colorado Springs Utilities (Utilities), an enterprise fund of the City. Because PACE provides services entirely to Utilities, PACE is considered a blended component unit.
NOTES TO FINANCIAL STATEMENTS December 31, 2020
64 City of Colorado Springs 2020 Annual Comprehensive Financial Report

The following proprietary fund type component units are discretely presented, as they are legally separate from the City, the City Council and the Boards of Directors of the component units are not substantively the same, and the component units do not provide services exclusively to the City.
Fountain Valley Authority – The Fountain Valley Authority constructed a water treatment plant, approximately 17 miles south of the City, with 18,000,000 gallons per day capacity. Utilities acts as operator of the plant under contract with the Fountain Valley Authority. Utilities is entitled to receive approximately 71.4% of the water treated at the Fountain Valley Authority plant. The remaining water is available to the other Fountain Valley Authority participants, which include the City of Fountain, the Security Water District, the Stratmoor Hills Water District and the Widefield Water and Sanitation District, each of which owns and operates a water distribution system. The Fountain Valley Authority is a legally separate entity and is under the direction of a Board of Directors consisting of eight persons appointed by the member governments they represent. The Establishing Contract specifies that the Board of Directors is made up of four members designated by the City and one designated each by the remaining four participants. Fountain Valley Authority is a component unit due to the nature and significance of its relationship to the City.
Under the applicable long-term contracts relating to the Fountain Valley Authority, Utilities is obligated to pay water treatment service charges to the Fountain Valley Authority and water conveyance service charges to the U.S. Bureau of Reclamation (Bureau) for conveyance of its water through the Bureau’s Fountain Valley Conduit, which conveys raw water from the Pueblo Reservoir to the Fountain Valley Authority’s treatment plant and treated water from the treatment plant to distribution reservoirs of the Fountain Valley Authority participants.
Aurora-Colorado Springs Joint Water Authority – The Aurora-Colorado Springs Joint Water Authority has constructed a 66-inch diameter pipeline from the Twin Lakes Dam, which is located approximately 12 miles south of Leadville, Colorado, to connect with the Otero Pumping Station intake pipeline located approximately 10 miles north of Buena Vista, Colorado. The sole participants and customers of the Aurora-Colorado Springs Joint Water Authority are the City of Aurora and Utilities. The Aurora-Colorado Springs Joint Water Authority is a legally separate entity and is under the direction of the Board of Directors consisting of six voting members and two nonvoting members. Three voting directors represent each city and are appointed by the city councils of each city. Utilities has a 66.7% participation share in the Aurora-Colorado Springs Joint Water Authority’s project, which was determined by the parties on the basis of their projected pumping demands. No provision is made in the Aurora-Colorado Springs Joint Water Authority contracts for adjustments in participation shares if actual pumping demands differ from these projections. Therefore, it is possible that the transmission service charges to be paid by Utilities will be disproportionate to the water transmission service that Utilities is using during a particular time period. Aurora-Colorado Springs Joint Water Authority is a component unit due to the nature and significance of its relationship to the City.
Canal and Reservoir Companies – Utilities owns from 51.9% to 77.2% in four canal and reservoir companies which include The Twin Lakes Reservoir and Canal Company, The Lake Meredith Reservoir Company, The Colorado Canal Company and The Lake Henry Reservoir Company. This ownership interest represents proportionate ownership and control of the companies’ facilities and water rights. The water rights add significant physical water to the water supply portfolio in addition to allowing for exchange, storage, staging, and delivery of Utilities’ water supply.
NOTES TO FINANCIAL STATEMENTS December 31, 2020
City of Colorado Springs 2020 Annual Comprehensive Financial Report 65

Other auditors have examined the financial statements of each of these entities, and their complete individual financial statements may be obtained at the following address:
Colorado Springs UtilitiesChief Planning and Finance OfficerP.O. Box 1103, Mail Code 950Colorado Springs, CO 80947-0950
The Pikes Peak Regional Communications Network (PPRCN) was established by an intergovernmental agreement between the City and El Paso County (County) on December 1, 1999. PPRCN commenced operations during 2001 and is governed by a five member Board of Directors of which two members are appointed by the City, one is appointed by Utilities, and two are appointed by the County. PPRCN was established to provide a modern, trunked radio system, available to the participating public safety and public service activities, throughout the City and the County.
The complete individual financial statements for PPRCN may be obtained at the following address:
City of Colorado SpringsChief Financial Officer30 South Nevada Avenue, Suite 202Colorado Springs, CO 80903
3. Fiduciary Component Units
Pension Trust Funds
The Colorado Springs Old Hire Fire and Police pension plans are single-employer closed plans with no active employees. The Fire and Police Pension Association (FPPA) invests the assets of these plans, in an investment structure approved by the City, and administers the distribution of benefit payments to the retirees. However, the responsibility for determining the amounts of those benefit payments remains with the City. The City is also responsible for governance of the plans through the Old Hire Police and Fire Pension boards. The City constitutes the majority on both Old Hire boards and, therefore, has the ability to impose its will upon the plans. Financial burden remains with the City which is the sole source of the actuarially determined annual funding of the plans. As a result, the plans are reported separately as fiduciary component units of the City in exhibits H-1 and H-2.
FPPA issues a publicly available financial report that includes financial statements and required supplementary information for FPPA. That report may be obtained by outline at https://fppaco.org/annual-reports.html or by writing to:
Fire and Police Pension Association of Colorado5290 DTC Parkway, Suite 100Greenwood Village, CO 80111-2721(303) 770-3772
NOTES TO FINANCIAL STATEMENTS December 31, 2020
66 City of Colorado Springs 2020 Annual Comprehensive Financial Report

4. Joint Ventures
The City has joined with other governmental entities in a joint venture to provide building and construction code inspection and enforcement. The joint venture, Pikes Peak Regional Building Department (PPRBD), in which the City participates, is not considered a component unit and is, therefore, not included in the City’s reporting entity. The PPRBD was formed in accordance with intergovernmental agreements among various affected local governments to administer and enforce building and construction codes on behalf of its member entities. Member entities are the City, the County and the cities of Manitou Springs, Green Mountain Falls, Fountain, and the towns of Monument and Palmer Lake. A three-member commission appointed by the City, the County and a member selected by the remaining municipalities, governs the PPRBD. The City has not invested money in the PPRBD and the commission is required to set its fees so as to fully recover operating expenses. Since the City has only a residual equity interest, the equity method is not considered appropriate for this joint venture.
The City has joined with the County and cities of Manitou Springs and Green Mountain Falls, and the town of Ramah, Colorado, in a joint venture to provide infrastructure improvements for their various municipalities. The joint venture, Pikes Peak Rural Transportation Authority (PPRTA), is not considered a component unit of the City and is, therefore, not included in the City’s reporting entity. PPRTA is funded with a 1% sales and use tax approved by voters in November 2004. In 2012, voters extended the 1% tax for another ten years starting in 2015 and running through 2024. These funds are allocated to the various municipalities and are to be used for capital projects, maintenance programs, and transit services. PPRTA is governed by a nine-member board appointed by the member municipalities.
The City of Colorado Springs, along with 38 agencies within El Paso and Teller Counties, has entered into a joint venture to provide the technical infrastructure necessary to connect emergency 9-1-1 telephone callers with the proper communication center. The joint venture of the El Paso-Teller County Emergency Telephone Service Authority (E911 Authority), in which the City participates, is not considered a component unit and is, therefore, not included in the City’s reporting entity. The E911 Authority was formed by an intergovernmental agreement in 1989 and is governed by a nine-member board appointed by the City (3 members), El Paso County (2 members), Teller County (1 member), and the Board itself (3 members) from a list of qualified nominees. The E911 Authority is funded entirely by a $1.35 per phone line tariff applied to every wire line and wireless telephone with a subscriber address within the two-county area. The funds are used to maintain the emergency telephone system infrastructure, call-answering and processing equipment, back-up power supplies, and furnishings at each of the communication centers in the two county service area.
The City’s Fire Department is a member of the Colorado Metropolitan Certification Board (CMCB), a joint venture along with the Denver Fire Department, Aurora Fire Department, the West Metro Fire Protection District, Poudre Fire Authority, and Littleton Fire Rescue, that provides certification of fire training to its member fire departments. The CMCB is accredited by the National Board on Fire Service Professional Qualifications for Fire Service Certification. The joint venture of the CMCB, in which the City participates, is not considered a component unit and is, therefore, not included in the City’s reporting entity. The CMCB was formed in accordance with an intergovernmental agreement in 1996 and is governed by the current six voting members. In 2015, the Board determined that the governance model will not exceed seven members with the original four retaining the majority. The six-member board is comprised of Training Chiefs appointed by each Department’s Fire Chief. It is intended that each of the CMCB member governments cover one-sixth of the operational expenses associated with the CMCB.
NOTES TO FINANCIAL STATEMENTS December 31, 2020
City of Colorado Springs 2020 Annual Comprehensive Financial Report 67

Utilities has an equity interest of 5.0% in Young Gas Storage Company Ltd. (Young). Young is a Colorado Limited Partnership organized on June 30, 1993, to develop and operate a natural gas storage system near Fort Morgan, Colorado.The financial statements of the PPRBD, the PPRTA, the E-911 Authority and the CMCB may be obtained at the following address:
City of Colorado SpringsChief Financial Officer30 South Nevada Avenue, Suite 202Colorado Springs, CO 80903
The financial statements of Young may be obtained at the following address:
Colorado Springs UtilitiesChief Planning and Financial OfficerP.O. Box 1103, Mail Code 950Colorado Springs, CO 80947-0950
B. Government-wide and Fund Financial Statements
The government-wide financial statements (i.e. the statement of net position and the statement of activities) report information on all of the nonfiduciary activities of the primary government and its component units. Interfund activity has been eliminated in the process of consolidating the government-wide financial statements, except for the interfund services provided and used. Governmental activities, which normally are supported by taxes and intergovernmental revenues, are reported separately from business-type activities, which rely to a significant extent on fees and charges for support. Likewise, the primary government is reported separately from certain legally separate component units for which the primary government is financially accountable.
The statement of activities demonstrates the degree to which the direct expenses of a given function or segment is offset by program revenues. Direct expenses are those that are clearly identifiable with a specific function or segment. Program revenues include: 1) charges to customers or applicants who purchase, use, or directly benefit from goods, services, or privileges provided by a given function or segment, and 2) grants and contributions that are restricted to meeting the operational or capital requirements of a particular function or segment. Taxes and other items not properly included among program revenues are reported instead as general revenues. General revenues include all taxes.
Separate financial statements are provided for governmental funds, proprietary funds, and fiduciary funds, even though the latter are excluded from the government-wide financial statements. Major individual governmental funds and major individual enterprise funds are reported as separate columns in the fund financial statements.
NOTES TO FINANCIAL STATEMENTS December 31, 2020
68 City of Colorado Springs 2020 Annual Comprehensive Financial Report

C. Basis of Accounting
The government-wide financial statements are reported using the economic resources measurement focus and the accrual basis of accounting, as are the proprietary fund and fiduciary fund financial statements. Revenues are recorded when earned and expenses are recorded when a liability is incurred, regardless of the timing of related cash flows. Property taxes are recognized as revenues in the year for which they are levied. Grants and similar items are recognized as revenue as soon as all eligibility requirements imposed by the provider have been met.
Governmental fund financial statements are reported using the current financial resources measurement focus and the modified accrual basis of accounting. Revenues are recognized as soon as they are both measurable and available. Revenues are considered to be available when they are collectible within the current period or soon enough thereafter to pay liabilities of the current period. For this purpose, the City considers revenues to be available if they are collected within 30 days of the end of the current fiscal period for all sales tax transactions or within 60 days of the end of the current fiscal period for all other transactions. Expenditures are recognized when the related liability is incurred, with the exception of debt service expenditures and expenditures related to compensated absences and claims and judgments which are recorded when due.
Licenses and interest associated with the current fiscal period are all considered to be susceptible to accrual and so have been recognized as revenues of the current fiscal period. All other revenue items are considered to be measurable and available only when cash is received by the government.
The City reports the following major governmental fund:
• The General Fund is the government’s primary operating fund. It accounts for all financial resources of the general government, except those required to be accounted for in another fund.
The City reports the following major proprietary funds:
• Utilities fund provides water and wastewater collection, treatment, and distribution system; electric generation, transmission, distribution and street light system; and gas distribution system.
• PACE fund provides natural gas to Utilities.
• MHS fund carries out its rights and duties under the Lease Agreement as described in Note III.H.5.
Additionally, the City reports the following fund types:
• Special revenue funds account for revenue derived from specific sources that are restricted legally or by regulation.
• Capital projects funds account for financial resources used for the acquisition or construction of major capital facilities and infrastructure.
• Permanent funds account for the activities of resources that are legally restricted to the extent that earnings, but not principal, may be used for purposes that support the City’s programs.
NOTES TO FINANCIAL STATEMENTS December 31, 2020
City of Colorado Springs 2020 Annual Comprehensive Financial Report 69

• Internal service funds account for general liability insurance, workers’ compensation insurance, health insurance, printing and mailing services, and radio services provided to other departments or agencies of the City on a cost-reimbursement basis.
• Fiduciary funds consist of pension trust funds. These pension funds account for the activities of two City police and fire pension plans. Pension resources and benefit payments to qualified public safety employees for the Old Hire Police and Old Hire Fire pension plans occur in these fiduciary funds. Additional information on these plans is available in Note IV.H.2.
As a general rule, the effect of interfund activity has been eliminated from the government-wide financial statements. Exceptions to this general rule are surplus revenue and other charges between the General Fund and Utilities. Elimination of these charges would distort the direct costs and program revenues reported for the various functions concerned.
Proprietary funds distinguish operating revenues and expenses from non-operating items. Operating revenues and expenses generally result from providing services and producing and delivering goods in connection with proprietary funds’ principal ongoing operations. The principal operating revenues of the enterprise funds and internal service funds are charges to customers for sales and services. Operating expenses for enterprise funds and internal service funds include the cost of sales and services, administrative expenses, and depreciation on capital assets. All revenues and expenses not meeting this definition are reported as non-operating revenues and expenses.
As a general policy, when both restricted and unrestricted resources are available for use, it is the City’s policy to use restricted resources first, then unrestricted resources as they are needed. The policy differs for special revenue and permanent funds as discussed in Note D.9.
Remainder of page intentionally blank
NOTES TO FINANCIAL STATEMENTS December 31, 2020
70 City of Colorado Springs 2020 Annual Comprehensive Financial Report

D. Assets, Liabilities, Deferred Outflows/Inflows of Resources, and Net Position or Fund Balance
1. Deposits and Investments
In accordance with City Code and Colorado state statutes, the City maintains an Investment Policy approved by City Council. Per the Investment Policy, the City is authorized to invest in obligations of the United States, certain US instrumentalities; certain international agency securities; general obligation or revenue bonds of any state or local government of the U.S.; bankers acceptances of certain banks; certain commercial paper; local government investment pools; written repurchase agreements properly collateralized by certain authorized securities; certain money market funds; negotiable and time certificates of deposit; corporate bonds; and guaranteed investment contracts.
Also in accordance with City Code, the City maintains a separate Cemetery Endowment Fund (CEF) Investment Policy approved by City Council. Per the CEF Investment Policy, the City is authorized to invest in a broader class of assets including fixed income instruments, domestic and global equities, special opportunities and commodities. The investment vehicles used to gain exposure to the asset classes may include mutual funds, commingled trust funds, separate accounts, limited partnerships, and offshore exempted companies.
For purposes of the statements of cash flows, cash and cash equivalents include amounts on hand and in demand deposits with original maturities of 90 days or less.
Investments are stated at fair value based on quoted market prices.
Disaggregated asset amounts for the pension trust funds are not available from FPPA.
2. Receivables and Payables
Outstanding balances between funds at the end of the fiscal year are referred to as “due to/from other funds”. Any residual balances outstanding between the governmental activities and business-type activities are reported in the government-wide financial statements as “internal balances”.
Trade and property tax receivables shown on the financial statements are net of an estimated allowance for uncollectibles.
The County Assessor certifies property valuations to the City on November 25 of each year. By December 15, the City sets and certifies its mill levy rate with the County, which then bills and collects the property taxes due. These property taxes attach as an enforceable lien on January 1 of the tax year. The taxes are payable in two installments on February 28 and June 15, or in one installment due April 30.
3. Inventories and Prepaid Items
Inventories held for resale, exclusive of component units, are reported at the lower of cost or market. Inventories of supplies are reported at cost. Proprietary fund inventories, including internal service funds, consist of materials, supplies, and fuel stock. The costs of inventories are recorded as expenditures when consumed rather than when purchased. Certain payments to vendors reflect costs applicable to future accounting periods and are recorded as prepaid items in both government-wide and fund financial statements. At the combining and individual fund
NOTES TO FINANCIAL STATEMENTS December 31, 2020
City of Colorado Springs 2020 Annual Comprehensive Financial Report 71

reporting level, an equal amount of fund balance is considered non-spendable as the amount is not available for general appropriation.
Business-type activities show a significant prepaid item for PACE. PACE has prepaid for delivery of natural gas with the proceeds from bonds and entered into a Prepaid Gas Agreement (Agreement) effective June 11, 2008. PACE amortizes the historical cost of the prepaid gas supply pursuant to the Agreement on a net present value (NPV) basis based upon the change in the NPV of the Agreement over its remaining thirty-year contract life.
4. Restricted Assets
In accordance with applicable bond covenants, ordinances and conditions attached by donors, certain investments are displayed as restricted on the financial statements of certain funds. Restricted investments are carried at fair value.
5. Capital Assets
Capital outlays are recorded as expenditures of governmental funds in the fund financial statements and as assets in the government-wide financial statements to the extent the City’s capitalization thresholds, $5,000 for general assets and $500,000 for infrastructure assets, are met. Depreciation is recorded on capital assets on a government-wide basis using the straight-line method. To the extent the City’s capitalization thresholds are met, capital outlays of the proprietary funds are recorded as capital assets and depreciated over their useful lives using the straight-line method of depreciation on both the fund basis and the government-wide basis of accounting. The following are the estimated useful lives used for the straight-line method of depreciation:
Infrastructure 20 - 35 yearsBuildings 10 - 40 yearsUtility plant 25 - 100 yearsImprovements other than buildings 15 - 25 yearsFurniture and equipment 3 - 15 yearsIntangibles 5 - infinite
Donated assets are valued at their estimated acquisition value on the date of receipt. The City does not capitalize historical treasure or works of art. With the early adoption of GASB Statement No. 89, Accounting for Interest Cost Incurred Before the End of a Construction Period (GASB 89), as of January 1, 2019, the City is no longer capitalizing interest costs incurred during construction of the assets of business-type activities.
GASB Statement No. 83, Certain Asset Retirement Obligations was effective for the City in 2019. The City performed an assessment of its legal obligations to perform future asset retirement activities related to its tangible capital assets and determined there are no material obligations as of December 31, 2020. An annual assessment is performed, and any future material obligations will be recorded in the period they are identified.
NOTES TO FINANCIAL STATEMENTS December 31, 2020
72 City of Colorado Springs 2020 Annual Comprehensive Financial Report

Utilities computes depreciation and amortization on plant in service on a straight-line, service-life basis. Depreciation is calculated using the following estimated maximum service lives for major asset classifications:
Electric boiler plant/station equipment 25 yearsElectric underground conduit 28.5 yearsGas mains and services 80 yearsWater source of supply 100 yearsWater treatment plant 25 yearsWater transmission and distribution mains 50 yearsSewer mains and laterals 100 yearsWastewater preliminary treatment facility 45 yearsGeneral structures and improvements 57 yearsIntangibles 50 years
6. Deferred Outflows/Inflows of Resources
The statement of net position and balance sheet will report a separate section for deferred outflows of resources. This separate financial statement element, deferred outflows of resources, represents a consumption of net position that applies to a future period(s) and so will not be recognized as an outflow of resources (expense/expenditure) until then. The City only has four items that qualify for reporting in this category. The first item is deferred cash flow hedges – unrealized loss on derivative instruments reported in the government-wide statement of net position and the proprietary funds balance sheet. This amount is recognized when the interest rate cap is exercised. The second, loss on debt refundings, is reported in the government-wide statement of net position, the proprietary funds balance sheet, and governmental fund component units combining statement of net position. This amount is deferred and amortized over the shorter of the life of the refunded or refunding debt. The third and fourth items recorded as a deferred outflow of resources are for pension-related amounts and other postemployment benefit related amounts as described below.
The statement of net position and balance sheet will report a separate section for deferred inflows of resources. This separate financial statement element, deferred inflows of resources, represents an acquisition of net position that applies to a future period(s) and so will not be recognized as an inflow of resources (revenue) until that time. The City has four types of items that qualify for reporting in this category. The first item, unavailable revenue, is reported in the governmental funds balance sheets, government-wide statement of net position, and governmental fund component units combining statement of net position. The governmental funds report unavailable revenues from two sources: property taxes and loans. These amounts are initially deferred on the statement of net position and subsequently recognized on the statement of activities as an inflow of resources in the following fiscal year, when the amounts become available for spending. The second item, gain on debt refundings, is reported in both the government-wide statement of net position and proprietary funds balance sheet. Gain on debt refundings is deferred and amortized over the shorter of the life of the refunded or refunding debt. The third and fourth items recorded as a deferred inflow of resources are for pension-related amounts and other postemployment benefit related amounts as described below.
NOTES TO FINANCIAL STATEMENTS December 31, 2020
City of Colorado Springs 2020 Annual Comprehensive Financial Report 73

Deferred inflows and outflows of resources related to pensions as well as related to OPEB (other postemployment benefits) arise from differences between expected and actual experience with regard to economic and demographic factors, changes in assumptions or other inputs, projected and actual plan earnings, and changes in proportionate share (if a cost sharing plan). These deferrals are amortized over a closed period. The amounts not recognized as a pension expense and OPEB expense in the current period are reported as deferred outflows or deferred inflows related to pensions and deferred outflows or deferred inflows related to OPEB, respectively. Contributions made to the plans subsequent to the plans fiduciary net position measurement date are recorded as deferred outflows of resources related to pensions and deferred outflows of resources related to OPEB.
7. Compensated Absences
City employees earn sick leave and vacation leave in varying amounts depending upon years of service. The City accrues compensated absences in the government-wide and proprietary fund financial statements. A liability for the amount is reported in governmental funds only if they have matured, for example as a result of employee resignations and retirements.
8. Long-term Obligations
For long-term obligations, only the current portion, or the portion financed from expendable available financial resources, is reported on the governmental fund financial statements. The current and non-current portions are recorded in the government-wide and the proprietary fund financial statements. For certain debt issues, Utilities and CSURA enter into interest rate swap agreements to modify their interest rates on outstanding debt.
In the government-wide and proprietary fund financial statements, bond premiums and discounts, as well as prepaid insurance costs related to issuance, are deferred and amortized over the life of the bonds using the straight-line method. Bonds payable are reported net of the applicable bond premium or discount. Prepaid insurance costs related to bond issuance are amortized over the term of the related debt. In the fund financial statements, governmental funds recognize bond premiums and discounts, as well as prepaid insurance costs and other costs related to bond issuance, during the period in which they occur. The face amount of debt issued is reported as other financing sources. Premiums and discounts received on debt issuance are reported as other financing sources or uses. Prepaid insurance costs and other costs related to bond issuance, whether or not withheld from the actual debt proceeds received, are reported as debt service expenditures.
9. Net Position/Fund Balance
Sometimes the City will fund outlays for a particular purpose from both restricted (restricted bonds or grant proceeds) and unrestricted resources. In order to calculate the amounts to report as restricted net position and unrestricted net position in the government-wide and proprietary fund financial statements, a flow assumption is made about the order in which the resources are considered to be applied. It is the City’s policy to consider restricted net position to have been depleted before unrestricted net position is applied.
NOTES TO FINANCIAL STATEMENTS December 31, 2020
74 City of Colorado Springs 2020 Annual Comprehensive Financial Report

In the fund financial statements, fund balance of the City’s governmental funds are classified as nonspendable, restricted, committed, assigned, or unassigned. A governmental fund other than the General Fund may not necessarily have all five components of fund balance.
Nonspendable fund balances indicate amounts that cannot be spent either 1) due to form, for example, prepaid items and inventories, or 2) due to legal or contractual requirements to be maintained intact, for example, the principal of an endowment or the capital of a revolving loan fund. It also includes assets that will not convert to cash soon enough to affect the current period such as the long-term portion of loans and notes receivable as well as property held for resale.
Restricted fund balances indicate amounts subject to externally enforceable legal restrictions. Such restrictions are typically imposed by parties altogether outside the City such as creditors, grantors, contributors, or other governments.
Committed fund balances indicate amounts constrained by limitations that the City, by resolution, imposes on itself by City Council (highest decision making level). It requires the same level of resolution by City Council to remove or change the constraints placed on the resources. The action that imposed the limitation would need to occur no later than the close of the reporting period.
Assigned fund balance is the portion of fund balance that reflects the City’s intended use of resources but does not meet the criteria to be classified as committed. The City’s Charter authorizes the Mayor or Mayor’s designee to assign fund balance through the use of encumbrances. City Council may also assign fund balance as it does when appropriating fund balance to cover a gap between estimated revenue and appropriations in the subsequent year’s appropriated budget. Unlike commitments, assignments often exist temporarily. In other words, an additional action does not normally have to be taken for the removal of an assignment. Interest earned on fund balances is assigned to be used by that fund unless otherwise specified through City Council or voter documentation.
Unassigned fund balances indicate amounts in the General Fund that are not classified as non-spendable, restricted, committed, or assigned. The General Fund is the only fund that would report a positive amount in unassigned fund balance. Negative fund balances in other governmental funds are reported as unassigned once other purposes for that fund were reduced. Additionally, for the General Fund, any negative restricted, committed, or assigned fund balance would be eliminated by reducing unassigned fund balance first.
For the General Fund, in the event that an expenditure can be considered restricted or unrestricted (committed, assigned, or unassigned) and both have available amounts, the expenditure will be first applied against the most restrictive fund balance classification.
The order of use of funds for special revenue funds and other (permanent) funds will be from the least constrained to most constrained (assigned, committed, restricted, and then non-spendable).
In the City’s Financial Policies included in the annual budget document, the City’s goal target range for the General Fund reserve – unrestricted fund balance is 16.67% to 25% of the following year’s expenditure budget. The target for the unrestricted General Fund balance would exclude the TABOR emergency reserves but include other categories of fund balance that are committed, assigned or unassigned.
NOTES TO FINANCIAL STATEMENTS December 31, 2020
City of Colorado Springs 2020 Annual Comprehensive Financial Report 75

10. Municipal Solid Waste Landfill Closure and Postclosure Care Costs
The City is subject to the Colorado Department of Public Health and Environment regulations, which require the City to incur closure and postclosure care costs for landfills. As of December 31, 2020, the Utilities fund recognized a liability of $5,084,917 for closure and postclosure care costs based upon landfill capacity used to date. The estimated total current cost of closure and postclosure care to be recognized for the Utilities fund landfills is $8,264,677. The average landfill capacity used to date is 67.7%. As of December 31, 2020, the governmental activities recognized a liability of $346,090 for closure and postclosure care costs in the government-wide financial statements. There are no financial assurance requirements or restricted assets for the payment of closure and postclosure care costs. Estimates are stated in current dollars and shall be adjusted annually for inflation and changes in laws and regulations. An independent assessment is done every five years to verify this cost. Based on the last independent assessment adjusted for inflation, the total closure and postclosure costs for governmental and business-type activities combined are $8,610,767. The last independent assessment was completed in 2018.
11. Derivative Instruments
Utilities uses financial derivative instruments to manage its exposure to fluctuating natural gas prices through the use of natural gas hedge contracts as well as its exposure to changing interest rates through the use of interest rate swaps. Colorado Springs Urban Renewal Authority also uses financial derivatives in the form of an interest rate swap in order to hedge interest rates and protect against rising interest rates. See Note III.M. for further discussion related to derivatives and interest rate swaps.
All financial derivatives are stated on the balance sheet at fair value as of December 31, 2020, based on quoted market prices, current market conditions, or other estimates obtained from third-party broker dealers or valuation services.
Derivative instruments deemed effective by applying methods of evaluating effectiveness pursuant to GASB 53, Accounting and Financial Reporting for Derivative Instruments, are recognized as cash flow hedges. Changes in the fair value of cash flow hedge derivative instruments are reported as either a deferred cash flow hedge outflow or inflow on the Statements of Net Position.
Remainder of page intentionally blank
NOTES TO FINANCIAL STATEMENTS December 31, 2020
76 City of Colorado Springs 2020 Annual Comprehensive Financial Report

II. STEWARDSHIP, COMPLIANCE AND ACCOUNTABILITY
A. Budgetary Information
In accordance with City Charter, the Mayor is required to submit a balanced budget to City Council on or before the first Monday in October each year. The budget is reviewed and modified if supported by a majority of City Council and an appropriation ordinance prepared to adopt the budget. According to City Charter, the appropriation ordinance is to be adopted no later than December 31 each year. City budgeting and accounting systems provide for program planning of expenditures by function and activity within the funds. Amendments to the original budget were material in relation to the initial appropriation.
The City prepares annual budgets and maintains budgetary controls for all funds in order to ensure compliance with the annual appropriation ordinance as approved by City Council. The legal level of budgetary control for all funds, other than the General Fund, is at the fund level. For the General Fund, the legal level of budgetary control is appropriating departments determined during the annual budget process. Transfer of appropriation within the budget of an appropriating department may be authorized by approval of the affected General Fund department head. Transfer of appropriation within the budget of the other funds may be authorized by approval of the affected department head. Such transfers are filed with the Chief Financial Officer but require no City Council action. Any net increase of appropriation to a fund or transfer between General Fund appropriating departments requires City Council action. The budget is prepared in a manner consistent with the Colorado state statutes. However, unlike the financial basis of reporting, the City's budget is prepared completely on a modified accrual basis.
Appropriations for all funds that are not budgeted on a project-length basis lapse at year-end except for contractually encumbered and reserved appropriations. Project-length budgets are those where appropriations are initially made to individual projects and do not lapse until such time as the project is complete. Project-length budgets are adopted for all capital projects as well as for intergovernmental grants, capital improvements, special projects and special assessments. All budgets are prepared on the modified accrual basis and are reported as such.
B. Excess of Expenditures over Appropriations
During 2020, expenditures exceeded appropriations for the Park Developer Easement Fund by $111, as a result of unanticipated allocated expenditures including bank and investment fees. The Cemetery Endowment Fund exceeded appropriations by $60,442 as a result of a significant increase in investment revenues and resulting transfer out to the Cemetery Enterprise Fund. The TOPS Maintenance Trust Fund exceeded appropriations by $32 as a result of unanticipated allocated expenditures including bank and investment fees. The Development Review Fund exceeded appropriations by $21,581 as a result of increased operational costs incurred due to new large scale local projects. The Claims Reserve Self-Insurance Fund and Employee Benefits Self-Insurance Fund exceeded appropriations by $2,553,932 and $457,183, respectively, as a result of increased incidences, severity of claims and incurred but not reported claims adjustments from the actuary.
NOTES TO FINANCIAL STATEMENTS December 31, 2020
City of Colorado Springs 2020 Annual Comprehensive Financial Report 77

C. Deficit Fund Equity
The Public Authority for Colorado Energy, a proprietary fund, had deficit fund equity as of December 31, 2020. The deficit of $161,337,000 relates to bonds issued for prepaid natural gas contracts and capital assets. The Cemetery fund had deficit fund equity as of December 31,2020. The deficit in the Cemetery fund of $161,148 is due to fluctuations of pension and OPEB obligations. The Claims Reserve Self-Insurance fund, the Workers’ Compensation Self-Insurance fund, and the Employee Benefits Self-Insurance fund all had deficit fund equity as of December 31, 2020. The deficit in the Workers’ Compensation Self-Insurance fund of $15,968,830 is entirely due to incurred but not reported claims. The deficits in the Claims Reserve Self-Insurance fund and the Employee Benefits Self-Insurance fund of $3,122,035 and $8,772,676, respectively, are in large part due to incurred but not reported claims. The following governmental fund component units have deficit fund equity at year end: Barnes & Powers North BID $2,063,675, Barnes & Powers South BID $216,756, Creekwalk Marketplace BID $2,918,471, CSURA $82,992,299, First & Main BID $233,324, First & Main BID No. 2 $11,439,881, First & Main North BID $589,165, Interquest North BID $1,135,504, Interquest South BID $854,348, Interquest Town Center BID $129,843, Powers & Woodmen Commercial BID $854,463, and Southwest Downtown BID $1,869,982. These deficits also relate to bonds and other noncurrent liabilities that have been issued for capital assets. The deficits will decrease over time as the entities collect the dedicated general property taxes to make payments on the bonds. Additional information about the component units can be found in their respective financial statements.
Remainder of page intentionally blank
NOTES TO FINANCIAL STATEMENTS December 31, 2020
78 City of Colorado Springs 2020 Annual Comprehensive Financial Report

III. DETAILED NOTES ON ALL FUNDS
A. Unrestricted and Restricted Cash and Investments
The City’s restricted and unrestricted cash and investments, exclusive of component units, total $801,951,000 and consist of the following on December 31, 2020 (in 000’s):
Investment TypeUnrestricted
Assets Restricted
Assets TotalDemand accounts (incl petty cash of $53) $ 50,378 $ 56,368 $ 106,746 Money market mutual funds 1,190 2,085 3,275 Colorado Liquid Asset Trust (COLOTRUST) 194,782 39,914 234,696 Colorado Surplus Asset Trust Fund (CSAFE) — 81,369 81,369 Commercial paper 4,988 — 4,988 US treasury securities 117,382 6,958 124,340 US instrumentality securities 158,447 10,855 169,302 Domestic corporate fixed-income securities 25,047 — 25,047 Mutual funds — 12,458 12,458 Municipal bonds 22,637 — 22,637 Supra-national securities 3,365 — 3,365 Domestic equities — 1,183 1,183 Guaranteed investment contract — 6,860 6,860 Mortgages pooled 5,335 — 5,335 Domestic partnership — 350 350
Total $ 583,551 $ 218,400 $ 801,951
Note: Immaterial differences may occur due to rounding.
Reconciliation of total deposits and investments to the financial statements at December 31, 2020 (in 000’s):
GovernmentalActivities
Business-typeActivities Total
Unrestricted $ 222,534 $ 361,017 $ 583,551
Restricted 25,785 192,615 218,400
Total $ 248,319 $ 553,632 $ 801,951
Note: Immaterial differences may occur due to rounding.
NOTES TO FINANCIAL STATEMENTS December 31, 2020
City of Colorado Springs 2020 Annual Comprehensive Financial Report 79

1. Deposits
The carrying amount of the City’s deposits at December 31, 2020, was $106,693,000 and the bank balances were $123,920,000. Of the bank balances, $1,202,000 was covered by federal deposit insurance and $122,718,000 was uninsured but collateralized in accordance with provisions of the Colorado Public Deposit Protection Act (CPDPA). The collateral is pooled and held in trust for all uninsured deposits as a group. The Federal Deposit Insurance Corporation (FDIC) covers $250,000 per depositor, per insured bank, for each account ownership category. Therefore, the City’s deposits are not subject to custodial credit risk.
2. Investments
The City, a home-rule municipality operating under its City Charter, is allowed under Colorado state statutes to promulgate and implement local standards for cash and investment management operations. The adopted investment policy for the City authorizes all investments shall be made in accordance with applicable City policies, Colorado state statutes, and Federal regulations. The provisions of the City’s investment policy apply to all investable funds of the City to include bond ordinance accounts and reserve accounts. Excluded from the City investment policy are Utilities' funds, trust and endowment funds, and money held in bank checking accounts for operating purposes. Utilities has adopted individual investment policies to manage their investment portfolios. The investments of the City are reported in aggregate to include investments of money related to governmental and business-type activities, individual major funds and non-major funds. The City’s investments are subject to interest rate risk, credit risk, concentration of credit risk, and custodial credit risk.
Interest rate risk - Interest rate risk is the risk that changes in the financial market rates of interest will adversely affect the value of an instrument. As a means of limiting its exposure to fair value losses arising from rising interest rates, the City investment policy limits investment maturities to less than five years. The Utilities investment policy further defines this requirement by limiting investments of their income fund to maturities of two years or less.
Credit risk - Credit risk is the risk of loss due to a debtor’s non-payment of a loan or other line of credit (either principal, interest or both). The City investment policy authorizes the City to invest in obligations of the United States or agencies thereof, commercial paper, municipal bonds, corporate bonds, bankers acceptances, local government investment pools, specific money market mutual funds, time certificates of deposit, repurchase agreements, and obligations of the City of Colorado Springs. To mitigate credit risk, the City investment policy outlines credit rating benchmarks for these obligations.
Concentration of credit risk - Concentration of credit risk is the risk of loss attributable to the magnitude of the City’s investments in a single issuer. Concentration risk is defined by the GASB as positions of 5% or more in the securities of any one issuer. The City’s pooled investments are in compliance with the City investment policy which limits investments with any single issuer other than the Federal Government to 5%. The securities of the Federal Government are defined as obligations of the United States Treasury and are explicitly guaranteed by the United States Government. None of the City’s pooled investments at December 31, 2020, were subject to concentration of credit risk.
Custodial credit risk - Custodial credit risk is the risk, that in the event of the failure of a depository financial institution, the City will not be able to recover the value of its investments or collateral securities that are in possession of an outside party. City investments are placed in depository financial institutions by a designated investment adviser during the fiscal year.
NOTES TO FINANCIAL STATEMENTS December 31, 2020
80 City of Colorado Springs 2020 Annual Comprehensive Financial Report

Investments are exposed to custodial credit risk if they are uninsured, are not registered in the City’s name and are held by either the counterparty to the investment purchase or held by the counterparty’s trust department or agent but not held in the City’s name. None of the City’s investments owned at December 31, 2020, were subject to custodial credit risk.
As of December 31, 2020, the City had the following investment maturities:
Investment TypeValue
(in 000's)Weighted Average
Maturity (Years)
Money market and mutual funds $ 15,733 0.00
Colorado Liquid Asset Trust (COLOTRUST) 234,696 0.00
Colorado Surplus Asset Trust (CSAFE) 81,369 0.00
Commercial paper 4,988 1.31
US treasury securities 124,340 2.02
US instrumentality securities 169,302 3.02
Domestic corporate fixed-income securities 25,047 0.98
Municipal bonds 22,637 3.01
Supra-national securities 3,365 1.78
Domestic equities 1,183 0.00
Guaranteed investment contract 6,860 17.87
Mortgages pooled 5,335 1.45
Domestic partnership 350 0.00
Total 695,205
Portfolio weighted average maturity 1.44
Reconciliation to total cash and investments
Add:
Cash on hand and in banks 106,746
$ 801,951
Note: Immaterial differences may occur due to rounding.
NOTES TO FINANCIAL STATEMENTS December 31, 2020
City of Colorado Springs 2020 Annual Comprehensive Financial Report 81

As of December 31, 2020, the City had the following investment credit quality distribution:
Investment Type
Standard andPoor's (S&P) or
Equivalent % of TotalMoney market mutual funds AAA 0.47Money market mutual funds unrated 1.79Local investment pools AAAm 45.46Commercial paper AA+ 0.37Commercial paper AA 0.35US treasury securities AA+ 16.89US treasury securities A-1+ 1.00US instrumentality securities AA+ 24.35Domestic corporate fixed-income securities AAA 0.65Domestic corporate fixed-income securities AA 0.44Domestic corporate fixed-income securities AA- 1.42Domestic corporate fixed-income securities A+ 1.10Municipal bonds AAA 1.20Municipal bonds AA+ 0.90Municipal bonds AA 1.03Municipal bonds AA- 0.13Supra-national securities AAA 0.48Domestic equities unrated 0.17Guaranteed investment contract A+ 0.49Guaranteed investment contract AA- 0.49Mortgages pooled AA+ 0.77Domestic partnership unrated 0.05
100.00
As of December 31, 2020, the City has invested $234,696,000 in the Colorado Government Liquid Asset Trust (COLOTRUST), an investment vehicle established for local government entities in Colorado pursuant to Part 7 of Article 75 of Title 24 of the Colorado Revised Statutes, to pool surplus funds for investment purposes. COLOTRUST operates similarly to a money market fund and each share is equal in value to $1.00. The value of the position in the pool is the same as the value of the pool shares. The designated custodial bank provides safekeeping and depository services in connection with the direct investment and withdrawal functions. Substantially all securities owned by the pool are held by the Federal Reserve Bank in the account maintained for the custodial bank. The custodian’s internal records identify the investments owned by the pool.
The City’s investment in COLOTRUST is rated AAAm by S&P. COLOTRUST is routinely monitored by the Colorado Division of Securities with regard to operations and investments. Separately issued financial statements may be obtained at the following address:
COLOTRUST717 17th Street, Suite 1850Denver, CO 80202www.colotrust.com
NOTES TO FINANCIAL STATEMENTS December 31, 2020
82 City of Colorado Springs 2020 Annual Comprehensive Financial Report

As of December 31, 2020, the City has invested $81,369,000 in the Colorado Surplus Asset Trust Fund (CSAFE), an investment vehicle established for local government entities in Colorado pursuant to Part 7 of Article 75 of Title 24 of the Colorado Revised Statutes, to pool surplus funds for investment purposes. CSAFE operates similarly to a money market fund and each share is equal in value to $1.00. The value of the position in the pool is the same as the value of the pool shares. The designated custodial bank provides safekeeping and depository services in connection with the direct investment and withdrawal functions. Substantially all securities owned by the pool are held by the Federal Reserve Bank in the account maintained for the custodial bank. The custodian’s internal records identify the investments owned by the pool.
The City’s investment in CSAFE is rated AAAm by S&P. CSAFE is routinely monitored by the Colorado Division of Securities with regard to operations and investments. Separately issued financial statements may be obtained at the following address:
CSAFE1675 Broadway, Ste 500Denver, CO 80202www.csafe.org
In addition to the above, the City is a participant in FPPA's Glide Path pool through its Pension Trust Fund fiduciary component unit. FPPA pools these, and other, deposits and invests them in accordance with State of Colorado statute. As of December 31, 2020, the City had pooled investment funds with FPPA of $132,020,700.
The City reports as an increase or decrease in its pooled investment funds the City's share of unrealized gains, losses, income and expenses of the pool.
Remainder of page intentionally blank
NOTES TO FINANCIAL STATEMENTS December 31, 2020
City of Colorado Springs 2020 Annual Comprehensive Financial Report 83

3. Component Unit Deposits and Investments
Cash and investments of the component units of the City are reported at fair value and consist of the following at December 31, 2020 (in 000’s):
DemandAccounts
Money MarketMutual Funds COLOTRUST
AlternativeInvestments Total
Governmental Activities:
Barnes & Powers North BID $ 22 $ — $ 41 $ — $ 63
Barnes & Powers South BID — — 102 — 102
Briargate Center BID 1 807 310 — 1,118
Creekwalk Marketplace BID 55 — 5,308 — 5,363
CS Downtown Development Authority 73 — 1,187 — 1,260
CS Health Foundation 2,407 158,431 — 6,713 167,551
CS Urban Renewal Authority 542 — 29,701 — 30,243
First & Main BID — — 158 — 158
First & Main BID No. 2 11 — 2,011 — 2,022
First & Main North BID 9 — 8 — 17
Greater Downtown CS BID 53 — 441 — 494
Interquest North BID 22 — 1,970 — 1,992
Interquest South BID 2 — 470 — 472
Interquest Town Center BID 1,063 — — — 1,063
Powers & Woodmen Commercial BID 9 — 621 — 630
Southwest Downtown BID 1,626 — 9,847 — 11,473
5,895 159,238 52,175 6,713 224,021
Business-type Activities:
Fountain Valley Authority 9,517 — — — 9,517
Aurora-Colorado Springs
Joint Water Authority 168 — — — 168
Various canal & reservoir companies 5,172 — — — 5,172
14,857 — — — 14,857
Total $ 20,752 $ 159,238 $ 52,175 $ 6,713 $ 238,878
Note: Immaterial differences may occur due to rounding.
Reconciliation of total deposits and investments to the government-wide financial statements at December 31, 2020 (in 000’s):
GovernmentalActivities
Business-typeActivities Total
Unrestricted $ 170,356 $ 12,803 $ 183,159 Restricted 53,665 2,054 55,719
Total $ 224,021 $ 14,857 $ 238,878
Note: Immaterial differences may occur due to rounding.
NOTES TO FINANCIAL STATEMENTS December 31, 2020
84 City of Colorado Springs 2020 Annual Comprehensive Financial Report

The carrying amount of the deposits of the component units of the City at December 31, 2020, was $20,752,000, and the bank balances were $21,391,000. Of the bank balances, $2,580,000 was covered by federal deposit insurance, and $12,425,000 was collateralized in accordance with provisions of the CPDPA. The Colorado Springs Health Foundation and the various canal companies are not public entities. Their excess balances above federal deposit insurance are not covered by the CPDPA. The various canal companies are publicly traded. At December 31, 2020, bank balances exceeded federally insured limits by approximately $6,386,000.
4. Fair Value Measurement
Governmental Accounting Standards Board Statement No. 72 (GASB 72) Fair Value Measurement and Application establishes a hierarchy of inputs to valuation techniques used to measure fair value and requires disclosures to be made about investment fair value measurements, the level of fair value hierarchy, and valuation techniques. According to GASB 72, an investment is defined as a security or other asset that (a) a government holds primarily for the purpose of income or profit and (b) has a present service capacity based solely on its ability to generate cash or to be sold to generate cash.
The City records assets and liabilities in accordance with GASB 72, which establishes general principles for measuring fair value, provides additional fair value application guidance and enhances disclosures about fair value measurements.
With the exception of COLOTRUST and CSAFE, which are discussed on the following page, the City’s investments and derivative instruments are measured at fair value on a recurring basis. Fair value measurements are categorized based on the valuation inputs used to measure fair value of assets and liabilities as follows:
Level 1 - Quoted prices in active markets for identical securities.
Level 2 - Prices determined using other significant observable inputs. Observable inputs are inputs that reflect the assumptions market participants would use in pricing a security and are developed based on market data obtained from sources independent of the reporting entity. These may include quoted prices for similar securities, interest rates, prepayment speeds, credit risk, and others. Debt securities are valued in accordance with the evaluated bid price supplied by the pricing service and generally categorized as Level 2 in the hierarchy.
Level 3 - Prices determined using significant unobservable inputs. Unobservable inputs are inputs that reflect the reporting entity’s own assumptions about the factors market participants would use in pricing the security and would be based on the best information available under the circumstances.
Remainder of page intentionally blank
NOTES TO FINANCIAL STATEMENTS December 31, 2020
City of Colorado Springs 2020 Annual Comprehensive Financial Report 85

The following table reflects the fair value of the City’s investments and derivative instruments, exclusive of discretely presented component units, as of December 31, 2020 (in 000’s):
Fair Value Measurement UsingTotal Level 1 Level 2 Level 3
AssetsInvestments
Money market mutual funds $ 15,733 $ 15,733 $ — $ — Colorado Liquid Asset Trust (COLOTRUST) 234,696 (A) (A) (A)Colorado Surplus Asset Trust Fund (CSAFE) 81,369 (A) (A) (A)Commercial paper 4,988 — 4,988 — US treasury securities 124,340 — 124,340 — US instrumentality securities 169,302 — 169,302 — Domestic corporate fixed-income securities 25,047 — 25,047 — Municipal bonds 22,637 — 22,637 — Supra-national securities 3,365 — 3,365 — Domestic equities 1,183 1,183 — — Guaranteed investment contract 6,860 — 6,860 — Mortgages pooled 5,335 — 5,335 — Domestic partnership 350 — — 350
Total investments $ 695,205 $ 16,916 $ 361,874 $ 350
LiabilitiesDerivative instruments $ 121,371 $ — $ 121,371 $ — Total derivative instruments $ 121,371 $ — $ 121,371 $ —
Note: Immaterial differences may occur due to rounding.
(A) During the year, the City invested in COLOTRUST and CSAFE, local government investment pools. The valuation is measured at net asset value and is designed to approximate the share value. The pools' Board of Trustees, elected by the participants, is responsible for overseeing the management of the investment pools, including establishing operating standards and policies. COLOTRUST and CSAFE are designed to provide local governments with a convenient method for investing in short-term investments carefully chosen to provide maximum safety and liquidity, while still maximizing interest earnings.
Remainder of page intentionally blank
NOTES TO FINANCIAL STATEMENTS December 31, 2020
86 City of Colorado Springs 2020 Annual Comprehensive Financial Report

The following table reflects the fair value of the investments for component units of the City as of December 31, 2020 (in 000’s):
Fair Value Measurement UsingTotal Level 1 Level 2 Level 3
Governmental Activities AssetsInvestments
Money market mutual funds $ 159,238 $ 159,238 $ — $ — Colorado Liquid Asset Trust (COLOTRUST) 52,175 (A) (A) (A)Alternative investments 6,713 (B) (B) (B)
Total investments $ 218,126 $ 159,238 $ — $ —
Note: Immaterial differences may occur due to rounding.
(A) During the year, the component units of the City invested in COLOTRUST, a local government investment pool. The valuation is measured at net asset value and is designed to approximate the share value. The pool's Board of Trustees, elected by the participants, is responsible for overseeing the management of COLOTRUST, including establishing operating standards and policies. COLOTRUST is designed to provide local governments with a convenient method for investing in short-term investments carefully chosen to provide maximum safety and liquidity, while still maximizing interest earnings.
(B) In accordance with GASB 72, component units of the City are not required to classify investments in certain entities that calculate net assets value per share (or its equivalent) in the fair value hierarchy above.
Remainder of page intentionally blank
NOTES TO FINANCIAL STATEMENTS December 31, 2020
City of Colorado Springs 2020 Annual Comprehensive Financial Report 87

B. Receivables
Receivables for governmental funds, proprietary funds, and component units at December 31, 2020, include the following (in 000’s):
General Fund Utilities PACE MHS
Non-Major& Other Total
Interest $ — $ 399 $ — $ — $ — $ 399 Taxes 46,510 — — — 29,094 75,604 Accounts 8,996 117,687 7,296 — 31,045 165,024 Leases — — — 88,832 2,098 90,930 Assessments — — — — 3,296 3,296 Intergovernmental loans — — — — 28,194 28,194 Notes and loans 237 — — — 3,516 3,753
Gross receivables 55,743 118,086 7,296 88,832 97,243 367,200
Less: allowances for uncollectibles (50) (3,731) — — (15,273) (19,054)
Net receivables $ 55,693 $ 114,355 $ 7,296 $ 88,832 $ 81,970 $ 348,146
Note: Immaterial differences may occur due to rounding.
Loans receivable of $12,937,020 are included in receivables - net of an allowance of $15,257,561 in the statement of net position/balance sheet as of December 31, 2020, for Community Development Division (CDD). These loans were funded with HOME (Federal Home Investment Partnership Act), CDBG (Community Development Block Grant), CHFA (Colorado Housing Finance Authority), and HOPE III (Homeownership Opportunity Program) funds.
Remainder of page intentionally blank
NOTES TO FINANCIAL STATEMENTS December 31, 2020
88 City of Colorado Springs 2020 Annual Comprehensive Financial Report
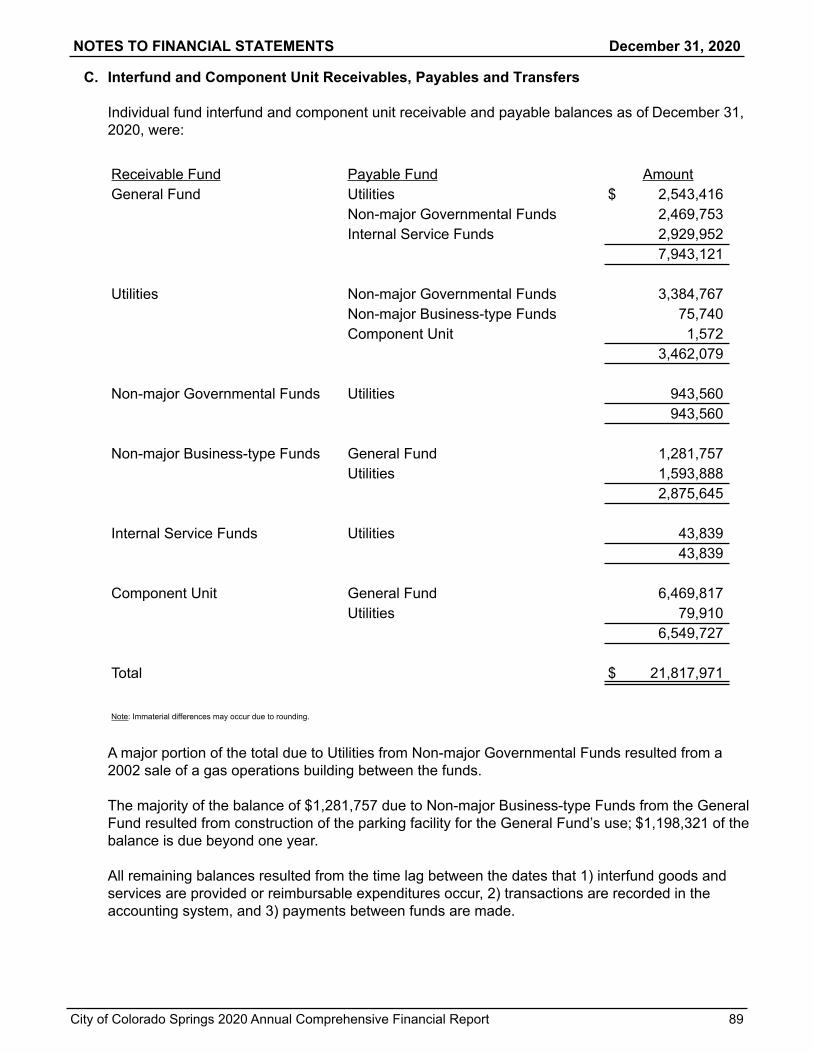
C. Interfund and Component Unit Receivables, Payables and Transfers
Individual fund interfund and component unit receivable and payable balances as of December 31, 2020, were:
Receivable Fund Payable Fund AmountGeneral Fund Utilities $ 2,543,416
Non-major Governmental Funds 2,469,753 Internal Service Funds 2,929,952
7,943,121
Utilities Non-major Governmental Funds 3,384,767 Non-major Business-type Funds 75,740 Component Unit 1,572
3,462,079
Non-major Governmental Funds Utilities 943,560 943,560
Non-major Business-type Funds General Fund 1,281,757 Utilities 1,593,888
2,875,645
Internal Service Funds Utilities 43,839 43,839
Component Unit General Fund 6,469,817 Utilities 79,910
6,549,727
Total $ 21,817,971
Note: Immaterial differences may occur due to rounding.
A major portion of the total due to Utilities from Non-major Governmental Funds resulted from a 2002 sale of a gas operations building between the funds.
The majority of the balance of $1,281,757 due to Non-major Business-type Funds from the General Fund resulted from construction of the parking facility for the General Fund’s use; $1,198,321 of the balance is due beyond one year.
All remaining balances resulted from the time lag between the dates that 1) interfund goods and services are provided or reimbursable expenditures occur, 2) transactions are recorded in the accounting system, and 3) payments between funds are made.
NOTES TO FINANCIAL STATEMENTS December 31, 2020
City of Colorado Springs 2020 Annual Comprehensive Financial Report 89

Individual fund transfers during the year were:
Transfers In:
Transfers out:General
Fund
Non-majorGovernmental
Funds
Non-majorEnterprise
FundsTotal
Transfers OutGeneral Fund $ — $ 4,422,444 $ — $ 4,422,444 Non-major Governmental Funds 239,541 125,000 310,442 674,983 Utilities 35,485,000 — — 35,485,000
Total transfers in $ 35,724,541 $ 4,547,444 $ 310,442 $ 40,582,427
Transfers were made in accordance with budgetary authorizations for the following purposes:1) From General Fund into Non-major Governmental Funds: to move unrestricted revenues
collected in the General Fund to finance various capital projects;2) From Non-major Governmental Funds to General Fund: to move LART portion of voter
approved TABOR retention for the benefit of public safety and to finance projects;3) From Non-major Governmental Funds to Non-major Governmental Funds: to move LART
contributions to finance various capital projects;4) From Non-major Governmental Funds to Non-major Enterprise Funds: to move the annual
allocated earnings into the Cemetery Enterprise Fund;5) From Utilities to General Fund: to transfer Utilities surplus detailed in Note III.D. below, some
other minor cost sharing projects between the two funds.
D. Transfer of Surplus
As allowed by City Charter, section 6-40(b), Utilities provides transfers of surplus to the City. These amounts are based on actual sales inside the City, and rates are fixed per kilowatt hour of electricity and per thousand cubic feet of natural gas. The money is transferred every month from Utilities to the General Fund of the City as they become available. Payments are recorded as transfers on the statement of revenues. In 2020, the amount transferred was $35.2 million.
Remainder of page intentionally blank
NOTES TO FINANCIAL STATEMENTS December 31, 2020
90 City of Colorado Springs 2020 Annual Comprehensive Financial Report

E. Unavailable/Unearned Revenue
Governmental funds report unavailable revenue in connection with receivables for revenues that are not considered to be available to liquidate liabilities of the current period (deferred inflows of resources). Governmental funds also defer revenue recognition in connection with resources that have been received, but not yet earned (unearned revenue). At the end of 2020, the various components of unavailable revenue and unearned revenue reported in the governmental funds were as follows:
Unavailable Unearned
Loans $ 12,937,020 $ — Property taxes 29,316,148 — Grant drawdowns prior to meeting
all eligibility requirements — 12,669,789 Other unearned revenue — 5,094,368
Total unavailable/unearned revenue for governmental funds $ 42,253,168 $ 17,764,157
F. Inventories
Inventories held for resale, exclusive of component units, are reported at the lower of cost or market. Inventories of supplies are reported at cost. General fund and proprietary fund inventories, including internal service funds, consist of the following at December 31, 2020:
General Fund Proprietary Funds Total InventoryMaterials and supplies $ — $ 48,515,788 $ 48,515,788 Fuel 294,093 10,107,509 10,401,602
Total inventories $ 294,093 $ 58,623,297 $ 58,917,390
Remainder of page intentionally blank
NOTES TO FINANCIAL STATEMENTS December 31, 2020
City of Colorado Springs 2020 Annual Comprehensive Financial Report 91

G. Changes in Capital Assets
The following schedule reflects the changes in capital assets, exclusive of discretely presented component units, for governmental activities for the year ended December 31, 2020 (in 000’s):
BeginningBalance Increases* Decreases*
EndingBalance
GOVERNMENTAL ACTIVITIESCapital assets not being depreciated:
Land $ 369,645 $ 31,213 $ — $ 400,858 Construction in progress 25,722 35,055 (17,385) 43,392
Total capital assets not being depreciated 395,367 66,268 (17,385) 444,250
Capital assets being depreciated:Buildings 209,250 — (29) 209,221 Improvements other than buildings 90,117 6,659 — 96,776 Machinery and equipment 182,223 18,422 (6,382) 194,263 Intangibles 20,744 — (35) 20,709 Infrastructure 1,484,969 59,681 (15,584) 1,529,066
Total capital assets being depreciated 1,987,303 84,762 (22,030) 2,050,035
Less accumulated depreciation for:Buildings (91,425) (5,057) 23 (96,459) Improvements other than buildings (38,319) (3,542) — (41,861) Machinery and equipment (127,986) (11,945) 6,268 (133,663) Intangibles (10,345) (717) 35 (11,027) Infrastructure (637,783) (39,147) 9,912 (667,018)
Total accumulated depreciation (905,858) (60,408) 16,238 (950,028)
Total capital assets being depreciated, net 1,081,445 24,354 (5,792) 1,100,007
Governmental activities capital assets, net $ 1,476,812 $ 90,622 $ (23,177) $ 1,544,257
* Includes transfers between categories.Note: Immaterial differences may occur due to rounding.
Remainder of page intentionally blank
NOTES TO FINANCIAL STATEMENTS December 31, 2020
92 City of Colorado Springs 2020 Annual Comprehensive Financial Report

The following schedule reflects the changes in capital assets, exclusive of discretely presented component units, for business-type activities for the year ended December 31, 2020 (in 000’s):
BeginningBalance Increases* Decreases*
EndingBalance
BUSINESS-TYPE ACTIVITIESCapital assets not being depreciated:
Land $ 244,845 $ 3,691 $ (15,715) $ 232,821 Intangible 38,588 2,700 — 41,288 Construction in progress 185,791 252,358 (203,250) 234,899
Total capital assets not being depreciated 469,224 258,749 (218,965) 509,008
Capital assets being depreciated:Buildings 97,388 337 (2,040) 95,685 Improvements other than buildings 326,151 18,357 (1,438) 343,070 Machinery and equipment 43,495 2,102 (2,460) 43,137 Infrastructure 56,628 4,058 — 60,686 Utilities plant 6,246,143 308,468 (393,618) 6,160,993 Intangible 81,843 1,272 (197) 82,918
Total capital assets being depreciated 6,851,648 334,594 (399,753) 6,786,489
Less accumulated depreciation for:Buildings (57,284) (2,356) 1,300 (58,340) Improvements other than buildings (145,587) (13,318) 840 (158,065) Machinery and equipment (27,507) (2,560) 2,377 (27,690) Infrastructure (16,269) (1,925) — (18,194) Utilities plant (2,577,088) (161,360) 49,046 (2,689,402) Intangible (53,852) (2,552) 79 (56,325)
Total accumulated depreciation (2,877,587) (184,071) 53,642 (3,008,016)
Total capital assets being depreciated, net 3,974,061 150,523 (346,111) 3,778,473
Business-type activities capital assets, net $ 4,443,285 $ 409,272 $ (565,076) $ 4,287,481
* Includes transfers between categories.Note: Immaterial differences may occur due to rounding.
Remainder of page intentionally blank
NOTES TO FINANCIAL STATEMENTS December 31, 2020
City of Colorado Springs 2020 Annual Comprehensive Financial Report 93

Depreciation expense was charged to governmental activities and business-type activities as of December 31, 2020, as follows (in 000’s):
Governmental Activities:
General government $ 3,786 Public safety 6,553 Public works 44,673 Parks 5,238 Planning 124 Internal service funds 34 Total depreciation expense governmental activities $ 60,408
Business-type Activities:
Utilities $ 163,856 Non-major enterprise funds 20,215 Total depreciation expense business-type activities $ 184,071
Note: Immaterial differences may occur due to rounding.
Remainder of page intentionally blank
NOTES TO FINANCIAL STATEMENTS December 31, 2020
94 City of Colorado Springs 2020 Annual Comprehensive Financial Report

The following schedule reflects the changes in discretely presented component unit capital assets for governmental activities for the year ended December 31, 2020 (in 000’s):
BeginningBalance Increases* Decreases*
EndingBalance
GOVERNMENTAL ACTIVITIESCapital assets not being depreciated:
Land $ — $ 866 $ — $ 866 Construction in progress 15,575 58,335 (37,210) 36,700
Total capital assets not being depreciated 15,575 59,201 (37,210) 37,566
Capital assets being depreciated:Buildings 1,805 — — 1,805 Improvements other than buildings 9,267 885 — 10,152 Machinery and equipment 128 12 — 140 Infrastructure 45,497 1,811 — 47,308
Total capital assets being depreciated 56,697 2,708 — 59,405
Less accumulated depreciation for:Buildings (10) (45) — (55) Improvements other than buildings (2,036) (379) — (2,415) Machinery and equipment (113) (9) — (122) Infrastructure (10,332) (1,406) — (11,738)
Total accumulated depreciation (12,491) (1,839) — (14,330)
Total capital assets being depreciated, net 44,206 869 — 45,075
Governmental activities capital assets, net $ 59,781 $ 60,070 $ (37,210) $ 82,641
* Includes transfers between categories.Note: Immaterial differences may occur due to rounding.
Remainder of page intentionally blank
NOTES TO FINANCIAL STATEMENTS December 31, 2020
City of Colorado Springs 2020 Annual Comprehensive Financial Report 95

The following schedule reflects the changes in discretely presented component unit capital assets for business-type activities for the year ended December 31, 2020 (in 000’s):
BeginningBalance Increases* Decreases*
EndingBalance
BUSINESS-TYPE ACTIVITIESCapital assets not being depreciated:
Land $ 65 $ — $ — $ 65 Construction in progress 1,059 1,944 (1,718) 1,285
Total capital assets not being depreciated 1,124 1,944 (1,718) 1,350
Capital assets being depreciated:Machinery and equipment — 35 — 35 Utilities plant 126,447 1,779 (2,969) 125,257
126,447 1,814 (2,969) 125,292 Less accumulated depreciation for:
Machinery and equipment — (4) — (4) Utilities plant (59,904) (1,556) 2,505 (58,955)
(59,904) (1,560) 2,505 (58,959)
Total capital assets being depreciated, net 66,543 254 (464) 66,333
Business-type activities capital assets, net $ 67,667 $ 2,198 $ (2,182) $ 67,683
* Includes transfers between categories.
Note: Immaterial differences may occur due to rounding.
Remainder of page intentionally blank
NOTES TO FINANCIAL STATEMENTS December 31, 2020
96 City of Colorado Springs 2020 Annual Comprehensive Financial Report

Special Items
Decommissioning of Power Plants - In June 2020, the Utilities Board voted to approve an integrated resource plan that commits Utilities to providing cost-effective, resilient and environmentally sustainable power. The plan calls for grid modernization, integration of more cost-effective renewable energy and incorporation of new technologies like energy storage. It allows Utilities to achieve an 80.0% carbon reduction by 2030 and included a decision to decommission Martin Drake Power Plant (Drake) no later than December 31, 2022, Ray Nixon Power Plant Unit 1 (Nixon 1) no later than December 31, 2029 and Birdsall Power Plant (Birdsall) no later than December 31, 2034. This further accelerated Drake’s decommission date from the previous decision by the Utilities Board in November 2015 to close and decommission Drake no later than 2035. Drake Unit 5 was fully decommissioned in 2016.
As a result of the Utilities Board’s decision to decommission Drake, Nixon 1 and Birdsall, Utilities determined the assets related to the decommissioning power plants were impaired as of December 31, 2020 and recorded a loss as a Special item on the Statement of Revenues, Expenses and Changes in Net Position.
Transfer of Operations - In November 2020, Utilities took over Cascade Metropolitan District No. 1’s water system (Cascade). Utilities recorded the Cascade assets at net book value as a Special item on the Statement of Revenues, Expenses and Changes in Net Position in accordance with GASB Statement No. 69, Government Combinations and Disposals of Government Operations.
Special items on Exhibit 8 - Statement of Revenues, Expenses and Changes in Net Position (in 000’s):
Special ItemsDrake $ (184,321) Nixon 1 (48,426) Birdsall (742) Total power plant impairment (233,489)
Cascade 5,394
Total special items $ (228,095)
Remainder of page intentionally blank
NOTES TO FINANCIAL STATEMENTS December 31, 2020
City of Colorado Springs 2020 Annual Comprehensive Financial Report 97

H. Leases
1. Operating Leases
Total rental expense on all operating leases, including month-to-month leases, for the year ended December 31, 2020, was $586,627 for governmental activities and $180,209 for business-type activities. The following schedule shows minimum rental payments for succeeding years for both governmental and business-type activities:
Year endingDecember 31:
GovernmentalActivities
Business-type Activities
2021 $ 543,611 $ 110,431 2022 503,166 110,706 2023 135,751 110,729 2024 50,370 —
Total $ 1,232,898 $ 331,866
2. Operating Leases - Component Units
The City’s component units for governmental activities had no operating lease rental expense for 2020. The Pikes Peak Regional Communications Network (PPRCN) was the only City business-type activity that had operating lease rental expense for 2020, which was $76,256. The following is a schedule of minimum rental payments for PPRCN for succeeding years:
Year endingDecember 31:
Business-typeActivities
2021 $ 89,203 2022 92,591 2023 96,136 2024 99,845 2025 103,726
Total $ 481,501
3. Capital Leases
The City has entered into various capital lease commitments in order to acquire a building, machinery and equipment. The building, machinery and equipment so acquired are capitalized in the government-wide financial statements and in the business-type activities/proprietary fund financial statements. All related lease payments are subject to annual appropriation and made from the acquiring fund. Should the City not appropriate monies for these payments, the building, machinery or equipment would revert to the lessor.
NOTES TO FINANCIAL STATEMENTS December 31, 2020
98 City of Colorado Springs 2020 Annual Comprehensive Financial Report

Future minimum lease obligations consist of governmental activities and business-type activities. The following schedule shows these obligations, and their net present value as of December 31, 2020, exclusive of component units, (in 000’s):
YearGovernmental
ActivitiesBusiness-type
Activities2021 $ 5,976 $ 100 2022 5,482 100 2023 3,628 100 2024 2,184 98 2025 1,804 — 2026-2030 2,704 —
Future minimum lease payments 21,778 398 Amount representing interest (775) (20)
Present value of net minimum payments $ 21,003 $ 378
Note: Immaterial differences may occur due to rounding.
These capital leases represent agreements for certain capital assets, which have been included as assets as follows (in 000’s):
GovernmentalActivities
Business-typeActivities
Building $ 4,436 $ — Machinery and equipment 29,792 1,271 Accumulated depreciation (11,485) (786)
Net capitalized lease property $ 22,743 $ 485
Note: Immaterial differences may occur due to rounding.
Amortization of the leased property is included in depreciation expense.
Remainder of page intentionally blank
NOTES TO FINANCIAL STATEMENTS December 31, 2020
City of Colorado Springs 2020 Annual Comprehensive Financial Report 99

4. Capital Leases - Component Units
Fountain Valley Authority leases various plant assets under a capital lease agreement expiring December 31, 2025. As of December 31, 2020, future minimum payments under the Fountain Valley Authority capital lease consisted of the following (in 000’s):
YearBusiness-type
Activities2021 $ 5,337 2022 2,274
Future minimum lease payments 7,611 Amount representing interest (290)
Present value of net minimum payments $ 7,321
Note: Immaterial differences may occur due to rounding.
Property recorded under the capital lease for Fountain Valley Authority is as follows (in 000’s):
Business-typeActivities
Assets:Utilities plant $ 75,518 Accumulated depreciation (29,508)
Net capitalized lease property $ 46,010
Note: Immaterial differences may occur due to rounding.
Amortization of the plant cost has been included in depreciation expense.
5. Lease and Integration Agreements
Memorial Health System
For many years, the City owned and operated Memorial Health System (MHS System), which consisted of hospitals and provided medical services, as an enterprise of the City (MHS). Effective October 1, 2012, the MHS System was leased to University of Colorado Health (UCH), under a Lease Agreement and related instruments approved by the electors of the City.
Under the Lease Agreement, the City leased the MHS System facilities and transferred its operations to the Lessee. The Lease Agreement and related instruments contained transition provisions regarding liabilities assumed by the Lessee and certain liabilities which were not assumed. The term of the Lease Agreement was initially 40 years, with the option in year nine, upon mutual agreement of the parties, to extend the term by additional one-year terms to be automatically added to the original term on each anniversary date of the effective date, commencing on the tenth anniversary of the effective date. The Lease Agreement is subject to certain early termination provisions.
NOTES TO FINANCIAL STATEMENTS December 31, 2020
100 City of Colorado Springs 2020 Annual Comprehensive Financial Report

In addition to a lump sum payment made at Lease inception, the Lease Agreement also provides for various payments to MHS over the term of the Lease Agreement, including fixed payments of $467,676 per month for 30 years. MHS recorded the present value of the future lease payments as a lease receivable using an imputed discount interest rate of approximately 3%.
As of December 31, 2020, future minimum payments under the capital lease consisted of the following (in 000’s):
Year Amount2021 $ 5,612 2022 5,612 2023 5,612 2024 5,612 2025 5,612 2026-2030 28,061 2031-2035 28,061 2036-2040 28,061 2041-2042 9,821
Future minimum lease payments 122,064 Amount representing discount interest (33,232)
Present value of net minimum payments $ 88,832
Note: Immaterial differences may occur due to rounding.
The Lessee is also required to make Margin Sharing Payments to MHS throughout the 40-year term of the Lease Agreement equal to 5% of the excess in any fiscal year of Operating EBITDA (as defined in the lease) over a baseline annual margin of 8%. While no amounts have been recorded in the accompanying financial statements relating to future contingent Margin Sharing Payments, since 2015, MHS has received and recognized $5.8 million. The Lessee is also obligated to spend an annual average of $28 million for capital improvements during the term of the Lease Agreement and UCH is obligated under the Lease related instruments to provide $3 million annually for 40 years to fund the development of a branch of the University of Colorado, School of Medicine in Colorado Springs. To the best of the City’s knowledge, the Lessee has been in compliance with these capital investment requirements.
Concurrent with the lease of facilities and transfer of operations under the Lease Agreement, MHS derecognized MHS System assets and the UCH assumed liabilities relating to the MHS System operations and all leased property and equipment. Certain assets and liabilities were specifically excluded from the Lease Agreement and remain as assets and liabilities of MHS.
UCH and certain related entities have agreed that they generally will not individually or collectively provide any service within the city limits of Colorado Springs that competes with the services or operations of the MHS System hospitals as they existed as of October 1, 2012, for a period of two years beyond the expiration of the term of the Lease Agreement. The City has agreed that it generally will not provide any service within the city limits of Colorado Springs that competes with the services or operations of the MHS System hospitals being operated by the Lessee throughout the term of the Lease Agreement.
NOTES TO FINANCIAL STATEMENTS December 31, 2020
City of Colorado Springs 2020 Annual Comprehensive Financial Report 101

The parties to the Lease Agreement may terminate the Lease Agreement at any time by mutual written agreement. The Lease Agreement may be terminated by either party in the event of certain default provisions, as defined. Upon the expiration or termination of the Lease Agreement, the Lessee must convey to the City the facilities and expansions to the facilities of the MHS System hospitals. The Lessee must also transfer all assets and assign all claims and liabilities relating to the MHS System hospitals’ operations at the time of the expiration or termination. As a condition to the transfer of the assets and liabilities upon expiration or termination, the City must pay the Lessee an amount representing the fair market value of the MHS System hospitals’ operating businesses as of such date, as is more thoroughly defined in the Lease Agreement.
Colorado Springs Health Foundation - In connection with the Lease Agreement and contemplated transaction, Colorado Springs Health Foundation (CSHF) was established in 2012 pursuant to the provisions of City Council Resolution No. 121-12. As further provided in that resolution, and subject to any obligation payable by CSHF under a Guaranty and Indemnification Agreement (the “Guaranty”) executed by CSHF, CSHF receives distributions of funds related to the lease transaction for the purpose of addressing community health issues in the MHS System service area. In accordance with the Lease and the Guaranty, in order to fulfill certain indemnification against claims and other obligations that the City or MHS has to UCH, CSHF held $50 million in a “segregated account” through October 1, 2015. After that date, CSHF was required to hold $25 million in the “segregated account” through October 1, 2017. Such claims and obligations are subject to a dispute resolution process. As of December 31, 2017, funds are no longer required to be segregated and no material claims or obligations exist.
In November 2015, City Council approved Resolution No. 109-15, approving a Funds Management Agreement between the City and CSHF. The Funds Management Agreement provides greater clarity with respect to how lease proceeds will be transferred to CSHF and the manner in which CSHF will invest funds.
Third Party Payer Settlements - Pursuant to the Lease Agreement, the recorded amounts of Medicare and Medicaid cost report liabilities, liabilities under the Medicare Recovery Audit Contractor Program and other accrued commercial payer liabilities were assumed by the Lessee.
However, the differences between the actual settlements under third-party payer agreements and the estimated settlements included in the working capital calculations discussed above will result in net payments to or from the Health System. Laws and regulations that govern these payer systems, including Medicare and Medicaid, are extremely complex. As a result, the actual settlements could be materially different from the estimated settlement amounts used in the working capital calculations. As of December 31, 2015, the Lessee identified approximately $5.3 million due to the City as a result of third-party payer settlements to date, as well as other reconciliations. During 2016, City Council approved Ordinance 16-37, approving the transfer of these funds, less audit fees, to CSHF. During 2017, the Lessee transferred $2.6 million to the City. City Council approved Ordinance 17-43, approving the transfer of these funds, less audit fees, to CSHF. No transfers were made to CSHF for third-party payer settlements in 2020.
Recording of Contingent Liabilities - The ultimate amounts owed by MHS relating to the above contingencies are not reasonably determinable. MHS has recorded a liability which encompasses all contingent liabilities and a promise to transfer to CSHF all net proceeds, after expenses, of the lease transaction.
NOTES TO FINANCIAL STATEMENTS December 31, 2020
102 City of Colorado Springs 2020 Annual Comprehensive Financial Report

Airport
The Airport leases facilities, infrastructure, and land to various parties, including but not limited to airlines, concessionaires, and others. Substantially all of the leases are operating leases for land, buildings, and terminal space. The leases contain provisions for cancellation by either party if certain conditions are met. The current rental car agreement between the Airport and the on-site rental car companies expires June 30, 2028. The following is a schedule, by year, of minimum future rentals of the operating leases as of December 31, 2020 (in 000's):
Year Amount2021 $ 6,202 2022 9,443 2023 5,324 2024 4,822 2025 4,392 2026-2030 13,946 2031-2035 6,268 2036-2040 6,179 2041-2045 5,763 2046-2050 5,541 2051-2055 4,431 2056-2060 1,120 2061-2065 661 2066-2070 504
$ 74,596
Note: Immaterial differences may occur due to rounding.
Minimum future rentals do not include contingent rentals, which may be received under certain leases on the basis of revenue, fuel flow, or number of uses. Contingent rentals amounted to $2,701,490 for the year ended December 31, 2020.
Remainder of page intentionally blank
NOTES TO FINANCIAL STATEMENTS December 31, 2020
City of Colorado Springs 2020 Annual Comprehensive Financial Report 103

I. Revolving Loan Agreement/Letter of Credit
On September 4, 2019, Utilities amended the Revolving Loan Agreement (Credit Line) with U.S. Bank National Association dated as of September 8, 2016. On June 1, 2020, Utilities executed a second amendment increasing the available Credit Line from $60.0 million to $75.0 million, and as of December 31, 2020, Utilities may receive advances up to $75.0 million under the Credit Line to fund Utilities' operating needs and normal expenditures including, without limitation, regularly scheduled capital expenses. Utilities' repayment obligation under the Credit Line is limited to the net pledged revenues on a subordinate basis to the parity bonds and certain related obligations. The 2020 Credit Line expires on September 9, 2022. Utilities has entered into agreements similar to this Credit Line over the past several years and to date, Utilities has not drawn on any such agreement.
On November 24, 2015, City Council approved Ordinance 15‑83 authorizing the issuance of up to $150.0 million in commercial paper notes (Series A Notes and Series B Notes collectively the Notes). The maximum principal amount of the commercial paper notes which may be outstanding at any time is limited to $75.0 million for each series. In October 2018, Utilities terminated the Irrevocable Transferable Direct‑Pay Letters of Credit for the Notes and suspended the commercial paper program. Market conditions will determine if and when the City (on behalf of Utilities) will deliver more commercial paper notes.
J. Long-term Debt
The City has outstanding long-term debt in the form of several instruments. General Obligation bonds are direct obligations that pledge the full faith and credit of the City for the repayment of principal and interest. Certificates of participation and lease/lease purchase agreements are issued for particular projects and are repaid from lease payments made by the City for use of the acquired property. Special assessment bonds and notes are used to finance projects, which benefit particular properties and are repaid solely from charges levied upon the benefiting properties. While principal and interest payments are intended to be paid solely from revenues derived from assessments levied upon the benefiting property, the City may choose to commit resources should the need arise. Proprietary fund principal and interest payments on revenue bonds and notes payable are pledged solely from revenues of the proprietary fund operation.
There were no known violations of the terms or provisions of the various contracts and agreements relating to long-term debt during this reporting period.
During 2020, Utilities issued $200,720,000 of Utilities System Refunding Revenue Bonds, Series 2020A, $50,980,000 in Utilities System Refunding Revenue Bonds, Series 2020B and $85,440,000 of Utilities issued Improvement Revenue bonds, Series 2020C. The Series 2020A bonds were used to refund the City's outstanding Utilities System Refunding Revenue Bonds, Series 2009A, Utilities System Revenue Bonds, Series 2010A-1, Taxable Utilities System Improvement Revenue Bonds, Series 2010A-2 and Taxable Utilities System Improvement Revenue Bonds, Series 2010B-2. Series 2020B bonds were used to refund Utilities System Revenue Bonds, Series 2010D-2. Series 2020C bonds were issued as new money bonds to finance a portion of the costs of a number of general capital improvements to the Utility System. The Series 2020A bonds with a final maturity date of 2050, pay interest ranging from 4.00% to 5.00%. The Series 2020B and Series 2020C bonds bear interest rates of 5.00%, with final maturity dates of 2028 and 2050, respectively. The reacquisition price of the refunded bonds exceeded the net carrying amount of the old debt by $11,846,564 and $5,480,000 for Series 2020A and 2020B, respectively. This amount is deferred and amortized over the remaining life of the old debt or the life of the new debt, whichever is shorter. As a result, the debt service payments were reduced by a total of $66,456,092 and
NOTES TO FINANCIAL STATEMENTS December 31, 2020
104 City of Colorado Springs 2020 Annual Comprehensive Financial Report

$16,146,492 and resulted in a net present value savings of $48,327,571 and $12,248,111 for Series 2020A and 2020B, respectively.
During 2020, Southwest Downtown Business Improvement District issued $26,500,000 in Series 2020A Limited Tax Supported and Special Revenue Senior Bonds. The proceeds from the sale of the bonds will be used to finance certain public improvements and paying the cost of issuing the bonds. The bonds are cash flow bonds with a final maturity of 2049 and bear interest at the rate of 8.0% per annum.
During 2020, Airport entered into a direct borrowing note payable with the Colorado Department of Transportation (CDOT) for $7,500,000 to fund the construction of a ten acre deicing ramp at the departure end of runway 35R. The note reaches final maturity in 2029 and bears a 3.25% interest rate. In the event of non-appropriation by the City to fund future note payments, CDOT can transfer jet fuel sales and use tax revenue otherwise payable to the City to be paid to CDOT in an amount sufficient to make any payment due. In the event of default, CDOT has the right to terminate the contract. If terminated, the Airport must return any funds that have been disbursed and any accrued interest within forty-five days of the date of termination.
During 2020, Interquest North Business Improvement District issued $13,735,000 in Limited Tax General Obligation Bonds, Series 2020 to fund construction of public improvements. The District made its first draw of $1,535,000 on September 15, 2020 and the remaining draws are scheduled to occur in 2021, 2022, and 2023. The bonds mature in 2049 and bear 7.00% interest paid annually.
During 2020, Interquest Town Center Business Improvement District (District) issued $2,860,000 in General Obligation Limited Tax Bonds, Series 2020. The bond proceeds will be used to fund infrastructure improvements. Final maturity of the bonds is in 2049 and bear interest at a rate of 7.00% per annum. The bonds are secured by and payable from pledged revenue consisting of monies derived by the District from a mill levy.
Sales Tax Increment Financings - During 2019, the City approved a resolution authorizing CSURA to use 87.5% of the annual City General Fund sales tax increments generated within the True North Commons Urban Renewal Project Plan area. The dedication of these sales tax increments shall be for a period not to exceed 25 years.
During 2018, the City approved a resolution authorizing CSURA to use 87.5% of the annual City General Fund sales tax increments generated within the Museum and Park Urban Renewal Project Plan area. The dedication of these sales tax increments shall be for a period not to exceed 25 years.
During 2018, the City approved a resolution authorizing CSURA to use 87.5% of the annual City General Fund sales tax increments generated within the Tejon and Costilla Urban Renewal Project Plan area. The dedication of these sales tax increments shall be for a period not to exceed 25 years.
During 2015, the City approved a resolution authorizing CSURA to use 87.5% of the annual City General Fund sales tax increments generated within the Gold Hill Mesa Commercial Urban Renewal Plan area for the first 5 years and 75% for the remaining 20 years. The dedication of these sales tax increments shall be for a period not to exceed 25 years.
During 2015, the City approved a resolution authorizing CSURA to use 87.5% of the annual City General Fund sales tax increments generated within the South Nevada Area Urban Renewal
NOTES TO FINANCIAL STATEMENTS December 31, 2020
City of Colorado Springs 2020 Annual Comprehensive Financial Report 105

Project Urban Renewal Plan area for the first 5 years and 75% for the remaining 20 years. The dedication of these sales tax increments shall be for a period not to exceed 25 years.
During 2013, the City approved a resolution authorizing CSURA to use 50% of the annual City General Fund sales tax increments generated within the Copper Ridge Metropolitan District area. During 2019, the dedication of these sales tax increments was amended to extend the 25 year duration period through 2044.
During 2012, the City approved a resolution authorizing CSURA to use 100% of the annual City General Fund sales tax increments generated within the Ivywild Urban Renewal area. The dedication of these sales tax increments shall be for a period from January 24, 2012 through June 28, 2036.
During 2007, the City approved a resolution authorizing CSURA to use 100% of the annual City General Fund sales tax increments generated within the North Nevada Avenue corridor Urban Renewal area. The dedication of these sales tax increments shall be for a period not to exceed 23 years and is estimated to total $98,800,000. The increment will be utilized to support a bond issue that will fund needed infrastructure improvements and administrative expenses within the renewal area.
Remainder of page intentionally blank
NOTES TO FINANCIAL STATEMENTS December 31, 2020
106 City of Colorado Springs 2020 Annual Comprehensive Financial Report

1. Summary of Long-term Debt
Debt Types
OriginalIssue Amount
(in 000's)
OutstandingPrincipalAmount
(in 000's)
Future Aggregate
InterestRequirements
(in 000's)
Interest Ratesof Debt
OutstandingMaturity Datesof Serial Debt
Governmental Activities1
Certificates of Participation
Refunding COP Series 2017 $ 29,930 $ 28,385 $ 12,472 3.000 - 5.250 2018 - 2039
COP Series 2019 9,000 8,760 4,133 4.000 - 5.000 2020 - 2039
38,930 37,145 16,605
General Obligation Bonds - Direct Placement
Briargate GID Series 2014 8,960 3,225 340 2.960 2015 - 2030
Marketplace at Austin Bluffs GID Series 2008 2,790 1,905 941 6.500 2010 - 2033
11,750 5,130 1,281 Lease/Lease Purchase - Direct borrowing and Direct Placement
Lease Purchase Series 2016 - Direct Placement 13,690 8,495 488 1.620 2017 - 2026
Capital Leases 34,688 21,004 776 1.586 - 4.460 2007 - 2027
48,378 29,499 1,264
Total Governmental Activities $ 99,058 $ 71,774 $ 19,150
(continued)
Remainder of page intentionally blank
NOTES TO FINANCIAL STATEMENTS December 31, 2020
City of Colorado Springs 2020 Annual Comprehensive Financial Report 107

Debt Types
OriginalIssue Amount
(in 000's)
OutstandingPrincipalAmount
(in 000's)
Future Aggregate
InterestRequirements
(in 000's)
Interest Ratesof Debt
OutstandingMaturity Datesof Serial Debt
Business-type Activities2
Revenue Bonds
Utilities Revenue Bonds
Series 2005A $ 100,000 $ 73,970 $ 30,991 resets weekly 2010 - 2035
Series 2006B 75,000 59,000 23,308 resets weekly 2011 - 2036
Series 2007A 75,000 55,430 17,443 resets weekly 2008 - 2037
Series 2008A 50,000 37,470 17,111 resets weekly 2009 - 2038
Series 2008D 3,631 259 4 1.350 2008 - 2021
Series 2009B-2 64,450 62,155 37,751 4.949 - 5.545 2010 - 2039
Series 2009C 66,455 56,725 23,142 resets weekly 2010 - 2028
Series 2009D-2 56,750 52,135 57,065 4.164 - 6.313 2016 - 2049
Series 2010C 50,000 39,370 18,038 resets weekly 2011 - 2040
Series 2010D 224,520 107,260 120,041 1.324 - 5.158 2011 - 2040
Series 2011A 167,490 69,685 17,168 2.000 - 5.000 2012 - 2033
Series 2012A 50,000 40,665 20,373 resets weekly 2012 - 2041
Series 2012B 108,015 83,925 33,146 3.000 - 5.000 2013 - 2043
Series 2012C 157,670 74,160 38,357 3.000 - 5.000 2013 - 2042
Series 2013A 97,580 90,185 44,635 1.500 - 5.000 2014 - 2045
Series 2013B-1 58,915 51,080 36,004 1.500 - 5.000 2014 - 2043
Series 2013B-2 68,645 59,895 42,462 2.000 - 5.000 2014 - 2043
Series 2014A-1 58,515 56,495 38,692 4.000 - 5.000 2019 - 2044
Series 2014A-2 53,995 52,170 35,618 4.000 - 5.000 2019 - 2044
Series 2015A 82,975 74,170 37,259 3.000 - 5.000 2018 - 2048
Series 2017A-1 89,750 87,515 34,557 3.000 - 5.000 2018 - 2042
Series 2017A-2 84,340 80,475 68,204 2.500 - 5.000 2018 - 2047
Series 2017A-3 66,090 39,105 3,892 5.000 2018 - 2023
Series 2018A-1 125,645 124,345 27,419 3.000 - 5.000 2018 - 2026
Series 2018A-2 39,500 38,115 32,705 3.000 - 5.000 2019 - 2048
Series 2018A-3 4,810 4,220 1,439 5.000 2019 - 2033
Series 2018A-4 56,860 54,930 47,332 4.000 - 5.000 2019 - 2048
Series 2019A 84,090 84,090 37,241 5.000 2027 - 2029
Series 2020A 200,720 198,990 122,761 4.000 - 5.000 2020 - 2050
Series 2020B 50,980 49,675 11,604 5.000 2020 - 2028
Series 2020C 85,440 85,135 66,540 5.000 2020 - 2050
PACE Revenue Bonds Series 2008 653,210 565,620 421,998 5.750 - 6.500 2009 - 2038
PPAM Revenue Bonds Series 2018 30,050 29,160 25,377 3.750 - 5.250% 2019 - 2048
3,241,091 2,637,579 1,589,677
Bonds and notes payable from direct borrowings and direct placements
Parking System Revenue Bonds Series 2015 - Direct Placement 9,520 5,325 516 2.430 2015 - 2027
Airport, 2014 3,431 2,159 193 2.500 2015 - 2024Airport, 2016 7,500 7,500 1,405 2.500 2017 - 2026Drinking Water - Utilities, 2009 8,600 4,831 659 2.500 2011 - 2030
19,531 14,490 2,257
Capital Leases 478 378 20 2.080 2020 - 2024
Total Business-type Activities $ 3,270,620 $ 2,657,772 $ 1,592,470
(continued)
NOTES TO FINANCIAL STATEMENTS December 31, 2020
108 City of Colorado Springs 2020 Annual Comprehensive Financial Report

Debt Types
OriginalIssue Amount
(in 000's)
OutstandingPrincipalAmount
(in 000's)
Future Aggregate
InterestRequirements
(in 000's)
Interest Ratesof Debt
OutstandingMaturity Datesof Serial Debt
Component Units2
Governmental ActivitiesLimited Tax General Obligation Bonds
Barnes & Powers North BID Series 2007 $ 4,000 $ 3,130 $ 1,999 6.500 2009 - 2036Barnes & Powers South BID Series 2007 835 385 92 6.500 2009 - 2026First & Main BID Series 2009 1,650 1,360 1,343 8.500 2009 - 2038First & Main North BID Series 2005 1,927 1,424 764 6.000 2005 - 2035First & Main No. 2 BID Series 2009 2,400 2,055 2,033 8.500 2011 - 2038First & Main No. 2 BID Series 2015 1,750 1,615 1,689 6.750 2015 - 2044Interquest North BID Series 2010 6,500 5,745 6,176 8.500 2012 - 2040Interquest North BID Series 2016 4,765 4,630 5,965 8.500 2017 - 2045Interquest North BID - Series 2020 1,535 1,535 2,441 7.000 2020 - 2049Interquest Town Center - Series 2020 2,860 2,860 4,141 7.000 2020 - 2049Powers & Woodmen Commercial BID Series 2010 1,850 1,605 1,683 8.500 2011 - 2039
30,072 26,344 28,326
Special Assessment Revenue BondsBriargate Center BID Series 2006 7,360 3,135 660 4.500 - 4.900% 2006 - 2007Urban Renewal Authority Series 2018A 7,325 7,325 6,706 5.750 2021 - 2047Urban Renewal Authority Series 2018B3 1,156 1,156 — 8.125 N/A
15,841 11,616 7,366
Revenue BondsFirst & Main No. 2 BID Series 2011 2,000 1,620 1,303 8.500 2011 - 2035First & Main No. 2 BID Series 2015 1,725 1,580 1,271 6.750 2017 - 2039Interquest South BID Series 2017 4,000 3,945 3,503 4.500 - 5.000 2018 - 2047SW Downtown BID Series 2020A3 26,500 26,500 — 8.000 2020 - 2049Creekwalk Marketplace Series 2019A 24,230 24,230 26,414 5.000 - 8.000 2020 - 2049
Creekwalk Marketplace Series 2019B3 2,500 2,500 — 8.000 2049 60,955 60,375 32,491
Bonds and notes payable from direct borrowings and direct placementsUrban Renewal Authority Series 2017 39,000 38,200 8,033 3.330 2018 - 2027Urban Renewal Authority Series 2019 12,400 11,738 3,056 3.330 2020 - 2031Barnes & Powers North BID3 322 150 — 7.000 N/ABriargate Center BID 2018 3,380 2,852 667 4.770 2019 - 2028Briargate Center BID 20193 6,196 5,816 — — N/AColorado Springs Downtown Development3 1,350 1,350 — — N/ACreekwalk Marketplace3 496 571 — 7.000 N/AFirst & Main North BID3 366 156 — 7.000 N/AFirst & Main No. 2 BID3 11,183 10,526 — 7.000 N/AInterquest South BID3 2,405 209 — 7.000 N/APowers & Woodmen Commercial BID3 2,034 1,967 — 7.000 N/ASW Downtown BID3 828 336 — 7.000 N/AInterquest Town Center BID3 17 79 — 8.000 N/AUrban Renewal Authority, 20123 778 486 — 7.000 2013 - 2028Urban Renewal Authority, Series 2020 Refunding 52,575 52,574 7,728 2.050 2020 - 2047Urban Renewal Authority, Series 2020 Revenue 3,919 3,875 1,253 3.250 2020 - 2047
137,249 130,885 20,737
Total Governmental Activities $ 244,117 $ 229,220 $ 88,920
Business-type ActivitiesFountain Valley Authority $ 10,830 $ 723 $ 74 3.030 - 4.400 2001 - 2024The Lake Meredith Reservoir Company, 2003 1,472 857 268 4.000 2005 - 2034
12,302 1,580 342
Capital Leases 64,803 7,320 290 3.046 1986 - 2025
Total Business-type Activities $ 77,105 $ 8,900 $ 632
Total Component Units $ 321,222 $ 238,120 $ 89,552
1Exclusive of municipal solid waste landfill and compensated absences2Exclusive of other liabilities3These items have no repayment scheduleNote: Immaterial differences may occur due to rounding.
NOTES TO FINANCIAL STATEMENTS December 31, 2020
City of Colorado Springs 2020 Annual Comprehensive Financial Report 109

2. Changes in Long-term Liabilities
The City has issued and has long-term debt in various instruments. The following is a summary of transactions of the long-term liabilities, exclusive of discretely presented component units, for year ended December 31, 2020 (in 000's):
BeginningBalance* Additions Reductions
EndingBalance
AmountsDue withinOne Year
GOVERNMENTAL ACTIVITIESCertificates of participation $ 38,140 $ — $ 995 $ 37,145 $ 920 Add issuance premium 3,454 — 227 3,227 —
41,594 — 1,222 40,372 920
Bonds and notes payable from direct borrowings and direct placementsGeneral obligation bonds 6,985 — 1,855 5,130 605 Lease/lease purchase 9,835 — 1,340 8,495 1,360 Capital leases 16,515 10,515 6,026 21,004 5,650
33,335 10,515 9,221 34,629 7,615
Other liabilitiesMunicipal solid waste landfill 340 6 — 346 — Compensated absences 18,632 23,249 21,691 20,190 1,010 Net pension liability 301,400 — 63,619 237,781 — Net OPEB liability 39,043 2,928 2,193 39,778 — Developer reimbursements 3,129 — 150 2,979 —
362,544 26,183 87,653 301,074 1,010 Governmental activities
long-term liabilities $ 437,473 $ 36,698 $ 98,096 $ 376,075 $ 9,545
BUSINESS-TYPE ACTIVITIESRevenue bonds
Revenue bonds $ 2,715,639 $ 337,140 $ 415,200 $ 2,637,579 $ 103,809 Add issuance premiums/(discounts) 158,144 84,044 23,510 218,678 —
2,873,783 421,184 438,710 2,856,257 103,809
Bonds and notes payable from direct borrowings and direct placementsRevenue bonds 6,040 — 715 5,325 735 Notes payable 8,981 7,500 1,991 14,490 1,416 Capital leases 162 478 262 378 92
15,183 7,978 2,968 20,193 2,243
Other liabilitiesMunicipal solid waste landfill 4,818 267 — 5,085 — Compensated absences 17,048 25,776 22,137 20,687 13,257 Customer deposits 3,420 834 559 3,695 — Customer advances for construction 22,576 8,651 12,170 19,057 — Net pension liability 324,930 26,443 164,168 187,205 — Net OPEB liability 47,424 7,106 10,301 44,229 — Derivative instruments 100,410 20,961 — 121,371 — Other 8,638 2,737 35 11,340 —
529,264 92,775 209,370 412,669 13,257 Business-type activities
long-term liabilities $ 3,418,230 $ 521,937 $ 651,048 $ 3,289,119 $ 119,309
*Reclassified for GASB 88Note: Immaterial differences may occur due to rounding.
NOTES TO FINANCIAL STATEMENTS December 31, 2020
110 City of Colorado Springs 2020 Annual Comprehensive Financial Report

Internal service funds predominantly serve the governmental funds. Accordingly, long-term liabilities for those funds are included in the governmental activities totals. Also, municipal solid waste landfill, compensated absences, net pension liability, net OPEB liability, and developer reimbursements for governmental activities are generally liquidated by the General Fund.
Component Units
The following is a summary of long-term debt transactions for component units of the City for the year ended December 31, 2020 (in 000’s):
BeginningBalance* Additions Reductions
EndingBalance
AmountsDue withinOne Year
GOVERNMENTAL ACTIVITIESLimited tax general
obligation bonds $ 22,458 $ 4,395 $ 509 $ 26,344 $ 548 Special assessment
revenue bonds 13,269 — 1,653 11,616 420 Revenue bonds 34,000 26,500 125 60,375 155 Other 12,878 2,033 4,431 10,480 —
82,605 32,928 6,718 108,815 1,123 Bonds and notes payable from direct borrowings and direct placements
Revenue bonds 51,100 — 1,162 49,938 1,266 Notes payable 76,561 67,102 62,716 80,947 3,493
127,661 67,102 63,878 130,885 4,759 Governmental activities
long-term liabilities $ 210,266 $ 100,030 $ 70,596 $ 239,700 $ 5,882
BUSINESS-TYPE ACTIVITIESNotes payable 2,322 — 742 1,580 219 Capital leases 14,940 — 7,620 7,320 5,113 Business-type activities
long-term liabilities $ 17,262 $ — $ 8,362 $ 8,900 $ 5,332
*Reclassified for GASB 88 and restated for removal of debt as further explained in Note III.O.Note: Immaterial differences may occur due to rounding.
Remainder of page intentionally blank
NOTES TO FINANCIAL STATEMENTS December 31, 2020
City of Colorado Springs 2020 Annual Comprehensive Financial Report 111

3. Annual Debt Service Requirements of Long-term Debt
The following is a summary of general obligation bond scheduled maturities as of December 31, 2020 (in 000's):
Governmental ActivitiesGovernmental Activities
Component UnitsDirect Placement
Year Principal Interest Principal Interest
2021 $ 605 $ 219 $ 548 $ 1,931 2022 625 198 591 1,906 2023 645 175 630 1,862 2024 690 152 699 1,816 2025 725 127 690 1,695 2026-2030 1,320 347 4,464 7,929 2031-2035 520 63 6,402 5,986 2036-2040 — — 6,135 3,407 2041-2045 — — 4,565 1,501 2046-2049 — — 1,620 293
Total $ 5,130 $ 1,281 $ 26,344 $ 28,326
Note: Immaterial differences may occur due to rounding.
The City has outstanding direct placement general obligation bonds totaling $5,130,000.
Remainder of page intentionally blank
NOTES TO FINANCIAL STATEMENTS December 31, 2020
112 City of Colorado Springs 2020 Annual Comprehensive Financial Report

The following is a summary of revenue bond scheduled maturities as of December 31, 2020 (in 000's):
Governmental ActivitiesComponent Units Business-type Activities
Year Principal Interest Principal Interest
2021 $ 155 $ 1,787 $ 103,809 $ 136,851 2022 160 1,777 115,985 131,012 2023 420 1,766 120,115 125,219 2024 490 1,742 121,905 119,122 2025 470 1,531 125,660 112,923 2026-2030 3,710 8,059 702,845 463,885 2031-2035 5,890 6,745 574,770 297,151 2036-2040 7,555 4,841 476,860 140,463 2041-2045 5,080 3,005 191,845 50,510 2046-2049 7,445 1,238 103,785 12,542
Total $ 31,375 $ 32,491 $ 2,637,579 $ 1,589,678
Note: Immaterial differences may occur due to rounding.
The governmental activities component units have additional revenue bonds in the amount of $29,000,000. This amount is to be repaid exclusively from specified revenues, and therefore has no predetermined payback period. As such, this amount is not listed in the above schedule.
The following is a summary of direct placement revenue bond scheduled maturities as of December 31, 2020 (in 000's)
Governmental ActivitiesComponent Units Business-type ActivitiesDirect Placement Direct Placement
Year Principal Interest Principal Interest
2021 $ 1,266 $ 1,659 $ 735 $ 129 2022 1,454 1,617 750 112 2023 1,939 1,569 770 93 2024 2,232 1,505 790 75 2025 2,628 1,431 810 55 2026-2030 36,763 3,187 1,470 51 2031 3,656 121 — —
Total $ 49,938 $ 11,089 $ 5,325 $ 515
Note: Immaterial differences may occur due to rounding.
CSURA has outstanding direct placement revenue bonds totaling $49,938,000. If any principal or interest is not paid when due, interest on the unpaid amount shall become payable at up to 7% per annum or the same interest rate at which the bonds were issued, depending on which bond is in default. Parking has outstanding direct placement revenue bonds of $5,325,000. In the event of default, a rate increase to 12% per annum would be applied to all remaining payment obligations.
NOTES TO FINANCIAL STATEMENTS December 31, 2020
City of Colorado Springs 2020 Annual Comprehensive Financial Report 113

The following is a summary of certificates of participation scheduled maturities as of December 31, 2020 (in 000's):
Governmental ActivitiesYear Principal Interest
2021 $ 920 $ 1,514 2022 1,010 1,468 2023 1,105 1,417 2024 1,205 1,362 2025 1,315 1,302 2026-2030 8,460 5,398 2031-2035 11,900 3,169 2036-2039 11,230 975
Total $ 37,145 $ 16,605
Note: Immaterial differences may occur due to rounding.
The following is a summary of capital leases and lease/lease purchase scheduled maturities as of December 31, 2020 (in 000's):
Governmental Activities Business-type ActivitiesBusiness-type Activities
Component UnitsDirect Borrowing Direct Borrowing Direct Borrowing
Year Principal Interest Principal Interest Principal Interest
2021 $ 7,010 $ 463 $ 92 $ 8 $ 5,113 $ 223 2022 6,646 332 94 6 2,207 67 2023 4,921 206 95 4 — — 2024 3,556 124 97 2 — — 2025 3,220 81 — — — — 2026-2027 4,146 58 — — — —
Total $ 29,499 $ 1,264 $ 378 $ 20 $ 7,320 $ 290
Note: Immaterial differences may occur due to rounding.
The City has capital leases with outstanding balances totaling $21,004,000 for governmental activities and $378,000 for business-type activities. Capital leases are discussed further in Note III.H.3.
The City also has a lease purchase in governmental activities with an outstanding balance of $8,495,000. The lease would terminate with failure of the City to appropriate funds for payment and the City's right to possession of leased property would also terminate. The lease is collateralized by the Colorado Springs Police Department Sandcreek Substation.
Fountain Valley Authority has an outstanding capital lease principal balance of $7,320,465.
NOTES TO FINANCIAL STATEMENTS December 31, 2020
114 City of Colorado Springs 2020 Annual Comprehensive Financial Report

The following is a summary of special assessment bond scheduled maturities as of December 31, 2020 (in 000's):
Governmental ActivitiesComponent Units
Year Principal Interest
2021 $ 420 $ 579 2022 545 553 2023 575 526 2024 615 496 2025 640 465 2026-2030 2,090 1,872 2031-2035 1,570 1,436 2036-2040 2,260 910 2041-2045 735 423 2046-2047 1,010 106
Total $ 10,460 $ 7,366
Note: Immaterial differences may occur due to rounding.
CSURA issued special assessment bonds in 2018. The bond is to be repaid exclusively from specified revenues, and therefore have no predetermined payback period. As such, the bond isnot listed in the above schedule. As of December 31, 2020, the outstanding principal balance is $1,156,000.
Remainder of page intentionally blank
NOTES TO FINANCIAL STATEMENTS December 31, 2020
City of Colorado Springs 2020 Annual Comprehensive Financial Report 115

The following is a summary of notes payable scheduled maturities as of December 31, 2020 (in 000's):
Governmental ActivitiesComponent Units Business-type Activities
Business-type ActivitiesComponent Units
Direct Borrowings Direct Borrowings Direct BorrowingsYear Principal Interest Principal Interest Principal Interest
2021 $ 3,493 $ 1,371 $ 1,416 $ 416 $ 219 $ 71 2022 3,667 1,275 1,456 375 226 58 2023 3,832 1,188 1,498 334 240 43 2024 4,020 1,098 1,541 292 253 29 2025 3,826 926 1,584 247 59 26 2026-2030 38,539 3,551 6,995 593 333 92 2031-2035 1,499 225 — — 250 23 2036 425 14 — — — —
Total $ 59,301 $ 9,648 $ 14,490 $ 2,257 $ 1,580 $ 342
Note: Immaterial differences may occur due to rounding.
The governmental activities component units have additional combined notes payable and other long-term liabilities in the amount of $21,645,513. These amounts are to be repaid exclusively from specified revenues, and therefore have no predetermined payback period. As such, these amounts are not listed in the above schedule.
For governmental activities component units, CSURA has outstanding direct borrowing notes payable of $3,875,072 for a tax exempt note and $52,575,000 for a refunding loan. If CSURA fails to make principal and interest payments when due on the refunding loan, it will trigger a rate increase event. Briargate BID has an outstanding refunding loan of $2,852,000 that is collateralized by pledged revenue.
Included in business-type activities, Airport has outstanding direct borrowing notes payable totaling $9,659,420. In the event of non-appropriation for payment of the Airport's principal and interest, the Colorado Department of Transportation as lender may transfer jet fuel sales and use tax revenue otherwise payable to the Airport to be paid to the lender. In the event of default, CDOT has the right to terminate the contract. If terminated, the Airport must return any funds that have been disbursed and any accrued interest within forty-five days of the date of termination. Utilities has direct borrowing outstanding notes payable of $4,831,000.
Business-type activities component units have outstanding direct borrowing notes payable of $1,580,000. Of this total, Fountain Valley Authority has a note payable for $722,818 that is collateralized by pledged revenue.
NOTES TO FINANCIAL STATEMENTS December 31, 2020
116 City of Colorado Springs 2020 Annual Comprehensive Financial Report

Over the years, the City has issued revenue with pledged revenues as collateral. These bonds were issued to finance various construction projects within each of the issuing funds, with the pledged revenue coming from the respective fund.
Amount Pledged(in 000's)
Term of Commitment
Business-type activities:Utilities revenue bonds $ 3,185,101 2001 - 2050PACE revenue bonds 987,618 2009 - 2038Parking revenue bonds 5,841 1999 - 2027PPAM revenue bonds 54,537 2019 - 2048
The total pledged revenue is not estimable in comparison to pledged debt in that revenues are uncertain as to future amounts. However, the debt coverage requirement for each issue must be met or the bonds will be in default. This provides sufficient coverage each year for the pledged debt. The debt service coverage, or comparison of pledged revenues net of specific operating expenses, for each pledged debt is provided in Table 12 of the Statistical Section.
Remainder of page intentionally blank
NOTES TO FINANCIAL STATEMENTS December 31, 2020
City of Colorado Springs 2020 Annual Comprehensive Financial Report 117

K. Industrial Development Revenue Bonds and Other Instruments Issued under the Colorado County and Municipality Development Revenue Bond Act
The City has lent its name to various industrial development revenue bond issues over the years. Proceeds of these bond issues were used to finance various private activities relating to business expansion, construction and development. In addition, Private Activity Bonds (PAB) are a form of tax-exempt financing in which the City acts as the issuer under the County and Municipality Development Revenue Bond Act, section 29-3-101 CRS. PABs are authorized to allow counties and municipalities to promote industry and develop trade or other economic activity by inducing profit or nonprofit enterprises to locate, expand or remain in their communities. Recently, the City has prioritized affordable multi-family rental projects. The advantage to nonprofit entities that borrow through the City is that they borrow funds at lower interest rates because the bonds are exempt from federal and state income tax.
The City is not liable for the repayment of principal or interest on these bonds and related financial activity is not shown in the financial statements. Prior to 2018, the City assigned its annual allocation to El Paso County. It is possible that PABs, or industrial revenue bonds, were issued using this allocation. The City now retains its allocations and works directly with requestors. During 2020, $8.0 million in PABs were issued under the City’s allocation.
Remainder of page intentionally blank
NOTES TO FINANCIAL STATEMENTS December 31, 2020
118 City of Colorado Springs 2020 Annual Comprehensive Financial Report

L. Fund Balance Fund balances of the governmental funds at December 31, 2020, include the following:
GeneralFund
Non-MajorGovernmental
Funds
TotalGovernmental
FundsNonspendable:
Delinquent property taxes receivable $ 20,394 $ — $ 20,394 Inventories 294,093 — 294,093 Prepaid expenses — 29,349 29,349 Endowments - CD Smith trust fund — 1,183,046 1,183,046 Endowment - Cemetery endowment fund — 12,852,364 12,852,364 Endowment - TOPS maintenance trust fund — 644,928 644,928
Total nonspendable 314,487 14,709,687 15,024,174 Restricted:
Emergency reserve - TABOR 9,211,165 — 9,211,165 Capital reserve - public safety 8,290,740 — 8,290,740 Capital reserve - parks 2,224,345 — 2,224,345 Bicycle Tax — 180,845 180,845 Trails/Open Space — 13,433,368 13,433,368 Conservation Trust — 1,418,782 1,418,782 Public Safety Sales Tax — 11,032,813 11,032,813 Road Repair, Maintenance, & Improvement Sales Tax — 18,327,620 18,327,620 Special Improvement Maintenance Districts - ALL — 1,203,894 1,203,894 Public improvements - Banning Lewis Ranch — 2,456,610 2,456,610 General Improvement Districts - ALL — 1,333,045 1,333,045 Lodgers and Auto Rental Tax — 2,185,524 2,185,524 Gift Trust - general government — 268,000 268,000 Gift Trust - public safety — 434,184 434,184 Gift Trust - public works — 7,611 7,611 Gift Trust - parks — 5,376,534 5,376,534 Endowment - CD Smith trust fund — 213,254 213,254 Endowment - Cemetery endowment fund — 80,837 80,837 Endowment - TOPS maintenance trust fund — 173,873 173,873
Total restricted 19,726,250 58,126,794 77,853,044 Committed:
Public improvements - Public Space and Development — 12,356,270 12,356,270 Public improvements - Subdivision Drainage — 7,860,168 7,860,168 Public improvements - Arterial Roadway — 2,307,018 2,307,018 Public improvements - Park Developer Easement — 125,815 125,815 Ballfield Capital Improvements — 15,491 15,491 Street Tree — 95,505 95,505 Senior Programs — 556,941 556,941 Therapeutic Recreation — 4,819 4,819 Capital outlay - general government 4,566,420 19,607,735 24,174,155 Capital outlay - public safety 396,673 — 396,673 Capital outlay - planning 3,789 — 3,789 Capital outlay - public works 5,996,819 — 5,996,819 Capital outlay - parks 5,642,579 — 5,642,579
Total committed 16,606,280 42,929,762 59,536,042 Assigned:
Public improvements - Park Developer Easement — 59,720 59,720 Public improvements - Banning Lewis Ranch — 308,336 308,336 Encumbrances - general government 1,219,167 — 1,219,167 Encumbrances - public safety 370,763 — 370,763 Encumbrances - planning 57,557 — 57,557 Encumbrances - public works 5,533,351 — 5,533,351 Encumbrances - parks 323,002 — 323,002 Encumbrances - internal service 12,795 — 12,795 Encumbrances - capital projects — 3,854,506 3,854,506
Total assigned 7,516,635 4,222,562 11,739,197 Unassigned: 82,295,044 — 82,295,044
Total unassigned 82,295,044 — 82,295,044 Total Fund Balance $ 126,458,696 $ 119,988,805 $ 246,447,501
NOTES TO FINANCIAL STATEMENTS December 31, 2020
City of Colorado Springs 2020 Annual Comprehensive Financial Report 119

M. Derivatives and Interest Rate Swaps
1. Utilities Derivative Instruments
Utilities' financial derivatives are acquired with the objective of effectively hedging expected cash flows. Interest rate hedges that are deemed effective by applying methods of evaluating effectiveness pursuant to GASB 53 are recognized as cash flow hedges. Financial derivatives that do not meet the effectiveness criteria are classified as investment derivatives. Changes in the fair value of cash flow hedge derivative instruments are reported as either Deferred Outflows or Inflows of Resources on the Statements of Net Position. Interest rate hedges that are deemed ineffective are recognized as standalone investment derivatives. The change in the fair value of investment derivatives is recognized as Nonoperating Revenues (Expenses) on the Statement of Revenues, Expenses and Changes in Net Position.
Utilities has interest rate hedges based on both the Securities Industry and Financial Markets Association (SIFMA) index and the London Interbank Offered Rate (LIBOR) index. Historically, Utilities’ interest rate derivatives based on 68.0% of 1-month LIBOR were classified as cash flow hedges. As of December 31, 2013, these LIBOR-based derivatives are no longer effective pursuant to GASB 53 hedge effectiveness standards and are considered investment derivatives.
Utilities values interest rate derivatives based on valuations provided by Stifel, a third-party valuation service provider for 2020. The fair values of the interest rate derivatives are based on present value of their estimated future cash flows and account for the risk of nonperformance.
Remainder of page intentionally blank
NOTES TO FINANCIAL STATEMENTS December 31, 2020
120 City of Colorado Springs 2020 Annual Comprehensive Financial Report

Summary of Derivative Instruments
The fair value and notional amount of derivative instruments outstanding at December 31, 2020, classified by type and changes in fair value of such derivative instruments (in 000's):
2020 Changes in Fair Value Fair Value at December 31, 2020Classification Amount Classification Amount Notional
Cash Flow HedgesInterest Rate Swaps Deferred outflows $ (7,346) Derivative instruments $ (37,986) $ 111,440
Total Cash Flow Hedges $ (7,346) $ (37,986)
Investment DerivativeInterest Rate Swaps Derivative loss $ (13,615) Derivative instruments $ (83,385) $ 251,620
Total Investment Derivative $ (13,615) $ (83,385)
Note: Immaterial differences may occur due to rounding.
Utilities employs interest rate swap derivatives that are designed to synthetically fix the cash flows on Variable Rate Demand Obligation bonds (VRDO). The variable rate received on the interest rate swaps is intended to offset the variable rate being paid on the obligations so that the fixed rate of the swap is essentially the effective rate incurred by Utilities.
Summary of scheduled projected future cash flows for interest rate derivatives as of December 31, 2020 (in 000's):
December 31,
Projected FutureCash FlowsIn/(Out) forHedging
Derivatives2021 $ (15,141) 2022 (14,605) 2023 (14,043) 2024 (13,453) 2025 (12,837) 2026-2030 (48,066) 2031-2035 (21,963) 2036-2040 (4,592) 2041 (92) Total $ (144,792)
Note: Immaterial differences may occur due to rounding.
NOTES TO FINANCIAL STATEMENTS December 31, 2020
City of Colorado Springs 2020 Annual Comprehensive Financial Report 121

Summary of Utilities’ pay-fixed interest rate swap agreements outstanding as of December 31, 2020 (in 000's):
NotionalAmount Effective Date Maturity Date Terms Counterparty
Cash Flow Hedges2005A SIFMA Swap $ 55,370 09/15/05 11/01/35 Pay 4.7099%;
receive SIFMA indexBank of America, N.A.
2005A SIFMA Swap 18,600 09/15/05 11/01/35 Pay 4.7099%; receive SIFMA index
J. Aron & Company
2008A SIFMA Swap 37,470 09/12/08 11/01/38 Pay 4.2686%; receive SIFMA index
Bank of America, N.A.
Investment Derivatives2005A SIFMA Swap 430 09/15/05 11/01/35 Pay 4.7099%;
receive SIFMA indexBank of America, N.A.
2006B New Money LIBOR Swap
23,600 09/14/06 11/01/36 Pay 4.1185%; receive 68% of LIBOR
JPMorgan Chase Bank, N.A.
2006B New Money LIBOR Swap
35,400 09/14/06 11/01/36 Pay 4.1185%; receive 68% of LIBOR
Morgan Stanley Capital Services, Inc.
2007A New Money LIBOR Swap
33,258 09/13/07 11/01/37 Pay 3.1980%; receive 68% of LIBOR
J. Aron & Company
2007A New Money LIBOR Swap
22,172 09/13/07 11/01/37 Pay 3.1980%; receive 68% of LIBOR
Morgan Stanley Capital Services, Inc.
2009C LIBOR Swap (2012 Novation)
56,725 10/01/09 11/01/28 Pay 5.4750%; receive 68% of LIBOR
Wells Fargo Bank, N.A.
2010C LIBOR Swap 39,370 10/26/10 11/01/40 Pay 3.8807%; receive 68% of LIBOR
Morgan Stanley Capital Services, Inc.
2012A LIBOR Swap 40,665 03/15/12 11/01/41 Pay 4.0242%; receive 68% of LIBOR
Morgan Stanley Capital Services, Inc.
Total Notional Amount for Interest Rate Swaps $ 363,060
Note: Immaterial differences may occur due to rounding.
2005A SIFMA Swap - During the fourth quarter of 2012, it was discovered that in 2008, Utilities redeemed a portion of its 2005A variable rate bond series through the issuance of the 2008D Clean Renewable Energy Bonds. This transaction created an immaterial difference between the notional size of the bond issuance and the interest rate swap hedge. The overhedged portion of the swap has therefore been declared an investment derivative instrument.
NOTES TO FINANCIAL STATEMENTS December 31, 2020
122 City of Colorado Springs 2020 Annual Comprehensive Financial Report

RiskUtilities routinely monitors and manages risks in the areas of credit, interest rate and associated basis, termination, rollover, market access and foreign currency risks. These risks are discussed in detail below.
Credit Risk - The exposure resulting from the counterparty's inability or unwillingness to fulfill its present and future financial obligations. Each of Utilities’ interest rate cash flow and investment derivative instruments are held with various counterparties of high credit quality. Utilities views counterparty credit risks that may arise through interest rate derivative transactions as similar between cash flow hedges and investment derivative instruments.
Long-term counterparty credit ratings from Moody’s and S&P at December 31, 2020:
CounterpartyCreditRating
J. Aron & Co. A3/BBB+JP Morgan Chase Bank, N.A. Aa2/A+Bank of America, N.A. Aa2/A+Morgan Stanley Capital Services, Inc. A2/BBB+Wells Fargo Bank, N.A. Aa2/A+
The Financial Risk Management Plan requires that Utilities’ counterparties to financial instruments be on an approved counterparty list. To be on the interest rate counterparty transaction list, at the time of transaction execution, counterparties must have a minimum credit rating in the “A-” category by at least one of the major credit rating agencies previously listed or a counterparty shall provide a guarantee, swap surety, or other form of credit enhancement such that its creditworthiness is of an “A-” category equivalent. Each counterparty must also have a demonstrated record of successfully executing swap transactions and shall have a minimum capitalization of at least $250.0 million.
The Energy Risk Management Plan requires that Utilities’ counterparties to commodity transactions be on an approved counterparty list. To be on this list, counterparties must have the necessary contracts in place for the commodity being transacted and have adequate credit or credit facilities in place to cover assumed transactions. The Energy Risk Management Plan limits the amount of counterparty credit exposure according to the counterparty’s credit rating. At December 31, 2020, Utilities has no forward exposure to energy financial commodity transactions.
It is Utilities’ policy to require collateral posting provisions for all counterparties involved in its non-exchange-traded derivative instrument transactions. The collateral posted by counterparties is governed by ISDA agreements with collateral threshold limits as specified in each agreement. As the mark to market value of a fixed price financial derivative held by Utilities decreases relative to market, Utilities may be obligated to post collateral with the applicable counterparty. Conversely, as the mark to market value of a fixed price financial derivative agreement or call option increases, Utilities’ counterparties may be required to post collateral.
At December 31, 2020, Utilities has posted approximately $29.7 million in collateral with various counterparties to the swap agreements. Utilities’ aggregate fair value of derivative instruments as of December 31, 2020 was approximately ($121.4) million.
NOTES TO FINANCIAL STATEMENTS December 31, 2020
City of Colorado Springs 2020 Annual Comprehensive Financial Report 123

The combined fair value of all derivative instruments, net of collateral postings, as of December 31, 2020 was approximately ($91.7) million.
Collateral postings represent the initial amount that Utilities would be required to pay in the event counterparties failed due to a credit default event. Collateral posted is presented as restricted cash and impacts Utilities’ cash reserves and liquidity. In the event of a failure of all counterparties due to a credit default, Utilities anticipates the full value of the collateral posting would be liquidated on behalf of secured creditors, thereby reducing actual cash balances and liquidity by the value of the collateral posting. A credit default by all counterparties could lead to additional cash requirements called by secured creditors up to the net liability of the combined derivative instrument positions.
The impact of a future credit default on Utilities is dependent on market conditions that exist at the time of the event. As a result, the impact on Utilities’ cash and liquidity position could be negative or positive. In consideration of this uncertainty and to minimize the impact of such an event on liquidity, as of December 31, 2020, Utilities has total lines of credit available in the amount of $75.0 million. Utilities also closely monitors the creditworthiness of all existing counterparties and awards future business based on creditworthiness and collateral positions existing at the time of the transaction.
Interest Rate Risk - The risk that changes in market interest rates will adversely affect Utilities’ anticipated cash flows. Utilities is exposed to interest rate risk on variable rate debt. Utilities utilizes fixed price swaps to offset cash flow exposures to a portion of the variable rate debt. Utilities receives fixed rate swap payments against VRDOs based on SIFMA and LIBOR swap indices.
Basis Risk - The risk that arises when variable rates or prices of a derivative instrument and a hedged item are based on different reference rates. Utilities is exposed to basis risk on pay-fixed interest rate swap hedging derivative instruments because the variable rate payments received by Utilities on these hedging derivative instruments are based on a rate or index other than interest rates. Utilities pays on hedged variable rate debt, which is generally remarketed every 7 days. As of December 31, 2020, the weighted average interest rate on Utilities’ variable rate debt was 0.087%, the SIFMA swap index rate was 0.09%, while 68.0% of the LIBOR was 0.0978%. Termination Risk - The risk that a derivative instrument’s unscheduled end will affect Utilities’ asset and liability strategy or will present Utilities with potentially unscheduled termination payments to the counterparty. Utilities or its counterparties may terminate a derivative instrument if the other party fails to perform under the terms of the contract or if both parties agree to terminate, or “close.” If at the time of termination a hedging derivative instrument is in a liability position, Utilities would be liable to the counterparty for a payment equal to the liability, subject to netting arrangements.
Rollover Risk - The risk that a derivative instrument associated with a hedged item does not extend to the maturity of that hedged item. Utilities is exposed to rollover risk on hedging instruments of debt that mature or may be terminated prior to the maturity of the hedged debt. When these hedging derivative instruments terminate, or if a counterparty exercises a termination option, Utilities will be re-exposed to the risks being hedged by the hedging derivative instrument. Utilities has no exposure to rollover risk with current interest rate derivative instruments.
Market Access Risk - The risk that Utilities will not be able to enter credit markets or that credit will become more costly. A strong credit rating tends to broaden an entity’s credit market access and bondholder base while achieving lower cost funding. As of December 2020, Utilities’ long-term credit rating are “Aa2/AA+” by Moody’s and S&P, respectively.
Foreign Currency Risk - The risk that changes in exchange rates will adversely affect the cash flows of a transaction. Utilities has no exposure to foreign currency risk.
NOTES TO FINANCIAL STATEMENTS December 31, 2020
124 City of Colorado Springs 2020 Annual Comprehensive Financial Report

2. Colorado Springs Urban Renewal Authority Derivative Instruments
Swap Agreement - On August 24, 2016, CSURA entered into an interest rate swap transaction (hedging derivative instrument) (Swap) with U.S. Bank National Association (Bank) in order to hedge interest rates and protect against rising interest rates. The Swap is associated with the Series 2016A Senior Loan, and used the debt service maturity schedule of the Series 2016A Senior Loan as the notional amount of the Swap. An International Swaps and Derivatives Association (ISDA) Master Agreement was used to develop the Swap which is set to terminate on December 1, 2030.
From the effective date of the agreement through termination date, CSURA is the fixed rate payer under the Swap, paying a rate of 1.1045%, on the 1st day of each month, based on a 30/360 day count. The Bank is the floating rate payer, paying the current 70% of a 1-month LIBOR rate based on an actual/360 day count.
As part of the refunding of the Series 2016A Senior Loan, dated November 24, 2020, the Swap was terminated.
N. Tax Abatements
As a home rule city, the City Council has the authority to and has entered into Economic Development Agreements with local businesses which provide incentive payments based upon sales/use taxes paid by the businesses to the City. The taxes paid to the City are included in the revenue reported in these financial statements. The payments made to the businesses based upon the taxes paid are also included as expenditures in these financial statements. While the revenues and expenditures associated with these agreements are recognized by the City in accordance with City Code and included in these financial statements, per GASB 77, the substance of the agreements meet the definition of “tax abatements” as the revenues received were not available for general municipal services purposes, but rather used to effectively reduce the net tax liability of certain taxpayers per the conditions of an agreement.
The purpose of these agreements is to proactively enhance the local business climate by retaining existing businesses and jobs and to bring new companies and industries to the City. Specific agreements are formalized through various City Council Resolutions and generally require a certain level of capital expenditure and/or job creation. The agreements are not assignable and payments are subject to annual appropriation by City Council.
Remainder of page intentionally blank
NOTES TO FINANCIAL STATEMENTS December 31, 2020
City of Colorado Springs 2020 Annual Comprehensive Financial Report 125
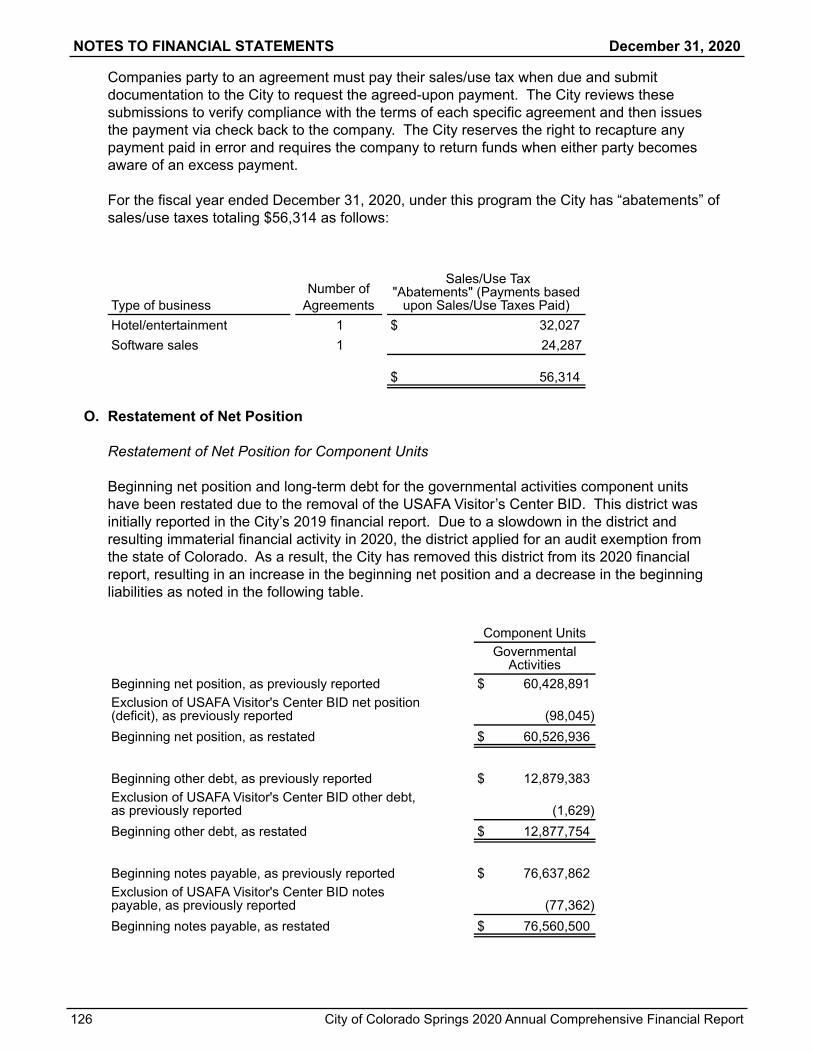
Companies party to an agreement must pay their sales/use tax when due and submit documentation to the City to request the agreed-upon payment. The City reviews these submissions to verify compliance with the terms of each specific agreement and then issues the payment via check back to the company. The City reserves the right to recapture any payment paid in error and requires the company to return funds when either party becomes aware of an excess payment.
For the fiscal year ended December 31, 2020, under this program the City has “abatements” of sales/use taxes totaling $56,314 as follows:
Type of businessNumber of
Agreements
Sales/Use Tax "Abatements" (Payments based
upon Sales/Use Taxes Paid) Hotel/entertainment 1 $ 32,027 Software sales 1 24,287
$ 56,314
O. Restatement of Net Position
Restatement of Net Position for Component Units
Beginning net position and long-term debt for the governmental activities component units have been restated due to the removal of the USAFA Visitor’s Center BID. This district was initially reported in the City’s 2019 financial report. Due to a slowdown in the district and resulting immaterial financial activity in 2020, the district applied for an audit exemption from the state of Colorado. As a result, the City has removed this district from its 2020 financial report, resulting in an increase in the beginning net position and a decrease in the beginning liabilities as noted in the following table.
Component UnitsGovernmental
ActivitiesBeginning net position, as previously reported $ 60,428,891 Exclusion of USAFA Visitor's Center BID net position (deficit), as previously reported (98,045) Beginning net position, as restated $ 60,526,936
Beginning other debt, as previously reported $ 12,879,383 Exclusion of USAFA Visitor's Center BID other debt, as previously reported (1,629) Beginning other debt, as restated $ 12,877,754
Beginning notes payable, as previously reported $ 76,637,862 Exclusion of USAFA Visitor's Center BID notes payable, as previously reported (77,362) Beginning notes payable, as restated $ 76,560,500
NOTES TO FINANCIAL STATEMENTS December 31, 2020
126 City of Colorado Springs 2020 Annual Comprehensive Financial Report

IV. OTHER INFORMATION
A. Risk Management
The City’s Risk Management division manages the insurance and self-insurance programs that have been established to respond to claims presented against the City, Utilities and MHS. For workers’ compensation coverage the City has purchased commercial insurance to cover losses in excess of $750,000 per occurrence. The City pays losses less than this amount through the Workers’ Compensation Self-Insurance fund and records a liability for unpaid workers’ compensation claims and an estimate of claims incurred but not reported (IBNR). MHS is self-insured for workers’ compensation claims up to $750,000 per claim and maintains reinsurance covering claims in excess of $750,000. A liability is recorded for unpaid workers’ compensation claims. MHS exposure to workers’ compensation claims is limited to operations prior to the lease of the system on October 1, 2012. Since October 1, 2012, MHS has had no employees. All MHS workers' compensation claims have been resolved.
General liability coverage for the operations of Utilities is purchased from commercial carriers for losses in excess of $1,000,000. General liability coverage for the Airport is purchased from commercial carriers with varying deductibles. The City and its enterprises are self-insured for general liability coverage up to $1,000,000. The Colorado Governmental Immunity Act currently provides that the maximum amount that may be recovered against entities such as the City is $387,000 for any injury to one person in any single occurrence and $1,093,000 for any injury to two or more persons in any single occurrence. A liability is recorded for claims for which the City is legally obligated to pay.
The City maintains a self-insurance certificate from the State of Colorado for auto liability. The certificate renews every three years. For 2020, the City is reporting auto liability case reserves of $628,000 and IBNR reserves of $223,000 as reflected in the 2020 actuary report.
The City has purchased property coverage to insure against loss to City property. Deductibles are paid by the General Fund or enterprise funds.
For medical claims coverage, the City has a reinsurance policy that provides coverage for claims in excess of $525,000 specific deductible per person, along with $200,000 aggregating specific deductible. The City pays for medical claims through its Employee Benefits Self-Insurance fund. The City has recorded a liability for medical claims and an estimate of IBNR. Utilities is self-insured up to $400,000 per individual for medical and self-insured for a limited dental benefit, and is fully insured for the vision plan. Utilities pays claims and associated plan expenses through its Employee Benefits Self-Insurance fund. Utilities maintains a reinsurance policy should a covered medical claim exceed $400,000 and has a fully funded reserve account for claims IBNR, Health Reimbursement Account (HRA) and catastrophic claims.
During 2020, the combined annual aggregate coverage in Communicable Disease Response and Interruption for Utilities was reduced from $1,000,000 to $10,000. There were no other significant reductions in insurance coverage as compared to 2019. Additionally, there were no settlements in excess of insurance coverage in the past three fiscal years.
NOTES TO FINANCIAL STATEMENTS December 31, 2020
City of Colorado Springs 2020 Annual Comprehensive Financial Report 127

The following is a summary of changes in outstanding reserves for 2020. The City’s liability is included in claims payable in the respective internal service funds. The liabilities for Utilities and MHS are included in accrued liabilities and other long-term liabilities (in 000's).
2020 2019
Claims liabilities, beginning of the year $ 28,974 $ 28,073
Increases 68,756 64,289
Decreases (65,954) (63,388)
Claims liabilities, end of year $ 31,776 $ 28,974
As a result of the continued spread of a novel coronavirus and the incidence of COVID-19 and variants, economic uncertainties continue which may negatively affect the financial position, results of operations and cash flows of the City. The duration of these uncertainties and the ultimate financial effects cannot be reasonably estimated at this time.
B. Donor-restricted Endowments
As of the end of 2020, the City maintained three donor-restricted endowment funds as follows:
AvailableFund Balance for Spending
C.D. Smith Trust $ 1,396,300 $ 213,254 Cemetery Endowment 12,933,201 80,837 TOPS Maintenance Trust 818,801 173,873
State law does not restrict the ability to spend net appreciation on these funds. Terms of the donation, however, restrict spending to investment earnings only. The policy for authorizing and spending investment income states that all investment earnings are available for expenditure. The amount available for spending is reported as expendable under net position restricted for endowments on the statement of net position and as restricted fund balance on the balance sheet.
Remainder of page intentionally blank
NOTES TO FINANCIAL STATEMENTS December 31, 2020
128 City of Colorado Springs 2020 Annual Comprehensive Financial Report

C. Postemployment Benefits Other than Pensions
The City's former or current non-uniformed and uniformed (firefighters and police officers) employees are eligible to participate in various defined benefit postemployment benefit other than pension (OPEB) plans. More detailed notes regarding each plan follows. Below is a table that summarizes the net OPEB liabilities, deferred outflows and inflows of resources, and OPEB expenses associated with each of the plans (in 000's).
Net OPEBLiability
Deferred Outflows of Resources
Deferred Inflowsof Resources
OPEBExpense
GOVERNMENTAL ACTIVITIES
PERA Health Care Trust Fund $ 9,288 $ 1,334 $ 1,716 $ 680
City OPEB Plan 30,491 5,282 1,702 2,804
Utilities OPEB Plan — — — —
Total governmental activities 39,779 6,616 3,418 3,484
BUSINESS-TYPE ACTIVITIES
PERA Health Care Trust Fund 21,847 2,774 5,538 1,138
City OPEB Plan 1,203 210 42 116
Utilities OPEB Plan 21,179 1,185 — 3,160
Total business-type activities 44,229 4,169 5,580 4,414
TOTAL
PERA Health Care Trust Fund 31,135 4,108 7,254 1,818
City OPEB Plan 31,694 5,492 1,744 2,920
Utilities OPEB Plan 21,179 1,185 — 3,160
Total $ 84,008 $ 10,785 $ 8,998 $ 7,898
Note: Immaterial differences may occur due to rounding.
1. Colorado PERA Health Care Trust Fund
The City participates in the Health Care Trust Fund (HCTF), a cost-sharing multiple-employer defined benefit OPEB fund administered by the Public Employees’ Retirement Association of Colorado (PERA). The net OPEB liability, deferred outflows of resources and deferred inflows of resources related to OPEB, OPEB expense, information about the fiduciary net position and additions to/deductions from the fiduciary net position of the HCTF have been determined on the same basis as they are reported by HCTF using the economic resources measurement focus and the accrual basis of accounting. For this purpose, benefits paid on behalf of health care participants are recognized when due and/or payable in accordance with the benefit terms. Investments are reported at fair value.
Plan description: Eligible employees of the City are provided with OPEB through the HCTF, a cost-sharing multiple-employer defined benefit OPEB plan administered by PERA. The HCTF is established under Title 24, Article 51, Part 12 of the Colorado Revised Statutes (CRS), as amended. Colorado State law provisions may be amended from time to time by the Colorado General
NOTES TO FINANCIAL STATEMENTS December 31, 2020
City of Colorado Springs 2020 Annual Comprehensive Financial Report 129

Assembly. Title 24, Article 51, Part 12 of the CRS, as amended, sets forth a framework that grants authority to the PERA Board to contract, self-insure, and authorize disbursements necessary in order to carry out the purposes of the PERACare program, including the administration of the premium subsidies. Colorado State law provisions may be amended from time to time by the Colorado General Assembly. PERA issues a publicly available annual comprehensive financial report that can be obtained at:
www.copera.org/investments/pera-financial-reports
or by writing toColorado PERA, 1301 Pennsylvania StreetDenver, Colorado 80203
or by calling PERA at 303-832-9550 or 1-800-759-PERA (7372)
All City civilian employees are members of the HCTF. The HCTF provides a health care premium subsidy to eligible participating PERA benefit recipients and retirees who choose to enroll in one of the PERA health care plans, however, the subsidy is not available if only enrolled in the dental and/or vision plan(s). The health care premium subsidy is based upon the benefit structure under which the member retires and the member’s years of service credit. For members who retire having service credit with employers in the Denver Public Schools (DPS) Division and one or more of the other four Divisions (State, School, Local Government and Judicial), the premium subsidy is allocated between the HCTF and the Denver Public Schools Health Care Trust Fund (DPS HCTF). The basis for the amount of the premium subsidy funded by each trust fund is the percentage of the member contribution account balance from each division as it relates to the total member contribution account balance from which the retirement benefit is paid.
CRS § 24-51-1202 et seq. specifies the eligibility for enrollment in the health care plans offered by PERA and the amount of the premium subsidy. The law governing a benefit recipient’s eligibility for the subsidy and the amount of the subsidy differs slightly depending under which benefit structure the benefits are calculated. All benefit recipients under the PERA benefit structure and all retirees under the DPS benefit structure are eligible for a premium subsidy, if enrolled in a health care plan under PERACare. Upon the death of a DPS benefit structure retiree, no further subsidy is paid.
Enrollment in PERACare is voluntary and is available to benefit recipients and their eligible dependents, certain surviving spouses, and divorced spouses and guardians, among others. Eligible benefit recipients may enroll in the program upon retirement, upon the occurrence of certain life events, or on an annual basis during an open enrollment period.
The maximum service-based premium subsidy is $230 per month for benefit recipients who are under 65 years of age and who are not entitled to Medicare; the maximum service-based subsidy is $115 per month for benefit recipients who are 65 years of age or older or who are under 65 years of age and entitled to Medicare. The basis for the maximum service-based subsidy, in each case, is for benefit recipients with retirement benefits based on 20 or more years of service credit. There is a 5% reduction in the subsidy for each year less than 20. The benefit recipient pays the remaining portion of the premium to the extent the subsidy does not cover the entire amount.
For benefit recipients who have not participated in Social Security and who are not otherwise eligible for premium-free Medicare Part A for hospital-related services, CRS § 24-51-1206(4) provides an additional subsidy. According to the statute, PERA cannot charge premiums to benefit recipients without Medicare Part A that are greater than premiums charged to benefit recipients with Part A for the same plan option, coverage level, and service credit. Currently, for each individual
NOTES TO FINANCIAL STATEMENTS December 31, 2020
130 City of Colorado Springs 2020 Annual Comprehensive Financial Report
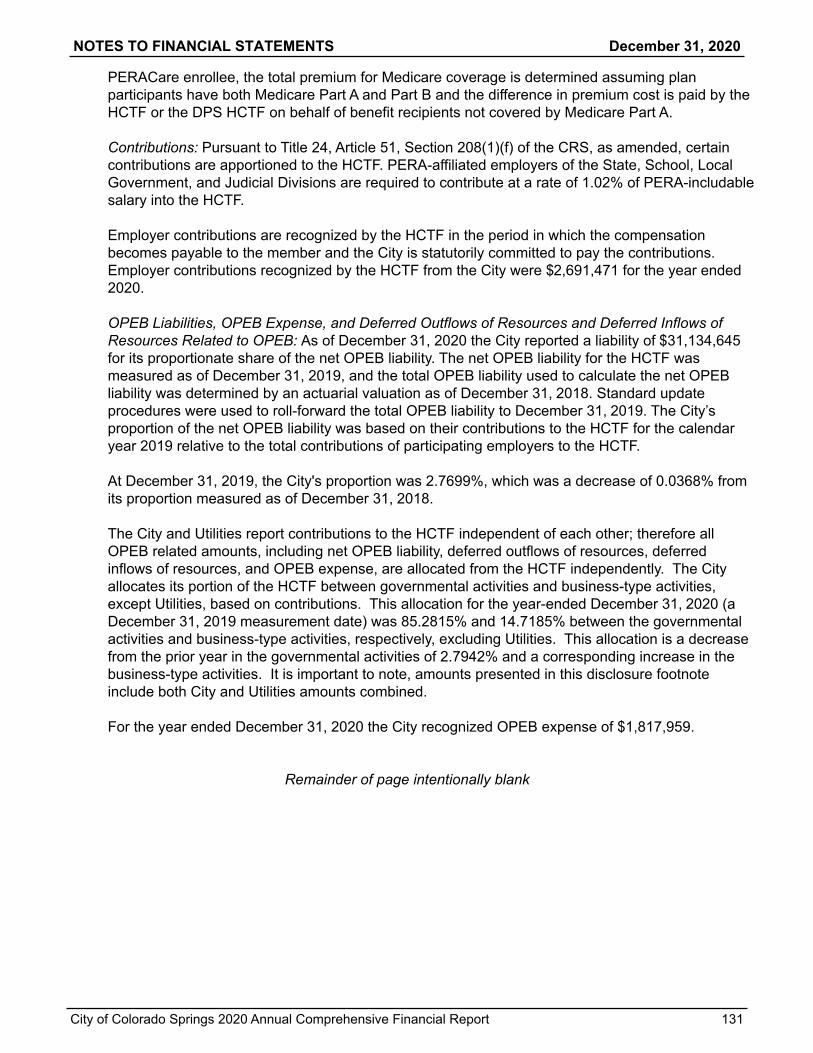
PERACare enrollee, the total premium for Medicare coverage is determined assuming plan participants have both Medicare Part A and Part B and the difference in premium cost is paid by the HCTF or the DPS HCTF on behalf of benefit recipients not covered by Medicare Part A.
Contributions: Pursuant to Title 24, Article 51, Section 208(1)(f) of the CRS, as amended, certain contributions are apportioned to the HCTF. PERA-affiliated employers of the State, School, Local Government, and Judicial Divisions are required to contribute at a rate of 1.02% of PERA-includable salary into the HCTF.
Employer contributions are recognized by the HCTF in the period in which the compensation becomes payable to the member and the City is statutorily committed to pay the contributions. Employer contributions recognized by the HCTF from the City were $2,691,471 for the year ended 2020.
OPEB Liabilities, OPEB Expense, and Deferred Outflows of Resources and Deferred Inflows of Resources Related to OPEB: As of December 31, 2020 the City reported a liability of $31,134,645 for its proportionate share of the net OPEB liability. The net OPEB liability for the HCTF was measured as of December 31, 2019, and the total OPEB liability used to calculate the net OPEB liability was determined by an actuarial valuation as of December 31, 2018. Standard update procedures were used to roll-forward the total OPEB liability to December 31, 2019. The City’s proportion of the net OPEB liability was based on their contributions to the HCTF for the calendar year 2019 relative to the total contributions of participating employers to the HCTF.
At December 31, 2019, the City's proportion was 2.7699%, which was a decrease of 0.0368% from its proportion measured as of December 31, 2018.
The City and Utilities report contributions to the HCTF independent of each other; therefore all OPEB related amounts, including net OPEB liability, deferred outflows of resources, deferred inflows of resources, and OPEB expense, are allocated from the HCTF independently. The City allocates its portion of the HCTF between governmental activities and business-type activities, except Utilities, based on contributions. This allocation for the year-ended December 31, 2020 (a December 31, 2019 measurement date) was 85.2815% and 14.7185% between the governmental activities and business-type activities, respectively, excluding Utilities. This allocation is a decrease from the prior year in the governmental activities of 2.7942% and a corresponding increase in the business-type activities. It is important to note, amounts presented in this disclosure footnote include both City and Utilities amounts combined.
For the year ended December 31, 2020 the City recognized OPEB expense of $1,817,959.
Remainder of page intentionally blank
NOTES TO FINANCIAL STATEMENTS December 31, 2020
City of Colorado Springs 2020 Annual Comprehensive Financial Report 131

At December 31, 2020, the City reported deferred outflows of resources and deferred inflows of resources related to OPEB from the following sources:
Deferred Outflowsof Resources
Deferred Inflowsof Resources
Differences between expected and actual experience $ 103,141 $ 5,232,029 Net difference between projected and actual earnings on OPEB plan investments — 519,779 Change in assumptions 258,350 — Changes in proportion 1,054,498 1,501,465 Contributions subsequent to the measurement date 2,691,471 — Total $ 4,107,460 $ 7,253,273
The $2,691,471 reported as deferred outflows of resources related to OPEB, resulting from contributions subsequent to the measurement date, will be recognized as a reduction of the net OPEB liability in the year ended December 31, 2021. Other amounts reported as deferred outflows of resources and deferred inflows of resources related to OPEB will be recognized in OPEB expense as follows:
Year EndedDecember 31,
Differences Between Expected
and Actual Experience
Net Difference Between Projected and Actual Earnings
on InvestmentsChange in
AssumptionsNet Changes in
Proportion
Net Effect of Amortized Deferred Amounts on OPEB
Expense
2021 $ (1,002,768) $ (163,166) $ 61,558 $ (131,887) $ (1,236,263)
2022 (1,002,768) (163,166) 61,558 (131,887) (1,236,263)
2023 (1,002,768) (12,496) 61,558 (131,887) (1,085,593)
2024 (1,034,447) (180,951) 61,558 14,793 (1,139,047)
2025 (1,025,646) — 11,924 (65,792) (1,079,514)
Thereafter (60,491) — 194 (307) (60,604)
$ (5,128,888) $ (519,779) $ 258,350 $ (446,967) $ (5,837,284)
The differences between expected and actual experience, and the City's change in proportion in the plan are amortized over a closed period equal to the average expected remaining service lives of active and inactive members in the plan. The HCTF determined the average expected remaining service lives for active and inactive members at the beginning of the 2019 measurement period to be 6.06 years. The difference between expected and actual investment experience is amortized over a closed five year period.
Remainder of page intentionally blank
NOTES TO FINANCIAL STATEMENTS December 31, 2020
132 City of Colorado Springs 2020 Annual Comprehensive Financial Report

Actuarial assumptions: The total OPEB liability in the December 31, 2018 actuarial valuation was determined using the following actuarial cost method, actuarial assumptions and other inputs:
Rate %Actuarial cost method Entry AgePrice inflation 2.40 Real wage growth 1.10 Wage inflation 3.50 Salary increases, including wage inflation 3.50 in aggregateLong-term investment rate of return, net of OPEB plan investment expenses, including price inflation 7.25 Discount rate 7.25 Health care cost trend rates PERA benefit structure:
Service-based premium subsidy —PERACare Medicare plans 5.60 in 2019, gradually
decreasing to 4.50 in 2029Medicare Part A premiums 3.50 in 2019, gradually
increasing to 4.50 in 2029
Calculations are based on the benefits provided under the terms of the substantive plan in effect at the time of each actuarial valuation and on the pattern of sharing of costs between employers of each fund to that point.
The actuarial assumptions used in the December 31, 2018, valuation were based on the results of the 2016 experience analysis for the periods January 1, 2012, through December 31, 2015, as well as, the October 28, 2016, actuarial assumptions workshop and were adopted by the PERA Board during the November 18, 2016, Board meeting. In addition, certain actuarial assumptions pertaining to per capita health care costs and their related trends are analyzed and reviewed by PERA’s actuary, as discussed below.
In determining the additional liability for PERACare enrollees who are age 65 or older and who are not eligible for premium-free Medicare Part A, the following monthly costs/premiums are assumed for 2019 for the PERA Benefit Structure:
Medicare PlanCost for Members
Without Medicare Part APremiums for MembersWithout Medicare Part A
Medicare Advantage/Self-Insured Prescription $ 601 $ 240 Kaiser Permanente Medicare Advantage HMO 605 237
The 2019 Medicare Part A premium is $437 per month.
Remainder of page intentionally blank
NOTES TO FINANCIAL STATEMENTS December 31, 2020
City of Colorado Springs 2020 Annual Comprehensive Financial Report 133

In determining the additional liability for PERACare enrollees in the PERA Benefit Structure who are age 65 or older and who are not eligible for premium-free Medicare Part A, the following chart details the initial expected value of Medicare Part A benefits, age adjusted to 65 for the year following the valuation date:
Medicare PlanCost for Members
Without Medicare Part AMedicare Advantage/Self-Insured Prescription $ 562 Kaiser Permanente Medicare Advantage HMO 571
All costs are subject to the health care cost trend rates as discussed below.
Health care cost trend rates reflect the change in per capita health costs over time due to factors such as medical inflation, utilization, plan design, and technology improvements. For the PERA benefit structure, health care cost trend rates are needed to project the future costs associated with providing benefits to those PERACare enrollees not eligible for premium-free Medicare Part A.
Health care cost trend rates for the PERA benefit structure are based on published annual health care inflation surveys in conjunction with actual plan experience (if credible), building block models and industry methods developed by health plan actuaries and administrators. In addition, projected trends for the Federal Hospital Insurance Trust Fund (Medicare Part A premiums) provided by the Centers for Medicare & Medicaid Services are referenced in the development of these rates. Effective December 31, 2018, the health care cost trend rates for Medicare Part A premiums were revised to reflect the current expectation of future increases in rates of inflation applicable to Medicare Part A premiums.
The PERA benefit structure health care cost trend rates that were used to measure the total OPEB liability are summarized in the table below:
Year
PERACareMedicare Plans
(%)
Medicare Part APremiums
(%)2019 5.60 3.502020 8.60 3.502021 7.30 3.502022 6.00 3.752023 5.70 3.752024 5.50 3.752025 5.30 4.002026 5.10 4.002027 4.90 4.252028 4.70 4.25Thereafter 4.50 4.50
Mortality assumptions for the determination of the total OPEB liability for each of the Division Trust Funds as shown below are applied, as applicable, in the determination of the total OPEB liability for the HCTF. Affiliated employers of the State, School, Local Government, and Judicial Divisions participate in the HCTF.
Healthy mortality assumptions for active members were based on the RP-2014 White Collar Employee Mortality Table, a table specifically developed for actively working people. To allow for an
NOTES TO FINANCIAL STATEMENTS December 31, 2020
134 City of Colorado Springs 2020 Annual Comprehensive Financial Report

appropriate margin of improved mortality prospectively, the mortality rates incorporate a 70% factor applied to male rates and a 55% factor applied to female rates.
Healthy, post-retirement mortality assumptions for the State and Local Government Divisions were based on the RP-2014 Healthy Annuitant Mortality Table, adjusted as follows:
• Males: Mortality improvement projected to 2018 using the MP-2015 projection scale, a 73% factor applied to rates for ages less than 80, a 108% factor applied to rates for ages 80 and above, and further adjustments for credibility.
• Females: Mortality improvement projected to 2020 using the MP-2015 projection scale, a 78% factor applied to rates for ages less than 80, a 109% factor applied to rates for ages 80 and above, and further adjustments for credibility.
Healthy, post-retirement mortality assumptions for the School and Judicial Divisions were based on the RP-2014 White Collar Healthy Annuitant Mortality Table, adjusted as follows:
• Males: Mortality improvement projected to 2018 using the MP-2015 projection scale, a 93% factor applied to rates for ages less than 80, a 113% factor applied to rates for ages 80 and above, and further adjustments for credibility.
• Females: Mortality improvement projected to 2020 using the MP-2015 projection scale, a 68% factor applied to rates for ages less than 80, a 106% factor applied to rates for ages 80 and above, and further adjustments for credibility.
For disabled retirees, the mortality assumption was based on 90% of the RP-2014 Disabled Retiree Mortality Table.
The following economic and demographic assumptions were specifically developed for, and used in, the measurement of the obligations for the HCTF:
• Initial per capita health care costs for those PERACare enrollees under the PERA benefit structure who are expected to attain age 65 and older ages and are not eligible for premium-free Medicare Part A benefits were updated to reflect the change in costs for the 2019 plan year.
• The morbidity assumptions were updated to reflect the assumed standard aging factors.
• The health care cost trend rates for Medicare Part A premiums were revised to reflect the then-current expectation of future increases in rates of inflation applicable to Medicare Part A premiums.
The long-term expected return on plan assets is reviewed as part of regular experience studies prepared every four or five years for PERA. Recently, this assumption has been reviewed more frequently. The most recent analyses were outlined in presentations to PERA’s Board on October 28, 2016.
Several factors were considered in evaluating the long-term rate of return assumption for the HCTF, including long-term historical data, estimates inherent in current market data, and a log-normal distribution analysis in which best-estimate ranges of expected future real rates of return (expected return, net of investment expense and inflation) were developed for each major asset class. These ranges were combined to produce the long-term expected rate of return by weighting the expected
NOTES TO FINANCIAL STATEMENTS December 31, 2020
City of Colorado Springs 2020 Annual Comprehensive Financial Report 135

future real rates of return by the target asset allocation percentage and then adding expected inflation.
As of the most recent adoption of the long-term expected rate of return by the PERA Board, the target asset allocation and best estimates of geometric real rates of return for each major asset class are summarized in the following table:
Asset ClassTarget Allocation
(%)
30 Year Expected Geometric Real Rate of Return
(%)US equity - large cap 21.20 4.30US equity - small cap 7.42 4.80Non US equity - developed 18.55 5.20Non US equity - emerging 5.83 5.40Core fixed income 19.32 1.20High yield 1.38 4.30Non US fixed income - developed 1.84 0.60Emerging market debt 0.46 3.90Core real estate 8.50 4.90Opportunity fund 6.00 3.80Private equity 8.50 6.60Cash 1.00 0.20Total 100.00
In setting the long-term expected rate of return, projections employed to model future returns provide a range of expected long-term returns that, including expected inflation, ultimately support a long-term expected rate of return assumption of 7.25%.
Sensitivity of the City’s proportionate share of the net OPEB liability to changes in the Health Care Cost Trend Rates: The following presents the net OPEB liability using the current health care cost trend rates applicable to the PERA benefit structure, as well as if it were calculated using health care cost trend rates that are one percentage point lower or higher than the current rates:
Sensitivity of the NOL:
1% DecreaseCurrent Trend
Rates 1% IncreaseInitial PERACare Medicare trend rate 4.60% 5.60% 6.60%Ultimate PERACare Medicare trend rate 3.50 4.50 5.50Initial Medicare Part A trend rate 2.50 3.50 4.50Ultimate Medicare Part A trend rate 3.50 4.50 5.50
Proportionate share of the net OPEB liability $ 30,394,539 $ 31,134,645 $ 31,988,752
NOTES TO FINANCIAL STATEMENTS December 31, 2020
136 City of Colorado Springs 2020 Annual Comprehensive Financial Report

Discount rate: The discount rate used to measure the total OPEB liability was 7.25%. The projection of cash flows used to determine the discount rate applied the actuarial cost method and assumptions shown above. In addition, the following methods and assumptions were used in the projection of cash flows:
• Updated health care cost trend rates for Medicare Part A premiums as of the December 31, 2019, measurement date.
• Total covered payroll for the initial projection year consists of the covered payroll of the active membership present on the valuation date and the covered payroll of future plan members assumed to be hired during the year. In subsequent projection years, total covered payroll was assumed to increase annually at a rate of 3.50%.
• Employer contributions were assumed to be made at rates equal to the fixed statutory rates specified in law and effective as of the measurement date.
• Employer contributions and the amount of total service costs for future plan members were based upon a process used by the plan to estimate future actuarially determined contributions assuming an analogous future plan member growth rate.
• Benefit payments and contributions were assumed to be made at the middle of the year.
Based on the above assumptions and methods, the projection test indicates the HCTF’s fiduciary net position was projected to make all projected future benefit payments of current members. Therefore, the long-term expected rate of return of 7.25% on OPEB plan investments was applied to all periods of projected benefit payments to determine the total OPEB liability. The discount rate determination does not use the municipal bond index rate, and therefore, the discount rate is 7.25%.
Sensitivity of the City’s proportionate share of the net OPEB liability to changes in the discount rate: The following presents the proportionate share of the net OPEB liability calculated using the discount rate of 7.25%, as well as what the proportionate share of the net OPEB liability would be if it were calculated using a discount rate that is one percentage point lower or higher than the current rate:
Sensitivity of the NOL:
1% DecreaseCurrent
Discount Rate 1% Increase6.25% 7.25% 8.25%
Proportionate share of the net OPEB liability $ 35,203,383 $ 31,134,645 $ 27,654,040
OPEB plan fiduciary net position: Detailed information about the HCTF’s fiduciary net position is available in PERA’s annual comprehensive financial report which can be obtained at:
https://www.copera.org/resources/forms-publications/2019-cafr
NOTES TO FINANCIAL STATEMENTS December 31, 2020
City of Colorado Springs 2020 Annual Comprehensive Financial Report 137

2. The City of Colorado Springs OPEB Plan
The City's postemployment benefits other than pension plan, is a single-employer defined benefit OPEB plan administered by the City of Colorado Springs. The total OPEB liability, deferred outflows of resources and deferred inflows of resources related to OPEB and OPEB expense of the plan have been determined on the same basis as they are reported by the plan using the economic resources measurement focus and the accrual basis of accounting. For this purpose, benefits paid on behalf of health care participants are recognized when due and/or payable in accordance with the benefit terms. No assets are accumulated in a trust that meets the criteria in paragraph 4 of GASB 75 as the plan is pay-as-you-go.
Plan description: Uniformed employees who retire from active service with the City and who begin receiving pension benefit payments are eligible to participate in the City’s medical benefits plan as a retiree until the retiree reaches Medicare-eligible age, currently 65. Beginning January 1, 2011, retirees who reach age 65 and are Medicare-eligible are no longer eligible to participate in City’s medical benefit plans, but have access to the One Health (formerly Extend Health) private medical plan exchange. “Grandfathered” retirees who have reached age 65 and are not Medicare-eligible are allowed to stay on the City's medical plans.
Civilian employees who retire from active service with the City and who begin receiving pension benefit payments are not eligible to participate in the City’s medical benefits plan as they have access to PERACare. There remain a few civilian retirees who have reached the Medicare-eligible age that have access to One Health medical plans as they are not eligible to participate in the PERACare plans. Both uniformed and civilian retirees have access to the City’s dental and vision benefits plans before and after they reach Medicare-eligible age.
Upon retirement from employment with the City, the following life insurance benefits are available to the retiree:
• $9,000 for Mayor and Mayoral Appointees• $6,000 for City Department Heads and other City Executives• $3,000 for all other City retirees
The benefit recipients and members of the City's OPEB plan as of December 31, 2018 are as follows:
Number of retirees receiving benefits 1,620 Number of beneficiaries receiving benefits 167 Number of active employees 2,347
There are no inactive employees eligible for benefits.
Remainder of page intentionally blank
NOTES TO FINANCIAL STATEMENTS December 31, 2020
138 City of Colorado Springs 2020 Annual Comprehensive Financial Report

Benefit payments: Medical Plan - City benefit payments for a retiree’s medical plan premium vary as follows:
Retirees that were: City pays:
Eligible to retire prior to January 1, 1979The retiree's medical plan premium paid in full
Hired prior to August 1, 1988 and eligible to retire on or after January 1, 1979
$91.40 per month toward the retiree medical plan premium costs, the retiree pays the balance of the premium costs
Hired on or after August 1, 1988
Nothing toward the retiree's medical plan premium costs, retiree pays the full medical plan premium
There is no direct cost to the City for those uniformed retirees that participate in the medical benefits plan as the retirees are responsible for their full medical plan premium cost.
Dental and Vision Plan - All retirees are required to pay the full dental and vision plan premiums should they choose to participate the City’s plans. In addition, the vision plan is not self-funded, but rather fully insured.
Retiree Life Plan - The City pays the following annually for retiree life insurance premiums:
• $13.56 for Mayor and Mayoral Appointees• $9.00 for City Department Heads and other City Executives• $4.56 for all other City retirees
If the retirement is a disability retirement, the retiree applies for a waiver of premium through the City’s carrier. If approved, the retiree receives a life insurance benefit in the amount of one and a half times his or her salary until the retiree attains the age of 65, at which point the life insurance is reduced to the amounts listed above. The City does not pay for the carrier approved waivers.
Employer benefit payments recognized from the City were $1,458,121 for the year ended December 31, 2020.
OPEB Liabilities, OPEB Expense, and Deferred Outflows of Resources and Deferred Inflows of Resources Related to OPEB: As of December 31, 2020, the City reported a liability of $31,694,639 for total OPEB liability. The total OPEB liability was measured as of December 31, 2019, and was determined by an actuarial valuation as of that date.
The City allocates its OPEB plan between governmental activities and business-type activities, except Utilities, based on benefit payments. This allocation for the year-ended December 31, 2020, (a December 31, 2019 measurement date) was 96.2030% and 3.7970% between governmental activities and business-type activities, respectively. This allocation is a decrease from the prior year in the governmental activities of 0.0888% and a corresponding increase in the business-type activities.
For the year ended December 31, 2020 the City recognized OPEB expense of $2,920,332.
NOTES TO FINANCIAL STATEMENTS December 31, 2020
City of Colorado Springs 2020 Annual Comprehensive Financial Report 139

At December 31, 2020, the City reported deferred outflows of resources of resources related to OPEB from the following sources:
Deferred Outflowsof Resources
Deferred Inflowsof Resources
Differences between expected and actual experience $ 1,223,827 $ 176,043 Change in assumptions 2,809,502 1,567,661 Benefit payments subsequent to the measurement date 1,458,121 — Total $ 5,491,450 $ 1,743,704
The $1,458,121 reported as deferred outflows of resources related to OPEB, resulting from benefit payments subsequent to the measurement date, will be recognized as a reduction of the total OPEB liability in the year ended December 31, 2021. Other amounts reported as deferred outflows of resources and deferred inflows of resources related to OPEB will be recognized in OPEB expense as follows:
Year EndedDecember 31,
Differences Between Expected
and Actual Experience
Change in Assumptions
Net Effect of Amortized Deferred Amounts on OPEB
expense2021 $ 467,848 $ 526,601 $ 994,449 2022 301,611 312,734 614,345 2023 98,437 51,342 149,779 2024 98,437 51,342 149,779 2025 98,437 51,342 149,779
Thereafter (16,986) 248,480 231,494 $ 1,047,784 $ 1,241,841 $ 2,289,625
The differences between expected and actual experience and changes of assumptions are amortized over a closed period equal to the average expected remaining service lives of active and inactive members in the plan. The average expected remaining service lives for active and inactive members at the beginning of the 2019 measurement period to be 6.72 years.
Actuarial assumptions. The total OPEB liability in the December 31, 2018 actuarial valuation was determined using the following actuarial cost method, actuarial assumptions and other inputs:
Rate %Actuarial cost method Entry age, level % of payWage inflation (civilian) 3.50 Wage inflation (sworn) 2.50 plus productivity component of 1.75Salary increases, including wage inflation 3.50 - 11.25Long-term investment rate of return, net of OPEB plan investment expenses, including price inflation N/ADiscount rate 2.74
NOTES TO FINANCIAL STATEMENTS December 31, 2020
140 City of Colorado Springs 2020 Annual Comprehensive Financial Report

The medical and drug health care cost trend rate that were used to measure the total OPEB liability are summarized in the table below:
YearMedical/Drug
Cost Trend (%)2020 7.252021 7.002022 6.752023 6.502024 6.252025 6.002026 5.752027 5.502028 5.252029 5.002030 4.75
Thereafter 4.50
Calculations are based on the benefits provided under the terms of the substantive plan in effect at the time of each actuarial valuation. Health care trend rates assumptions were developed by Segal Consulting's internal guidelines, which are established each year using data sources such as the 2021 Segal Health Trend Survey, internal client results, trends from other published surveys prepared by the S&P Dow Jones Indices, consulting firms and brokers, and CPI statistics published by the Bureau of Labor and Statistics.
Mortality, turnover, disability, retirement and salary scale assumptions are based on the Local Government Division rates in the PERA pension valuation as of December 31, 2018 for civilian members as well as the Fire and Police Pension Association (FPPA) 2018 Actuarial Experience Study for the period ending December 31, 2017 for sworn members.
Civilian Mortality Assumptions: Healthy mortality assumptions for active members were based on the RP-2014 White Collar Employee Mortality Table with adjustments for credibility and gender adjustments of a 79% factor applied to the rates for ages below 80 and a 111% factor applied to the rates for ages 80 and above, projected to 2018 using the MP-2015 projection scale, for males, and a 78% factor applied to the rates for ages below 80 and a 102% factor applied to the rates for ages 80 and above, projected to 2019 using the MP-2015 projection scale, for females.
Healthy, post-retirement mortality assumptions for the State and Local Government Divisions were based on the RP-2014 Healthy Annuitant Mortality Table, adjusted as follows:
• Males: Mortality improvement projected to 2018 using the MP-2015 projection scale, a 73% factor applied to rates for ages less than 80, a 108% factor applied to rates for ages 80 and above, and further adjustments for credibility.
• Females: Mortality improvement projected to 2020 using the MP-2015 projection scale, a 78% factor applied to rates for ages less than 80, a 109% factor applied to rates for ages 80 and above, and further adjustments for credibility.
NOTES TO FINANCIAL STATEMENTS December 31, 2020
City of Colorado Springs 2020 Annual Comprehensive Financial Report 141

For disabled retirees, the mortality assumption was based on 90% of the RP-2014 Disabled Retiree Mortality Table.
Sworn Mortality Assumptions: Pre-Retirement mortality rate was based on RP-2014 Employee Mortality Tables for males and females projected to 2018 using the MP-2017 projected scales times 50% and increased by 0.00015, and then projected generationally using scale MP-2017. Post-Retirement mortality rate was based on RP-2014 Annuitant Mortality Tables for males and females projected to 2018 using the MP-2017 projection scales, and then generationally projected using scale MP-2017. Disabled mortality rates were based on RP-2014 Annuitant Mortality Tables for males and females projected to 2018 using the MP-2017 projection scales with a minimum probability of 3% for males and 2% for females, and then generationally projected using scale MP-2017.
All current retired participants are assumed to continue retiree medical coverage. Forty percent of future eligible retired participants are assumed to elect retiree medical coverage upon retirement. All participants eligible for the $91.40 are assumed to participate in the program.
Primary changes in assumptions since the previous measurement date of December 31, 2018 include:
• The discount rate decreased from 4.10% to 2.74% based on changes in the 20-year municipal bond rate.
• Reflected repeal of the excise tax on certain high-cost health plans (Cadillac Tax) effective as of December 20, 2019.
• The 2019 trend was updated based on updating projected health care costs to reflect premium renewals for calendar year 2020.
• The future trends for medical costs were increased.
The following presents the total OPEB liability using the current health care cost trend rates applicable to the benefit structure, as well as if it were calculated using health care cost trend rates that are one percentage point lower or higher than the current rates:
Sensitivity of the TOL:
1% DecreaseCurrent
Trend Rate 1% IncreaseHealth care cost trend rates 6.25 - 3.50% 7.25 - 4.50% 8.25 - 5.50%
Total OPEB liability $ 30,637,757 $ 31,694,639 $ 32,951,012
NOTES TO FINANCIAL STATEMENTS December 31, 2020
142 City of Colorado Springs 2020 Annual Comprehensive Financial Report

Discount Rate: The plan is pay-as-you-go. Since there are no dedicated assets and retiree benefits are paid annually in an amount equal to the benefits distributed, the discount rate used was 2.74% based on a yield or index rate for 20-year, tax-exempt general obligation municipal bond rate with an average rating of AA/Aa or higher.
The following presents the total OPEB liability calculated using the discount rate of 2.74%, as well as what the total OPEB liability would be if it were calculated using a discount rate that is one percentage point lower or higher than the current rate:
Sensitivity of the TOL:
1% DecreaseCurrent
Discount Rate 1% Increase1.74% 2.74% 3.74%
Total OPEB liability $ 35,836,188 $ 31,694,639 $ 28,263,609
Because the City's medical and dental plans are self-funded, the plan does not release a separate report. However, the benefits are accounted for under the Employee Benefits Self-Insurance Fund under the City's Internal Service Funds.
Changes in the Total OPEB Liability: Below is a schedule of changes in the total OPEB liability for the City's OPEB plan for year ended December 31, 2020.
Total OPEB liability (TOL) - January 1, 2020 $ 29,052,980
Service cost 735,267 Interest 1,190,620 Changes in benefit terms — Differences between expected and actual experience (206,820) Changes of assumptions or other inputs 2,435,234 Benefit payments (1,512,642)
Net changes to TOL 2,641,659
Total OPEB liability (TOL) - December 31, 2020 $ 31,694,639
Plan fiduciary net position as a percentage of total OPEB liability — %
Covered employee payroll $ 203,394,298
Total OPEB liability as a percentage of covered employee payroll 15.58 %
NOTES TO FINANCIAL STATEMENTS December 31, 2020
City of Colorado Springs 2020 Annual Comprehensive Financial Report 143

3. Colorado Springs Utilities OPEB Plan
In accordance with City Code, Utilities offers a single-employer defined benefit health care OPEB plan to retirees with Utilities' benefit payments determined by City Council. Employees eligible to retire prior to January 1, 1979, receive this health care plan without cost to the employee. Those eligible to retire after January 1, 1979 and hired prior to August 1, 1988 receive a limited Utilities' contribution not to exceed $91.40 per month. The monthly subsidy for these members is determined as the difference between the full PERA premium and the PERA service subsidy. All employees hired after August 1, 1988, receive no contribution from Utilities for this health care plan. In addition to regular medical insurance subsidies, Utilities also funds a Medicare supplement for eligible retirees. No assets are accumulated in a trust that meets the criteria of paragraph 4 of GASB 75.
Utilities' OPEB plan also provides a subsidy of life insurance premiums of $0.13/$1,000 for life insurance amounts up to $9,000/year per member, depending on employee type, to those who have retired prior to January 1, 2013. Employees retiring after January 1, 2013 are no longer eligible to receive the life insurance benefits.
As of the most recent actuarial valuation of the plan, 1,238 retired members or beneficiaries and 15 active employees were covered by the benefit terms.
Utilities total OPEB liability as of December 31, 2020 of $21,179,000 was measured as of December 31, 2019 and was determined by an actuarial valuation as of that date.
Actuarial Assumptions and Other Inputs: The total OPEB liability in the actuarial valuation was determined using the following actuarial assumptions and other inputs, applied to all periods included in the measurements, unless otherwise specified:
Measurement date December 31, 2019Actuarial cost method Entry ageInflation 3.50%Salary increases 3.50 - 10.45%Discount rate 2.74%Health care cost trend rates
PERA Premiums 0.00% to 2021, 6.50% to 2022, and 6.00% to 2023 graded to 4.50% over 6 years
Medicare Part B 6.00% to 2021 and 4.50% thereafter
Healthy mortality assumptions for active members were based on the RP-2014 White Collar Employee Mortality Table with a 70.0% factor applied to male rates and 55.0% factor applies to female rates.
Healthy, post-retirement mortality assumptions were based on the RP-2014 Healthy Annuitant Mortality Table with adjustments for the following:
• Males: Mortality improvement projected to 2018 using the MP-2015 projections scale, a 73.0% factor applied to rates for ages less than 80, a 108% factor applied to rates for ages 80 and above and further adjustments for credibility.
• Females: Mortality improvement projected to 2020 using the MP-2015 projection scale, a 78.0% factor applied to rates for ages less than 80, a 109.0% factor applied to rates for ages 80 and above and further adjustments for credibility.
NOTES TO FINANCIAL STATEMENTS December 31, 2020
144 City of Colorado Springs 2020 Annual Comprehensive Financial Report

For disabled retirees, the mortality assumption was based on RP-2014 Disabled Retiree Mortality Table with a 90.0% factor applied to all rates.
Changes in the Total OPEB Liability
Total OPEB liability (TOL) - January 1, 2020 $ 19,228,000
Service cost 11,000 Interest 764,000 Changes in benefit terms — Differences between expected and actual experience (492,000) Changes of assumptions or other inputs 2,877,000 Benefit payments (1,209,000)
Net changes to TOL 1,951,000
Total OPEB liability (TOL) - December 31, 2020 $ 21,179,000
Fiduciary net position as a percentage of total OPEB liability — %
Covered employee payroll $ 2,207,000
Total OPEB liability as a percentage of covered employee payroll 959.63 %
Changes of assumptions and other inputs: Changes in the discount rate from 4.10% to 2.74% based on changes in the 20-year municipal bond rate. Future trend rates for PERA premiumns were lowered.
Discount Rate: The plan is pay-as-you-go. Since there are no dedicated assets and retiree benefits are paid annually in an amount equal to the benefits distributed, the discount rate used was 2.74% based on a yield or index rate for 20-year, tax-exempt general obligation municipal bond rate with an average rating of AA/Aa or higher.
The following presents the total OPEB liability calculated using the discount rate of 2.74%, as well as what the total OPEB liability would be if it were calculated using a discount rate that is one percentage point lower or higher than the current rate:
Sensitivity of the TOL:
1% DecreaseCurrent
Discount Rate 1% Increase1.74% 2.74% 3.74%
Total OPEB liability $ 23,807,000 $ 21,179,000 $ 18,996,000
NOTES TO FINANCIAL STATEMENTS December 31, 2020
City of Colorado Springs 2020 Annual Comprehensive Financial Report 145

Sensitivity of the Total OPEB liability to Changes in the Health Care Cost Trend Rates: The following presents the total OPEB liability of Utilities, as well as what the OPEB liability would be if it were calculated using health care cost trend rates that are one percentage point lower or higher than the current health care cost trend rates:
1% DecreaseCurrent
Trend Rates 1% IncreaseInitial PERA premiums trend rate 5.50% 6.50% 7.50%Ultimate PERA premiums trend rate 3.50 4.50 5.50Medicare Part B 3.50 4.50 5.50
Total OPEB liability $ 21,152,000 $ 21,179,000 $ 21,209,000
OPEB Expense and Deferred Outflows of Resources and Deferred Inflows of Resources Related to OPEB: For the year ended December 31, 2020, Utilities recognized OPEB expense of $3,159,993. At December 31, 2020, Utilities reported deferred outflows of resources related to OPEB from the following sources:
Deferred Outflowsof Resources
Benefit payments subsequent to the measurement date $ 1,185,000 Total $ 1,185,000
The $1,185,000 reported as deferred outflows of resources related to OPEB, resulting from benefit payments subsequent to the measurement date, will be recognized as a reduction of the total OPEB liability in the year ended December 31, 2020.
D. Commitments and Contingent Liabilities
1. Construction and Purchase Commitments
Significant construction and purchase commitments of the City, as of December 31, 2020, are as follows (in millions):
General Fund $ 6.5 Non-major governmental funds 27.8 Utilities 192.9 Non-major enterprise funds 7.7
On April 27, 2016, the City entered into an Intergovernmental Agreement with Pueblo County (IGA), relating to the City’s future operation of its stormwater program. The IGA included provisions requiring the City to make certain minimum expenditures for its stormwater program, including both operation and maintenance, and capital improvements, a portion of which will be paid by Utilities. For calendar years 2016 through 2035, the City and Utilities agreed to expend a minimum of $460 million, with a minimum total, annual averages, and annual minimum expenditures.
The IGA also included provisions that require a portion of these funds to be spent on capital improvement projects benefiting the City and Pueblo County.
NOTES TO FINANCIAL STATEMENTS December 31, 2020
146 City of Colorado Springs 2020 Annual Comprehensive Financial Report

Although the IGA does not contain express language stating that these City expenditures are subject to annual appropriation, future year City expenditures are nevertheless made subject to this appropriation limitation by Section IV (N) of the IGA. Moreover, the City is obligated under the federal Clean Water Act to operate its stormwater system in compliance with a municipal separate storm sewer system (MS4) Discharge Permit. A substantial portion of the expenditures required by the IGA will also serve to fulfill the City’s obligations under the Discharge Permit and federal law.
In November 2017, City voters approved reestablishment of Stormwater User Service Fees to be imposed upon all developed or improved property within the City. This approval directs that the revenues derived therefrom will be collected by an enterprise fund and used only for the stormwater system capital and operating expenses, performance of MS4 Discharge Permit obligations, and meeting the obligations arising under intergovernmental agreements entered into prior to June 1, 2016, which includes the IGA. The voter authorization also allows the fees to be increased by City Council if necessary to comply with federal law, a court order, or to meet IGA obligations. After imposition of the fees beginning July 1, 2018, it was anticipated that this revenue stream would be sufficient to fund the IGA financial commitments.
2. Refunded Bonds
The City placed proceeds from advance refunding bond issues and in-substance defeasances in irrevocable refunding escrow accounts. As of December 31, 2020, the City remains contingently liable for the outstanding principal balance of $32,350,000 in refunded bonds and debt defeased in-substance.
Utilities has placed proceeds from advance refunding bond issues in irrevocable refunding escrow accounts throughout various years. As of December 31, 2020, Utilities remains contingently liable for the outstanding principal balance of $19,850,000 in refunded bonds.
3. Charter Amendments
In April 1991, voters approved City Charter Amendment #3, entitled Taxpayers Bill of Rights (TABOR). In November 1992, voters adopted a similar statewide constitutional amendment. Both contain provisions which limit the amount of revenue the City may retain in any given year. TABOR permits a maximum annual percentage change in “fiscal year spending” (FYS) equivalent to the sum of inflation in the prior calendar year and annual local growth. Should actual FYS increase at a rate greater than that which the formula allows, the City must refund the “excess” in the ensuing year or seek voter approval to retain the “excess.” TABOR also establishes a separate requirement for local governments that limits the increase in property tax revenue from year to year. At the November 3, 2020, coordinated election, the City asked, and the citizens approved, a TABOR ballot item known as Issue 2A. Part of the ballot question allowed the City to retain and spend all revenues received in 2020.
Policy-making and legislative authority are vested in the governing council (Council) consisting of nine members, all elected on a non-partisan basis. Council members serve four-year terms and are term limited to two terms. Three council members are elected at large; the remaining council members are elected from six equally-populated districts. Biennially, council members elect a President from among themselves to preside over the meetings and a President Pro Tempore to fill in when the President is absent.
NOTES TO FINANCIAL STATEMENTS December 31, 2020
City of Colorado Springs 2020 Annual Comprehensive Financial Report 147

4. Litigation
The City is involved as a defendant in various legal actions involving claims and litigation arising from contracts, personal injury, property damage, and other matters. It is the practice of the City to expense and record as a liability those claims where a liability has been incurred and the amount of ultimate settlement can be reasonably estimated. Except as stated below, the City has provided for these estimated probable losses in the financial statements and, in the opinion of management, such claims and litigation will not have a material, adverse effect on the operations of the City.
The Clean Water Act Litigation - On November 9, 2016, the United States, on behalf of the Environmental Protection Agency, and the State of Colorado, on behalf of its Department of Public Health and Environment, filed a complaint against the City in the United States District Court for Colorado. The complaint sought injunctive relief and civil penalties against the City claiming that the City has not complied with discharge permits for its Municap Separate Storm Sewer System (MS4). Pueblo County and a conservancy district had intervened as additional plaintiffs.
In January 2021, the City and the parties to the litigation entered into a Consent Decree, settling the litigation. In the Consent Decree, the City agreed to undertake certain remedial actions, agreed to certain injunctive relief, and agreed to pay certain amounts to the EPA and the Lower Arkansas Valley Water Conservancy District. The City anticipates that funds derived from user fees collected by the Stormwater Enterprise Fund will be available to offset the cost of its obligations under the Consent Decree. The City has accrued $2.0 million for this claim for the year ended December 31, 2020.
The Curb Ramps Litigation - On March 20, 2019, Sharon King and Paul Spotts filed a class action lawsuit in the United States District Court for Colorado alleging that the City had failed to provide access to its public sidewalks for individuals with mobility disabilities, contrary to federal laws, and particularly the Americans with Disabilities Act. The plaintiffs and City had entered into a class action settlement agreement, which has been approved by the Court, and will require the City to install or retrofit 15,400 curb ramps over a period of 14 years, at the rate of at least 1,100 curb ramps per year at an aggregate cost to the City estimated to be $61,600,000 (2018 dollars) and attorneys’ fees. The City intends to fulfill the obligation over the stated period from its general fund and other available revenues.
De'Von Bailey Claims - In the United States District Court case titled Estate of De'Von Bailey v. City of Colorado Springs, et al., 20-cv-1600-WJM-KMT, plaintiffs have asserted claims for excessive force, denial of equal protections, and battery causing wrongful death. These claims arise from City police officers shooting Mr. Bailey during an encounter after a reported armed robbery involving Mr. Bailey. The City is actively defending the suit. The City has excess liability coverage for this claim, and secondary insurer coverage which limits the City's liability exposure.
5. Contingent Liabilities
Under the terms of federal and state grants, periodic audits are required and certain costs may be questioned as not being appropriate expenditures under the terms of the grant. Such audits could lead to reimbursements to the grantor agencies. The amount, if any, of expenditures which may be disallowed by the grantor cannot be determined at this time. Management believes disallowances, if any, resulting from any such audits would be immaterial.
NOTES TO FINANCIAL STATEMENTS December 31, 2020
148 City of Colorado Springs 2020 Annual Comprehensive Financial Report

6. Environmental Matters
Numerous federal, state and local environmental laws and regulations affect Utilities’ facilities and operations. Utilities monitors its compliance with environmental laws and regulations on an ongoing basis. Additional detailed information may be found in the separately issued Utilities financial statements.
E. Passenger Facility Charges
The Federal Aviation Administration (FAA) has approved previously filed applications of the Airport for the right to impose passenger facility charges (PFCs) on enplaned passengers at the Airport. PFC revenue is required to be used to fund FAA-approved capital projects eligible under federal legislation permitting the imposition of PFCs. The approved Airport projects include certain completed and ongoing projects such as runway and taxiway rehabilitations, security enhancements, roadway upgrades, and drainage improvements. GASB 34 requires PFCs be recognized when earned, not when received. Unspent PFC revenue is recorded in the financial statements as restricted cash and restricted net position.
F. Customer Facility Charges
The Airport has established a Rental Car Company Customer Facility Charge Policy, in accordance with the rental car concession agreements. In 2018, the Airport entered into a new agreement that extends the collection of customer facility charges (CFCs) at the $2.50 rate until December 31, 2028. Any increase in this rate will be based on the projected costs of anticipated capital projects outlined in the policy.
G. Joint Venture - Utilities
Utilities has an equity interest in Young Gas Storage Company, Ltd. (Young) of 5%. Young is a Colorado limited partnership organized on June 30, 1993, to develop and operate a natural gas storage system near Fort Morgan, Colorado. Young’s natural gas storage system consists of 38 natural gas storage facility wells, a 6,000 horsepower compressor station, a natural gas processing plant, eleven miles of 20-inch transmission line and four miles of storage gathering line.
The net investment in the joint venture reported on the Statement of Net Position as of December 31, 2020 is (in 000’s):
EntityAmountInvested
UndistributedNet Earnings
UtilitiesInvestment
Young Gas Storage Company Ltd. $ 500 $ 398 $ 898
NOTES TO FINANCIAL STATEMENTS December 31, 2020
City of Colorado Springs 2020 Annual Comprehensive Financial Report 149

H. Retirement Plans
The City’s former or current non-uniformed and uniformed (firefighters and police officers) employees are eligible to participate in one of six defined benefit pension plans. Non-uniformed employees participate in the Public Employees’ Retirement Association of Colorado (PERA) and uniformed employees participate in one of five plans administered by the Fire and Police Pension Association (FPPA). More detailed notes regarding each plan follows. Below is a table that summarizes the net pension liabilities, net pension asset, deferred outflows and inflows of resources, and pension expenses associated with each of the plans (in 000's).
Net PensionLiability
Net Pension Asset
DeferredOutflows of Resources
DeferredInflows of
ResourcesPensionExpense
GOVERNMENTAL ACTIVITIESOld Hire Fire $ 36,201 — $ 2,328 $ 1,461 $ 17,419 Old Hire Police 25,725 — 1,851 1,228 10,236 New Hire Fire 37,752 — 9,125 5,608 8,813 New Hire Police 58,981 — 21,113 13,644 16,104 PERA 79,123 — 17,806 32,370 6,396 FPPA Statewide — (4,555) 29,919 9,283 3,822
Total governmental activities 237,782 (4,555) 82,142 63,594 62,790
BUSINESS-TYPE ACTIVITIESOld Hire Fire — — — — — Old Hire Police — — — — — New Hire Fire — — — — — New Hire Police 1,412 — 440 313 364 PERA 185,792 — 39,806 80,327 7,255 FPPA Statewide — (10) 61 54 4
Total business-type activities 187,204 (10) 40,307 80,694 7,623
TOTALOld Hire Fire 36,201 — 2,328 1,461 17,419 Old Hire Police 25,725 — 1,851 1,228 10,236 New Hire Fire 37,752 — 9,125 5,608 8,813 New Hire Police 60,393 — 21,553 13,957 16,468 PERA 264,915 — 57,612 112,697 13,651 FPPA Statewide — (4,565) 29,980 9,337 3,826
Total $ 424,986 $ (4,565) $ 122,449 $ 144,288 $ 70,413
Note: Immaterial differences may occur due to rounding.
NOTES TO FINANCIAL STATEMENTS December 31, 2020
150 City of Colorado Springs 2020 Annual Comprehensive Financial Report

1. Non-Uniformed Employees
Defined Benefit Pension Plan
Plan Description: The City participates in the Local Government Division Trust Fund (LGDTF), a cost-sharing multiple-employer defined benefit pension plan administered by PERA. The net pension liability, deferred outflows of resources and deferred inflows of resources related to pensions, pension expense, information about the fiduciary net position and additions to/deductions from the fiduciary net position of the LGDTF have been determined using the economic resources measurement focus and the accrual basis of accounting. For this purpose, benefit payments (including refunds of employee contributions) are recognized when due and payable in accordance with the benefit terms. Investments are reported at fair value. Title 24, Article 51, of the Colorado Revised Statutes (CRS), as amended, assigns the authority to establish benefit provisions to the State Legislature.
The Colorado General Assembly passed significant pension reform through Senate Bill (SB) 18-200: Concerning Modifications To the Public Employees’ Retirement Association Hybrid Defined Benefit Plan Necessary to Eliminate with a High Probability the Unfunded Liability of the Plan Within the Next Thirty Years. The bill was signed into law by Governor Hickenlooper on June 4, 2018. SB 18-200 makes changes to certain benefit provisions. Some, but not all, of these changes were in effect as of December 31, 2020.
PERA issues a publicly available annual financial report that includes financial statements and required supplementary information for LGDTF. That report may be obtained online at:
https://www.copera.org/sites/default/files/documents/5-20-19.pdf
or by writing to:
Colorado PERA1301 Pennsylvania StreetDenver, Colorado 80203
or by calling PERA at 303-832-9550 or 1-800-759-PERA (7372).
All City employees, except uniformed police and fire, are members of the LGDTF. However, the Mayor, direct reports of the Mayor, and elected officials of the City may elect to be exempt from membership in PERA. The LGDTF of PERA provides retirement, disability, and survivor benefits. Retirement benefits are determined by the amount of service credit earned and/or purchased, highest average salary, the benefit structure(s) under which the member retires, the benefit option selected at retirement, and age at retirement. Retirement eligibility is specified in tables set forth at CRS § 24-51-602, 604, 1713, and 1714.
The lifetime retirement benefit for all eligible retiring employees under the PERA Benefit Structure is the greater of the:
• Highest average salary multiplied by 2.5% and then multiplied by years of service credit. • Value of the retiring employee’s member contribution account plus a 100% match on eligible
amounts as of the retirement date. This amount is then annuitized into a monthly benefit based on life expectancy and other actuarial factors.
NOTES TO FINANCIAL STATEMENTS December 31, 2020
City of Colorado Springs 2020 Annual Comprehensive Financial Report 151

In all cases, the service retirement benefit is limited to 100% of highest average salary and also cannot exceed the maximum benefit allowed by Federal Internal Revenue Code.
Members may elect to withdraw their member contribution accounts upon termination of employment with all PERA employers; waiving rights to any lifetime retirement benefits earned. If eligible, the member may receive a match of either 50% or 100% on eligible amounts depending on when contributions were remitted to PERA, the date employment was terminated, whether 5 years of service credit has been obtained and the benefit structure under which contributions were made.
On an annual basis, eligible recipients who elect to receive a lifetime retirement benefit are generally eligible to receive post-retirement cost-of-living adjustments, referred to as annual increases (AI) in the CRS, once certain criteria are met. Pursuant to SB 18-200, the annual increase for 2019 is 0.00% for all benefit recipients. Thereafter, benefit recipients who began eligible employment before January 1, 2007 will receive an annual increase of 1.25% unless adjusted by the automatic adjustment provision (AAP) pursuant to CRS § 24-51-413. Benefit recipients under the PERA benefit structure who began eligible employment on or after January 1, 2007 will receive the lesser of an annual increase of 1.25% or the average of the Consumer Price Index for Urban Wage Earners and Clerical Workers for the prior calendar year, not to exceed 10% of PERA’s Annual Increase Reserve (AIR) for the LGDTF. The AAP may raise or lower the aforementioned annual increase by up to 0.25% based on the parameters specified in CRS § 24-51-413.
The City and its eligible employees are required to contribute to the LGDTF at a rate set by Colorado state statutes. The contribution requirements are established under CRS § 24-51-401, et seq and § 24-51-413. Colorado State law provisions may be amended from time to time by the Colorado General Assembly.
The employee contribution requirements are summarized in the table below:
January 1, 2019 Through
December 31, 2019
January 1, 2020 Through
June 30, 2020
July 1, 2020 Through
December 31, 2020
Employee contribution rate1 8.00% 8.00% 8.50%
1Rates are expressed as a % of salary as defined in CRS § 24-51-101(42).
Remainder of page intentionally blank
NOTES TO FINANCIAL STATEMENTS December 31, 2020
152 City of Colorado Springs 2020 Annual Comprehensive Financial Report

The employer contribution requirements are summarized in the table below:
January 1, 2019 Through
June 30, 2020
July 1, 2020 Through
December 31, 2020
Rate (%)1 Rate (%)1
Employer contribution rate 10.00 10.50 Amount of employer contribution apportioned to the Health Care Trust Fund as specified in CRS § 24-51-208(1)(f) (1.02) (1.02)
Amount apportioned to the LGDTF 8.98 9.48 Amortization Equalization Disbursement (AED) as specifiedin CRS § 24-51-411 2.20 2.20 Supplemental Amortization Equalization Disbursement (SAED) as specified in C.R.S. § 24-51-411 1.50 1.50 Total employer contribution rate to the LGDTF 12.68 13.18 1Rates are expressed as a % of salary as defined in CRS § 24-51-101(42).
Employer contributions are recognized by the LGDTF in the period in which the compensation becomes payable to the member and the City is statutorily committed to pay the contributions to the LGDTF. Employer contributions recognized by the LGDTF from the City were $33,908,959 for the year ended December 31, 2020.
Net Pension Liability, Pension Expense, Deferred Outflows of Resources and Deferred Inflows of Resources Related to Pensions: As of December 31, 2020, the City reported a liability of $264,915,173 for its proportionate share of the net pension liability. The net pension liability was measured as of December 31, 2019, and the total pension liability used to calculate the net pension liability was determined by an actuarial valuation as of December 31, 2018 and rolled forward to December 31, 2019 using standard roll-forward techniques. The City’s proportion of the net pension liability was based on the City’s contributions to the LGDTF for the calendar year 2019 relative to the total contributions of participating employers to the LGDTF.
At December 31, 2019, the City’s proportion was 36.2208%, which was an increase of 0.0029% from its proportion measured as of December 31, 2018.
The City and Utilities report contributions to the LGDTF independent of each other; therefore all pension related amounts, including net pension liability, deferred outflows of resources, deferred inflows of resources, and pension expense, are allocated from the LGDTF independently. The City allocates its portion of the LGDTF between governmental activities and business-type activities, except Utilities, based on contributions. This allocation for the year-ended December 31, 2020 (a December 31, 2019 measurement date) was 85.2815% and 14.7185% between the governmental activities and business-type activities respectively. This allocation is a decrease from the prior year in the governmental activities of 2.7942% and a corresponding increase in the business-type activities. It is important to note, amounts presented in this disclosure footnote include both City and Utilities amounts combined.
For the year ended December 31, 2020 the City’s pension expense related to the PERA LGDTF was $13,651,148.
NOTES TO FINANCIAL STATEMENTS December 31, 2020
City of Colorado Springs 2020 Annual Comprehensive Financial Report 153

At December 31, 2020, the City reported deferred outflows of resources and deferred inflows of resources related to pensions for the PERA LGDTF from the following sources:
Deferred Outflowsof Resources
Deferred Inflowsof Resources
Differences between expected and actual experience $ 17,335,313 $ — Net difference between projected and actual earnings on pension plan investments — 108,381,221 Changes in proportion 6,367,966 4,316,362 Contributions subsequent to the measurement date 33,908,959 — Total $ 57,612,238 $ 112,697,583
The $33,908,959 reported as deferred outflows of resources related to pensions, resulting from contributions subsequent to the measurement date, will be recognized as a reduction of the net pension liability in the year ended December 31, 2021.
Other amounts reported as deferred outflows of resources and deferred inflows of resources related to pensions will be recognized in pension expense as follows:
Year EndedDecember 31,
Differences Between Expected and Actual
Experience
Net Difference Between Projected and Actual Earnings
on InvestmentsNet Changes in
Proportion
Net Effect of Amortized Deferred
Amounts on Pension Expense
2021 $ 14,786,649 $ (33,117,301) $ 1,913,796 $ (16,416,856)
2022 2,548,664 (33,675,908) 137,808 (30,989,436)
2023 — (4,607,951) — (4,607,951)
2024 — (36,980,061) — (36,980,061)
Total $ 17,335,313 $ (108,381,221) $ 2,051,604 $ (88,994,304)
The differences between expected and actual experience, changes of assumptions as well as the City’s change in their proportion are amortized over a closed period equal to the average expected remaining service lives of active and inactive members in the plan. The LGDTF determined the average expected remaining service lives for active and inactive members at the beginning of the 2019 measurement period to be 2.24 years. The difference between expected and actual investment experience is amortized over a closed five-year period.
Remainder of page intentionally blank
NOTES TO FINANCIAL STATEMENTS December 31, 2020
154 City of Colorado Springs 2020 Annual Comprehensive Financial Report

Actuarial assumptions: The total pension liability in the December 31, 2018 actuarial valuation was determined using the following actuarial assumptions and other inputs:
Rate (%)Price inflation 2.40 Real wage growth 1.10 Wage inflation 3.50 Salary increase, including wage inflation 3.50 - 10.45Long-term investments rate of return, net of pension plan investment expenses, including price inflation 7.25 Future post-retirement benefit increases:
PERA benefit structure hire prior to 1/1/071 1.25 compounded annually thereafter
PERA benefit structure hired after 12/31/06(ad hoc, substantively automatic)1
Financed by the Annual Increase Reserve (AIR)
1 For 2019, the annual increase was 0.00%
Healthy mortality assumptions for active members reflect the RP-2014 White Collar Employee Mortality Table, a table specifically developed for actively working people. To allow for an appropriate margin of improved mortality prospectively, the mortality rates incorporate a 70% factor applied to male rates and a 55% factor applied to female rates.
Post-retirement non-disabled mortality assumptions were based on the RP-2014 Healthy Annuitant Mortality Table, adjusted as follows:
• Males: Mortality improvement projected to 2018 using the MP-2015 projection scale, a 73% factor applied to rates for ages less than 80, a 108% factor applied to rates for ages 80 and above, and further adjustments for credibility.
• Females: Mortality improvement projected to 2020 using the MP-2015 projection scale, a 78% factor applied to rates for ages less than 80, a 109% factor applied to rates for ages 80 and above, and further adjustments for credibility.
For disabled retirees, the mortality assumption was based on 90% of the RP-2014 Disabled Retiree Mortality Table.
The actuarial assumptions used in the December 31, 2018, valuations were based on the results of the 2016 experience analysis for the periods January 1, 2012, through December 31, 2015, as well as the October 28, 2016 actuarial assumptions workshop and were adopted by the PERA Board during the November 18, 2016 Board meeting.
The long-term expected return on plan assets is reviewed as part of regular experience studies prepared every four or five years for PERA. Recently, this assumption has been reviewed more frequently. The most recent analyses were outlined in presentations to PERA’s Board on October 28, 2016.
NOTES TO FINANCIAL STATEMENTS December 31, 2020
City of Colorado Springs 2020 Annual Comprehensive Financial Report 155

Several factors were considered in evaluating the long-term rate of return assumption for the LGDTF, including long-term historical data, estimates inherent in current market data, and a log-normal distribution analysis in which best-estimate ranges of expected future real rates of return (expected return, net of investment expense and inflation) were developed for each major asset class. These ranges were combined to produce the long-term expected rate of return by weighting the expected future real rates of return by the target asset allocation percentage and then adding expected inflation.
As of the most recent adoption of the long-term expected rate of return by the PERA Board, the target asset allocation and best estimates of geometric real rates of return for each major asset class are summarized in the following table:
Asset ClassTarget Allocation
(%)
30 Year Expected Geometric RealRate of Return
(%)US equity - large cap 21.20 4.30US equity - small cap 7.42 4.80Non US equity - developed 18.55 5.20Non US equity - emerging 5.83 5.40Core fixed income 19.32 1.20High yield 1.38 4.30Non US fixed income - developed 1.84 0.60Emerging market bonds 0.46 3.90Core real estate 8.50 4.90Opportunity fund 6.00 3.80Private equity 8.50 6.60Cash 1.00 0.20Total 100.00
* In setting the long-term expected rate of return, projections employed to model future returns provide a range of expected long-term returns that, including expected inflation, ultimately support a long-term expected rate of return assumption of 7.25%.
Discount rate: The discount rate used to measure the total pension liability was 7.25%. The projection of cash flows used to determine the discount rate applied the actuarial method and assumptions shown above. In addition, the following methods and assumptions were used in the projection of cash flows:
• Total covered payroll for the initial projection year consists of the covered payroll of the active membership present on the valuation date and the covered payroll of future plan members assumed to be hired during the year. In subsequent projection years, total covered payroll was assumed to increase annually at a rate of 3.50%.
• Employee contributions were assumed to be made at the member contribution rates in effect for each year, including the additional 0.50% resulting from the 2018 AAP assessment, statutorily recognized July 1, 2019, and effective July 1, 2020. Employee contributions for future plan members were used to reduce the estimated amount of total service costs for future plan members.
NOTES TO FINANCIAL STATEMENTS December 31, 2020
156 City of Colorado Springs 2020 Annual Comprehensive Financial Report

• Employer contributions were assumed to be made at rates equal to the fixed statutory rates specified in law for each year, including the additional 0.50%, resulting from the 2018 AAP assessment, statutorily recognized July 1, 2019, and effective July 1, 2020. Employer contributions also include current and estimated future AED and SAED, until the actuarial value funding ratio reaches 103%, at which point, the AED and SAED will each drop 0.50% every year until they are zero. Additionally, estimated employer contributions reflect reductions for the funding of the AIR and retiree health care benefits. For future plan members, employer contributions were further reduced by the estimated amount of total service costs for future plan members not financed by their member contributions.
• Employer contributions and the amount of total service costs for future plan members were based upon a process to estimate future actuarially determined contributions assuming an analogous future plan member growth rate.
• The AIR balance was excluded from the initial fiduciary net position, as, per statute, AIR amounts cannot be used to pay benefits until transferred to either the retirement benefits reserve or the survivor benefits reserve, as appropriate. AIR transfers to the fiduciary net position and the subsequent AIR benefit payments were estimated and included in the projections.
• The projected benefit payments reflect the lowered annual increase cap, from 1.50% to 1.25% resulting from the 2018 AAP assessment, statutorily recognized July 1, 2019, and effective July 1, 2020.
• Benefit payments and contributions were assumed to be made at the middle of the year.
Based on the above assumptions and methods, LGDTF’s fiduciary net position was projected to be available to make all projected future benefit payments of current members. Therefore, the long-term expected rate of return of 7.25% on pension plan investments was applied to all periods of projected benefit payments to determine the total pension liability. The discount rate determination does not use the municipal bond index rate, and therefore, the discount rate is 7.25%. There was no change in the discount rate from the prior measurement date.
The following presents the proportionate share of the net pension liability calculated using the discount rate of 7.25%, as well as what the proportionate share of the net pension liability would be if it were calculated using a discount rate that is one percentage point lower or higher than the current rate:
Sensitivity of the NPL:
1% DecreaseCurrent
Discount Rate 1% Increase6.25% 7.25% 8.25%
City's proportionate share of net pension liability $ 486,630,588 $ 264,915,173 $ 78,455,727
Detailed information about the pension plan’s fiduciary net position is available in the separately issued PERA LGDTF financial reports found at: https://www.copera.org/sites/default/files/documents/5-20-19.pdf
NOTES TO FINANCIAL STATEMENTS December 31, 2020
City of Colorado Springs 2020 Annual Comprehensive Financial Report 157

Defined Contribution Plans
City employees, depending upon their position in the City as noted in the plan descriptions below, have access to up to four defined contribution plans: PERA 401(k), ICMA 457, ICMA 401(a), and PERA DC.
PERA 401(k) Plan Description: The LGDTF members of the City may voluntarily contribute to the Voluntary Investment Program (401(k) Plan), an Internal Revenue Code Section 401(k) defined contribution plan administered by PERA. Contributions are separate from others made to PERA. Title 24, Article 51, Part 14, of the CRS, as amended, assigns the authority to establish the 401(k) Plan provisions to the PERA Board of Trustees. PERA issues a publicly available annual report which includes additional information on the Voluntary Investment Program. That report can be obtained at www.copera.org/investments/pera-financial-reports.
PERA 401(k) Funding Policy: The 401(k) Plan is funded by voluntary member contributions of up to a maximum limit set by the IRS ($19,500 annually for 2020 calendar year). There is a catch-up provision that allows participants 50 and older who are contributing the maximum to contribute an additional $6,500 annually to their accounts. The City does not contribute to the PERA 401(k) plan.
ICMA 457 Plan Description: Per authority of a City Council Resolution, employees of the City may also voluntarily contribute to an ICMA 457 Plan, an Internal Revenue Code of 1986 section 457. The plan is administered by ICMA Retirement Corporation and the Vantage Trust Company.
ICMA 457 Funding Policy: The ICMA 457 plan is funded by voluntary member contributions of up to a maximum limit set by the IRS ($19,500 annually for 2020 calendar year). In addition, employees are eligible to contribute an additional $6,500 annually if they are age 50 or older. There is an additional “pre-retirement” catch-up provision that allows employees to double their 457 contributions by funding an additional $19,500 if they are within three years of retirement. The City does not contribute to the ICMA 457 plan.
ICMA 401(a) Plan Description: Per Title 24, Article 51 of CRS, as amended, the City and Utilities provide, to certain employees, the option to make a one-time irrevocable election to participate in an ICMA 401(a), a defined contribution plan, administered by ICMA Retirement Corporation, in lieu of participation in Colorado PERA.
ICMA 401(a) Funding Policy: The City contributes to the ICMA 401(a) at a rate of 10.0% of covered salary. The City’s contribution to the ICMA 401(a) for the year ending December 31, 2020 was $62,242.
PERA Defined Contribution (PERA DC) Plan Description: Certain City employees hired after December 31, 2018 can elect to participate in Colorado PERA's defined contribution plan in lieu of participating in the defined benefit plan. The PERA DC Plan is an Internal Revenue Code Section 401(a) governmental profit-sharing defined contribution plan. Title 24, Article 51, Part 15 of the C.R.S., as amended, assigns the authority to establish Plan provisions to the PERA Board of Trustees. Per Title 24, Article 51 of CRS, as amended, employees have 60 calendar days from their date of hire to make a choice between the defined benefit plan and the defined contribution plan. If they do not make an active choice in the 60 days, they automatically are enrolled in the PERA defined benefit plan. Additionally, effective January 1, 2019, employees will have a one-time option of switching between the PERA defined benefit and the defined contribution plans between years two and five of participation in PERA.
NOTES TO FINANCIAL STATEMENTS December 31, 2020
158 City of Colorado Springs 2020 Annual Comprehensive Financial Report

PERA Defined Contribution Funding Policy: All participating employees in the PERA DC Plan and the the City are required to contribute a percentage of the participating employees’ PERA-includable salary to the PERA DC Plan. The employee and employer contribution rates are summarized in the tables below:
January 1, 2019Through
December 31, 2019
January 1, 2020Through
June 30, 2020
July 1, 2020Through
December 31, 2020
Employee contribution rates 8.00 % 8.00 % 8.50 %
Employer contribution rates (on behalf of participating employees) 10.00 % 10.00 % 10.50 %
Additionally the employers are required to contribute AED and SAED to the LGDTF as follows:
As of 12/31/2020
Amortization Equalization Disbursement (AED) as specified in C.R.S. § 24-51-411 1 2.20 %
Supplemental Amortization Equalization Disbursement (SAED) as specified in C.R.S. § 24-51-411 1 1.50 %
Total employer contribution rate to the LGDTF1 3.70 %
1Contribution rates for the DC Plan are expressed as a percentage of salary as defined in C.R.S. § 24-51-101(42).
Contribution requirements are established under Title 24, Article 51, Section 1505 of the CRS, as amended. Participating employees of the PERA DC Plan are immediately vested in their own contributions and investment earnings and are immediately 50% vested in the amount of employer contributions made on their behalf. For each full year of participation, vesting of employer contributions increases by 10%. Forfeitures are used to pay expenses of the PERA DC Plan in accordance with PERA Rule 16.80 as adopted by the PERA Board of Trustees in accordance with Title 24, Article 51, Section 204 of the CRS. As a result, forfeitures do not reduce pension expense. The City's contribution to the PERA DC Plan for the year ending December 31, 2020 was $50,749.
Remainder of page intentionally blank
NOTES TO FINANCIAL STATEMENTS December 31, 2020
City of Colorado Springs 2020 Annual Comprehensive Financial Report 159

2. Uniformed Employees
Defined Benefit Plans
City firefighters and police officers participate in one of five different defined benefit pension plans. Membership in the various plans is dependent upon the classification of the employee (fire or police) and the start date of the employee. The five plans, administered by the FPPA, are the Old Hire Fire Pension Plan, Old Hire Police Pension Plan, New Hire Fire Pension Plan, New Hire Police Pension Plan and the Statewide Defined Benefit Plan. FPPA uses the accrual basis of accounting. The net pension liability, deferred outflows of resources and deferred inflows of resources related to pensions, pension expense, information about the fiduciary net position and additions to/deductions from the fiduciary net position were calculated using this basis of accounting. For this purpose, benefit payments (including refunds of employee contributions) are recognized when due and payable in accordance with the benefit terms. Investments are reported at fair value. FPPA issues a publicly available financial report that includes financial statements and required supplementary information for FPPA. That report may be obtained online at:
http://www.fppaco.org/PDF/annual-reports/19.annual.report.pdf
or by calling FPPA at (303) 770-3772 or by writing to:
Fire and Police Pension Association of Colorado 5290 DTC Parkway, Suite 100Greenwood Village, CO 80111-2721
The following information regarding the discount rate applies to all five plans with the FPPA.
Discount Rate: The long-term expected rate of return on pension plan investments was determined using a building-block method in which best-estimate ranges of expected future real rates of return (expected returns, net of pension plan investment expense and inflation) are developed for each major asset class. These ranges are combined to produce the long-term expected rate of return by weighing the expected future real rates of return by the target asset allocation percentage and by adding expected inflation. Best estimates of arithmetic real rates of return for each major asset class included in the plan’s target asset allocation as of December 31, 2019 are below:
Old Hire Fire Pension Plan and Old Hire Police Pension Plan:
Asset ClassTarget Allocation
(%)
Long-term Expected Nominal Rate of
Return(%)
Global equity 17.50 7.70 Equity long/short 6.00 6.50 Private markets 25.00 9.50 Fixed income 40.50 5.00 Absolute return 6.00 5.00 Managed futures — 4.70 Cash 5.00 3.20 Total 100.00 %
NOTES TO FINANCIAL STATEMENTS December 31, 2020
160 City of Colorado Springs 2020 Annual Comprehensive Financial Report

New Hire Fire Pension Plan, New Hire Police Pension Plan and the Statewide Defined Benefit Plan:
Asset ClassTarget Allocation
(%)
Long-term Expected Rate of Return
(%)1
Global equity 38.00 7.00 Equity long/short 8.00 6.00 Private markets 25.00 9.20 Fixed income 15.00 5.20 Absolute return 8.00 5.50 Managed futures 4.00 5.00 Cash 2.00 2.52 Total 100.00 %
1Nominal rate of return for New Hire plans and real rate of return for Statewide plan
The discount rate used to measure the total pension liability for the New Hire and Statewide plans was 7.00%, while the discount rate used for the Old Hire plans was 6.50%. The projection of cash flows used to determine the discount rate assumed that contributions from the City will be made based on actuarially determined rates based on the Board’s funding policy. Based on those assumptions, the plan’s fiduciary net position was projected to be available to make all the projected future payments of the current plan members. Therefore, the long-term expected rate of return on pension plan investments was applied to all periods of projected benefit payments to determine the total pension liability.
The discount rate determination does not use the Municipal Bond Index Rate.
Detailed information about the pension plan’s fiduciary net position is available in the separately issued FPPA financial reports found at:
http://www.fppaco.org/PDF/annual-reports/19.annual.report.pdf
Old Hire Defined Benefit Pension Plans
Plan Description: The Old Hire Pension Plans, defined benefit pension plans, are part of the Public Employee Retirement System administered by the Fire and Police Pension Association of Colorado (FPPA). There are 218 local plans associated with the FPPA Affiliated Local Plans. The Affiliated Local Plans at FPPA represent the assets of numerous separate plans that have elected to affiliate with FPPA for plan administration and investment only. Each plan has a separate plan document and actuarial valuation and is governed by its own local pension board which has the authority to amend the plan benefits, such as cost of living increases. Funding for the Old Hire Pension Plans is the sole obligation of the City.
The Old Hire Pension Plans are for sworn fire and police employees hired before April 8, 1978. These single-employer plans are closed to new employees. Any amendments to the benefit-related provisions of the Old Hire plans may be made by the Old Hire Pension Boards.
NOTES TO FINANCIAL STATEMENTS December 31, 2020
City of Colorado Springs 2020 Annual Comprehensive Financial Report 161

The City has elected to op-out of the current Colorado law limiting annual benefit increases to 3% for benefits earned after January 1, 1980 known as the limited rank escalation. Instead, benefit increases are linked to pay increases for the active duty rank the member occupied on the date of retirement.
Actuarial assumptions: The following actuarial assumptions apply to both of the Old Hire Pension Plans.
The total pension liability in the December 31, 2019 actuarial valuation was determined using the following actuarial assumptions and other inputs:
Rate (%)Wage inflation 2.50 Long-term investments rate of return, net pension plan investment expenses, including price inflation 6.50
Mortality rates were based on the RP-2014 Mortality Tables projected to 2018 using the MP-2017 projection scales, and then projected prospectively using the ultimate rates of the sale for all years.
Following an experience study in 2018 and asset allocation study in 2018-2019, the Board adopted a new assumption set for first use in the December 31, 2019 valuations. The assumptions changes are incorporated into the total pension liability as of December 31, 2019.
The complete assumption set can be found in the actuarial valuation report as of December 31, 2019.
The assumptions that are based upon the actuary’s recommendations are internally consistent and reasonable based on the actual past experience of the plan.
Old Hire Fire Defined Benefit Pension Plan
The benefit recipients and members of the Old Hire Fire Pension Plan as of December 31, 2019 are as follows:
Retirees and beneficiaries 174
There are no active or inactive, non-retired members in the plan.
Contributions to the plan are based on biennially completed actuarial valuations of the plan. The contributions for year ended December 31, 2020 were based on the actuarial valuation as of January 1, 2020. The annual required contribution is the sum of the normal cost of the plan and the amortization of the unfunded actuarially determined liability. Employer contributions recognized by the Old Hire Fire Pension Plan from the City were $2,328,416 for the year ended December 31, 2020.
Net Pension Liability, Pension Expense, Deferred Outflows of Resources and Deferred Inflows of Resources Related to Pensions: As of December 31, 2020, the City reported a liability of $36,200,523 for the Old Hire Fire Pension Plan net pension liability. The net pension liability was measured as of December 31, 2019, and the total pension liability used to calculate the net pension liability was determined by an actuarial valuation as of December 31, 2019.
NOTES TO FINANCIAL STATEMENTS December 31, 2020
162 City of Colorado Springs 2020 Annual Comprehensive Financial Report

For the year ended December 31, 2020, the City’s pension expense related to the Old Hire Fire Pension Plan was $17,419,175.
At December 31, 2020, the City reported deferred outflows and deferred inflows of resources related to pensions for the Old Hire Fire Pension Plan from the following sources:
Deferred Outflowsof Resources
Deferred Inflowsof Resources
Net difference between projected and actual earnings on pension plan investments $ — $ 1,461,357 Contributions subsequent to the measurement date 2,328,416 — Total $ 2,328,416 $ 1,461,357
The $2,328,416 reported as deferred outflows of resources related to pensions, resulting from contributions made subsequent to the measurement date, will be recognized as a reduction of the net pension liability in the year ended December 31, 2021. Other amounts reported as deferred outflows of resources and deferred inflows of resources related to pensions will be recognized in pension expense as follows:
Year EndedDecember 31,
Net Difference Between Projected and
Actual Earnings on Investments
Net Effect ofAmortized Deferred
Amounts on Pension Expense
2021 $ (375,068) $ (375,068) 2022 (678,989) (678,989) 2023 322,688 322,688 2024 (729,988) (729,988) Total $ (1,461,357) $ (1,461,357)
Per GASB Statement No. 68, the difference between expected and actual investment experience is amortized over a closed five year period.
The following presents the City’s net pension liability calculated using the discount rate of 6.50%, as well as what the net pension liability would be if it were calculated using a discount rate that is one percentage point lower or higher than the current rate:
Sensitivity of the NPL:
1% DecreaseCurrent
Discount Rate 1% Increase5.50% 6.50% 7.50%
City's net pension liability $ 45,774,315 $ 36,200,523 $ 27,924,041
NOTES TO FINANCIAL STATEMENTS December 31, 2020
City of Colorado Springs 2020 Annual Comprehensive Financial Report 163

Below is a schedule of changes in the net pension liability for the Old Hire Fire Pension Plan for year ended December 31, 2020:
Total pension liability (TPL) - January 1,2020 $ 94,066,095 Service cost — Interest on the TPL 6,731,045 Benefit changes — Differences between expected and actual experience of the TPL 7,956,514 Changes in assumptions 7,153,963 Benefit payments, including refunds of employee contributions (8,796,692) Net change in TPL 13,044,830
Total pension liability - December 31, 2020 107,110,925
Plan fiduciary net position (FNP) - January 1, 2020 68,842,799 Employer contributions 2,328,416 Employee contributions — Net investment income 8,573,590 Benefit payments, including refunds of employee contributions (8,796,692) Pension plan administrative expense (37,711) Net change in FNP 2,067,603
Plan fiduciary net position - December 31, 2020 70,910,402
Net pension liability $ 36,200,523
Plan fiduciary net position as a percentage of the total pension liability 66.20 %
Covered payroll $ —
Net pension liability as a percentage of covered payroll N/A
Remainder of page intentionally blank
NOTES TO FINANCIAL STATEMENTS December 31, 2020
164 City of Colorado Springs 2020 Annual Comprehensive Financial Report

Old Hire Police Defined Benefit Pension Plan
The benefit recipients and members of the Old Hire Police Pension Plan as of December 31, 2019 are as follows:
Retirees and beneficiaries 136
There are no active or inactive, non-retired members in the plan.
Contributions to the plan are based on biennially completed actuarial valuations of the plan. The contributions for year ended December 31, 2020 were based on the actuarial valuation as of January 1, 2020. The annual required contribution is the sum of the normal cost of the plan and the amortization of the unfunded actuarially determined liability. Employer contributions recognized by the Old Hire Police Pension Plan from the City were $1,850,964 for the year ended December 31, 2020.
Net Pension Liability, Pension Expense, Deferred Outflows of Resources and Deferred Inflows of Resources Related to Pensions: As of December 31, 2020, the City reported a liability of $25,725,138 for the Old Hire Police Pension Plan net pension liability. The net pension liability was measured as of December 31, 2019, and the total pension liability used to calculate the net pension liability was determined by an actuarial valuation as of December 31, 2019.
For the year ended December 31, 2020, the City’s pension expense related to the Old Hire Police Pension Plan was $10,236,453.
At December 31, 2020, the City reported deferred outflows and deferred inflows of resources related to pensions for the Old Hire Police Pension Plan from the following sources:
Deferred Outflowsof Resources
Deferred Inflowsof Resources
Net difference between projected and actual earnings on pension plan investments $ — $ 1,228,356 Contributions subsequent to the measurement date 1,850,964 — Total $ 1,850,964 $ 1,228,356
Remainder of page intentionally blank
NOTES TO FINANCIAL STATEMENTS December 31, 2020
City of Colorado Springs 2020 Annual Comprehensive Financial Report 165

The $1,850,964 reported as deferred outflows of resources related to pensions, resulting from contributions made subsequent to the measurement date, will be recognized as a reduction of the net pension liability in the year ended December 31, 2021. Other amounts reported as deferred outflows and deferred inflows of resources related to pensions will be recognized in pension expense as follows:
Year EndedDecember 31,
Net Difference Between Projected and Actual
Earnings on Investments
Net Effect of Amortized Deferred Amounts
on Pension Expense2021 $ (315,406) $ (315,406) 2022 (571,351) (571,351) 2023 274,757 274,757 2024 (616,356) (616,356) Total $ (1,228,356) $ (1,228,356)
Per GASB Statement No. 68 the difference between projected and actual investment experience is amortized over a closed five year period.
The following presents net pension liability calculated using the discount rate of 6.50%, as well as what the City’s net pension liability would be if it were calculated using a discount rate that is one percentage point lower or higher than the current rate:
Sensitivity of the NPL:
1% DecreaseCurrent
Discount Rate 1% Increase5.50% 6.50% 7.50%
City's net pension liability $ 33,734,053 $ 25,725,138 $ 18,840,868
Remainder of page intentionally blank
NOTES TO FINANCIAL STATEMENTS December 31, 2020
166 City of Colorado Springs 2020 Annual Comprehensive Financial Report

Below is a schedule of changes in the net pension liability for the Old Hire Police Pension Plan for year ended December 31, 2020:
Total pension liability (TPL) - January 1, 2020 $ 79,060,305 Service cost — Interest on the TPL 5,670,286 Benefit changes — Differences between expected and actual experienceof the TPL 2,284,694 Changes in assumptions 6,035,154 Benefit payments, including refunds of employee contributions (7,040,254) Net change in TPL 6,949,880
Total pension liability - December 31, 2020 86,010,185
Plan fiduciary net position (FNP) - January 1, 2020 58,247,082 Employer contributions 1,850,964 Employee contributions — Net investment income 7,258,087 Benefit payments, including refunds of employee contributions (7,040,254) Pension plan administrative expense (30,832) Net change in FNP 2,037,965
Plan fiduciary net position - December 31, 2020 60,285,047
Net pension liability $ 25,725,138
Plan fiduciary net position as a percentage of the total pension liability 70.09 %
Covered payroll $ —
Net pension liability as a percentage of covered payroll N/A
Remainder of page intentionally blank
NOTES TO FINANCIAL STATEMENTS December 31, 2020
City of Colorado Springs 2020 Annual Comprehensive Financial Report 167

New Hire Defined Benefit Pension Plans
Plan Description: The New Hire Pension Plans are single-employer defined benefit plans administered by the Fire and Police Pension Association of Colorado (FPPA). Effective October 1, 2006, the New Hire Pension Plans were incorporated into the Defined Benefit System by the FPPA Board pursuant to provisions of CRS 31-31-706(2)(a). Assets of the New Hire Pension Plans are held in trust with the FPPA Board acting as trustee. As trustee, FPPA collects, invests, administers and disburses monies related to the Defined Benefit Pension Plan.
The New Hire Pension Plans are for sworn fire and police employees hired after April 8, 1978 but before October 1, 2006. These plans are closed to new employees. Any amendments to the benefit-related provisions of the New Hire Pension Plans may be made by the FPPA Board, with the consent of the City, only upon approval of at least 65% of the then active members in the plan. In 2007 and 2011, members in the New Hire Pension Plans were allowed to make a one-time irrevocable election to switch from the New Hire Pension Plans to the Statewide Defined Benefit Pension Plan effective January 1, 2008 and January 1, 2012, respectively.
New Hire Pension Plan - Fire Component
Members in the New Hire Pension Plan - Fire Component (New Hire Fire Pension Plan) may be eligible for a normal retirement pension at any time after age 55, if the member has at least 25 years of service. Members who elect to retire on or after their normal retirement date shall be eligible for a monthly pension equal to 2% of final average salary (past 39 payroll periods) for each year of service for the first 10 years, plus 2.85% of the final average salary for each year of service in excess of 10 years. The maximum monthly pension is 77% and is earned upon completing 30 years of service. A member is eligible for an early retirement benefit after completion of 20 years of service and attainment of age 50. The early retirement benefit is reduced by 4.615% for each year that the member is less than age 55.
Cost-of-living adjustments begin on October 1 immediately before the retiree turns 65 or 10 years after benefits payment commence, whichever is earlier. The COLA increase reflects increases in the consumer price index but in no case can the increase be more than 3% for any one year.
Upon termination, a member may elect to have all contributions, along with 5% per annum, as interest, returned as a lump sum distribution. Alternatively, a member with at least 10 years of accredited service may leave contributions with the Plan and remain eligible for a retirement pension at age 55 equal to 2% of the member’s final average salary for each year of credited service for the first 10 years, plus 2.85% of final average salary for each year of credited service in excess of 10 years not to exceed 77%.
The benefit recipients and members of the New Hire Fire Pension Plan as of December 31, 2019 are as follows:
Retirees and beneficiaries 177 Inactive, non-retired members 8 Active members 91
The Plan sets contribution rates at a level that enables all benefits to be fully funded at the retirement date of all members within the plan as determined by the actuarial study. The City’s contribution rate shall never drop below the employee rate as set by the Board of the Fire and
NOTES TO FINANCIAL STATEMENTS December 31, 2020
168 City of Colorado Springs 2020 Annual Comprehensive Financial Report

Police Pension Association. Eligible employees are required to contribute 10% of their FPPA-includable salary. For 2020, the City’s employer contribution rate was set at 24%. The City also contributed an additional amount into the plan of $2,344,948. Employer contributions recognized by the New Hire Fire Pension Plan from the City were $4,788,124 for the year ended December 31, 2020.
Net Pension Liability, Pension Expense, Deferred Outflows of Resources and Deferred Inflows of Resources Related to Pensions: As of December 31, 2020, the City reported a liability of $37,751,619 for the New Hire Fire Pension Plan net pension liability. The net pension liability was measured as of December 31, 2019, and the total pension liability used to calculate the net pension liability was determined by an actuarial valuation as of December 31, 2019.
For the year ended December 31, 2020, the City’s pension expense related to the New Hire Fire Pension Plan was $8,812,921.
At December 31, 2020 the City reported deferred outflows of resources and deferred inflows of resources related to pensions for the New Hire Fire Pension Plan from the following sources:
Deferred Outflowsof Resources
Deferred Inflowsof Resources
Differences between expected and actual experience $ 2,136,325 $ 246,620 Change of assumptions 2,200,201 — Net difference between projected and actual earnings on pension plan investments — 5,361,830 Contributions subsequent to the measurement date 4,788,124 — Total $ 9,124,650 $ 5,608,450
The $4,788,124 reported as deferred outflows of resources related to pensions, resulting from contributions made subsequent to the measurement date, will be recognized as a reduction to the net pension liability in the year ended December 31, 2021.
Other amounts reported as deferred outflows of resources and deferred inflows of resources related to pensions will be recognized in pension expense as follows:
Year EndedDecember 31,
Differences Between Expected and Actual
ExperienceChanges of
Assumptions
Net Difference Between Projected and Actual
Earnings on Investments
Net Effect of Amortized Deferred Amounts on
Pension Expense
2021 $ 1,372,667 $ 2,200,201 $ (1,375,581) $ 2,197,287
2022 517,038 — (1,884,945) (1,367,907)
2023 — — (71,803) (71,803)
2024 — — (2,029,501) (2,029,501)
Total $ 1,889,705 $ 2,200,201 $ (5,361,830) $ (1,271,924)
The differences between expected and actual experience as well as changes of assumptions are amortized over a closed period equal to the average expected remaining service lives of active and inactive members in the plan. FPPA determined the average expected remaining service lives for active and inactive members at the beginning of the 2019 measurement period to be 2.3193 years. The difference between expected and actual investment experience is amortized over a closed five-year period.
NOTES TO FINANCIAL STATEMENTS December 31, 2020
City of Colorado Springs 2020 Annual Comprehensive Financial Report 169

Actuarial assumptions: The total pension liability in the December 31, 2019 actuarial valuation was determined using the following actuarial assumptions and other inputs:
Rate (%)Wage inflation 2.50 Salary increase, including wage inflation 4.00 - 14.00Cost of living 2.50 Long-term investments rate of return, net pension plan investment expenses, including price inflation 7.00
For determining the total pension liability, the post-retirement mortality tables for non-disabled retirees uses the 2006 central rates from the RP-2014 Employee Mortality Tables for males and females projected to 2018 using the MP-2017 projections scales, and then projected prospectively using the ultimate rates of the scale for all years. The pre-retirement off-duty mortality tables are adjusted to the 50% of the RP-2014 mortality tables for active employees. The on-duty mortality rate is 0.00015.
The assumptions that are based upon the actuary’s recommendations are internally consistent and reasonable based on the actual past experience of the plan.
The following presents the City’s net pension liability calculated using the discount rate of 7.00%, as well as what the City’s net pension liability would be if it were calculated using a discount rate that is one percentage point lower or higher than the current rate:
Sensitivity of the NPL:
1% DecreaseCurrent
Discount Rate 1% Increase6.00% 7.00% 8.00%
City's net pension liability $ 63,737,531 $ 37,751,619 $ 16,425,819
Remainder of page intentionally blank
NOTES TO FINANCIAL STATEMENTS December 31, 2020
170 City of Colorado Springs 2020 Annual Comprehensive Financial Report

Below is a schedule of changes in the net pension liability for the New Hire Fire Pension Plan for year ended December 31, 2020:
Total pension liability (TPL) - January 1, 2020 $ 182,354,848 Service cost 1,902,086 Interest on the TPL 12,524,201 Benefit changes — Differences between expected and actual experience of the TPL 3,755,612 Changes in assumptions — Benefit payments, including refunds of employee contributions (8,777,467) Net change in TPL 9,404,432
Total pension liability - December 31, 2020 191,759,280
Plan fiduciary net position (FNP) - January 1, 2020 138,638,938 Employer contributions 3,583,394 Employee contributions 936,275 Net investment income 19,700,611 Benefit payments, including refunds of employee contributions (8,777,467) Pension plan administrative expense (74,090) Net change in FNP 15,368,723
Plan fiduciary net position - December 31, 2020 154,007,661
Net pension liability $ 37,751,619
Plan fiduciary net position as a percentage of the total pension liability 80.31 %
Covered payroll $ 9,362,740
Net pension liability as a percentage of covered payroll 403.21 %
Remainder of page intentionally blank
NOTES TO FINANCIAL STATEMENTS December 31, 2020
City of Colorado Springs 2020 Annual Comprehensive Financial Report 171

New Hire Pension Plan - Police Component
Members in the New Hire Pension Plan - Police Component (New Hire Police Pension Plan) may be eligible for a normal retirement pension at any time after age 50, if the member has at least 25 years of service. The annual normal pension equals 2% of the member’s final average salary (for the past 39 payroll periods) for each full year of credited service up to ten years plus 2.75% for each full year thereafter with a maximum benefit of 75%. A member is eligible for an early retirement benefit after completion of 20 years of service and attainment of age 45. The early retirement benefit is reduced by 7.5% for each year that the member is less than age 50.
Cost-of-living adjustments begin on October 1 immediately before the retiree turns 60 or 10 years after benefits payment commence, whichever is earlier. The COLA increase reflects increases in the consumer price index but in no case can the increase be more than 3% for any one year.
Upon termination, a member may elect to have all contributions, along with 5% per annum, as interest, returned as a lump sum distribution. Alternatively, a member with at least 10 years of accredited service may leave contributions with the Plan and remain eligible for a retirement pension at age 50 equal to 2% of the member’s final average salary (for the past 39 payroll periods) for each full year of credited service up to ten years plus 2.75% for each full year thereafter with a maximum benefit of 75%.
The benefit recipients and members of the New Hire Police Pension Plan as of December 31, 2019 are as follows:
Retirees and beneficiaries 326 Inactive, non-retired members 22 Active members 257
The Plan sets contribution rates at a level that enables all benefits to be fully funded at the retirement date of all members within the plan as determined by the actuarial study. The City’s contribution rate shall never drop below the employee rate as set by the Board of the Fire and Police Pension Association. Eligible employees are required to contribute 8% of their FPPA-includable salary. For 2020, the City’s employer contribution rate was set at 21%. The City also contributed an additional amount into the plan of $961,397. Employer contributions recognized by the New Hire Police Pension Plan from the City were $6,457,477 for the year ended December 31, 2020.
The Plan is allocated between the governmental activities and the business-type activities based on contributions. The allocation for the year ended December 31, 2020 (a December 31, 2019 measurement date) was 97.6614% and 2.3386% between the governmental activities and the business-type activities respectively. This is an increase from the prior year in the governmental activities of 0.0970% and a corresponding decrease in the business-type activities.
Net Pension Liability, Pension Expense, Deferred Outflows of Resources and Deferred Inflows of Resources Related to Pensions: As of December 31, 2020, the City reported a liability of $60,393,270 for the New Hire Police Pension Plan net pension liability. The net pension liability was measured as of December 31, 2019, and the total pension liability used to calculate the net pension liability was determined by an actuarial valuation as of December 31, 2019.
NOTES TO FINANCIAL STATEMENTS December 31, 2020
172 City of Colorado Springs 2020 Annual Comprehensive Financial Report

For the year ended December 31, 2020, the City’s pension expense related to the New Hire Police Pension Plan was $16,467,793.
At December 31, 2020, the City reported deferred outflows of resources and deferred inflows of resources related to pensions for the New Hire Police Pension Plan from the following sources:
Deferred Outflowsof Resources
Deferred Inflowsof Resources
Differences between expected and actual experience $ 7,257,804 $ 1,868,571 Change of assumptions 7,838,249 — Net difference between projected and actual earnings on pension plan investments — 12,088,494 Contributions subsequent to the measurement date 6,457,477 — Total $ 21,553,530 $ 13,957,065
The $6,457,477 reported as deferred outflows of resources related to pensions, resulting from contributions made subsequent to the measurement date, will be recognized as a reduction to the net pension liability in the year ended December 31, 2021.
Other amounts reported as deferred outflows of resources and deferred inflows of resources related to pensions will be recognized in pension expense as follows:
Year EndedDecember 31,
Difference Between Expected and Actual
ExperienceChanges of
Assumptions
Net Difference Between Projected and Actual
Earnings on Investments
Net Effect of Amortized Deferred Amounts on
Pension Expense
2021 $ 2,618,673 $ 6,397,834 $ (3,114,993) $ 5,901,514
2022 2,770,560 1,440,415 (4,200,199) 10,776
2023 — — (191,733) (191,733)
2024 — — (4,581,569) (4,581,569)
Total $ 5,389,233 $ 7,838,249 $ (12,088,494) $ 1,138,988
The differences between expected and actual experience as well as changes of assumptions are amortized over a closed period equal to the average expected remaining service lives of active and inactive members in the plan. FPPA determined the average expected remaining service lives for active and inactive members at the beginning of the 2019 measurement period to be 2.7687 years. The difference between projected and actual investment experience is amortized over a closed five-year period.
Remainder of page intentionally blank
NOTES TO FINANCIAL STATEMENTS December 31, 2020
City of Colorado Springs 2020 Annual Comprehensive Financial Report 173

Actuarial assumptions: The total pension liability in the December 31, 2018 actuarial valuation was determined using the following actuarial assumptions and other inputs:
Rate (%)Wage inflation 2.50 Salary increase, including wage inflation 4.00 - 14.00Cost of living 2.50 Long-term investments rate of return, net pension plan investment expenses, including price inflation 7.00
For determining the total pension liability, the post-retirement mortality tables for non-disabled retirees uses the 2006 central rates from the RP-2014 Employee Mortality Tables for males and females projected to 2018 using the MP-2017 projections scales, and then projected prospectively using the ultimate rates of the scale for all years. The pre-retirement off-duty mortality tables are adjusted to the 50% of the RP-2014 mortality tables for active employees. The on-duty mortality rate is 0.00015.
The assumptions that are based upon the actuary’s recommendations are internally consistent and reasonable based on the actual past experience of the plan.
The following presents net pension liability calculated using the discount rate of 7.00%, as well as what the City’s net pension liability would be if it were calculated using a discount rate that is one percentage point lower or higher than the current rate:
Sensitivity of the NPL:
1% DecreaseCurrent
Discount Rate 1% Increase6.00% 7.00% 8.00%
City's net pension liability $ 120,228,018 $ 60,393,270 $ 11,791,709
Remainder of page intentionally blank
NOTES TO FINANCIAL STATEMENTS December 31, 2020
174 City of Colorado Springs 2020 Annual Comprehensive Financial Report

Below is a schedule of changes in the net pension liability for the New Hire Police Pension Plan for year ended December 31, 2020:
Total pension liability (TPL) - January 1, 2020 $ 383,230,807 Service cost 5,523,169 Interest on the TPL 26,516,398 Benefit changes — Differences between expected and actual experience of the TPL 8,879,893 Changes in assumptions — Benefit payments, including refunds of employee contributions (14,373,413) Net change in TPL 26,546,047
Total pension liability - December 31, 2020 409,776,854
Plan fiduciary net position (FNP) - January 1, 2020 311,369,449 Employer contributions 6,053,042 Employee contributions 2,000,225 Net investment income 44,477,485 Benefit payments, including refunds of employee contributions (14,373,413) Pension plan administrative expense (143,204) Net change in FNP 38,014,135
Plan fiduciary net position - December 31, 2020 349,383,584
Net pension liability $ 60,393,270
Plan fiduciary net position as a percentage of the total pension liability 85.26 %
Covered payroll $ 24,709,177
Net pension liability as a percentage of covered payroll 244.42 %
Statewide Defined Benefit Pension Plan
Plan Description: The Statewide Defined Benefit Plan is a cost-sharing multiple-employer defined benefit plan covering a substantial number of full-time employees of participating fire or police departments in the State of Colorado hired after April 8, 1978, provided that they are not already covered by a statutorily exempt plan. As of August 5, 2003, the Statewide Pension Plan may include clerical and other personnel from fire districts whose services are auxiliary to fire protection. The Statewide Pension Plan became effective January 1, 1980 and currently has 265 participating employer fire and police departments. Effective January 1, 1988, employers cannot withdraw from the plan per Colorado state statutes.
The Statewide Pension Plan is for City sworn fire and police employees hired after October 1, 2006. This plan is open to new employees. Any amendments to the benefit-related provisions of the Statewide Pension Plan may be made by the FPPA Board, only upon approval of at least 65% of the then active members in the plan with the exception of retirement age. Colorado state
NOTES TO FINANCIAL STATEMENTS December 31, 2020
City of Colorado Springs 2020 Annual Comprehensive Financial Report 175

statutes were amended to allow the FPPA Board to change the retirement age on an annual basis, depending upon the results of the actuarial valuation and other circumstances. The amended statutes state that retirement age should be no less than age 55 and no greater than age 60.
Members in the Statewide Pension Plan may be eligible for a normal retirement pension at any time after age 55, if the member has at least 25 years of service. The annual normal pension equals 2% of the member’s highest three years’ base salary year of credited service up to ten years, plus 2.5% for each year of service thereafter. A member is eligible for an early retirement benefit after completion of 30 years of service and attainment of age 50. The early retirement benefit equals the normal retirement benefit reduced on an actuarially equivalent basis.
Cost-of-living adjustments begin in October annually. The COLA increase reflects increases in the consumer price index but in no case can the increase be more than 3% for any one year.
Upon termination, a member may elect to have all contributions, along with 5% per annum, as interest, returned as a lump sum distribution. Alternatively, a member with at least 5 years of accredited service may leave contributions with the Plan and remain eligible for a retirement pension at age 55 equal to 2% of the member’s highest three years’ base salary for each full year of credited service up to ten years plus 2.5% for each full year thereafter.
The Plan sets contribution rates at a level that enables all benefits to be fully funded at the retirement date of all members within the plan as determined by the actuarial study. The contribution rates for this plan are set by state statute. Employer contribution rates can only be changed by amending state statute. Member contribution rates can be amended by state statute or by election of the membership. In 2014, the members elected to increase the member contribution rate to the plan beginning in 2015. Member contribution rates will increase by .5% annually through 2022 to a total of 12% of base salary. Employer contributions remained at 8% through December 31, 2020. Eligible employees contributed 10.50% of their FPPA-includable salary with the employer contribution rate at 8%. Employer contributions recognized by the Statewide Pension Plan from the City were $5,413,015 for the year ended December 31, 2020.
Net Pension Asset, Pension Expense, Deferred Outflows of Resources and Deferred Inflows of Resources Related to Pensions: As of December 31, 2020, the City reported an asset of $4,565,101 as its proportionate share of the Statewide Pension Plan net pension asset. The net pension asset was measured as of December 31, 2019, and the total pension liability used to calculate the net pension asset was determined by an actuarial valuation as of December 31, 2019. The City’s proportion of the net pension asset was based on the City’s contributions in relation to all participating employers in the plan.
At December 31, 2019, the City’s proportion was 8.0718%, which was an increase of 0.6518% from its proportion measured as of December 31, 2018. The City allocates its portion of the Statewide Pension Plan between governmental activities and business-type activities, based on contributions. This allocation for the year-ended December 31, 2020 (a December 31, 2019 measurement date) was 99.7877% and 0.2123% between the governmental activities and business-type activities respectively. This allocation is a decrease from the prior year in the governmental activities of 0.1034% and a corresponding increase in the business-type activities.
For the year ended December 31, 2020, the City’s pension expense related to the Statewide Pension Plan was $3,826,294.
NOTES TO FINANCIAL STATEMENTS December 31, 2020
176 City of Colorado Springs 2020 Annual Comprehensive Financial Report

At December 31, 2020, the City reported deferred outflows of resources and deferred inflows of resources related to pensions for the Statewide Pension Plan from the following sources:
Deferred Outflowsof Resources
Deferred Inflowsof Resources
Differences between expected and actual experience $ 15,449,139 $ 89,359 Change of assumptions 8,668,157 — Net difference between projected and actual earnings on pension plan investments — 7,176,449 Change in proportion 449,985 2,070,521 Contributions subsequent to the measurement date 5,413,015 — Total $ 29,980,296 $ 9,336,329
The $5,413,015 reported as deferred outflows of resources related to pensions, resulting from contributions made subsequent to the measurement date, will be recognized as a reduction in net pension liability in the year ended December 31, 2021. Other amounts reported as deferred outflows of resources and deferred inflows of resources related to pensions will be recognized in pension expense as follows:
Year EndedDecember 31,
Differences Between Expected and Actual
ExperienceChanges of
Assumptions
Net Difference Between Projected and Actual Earnings
on InvestmentsNet Changes in
Proportion
Net Effect of Amortized Deferred
Amounts on Pension Expense
2021 $ 1,601,963 $ 904,054 $ (1,794,112) $ (225,879) $ 486,026
2022 1,601,963 904,054 (1,794,112) (225,879) 486,026
2023 1,601,963 904,054 (1,794,112) (225,879) 486,026
2024 1,601,963 904,054 (1,794,113) (225,879) 486,025
2025 1,601,963 904,054 — (199,775) 2,306,242
Thereafter 7,349,965 4,147,887 — (517,245) 10,980,607
Total $ 15,359,780 $ 8,668,157 $ (7,176,449) $ (1,620,536) $ 15,230,952
The differences between expected and actual experience, changes of assumptions as well as the City’s change in their proportion are amortized over a closed period equal to the average expected remaining service lives of active and inactive members in the plan. FPPA determined the average expected remaining service lives for active and inactive members at the beginning of the 2019 measurement period to be 9.5881 years. The difference between projected and actual investment experience is amortized over a closed five-year period.
Remainder of page intentionally blank
NOTES TO FINANCIAL STATEMENTS December 31, 2020
City of Colorado Springs 2020 Annual Comprehensive Financial Report 177

Actuarial assumptions: The total pension liability in the December 31, 2019 actuarial valuation was determined using the following actuarial assumptions and other inputs:
Rate (%)Wage inflation 2.50 Salary increase, including wage inflation 4.25 - 11.25Cost of living 0.00Long-term investments rate of return, net pension plan investment expenses, including price inflation 7.00
For determining the total pension liability, the post-retirement mortality tables for non-disabled retirees uses the 2006 central rates from the RP-2014 Employee Mortality Tables for males and females projected to 2018 using the MP-2017 projections scales, and then projected prospectively using the ultimate rates of the scale for all years. The pre-retirement off-duty mortality tables are adjusted to the 50% of the RP-2014 mortality tables for active employees. The on-duty mortality rate is 0.00015.
The assumptions that are based upon the actuary’s recommendations are internally consistent and reasonable based on the actual past experience of the plan.
The following presents the City’s proportionate share net pension liability (asset) calculated using the discount rate of 7.00%, as well as what the City’s proportionate share of the net pension liability (asset) would be if it were calculated using a discount rate that is one percentage point lower or higher than the current rate:
Sensitivity of the NPL/(NPA):
1% DecreaseCurrent
Discount Rate 1% Increase6.00% 7.00% 8.00%
City's proportionate share of net pension liability (asset) $ 27,679,190 $ (4,565,101) $ (31,307,472)
Defined Contribution Plan
Statewide Money Purchase Plan Description: Per Senate Bill 15-028, Fire and Police Chiefs are allowed to opt out of participation in the defined benefit plans into an alternative pension plan. The alternative pension plan must be the FPPA Statewide Hybrid Plan, the Statewide Money Purchase Plan or a locally administered money purchase plan. The Statewide Money Purchase Plan is a qualified defined contribution plan under section 401(a) of the IRS code of 1986.
Statewide Money Purchase Plan Funding Policy: The employee and employer contributions rates are set at a minimum of 8%, or such higher rate as approved locally. The City chose to set the rates, at plan inception, for both employee and employer. Each contribute at a rate of 10% each. The City contributions to the FPPA Statewide Money Purchase Plan for the year ending December 31, 2020 was $678.
NOTES TO FINANCIAL STATEMENTS December 31, 2020
178 City of Colorado Springs 2020 Annual Comprehensive Financial Report

457 Plan Description: Per authority of a City Council resolution, uniformed members of the City may also voluntarily contribute to an ICMA or a FPPA 457 Plan, each an Internal Revenue Code of 1986 section 457. The ICMA plan is administered by ICMA Retirement Corporation and the Vantage Trust Company and the FPPA plan is administered by the FPPA and Fidelity Investments.
457 Funding Policy: The ICMA and FPPA 457 plans are funded by voluntary member contributions of up to a maximum limit set by the IRS ($19,500 annually for 2020 calendar year). In addition, employees are eligible to contribute an additional $6,500 annually if they are age 50 or older. There is an additional “pre-retirement” catch-up provision that allows employees to double their 457 contributions by funding an additional $19,500 if they are within three years of retirement. The City does not contribute to the ICMA or FPPA 457 plans.
I. Accounting Changes
GASB Statement No. 84, Fiduciary Activities, was implemented by the City during 2020. This statement establishes criteria for identifying fiduciary activities and guidance for reporting. It describes four fiduciary funds that should be reported, if applicable: (1) pension (and other employee benefit) trust funds, (2) investment trust funds, (3) private-purpose trust funds, and (4) custodial funds. Further direction was provided with GASB Statement No. 97, Certain Component Unit Criteria, and Accounting and Financial Reporting for Internal Revenue Code Section 457 Deferred Compensation Plans-An Amendment of GASB Statements No. 14 and No. 84 and a Supersession of GASB Statement No. 32, which amended, in part, GASB 84. After review of both statements, the City determined that its two Old Hire pension fund plans qualify as pension trust funds due to the amount of control held by the City. As such, two funds are now included as fiduciary activities with a beginning fiduciary net position of $131,195,449. Further, it was determined that items previously tracked and reported by the City in an agency fund no longer meet the requirements of fiduciary activities. This change resulted in the removal of $97,802 of assets and liabilities as fiduciary activities and are now reported as General Fund activity. As such, the beginning fiduciary net position was restated for these changes and is now retitled as net position restricted for pensions.
GASB Statement No. 88, Certain Disclosures Related to Debt, including Direct Borrowings and Direct Placements, was also implemented during 2020. This statement provided a definition of debt for purposes of the financial statements note disclosure. This expanded language establishes the concept of direct borrowing and direct placement, depending upon whether the agreement entered into is directly with a lender or an investor. While the City was largely already reporting information related to such transactions, GASB 88 requires that these transactions are now more transparent and include additional contractual information, including any collateral or finance-related obligations in the event of default or termination. These expanded footnotes can be reviewed in Note III.J.
GASB Statement No. 90, Majority Equity Interests, was implemented during 2020. This statement aims to provide consistency in the reporting of majority equity interests and improve the relevance of information related to certain component units. It defines a majority equity interest and specifies that a majority equity interest in a legally separate organization should be reported as an investment if a government's holding of the equity interest meets the definition of an investment. After review, the City has determined that it has no material amounts to report and therefore there was no impact to the financial statements for this implementation.
NOTES TO FINANCIAL STATEMENTS December 31, 2020
City of Colorado Springs 2020 Annual Comprehensive Financial Report 179

J. Subsequent Events
On November 10, 2020, City Council approved changes to the natural gas, electric, water, and wastewater rate schedules effective January 1, 2021. On January 26, 2021 City Council approved changes to the electric cost adjustment, gas cost adjustment, and supply credit rates effective February 1, 2021.
In mid-February 2021, the City and much of the country experienced record low temperatures. The resulting challenges in the delivery of natural gas caused natural gas prices to increase to unprecedented levels. During this period, Utilities incurred additional electric and natural gas fuel costs of approximately $144.0 million. To recover these expenses, City Council approved increases to the gas and electric cost adjustment rates effective March 11 and April 1, 2021, respectively.
During March 2021, the American Rescue Plan Act was signed into law. This $1.9 trillion federal relief or stimulus package includes $350.0 billion allocated to state, local, and tribal governments. Although the City is still determining the amount of expected funding, City leadership is examining the best use of the funds to support the local economy. Further guidance on applicable uses is expected from the federal government in May 2021, around the time the first round of funding is expected to be received by the City. The second round of funding must be provided no later than twelve months after the first round. Spending is allowed through December 31, 2024.
Remainder of page intentionally blank
NOTES TO FINANCIAL STATEMENTS December 31, 2020
180 City of Colorado Springs 2020 Annual Comprehensive Financial Report

REQUIRED SUPPLEMENTARY INFORMATION
City of Colorado Springs 2020 Annual Comprehensive Financial Report 181

REQUIRED SUPPLEMENTARY INFORMATION CITY OF COLORADO SPRINGSSCHEDULE OF THE CITY'S PROPORTIONATE SHARE COLORADOOF THE NET PENSION LIABILITY EXHIBIT 16Years ended December 31, (PAGE 1 OF 3)
Colorado PERA Local Government Division Trust Fund
2020 2019 2018 2017 2016 2015Proportionate share of total pension liability $ 1,928,523,285 $ 1,893,691,502 $ 1,920,057,454 $ 1,896,397,997 $ 1,742,453,960 $ 1,725,945,784 Proportionate share of fiduciary net position (1,663,608,112) (1,438,354,956) (1,523,903,793) (1,396,620,395) (1,339,384,263) (1,393,102,634) Proportionate share of net pension liability $ 264,915,173 $ 455,336,546 $ 396,153,661 $ 499,777,602 $ 403,069,697 $ 332,843,150
Fiduciary net position as a percentage of total pension liability 86.26 % 75.96 % 79.37 % 73.65 % 76.87 % 80.72 %
Covered payroll $ 249,094,029 $ 236,427,277 $ 225,147,540 $ 216,649,184 $ 208,704,241 $ 204,135,871
Net pension liability as a percentage of covered payroll 106.35 % 192.59 % 175.95 % 230.69 % 193.13 % 163.05 %
Proportion of net pension liability 36.2208 % 36.2179 % 35.5796 % 37.0112 % 36.5901 % 37.1349 %
* Notes to the Required Supplementary Information regarding changes in assumptions and benefits can be found on page three of this exhibit.
* Information determined under the provisions of GASB 68 is not available for years prior to 2015. In future reports, additional years will be added until 10 years of historical data are presented. Information presented in this schedule has been determined as of the measurement date in accordance with GASB Statement No. 68.
182 City of Colorado Springs 2020 Annual Comprehensive Financial Report

REQUIRED SUPPLEMENTARY INFORMATION CITY OF COLORADO SPRINGSSCHEDULE OF CITY'S CONTRIBUTIONS COLORADOYears ended December 31, EXHIBIT 16
(PAGE 2 OF 3)
Colorado PERA Local Government Division Trust Fund
Statutorily Determined Contribution
Actual Contribution
Contribution Deficiency (Excess) Covered Payroll
Actual Contributions as a
% of Covered Payroll
2020 $ 33,908,959 $ 33,908,959 $ — $ 261,964,997 12.94
2019 32,516,796 32,516,796 — 249,094,029 13.05
2018 30,705,118 30,705,118 — 236,427,277 12.99
2017 28,775,859 28,775,859 — 225,147,540 12.78
2016 27,723,419 27,723,419 — 216,649,184 12.80
2015 26,548,367 26,548,367 — 208,704,241 12.72
* Notes to the Required Supplementary Information regarding changes in assumptions and benefits can be found on page three of this exhibit.
* Information determined under the provisions of GASB 68 is not available for years prior to 2015. In future reports, additional years will be added until 10 years of historical data are presented. Information presented in this schedule has been determined as of the City's fiscal year end December 31 in accordance with GASB Statement No. 68.
City of Colorado Springs 2020 Annual Comprehensive Financial Report 183

NOTES TO THE CITY OF COLORADO SPRINGSREQUIRED SUPPLEMENTARY INFORMATION COLORADOYear ended December 31, 2020 EXHIBIT 16
(PAGE 3 OF 3)
Colorado PERA Local Government Division Trust Fund
Changes of assumptions - • 2020 - Senate Bill (SB) 18-200 was enacted on June 4, 2018, which included the adoption of the automatic adjustment
provision (AAP). The following changes reflect the anticipated adjustments resulting from the 2018 AAP assessment, statutorily recognized July 1, 2019, and effective July 1, 2020:
-Member contribution rates increase by 0.50%-Employer contribution rates increase by 0.50%-Annual Increase (AI) cap is lowered from 1.50% per year to 1.25% per year.
House Bill (HB) 19-1217, enacted May 20, 2019, repealed the member contribution increases scheduled forthe Local Government Division pursuant to SB 18-200.
• 2019 - The following major changes were made to plan provisions as part of SB 18-200: Member contribution rates increase by 0.75% effective July 1, 2019, an additional 0.75% effective July 1, 2020 and an additional 0.50% effective July 14, 2021. (See subsequent event regarding HB 19-1217 for more information.)
• 2017 - The investment return assumption was lowered from 7.50% to 7.25%. The price inflation assumption was lowered from 2.80% to 2.40%. The wage inflation assumption was lowered from 3.90% to 3.50%. The post-retirement mortality assumption for healthy lives was changed to the RP-2014 Healthy Annuitant Mortality Table with adjustments for credibility and gender adjustments of 73.0% factor applied to ages below 80 and a 108.0% factor applied to age 80 and above, projected to 2018, for males and a 78.0% factor applied to ages below 80 and a 109.0% factor applied to age 80 and above, projected to 2020, for females. For disabled retirees, the mortality assumption was changed to reflect 90.0% of RP-2014 Disabled Retiree Mortality Table. The mortality assumption for active members was changed to RP-2014 White Collar Employee Mortality Table, a table specifically developed for actively working people. To allow for an appropriated margin of improved mortality prospectively, the mortality rates incorporate a 70.0% factor applied to male rated and 55.0% factor applied to female rates. The rates of retirement, withdrawal and disability were revised to reflect more closely actual experience.
Changes in benefits - • 2019 - The following major changes were made to plan provisions as part of SB 18-200: The number of years used in
the Highest Average Salary calculation for non-vested members as of January 1, 2020, increases from three to five years for the Local Government Division. Annual increase (AI) cap is lowered from 2.00% per year to 1.50% per year. Initial AI waiting period is extended from one year after retirement to three years after retirement
Subsequent event - • 2020 - Subsequent to December 31, 2019, as a result of the COVID-19 pandemic, the global economic outlook has
changed. The duration and full effects of the pandemic are currently unknown, as the global picture continues to evolve. Although unprecedented federal fiscal and monetary stimulus have helped to stabilize and soften the impact of economic contraction, the near-term negative impact on PERA's investment portfolio, as well the short-medium term impact on the Trust Fund's membership and demographics, remains uncertain.
• 2019 - During the 2019 legislative session, the Colorado General Assembly passed HB 19-1217: PERA Public Employees' Retirement Association Local Government Division Member Contribution Rate. The bill was signed into law on May 20, 2019, and eliminated the 2.00% increase in the contribution rate required by SB 18-200 for members in the LGDTF. The impact of this change will be reflected in the subsequent fiscal year, for the measurement date December 31, 2019.
184 City of Colorado Springs 2020 Annual Comprehensive Financial Report

REQUIRED SUPPLEMENTARY INFORMATION CITY OF COLORADO SPRINGSSCHEDULE OF THE CHANGES IN THE COLORADOCITY'S NET PENSION LIABILITY EXHIBIT 17Years ended December 31, (PAGE 1 OF 4)
Old Hire Fire Defined Benefit Pension Plan
2020 2019 2018 2017 2016 2015Total Pension Liability (TPL) - January 1 $ 94,066,095 $ 95,398,783 $ 97,526,320 $ 98,527,662 $ 94,992,823 $ 96,220,416
Service cost — — — — — —
Interest on the TPL 6,731,045 6,853,477 7,014,133 7,091,577 6,824,022 6,916,644
Benefit changes — — — — — — Difference between expected and actual experience of the TPL 7,956,514 — (985,133) — (1,442,156) —
Changes in assumptions 7,153,963 — — — 6,312,216 — Benefit payments, including refunds of employee contributions (8,796,692) (8,186,165) (8,156,537) (8,092,919) (8,159,243) (8,144,237)
Net change in TPL 13,044,830 (1,332,688) (2,127,537) (1,001,342) 3,534,839 (1,227,593) Total Pension Liability - December 31 107,110,925 94,066,095 95,398,783 97,526,320 98,527,662 94,992,823
Plan Fiduciary Net Position (FNP) - January 1 68,842,799 74,667,694 70,493,833 73,326,035 78,504,844 80,007,825
Employer contributions 2,328,416 2,286,697 2,286,697 1,639,319 1,639,319 1,467,740
Employee contributions — — — — — —
Net investment income 8,573,590 117,863 10,078,024 3,737,918 1,450,492 5,299,069 Benefit payments, including refunds of employee contributions (8,796,692) (8,186,165) (8,156,537) (8,092,919) (8,159,243) (8,144,237) Pension plan administrative expense (37,711) (43,290) (34,323) (116,520) (109,377) (125,553)
Net change in FNP 2,067,603 (5,824,895) 4,173,861 (2,832,202) (5,178,809) (1,502,981) Plan Fiduciary Net Position - December 31 70,910,402 68,842,799 74,667,694 70,493,833 73,326,035 78,504,844
Net pension liability $ 36,200,523 $ 25,223,296 $ 20,731,089 $ 27,032,487 $ 25,201,627 $ 16,487,979
Fiduciary net position as a percentage of total pension liability 66.20 % 73.19 % 78.27 % 72.28 % 74.42 % 82.64 %
Covered payroll $ — $ — $ — $ — $ — $ —
Net pension liability as a percentage of covered payroll N/A N/A N/A N/A N/A N/A
Notes to the Required Supplementary Information
Changes in benefits None
Changes of assumptions 2020 - Investment rate of return decreased from 7.50% to 6.50%. Post-retirement mortality table updated to 2006 central rates from the RP-2014 Annuitant Mortality Tables for males and females projected to 2018 using the MP-2017 projection scales, and then projected prospectively using the ultimate rates of the scale for all years.
2017 - Real rate of return increased from 4.50% to 5.00%. Post-retirement mortality table updated to RP-2014 from RP-2000. Administrative expenses paid in the prior two fiscal years are included in the calculated annual contribution.
2016 - Price inflation changed from 3.00% to 2.50%. Post-retirement mortality rate was based on RP-2014 mortality tables for blue collar employees with scale BB.
* Information determined under the provisions of GASB 68 is not available for years prior to 2015. In future reports, additional years will be added until 10 years of historical data are presented. Information presented in this schedule has been determined as of the measurement date in accordance with GASB Statement No. 68.
City of Colorado Springs 2020 Annual Comprehensive Financial Report 185

REQUIRED SUPPLEMENTARY INFORMATION CITY OF COLORADO SPRINGSSCHEDULE OF CITY'S CONTRIBUTIONS COLORADOYears ended December 31, EXHIBIT 17
(PAGE 2 OF 4)
Old Hire Fire Defined Benefit Pension Plan
Actuarially Determined Contribution
Actual Contribution
Contribution Deficiency (Excess)
Covered Payroll
Actual Contributions
as a % of Covered Payroll
2020 $ 2,328,416 $ 2,328,416 $ — $ — N/A
2019 2,328,416 2,328,416 — — N/A
2018 2,286,697 2,286,697 — — N/A
2017 2,286,697 2,286,697 — — N/A
2016 1,639,319 1,639,319 — — N/A
2015 1,639,319 1,639,319 — — N/A
Notes to the Required Supplementary Information
Valuation date: January 1, 2020
Methods and assumptions used to determine contributions
Actuarial cost method Entry age
Amortization method Level dollar, open
Remaining amortization period 19 years
Inflation 2.50%
Salary increase N/A
Investment rate of return 6.50%
Asset valuation method 5-year smoothed fair value
Retirement age 50 years of age
Mortality Post-retirement: 2006 central rates from the RP-2014 Annuitant Mortality Tables for males and females projected to 2018 using the MP-2017 projection scales, and then projected prospectively using the ultimate rates of the scale for all years.
* Information determined under the provisions of GASB 68 is not available for years prior to 2015. In future reports, additional years will be added until 10 years of historical data are presented. Information presented in this schedule has been determined as of the City's fiscal year end December 31 in accordance with GASB Statement No. 68.
186 City of Colorado Springs 2020 Annual Comprehensive Financial Report

REQUIRED SUPPLEMENTARY INFORMATION CITY OF COLORADO SPRINGSSCHEDULE OF THE CHANGES IN THE COLORADOCITY'S NET PENSION LIABILITY EXHIBIT 17Years ended December 31, (PAGE 3 OF 4)
Old Hire Police Defined Benefit Pension Plan
2020 2019 2018 2017 2016 2015Total Pension Liability (TPL) - January 1 $ 79,060,305 $ 80,146,168 $ 81,444,517 $ 82,286,576 $ 80,928,590 $ 81,933,276
Service cost — — — — — —
Interest on the TPL 5,670,286 5,758,923 5,859,424 5,922,411 5,813,424 5,891,079
Benefit changes — — — — — — Difference between expected and actual experience of the TPL 2,284,694 — (397,839) — (2,591,637) —
Changes in assumptions 6,035,154 — — — 5,094,537 — Benefit payments, including refunds of employee contributions (7,040,254) (6,844,786) (6,759,934) (6,764,470) (6,958,338) (6,895,765)
Net change in TPL 6,949,880 (1,085,863) (1,298,349) (842,059) 1,357,986 (1,004,686) Total Pension Liability - December 31 86,010,185 79,060,305 80,146,168 81,444,517 82,286,576 80,928,590
Plan Fiduciary Net Position (FNP) - January 1 58,247,082 63,196,268 59,630,971 61,865,742 66,224,327 67,207,764
Employer contributions 1,850,964 1,833,691 1,833,691 1,466,935 1,466,935 1,541,080
Employee contributions — — — — — 6,534
Net investment income 7,258,087 98,302 8,520,414 3,161,491 1,225,181 4,471,258 Benefit payments, including refunds of employee contributions (7,040,254) (6,844,786) (6,759,934) (6,764,470) (6,958,338) (6,895,765)
Pension plan administrative expense (30,832) (36,393) (28,874) (98,727) (92,363) (106,544)
Net change in FNP 2,037,965 (4,949,186) 3,565,297 (2,234,771) (4,358,585) (983,437) Plan Fiduciary Net Position - December 31 60,285,047 58,247,082 63,196,268 59,630,971 61,865,742 66,224,327
Net pension liability $ 25,725,138 $ 20,813,223 $ 16,949,900 $ 21,813,546 $ 20,420,834 $ 14,704,263
Fiduciary net position as a percentage of total pension liability 70.09 % 73.67 % 78.85 % 73.22 % 75.18 % 81.83 %
Covered payroll $ — $ — $ — $ — $ — $ 61,878
Net pension liability as a percentage of covered payroll N/A N/A N/A N/A N/A 23763.31 %
Notes to the Required Supplementary Information
Changes in benefits None
Changes of assumptions 2020 - Investment rate of return decreased from 7.50% to 6.50%. Post-retirement mortality table updated to 2006 central rates from the RP-2014 Annuitant Mortality Tables for males and females projected to 2018 using the MP-2017 projection scales, and then projected prospectively using the ultimate rates of the scale for all years.
2017 - Real return increased from 4.50% to 5.00%. Post-retirement mortality table updated to RP-2014 from RP-2000. Administrative expenses paid in the prior two fiscal years are included in the calculated annual contribution.
2016 - Price inflation changed from 3.00% to 2.50%. Post-retirement mortalility rate was based on RP-2014 mortalility tables for blue collar employees with scale BB.
* Information determined under the provisions of GASB 68 is not available for years prior to 2015. In future reports, additional years will be added until 10 years of historical data are presented. Information presented in this schedule has been determined as of the measurement date in accordance with GASB Statement No. 68.
City of Colorado Springs 2020 Annual Comprehensive Financial Report 187

REQUIRED SUPPLEMENTARY INFORMATION CITY OF COLORADO SPRINGSSCHEDULE OF CITY'S CONTRIBUTIONS COLORADOYears ended December 31, EXHIBIT 17
(PAGE 4 OF 4)
Old Hire Police Defined Benefit Pension Plan
Actuarially Determined Contribution
Actual Contribution
Contribution Deficiency (Excess)
Covered Payroll
Actual Contributions
as a % of Covered Payroll
2020 $ 1,850,964 $ 1,850,964 $ — $ — N/A
2019 1,850,964 1,850,964 — — N/A
2018 1,836,343 1,836,343 — — N/A
2017 1,833,691 1,833,691 — — N/A
2016 1,466,935 1,466,935 — — N/A
2015 1,466,935 1,466,935 — — N/A
Notes to the Required Supplementary Information
Valuation date: January 1, 2020
Methods and assumptions used to determine contributions
Actuarial cost method Entry age
Amortization method Level dollar, open
Remaining amortization period 19 years
Inflation 2.50%
Salary increase N/A
Investment rate of return 6.50%
Asset valuation method 5-year smoothed fair value
Retirement age 50 years of age
Mortality Post-retirement: 2006 central rates from the RP-2014 Annuitant Mortality Tables for males and females projected to 2018 using the MP-2017 projection scales, and then projected prospectively using the ultimate rates of the scale for all years.
* Information determined under the provisions of GASB 68 is not available for years prior to 2015. In future reports, additional years will be added until 10 years of historical data are presented. Information presented in this schedule has been determined as of the City's fiscal year end December 31 in accordance with GASB Statement No. 68.
188 City of Colorado Springs 2020 Annual Comprehensive Financial Report

REQUIRED SUPPLEMENTARY INFORMATION CITY OF COLORADO SPRINGSSCHEDULE OF THE CHANGES IN THE COLORADOCITY'S NET PENSION LIABILITY EXHIBIT 18Years ended December 31, (PAGE 1 OF 4)
New Hire Pension Plan - Fire Component
2020 2019 2018 2017 2016 2015Total Pension Liability (TPL) - January 1 $ 182,354,848 $ 168,492,702 $ 163,542,442 $ 157,971,179 $ 145,875,351 $ 138,255,953
Service cost 1,902,086 2,007,404 1,872,966 2,129,584 2,350,743 2,436,526
Interest on the TPL 12,524,201 12,196,763 12,030,879 11,644,318 11,152,618 10,261,170
Benefit changes — — — — — — Difference between expected and actual experience of the TPL 3,755,612 (915,934) (819,178) (645,848) 55,903 238,938
Changes in assumptions — 8,912,225 — — 4,765,138 — Benefit payments, including refunds of employee contributions (8,777,467) (8,338,312) (8,134,407) (7,556,791) (6,228,574) (5,317,236)
Net change in TPL 9,404,432 13,862,146 4,950,260 5,571,263 12,095,828 7,619,398 Total Pension Liability - December 31 191,759,280 182,354,848 168,492,702 163,542,442 157,971,179 145,875,351
Plan Fiduciary Net Position (FNP) - January 1 138,638,938 142,035,779 126,527,898 123,154,436 122,730,229 115,691,126
Employer contributions 3,583,394 4,058,332 4,181,089 3,485,586 3,437,596 3,341,129
Employee contributions 936,275 923,455 1,083,453 1,045,342 1,202,513 1,278,915
Net investment income 19,700,611 33,950 18,445,141 6,569,905 2,206,766 7,924,723 Benefit payments, including refunds of employee contributions (8,777,467) (8,338,312) (8,134,407) (7,556,791) (6,228,574) (5,317,236)
Pension plan administrative expense (74,090) (74,266) (67,395) (209,340) (194,094) (195,429)
Other — — — 38,760 — 7,001
Net change in FNP 15,368,723 (3,396,841) 15,507,881 3,373,462 424,207 7,039,103 Plan Fiduciary Net Position - December 31 154,007,661 138,638,938 142,035,779 126,527,898 123,154,436 122,730,229
Net pension liability $ 37,751,619 $ 43,715,910 $ 26,456,923 $ 37,014,544 $ 34,816,743 $ 23,145,122
Fiduciary net position as a percentage of total pension liability 80.31 % 76.03 % 84.30 % 77.37 % 77.96 % 84.13 %
Covered payroll $ 9,362,740 $ 9,234,540 $ 9,517,994 $ 10,367,032 $ 11,910,879 $ 12,789,129
Net pension liability as a percentage of covered payroll 403.21 % 473.40 % 277.97 % 357.04 % 292.31 % 180.97 %
Notes to the Required Supplementary Information
Changes in benefits None
Changes of assumptions 2019 - Investment rate of return changed from 7.50% to 7.00%. 2006 central rates from the RP-2014 Employee Mortality Tables for males and females projected to 2018 using the MP-2017 projection scales, and then projected prospectively using the ultimate rates of the scale for all years, 50% multiplier for off-duty mortality
2017 - Real return increased from 4.50% to 5.00%. Post-retirement mortality table updated to RP-2014 from RP-2000. Administrative expenses paid in the prior two fiscal years are included in the calculated annual contribution.
2016 - Price inflation changed from 3.00% to 2.50%. Post-retirement mortality rate was based on RP-2014 mortality tables for blue collar employees with scale BB.
* Information determined under the provisions of GASB 68 is not available for years prior to 2015. In future reports, additional years will be added until 10 years of historical data are presented. Information presented in this schedule has been determined as of the measurement date in accordance with GASB Statement No. 68.
City of Colorado Springs 2020 Annual Comprehensive Financial Report 189

REQUIRED SUPPLEMENTARY INFORMATION CITY OF COLORADO SPRINGSSCHEDULE OF CITY'S CONTRIBUTIONS COLORADOYears ended December 31, EXHIBIT 18
(PAGE 2 OF 4)
New Hire Pension Plan - Fire Component
Actuarially Determined Contribution
Actual Contribution
Contribution Deficiency (Excess)
Covered Payroll
Actual Contributions
as a % of Covered Payroll
2020 $ 4,788,124 $ 4,788,124 $ — $ 9,765,687 49.03
2019 3,562,759 3,562,759 — 9,362,740 38.05
2018 4,071,111 4,071,111 — 9,234,540 44.09
2017 4,207,271 4,207,271 — 9,517,994 44.20
2016 3,477,722 3,477,722 — 10,367,032 33.55
2015 3,444,712 3,444,712 — 11,910,879 28.92
Notes to the Required Supplementary Information
Valuation date: January 1, 2019
Methods and assumptions used to determine contributions
Actuarial cost method Entry age
Amortization method Level dollar, closed
Remaining amortization period 21 years
Inflation 2.50%
Salary increase 4.00 - 14.00% including inflation
Investment rate of return 7.00%
Asset valuation 5 year smoothed fair value
Retirement age Age based rates for members with more than 25 years combined service & age starting at age 55 with 100% at age 60 years
Mortality Pre-retirement: 2006 central rates from the RP‑2014 Employee Mortality Tables for males and females projected to 2018 using the MP‑2017 projection scales, and then projected prospectively using the ultimate rates of the scale for all years, 50% multiplier for off‑duty mortality.
Post-retirement: 2006 central rates from the RP‑2014 Annuitant Mortality Tables for males and females projected to 2018 using the MP‑2017 projection scales, and then projected prospectively using the ultimate rates of the scale for all years.
* Information determined under the provisions of GASB 68 is not available for years prior to 2015. In future reports, additional years will be added until 10 years of historical data are presented. Information presented in this schedule has been determined as of the City's fiscal year end December 31 in accordance with GASB Statement No. 68.
190 City of Colorado Springs 2020 Annual Comprehensive Financial Report

REQUIRED SUPPLEMENTARY INFORMATION CITY OF COLORADO SPRINGSSCHEDULE OF THE CHANGES IN THE COLORADOCITY'S NET PENSION LIABILITY EXHIBIT 18Years ended December 31, (PAGE 3 OF 4)
New Hire Pension Plan - Police Component
2020 2019 2018 2017 2016 2015Total Pension Liability (TPL) - January 1 $ 383,230,807 $ 342,817,503 $ 331,007,540 $ 319,975,168 $ 297,810,707 $ 281,166,840
Service cost 5,523,169 5,527,257 5,320,575 5,823,050 6,291,613 6,226,828
Interest on the TPL 26,516,398 25,073,851 24,542,529 23,779,327 22,785,151 20,973,736
Benefit changes — — — — — — Difference between expected and actual experience of the TPL 8,879,893 4,145,156 (5,184,926) (6,911,997) (4,663,822) (1,295,803)
Changes in assumptions — 19,566,442 — — 7,939,475 — Benefit payments, including refunds of employee contributions (14,373,413) (13,899,402) (12,868,215) (11,658,008) (10,187,956) (9,260,894)
Net change in TPL 26,546,047 40,413,304 11,809,963 11,032,372 22,164,461 16,643,867
Total Pension Liability - December 31 409,776,854 383,230,807 342,817,503 331,007,540 319,975,168 297,810,707
Plan Fiduciary Net Position (FNP) - January 1 311,369,449 315,606,098 277,111,969 264,726,596 260,252,125 242,667,157
Employer contributions 6,053,042 7,590,899 8,433,311 7,512,099 7,916,242 7,728,841
Employee contributions 2,000,225 2,222,616 2,319,332 2,628,533 2,493,427 2,830,620
Net investment income 44,477,485 (4,868) 40,741,455 14,354,620 4,665,140 16,694,742 Benefit payments, including refunds of employee contributions (14,373,413) (13,899,402) (12,868,215) (11,658,008) (10,187,956) (9,260,894)
Pension plan administrative expense (143,204) (145,894) (131,754) (451,871) (412,382) (408,341)
Net change in FNP 38,014,135 (4,236,649) 38,494,129 12,385,373 4,474,471 17,584,968 Plan Fiduciary Net Position - December 31 349,383,584 311,369,449 315,606,098 277,111,969 264,726,596 260,252,125
Net pension liability $ 60,393,270 $ 71,861,358 $ 27,211,405 $ 53,895,571 $ 55,248,572 $ 37,558,582
Fiduciary net position as a percentage of total pension liability 85.26 % 81.25 % 92.06 % 83.72 % 82.73 % 87.39 %
Covered payroll $ 24,709,177 $ 23,500,297 $ 24,114,374 $ 26,439,948 $ 28,615,723 $ 30,066,196
Net pension liability as a percentage of covered payroll 244.42 % 305.79 % 112.84 % 203.84 % 193.07 % 124.92 %
Notes to the Required Supplementary Information
Changes in benefits None
Changes of assumptions 2019 - Investment rate of return changed from 7.50% to 7.00%. Post-retirement mortality table updated to 2006 central rates from the RP-2014 Employee Mortality Tables for males and females projected to 2018 using the MP-2017 projection scales, and then projected prospectively using the ultimate rates of the scale for all years, 50% multiplier for off-duty mortality
2017 - Real return increased from 4.50% to 5.00%. Post-retirement mortality table updated to RP-2014 from RP-2000. Administrative expenses paid in the prior two fiscal years are included in the calculated annual contribution.
2016 - Price inflation changed from 3.00% to 2.50%. Post-retirement mortality rate was based on RP-2014 mortality tables for blue collar employees with scale BB.
* Information determined under the provisions of GASB 68 is not available for years prior to 2015. In future reports, additional years will be added until 10 years of historical data are presented. Information presented in this schedule has been determined as of the measurement date in accordance with GASB Statement No. 68.
City of Colorado Springs 2020 Annual Comprehensive Financial Report 191

REQUIRED SUPPLEMENTARY INFORMATION CITY OF COLORADO SPRINGSSCHEDULE OF CITY'S CONTRIBUTIONS COLORADOYears ended December 31, EXHIBIT 18
(PAGE 4 OF 4)
New Hire Pension Plan - Police Component
Actuarially Determined Contribution
Actual Contribution
Contribution Deficiency (Excess)
Covered Payroll
Actual Contributions
as a % of Covered Payroll
2020 $ 6,457,477 $ 6,457,477 $ — $ 25,086,796 25.74
2019 6,026,386 6,026,386 — 24,709,177 24.39
2018 7,607,860 7,607,860 — 23,500,297 32.37
2017 8,471,261 8,471,261 — 24,114,374 35.13
2016 7,527,907 7,527,907 — 26,439,948 28.47
2015 7,969,055 7,969,055 — 28,615,723 27.85
Notes to the Required Supplementary Information
Valuation date: January 1, 2019
Methods and assumptions used to determine contributions
Actuarial cost method Entry age
Amortization method Level dollar, closed
Remaining amortization period 21 years
Inflation 2.50%
Salary increase 4.00 - 14.00% including inflation
Investment rate of return 7.00%
Asset valuation 5 year smoothed fair value
Retirement age Age based rates for members with more than 25 years combined service & age starting at age 50 with 100% at age 55 years.
Mortality Pre-retirement: 2006 central rates from the RP‑2014 Employee Mortality Tables for males and females projected to 2018 using the MP‑2017 projection scales, and then projected prospectively using the ultimate rates of the scale for all years, 50% multiplier for off‑duty mortality.
Post-retirement: 2006 central rates from the RP‑2014 Annuitant Mortality Tables for males and females projected to 2018 using the MP‑2017 projection scales, and then projected prospectively using the ultimate rates of the scale for all years.
* Information determined under the provisions of GASB 68 is not available for years prior to 2015. In future reports, additional years will be added until 10 years of historical data are presented. Information presented in this schedule has been determined as of the City's fiscal year end December 31 in accordance with GASB Statement No. 68.
192 City of Colorado Springs 2020 Annual Comprehensive Financial Report

REQUIRED SUPPLEMENTARY INFORMATION CITY OF COLORADO SPRINGSSCHEDULE OF THE CITY'S PROPORTIONATE SHARE COLORADOOF THE NET PENSION LIABILITY (ASSET) EXHIBIT 19Years ended December 31, (PAGE 1 OF 3)
Fire & Police Pension Association Statewide Defined Benefit Pension Plan
2020 2019 2018 2017 2016 2015Proportionate share of total pension liability $ 235,645,678 $ 196,860,692 $ 170,806,127 $ 153,221,012 $ 133,609,555 $ 115,980,297 Proportionate share of fiduciary net position (240,210,779) (187,479,815) (181,634,116) (150,482,259) (133,737,080) (123,899,253) Proportionate share of net pension liability (asset) $ (4,565,101) $ 9,380,877 $ (10,827,989) $ 2,738,753 $ (127,525) $ (7,918,956)
Fiduciary net position as a percentage of total pension liability (asset) 101.94 % 95.23 % 106.34 % 98.21 % 100.10 % 106.83 %
Covered payroll $ 59,417,629 $ 49,702,739 $ 43,974,999 $ 38,790,638 $ 35,068,719 $ 31,535,933
Net pension liability (asset) as a percentage of covered payroll 7.68 % 18.87 % 24.62 % 7.06 % 0.36 % 25.11 %
Proportion of net pension liability (asset) 8.0718 % 7.4200 % 7.5265 % 7.5795 % 7.2340 % 7.0168 %
* Notes to the Required Supplementary Information regarding changes in assumptions and benefits can be found on page three of this exhibit.
* Information determined under the provisions of GASB 68 is not available for years prior to 2015. In future reports, additional years will be added until 10 years of historical data are presented. Information presented in this schedule has been determined as of the measurement date in accordance with GASB Statement No. 68.
City of Colorado Springs 2020 Annual Comprehensive Financial Report 193

REQUIRED SUPPLEMENTARY INFORMATION CITY OF COLORADO SPRINGSSCHEDULE OF CITY'S CONTRIBUTIONS COLORADOYears ended December 31, EXHIBIT 19
(PAGE 2 OF 3)
Fire & Police Pension Association Statewide Defined Benefit Pension Plan
Statutorily Determined Contribution
Actual Contribution
Contribution Deficiency (Excess) Covered Payroll
Actual Contributions
as a % of Covered Payroll
2020 $ 5,413,015 $ 5,413,015 $ — $ 69,522,397 7.79
2019 4,841,239 4,841,239 — 59,417,629 8.15
2018 4,076,278 4,076,278 — 49,702,739 8.20
2017 3,579,520 3,579,520 — 43,974,999 8.14
2016 3,158,425 3,158,425 — 38,790,638 8.14
2015 2,976,381 2,976,381 — 35,068,719 8.49
* Notes to the Required Supplementary Information regarding changes in assumptions and benefits can be found on page three of this exhibit.
* Information determined under the provisions of GASB 68 is not available for years prior to 2015. In future reports, additional years will be added until 10 years of historical data are presented. Information presented in this schedule has been determined as of the City's fiscal year end December 31 in accordance with GASB Statement No. 68.
194 City of Colorado Springs 2020 Annual Comprehensive Financial Report

NOTES TO THE CITY OF COLORADO SPRINGSREQUIRED SUPPLEMENTARY INFORMATION COLORADOYear ended December 31, 2020 EXHIBIT 19
(PAGE 3 OF 3)
Fire & Police Pension Association Statewide Defined Benefit Pension Plan
Changes of assumptions - • 2019 - The discount rate used in the valuation of the total pension liability changed from 7.50% to 7.00%• 2017 - Effective January 1, 2016, the post-retirement mortality assumption for healthy lives was changed to the
RP-2014 Healthy Annuitant Mortality Table with adjustments for blue collar employees with scale BB. Beginning in 2015, members elected to increase member contribution rated 0.50% annually through 2022 when the contribution rate will reach 12.00%. Employer contribution rates will remain at 8.00%.
• 2016 - Price inflation changed from 3.00% to 2.50%. Post-retirement mortality rate was based on RP-2014 mortality tables for blue collar employees with scale BB.
Changes in benefits - There are no changes to benefits.
Subsequent event -• 2020 - House Bill 20-1044 was signed into law on April 1, 2020. Included in the bill is a provision to increase the
benefits of the members of the Statewide Defined Benefit Plan through a Rule of 80 provision effective January 1, 2021. This provision provides for a normal retirement as early as age 50 if the member's age combined with years of service totals at least 80. The impact of this change was not included in the Total Pension Liability or the Collective Pension Expense as of the December 31, 2019 measurement period. The impact of the benefit adjustment for the City cannot be estimated, but will be reflected in the December 31, 2020 measurement period.
Remainder of page intentionally blank
City of Colorado Springs 2020 Annual Comprehensive Financial Report 195
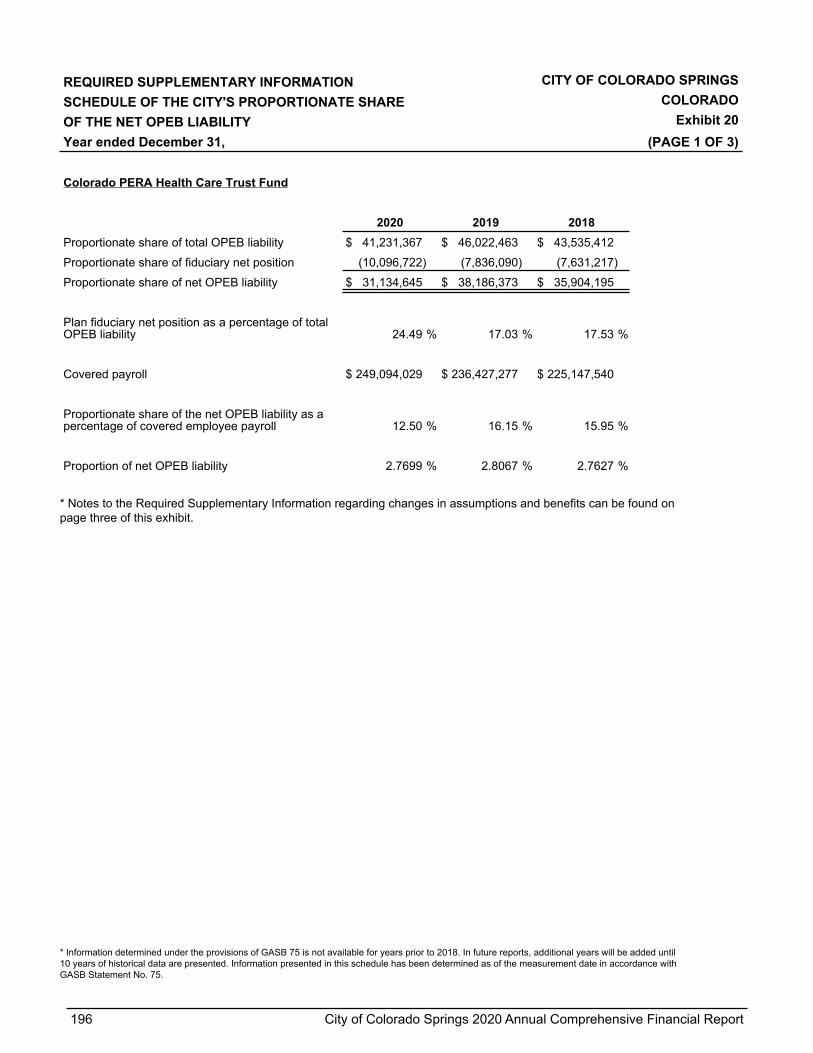
REQUIRED SUPPLEMENTARY INFORMATION CITY OF COLORADO SPRINGSSCHEDULE OF THE CITY'S PROPORTIONATE SHARE COLORADOOF THE NET OPEB LIABILITY Exhibit 20Year ended December 31, (PAGE 1 OF 3)
Colorado PERA Health Care Trust Fund
2020 2019 2018Proportionate share of total OPEB liability $ 41,231,367 $ 46,022,463 $ 43,535,412
Proportionate share of fiduciary net position (10,096,722) (7,836,090) (7,631,217)
Proportionate share of net OPEB liability $ 31,134,645 $ 38,186,373 $ 35,904,195
Plan fiduciary net position as a percentage of total OPEB liability 24.49 % 17.03 % 17.53 %
Covered payroll $ 249,094,029 $ 236,427,277 $ 225,147,540
Proportionate share of the net OPEB liability as a percentage of covered employee payroll 12.50 % 16.15 % 15.95 %
Proportion of net OPEB liability 2.7699 % 2.8067 % 2.7627 %
* Notes to the Required Supplementary Information regarding changes in assumptions and benefits can be found on page three of this exhibit.
* Information determined under the provisions of GASB 75 is not available for years prior to 2018. In future reports, additional years will be added until 10 years of historical data are presented. Information presented in this schedule has been determined as of the measurement date in accordance with GASB Statement No. 75.
196 City of Colorado Springs 2020 Annual Comprehensive Financial Report

REQUIRED SUPPLEMENTARY INFORMATION CITY OF COLORADO SPRINGSSCHEDULE OF CITY'S CONTRIBUTIONS COLORADOYear ended December 31, EXHIBIT 20
(PAGE 2 OF 3)
Colorado PERA Health Care Trust Fund
Statutorily Determined
ContributionsActual
Contributions
Contribution Deficiency (Excess)
CoveredPayroll
Actual Contributions
as a % of Covered Payroll
2020 $ 2,691,471 $ 2,691,471 $ — $ 261,964,997 1.03
2019 2,613,609 2,613,609 — 249,094,029 1.05
2018 2,447,276 2,447,276 — 236,427,277 1.04
* Notes to the Required Supplementary Information regarding changes in assumptions and benefits can be found on page three of this exhibit.
* Information determined under the provisions of GASB 75 is not available for years prior to 2018. In future reports, additional years will be added until 10 years of historical data are presented. Information presented in this schedule has been determined as of the City's fiscal year end December 31 in accordance with GASB Statement No. 75.
City of Colorado Springs 2020 Annual Comprehensive Financial Report 197

NOTES TO THE CITY OF COLORADO SPRINGSREQUIRED SUPPLEMENTARY INFORMATION COLORADOYear ended December 31, 2020 EXHIBIT 20
(PAGE 3 OF 3)
Colorado PERA Health Care Trust Fund
Changes of assumptions - There were no changes to assumptions
Changes in benefits - There were no changes to benefits.
Remainder of page intentionally blank
198 City of Colorado Springs 2020 Annual Comprehensive Financial Report
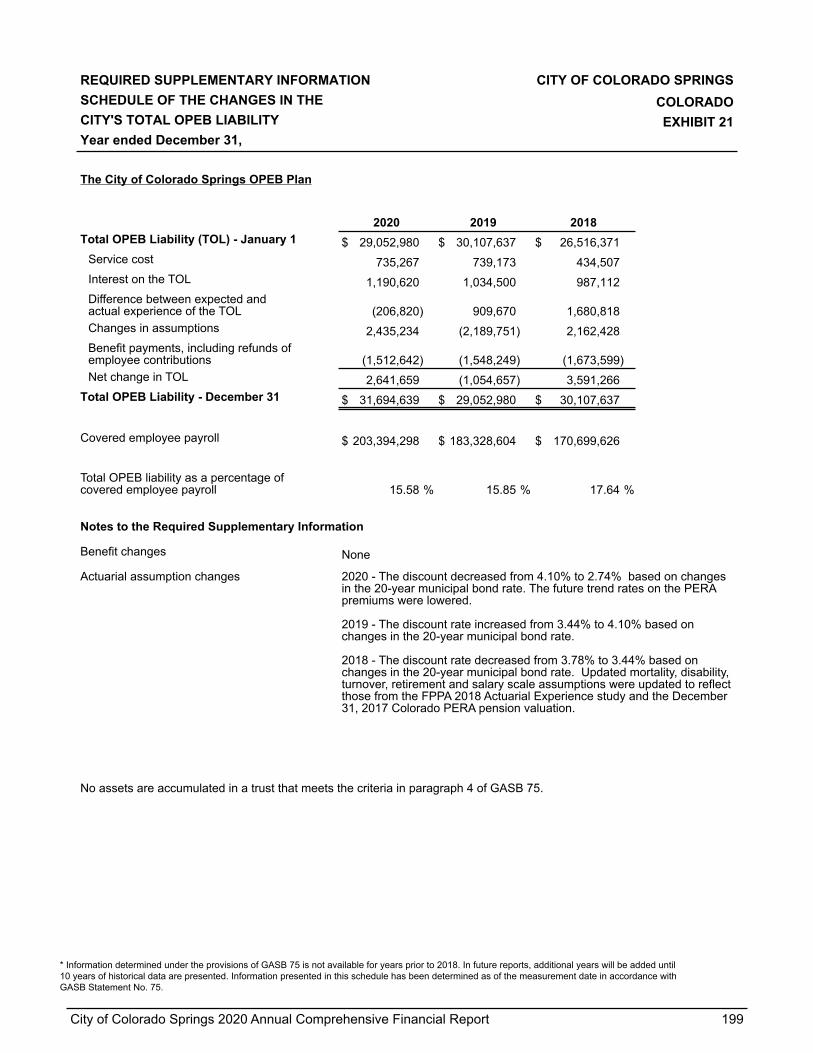
REQUIRED SUPPLEMENTARY INFORMATION CITY OF COLORADO SPRINGSSCHEDULE OF THE CHANGES IN THE COLORADOCITY'S TOTAL OPEB LIABILITY EXHIBIT 21Year ended December 31,
The City of Colorado Springs OPEB Plan
2020 2019 2018Total OPEB Liability (TOL) - January 1 $ 29,052,980 $ 30,107,637 $ 26,516,371
Service cost 735,267 739,173 434,507 Interest on the TOL 1,190,620 1,034,500 987,112 Difference between expected and actual experience of the TOL (206,820) 909,670 1,680,818 Changes in assumptions 2,435,234 (2,189,751) 2,162,428 Benefit payments, including refunds of employee contributions (1,512,642) (1,548,249) (1,673,599) Net change in TOL 2,641,659 (1,054,657) 3,591,266
Total OPEB Liability - December 31 $ 31,694,639 $ 29,052,980 $ 30,107,637
Covered employee payroll $ 203,394,298 $ 183,328,604 $ 170,699,626
Total OPEB liability as a percentage of covered employee payroll 15.58 % 15.85 % 17.64 %
Notes to the Required Supplementary Information
Benefit changes None
Actuarial assumption changes 2020 - The discount decreased from 4.10% to 2.74% based on changes in the 20-year municipal bond rate. The future trend rates on the PERA premiums were lowered.
2019 - The discount rate increased from 3.44% to 4.10% based on changes in the 20-year municipal bond rate.
2018 - The discount rate decreased from 3.78% to 3.44% based on changes in the 20-year municipal bond rate. Updated mortality, disability, turnover, retirement and salary scale assumptions were updated to reflect those from the FPPA 2018 Actuarial Experience study and the December 31, 2017 Colorado PERA pension valuation.
No assets are accumulated in a trust that meets the criteria in paragraph 4 of GASB 75.
* Information determined under the provisions of GASB 75 is not available for years prior to 2018. In future reports, additional years will be added until 10 years of historical data are presented. Information presented in this schedule has been determined as of the measurement date in accordance with GASB Statement No. 75.
City of Colorado Springs 2020 Annual Comprehensive Financial Report 199

REQUIRED SUPPLEMENTARY INFORMATION CITY OF COLORADO SPRINGSSCHEDULE OF THE CHANGES IN THE COLORADOUTILITIES' TOTAL OPEB LIABILITY EXHIBIT 22Year ended December 31,
Colorado Springs Utilities OPEB Plan
2020 2019 2018Total OPEB Liability (TOL) - January 1 $ 19,228,000 $ 21,624,000 $ 21,390,000
Service cost 11,000 23,000 20,000 Interest on the TOL 764,000 723,000 786,000 Benefit changes — — — Difference between expected and actual experience of the TOL (492,000) (511,000) (93,000) Changes in assumptions 2,877,000 (1,389,000) 785,000 Benefit payments, including refunds of employee contributions (1,209,000) (1,242,000) (1,264,000) Net change in TOL 1,951,000 (2,396,000) 234,000
Total OPEB Liability - December 31 $ 21,179,000 $ 19,228,000 $ 21,624,000
Covered employee payroll $ 2,207,000 $ 3,530,000 $ 5,683,000
Total OPEB liability as a percentage of covered employee payroll 959.63 % 544.70 % 380.50 %
Notes to the Required Supplementary Information
Changes in benefits None
Changes of assumptions 2020 - The discount decreased from 4.10% to 2.74% based on changes in the 20-year municipal bond rate. The future trend rates on the PERA premiums were lowered.
2019 - The discount rate increased from 3.44% to 4.10% based on changes in the 20-year municipal bond rate.
2018 - The discount rate decreased from 3.78% to 3.44% based on changes in the 20-year municipal bond rate. Updated mortality, disability, turnover, retirement and salary scale assumptions were updated to reflect those from the FPPA 2018 Actuarial Experience study and the December 31, 2017 Colorado PERA pension valuation
No assets are accumulated in a trust that meets the criteria in paragraph 4 of GASB 75
* Information determined under the provisions of GASB 75 is not available for years prior to 2018. In future reports, additional years will be added until 10 years of historical data are presented. Information presented in this schedule has been determined as of the measurement date in accordance with GASB Statement No. 75.
200 City of Colorado Springs 2020 Annual Comprehensive Financial Report

COMBINING AND INDIVIDUAL FUNDSTATEMENTS AND SCHEDULES
City of Colorado Springs 2020 Annual Comprehensive Financial Report 201

PROPRIETARY FUNDSSCHEDULE OF REVENUES AND EXPENSESBUDGET AND ACTUAL COMPARISONFor the year ended December 31, 2020
Colorado Springs UtilitiesFinal Budget Actual Variance
Operating revenues $ 892,477,000 $ 884,352,000 $ (8,125,000)
Operating expensesSalaries and benefits 207,523,000 200,759,000 6,764,000 Other operating expenses 343,821,000 286,819,000 57,002,000 Depreciation and amortization 159,040,000 161,258,000 (2,218,000)
Total operating expenses 710,384,000 648,836,000 61,548,000
Operating income 182,093,000 235,516,000 53,423,000
Nonoperating revenues (expenses)Derivative instruments — (13,615,000) (13,615,000) Investment earnings 5,487,000 5,917,000 430,000 Lease interest income — — — Interest expense (96,118,000) (96,999,000) (881,000) Amortization expense — — — Increase in contingent liabilities — — — Miscellaneous 8,263,000 (16,256,000) (24,519,000)
Total nonoperating revenues (expenses) (82,368,000) (120,953,000) (38,585,000)
Income (loss) before contributions and transfers 99,725,000 114,563,000 14,838,000
Capital contributions 40,067,000 73,222,000 33,155,000 Transfers - out (36,299,000) (35,485,000) 814,000 Special items — (228,095,000) (228,095,000)
Increase (decrease) in net position $ 103,493,000 $ (75,795,000) $ (179,288,000)
202 City of Colorado Springs 2020 Annual Comprehensive Financial Report

CITY OF COLORADO SPRINGSCOLORADO
Exhibit A-1
Public Authority for Colorado Energy Memorial HospitalBudget Actual Variance Budget Actual Variance
$ 50,567,000 $ 50,567,000 $ — $ — $ — $ —
— — — — — — 19,714,000 19,705,000 9,000 — — — — — — — — —
19,714,000 19,705,000 9,000 — — —
30,853,000 30,862,000 9,000 — — —
— — — — — — 1,028,000 1,028,000 — 74,900 156,380 81,480 — — — 5,612,112 2,788,714 (2,823,398) (38,406,000) (38,424,000) (18,000) — — — (820,000) (820,000) — — — — — — — (5,472,712) (3,401,369) 2,071,343 — — — (214,300) 456,275 670,575
(38,198,000) (38,216,000) (18,000) — — —
(7,345,000) (7,354,000) (9,000) — — —
— — — — — — — — — — — — — — — — — —
$ (7,345,000) $ (7,354,000) $ (9,000) $ — $ — $ —
City of Colorado Springs 2020 Annual Comprehensive Financial Report 203

204 City of Colorado Springs 2020 Annual Comprehensive Financial Report

NON-MAJOR GOVERNMENTAL FUNDS
City of Colorado Springs 2020 Annual Comprehensive Financial Report 205

NON-MAJOR GOVERNMENTAL FUNDS CITY OF COLORADO SPRINGS
COMBINING BALANCE SHEET COLORADODecember 31, 2020 Exhibit B-1
Special Revenue Funds
Capital Projects Fund
Permanent Funds Total
ASSETS
Cash and investments $ 72,548,701 $ 27,749,450 $ 458,737 $ 100,756,888 Accounts receivable (net of allowance for uncollectibles) 19,916,921 — 9,227 19,926,148 Sales tax receivable 12,043,600 — — 12,043,600 Loans receivable (net of allowance for uncollectibles) 12,937,020 — — 12,937,020 Property taxes receivable 3,954,255 — — 3,954,255 Due from other funds 808,416 135,144 — 943,560 Prepaids 29,349 — — 29,349 Restricted investments 500,000 — 14,680,338 15,180,338
Total assets $ 122,738,262 $ 27,884,594 $ 15,148,302 $ 165,771,158
LIABILITIES, DEFERRED INFLOWSOF RESOURCES AND FUND BALANCES
Liabilities Accounts payable $ 8,293,432 $ 1,037,586 $ — $ 9,331,018 Accrued salaries and benefits 611,713 — — 611,713 Deposits payable 424,038 — — 424,038 Due to other funds 2,469,753 3,384,767 — 5,854,520 Unearned revenue Grants 12,669,789 — — 12,669,789
Total liabilities 24,468,725 4,422,353 — 28,891,078
Deferred inflows of resources Unavailable revenue - property taxes 3,954,255 — — 3,954,255
Unavailable revenue - loans (net of allowance for uncollectibles) 12,937,020 — — 12,937,020
Total deferred inflows of resources 16,891,275 — — 16,891,275
Fund balancesNonspendable 29,349 — 14,680,338 14,709,687 Restricted 57,658,830 — 467,964 58,126,794 Committed 23,322,027 19,607,735 — 42,929,762 Assigned 368,056 3,854,506 — 4,222,562
Total fund balances 81,378,262 23,462,241 15,148,302 119,988,805
Total liabilities, deferred inflows of resources and fund balances $ 122,738,262 $ 27,884,594 $ 15,148,302 $ 165,771,158
206 City of Colorado Springs 2020 Annual Comprehensive Financial Report

NON-MAJOR GOVERNMENTAL FUNDS CITY OF COLORADO SPRINGS
COMBINING STATEMENT OF REVENUES, EXPENDITURES COLORADO
AND CHANGES IN FUND BALANCES Exhibit B-2
For the year ended December 31, 2020
Special Revenue Funds
Capital Projects Fund
Permanent Funds Total
Revenues
Taxes $ 115,393,872 $ — $ — $ 115,393,872
Intergovernmental 54,760,185 — — 54,760,185
Charges for services 15,749,098 — — 15,749,098
Endowments and donations 2,939,168 — 66,576 3,005,744
Other revenue 1,341,309 113,609 — 1,454,918
Investment earnings 2,125,026 824,932 1,829,357 4,779,315
Rental income 205,920 — — 205,920
Total revenues 192,514,578 938,541 1,895,933 195,349,052
Expenditures
Current
General government 6,186,668 — — 6,186,668
Public safety 46,280,527 — — 46,280,527
Public works 38,009,851 — — 38,009,851
Culture and recreation 9,167,027 — 42,201 9,209,228
Community development 5,928,911 — — 5,928,911
Economic development 4,090,060 — — 4,090,060
Debt service
Principal 2,500,541 1,148,923 — 3,649,464
Interest 613,902 45,025 — 658,927
Capital outlay 79,294,687 8,504,763 — 87,799,450
Total expenditures 192,072,174 9,698,711 42,201 201,813,086
Excess (deficiency) of revenues over expenditures 442,404 (8,760,170) 1,853,732 (6,464,034)
Other financing sources (uses)
Transfers - in — 4,547,444 — 4,547,444
Transfers - out (364,541) — (310,442) (674,983)
Total other financing sources (uses) (364,541) 4,547,444 (310,442) 3,872,461
Net change in fund balances 77,863 (4,212,726) 1,543,290 (2,591,573)
Fund balances - January 1 81,300,399 27,674,967 13,605,012 122,580,378
Fund balances - December 31 $ 81,378,262 $ 23,462,241 $ 15,148,302 $ 119,988,805
City of Colorado Springs 2020 Annual Comprehensive Financial Report 207

208 City of Colorado Springs 2020 Annual Comprehensive Financial Report

SPECIAL REVENUE FUNDSSpecial Revenue funds are used to account for the proceeds of specific revenuesources (other than major capital projects) that are legally restricted to expenditures for specific purposes.
Intergovernmental Grant Funds:Community Development Block Grant FundHome Investment Partnership FundGrants Fund
These Intergovernmental Grant Funds are used to account for the activities of the programs where the major source of funding is federal grants.
Capital, Operations and Maintenance Funds:Ballfield Capital Improvements FundBicycle Tax FundTrails/Open Space FundConservation Trust FundPublic Safety Sales Tax FundRoad Repair, Maintenance, and Improvement Sales Tax Fund
These funds are used to account for the activities of the fund where particular, ear-marked, ongoing revenue sources are designated for various capital, operations and maintenance activities.
Improvement and Maintenance District Funds:Old Colorado City Maintenance and Security District FundNorwood Special Improvement Maintenance District FundBriargate Special Improvement Maintenance District FundStetson Hills Improvement Maintenance District FundWoodstone Improvement Maintenance District FundGateway Improvement Maintenance District FundPlatte Avenue Improvement Maintenance District Fund
These Improvement and Maintenance District Funds are used to account for the activities of the neighborhood district where revenues are derived from neighborhood taxes and/or assessments and used for specific neighborhood improvements or maintenance purposes.
City of Colorado Springs 2020 Annual Comprehensive Financial Report 209

SPECIAL REVENUE FUNDS CONT'D.
Public Improvements Funds:Public Space and Development Fund (aka PLDO1)Subdivision Drainage FundArterial Roadway FundPark Developer Easement FundBanning Lewis Ranch Fund
These Public Improvements Funds are used to account for the activities of the fund established to finance public infrastructure costs in accordance with City subdivision ordinances.
Other Public Improvements Funds:Spring Creek General Improvement DistrictBriargate General Improvement DistrictMarket Place at Austin Bluffs (MAB) General Improvement District
These Other Public Improvements Funds are used to account for the activitiesof the funds established to finance improvement district infrastructure costs.
Other Special Revenue Funds:Lodgers and Auto Rental Tax FundStreet Tree FundGift Trust FundSenior Programs FundTherapeutic Recreation Fund
These Other Special Revenue Funds are used to account for the activities ofthe fund where ear-marked revenue is used for certain designated purposes.
1Public Land Dedication Ordinance
210 City of Colorado Springs 2020 Annual Comprehensive Financial Report

City of Colorado Springs 2020 Annual Comprehensive Financial Report 211

ALL SPECIAL REVENUE FUNDSCOMBINING BALANCE SHEETDecember 31, 2020
Intergovernmental Grant Funds
Capital, Operations and Maintenance
Funds
ASSETS
Cash and investments $ 1,166,460 $ 35,922,043 Accounts receivable (net of allowance for uncollectibles) 18,661,013 10,838 Sales tax receivable — 11,759,984 Loans receivable (net of allowance for uncollectibles) 12,937,020 — Property taxes receivable — — Due from other funds — 808,416 Prepaids — 29,349 Restricted investments — —
Total assets $ 32,764,493 $ 48,530,630
LIABILITIES, DEFERRED INFLOWSOF RESOURCES AND FUND BALANCES
Liabilities Accounts payable $ 4,588,807 $ 3,592,536 Accrued salaries and benefits 99,124 499,826 Deposits payable — — Due to other funds 2,469,753 — Unearned revenue Grants 12,669,789 —
Total liabilities 19,827,473 4,092,362
Deferred inflows of resources Unavailable revenue - property taxes — — Unavailable revenue - loans (net of allowance for uncollectibles) 12,937,020 —
Total deferred inflows of resources 12,937,020 —
Fund balances Nonspendable — 29,349 Restricted — 44,393,428 Committed — 15,491 Assigned — —
Total fund balances — 44,438,268
Total liabilities, deferred inflows of resources and fund balances $ 32,764,493 $ 48,530,630
212 City of Colorado Springs 2020 Annual Comprehensive Financial Report

CITY OF COLORADO SPRINGS COLORADO
Exhibit C-1
Improvement and Maintenance
District Funds
Public Improvements
Funds
Other Public Improvements
Funds Other Special
Revenue Funds Total
$ 1,223,336 $ 25,407,167 $ 827,139 $ 8,002,556 $ 72,548,701
19,914 557,668 6,156 661,332 19,916,921 — — — 283,616 12,043,600
— — — — 12,937,020 2,246,869 — 1,707,386 — 3,954,255 — — — — 808,416 — — — — 29,349 — — 500,000 — 500,000
$ 3,490,119 $ 25,964,835 $ 3,040,681 $ 8,947,504 $ 122,738,262
$ 26,593 $ 66,860 $ 250 $ 18,386 $ 8,293,432 12,763 — — — 611,713 — 424,038 — — 424,038 — — — — 2,469,753
— — — — 12,669,789
39,356 490,898 250 18,386 24,468,725
2,246,869 — 1,707,386 — 3,954,255 — — — — 12,937,020
2,246,869 — 1,707,386 — 16,891,275
— — — — 29,349 1,203,894 2,456,610 1,333,045 8,271,853 57,658,830 — 22,649,271 — 657,265 23,322,027 — 368,056 — — 368,056
1,203,894 25,473,937 1,333,045 8,929,118 81,378,262
$ 3,490,119 $ 25,964,835 $ 3,040,681 $ 8,947,504 $ 122,738,262
City of Colorado Springs 2020 Annual Comprehensive Financial Report 213

ALL SPECIAL REVENUE FUNDSCOMBINING STATEMENT OF REVENUES, EXPENDITURESAND CHANGES IN FUND BALANCESFor the year ended December 31, 2020
Inter-governmental Grant Funds
Capital, Operations and Maintenance
Funds
Improvement and Maintenance
District Funds
Revenues Taxes $ — $ 106,446,648 $ 2,465,325 Intergovernmental 49,875,907 4,884,278 — Charges for services — 99,470 — Donations — — — Other revenue 1,341,309 — — Investment earnings 146,226 1,223,093 38,555 Rental income — — —
Total revenues 51,363,442 112,653,489 2,503,880
Expenditures Current General government 6,145,228 — — Public safety 9,060,048 37,086,142 — Public works 27,190,913 — 2,285,994 Culture and recreation 1,295,799 6,573,115 — Community development 5,928,911 — — Economic development — — — Debt service Principal — 645,541 — Interest — 328,261 — Capital outlay 1,742,543 77,235,092 47,844
Total expenditures 51,363,442 121,868,151 2,333,838
Excess (deficiency) of revenues over expenditures — (9,214,662) 170,042
Other financing uses Transfers - out — — —
Total other financing uses — — —
Net change in fund balances — (9,214,662) 170,042
Fund balances - January 1 — 53,652,930 1,033,852
Fund balances - December 31 $ — $ 44,438,268 $ 1,203,894
214 City of Colorado Springs 2020 Annual Comprehensive Financial Report

CITY OF COLORADO SPRINGSCOLORADO
Exhibit C-2
Public Improvements
Funds
Other Public Improvements
FundsOther Special
Revenue Funds Total
$ — $ 1,951,842 $ 4,530,057 $ 115,393,872 — — — 54,760,185 15,649,628 — — 15,749,098 — — 2,939,168 2,939,168 — — — 1,341,309 644,197 35,225 37,730 2,125,026 — — 205,920 205,920
16,293,825 1,987,067 7,712,875 192,514,578
— 15,034 26,406 6,186,668 — — 134,337 46,280,527 8,294,518 — 238,426 38,009,851 — — 1,298,113 9,167,027 — — — 5,928,911 — — 4,090,060 4,090,060
— 1,855,000 — 2,500,541 — 285,641 — 613,902 269,208 — — 79,294,687
8,563,726 2,155,675 5,787,342 192,072,174
7,730,099 (168,608) 1,925,533 442,404
— — (364,541) (364,541)
— — (364,541) (364,541)
7,730,099 (168,608) 1,560,992 77,863
17,743,838 1,501,653 7,368,126 81,300,399
$ 25,473,937 $ 1,333,045 $ 8,929,118 $ 81,378,262
City of Colorado Springs 2020 Annual Comprehensive Financial Report 215

INTERGOVERNMENTAL GRANT SPECIAL REVENUE FUNDS CITY OF COLORADO SPRINGSCOMBINING BALANCE SHEET COLORADO
December 31, 2020 Exhibit C-3
Community Development Block Grant
Fund
Home Investment Partnership
Fund Grants Fund Total
ASSETS
Cash and investments $ — $ 1,166,460 $ — $ 1,166,460 Accounts receivable (net of allowance for uncollectibles) $ 1,061,721 $ 795,730 $ 16,803,562 $ 18,661,013 Loans receivable (net of allowance for uncollectibles) 5,582,008 7,269,226 85,786 12,937,020
Total assets $ 6,643,729 $ 9,231,416 $ 16,889,348 $ 32,764,493
LIABILITIES AND DEFERREDINFLOWS OF RESOURCES
Liabilities Accounts payable $ 643,972 $ 346,242 $ 3,598,593 $ 4,588,807 Accrued salaries and benefits 14,363 — 84,761 99,124 Due to other funds 350,045 — 2,119,708 2,469,753 Unearned revenue Grants 53,341 1,615,948 11,000,500 12,669,789
Total liabilities 1,061,721 1,962,190 16,803,562 19,827,473
Deferred inflows of resources Unavailable revenue - loans (net of allowance for uncollectibles) 5,582,008 7,269,226 85,786 12,937,020
Total deferred inflows of resources 5,582,008 7,269,226 85,786 12,937,020
Total liabilities and deferred inflows of resources $ 6,643,729 $ 9,231,416 $ 16,889,348 $ 32,764,493
216 City of Colorado Springs 2020 Annual Comprehensive Financial Report

INTERGOVERNMENTAL GRANT SPECIAL REVENUE FUNDS CITY OF COLORADO SPRINGSCOMBINING STATEMENT OF REVENUES, EXPENDITURES COLORADO
AND CHANGES IN FUND BALANCES Exhibit C-4For the year ended December 31, 2020
Community Development Block Grant
Fund
Home Investment Partnership
Fund Grants Fund Total
Revenues Intergovernmental $ 3,511,003 $ 286,909 $ 46,077,995 $ 49,875,907 Other revenue 355,876 727,399 258,034 1,341,309 Investment earnings 77 17,586 128,563 146,226
Total revenues 3,866,956 1,031,894 46,464,592 51,363,442
Expenditures Current General government — — 6,145,228 6,145,228 Public safety — — 9,060,048 9,060,048 Public works — — 27,190,913 27,190,913 Culture and recreation — — 1,295,799 1,295,799 Community development 3,866,956 1,031,894 1,030,061 5,928,911 Capital outlay — — 1,742,543 1,742,543
Total expenditures 3,866,956 1,031,894 46,464,592 51,363,442
Net change in fund balances — — — —
Fund balances - January 1 — — — —
Fund balances - December 31 $ — $ — $ — $ —
City of Colorado Springs 2020 Annual Comprehensive Financial Report 217

CAPITAL, OPERATIONS AND MAINTENANCE SPECIAL REVENUE FUNDSCOMBINING BALANCE SHEETDecember 31, 2020
Ballfield Capital Improvements Fund Bicycle Tax Fund Trails/Open Space Fund
ASSETS
Cash and investments $ 45,319 $ 188,394 $ 12,976,676 Accounts receivable (net of allowance for uncollectibles) — — — Sales tax receivable — 451 1,066,912 Due from other funds — — — Prepaids — — —
Total assets $ 45,319 $ 188,845 $ 14,043,588
LIABILITIES AND FUND BALANCES
Liabilities Accounts payable $ 29,828 $ 8,000 $ 584,941 Accrued salaries and benefits — — 25,279
Total liabilities 29,828 8,000 610,220
Fund balances Nonspendable — — — Restricted — 180,845 13,433,368 Committed 15,491 — —
Total fund balances 15,491 180,845 13,433,368
Total liabilities and fund balances $ 45,319 $ 188,845 $ 14,043,588
218 City of Colorado Springs 2020 Annual Comprehensive Financial Report

CITY OF COLORADO SPRINGS COLORADO
Exhibit C-5
Conservation Trust FundPublic Safety Sales Tax
Fund
Road Repair, Maintenance, &
Improvement Sales Tax Fund Total
$ 1,534,679 $ 7,576,431 $ 13,600,544 $ 35,922,043
— 10,838 — 10,838 — 4,267,467 6,425,154 11,759,984 — — 808,416 808,416 — 29,349 — 29,349
$ 1,534,679 $ 11,884,085 $ 20,834,114 $ 48,530,630
$ 57,524 $ 405,749 $ 2,506,494 $ 3,592,536 58,373 416,174 — 499,826
115,897 821,923 2,506,494 4,092,362
— 29,349 — 29,349 1,418,782 11,032,813 18,327,620 44,393,428 — — — 15,491
1,418,782 11,062,162 18,327,620 44,438,268
$ 1,534,679 $ 11,884,085 $ 20,834,114 $ 48,530,630
City of Colorado Springs 2020 Annual Comprehensive Financial Report 219

CAPITAL, OPERATIONS AND MAINTENANCE SPECIAL REVENUE FUNDSCOMBINING STATEMENT OF REVENUES, EXPENDITURESAND CHANGES IN FUND BALANCESFor the year ended December 31, 2020
Ballfield Capital Improvements Fund Bicycle Tax Fund
Trails/Open Space Fund
Revenues Taxes $ — $ 100,802 $ 9,533,738 Intergovernmental — — — Charges for services 46,083 — — Investment earnings 1,215 5,352 416,498
Total revenues 47,298 106,154 9,950,236
Expenditures Current Public safety — — — Culture and recreation — — 2,507,006 Debt service Principal — — — Interest — — — Capital outlay 44,839 74,590 13,766,476
Total expenditures 44,839 74,590 16,273,482
Excess (deficiency) of revenues
over expenditures 2,459 31,564 (6,323,246)
Net change in fund balances 2,459 31,564 (6,323,246)
Fund balances - January 1 13,032 149,281 19,756,614
Fund balances - December 31 $ 15,491 $ 180,845 $ 13,433,368
220 City of Colorado Springs 2020 Annual Comprehensive Financial Report

CITY OF COLORADO SPRINGS COLORADO
Exhibit C-6
Conservation Trust FundPublic Safety Sales Tax
Fund
Road Repair, Maintenance, &
Improvement Sales Tax Fund Total
$ — $ 38,131,013 $ 58,681,095 $ 106,446,648 4,884,278 — — 4,884,278 — 53,387 — 99,470 20,875 254,377 524,776 1,223,093
4,905,153 38,438,777 59,205,871 112,653,489
— 37,086,142 — 37,086,142 4,066,109 — — 6,573,115
50,400 595,141 — 645,541 91,913 236,348 — 328,261 535,739 395,631 62,417,817 77,235,092
4,744,161 38,313,262 62,417,817 121,868,151
160,992 125,515 (3,211,946) (9,214,662)
160,992 125,515 (3,211,946) (9,214,662)
1,257,790 10,936,647 21,539,566 53,652,930
$ 1,418,782 $ 11,062,162 $ 18,327,620 $ 44,438,268
City of Colorado Springs 2020 Annual Comprehensive Financial Report 221

IMPROVEMENT AND MAINTENANCE DISTRICTSPECIAL REVENUE FUNDSCOMBINING BALANCE SHEETDecember 31, 2020
Old Colorado City Maintenance and Security District
Fund
Norwood Special Improvement Maintenance District Fund
Briargate Special Improvement Maintenance District Fund
Stetson Hills Improvement Maintenance District Fund
ASSETS
Cash and investments $ 29,400 $ 378,977 $ 511,590 $ 206,464 Accounts receivable (net of allowance for uncollectibles) 984 6,965 8,601 2,945 Property taxes receivable 109,752 803,085 976,302 334,188
Total assets $ 140,136 $ 1,189,027 $ 1,496,493 $ 543,597
LIABILITIES, DEFERRED INFLOWS
OF RESOURCES AND FUND BALANCES
Liabilities Accounts payable $ 1,607 $ 8,262 $ 11,196 $ 2,933 Accrued salaries and benefits 1,319 4,024 6,041 1,379
Total liabilities 2,926 12,286 17,237 4,312
Deferred inflows of resources Unavailable revenue - property taxes 109,752 803,085 976,302 334,188
Total deferred inflows of resources 109,752 803,085 976,302 334,188
Fund balances Restricted 27,458 373,656 502,954 205,097
Total fund balances 27,458 373,656 502,954 205,097
Total liabilities, deferred inflows of resources and fund balances $ 140,136 $ 1,189,027 $ 1,496,493 $ 543,597
222 City of Colorado Springs 2020 Annual Comprehensive Financial Report

CITY OF COLORADO SPRINGS COLORADO
Exhibit C-7
Woodstone Improvement
Maintenance District Fund
Gateway Improvement Maintenance District
Fund
Platte Avenue Improvement
Maintenance District Fund Total
$ 60,375 $ 7,011 $ 29,519 $ 1,223,336
174 32 213 19,914 19,884 3,658 — 2,246,869
$ 80,433 $ 10,701 $ 29,732 $ 3,490,119
$ 2,548 $ 47 $ — $ 26,593 — — — 12,763
2,548 47 — 39,356
19,884 3,658 — 2,246,869
19,884 3,658 — 2,246,869
58,001 6,996 29,732 1,203,894
58,001 6,996 29,732 1,203,894
$ 80,433 $ 10,701 $ 29,732 $ 3,490,119
City of Colorado Springs 2020 Annual Comprehensive Financial Report 223

IMPROVEMENT AND MAINTENANCE DISTRICTSPECIAL REVENUE FUNDSCOMBINING STATEMENT OF REVENUES, EXPENDITURESAND CHANGES IN FUND BALANCESFor the year ended December 31, 2020
Old Colorado City Maintenance and Security District
Fund
Norwood Special Improvement Maintenance District Fund
Briargate Special Improvement Maintenance District Fund
Stetson Hills Improvement Maintenance District Fund
Revenues Taxes $ 122,111 $ 868,321 $ 1,071,707 $ 366,981 Investment earnings 947 12,607 17,910 5,048
Total revenues 123,058 880,928 1,089,617 372,029
Expenditures Current Public works 132,809 734,487 1,029,083 345,931 Capital outlay 10,000 2,100 24,496 11,248
Total expenditures 142,809 736,587 1,053,579 357,179
Excess (deficiency) of revenues over expenditures (19,751) 144,341 36,038 14,850
Net change in fund balances (19,751) 144,341 36,038 14,850
Fund balances - January 1 47,209 229,315 466,916 190,247
Fund balances - December 31 $ 27,458 $ 373,656 $ 502,954 $ 205,097
224 City of Colorado Springs 2020 Annual Comprehensive Financial Report

CITY OF COLORADO SPRINGS COLORADO
Exhibit C-8
Woodstone Improvement Maintenance District
Fund
Gateway Improvement Maintenance District
Fund
Platte Avenue Improvement
Maintenance District Fund Total
$ 21,726 $ 3,851 $ 10,628 $ 2,465,325 1,199 207 637 38,555
22,925 4,058 11,265 2,503,880
20,224 9,136 14,324 2,285,994 — — — 47,844
20,224 9,136 14,324 2,333,838
2,701 (5,078) (3,059) 170,042
2,701 (5,078) (3,059) 170,042
55,300 12,074 32,791 1,033,852
$ 58,001 $ 6,996 $ 29,732 $ 1,203,894
City of Colorado Springs 2020 Annual Comprehensive Financial Report 225

PUBLIC IMPROVEMENTS SPECIAL REVENUE FUNDS CITY OF COLORADO SPRINGSCOMBINING BALANCE SHEET COLORADODecember 31, 2020 Exhibit C-9
Public Space and
Development Fund
Subdivision Drainage
Fund
Arterial Roadway
Fund
Park Developer Easement
Fund
Banning Lewis Ranch
Fund Total
ASSETS
Cash and investments $ 11,900,861 $ 7,827,323 $ 2,304,464 $ 185,535 $ 3,188,984 $ 25,407,167
Accounts receivable (net of allowance
for uncollectibles) 522,269 32,845 2,554 — — 557,668
Total assets $ 12,423,130 $ 7,860,168 $ 2,307,018 $ 185,535 $ 3,188,984 $ 25,964,835
LIABILITIES AND FUND BALANCES
Liabilities Accounts payable $ 66,860 $ — $ — $ — $ — $ 66,860 Deposits payable — — — — 424,038 424,038
Total liabilities 66,860 — — — 424,038 490,898
Fund balances Restricted — — — — 2,456,610 2,456,610 Committed 12,356,270 7,860,168 2,307,018 125,815 — 22,649,271 Assigned — — — 59,720 308,336 368,056
Total fund balance 12,356,270 7,860,168 2,307,018 185,535 2,764,946 25,473,937
Total liabilities and fund balances $ 12,423,130 $ 7,860,168 $ 2,307,018 $ 185,535 $ 3,188,984 $ 25,964,835
226 City of Colorado Springs 2020 Annual Comprehensive Financial Report
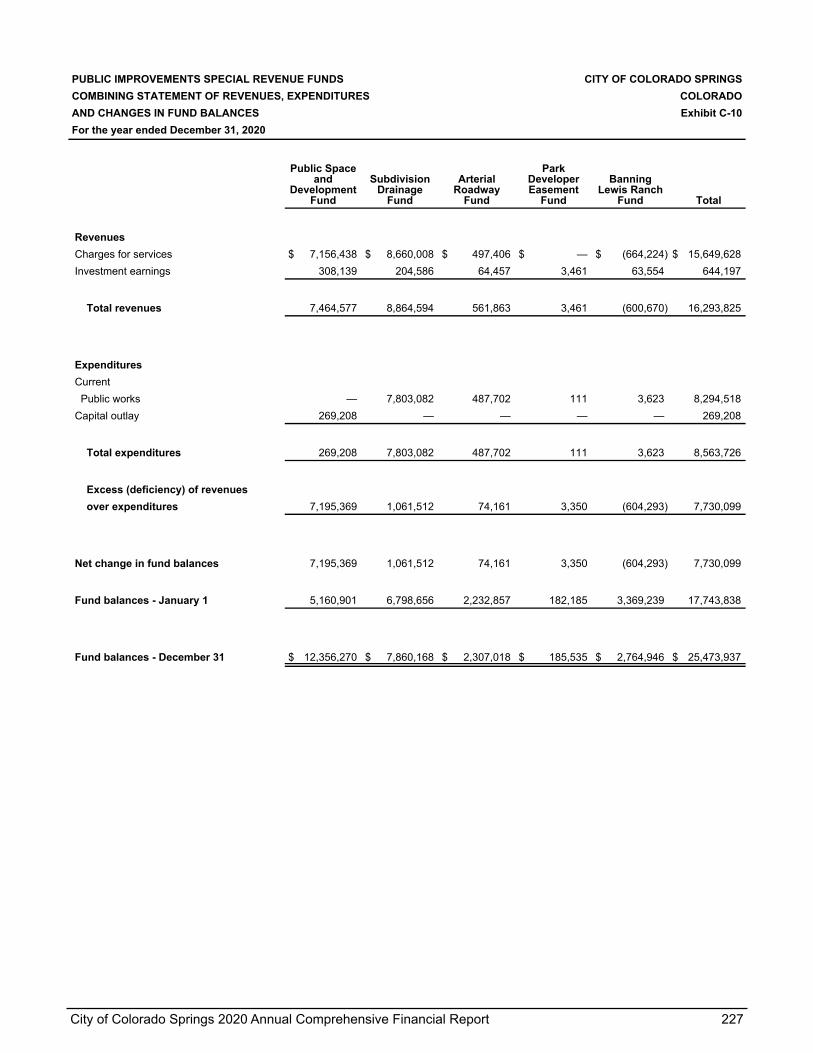
PUBLIC IMPROVEMENTS SPECIAL REVENUE FUNDS CITY OF COLORADO SPRINGSCOMBINING STATEMENT OF REVENUES, EXPENDITURES COLORADOAND CHANGES IN FUND BALANCES Exhibit C-10For the year ended December 31, 2020
Public Space and
Development Fund
Subdivision Drainage
Fund
Arterial Roadway
Fund
Park Developer Easement
Fund
Banning Lewis Ranch
Fund Total
Revenues Charges for services $ 7,156,438 $ 8,660,008 $ 497,406 $ — $ (664,224) $ 15,649,628 Investment earnings 308,139 204,586 64,457 3,461 63,554 644,197
Total revenues 7,464,577 8,864,594 561,863 3,461 (600,670) 16,293,825
Expenditures Current Public works — 7,803,082 487,702 111 3,623 8,294,518 Capital outlay 269,208 — — — — 269,208
Total expenditures 269,208 7,803,082 487,702 111 3,623 8,563,726
Excess (deficiency) of revenues over expenditures 7,195,369 1,061,512 74,161 3,350 (604,293) 7,730,099
Net change in fund balances 7,195,369 1,061,512 74,161 3,350 (604,293) 7,730,099
Fund balances - January 1 5,160,901 6,798,656 2,232,857 182,185 3,369,239 17,743,838
Fund balances - December 31 $ 12,356,270 $ 7,860,168 $ 2,307,018 $ 185,535 $ 2,764,946 $ 25,473,937
City of Colorado Springs 2020 Annual Comprehensive Financial Report 227

OTHER PUBLIC IMPROVEMENTS SPECIAL REVENUE FUNDS CITY OF COLORADO SPRINGS
COMBINING BALANCE SHEET COLORADO
December 31, 2020 Exhibit C-11
Spring Creek General
Improvement District
Briargate General
Improvement District
MAB General Improvement
District Total
ASSETS
Cash and investments $ 38,346 $ 559,713 $ 229,080 $ 827,139
Accounts receivable (net of allowance
for uncollectibles) 941 2,921 2,294 6,156
Property taxes receivable — 1,454,318 253,068 1,707,386
Restricted investments — 500,000 — 500,000
Total assets $ 39,287 $ 2,516,952 $ 484,442 $ 3,040,681
LIABILITIES, DEFERRED INFLOWS
OF RESOURCES AND FUND BALANCES
Liabilities
Accounts payable $ — $ — $ 250 $ 250
Total liabilities — — 250 250
Deferred inflows of resources
Unavailable revenue - property taxes — 1,454,318 253,068 1,707,386
Total deferred inflows of resources — 1,454,318 253,068 1,707,386
Fund balances
Restricted 39,287 1,062,634 231,124 1,333,045
Total fund balances 39,287 1,062,634 231,124 1,333,045
Total deferred inflows of
resources and fund balances $ 39,287 $ 2,516,952 $ 484,442 $ 3,040,681
228 City of Colorado Springs 2020 Annual Comprehensive Financial Report

OTHER PUBLIC IMPROVEMENTS SPECIAL REVENUE FUNDS CITY OF COLORADO SPRINGSCOMBINING STATEMENT OF REVENUES, EXPENDITURES COLORADOAND CHANGES IN FUND BALANCES Exhibit C-12For the year ended December 31, 2020
Spring Creek General
Improvement District
Briargate General
Improvement District
MAB General Improvement
District Total
Revenues Taxes $ 117,175 $ 1,563,647 $ 271,020 $ 1,951,842 Investment earnings 4,484 25,828 4,913 35,225
Total revenues 121,659 1,589,475 275,933 1,987,067
Expenditures Current General government 4,765 5,529 4,740 15,034 Debt service Principal 275,000 1,485,000 95,000 1,855,000 Interest 16,225 139,416 130,000 285,641
Total expenditures 295,990 1,629,945 229,740 2,155,675
Excess (deficiency) of revenues over expenditures (174,331) (40,470) 46,193 (168,608)
Net change in fund balances (174,331) (40,470) 46,193 (168,608)
Fund balances - January 1 213,618 1,103,104 184,931 1,501,653
Fund balances - December 31 $ 39,287 $ 1,062,634 $ 231,124 $ 1,333,045
City of Colorado Springs 2020 Annual Comprehensive Financial Report 229

OTHER SPECIAL REVENUE FUNDS CITY OF COLORADO SPRINGSCOMBINING BALANCE SHEET COLORADODecember 31, 2020 Exhibit C-13
Lodgers and Auto Rental
Tax FundStreet Tree
Fund Gift Trust Fund
Senior Programs
Fund
Therapeutic Recreation
Fund Total
ASSETS
Cash and investments $ 1,901,908 $ 95,505 $ 5,456,558 $ 543,766 $ 4,819 $ 8,002,556 Accounts receivable (net of allowances for uncollectibles) — — 638,197 23,135 — 661,332 Sales tax receivable 283,616 — — — — 283,616
Total assets $ 2,185,524 $ 95,505 $ 6,094,755 $ 566,901 $ 4,819 $ 8,947,504
LIABILITIES ANDFUND BALANCES
Liabilities Accounts payable $ — $ — $ 8,426 $ 9,960 $ — $ 18,386
Total liabilities — — 8,426 9,960 — 18,386
Fund balances Restricted 2,185,524 — 6,086,329 — — 8,271,853 Committed — 95,505 — 556,941 4,819 657,265
Total fund balances 2,185,524 95,505 6,086,329 556,941 4,819 8,929,118
Total liabilities and fund balances $ 2,185,524 $ 95,505 $ 6,094,755 $ 566,901 $ 4,819 $ 8,947,504
230 City of Colorado Springs 2020 Annual Comprehensive Financial Report

OTHER SPECIAL REVENUE FUNDS CITY OF COLORADO SPRINGSCOMBINING STATEMENT OF REVENUES, EXPENDITURES COLORADOAND CHANGES IN FUND BALANCES Exhibit C-14December 31, 2020
Lodgers and Auto Rental
Tax FundStreet Tree
Fund Gift Trust Fund
Senior Programs
Fund
Therapeutic Recreation
Fund Total
Revenues Taxes $ 4,530,057 $ — $ — $ — $ — $ 4,530,057 Donations — — 2,931,768 7,400 — 2,939,168 Investment earnings 19,274 2,694 — 15,672 90 37,730 Rental income — — — 205,920 — 205,920
Total revenues 4,549,331 2,694 2,931,768 228,992 90 7,712,875
Expenditures Current General government — — 26,406 — — 26,406 Public safety — — 134,337 — — 134,337 Public works — — 238,426 — — 238,426 Culture and recreation — 57 1,077,727 220,326 3 1,298,113 Economic development 4,090,060 — — — — 4,090,060
Total expenditures 4,090,060 57 1,476,896 220,326 3 5,787,342
Excess of revenues over expenditures 459,271 2,637 1,454,872 8,666 87 1,925,533
Other financing uses Transfers - out (364,541) — — — — (364,541)
Net change in fund balances 94,730 2,637 1,454,872 8,666 87 1,560,992
Fund balances - January 1 2,090,794 92,868 4,631,457 548,275 4,732 7,368,126
Fund balances - December 31 $ 2,185,524 $ 95,505 $ 6,086,329 $ 556,941 $ 4,819 $ 8,929,118
City of Colorado Springs 2020 Annual Comprehensive Financial Report 231

SPECIAL REVENUE FUNDS CITY OF COLORADO SPRINGSSCHEDULE OF REVENUES-BUDGET AND ACTUAL COLORADOFor the year ended December 31, 2020 Exhibit C-15
(PAGE 1 OF 2)
Final Budget Actual
VariancePositive
(Negative)RevenuesCommunity Development Block Grant $ 3,866,956 $ 3,866,956 $ —
Home Investment Partnership Fund 1,031,894 1,031,894 —
Grants Fund 46,464,592 46,464,592 —
Ballfield Capital Improvements Fund 79,700 47,298 (32,402)
Bicycle Tax Fund 82,400 106,154 23,754
Trails/Open Space Fund 9,884,000 9,950,236 66,236
Conservation Trust Fund 5,770,576 4,905,153 (865,423)
Public Safety Sales Tax Fund 38,779,541 38,438,777 (340,764)
Road Repair, Maintenance & Improvement Sales Tax Fund 58,314,000 59,205,871 891,871
Old Colorado City Maintenance and Security District Fund 125,850 123,058 (2,792)
Norwood Special Improvement Maintenance District Fund 890,635 880,928 (9,707)
Briargate Special Improvement Maintenance District Fund 1,103,159 1,089,617 (13,542)
Stetson Hills Improvement Maintenance District Fund 382,806 372,029 (10,777)
Woodstone Improvement Maintenance District Fund 23,068 22,925 (143)
Gateway Improvement Maintenance District Fund 4,326 4,058 (268)
Platte Avenue Improvement Maintenance District Fund 11,187 11,265 78
Public Space and Development Fund 2,313,000 7,464,577 5,151,577
Subdivision Drainage Fund 10,000,000 8,864,594 (1,135,406)
Arterial Roadway Fund 1,000,000 561,863 (438,137)
Park Developer Easement Fund — 3,461 3,461
Banning Lewis Ranch Fund 82,800 (600,670) (683,470)
Spring Creek General Improvement District 118,480 121,659 3,179
Briargate General Improvement District 1,571,756 1,589,475 17,719
MAB General Improvement District 293,220 275,933 (17,287)
Lodgers and Auto Rental Tax Fund 8,194,000 4,549,331 (3,644,669)
Street Tree Fund 1,800 2,694 894
Gift Trust Fund 1,900,000 2,931,768 1,031,768
Senior Programs Fund 168,000 228,992 60,992
Therapeutic Recreation Fund 100 90 (10)
Total revenues $ 192,457,846 $ 192,514,578 $ 56,732
(continued)
232 City of Colorado Springs 2020 Annual Comprehensive Financial Report

SPECIAL REVENUE FUNDS CITY OF COLORADO SPRINGSSCHEDULE OF EXPENDITURES-BUDGET AND ACTUAL COLORADOFor the year ended December 31, 2020 Exhibit C-15
(PAGE 2 OF 2)
Final Budget Actual
VariancePositive
(Negative)ExpendituresCommunity Development Block Grant $ 3,866,956 $ 3,866,956 $ —
Home Investment Partnership Fund 1,031,894 1,031,894 —
Grants Fund 46,464,592 46,464,592 —
Ballfield Capital Improvements Fund 80,099 44,839 35,260
Bicycle Tax Fund 243,223 74,590 168,633
Trails/Open Space Fund 26,588,131 16,273,482 10,314,649
Conservation Trust Fund 5,751,893 4,744,161 1,007,732
Public Safety Sales Tax Fund 46,243,071 38,313,262 7,929,809
Road Repair, Maintenance & Improvement Sales Tax Fund 70,350,317 62,417,817 7,932,500
Old Colorado City Maintenance and Security District Fund 146,623 142,809 3,814
Norwood Special Improvement Maintenance District Fund 959,004 736,587 222,417
Briargate Special Improvement Maintenance District Fund 1,215,720 1,053,579 162,141
Stetson Hills Improvement Maintenance District Fund 459,310 357,179 102,131
Woodstone Improvement Maintenance District Fund 33,506 20,224 13,282
Gateway Improvement Maintenance District Fund 10,512 9,136 1,376
Platte Avenue Improvement Maintenance District Fund 17,844 14,324 3,520
Public Space and Development Fund 6,881,548 269,208 6,612,340
Subdivision Drainage Fund 10,000,000 7,803,082 2,196,918
Arterial Roadway Fund 1,000,000 487,702 512,298
Park Developer Easement Fund — 111 (111)
Banning Lewis Ranch Fund 9,108 3,623 5,485
Spring Creek General Improvement District 297,725 295,990 1,735
Briargate General Improvement District 1,631,616 1,629,945 1,671
MAB General Improvement District 231,500 229,740 1,760
Lodgers and Auto Rental Tax Fund 5,555,438 4,454,601 1,100,837
Street Tree Fund 35,691 57 35,634
Gift Trust Fund 2,127,152 1,476,896 650,256
Senior Programs Fund 279,181 220,326 58,855
Therapeutic Recreation Fund 50 3 47
Total expenditures $ 231,511,704 $ 192,436,715 $ 39,074,989
Note: Includes transfers
City of Colorado Springs 2020 Annual Comprehensive Financial Report 233

234 City of Colorado Springs 2020 Annual Comprehensive Financial Report

CAPITAL PROJECTS FUND
The Capital Projects Fund is used to account for financial resources to be usedfor the acquisition or construction of major capital facilities other than thosefinanced by proprietary funds.
City Funded CIP Construction Fund
City of Colorado Springs 2020 Annual Comprehensive Financial Report 235

CAPITAL PROJECTS FUND CITY OF COLORADO SPRINGSBALANCE SHEET COLORADODecember 31, 2020 Exhibit D-1
City Funded CIP
Construction Fund
ASSETS
Cash and investments $ 27,749,450 Due from other funds 135,144
Total assets $ 27,884,594
LIABILITIES AND FUND BALANCES
Liabilities Accounts payable $ 1,037,586 Due to other funds 3,384,767
Total liabilities 4,422,353
Fund balances Committed 19,607,735 Assigned 3,854,506
Total fund balances 23,462,241
Total liabilities and fund balances $ 27,884,594
236 City of Colorado Springs 2020 Annual Comprehensive Financial Report

CAPITAL PROJECTS FUND CITY OF COLORADO SPRINGSSTATEMENT OF REVENUES, EXPENDITURES COLORADOAND CHANGES IN FUND BALANCE Exhibit D-2BUDGET AND ACTUALFor the year ended December 31, 2020
Final Budget Actual
Variance with Final Budget
Positive (Negative)
Revenues Other revenue $ — $ 113,609 $ 113,609 Investment earnings 508,000 824,932 316,932
Total revenues 508,000 938,541 430,541
Expenditures
Debt service Principal 1,148,923 1,148,923 — Interest 45,025 45,025 — Capital outlay 28,409,321 8,504,763 19,904,558
Total expenditures 29,603,269 9,698,711 19,904,558
Deficiency of revenues over expenditures (29,095,269) (8,760,170) 20,335,099
Other financing sources Transfers - in 5,197,445 4,547,444 (650,001)
Total other financing sources 5,197,445 4,547,444 (650,001)
Net change in fund balance (23,897,824) (4,212,726) 19,685,098
Fund balance - January 1 27,674,967 27,674,967 —
Fund balance - December 31 $ 3,777,143 $ 23,462,241 $ 19,685,098
City of Colorado Springs 2020 Annual Comprehensive Financial Report 237

ANNUAL STATEMENT OF RECEIPTS CITY OF COLORADO SPRINGSAND EXPENDITURES FOR COLORADOROADS, BRIDGES AND STREETS Exhibit D-32020 (PAGE 1 OF 2)
City or County:
City of Colorado SpringsLOCAL HIGHWAY FINANCE REPORT YEAR ENDING :
December 2020
This Information From The Records Of: City of Colorado Springs Prepared By: City of Colorado Springs Finance Office
Phone: (719) 385-5224
I. DISPOSITION OF HIGHWAY-USER REVENUES AVAILABLE FOR LOCAL GOVERNMENT EXPENDITURE
A. Local B. Local C. Receipts from D. Receipts fromITEM Motor-Fuel Motor-Vehicle State Highway- Federal Highway
Taxes Taxes User Taxes Administration1. Total receipts available
2. Minus amount used for collection expenses
3. Minus amount used for nonhighway purposes
4. Minus amount used for mass transit
5. Remainder used for highway purposes
II. RECEIPTS FOR ROAD AND STREET PURPOSES III. DISBURSEMENTS FOR ROAD AND STREET PURPOSES
ITEM AMOUNT ITEM AMOUNT
A. Receipts from local sources: A. Local highway disbursements: 1. Local highway-user taxes 1. Capital outlay (from page 2) 122,253,842
a. Motor Fuel (from Item I.A.5.) 2. Maintenance: 14,942,907
b. Motor Vehicle (from Item I.B.5.) 3. Road and street services:
c. Total (a.+b.) a. Traffic control operations 332,502
2. General fund appropriations 36,596,626 b. Snow and ice removal 3,034,459
3. Other local imposts (from page 2) 112,137,158 c. Other
4. Miscellaneous local receipts (from page 2) 3,768,391 d. Total (a. through c.) 3,366,961
5. Transfers from toll facilities 4. General administration & miscellaneous 6,025,571
6. Proceeds of sale of bonds and notes: 5. Highway law enforcement and safety 23,112,438
a. Bonds - Original Issues 6. Total (1 through 5) 169,701,719
b. Bonds - Refunding Issues B. Debt service on local obligations: c. Notes 1. Bonds:
d. Total (a. + b. + c.) — a. Interest
7. Total (1 through 6) 152,502,175 b. Redemption
B. Private Contributions c. Total (a. + b.) —
C. Receipts from State government 2. Notes:
(from page 2) 19,199,899 a. Interest
D. Receipts from Federal Government b. Redemption
(from page 2) — c. Total (a. + b.) —
E. Total receipts (A.7 + B + C + D) 171,702,074 3. Total (1.c + 2.c) —
C. Payments to State for highways 2,000,355
D. Payments to toll facilities —
E. Total disbursements (A.6 + B.3 + C + D) 171,702,074
IV. LOCAL HIGHWAY DEBT STATUS(Show all entries at par)
Opening Debt Amount Issued Redemptions Closing Debt
A. Bonds (Total) — —
1. Bonds (Refunding Portion)
B. Notes (Total) —
V. LOCAL ROAD AND STREET FUND BALANCE
A. Beginning Balance B. Total Receipts C. Total Disbursements D. Ending Balance E. Reconciliation
— 171,702,074 171,702,074 — —
Notes and Comments:
FORM FHWA-536 (Rev. 1-05) PREVIOUS EDITIONS OBSOLETE (Next Page)
238 City of Colorado Springs 2020 Annual Comprehensive Financial Report

ANNUAL STATEMENT OF RECEIPTS CITY OF COLORADO SPRINGSAND EXPENDITURES FOR COLORADOROADS, BRIDGES AND STREETS Exhibit D-32020 (PAGE 2 OF 2)
STATE:
ColoradoLOCAL HIGHWAY FINANCE REPORT YEAR ENDING (mm/yy):
December 2020
II. RECEIPTS FOR ROAD AND STREET PURPOSES - DETAIL
ITEM AMOUNT ITEM AMOUNTA.3. Other local imposts: A.4. Miscellaneous local receipts:
a. Property Taxes and Assessments a. Interest on investments 262,355 b. Other local imposts: b. Traffic Fines & Penalities 3,506,036
1. Sales Taxes 108,311,118 c. Parking Garage Fees2. Infrastructure & Impact Fees 904,761 d. Parking Meter Fees3. Liens e. Sale of Surplus Property4. Licenses f. Charges for Services5. Specific Ownership &/or Other 2,921,279 g. Other Misc. Receipts6. Total (1. through 5.) 112,137,158 h. Other
c. Total (a. + b.) 112,137,158 i. Total (a. through h.) 3,768,391
(Carry forward to page 1) (Carry forward to page 1)
ITEM AMOUNT ITEM AMOUNTC. Receipts from State Government D. Receipts from Federal Government
1. Highway-user taxes 17,640,713 1. FHWA (from Item I.D.5.)2. State general funds 2. Other Federal agencies:3. Other State funds: a. Forest Service
a. State bond proceeds b. FEMAb. Project Match c. HUDc. Motor Vehicle Registrations 1,559,186 d. Federal Transit Admind. Other (Specify) - DOLA Grant e. U.S. Corps of Engineerse. Other (Specify) f. Other Federalf. Total (a. through e.) 1,559,186 g. Total (a. through f.) —
4. Total (1. + 2. + 3.f) 19,199,899 3. Total (1. + 2.g) —
(Carry forward to page 1) (Carry forward to page 1)
III. DISBURSEMENTS FOR ROAD AND STREET PURPOSES - DETAIL
ON NATIONAL OFF NATIONAL
HIGHWAY HIGHWAY TOTAL
SYSTEM SYSTEM
(a) (b) (c)A.1. Capital outlay:
a. Right-Of-Way Costs 239,412 1,217,780 1,457,192 b. Engineering Costs 4,041,911 5,198,299 9,240,210 c. Construction:
(1). New Facilities — 5,130,468 5,130,468 (2). Capacity Improvements 2,043,484 11,169,677 13,213,161 (3). System Preservation 20,284,403 64,108,419 84,392,822 (4). System Enhancement & Operation — 8,819,989 8,819,989 (5). Total Construction (1) + (2) + (3) + (4) 22,327,887 89,228,553 111,556,440
d. Total Capital Outlay (Lines 1.a. + 1.b. + 1.c.5) 26,609,210 95,644,632 122,253,842 (Carry forward to page 1)
Notes and Comments:
FORM FHWA-536 (Rev.1-05) PREVIOUS EDITIONS OBSOLETE
City of Colorado Springs 2020 Annual Comprehensive Financial Report 239

240 City of Colorado Springs 2020 Annual Comprehensive Financial Report

PERMANENT FUNDS
Permanent funds are used to report resources that are legally restricted to theextent that only earnings, and not principal, may be used for purposes thatsupport the City’s programs for the benefit of the City or its citizenry.
Cemetery Endowment FundUsed to account for the investment activities of the Cemetery Endowmentcorpus with investment earnings used to finance cemetery operations.
C.D. Smith and TOPS Maintenance Trust FundsUsed to account for the investment activities of each fund's corpus withinvestment earnings used in accordance with trust provisions.
City of Colorado Springs 2020 Annual Comprehensive Financial Report 241

PERMANENT FUNDS CITY OF COLORADO SPRINGSCOMBINING BALANCE SHEET COLORADODecember 31, 2020 Exhibit E-1
C.D. Smith Trust Fund
Cemetery Endowment
Fund
TOPS Maintenance Trust Fund Total
ASSETS
Cash and investments $ 204,807 $ 80,057 $ 173,873 $ 458,737 Accounts receivable 8,447 780 — 9,227 Restricted investments 1,183,046 12,852,364 644,928 14,680,338
Total assets $ 1,396,300 $ 12,933,201 $ 818,801 $ 15,148,302
FUND BALANCES
Fund balances Nonspendable 1,183,046 12,852,364 644,928 14,680,338 Restricted 213,254 80,837 173,873 467,964
Total fund balances 1,396,300 12,933,201 818,801 15,148,302
Total liabilities and fund balances $ 1,396,300 $ 12,933,201 $ 818,801 $ 15,148,302
242 City of Colorado Springs 2020 Annual Comprehensive Financial Report

PERMANENT FUNDS CITY OF COLORADO SPRINGS COMBINING STATEMENT OF REVENUES, EXPENDITURES COLORADO AND CHANGES IN FUND BALANCES Exhibit E-2 For the year ended December 31, 2020
C.D. Smith Trust Fund
Cemetery Endowment
Fund
TOPS Maintenance Trust Fund Total
Revenues Endowments $ — $ 66,576 $ — $ 66,576 Investment earnings 193,707 1,627,131 8,519 1,829,357
Total revenues 193,707 1,693,707 8,519 1,895,933
Expenditures Current Culture and recreation 1,993 — 40,208 42,201
Total expenditures 1,993 — 40,208 42,201
Excess (deficiency) of revenuesover expenditures 191,714 1,693,707 (31,689) 1,853,732
Other financing uses Transfers - out — (310,442) — (310,442)
Total other financing uses — (310,442) — (310,442)
Net change in fund balance 191,714 1,383,265 (31,689) 1,543,290
Fund balances - January 1 1,204,586 11,549,936 850,490 13,605,012
Fund balances - December 31 $ 1,396,300 $ 12,933,201 $ 818,801 $ 15,148,302
City of Colorado Springs 2020 Annual Comprehensive Financial Report 243

PERMANENT FUNDS CITY OF COLORADO SPRINGSSCHEDULE OF REVENUES AND EXPENDITURES-BUDGET AND ACTUAL COLORADOFor the year ended December 31, 2020 Exhibit E-3
Final Budget ActualVariance Positive
(Negative)RevenuesC.D. Smith Trust Fund $ 75,000 $ 193,707 $ 118,707
Cemetery Endowment Fund 250,000 1,693,707 1,443,707
TOPS Maintenance Trust Fund 4,800 8,519 3,719
Total revenues $ 329,800 $ 1,895,933 $ 1,566,133
ExpendituresC.D. Smith Trust Fund $ 75,000 $ 1,993 $ 73,007
Cemetery Endowment Fund 250,000 310,442 (60,442)
TOPS Maintenance Trust Fund 40,176 40,208 (32)
Total expenditures $ 365,176 $ 352,643 $ 12,533
Note: Includes transfers.
244 City of Colorado Springs 2020 Annual Comprehensive Financial Report

NON-MAJOR PROPRIETARY FUNDSENTERPRISE FUNDS
Enterprise Funds account for the acquisition, operations and maintenance ofthe City’s facilities and services supported by user charges or those for whichthe City has decided that periodic determination of the revenues earned,expenses incurred, and/or net income is appropriate for capital maintenance,public policy, management control, accountability or other purposes.
Airport FundUsed to account for the activities of the City owned municipal airport.
Patty Jewett Golf FundUsed to account for the activities of the City owned golf course.
Valley Hi Golf FundUsed to account for the activities of the City owned golf course.
Pikes Peak America’s Mountain FundUsed to account for the activities of Pikes Peak America’s Mountain.
Parking FundUsed to account for the activities of the City owned parking system.
Cemetery FundUsed to account for the activities of the two City owned cemeteries.
Development Review FundUsed to account for the final implementation of City land use regulations andfire codes.
Stormwater FundUsed to account for activities related to stormwater capital improvements and maintenance.
City of Colorado Springs 2020 Annual Comprehensive Financial Report 245

NON-MAJOR ENTERPRISE FUNDSCOMBINING BALANCE SHEETDecember 31, 2020
Airport FundPatty Jewett
Golf FundValley Hi Golf
Fund
Pikes Peak America's
Mountain Fund
ASSETS AND DEFERREDOUTFLOWS OF RESOURCES
Current assetsCash and investments - unrestricted $ 21,564,333 $ 2,549,718 $ 838,223 $ 16,241,556 Accounts receivable (net of
allowance for uncollectibles) 3,350,111 6,986 685 768 Lease receivable 43,464 — — — Notes receivable 288,535 — — — Due from other funds 314 — — — Inventories 856,663 — — 26,236
Total current assets 26,103,420 2,556,704 838,908 16,268,560
Noncurrent assetsCash and investments - restricted — — — 1,951,013 Lease receivable 2,054,246 — — — Notes receivable 2,466,539 — — — Net pension asset 9,692 — — — Due from other funds — — — — Capital assets:
Land 17,556,526 60,000 931,200 667 Buildings 64,321,977 1,815,451 282,508 3,587,757 Construction in progress 9,411,476 — — 58,553,293 Improvements other than buildings 309,272,879 2,358,668 1,510,289 11,634,428 Machinery and equipment 30,336,702 2,842,252 1,131,458 3,859,106 Infrastructure 51,163,648 — — — Intangibles 652,943 — — —
Less accumulated depreciation (216,683,425) (5,500,949) (2,797,054) (11,162,570)
Total noncurrent assets 270,563,203 1,575,422 1,058,401 68,423,694
Total assets 296,666,623 4,132,126 1,897,309 84,692,254
Deferred outflows of resourcesLoss on debt refunding — — — — Pension-related amounts 1,878,046 136,254 58,171 368,550 OPEB-related amounts 211,365 26,734 8,382 71,545
Total deferred outflows of resources 2,089,411 162,988 66,553 440,095
Total assets and deferred outflowsof resources $ 298,756,034 $ 4,295,114 $ 1,963,862 $ 85,132,349
246 City of Colorado Springs 2020 Annual Comprehensive Financial Report

CITY OF COLORADO SPRINGSCOLORADO
Exhibit F-1(PAGE 1 OF 2)
Parking Fund Cemetery FundDevelopment Review Fund
Stormwater Fund Total
$ 10,293,974 $ 1,035,319 $ 8,226,747 $ 3,567,984 $ 64,317,854
22,146 30,720 155,755 871,232 4,438,403 — — — — 43,464 — — — — 288,535 83,436 — — 1,593,574 1,677,324 — — — — 882,899
10,399,556 1,066,039 8,382,502 6,032,790 71,648,479
— — — — 1,951,013 — — — — 2,054,246 — — — — 2,466,539 — — — — 9,692 1,198,321 — — — 1,198,321
2,072,246 81,379 — 1,917,000 22,619,018 25,082,242 514,720 80,173 — 95,684,828 200,000 — — 5,754,740 73,919,509 16,419,568 1,745,366 80,289 48,088 343,069,575 376,822 404,498 265,104 3,920,751 43,136,693 — — — 9,521,860 60,685,508 — — — — 652,943 (21,378,501) (2,186,865) (220,046) (2,859,144) (262,788,554)
23,970,698 559,098 205,520 18,303,295 384,659,331
34,370,254 1,625,137 8,588,022 24,336,085 456,307,810
68,032 — — — 68,032 140,642 103,366 273,281 3,267,614 6,225,924 21,901 48,117 33,510 529,470 951,024
230,575 151,483 306,791 3,797,084 7,244,980
$ 34,600,829 $ 1,776,620 $ 8,894,813 $ 28,133,169 $ 463,552,790 (continued)
City of Colorado Springs 2020 Annual Comprehensive Financial Report 247

NON-MAJOR ENTERPRISE FUNDSCOMBINING BALANCE SHEETDecember 31, 2020
Airport FundPatty Jewett
Golf FundValley Hi Golf
Fund
Pikes Peak America's
Mountain Fund
LIABILITIES, DEFERRED INFLOWS OF RESOURCES AND NET POSITION
Current liabilitiesAccounts payable $ 1,633,692 $ 18,134 $ 14,045 $ 7,221,523 Accrued salaries and benefits 146,024 9,591 4,096 22,509 Compensated absences 28,840 5,126 1,431 5,239 Due to other funds 44,170 9,218 — 8,268 Unearned revenue 122,576 — — — Accrued interest payable 275,242 — — 119,382 Matured bonds payable — — — 515,000 Notes payable 984,790 — — — Capital lease payable — 91,680 — —
Total current liabilities 3,235,334 133,749 19,572 7,891,921
Noncurrent liabilitiesCompensated absences 547,964 97,395 27,188 99,547 Unearned revenue 1,837,430 — — — Revenue bonds payable, net — — — 30,669,569 Notes payable 8,674,630 — — — Net pension liability 6,676,940 587,463 246,486 1,172,857 Net OPEB liability 1,150,958 161,359 52,007 351,905 Capital lease payable — 286,642 — —
Total noncurrent liabilities 18,887,922 1,132,859 325,681 32,293,878
Total liabilities 22,123,256 1,266,608 345,253 40,185,799
Deferred inflows of resourcesPension-related amounts 2,520,032 240,340 100,841 480,846 OPEB-related amounts 133,448 17,832 6,412 50,647
Total deferred inflows of resources 2,653,480 258,172 107,253 531,493
Net positionNet investment in capital assets 256,373,306 1,197,100 1,058,401 28,171,138 Restricted for passenger facility charges 109,313 — — — Restricted for pension-related 9,692 — — — Restricted for debt service — — — 1,951,013 Unrestricted 17,486,987 1,573,234 452,955 14,292,906
Total net position 273,979,298 2,770,334 1,511,356 44,415,057 Total liabilities, deferred inflows of resources and net position $ 298,756,034 $ 4,295,114 $ 1,963,862 $ 85,132,349
248 City of Colorado Springs 2020 Annual Comprehensive Financial Report

CITY OF COLORADO SPRINGSCOLORADO
Exhibit F-1(PAGE 2 OF 2)
Parking Fund Cemetery FundDevelopment Review Fund
Stormwater Fund Total
$ 717,483 $ 12,233 $ 10,077 $ 1,575,389 $ 11,202,576 12,775 7,578 27,224 98,848 328,645 1,549 2,757 4,613 13,306 62,861 8,729 1,932 — 3,423 75,740 — — 2,211,235 — 2,333,811 10,783 — — — 405,407 735,000 — — — 1,250,000 — — — — 984,790 — — — — 91,680
1,486,319 24,500 2,253,149 1,690,966 16,735,510
29,440 52,381 87,652 252,822 1,194,389 — 1,050,453 — — 2,887,883 4,590,000 — — — 35,259,569 — — — — 8,674,630 487,114 381,790 977,089 4,538,297 15,068,036 103,656 259,920 184,215 542,349 2,806,369 — — — — 286,642
5,210,210 1,744,544 1,248,956 5,333,468 66,177,518
6,696,529 1,769,044 3,502,105 7,024,434 82,913,028
213,631 156,195 399,741 1,856,679 5,968,305 17,399 12,529 23,543 91,690 353,500
231,030 168,724 423,284 1,948,369 6,321,805
17,515,409 559,098 205,520 18,303,295 323,383,267 — — — — 109,313 — — — — 9,692 — — — — 1,951,013 10,157,861 (720,246) 4,763,904 857,071 48,864,672
27,673,270 (161,148) 4,969,424 19,160,366 374,317,957
$ 34,600,829 $ 1,776,620 $ 8,894,813 $ 28,133,169 $ 463,552,790
City of Colorado Springs 2020 Annual Comprehensive Financial Report 249

NON-MAJOR ENTERPRISE FUNDSCOMBINING STATEMENT OF REVENUES, EXPENSESAND CHANGES IN NET POSITIONFor the year ended December 31, 2020
Airport FundPatty Jewett
Golf FundValley Hi Golf Fund
Pikes Peak America's Mountain
Fund
Operating revenuesCharges for services $ 13,225,565 $ 2,510,993 $ 1,316,517 $ 10,237,913
Operating expensesSalaries and benefits 8,971,460 749,483 309,476 1,641,675 Other operating expenses 6,732,887 1,177,656 722,631 3,943,228 Depreciation 17,527,200 182,281 54,516 729,621
Total operating expenses 33,231,547 2,109,420 1,086,623 6,314,524
Operating income (loss) (20,005,982) 401,573 229,894 3,923,389
Nonoperating revenues (expenses)Investment earnings 808,968 63,671 19,282 586,775 Interest expense (332,207) — (1,311) (1,382,416) Passenger facility charges 1,473,010 — — — Customer facility charges 855,725 — — — Gain/(loss) on disposal of capital assets 2,400,918 — — 5,298 COVID-19 recovery grant 10,241,666 389,607 215,372 1,000,000 Miscellaneous 329,776 — — —
Total nonoperating revenues (expenses) 15,777,856 453,278 233,343 209,657
Income (loss) before contributions and transfers (4,228,126) 854,851 463,237 4,133,046
Capital contributions 6,691,976 — — — Transfers - in — — — —
Change in net position 2,463,850 854,851 463,237 4,133,046
Total net position - January 1 271,515,448 1,915,483 1,048,119 40,282,011
Total net position - December 31 $ 273,979,298 $ 2,770,334 $ 1,511,356 $ 44,415,057
250 City of Colorado Springs 2020 Annual Comprehensive Financial Report

CITY OF COLORADO SPRINGSCOLORADO
Exhibit F-2
Parking Fund Cemetery FundDevelopment Review Fund
Stormwater Fund Total
$ 5,000,619 $ 1,009,311 $ 3,109,025 $ 18,403,842 $ 54,813,785
619,029 515,869 1,691,865 8,689,215 23,188,072 2,844,360 1,056,395 628,427 3,706,146 20,811,730 1,190,793 80,642 33,142 417,211 20,215,406
4,654,182 1,652,906 2,353,434 12,812,572 64,215,208
346,437 (643,595) 755,591 5,591,270 (9,401,423)
345,973 28,310 232,790 91,463 2,177,232 (155,043) — — — (1,870,977) — — — — 1,473,010 — — — — 855,725 — — — — 2,406,216 — 167,256 — — 12,013,901 — — — 109,221 438,997
190,930 195,566 232,790 200,684 17,494,104
537,367 (448,029) 988,381 5,791,954 8,092,681
— — — 1,599,794 8,291,770 — 310,442 — — 310,442
537,367 (137,587) 988,381 7,391,748 16,694,893
27,135,903 (23,561) 3,981,043 11,768,618 357,623,064
$ 27,673,270 $ (161,148) $ 4,969,424 $ 19,160,366 $ 374,317,957
City of Colorado Springs 2020 Annual Comprehensive Financial Report 251

NON-MAJOR ENTERPRISE FUNDSCOMBINING STATEMENT OF CASH FLOWSFor the year ended December 31, 2020
Airport FundPatty Jewett Golf Fund
Valley Hi Golf Fund
Pikes Peak America's Mountain
FundCASH FLOWS FROM OPERATING ACTIVITIESReceipts from customers $ 12,247,527 $ 2,514,350 $ 1,319,692 $ 10,326,582 Receipts from interfund services provided 139,356 — — — Payments to suppliers (5,153,392) (470,827) (335,896) (3,749,381) Payments to employees (8,961,242) (761,824) (329,856) (1,671,366) Payments for interfund services used (2,096,742) (709,394) (385,916) (533,888)
Net cash provided (used) by operating activities (3,824,493) 572,305 268,024 4,371,947
CASH FLOWS FROM NONCAPITAL FINANCING ACTIVITIESOperating grant 9,040,223 389,607 215,372 1,000,000 Transfers - in — — — —
Net cash provided by noncapital financing activities 9,040,223 389,607 215,372 1,000,000
CASH FLOWS FROM CAPITAL AND RELATED FINANCING ACTIVITIESPurchases of capital assets (21,398,569) — — (19,930,980) Payments from accounts payable incurred for capital asset additions (3,993,986) — — (5,366,751) Repayment of capital lease obligations (79,378) (99,549) (83,087) — Principal paid on capital debt (1,569,823) — — (490,000) Interest paid on capital debt (93,231) — (1,311) (1,457,088) Interest paid - other (2,619) — — — Proceeds received on capital debt 7,500,000 — — — Proceeds from sale of capital assets 3,861,973 — — 36,086 Capital grant 10,476,650 — — — Passenger facility charges 1,857,739 — — — Customer facility charges 938,041 — — — Insurance settlement 2,138 — — — Miscellaneous 95,585 — — —
Net cash provided (used) by capital and related financing activities (2,405,480) (99,549) (84,398) (27,208,733)
CASH FLOWS FROM INVESTING ACTIVITIESProceeds from sales and maturities of investments 3,456,485 — — 26,097,755 Purchases of investments (7,287,900) (934,411) (415,278) (5,489,010) Interest and dividends received 53,972 33,864 8,853 461,261 Principal received on lease/note receivable 246,653 — — — Interest received on lease/note receivable 280,212 — — — Principal received from interfund loan — — — — Interest received from interfund loan — — — —
Net cash provided (used) by investing activities (3,250,578) (900,547) (406,425) 21,070,006
Net decrease in cash and cash equivalents (440,328) (38,184) (7,427) (766,780)
Cash and cash equivalents - January 1 735,814 73,124 18,912 989,333
Cash and cash equivalents - December 31 $ 295,486 $ 34,940 $ 11,485 $ 222,553
Cash and cash equivalents $ 295,486 $ 34,940 $ 11,485 $ 222,553 Investments 21,268,847 2,514,778 826,738 17,970,016
Total cash and investments $ 21,564,333 $ 2,549,718 $ 838,223 $ 18,192,569
252 City of Colorado Springs 2020 Annual Comprehensive Financial Report

CITY OF COLORADO SPRINGSCOLORADO
Exhibit F-3(PAGE 1 OF 2)
Parking Fund Cemetery FundDevelopment Review
Fund Stormwater Fund Total
$ 4,632,931 $ 1,101,611 $ 3,002,000 $ 16,519,445 $ 51,664,138 372,327 — 121,344 1,771,700 2,404,727 (2,722,498) (374,190) (310,674) (2,480,272) (15,597,130) (659,504) (513,808) (1,752,237) (6,122,462) (20,772,299) (363,636) (675,380) (311,301) (1,043,121) (6,119,378)
1,259,620 (461,767) 749,132 8,645,290 11,580,058
— 167,256 — — 10,812,458 — 310,442 — — 310,442
— 477,698 — — 11,122,900
(331,144) — (27,834) (7,359,223) (49,047,750) — — — (1,030,560) (10,391,297) — — — — (262,014) (715,000) — — — (2,774,823) (146,772) — — — (1,698,402) — — — — (2,619) — — — — 7,500,000 — — — — 3,898,059 — — — 645,222 11,121,872 — — — — 1,857,739 — — — — 938,041 — — — — 2,138 — — — 109,221 204,806
(1,192,916) — (27,834) (7,635,340) (38,654,250)
2,788,136 285,476 1,696,342 82,867 34,407,061 (3,478,960) (349,897) (2,780,319) (1,205,839) (21,941,614) 190,583 18,043 147,875 50,828 965,279 — — — — 246,653 — — — — 280,212 80,170 — — — 80,170 53,018 — — — 53,018
(367,053) (46,378) (936,102) (1,072,144) 14,090,779
(300,349) (30,447) (214,804) (62,194) (1,860,513)
441,403 44,634 327,531 111,084 2,741,835
$ 141,054 $ 14,187 $ 112,727 $ 48,890 $ 881,322
$ 141,054 $ 14,187 $ 112,727 $ 48,890 $ 881,322 10,152,920 1,021,132 8,114,020 3,519,094 65,387,545
$ 10,293,974 $ 1,035,319 $ 8,226,747 $ 3,567,984 $ 66,268,867 (continued)
City of Colorado Springs 2020 Annual Comprehensive Financial Report 253

NON-MAJOR ENTERPRISE FUNDSCOMBINING STATEMENT OF CASH FLOWSFor the year ended December 31, 2020
Airport Fund
Patty Jewett
Golf FundValley Hi Golf Fund
Pikes Peak America's Mountain
Fund
Reconciliation of operating income (loss) to net cash provided (used) by operating activities
Operating income (loss) $ (20,005,982) $ 401,573 $ 229,894 $ 3,923,389 Adjustments to reconcile operating income (loss) to net cash provided (used) by operating activities
Depreciation expense 17,527,200 182,281 54,516 729,621 Decrease (increase) in assets and outflows of resources
Accounts receivable (724,827) 12,608 5,300 88,669 Due from other funds (314) — — — Inventories (59,743) — — 18,270 Deferred outflows of resources - pensions 1,245,136 99,477 41,305 64,615 Deferred outflows of resources - OPEB (55,217) (6,098) (1,987) (25,157) Net pension asset (9,692) — — —
Increase (decrease) in liabilities and inflows of resources
Accounts and other payables (486,435) (10,357) 1,779 (366,245) Accrued expenses (285,444) 5,143 (10,018) (28,925) Due to other funds 28,931 7,791 (960) 7,934 Other liabilities (113,541) (9,250) (2,125) — Deferred inflows of resources - pensions 2,396,910 237,070 100,210 469,288 Deferred inflows of resources - OPEB 102,471 10,345 4,790 31,499 Net pension liabilities (3,364,424) (357,738) (152,600) (541,958) Net OPEB liabilities (19,522) (540) (2,080) 947
Net cash provided (used) by operating activities $ (3,824,493) $ 572,305 $ 268,024 $ 4,371,947
Noncash investing, capital and financing activitiesNoncash acquisition of capital assets (incurrence of payable) $ 771,089 $ 477,871 $ — $ 7,116,974 Noncash capital contributions 2,793,990 — — — Change in fair value of investments 237,668 29,807 10,429 125,515
254 City of Colorado Springs 2020 Annual Comprehensive Financial Report

CITY OF COLORADO SPRINGSCOLORADO
Exhibit F-3(PAGE 2 OF 2)
Parking Fund Cemetery FundDevelopment Review Fund Stormwater Fund Total
$ 346,437 $ (643,595) $ 755,591 $ 5,591,270 $ (9,401,423)
1,190,793 80,642 33,142 417,211 20,215,406
3,330 10,964 (53,625) 292,697 (364,884) 1,309 — — (405,393) (404,398) — — — — (41,473) 41,866 50,460 114,069 12,497 1,669,425 (8,042) (12,238) (11,069) (231,045) (350,853) — — — — (9,692)
(223,740) 5,216 6,451 179,923 (893,408) (7,786) (13,674) 14,665 (248,621) (574,660) (18,035) 1,611 — 2,830 30,102 — 81,335 67,946 — 24,365 158,299 152,309 399,678 1,856,679 5,770,443 8,261 (1,673) 19,754 91,220 266,667 (234,732) (198,690) (588,334) 852,343 (4,586,133) 1,660 25,566 (9,136) 233,679 230,574 $ 1,259,620 $ (461,767) $ 749,132 $ 8,645,290 $ 11,580,058
$ 594,000 $ — $ — $ 1,170,348 $ 10,130,282 — — — 1,917,000 4,710,990 102,372 10,267 84,915 40,635 641,608
City of Colorado Springs 2020 Annual Comprehensive Financial Report 255

NON-MAJOR ENTERPRISE FUNDS CITY OF COLORADO SPRINGSSCHEDULE OF REVENUES AND EXPENSES COLORADOBUDGET AND ACTUAL-BUDGET BASIS Exhibit F-4For the year ended December 31, 2020
Final Budget Actual
Variance Positive
(Negative)RevenuesAirport Fund $ 74,681,802 $ 33,389,018 $ (41,292,784) Patty Jewett Golf Fund 2,851,774 2,934,464 82,690 Valley Hi Golf Fund 1,239,993 1,540,742 300,749 Pikes Peak America's Mountain Fund 10,429,216 11,699,173 1,269,957 Parking Fund 6,608,180 5,244,220 (1,363,960) Cemetery Fund 1,559,920 1,505,052 (54,868) Development Review Fund 2,459,550 3,256,900 797,350 Stormwater Fund 38,421,267 20,163,685 (18,257,582)
Total revenues $ 138,251,702 79,733,254 $ (58,518,448)
Reconciliation to GAAP: Add: Gain/(loss) on disposal of assets 2,406,216 Add: Increase in fair value of investments 641,608 Revenues (US GAAP basis) $ 82,781,078
Final Budget Actual
Variance Positive
(Negative)ExpensesAirport Fund $ 102,465,673 $ 40,160,815 $ 62,304,858 Patty Jewett Golf Fund 2,683,041 2,022,759 660,282 Valley Hi Golf Fund 1,233,707 1,129,621 104,086 Pikes Peak America's Mountain Fund 36,013,011 34,542,112 1,470,899 Parking Fund 11,001,688 5,271,139 5,730,549 Cemetery Fund 1,559,920 1,553,998 5,922 Development Review Fund 2,351,953 2,373,534 (21,581) Stormwater Fund 44,157,541 18,183,433 25,974,108
Total expenses $ 201,466,534 105,237,411 $ 96,229,123
Reconciliation to GAAP: Add: Depreciation expense 20,215,406 Add: Other year-end accrual entries 2,370,368 Less: Capital expenditures (58,700,163) Less: Capital debt principal payments (3,036,837) Expenses (US GAAP basis) $ 66,086,185 Note: Includes transfers
256 City of Colorado Springs 2020 Annual Comprehensive Financial Report

NON-MAJOR PROPRIETARY FUNDSINTERNAL SERVICE FUNDS
Internal Service Funds are used to account for the financing of goods orservices provided by one department to other departments of the City on acost-reimbursement basis.
Claims Reserve Self-Insurance FundUsed to account for self-insurance activities of the City (except Utilities) in the area of general liability.
Workers’ Compensation Self-Insurance FundUsed to account for the self-insurance activities related to employee workers’compensation.
Employee Benefits Self-Insurance FundUsed to account for self-insurance activities of the City employee benefitprogram (except Utilities).
Office Services FundUsed to account for printing and mailing services.
Radio Communications FundUsed to account for radio services.
City of Colorado Springs 2020 Annual Comprehensive Financial Report 257

INTERNAL SERVICE FUNDSCOMBINING BALANCE SHEETDecember 31, 2020
Claims Reserve Self-Insurance
Fund
Workers' Compensation Self-
Insurance FundASSETS
Current assetsCash and investments $ 2,263,117 $ 2,807,375 Accounts receivable (net of allowance for uncollectibles) — — Inventories — — Due from other funds — 27,824
Total current assets 2,263,117 2,835,199
Noncurrent assetsCapital assets:
Land — — Buildings — — Improvements other than buildings — — Machinery and equipment — 41,433
Less accumulated depreciation — (41,433)
Total noncurrent assets — —
Total assets $ 2,263,117 $ 2,835,199
LIABILITIES AND NET POSITION
Current liabilitiesAccounts payable $ 44,813 $ 98,921 Claims payable 5,321,000 9,320,000 Accrued salaries and benefits 2,884 14,216 Compensated absences 823 2,545 Due to other funds — —
Total current liabilities 5,369,520 9,435,682
Noncurrent liabilitiesClaims payable — 9,320,000 Compensated absences 15,632 48,347
Total noncurrent liabilities 15,632 9,368,347
Total liabilities 5,385,152 18,804,029
Net positionNet investment in capital assets — — Unrestricted (3,122,035) (15,968,830)
Total net position (3,122,035) (15,968,830)
Total liabilities and net position $ 2,263,117 $ 2,835,199
258 City of Colorado Springs 2020 Annual Comprehensive Financial Report

CITY OF COLORADO SPRINGSCOLORADO
Exhibit G-1
Employee Benefits Self-Insurance
FundOffice Services
Fund
Radio Communications
Fund Total
$ — $ 658,058 $ 456,426 $ 6,184,976 892,774 23,378 62,461 978,613 — 23,136 8,262 31,398 11,832 4,183 — 43,839
904,606 708,755 527,149 7,238,826
— — 13,000 13,000 — — 201,250 201,250 — — 310,198 310,198 — 299,359 252,025 592,817 — (233,595) (505,121) (780,149)
— 65,764 271,352 337,116
$ 904,606 $ 774,519 $ 798,501 $ 7,575,942
$ 2,236,486 $ 17,343 $ 76,679 $ 2,474,242 4,459,000 — — 19,100,000 9,270 8,997 8,317 43,684 2,129 6,164 2,395 14,056 2,929,952 — — 2,929,952
9,636,837 32,504 87,391 24,561,934
— — — 9,320,000 40,445 117,113 45,499 267,036
40,445 117,113 45,499 9,587,036
9,677,282 149,617 132,890 34,148,970
— 65,764 271,352 337,116 (8,772,676) 559,138 394,259 (26,910,144)
(8,772,676) 624,902 665,611 (26,573,028)
$ 904,606 $ 774,519 $ 798,501 $ 7,575,942
City of Colorado Springs 2020 Annual Comprehensive Financial Report 259

INTERNAL SERVICE FUNDSCOMBINING STATEMENT OF REVENUES, EXPENSESAND CHANGES IN NET POSITIONFor the year ended December 31, 2020
Claims Reserve Self-Insurance
Fund
Workers' Compensation Self-
Insurance FundOperating revenues
Charges for services $ 1,890,788 $ 9,951,554
Operating expensesSalaries and benefits 210,374 995,705 Other operating expenses 3,914,417 7,790,390 Depreciation — —
Total operating expenses 4,124,791 8,786,095
Operating income (loss) (2,234,003) 1,165,459
Nonoperating revenuesInvestment earnings 58,290 62,663
Change in net position (2,175,713) 1,228,122
Total net position - January 1 (946,322) (17,196,952)
Total net position - December 31 $ (3,122,035) $ (15,968,830)
260 City of Colorado Springs 2020 Annual Comprehensive Financial Report

CITY OF COLORADO SPRINGSCOLORADO
Exhibit G-2
Employee Benefits Self-Insurance
FundOffice Services
Fund
Radio Communications
Fund Total
$ 35,853,645 $ 1,113,593 $ 1,368,796 $ 50,178,376
943,175 654,492 539,166 3,342,912 36,066,384 879,624 855,424 49,506,239 — 10,958 22,798 33,756
37,009,559 1,545,074 1,417,388 52,882,907
(1,155,914) (431,481) (48,592) (2,704,531)
— 20,426 14,217 155,596
(1,155,914) (411,055) (34,375) (2,548,935)
(7,616,762) 1,035,957 699,986 (24,024,093)
$ (8,772,676) $ 624,902 $ 665,611 $ (26,573,028)
City of Colorado Springs 2020 Annual Comprehensive Financial Report 261

INTERNAL SERVICE FUNDSCOMBINING STATEMENT OF CASH FLOWSFor the year ended December 31, 2020
Claims Reserve Self-Insurance
Fund
Workers' Compensation Self-
Insurance FundCASH FLOWS FROM OPERATING ACTIVITIESReceipts from customers $ 304,763 $ 1,217,845 Receipts from interfund services provided 1,586,500 8,726,766 Payments to suppliers (942,399) (6,511,754) Payments to employees (215,295) (1,022,284) Payments for interfund services used (1,645) (1,149,343)
Net cash provided (used) by operating activities 731,924 1,261,230
CASH FLOWS FROM NONCAPITAL FINANCING ACTIVITIESRepayment of advance from other funds — — Advance from other funds — —
Net cash used by noncapital financing activities — —
CASH FLOWS FROM CAPITAL AND RELATEDFINANCING ACTIVITIES
Purchases of capital assets — —
Net cash used by capital and related financing activities — —
CASH FLOWS FROM INVESTING ACTIVITIESProceeds from sales and maturities of investments (34,413) (368,949) Purchases of investments (764,844) (948,782) Interest and dividends received 32,009 28,159
Net cash used by investing activities (767,248) (1,289,572)
Net decrease in cash and cash equivalents (35,324) (28,342)
Cash and cash equivalents - January 1 66,334 66,810
Cash and cash equivalents - December 31 $ 31,010 $ 38,468
Cash and cash equivalents $ 31,010 $ 38,468 Investments 2,232,107 2,768,907
Total cash and investments $ 2,263,117 $ 2,807,375
262 City of Colorado Springs 2020 Annual Comprehensive Financial Report

CITY OF COLORADO SPRINGSCOLORADO
Exhibit G-3(PAGE 1 OF 2)
Employee Benefits Self-Insurance
FundOffice Services
Fund
Radio Communications
Fund Total
$ 7,532,127 $ 317,452 $ 274,690 $ 9,646,877 27,696,417 821,336 1,052,628 39,883,647 (33,379,386) (517,489) (329,691) (41,680,719) (408,702) (681,524) (563,210) (2,891,015) (1,748,212) (356,718) (481,553) (3,737,471)
(307,756) (416,943) (47,136) 1,221,319
(2,622,196) — — (2,622,196) 2,929,952 — — 2,929,952
307,756 — — 307,756
— (29,175) (66,027) (95,202)
— (29,175) (66,027) (95,202)
— 612,313 238,314 447,265 — (222,398) (154,255) (2,090,279) — 16,412 10,346 86,926
— 406,327 94,405 (1,556,088)
— (39,791) (18,758) (122,215)
— 48,808 25,012 206,964
$ — $ 9,017 $ 6,254 $ 84,749
$ — $ 9,017 $ 6,254 $ 84,749 — 649,041 450,172 6,100,227
$ — $ 658,058 $ 456,426 $ 6,184,976
City of Colorado Springs 2020 Annual Comprehensive Financial Report 263

INTERNAL SERVICE FUNDSCOMBINING STATEMENT OF CASH FLOWSFor the year ended December 31, 2020
Claims Reserve Self-Insurance
Fund
Workers' Compensation Self-
Insurance FundReconciliation of operating income (loss) to net cash
provided (used) by operating activitiesOperating income (loss) $ (2,234,003) $ 1,165,459 Adjustments to reconcile operating income (loss) to net
cash provided (used) by operating activitiesDepreciation expense — —
Decrease (increase) in assetsAccounts receivable — 9,637 Prepaids 475 1,425 Due from other funds — (18,005) Inventories — —
Increase (decrease) in liabilitiesAccounts and other payables 2,970,373 129,293 Accrued expenses (4,921) (26,579) Due to other funds — —
Net cash provided (used) by operating activities $ 731,924 $ 1,261,230
Noncash investing, capital and financing activitiesChange in fair value of investments $ 26,281 $ 34,504
264 City of Colorado Springs 2020 Annual Comprehensive Financial Report

CITY OF COLORADO SPRINGSCOLORADO
Exhibit G-3(PAGE 2 OF 2)
Employee Benefits Self-Insurance
FundOffice Services
Fund
Radio Communications
Fund Total
$ (1,155,914) $ (431,481) $ (48,592) $ (2,704,531)
— 10,958 22,798 33,756
(651,803) 20,194 (41,476) (663,448) — — — 1,900 26,702 5,001 — 13,698 — 1,592 763 2,355
1,478,211 3,825 43,745 4,625,447 (4,952) (27,032) (24,044) (87,528) — — (330) (330)
$ (307,756) $ (416,943) $ (47,136) $ 1,221,319
$ — $ 4,013 $ 3,870 $ 68,668
City of Colorado Springs 2020 Annual Comprehensive Financial Report 265

INTERNAL SERVICES FUND CITY OF COLORADO SPRINGSSCHEDULE OF REVENUES AND COLORADOEXPENSES-BUDGET AND ACTUAL-BUDGET BASIS Exhibit G-4For the year ended December 31, 2020
Final Budget Actual
Variance Positive
(Negative)RevenuesClaims Reserve Self-Insurance Fund $ 1,569,000 $ 1,922,797 $ 353,797 Workers' Compensation Self-Insurance Fund 8,060,218 9,979,713 1,919,495 Employee Benefits Self-Insurance Fund 34,512,109 35,853,645 1,341,536 Office Services Fund 1,211,742 1,130,006 (81,736) Radio Communications Fund 1,442,853 1,379,143 (63,710)
Total revenues $ 46,795,922 50,265,304 $ 3,469,382
Reconciliation to GAAP: Add: Increase in fair value of investments 68,668 Revenues (US GAAP basis) $ 50,333,972
Final Budget Actual
Variance Positive
(Negative)ExpensesClaims Reserve Self-Insurance Fund $ 1,569,000 $ 4,122,932 $ (2,553,932) Workers' Compensation Self-Insurance Fund 9,000,000 8,781,959 218,041 Employee Benefits Self-Insurance Fund 36,543,822 37,001,005 (457,183) Office Services Fund 1,781,752 1,539,025 242,727 Radio Communications Fund 1,724,562 1,398,412 326,150
Total expenses $ 50,619,136 52,843,333 $ (2,224,197)
Reconciliation to GAAP: Add: Depreciation expense 33,756 Add: Other year-end accrual entries 5,818 Expenditures (US GAAP basis) $ 52,882,907
Note: Includes transfers
266 City of Colorado Springs 2020 Annual Comprehensive Financial Report

FIDUCIARY FUNDS
Fiduciary funds are used to report Old Hire Police and Old Hire Fire pension trust funds, which account for the activities in these City Police and Fire pension plans. These funds accumulate resources for pension benefit payments to qualified public safety employees.
City of Colorado Springs 2020 Annual Comprehensive Financial Report 267

FIDUCIARY FUNDS CITY OF COLORADO SPRINGSCOMBINING STATEMENT OF FIDUCIARY NET POSITION COLORADODecember 31, 2020 Exhibit H-1
Old Hire Old Hire TotalFire Pension Police Pension PensionTrust Fund Trust Fund Trust Funds
ASSETSPension assets held by Fire and Police Pension Association
Pooled investment funds $ 71,040,765 $ 60,979,935 $ 132,020,700 Total assets $ 71,040,765 $ 60,979,935 $ 132,020,700
NET POSITIONNet position restricted for pensions $ 71,040,765 $ 60,979,935 $ 132,020,700
268 City of Colorado Springs 2020 Annual Comprehensive Financial Report

FIDUCIARY FUNDS CITY OF COLORADO SPRINGSCOMBINING STATEMENT OF CHANGES COLORADOIN FIDUCIARY NET POSITION Exhibit H-2For the year ended December 31, 2020
Old Hire Old Hire TotalFire Pension Police Pension PensionTrust Fund Trust Fund Trust Funds
Additions
City contributions $ 2,328,416 $ 1,850,964 $ 4,179,380 Total contributions 2,328,416 1,850,964 4,179,380
Investment earnings:Net increase in fair value of investments 6,584,800 5,642,667 12,227,467 Interest, dividends, and other 845,856 721,867 1,567,723
Total investment earnings 7,430,656 6,364,534 13,795,190 Less investment costs 516,785 441,146 957,931
Net investment earnings 6,913,871 5,923,388 12,837,259 Total additions 9,242,287 7,774,352 17,016,639
Deductions
Benefits paid to participants or beneficiaries 9,070,783 7,046,616 16,117,399 Administrative expense 41,141 32,848 73,989
Total deductions 9,111,924 7,079,464 16,191,388
Net increase in fiduciary net position 130,363 694,888 825,251
Net position restrictedfor pensions - January 1, as restated 70,910,402 60,285,047 131,195,449
Net position restrictedfor pensions - December 31 $ 71,040,765 $ 60,979,935 $ 132,020,700
City of Colorado Springs 2020 Annual Comprehensive Financial Report 269

270 City of Colorado Springs 2020 Annual Comprehensive Financial Report

STATISTICAL SECTION
The statistical section includes six categories of information:
Financial Trend Analysis: This section is intended to assist in understanding and assessing how the City’s financial position has changed over time. Tables 1 through 4 include current and prior years information on net position and fund balances.
Revenue Capacity Analysis:
This section is intended to assist in understanding and assessing factors affecting the City’s ability to generate its own source revenues. The City’s largest own source revenue is the City’s sales tax. Tables 5 through 7 provide data related to the City’s sales tax collected, direct and overlapping sales and use tax rates and the City’s taxpayers by industry.
Debt Capacity Analysis:
This section is intended to assist in understanding and assessing the City’s tax burden and its ability to issue additional debt. Tables 8 through 12 outline various debt analysis including direct and overlapping debt, legal debt margin and pledged revenue coverage.
Demographic and Economic Analysis:
This section is intended to assist in (1) understanding the socioeconomic environment within which the City operates and (2) providing information to facilitate comparisons of financial statement information over time and among governments. Tables 13 through 15 provide information on various demographic and economic statistics, principal employers, and full time equivalent City government employees.
Operating Analysis: This section is intended to provide contextual information about the City’s operations and resources to assist in using the financial statement information in understanding the City’s economic condition. Tables 16 and 17 provide statistical information on operating indicators and capital assets.
Other Information:
Other tables required for disclosure are also included in this section. Tables 18 through 21 provide sales and use tax revenue collection costs and required refunds, assessed valuations, property tax levies and collections, direct and overlapping mill levy rates, landfill closure and postclosure costs.
City of Colorado Springs 2020 Annual Comprehensive Financial Report 271

NET POSITION BY COMPONENTLast ten fiscal years
Fiscal Year
2020 2019 2018 2017
Governmental activitiesNet investment in capital assets $ 1,480,807,235 $ 1,413,603,440 $ 1,379,549,497 $ 1,320,601,473
Restricted 40,763,006 36,632,780 47,078,513 38,015,920
Unrestricted (80,551,115) (81,798,147) (130,182,875) (100,500,356)
Total governmental activities net position $ 1,441,019,126 $ 1,368,438,073 $ 1,296,445,135 $ 1,258,117,037
Business-type activitiesNet investment in capital assets $ 2,090,953,267 $ 2,229,703,432 $ 2,109,118,989 $ 1,962,444,943
Restricted 67,324,018 57,212,559 41,771,236 46,297,314
Unrestricted 1,869,084 (59,476,898) (136,986,951) (69,559,753)
Total business-type activities net position $ 2,160,146,369 $ 2,227,439,093 $ 2,013,903,274 $ 1,939,182,504
Primary governmentNet investment in capital assets $ 3,571,760,502 $ 3,643,306,872 $ 3,488,668,486 $ 3,283,046,416
Restricted 108,087,024 93,845,339 88,849,749 84,313,234
Unrestricted (78,682,031) (141,275,045) (267,169,826) (170,060,109)
Total primary government net position $ 3,601,165,495 $ 3,595,877,166 $ 3,310,348,409 $ 3,197,299,541
272 City of Colorado Springs 2020 Annual Comprehensive Financial Report

CITY OF COLORADO SPRINGSCOLORADO
Table 1
Fiscal Year2016 2015 2014 2013 2012 2011
$ 1,248,000,610 $ 1,246,630,036 $ 1,247,391,126 $ 1,222,445,299 $ 1,204,660,019 $ 1,189,009,759
43,747,103 28,406,351 23,557,193 20,966,471 19,196,709 18,374,171
(89,121,095) (79,724,995) 72,305,489 74,861,853 85,263,142 71,001,838
$ 1,202,626,618 $ 1,195,311,392 $ 1,343,253,808 $ 1,318,273,623 $ 1,309,119,870 $ 1,278,385,768
$ 1,872,057,076 $ 1,731,137,866 $ 1,566,906,671 $ 1,423,336,171 $ 1,313,687,876 $ 1,302,975,565
51,102,001 69,882,674 61,330,543 42,190,406 81,754,874 127,607,494
(49,050,476) (63,038,610) 156,215,483 224,351,377 351,354,252 607,184,465
$ 1,874,108,601 $ 1,737,981,930 $ 1,784,452,697 $ 1,689,877,954 $ 1,746,797,002 $ 2,037,767,524
$ 3,120,057,686 $ 2,977,767,902 $ 2,814,297,797 $ 2,645,781,470 $ 2,518,347,895 $ 2,491,985,324
94,849,104 98,289,025 84,887,736 63,156,877 100,951,583 145,981,665
(138,171,571) (142,763,605) 228,520,972 299,213,230 436,617,394 678,186,303
$ 3,076,735,219 $ 2,933,293,322 $ 3,127,706,505 $ 3,008,151,577 $ 3,055,916,872 $ 3,316,153,292
City of Colorado Springs 2020 Annual Comprehensive Financial Report 273

CHANGES IN NET POSITIONLast ten fiscal years
Fiscal Year2020 2019 2018 2017
ExpensesGovernmental activities:
General government $ 99,253,639 $ 75,779,622 $ 109,660,430 $ 101,607,259 Public safety 245,421,258 230,131,163 181,773,131 187,325,052 Planning — 12,198,087 7,957,832 7,924,192 Planning and community development 11,967,295 — — — Public works 138,423,494 118,032,617 141,233,041 130,509,017 Parks 27,732,987 29,426,437 26,268,032 26,088,482 Health and welfare — — — — Culture and recreation — — — — Urban redevelopment and housing — — — — Economic development — — — — Interest on long-term debt 2,414,226 2,047,097 1,975,934 2,289,562
Total governmental activities 525,212,899 467,615,023 468,868,400 455,743,564 Business-type activities:
Utilities 764,323,344 741,238,248 818,765,578 793,109,339 PACE 58,949,000 59,525,000 59,945,000 60,277,000 MHS 2,945,094 2,987,413 3,052,496 3,035,965 Airport — — — — Parking — — — — Other non-major enterprises 53,259,512 54,212,096 40,715,626 42,098,307
Total business-type activities 879,476,950 857,962,757 922,478,700 898,520,611 Total primary government expenses $ 1,404,689,849 $ 1,325,577,780 $ 1,391,347,100 $ 1,354,264,175
Program RevenuesGovernmental activities:
Charges for services:General government $ 25,017,621 $ 25,884,456 $ 27,461,626 $ 16,985,911 Public safety 6,500,328 7,154,791 6,951,073 7,355,565 Planning — 2,132,235 2,061,979 2,019,143
Planning and community development 5,502,211 — — — Public works 21,772,133 16,962,729 14,883,995 12,470,148 Parks 2,220,471 3,044,391 3,018,873 2,866,225 Culture and recreation — — — — Urban redevelopment and housing — — — — Economic development — — — —
Operating grants and contributions 73,426,500 36,420,060 24,963,955 18,571,546 Capital grants and contributions 81,129,207 82,048,509 100,366,905 121,233,985
Total governmental activities $ 215,568,471 $ 173,647,171 $ 179,708,406 $ 181,502,523
Notes: The City adopted GASB Statement No. 61 in 2013, which requires PACE to be presented as a blended component unit. In 2012, Airport and Parking were moved from major funds to non-major funds and are presented as Other.
274 City of Colorado Springs 2020 Annual Comprehensive Financial Report

CITY OF COLORADO SPRINGSCOLORADO
Table 2(PAGE 1 OF 2)
Fiscal Year2016 2015 2014 2013 2012 2011
$ 65,304,997 $ 64,459,559 $ 66,869,211 $ 57,776,797 $ 58,618,337 $ 48,067,151 190,623,311 168,628,903 168,664,690 158,517,649 149,168,556 149,930,831 — — — — — — 22,968,689 12,523,168 — — — — 120,721,459 83,608,555 78,015,459 80,476,208 74,045,666 67,067,654 28,826,273 24,400,726 — — — — — — 1,083,268 1,057,832 1,274,298 1,214,081 — — 27,008,991 22,344,456 22,238,048 21,789,448 — — 5,721,466 4,775,034 6,803,814 5,032,806 — — 3,811,264 3,292,753 2,711,136 2,619,256 2,415,117 2,875,505 3,397,967 4,683,225 4,867,183 5,020,740 430,859,846 356,496,416 354,572,316 332,923,954 319,727,038 300,741,967
681,776,411 672,816,293 783,594,844 805,232,795 749,375,429 818,668,053 60,545,000 60,810,000 60,995,000 61,041,000 — — 3,175,469 3,285,813 620,537 431,000 431,645,000 560,894,000 — — — — — 24,874,856 — — — — — 3,843,908 36,515,165 39,347,633 37,810,511 47,044,893 43,356,373 12,391,209 782,012,045 776,259,739 883,020,892 913,749,688 1,224,376,802 1,420,672,026 $ 1,212,871,891 $ 1,132,756,155 $ 1,237,593,208 $ 1,246,673,642 $ 1,544,103,840 $ 1,721,413,993
$ 20,800,595 $ 19,975,243 $ 20,374,166 $ 11,468,448 $ 14,284,808 $ 16,781,325 6,742,276 6,930,898 6,413,558 4,796,826 5,032,930 4,585,702 — — — — — — — — — — — — 12,632,805 9,695,070 7,897,929 7,647,033 5,189,248 4,681,309 3,341,163 2,940,722 — — — — — — 2,655,107 2,394,630 2,343,078 2,901,620 — — 236,679 550,014 2,126,074 297,530 — — 1,000 — — — 20,758,053 22,588,951 15,399,529 21,514,697 20,121,901 25,377,676 59,514,382 47,827,449 80,881,804 60,360,011 77,975,257 176,593,370 $ 123,789,274 $ 109,958,333 $ 133,859,772 $ 108,731,659 $ 127,073,296 $ 231,218,532
City of Colorado Springs 2020 Annual Comprehensive Financial Report 275

CHANGES IN NET POSITIONLast ten fiscal years
Fiscal Year2020 2019 2018 2017
Business-type activities:Charges for services:
Utilities $ 884,352,000 $ 893,026,000 $ 890,477,000 $ 839,822,000 PACE 50,567,000 50,108,000 49,628,000 49,148,000 MHS — — — — Airport — — — — Parking — — — — Other non-major enterprises 54,813,785 58,792,179 47,893,293 36,013,711
Capital grants and contributions 81,513,770 87,202,848 70,293,975 61,096,647 Total business-type activities 1,071,246,555 1,089,129,027 1,058,292,268 986,080,358
Total primary government program revenues $ 1,286,815,026 $ 1,262,776,198 $ 1,238,000,674 $ 1,167,582,881
Net revenue (expense)Governmental activities $ (309,644,428) $ (293,967,852) $ (289,159,994) $ (274,241,041) Business-type activities 191,769,605 231,166,270 135,813,568 87,559,747
Total primary government net revenue (expense) $ (117,874,823) $ (62,801,582) $ (153,346,426) $ (186,681,294)
General revenues and other changes in net positionGovernmental activities:
Taxes:Property taxes $ 27,477,739 $ 23,841,133 $ 23,475,282 $ 22,190,678 Sales taxes 295,619,090 292,419,454 286,918,740 268,547,457 Specific ownership taxes 3,358,601 3,279,689 3,374,149 3,395,628 Occupational liquor taxes 324,337 315,546 304,686 291,426 Admissions tax 157,444 575,495 605,403 503,955 Bicycle excise tax 100,802 57,612 78,284 77,140
Investment earnings 8,414,431 8,122,461 2,259,245 1,645,386 Gain on sale of capital assets 1,265,590 1,242,627 1,376,263 1,260,228 Contributions to endowments 66,576 62,074 70,976 1,338,973 Transfers 45,440,871 36,044,699 30,141,965 30,480,589
Total governmental activities 382,225,481 365,960,790 348,604,993 329,731,460 Business-type activities:
Investment earnings 12,067,326 17,150,551 12,406,763 7,994,745 Gain on sale of capital assets 2,406,216 1,263,697 — — Loss on defeasance and repayment of long-term debt — — — — Extraordinary item — — — — Special item (228,095,000) — — — Transfers (45,440,871) (36,044,699) (30,141,965) (30,480,589)
Total business-type activities (259,062,329) (17,630,451) (17,735,202) (22,485,844) Total primary government general revenues and other changes $ 123,163,152 $ 348,330,339 $ 330,869,791 $ 307,245,616
Change in net positionGovernmental activities $ 72,581,053 $ 71,992,938 $ 59,444,999 $ 55,490,419 Business-type activities (67,292,724) 213,535,819 118,078,366 65,073,903
Total primary government change in net position $ 5,288,329 $ 285,528,757 $ 177,523,365 $ 120,564,322
Notes: The City adopted GASB Statement No. 61 in 2013, which requires PACE to be presented as a blended component unit. In 2012, Airport and Parking were moved from major funds to non-major funds and are presented as Other.
276 City of Colorado Springs 2020 Annual Comprehensive Financial Report

CITY OF COLORADO SPRINGSCOLORADO
Table 2(PAGE 2 OF 2)
Fiscal Year2016 2015 2014 2013 2012 2011
$ 793,293,000 $ 830,821,000 $ 868,846,000 $ 823,760,000 $ 849,746,000 $ 830,522,000 48,654,000 48,150,000 47,641,000 47,085,000 — — — — — — 415,872,000 551,709,000 — — — — — 20,360,155 — — — — — 3,831,263 32,830,447 31,592,365 31,029,462 35,699,603 33,843,316 9,612,131 76,081,834 46,213,579 60,238,372 57,956,449 68,939,203 46,543,219 950,859,281 956,776,944 1,007,754,834 964,501,052 1,368,400,519 1,462,577,768 $ 1,074,648,555 $ 1,066,735,277 $ 1,141,614,606 $ 1,073,232,711 $ 1,495,473,815 $ 1,693,796,300
$ (307,070,572) $ (246,538,083) $ (220,712,544) $ (224,192,295) $ (192,653,742) $ (69,523,435) 168,847,236 180,517,205 124,733,942 50,751,364 144,023,717 41,905,742 $ (138,223,336) $ (66,020,878) $ (95,978,602) $ (173,440,931) $ (48,630,025) $ (27,617,693)
$ 23,390,221 $ 22,540,418 $ 22,862,535 $ 24,283,843 $ 22,897,112 $ 24,473,652 252,544,859 190,269,766 185,615,186 172,706,230 163,975,846 155,546,936 2,846,855 2,611,736 2,478,710 2,343,653 2,222,285 2,190,174 280,240 273,125 266,803 264,539 259,820 257,561 503,199 469,933 509,696 432,317 476,030 449,533 85,746 83,080 81,032 78,760 90,536 86,091 1,147,142 1,082,201 1,379,491 1,102,409 1,783,647 1,291,703 2,389,154 135,015 326,919 995,844 — 748,077 171,160 80,485 83,086 70,965 78,943 73,080 31,027,222 30,725,000 32,055,000 32,116,530 33,145,262 30,235,004 314,385,798 248,270,759 245,658,458 234,395,090 224,929,481 215,351,811
8,117,657 7,111,047 4,534,754 4,070,731 18,412,607 3,492,224 — — — — — — — — — — (47,903,000) — — — — (507,000) — — (9,811,000) — — — (372,358,584) (1,015,237) (31,027,222) (30,725,000) (32,055,000) (32,116,530) (33,145,262) (30,235,004) (32,720,565) (23,613,953) (27,520,246) (28,552,799) (434,994,239) (27,758,017) $ 281,665,233 $ 224,656,806 $ 218,138,212 $ 205,842,291 $ (210,064,758) $ 187,593,794
$ 7,315,226 $ 1,732,676 $ 24,945,914 $ 10,202,795 $ 32,275,739 $ 145,828,376 136,126,671 156,903,252 97,213,696 22,198,565 (290,970,522) 14,147,725 $ 143,441,897 $ 158,635,928 $ 122,159,610 $ 32,401,360 $ (258,694,783) $ 159,976,101
City of Colorado Springs 2020 Annual Comprehensive Financial Report 277

FUND BALANCES OF GOVERNMENTAL FUNDSLast ten fiscal years
Fiscal Year2020 2019 2018 2017
General fundNonspendable $ 314,487 $ 267,873 $ 299,253 $ 291,430 Restricted 19,726,250 21,453,968 21,315,406 22,881,977 Committed 16,606,280 8,619,660 14,812,118 10,470,218 Assigned 7,516,635 3,271,255 5,218,259 7,783,758 Unassigned 82,295,044 51,208,209 31,892,186 32,322,036
Total general fund $ 126,458,696 $ 84,820,965 $ 73,537,222 $ 73,749,419
All other governmental fundsNonspendable $ 14,709,687 $ 13,199,141 $ 11,410,452 $ 12,294,033 Restricted 58,126,794 66,424,359 53,061,975 51,226,624 Committed 42,929,762 33,683,967 29,880,201 23,078,768 Assigned 4,222,562 9,272,911 2,800,134 1,845,149
Total all other governmental funds $ 119,988,805 $ 122,580,378 $ 97,152,762 $ 88,444,574
278 City of Colorado Springs 2020 Annual Comprehensive Financial Report

CITY OF COLORADO SPRINGSCOLORADO
Table 3
Fiscal Year2016 2015 2014 2013 2012 2011
$ 365,732 $ 384,475 $ 450,771 $ 133,289 $ 132,999 $ 609,243 30,049,266 7,545,287 9,996,781 8,182,418 7,547,036 7,547,034 5,234,626 6,150,522 6,369,071 5,565,912 3,857,623 1,231,321 4,042,429 3,629,733 2,937,924 8,070,526 3,212,142 3,415,078 29,290,407 32,707,058 33,950,373 35,115,277 47,194,174 37,994,759 $ 68,982,460 $ 50,417,075 $ 53,704,920 $ 57,067,422 $ 61,943,974 $ 50,797,435
$ 11,162,249 $ 11,195,086 $ 11,540,728 $ 11,049,247 $ 10,440,549 $ 9,721,218 48,084,352 34,619,120 33,433,127 30,599,345 32,237,097 26,971,406 23,230,678 21,439,222 16,622,140 14,015,208 11,107,290 10,824,498 856,356 245,488 1,050,454 847,687 32,259 120,349 $ 83,333,635 $ 67,498,916 $ 62,646,449 $ 56,511,487 $ 53,817,195 $ 47,637,471
City of Colorado Springs 2020 Annual Comprehensive Financial Report 279

CHANGES IN FUND BALANCES OF GOVERNMENTAL FUNDSLast ten fiscal years
Fiscal Year
2020 2019 2018 2017
RevenuesTaxes $ 327,038,013 $ 320,488,929 $ 314,756,544 $ 295,006,284
Licenses and permits — — — —
Licenses, permits and fines 8,702,782 10,068,157 7,873,189 6,327,465
Intergovernmental 107,556,349 80,885,614 68,996,748 69,428,549
Charges for services 33,326,352 29,685,094 26,834,822 25,891,928
Endowments and donations 3,005,744 3,820,491 1,845,510 3,236,664
Other revenue 7,721,596 7,893,331 7,604,283 3,476,744
Interfund services provided 8,045,494 7,502,200 6,917,339 6,762,691
Investment earnings 8,239,439 7,882,201 1,986,453 1,571,506
Rental income 268,537 419,232 478,850 407,287
Total revenues 503,904,306 468,645,249 437,293,738 412,109,118
ExpendituresGeneral government 87,782,199 83,717,293 76,027,262 73,012,905
Public safety 210,066,967 212,865,070 187,304,322 177,723,464
Planning — 12,073,572 7,780,318 7,858,733
Planning and community development 11,845,861 — — —
Public works 57,250,219 56,847,630 58,917,887 60,324,119
Parks 22,936,508 25,189,127 23,364,222 23,585,967
Health and welfare — — — —
Culture and recreation — — — —
Urban redevelopment and housing — — — —
Economic development — — — —
Miscellaneous — 22,461 18,199 18,417
Debt service
Principal 10,216,347 9,166,475 6,864,565 5,143,602
Interest 2,451,305 1,997,549 1,990,333 2,443,203
Issuance expense — 266,544 — 270,998
Capital outlay 109,264,107 88,763,142 105,294,562 87,074,558
Total expenditures 511,813,513 490,908,863 467,561,670 437,455,966
Deficiency of revenues under expenditures (7,909,207) (22,263,614) (30,267,932) (25,346,848)
Other financing sources (uses)Transfers - in 40,271,985 45,095,199 43,771,245 39,343,387
Transfers - out (5,097,427) (11,017,348) (12,096,375) (8,862,798)
Issuance of debt — 9,000,000 — 29,930,000
Payment on refunding bonds — — — (31,647,240)
Premium on bonds issued — 1,602,734 — 1,988,238
Capital lease financing 10,515,217 13,051,761 5,712,792 3,212,931
Loss on investments — — — —
Sale of capital assets 1,265,590 1,242,627 1,376,261 1,260,228
Total other financing sources (uses) 46,955,365 58,974,973 38,763,923 35,224,746
Net change in fund balances $ 39,046,158 $ 36,711,359 $ 8,495,991 $ 9,877,898
Debt service as a percentage of noncapital expenditures 2.9 % 2.6 % 2.2 % 2.0 %
Note: Prior to 2014, reimbursements from other funds were offset against its corresponding expense. This change was implemented to provide better comparisons to budget.
280 City of Colorado Springs 2020 Annual Comprehensive Financial Report

CITY OF COLORADO SPRINGSCOLORADO
Table 4
Fiscal Year
2016 2015 2014 2013 2012 2011
$ 279,651,120 $ 216,248,058 $ 211,813,962 $ 200,109,342 $ 189,921,630 $ 183,003,947
— — 1,860,374 1,940,283 1,761,529 870,688
6,571,781 7,216,901 — — — —
59,298,336 57,047,283 51,801,244 49,448,348 51,689,187 62,487,615
26,036,068 22,254,241 24,395,457 22,180,061 20,532,487 21,739,662
2,037,905 2,154,590 1,498,184 1,282,267 1,584,805 1,315,079
5,799,418 3,404,021 3,242,165 2,410,136 4,742,492 4,468,747
7,022,399 7,613,978 7,997,266 — — —
1,143,834 1,059,514 1,388,369 1,115,418 1,752,286 1,327,990
419,745 249,746 588,703 589,610 570,703 605,115
387,980,606 317,248,332 304,585,724 279,075,465 272,555,119 275,818,843
52,896,927 55,772,800 56,713,784 56,098,731 48,772,398 47,390,554
170,809,396 168,750,783 159,829,593 149,890,554 145,044,874 141,877,121
15,740,999 — — — — —
— 10,279,313 — — — —
51,168,691 46,688,517 38,414,786 38,659,424 32,353,857 31,816,336
25,670,280 21,701,668 — — — —
— — 1,080,000 1,040,000 1,270,179 1,209,861
— — 22,720,707 18,044,391 18,718,313 18,216,191
— — 4,952,651 4,402,839 6,531,559 4,877,732
— — 3,799,765 3,237,248 2,702,372 2,610,152
22,597 24,352 14,708 670,525 1,160,787 3,374,694
6,067,329 10,933,009 13,334,381 14,397,183 13,352,897 12,225,107
2,414,008 2,916,884 3,437,765 4,803,195 5,079,904 5,258,816
— — — — — 188,001
75,270,238 30,211,685 29,987,604 24,582,564 16,958,479 29,006,978
400,060,465 347,279,011 334,285,744 315,826,654 291,945,619 298,051,543
(12,079,859) (30,030,679) (29,700,020) (36,751,189) (19,390,500) (22,232,700)
47,515,435 45,666,562 42,711,618 42,406,999 40,886,014 39,793,341
(16,799,425) (13,768,280) (10,656,618) (10,622,278) (6,740,752) (7,877,337)
13,690,000 — 8,960,000 — — 13,485,000
— — (8,856,720) — — (16,262,864)
— — — — — 563,751
1,844,224 — — 1,776,674 2,402,394 —
— (438,002) — — — —
229,729 135,021 314,200 1,007,534 169,107 748,075
46,479,963 31,595,301 32,472,480 34,568,929 36,716,763 30,449,966
$ 34,400,104 $ 1,564,622 $ 2,772,460 $ (2,182,260) $ 17,326,263 $ 8,217,266
2.4 % 4.4 % 5.4 % 6.5 % 7.4 % 6.9 %
City of Colorado Springs 2020 Annual Comprehensive Financial Report 281

SALES AND USE TAX REVENUELast ten fiscal years
CITY OF COLORADO SPRINGSCOLORADO
Table 5
FiscalYear
CitySales and Use
Tax
Public SafetySales and Use
Tax
Road RepairMaintenance and
ImprovementTax
Trails, Open Spaceand Parks
Sales and UseTax
Total DirectTax Rate
2011 $ 118,569,370 $ 23,713,874 $ — $ 5,928,467 2.50%2012 126,925,671 25,385,133 — 6,346,282 2.50%2013 134,068,394 26,813,678 — 6,703,421 2.50%2014 142,102,152 28,420,430 — 7,105,106 2.50%2015 148,658,292 29,731,659 — 7,432,914 2.50%2016 162,067,524 32,413,507 49,743,080 8,103,376 3.12%2017 170,186,924 34,037,386 52,744,961 8,509,345 3.12%2018 181,242,818 36,248,564 56,176,843 9,062,141 3.12%2019 185,508,324 37,101,665 57,539,153 9,275,416 3.12%2020 186,289,844 37,257,968 57,756,132 9,314,492 3.12%
Source: City Sales Tax Division Reports.
282 City of Colorado Springs 2020 Annual Comprehensive Financial Report

DIRECT AND OVERLAPPINGSALES AND USE TAX RATESLast ten fiscal years
CITY OF COLORADO SPRINGSCOLORADO
Table 6
City Direct Rates Overlapping Rates
FiscalYear
CitySales and Use
Tax (%)
Public SafetySales and Use
Tax (%)
Trails, Open Spaceand Parks
Sales and UseTax (%)
2C Road Repair& Maintenance
Tax (%)Total
Direct (%)
El PasoCountySales
Tax (%)
Pikes Peak RuralTransportation
AuthorityTax (%)
Total Directand
OverlappingRates (%)
2011 2.00 0.40 0.10 0.00 2.50 1.00 1.00 4.50
2012 2.00 0.40 0.10 0.00 2.50 1.00 1.001 4.50
2013 2.00 0.40 0.10 0.00 2.50 1.232 1.00 4.73
2014 2.00 0.40 0.10 0.00 2.50 1.23 1.00 4.73
2015 2.00 0.40 0.10 0.00 2.50 1.23 1.00 4.73
2016 2.00 0.40 0.10 0.623 3.12 1.23 1.00 5.35
2017 2.00 0.40 0.10 0.62 3.12 1.23 1.00 5.35
2018 2.00 0.40 0.10 0.62 3.12 1.23 1.00 5.35
2019 2.00 0.40 0.10 0.62 3.12 1.23 1.00 5.35
2020 2.00 0.40 0.10 0.62 3.12 1.23 1.00 5.35
Note: In April 1991, voters approved City Charter Amendment #3, entitled the "Taxpayers Bill of Rights." A similar statewide constitutional amendment was passed in November 1992. One of the provisions of this amendment is that advance voter approval is necessary for any new tax or tax increase.
1In November 2012, voters in EPC, Colorado Springs, Manitou Springs, Green Mountain Falls, and Ramah approved an extension of the capital portion of PPRTA, which is 55% of the 1-cent sales and use tax. This extends the PPRTA tax through 2024.
2In November 2012, voters in EPC approved an increase to the EPC sales tax rate by .23 of 1-cent. The increased tax rate was effective as of January 1, 2013. The sales tax increase has a sunset date of January 1, 2021. The .23% is to be used for public safety critical needs as explained in EPC Resolution No. 12-309.
3In November 2015, voters in Colorado Springs approved a sales and use tax of .62 of 1-cent to be used for road repair and maintenance. The increased tax rate was effective as of January 1, 2016, with a sunset date of January 1, 2021. On November 5, 2019, voters approved a five year extension with a lower rate. The extended tax rate represents a reduction from .62 to .57 of 1-cent from January 1, 2021, through December 31, 2025.
City of Colorado Springs 2020 Annual Comprehensive Financial Report 283

PRINCIPAL TAXPAYERS CITY OF COLORADO SPRINGSCOLORADO
Table 7
SALES AND USE TAXPAYERS BY INDUSTRYCurrent year and nine years ago
Fiscal Year 2020 Fiscal Year 2011
Industry
Sales andUse TaxAmount Rank
Percentage ofTotal City Sales
and Use Tax
Sales andUse TaxAmount Rank
Percentage ofTotal City Sales
and Use Tax
Building materials $ 44,508,705 1 15.03 % $ — — — Miscellaneous retail 40,413,192 2 13.65 % 20,093,282 1 13.33 %Auto dealers 35,454,980 3 11.97 % 16,879,835 5 11.20 %Miscellaneous non-retail 32,457,399 4 10.96 % 17,145,560 4 11.38 %Restaurant 32,221,012 5 10.88 % 19,659,573 2 13.05 %Department and discount stores — — — 19,381,285 3 12.86 %
$ 185,055,288 62.49 % $ 93,159,535 61.82 %
Source: Sales Tax Division.
Note: Due to requirements under the City Charter, the names of the ten largest revenue payers are confidential. The industry categories listed provide alternative information regarding the sources of the City's revenue.
PROPERTY TAXPAYERSCurrent year
Fiscal Year 2020
Taxpayer Type of BusinessAssessedValuation
Percentage ofTotal City Assessed
Value
Cellco Partnership (f/k/a Verizon Wireless) Utility $ 101,367,210 1.61 %Wal-Mart Real Estate Discount retail 45,868,060 0.73 %Broadmoor Hotel Inc Resort hotel 35,650,570 0.57 %Comcast of Colorado Utility 27,259,110 0.43 %Palmer Center Owner LLC Real estate company 15,378,200 0.24 %Progressive Direct Insurance Co Insurance corporation 14,516,260 0.23 %SAP America Inc Software developer 13,077,190 0.21 %Dpix LLC Imaging solutions manufacturer 13,052,110 0.21 %TRP Colorado Springs LLC Investment services 12,887,960 0.21 %Great Wolf Lodge Resort hotel 12,845,350 0.20 %
$ 291,902,020 4.64 %
Source: El Paso County Treasurer's office.
Note: See Table 19 for the City's assessed value information.Property taxpayer information is included for continuing disclosure requirements on bonds. As such, only current year data is presented.
284 City of Colorado Springs 2020 Annual Comprehensive Financial Report

CIT
Y O
F C
OLO
RA
DO
SPR
ING
SC
OLO
RA
DO
Tabl
e 8
Per
Cap
ita1
$ 6,
326
5,
568
7,
209
7,
207
6,
990
6,
781
6,
556
6,
509
6,
201
6,
103
Not
e: D
etai
ls re
gard
ing
the
City
's o
utst
andi
ng d
ebt c
an b
e fo
und
in th
e no
tes
to th
e fin
anci
al s
tate
men
ts.
B
egin
ning
with
201
3, d
ebt a
mou
nts
are
net o
f rel
ated
pre
miu
ms,
dis
coun
ts, a
nd a
djus
tmen
ts.
1 Per
sona
l inc
ome
and
popu
latio
n da
ta w
as u
pdat
ed fo
r prio
r yea
rs a
nd c
an b
e fo
und
on T
able
13.
Perc
enta
ge o
f Pe
rson
al
Inco
me1
10.2
5%8.
8811
.45
10.9
810
.39
9.85
9.09
8.54
7.77
7.34
Tota
l Prim
ary
Gov
ernm
ent
(in 0
00's
)
$ 2,
706,
502
2,
414,
371
3,
161,
095
3,
192,
347
3,
149,
546
3,
119,
488
3,
062,
431
3,
084,
949
2,
963,
895
2,
951,
451
Bus
ines
s-Ty
pe A
ctiv
ities
(in
000'
s)
Cap
ital
Leas
es
$ 1,
391
1,
208
64
9
272
—
888
65
1
409
16
2
378
Not
es P
ayab
le
$ 94
,979
30,5
58
21
,417
21,4
67
54
,169
103,
077
30
,130
12,1
26
8,
981
14
,490
Rev
enue
B
onds
$ 2,
501,
884
2,
285,
310
3,
061,
246
3,
106,
294
3,
042,
226
2,
952,
994
2,
969,
753
3,
011,
814
2,
879,
823
2,
861,
582
Gov
ernm
enta
l Act
iviti
es (i
n 00
0's)
Cap
ital
Leas
es
$ 17
,913
16,1
90
4,
622
1,
133
81
4
1,95
1
4,12
5
7,46
9
16,5
15
21
,004
Leas
e/Le
ase
Purc
hase
$ —
—
—
—
—
13,6
90
12
,445
11,1
50
9,
835
8,
495
RA
TIO
S O
F O
UTS
TAN
DIN
GD
EBT
BY
TYPE
Last
ten
fisca
l yea
rs
Cer
tific
ates
of
Part
icip
atio
n
$ 43
,440
41,8
05
41
,345
39,4
76
37
,512
35,4
33
34
,632
32,1
76
41
,594
40,3
72
Sale
s Ta
x R
even
ue
Bon
ds
$ 30
,750
24,0
30
17
,544
10,0
81
2,
635
—
—
—
—
—
Gen
eral
O
blig
atio
n B
onds
$ 16
,145
15,2
70
14
,272
13,6
24
12
,190
11,4
55
10
,695
9,80
5
6,98
5
5,13
0
Fisc
al
Year
2011
2012
2013
2014
2015
2016
2017
2018
2019
2020
City of Colorado Springs 2020 Annual Comprehensive Financial Report 285

RATIOS OF GENERAL BONDEDDEBT OUTSTANDINGLast ten fiscal years
CITY OF COLORADO SPRINGSCOLORADO
Table 9
FiscalYear
GeneralObligation
Bonds(in 000's)
Less: Non-CityObligations(in 000's) 2
City GeneralObligation
Bonds(in 000's)
AssessedValue of Property(in 000's)
Percentage ofAssessedValue of Property
PerCapita 1
2011 $ 16,145 $ 16,145 $ — $ 4,938,341 — $ — 2012 15,270 15,270 — 4,601,619 — — 2013 14,272 14,272 — 4,600,222 — — 2014 13,624 13,624 — 4,608,210 — — 2015 12,190 12,190 — 4,678,625 — — 2016 11,455 11,455 — 4,985,582 — — 2017 10,695 10,695 — 5,048,413 — — 2018 9,805 9,805 — 5,414,794 — —
2019 6,985 6,985 — 5,508,082 — —
2020 5,130 5,130 — 6,280,902 — —
Note: Details regarding the City's outstanding debt can be found in the notes to the financial statements. Beginning with 2013, debt amounts are net of related premiums, discounts, and adjustments.
1Population data can be found on Table 13.2Non-City Obligations represent general obligation bonds of the City's blended component units. These bonds are to be repaid solely by
funds provided by the property owners within the geographical boundaries of the component units.
286 City of Colorado Springs 2020 Annual Comprehensive Financial Report

DIRECT AND OVERLAPPINGGOVERNMENTAL ACTIVITIES DEBTAs of December 31, 2020
CITY OF COLORADO SPRINGSCOLORADO
Table 10
Governmental Unit
EstimatedPercentageApplicable
DebtOutstanding
EstimatedShare of
OverlappingDebt
DebtOutstanding(Excluding
COPs)
EstimatedShare of
OverlappingDebt
(ExcludingCOPs)
El Paso County 63.32 % $ 99,301,554 $ 62,873,646 $ 2,986,554 $ 1,890,963 Harrison School District #2 92.2 % 139,223,284 128,365,033 139,223,284 128,365,033 Widefield School District #3 3.06 % 57,151,803 1,749,028 57,151,803 1,749,028 Fountain/Fort Carson School District #8 0.03 % 11,885,317 3,982 295,317 99 Colorado Springs School District #11 91.77 % 113,300,052 103,973,030 93,440,052 85,747,934 Cheyenne Mountain School District #12 97.51 % 48,495,000 47,286,490 48,495,000 47,286,490 Manitou School District #14 10.44 % 745,000 77,788 745,000 77,788 Academy School District #20 85.14 % 322,502,890 274,572,434 322,502,890 274,572,434 Ellicott School District #22 0.16 % 1,858,941 2,982 1,858,941 2,982 Falcon School District #49 51.35 % 157,601,072 80,923,311 10,394,814 5,337,418 Barnes & Powers North BID 100.00 % 3,324,503 3,324,503 3,324,503 3,324,503 Barnes & Powers South BID 100.00 % 385,000 385,000 385,000 385,000 Briargate Center BID 100.00 % 11,803,105 11,803,105 11,803,105 11,803,105 Creekwalk Marketplace BID 100.00 % 27,370,782 27,370,782 27,370,782 27,370,782 CS Downtown Development Authority 100.00 % 1,350,000 1,350,000 1,350,000 1,350,000 First & Main BID 100.00 % 1,390,000 1,390,000 1,390,000 1,390,000 First & Main #2 BID 100.00 % 26,814,252 26,814,252 26,814,252 26,814,252 First & Main North BID 100.00 % 1,648,699 1,648,699 1,648,699 1,648,699 Interquest North BID 100.00 % 12,007,719 12,007,719 12,007,719 12,007,719 Interquest South BID 100.00 % 4,244,075 4,244,075 4,244,075 4,244,075 Interquest Town Center BID 100.00 % 2,942,430 2,942,430 2,942,430 2,942,430 Powers & Woodmen BID 100.00 % 3,671,502 3,671,502 3,671,502 3,671,502 Southwest Downtown BID 100.00 % 27,422,865 27,422,865 27,422,865 27,422,865 Colorado Springs Urban Renewal Authority 100.00 % 115,355,498 115,355,498 115,355,498 115,355,498
Total overlapping debt 939,558,154 784,760,599
City direct debt 75,001,000 34,629,000
Total direct and overlapping debt $ 1,014,559,154 $ 819,389,599
Sources: Assessed value data used to estimate applicable percentages is provided by the El Paso County Assessor's office final certification letter dated November 27, 2019. Debt outstanding data provided by each governmental unit.
Note: Overlapping governments are those that coincide, at least in part, with the geographic boundaries of the City. This schedule estimates the portion of the outstanding debt of those overlapping governments that is borne by the residents and businesses of the City.This process recognizes that, when considering the government's ability to issue and repay long-term debt, the entire debt burden borne by the residents and businesses should be taken into account. However, this does not imply that every taxpayer is a resident, and therefore responsible for repaying the debt of each overlapping government.Debt Outstanding values include General Obligation bonds, Certificates of Participation (COP), Capital Leases, and other types of debt, net of related premiums, discounts, and adjustments.
City of Colorado Springs 2020 Annual Comprehensive Financial Report 287

CIT
Y O
F C
OLO
RA
DO
SPR
ING
SC
OLO
RA
DO
Tabl
e 11
Fisc
al Y
ear
2011
$ 49
3,83
4,14
0
—
$ 49
3,83
4,14
0
0.00
%
2012
$ 46
0,16
1,90
2
—
$ 46
0,16
1,90
2
0.00
%
2013
$ 46
0,02
2,28
9
—
$ 46
0,02
2,28
9
0.00
%
2014
$ 46
0,82
1,03
9
—
$ 46
0,82
1,03
9
0.00
%
2015
$ 46
7,86
2,48
0
—
$ 46
7,86
2,48
0
0.00
%
2016
$ 49
8,55
8,17
1
—
$ 49
8,55
8,17
1
0.00
%
2017
$ 50
4,84
1,28
0
—
$ 50
4,84
1,28
0
0.00
%
2018
$ 54
1,47
9,43
8
—
$ 54
1,47
9,43
8
0.00
%
1 Bas
ed u
pon
the
last
pre
cedi
ng a
sses
smen
t per
City
Cha
rter §
7-8
0(b)
.
Lega
l Deb
t Mar
gin
Cal
cula
tion
for F
isca
l Yea
r 202
0
2019
$ 55
0,80
8,21
7
—
$ 55
0,80
8,21
7
0.00
%
$ 6,
280,
902,
410
62
8,09
0,24
1
—
—
$ 62
8,09
0,24
1
2020
$ 62
8,09
0,24
1
—
$ 62
8,09
0,24
1
0.00
%
LEG
AL
DEB
T M
AR
GIN
INFO
RM
ATI
ON
Last
ten
fisca
l yea
rs
Ass
esse
d va
lue
- 201
9 fo
r 202
0 ta
xes
Deb
t lim
it (1
0% o
f ass
esse
d va
lue)
1
Deb
t app
licab
le to
lim
it:
Gen
eral
obl
igat
ion
bond
s
Tota
l net
deb
t app
licab
le to
lim
it
Lega
l deb
t mar
gin
Deb
t lim
it
Tota
l net
deb
t app
licab
le to
lim
it
Lega
l deb
t lim
it
Tota
l net
deb
t app
licab
le to
the
limit
as a
pe
rcen
tage
of d
ebt l
imit
288 City of Colorado Springs 2020 Annual Comprehensive Financial Report

PLEDGED REVENUE COVERAGELast ten fiscal years(in 000's)
CITY OF COLORADO SPRINGSCOLORADO
Table 12
Utilities Revenue Bonds Parking Revenue Bonds
Fiscal Year
Applicable Revenues
Less: Operating Expenses
Net Available Revenue
Debt Service
Principal
Debt ServiceInterest Coverage
Applicable Revenues
Less: Operating Expenses
Net Available Revenue
Debt Service
Principal
Debt Service Interest Coverage
2011 $ 871,788 $ 602,713 $ 269,075 $ 27,597 $ 101,451 2.09 $ 3,898 $ 1,540 $ 2,358 $ 525 $ 533 2.23
2012 896,096 558,295 337,801 47,441 103,702 2.23 3,868 1,519 2,349 545 511 2.22
2013 862,958 548,839 314,119 52,285 101,908 2.04 3,965 1,783 2,182 570 488 2.06
2014 906,466 566,921 339,545 57,295 105,303 2.09 4,382 1,804 2,578 595 463 2.44
2015 868,080 493,616 374,464 61,457 105,828 2.24 4,498 2,104 2,394 655 433 2.20
2016 837,827 495,749 342,078 68,637 106,472 1.95 4,683 1,751 2,932 695 215 3.22
2017 883,994 521,799 362,195 71,980 103,440 2.06 4,768 1,902 2,866 710 199 3.15
2018 940,065 548,679 391,386 75,614 106,924 2.14 4,855 2,114 2,741 720 181 3.04
2019 946,907 529,572 417,335 81,947 104,036 2.24 5,080 2,515 2,565 700 164 2.97 3
2020 947,570 505,838 441,732 89,045 107,245 2.25 5,191 2,420 2,771 715 147 3.22
Public Authority for Colorado Energy Revenue Bonds Pikes Peak America's Mountain Revenue Bonds
Fiscal Year
Net Applicable Revenues
Debt Service
Principal
Debt Service Interest Coverage
Applicable Revenues
Less: Operating Expenses
Net Available Revenue
Debt Service
Principal
Debt Service Interest Coverage
2011 — — — — — — — — — —
2012 — — — — — — — — — —
2013 $ 29,605 $ 5,795 $ 40,616 0.64 1 — — — — — —
2014 29,984 6,690 40,282 0.64 — — — — — —
2015 30,313 7,600 39,898 0.64 — — — — — —
2016 30,627 8,535 39,461 0.64 — — — — — —
2017 30,953 9,535 38,970 0.64 — — — — — —
2018 31,291 10,580 38,422 0.64 $ 10,672 $ 4,532 $ 6,140 $ — $ — —
2019 31,590 11,680 37,813 0.64 13,562 4,853 8,709 400 1,551 4.46
2020 31,890 12,860 37,098 0.64 10,825 5,585 5,240 490 1,457 2.69
MHS Revenue Bonds Sales and Use Tax Revenue Bonds
Fiscal Year
Applicable Revenues
Less: Operating Expenses
Net Available Revenue
Debt Service
Principal
Debt Service Interest Coverage
Sales and Use Tax Collections
Debt Service
Principal
Debt Service Interest Coverage
2011 $ 616,378 $ 566,987 $ 49,391 $ 8,152 $ 16,984 1.96 $ 121,250 $ 6,530 $ 1,321 15.44
2012 — — — — — — 128,019 6,720 1,124 16.32
2013 — — — — — — 134,751 6,925 922 17.17
2014 — — — — — — 144,887 7,130 713 18.47
2015 — — — — — — 148,056 7,340 499 18.89
2016 — — — — — — 156,716 2,635 132 56.64
2017 — — — — — — — — — —
2018 — — — — — — — — — —
2019 — — — — — — — — — —
2020 — — — — — — — — — —
Airport Revenue Bonds
Fiscal Year
Applicable Revenues
Less: Operating Expenses
Net Available Revenue
Debt Service
Principal
Debt Service Interest Coverage
2011 $ 21,995 $ 14,400 $ 7,595 $ 3,020 $ 2,218 1.45
2012 21,306 14,342 6,964 3,180 2,056 1.33
2013 20,440 13,314 7,126 3,350 1,887 1.36
2014 16,081 12,712 3,369 1,395 1,172 1.31
2015 17,270 12,782 4,488 1,565 862 1.85
2016 15,822 11,822 4,000 990 473 2.74
2017 13,900 14,373 (473) 1,040 423 (0.32) 2
2018 — — — — — —
2019 — — — — — —
2020 — — — — — —
Note: Details regarding the City's outstanding debt can be found in the notes to the financial statements.1The City adopted GASB Statement No. 61 in 2013, which requires PACE to be presented as a blended component unit.2The Airport believes that it is in compliance with the bond covenants based on the second criteria stated in the bond documents. Under the second criteria, the calculated debt service coverage is 4.81. These bonds were defeased in 2018. 3As restated
City of Colorado Springs 2020 Annual Comprehensive Financial Report 289

I
DEMOGRAPHIC ANDECONOMIC STATISTICSLast ten fiscal years
CITY OF COLORADO SPRINGSCOLORADO
Table 13
Fiscal Year Population1Personal Income
(in 000's)2Per Capital Personal
Income2 Unemployment Rate3
2011 427,863 * $ 26,408,772 $ 39,994 9.4 %
2012 433,580 * 27,180,204 40,622 9.2 %
2013 438,468 * 27,596,635 40,680 8.0 %
2014 442,940 * 29,082,644 42,379 5.1 %
2015 450,587 * 30,319,650 43,447 4.0 %
2016 460,018 * 31,668,303 44,458 3.2 %
2017 467,108 * 33,681,400 46,529 3.4 %
2018 473,928 * 36,128,371 49,007 4.6 %
2019 477,975 * 38,125,082 * 51,120 * 2.8 %
2020 483,624 * 40,232,145 * 53,324 * 8.6 % *
Sources:1Colorado Department of Local Affairs, Demography section.2U.S. Department of Commerce, Bureau of Economic Analysis for Colorado Springs, CO Metropolitian Statistical Area (MSA).3U.S. Department of Labor, Bureau of Labor Statistics for City of Colorado Springs, CO MSA.
*Estimate
290 City of Colorado Springs 2020 Annual Comprehensive Financial Report

PRINCIPAL EMPLOYERSCurrent Year and Nine Years Ago
CITY OF COLORADO SPRINGSCOLORADO
Table 14
2020 2011
Employer Rank
Percentage ofTotal CountyEmployment Rank
Percentage ofTotal CountyEmployment
Fort Carson 1 11.0 % 1 12.3 %United States Air Force Academy 2 3.2 % 4 2.8 %Schriever Air Force Base 3 2.5 % 3 3.5 %Peterson Air Force Base 4 2.0 % 2 5.0 %UCHealth - Memorial Health System 5 2.0 % 5 2.0 %Penrose St. Francis Health Services / Centura 6 1.4 % 8 1.1 %School District # 11 - Colorado Springs 7 1.4 % 6 1.7 %School District # 20 - Air Academy 8 1.2 % 7 1.2 %El Paso County 9 1.2 % 10 0.9 %City of Colorado Springs1 10 0.8 % 9 1.0 %
26.7 % 31.5 %
Source: The Colorado Springs Chamber & Economic Development Corporation and U.S. Department of Labor, Bureau of Labor Statistics for El Paso County, CO
1City of Colorado Springs includes the total of all full-time equivalent employees (FTE's) in all funds and enterprises except Colorado Springs Utilities and Memorial Health System.
City of Colorado Springs 2020 Annual Comprehensive Financial Report 291

FULL-TIME EQUIVALENT CITY GOVERNMENT EMPLOYEESBY FUNCTION/PROGRAMLast ten fiscal years
CITY OF COLORADO SPRINGSCOLORADO
Table 15
Fiscal YearFunction/Program 2020 2019 2018 2017 2016 2015 2014 2013 2012 2011
General government 366.25 341.75 326.75 308.25 257.25 256.25 256.25 253.15 285.08 239.80 Public safety 1,612.00 1,584.00 1,516.00 1,478.00 1,471.00 1,470.50 1,407.75 1,382.75 1,366.75 1,421.75 Public works 189.00 188.00 187.00 245.00 212.00 208.00 207.50 274.00 281.00 267.00 Culture and recreation — — — — — — 114.25 112.75 111.50 119.25
Parks 162.75 158.75 147.75 139.75 138.75 132.75 — — — —
Planning — 55.00 44.00 40.00 — — — — — — Planning and community development 57.00 — — — 63.00 33.00 — — — — Urban redevelopment and housing — — — — — — 32.00 31.00 34.00 41.00 Utilities 1,825.75 1,821.50 1,824.00 1,824.00 1,824.00 1,824.00 1,874.00 1,859.00 1,859.00 1,856.00 MHS 1 — — — — — — — — — 3,555.00 Airport 104.00 102.00 100.00 98.00 95.00 93.00 96.00 121.00 122.00 121.00 Parking 11.00 10.00 9.50 8.50 8.50 8.50 8.50 7.50 7.50 7.50
Stormwater2 73.00 73.00 67.00 — — — — — — — Other non-major enterprise funds 52.00 51.00 50.00 50.00 51.00 49.50 47.00 47.00 49.00 68.50
Total 4,452.75 4,385.00 4,272.00 4,191.50 4,120.50 4,075.50 4,043.25 4,088.15 4,115.83 7,696.80
Sources: Various City departments and Utilities.
Notes: Function/Program FTE count previously included all other non-Enterprise and non-General Fund positions in General Government. Historical full-time equivalent (FTE) count has been updated to reflect the department in which staff resides.
1 Beginning in 2012, as a result of the MHS lease, MHS figures are no longer included.2 In November 2017, the voters of Colorado Springs approved Issue 2A, which establishes and authorizes a stormwater fee. The fee was
effective as of July 1, 2018, at which time 67 FTEs from general government were transferred into the enterprise.
292 City of Colorado Springs 2020 Annual Comprehensive Financial Report

City of Colorado Springs 2020 Annual Comprehensive Financial Report 293
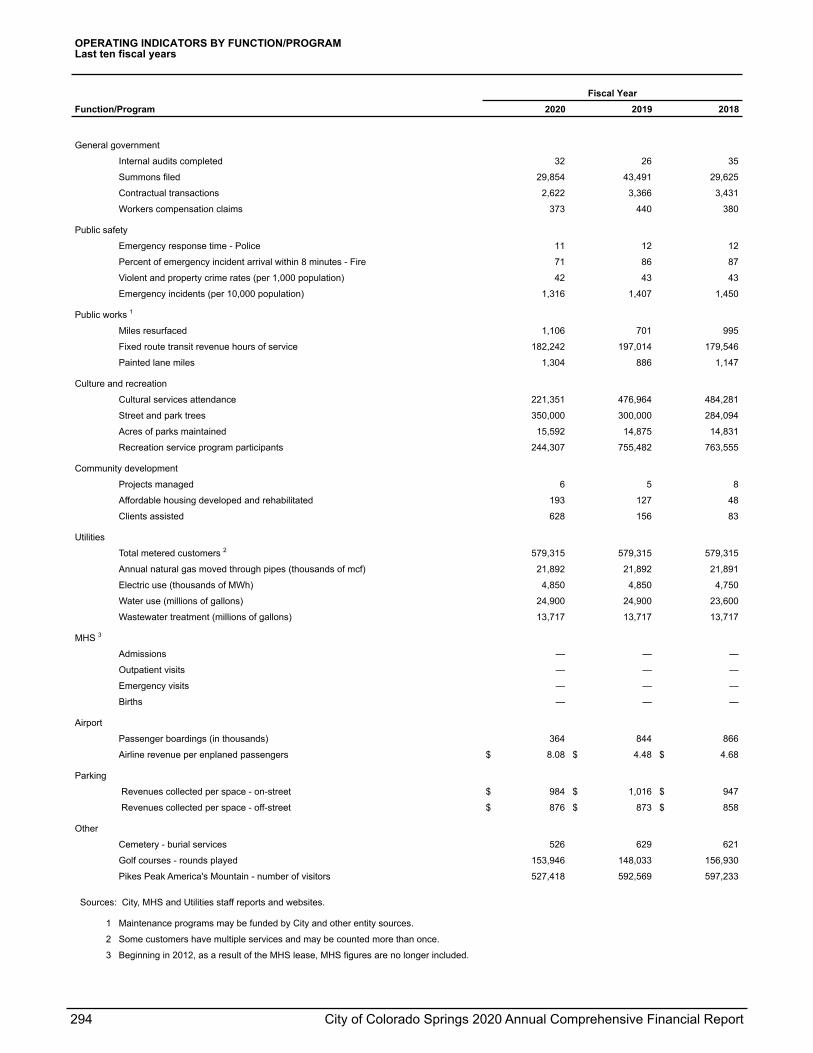
OPERATING INDICATORS BY FUNCTION/PROGRAMLast ten fiscal years
Fiscal YearFunction/Program 2020 2019 2018
General government
Internal audits completed 32 26 35
Summons filed 29,854 43,491 29,625
Contractual transactions 2,622 3,366 3,431
Workers compensation claims 373 440 380
Public safety
Emergency response time - Police 11 12 12
Percent of emergency incident arrival within 8 minutes - Fire 71 86 87
Violent and property crime rates (per 1,000 population) 42 43 43
Emergency incidents (per 10,000 population) 1,316 1,407 1,450
Public works 1
Miles resurfaced 1,106 701 995
Fixed route transit revenue hours of service 182,242 197,014 179,546
Painted lane miles 1,304 886 1,147
Culture and recreation
Cultural services attendance 221,351 476,964 484,281
Street and park trees 350,000 300,000 284,094
Acres of parks maintained 15,592 14,875 14,831
Recreation service program participants 244,307 755,482 763,555
Community development
Projects managed 6 5 8
Affordable housing developed and rehabilitated 193 127 48
Clients assisted 628 156 83
Utilities
Total metered customers 2 579,315 579,315 579,315
Annual natural gas moved through pipes (thousands of mcf) 21,892 21,892 21,891
Electric use (thousands of MWh) 4,850 4,850 4,750
Water use (millions of gallons) 24,900 24,900 23,600
Wastewater treatment (millions of gallons) 13,717 13,717 13,717
MHS 3
Admissions — — —
Outpatient visits — — —
Emergency visits — — —
Births — — —
Airport
Passenger boardings (in thousands) 364 844 866
Airline revenue per enplaned passengers $ 8.08 $ 4.48 $ 4.68
Parking
Revenues collected per space - on-street $ 984 $ 1,016 $ 947
Revenues collected per space - off-street $ 876 $ 873 $ 858
Other
Cemetery - burial services 526 629 621
Golf courses - rounds played 153,946 148,033 156,930
Pikes Peak America's Mountain - number of visitors 527,418 592,569 597,233
Sources: City, MHS and Utilities staff reports and websites.
1 Maintenance programs may be funded by City and other entity sources.
2 Some customers have multiple services and may be counted more than once.
3 Beginning in 2012, as a result of the MHS lease, MHS figures are no longer included.
294 City of Colorado Springs 2020 Annual Comprehensive Financial Report

CITY OF COLORADO SPRINGSCOLORADO
Table 16
Fiscal Year2017 2016 2015 2014 2013 2012 2011
33 26 39 33 26 26 26
22,000 29,731 36,676 37,928 29,066 34,499 36,678
3,434 3,350 3,533 2,255 2,726 2,897 2,636
346 405 353 426 451 386 418
12 14 13 13 13 12 11
88 89 88 89 90 90 89
38 40 40 40 46 40 42
1,472 1,471 1,417 1,340 1,284 1,272 1,266
1,432 1,133 187 115 109 178 148
163,025 150,399 130,653 120,031 108,441 112,877 124,011
1,414 830 801 1,465 1,355 1,398 1,449
451,689 379,938 343,124 324,337 256,389 192,280 256,547
284,600 284,800 213,207 213,874 214,670 218,000 126,602
14,479 14,807 15,063 14,527 16,277 16,184 16,143
791,234 765,539 664,283 646,744 602,271 691,105 691,786
9 6 6 6 12 17 2
295 108 69 156 122 135 188
295 108 69 156 122 288 188
558,570 558,570 547,764 540,990 537,096 537,096 530,208
22,354 22,603 23,816 20,602 23,376 23,376 24,020
4,580 4,700 4,800 4,600 4,600 4,600 4,630
23,700 21,900 21,600 28,700 27,800 27,800 23,700
13,717 14,699 13,870 15,586 15,586 15,586 15,586
— — — — — 17,420 25,633
— — — — — 280,982 384,655
— — — — — 101,550 135,517
— — — — — 3,286 4,604
850 656 598 623 650 822 814
$ 4.71 $ 6.06 $ 9.39 $ 8.80 $ 13.86 $ 8.46 $ 9.77
$ 916 $ 895 $ 853 $ 967 $ 737 $ 729 $ 791
$ 995 $ 983 $ 838 $ 855 $ 862 $ 767 $ 793
621 630 587 600 603 601 698
170,008 156,734 147,877 164,299 161,015 188,546 173,011
498,722 482,963 415,092 345,701 284,879 265,332 265,124
City of Colorado Springs 2020 Annual Comprehensive Financial Report 295

CAPITAL ASSET STATISTICSBY FUNCTION/PROGRAMLast ten fiscal years
CITY OF COLORADO SPRINGSCOLORADO
Table 17
Fiscal YearFunction/Program 2020 2019 2018 2017 2016 2015 2014 2013 2012 2011
Public safetyPolice
Area commands (stations) 4 4 4 4 4 4 4 4 4 4 Patrol units 277 233 237 211 197 171 171 181 185 205
FireStations 23 22 22 22 22 21 21 21 20 20 Emergency units 84 84 84 84 84 84 84 77 75 73
Public worksStreets (lane miles) 6,232 6,134 5,973 5,849 5,688 5,688 5,636 5,620 5,609 5,609 Major bridges 223 223 223 223 224 223 223 215 215 212 Signalized intersections 612 609 606 591 585 584 574 569 565 563 Transit buses 61 61 60 56 49 45 43 43 43 57
Culture and recreationParks and open space locations 206 205 205 205 205 205 204 201 201 200 Sports complexes 4 4 4 4 4 4 4 5 5 5 Community centers 5 4 4 4 5 5 4 4 4 4
UtilitiesElectric distribution lines (miles) 3,839 3,839 3,831 3,808 3,316 3,316 3,316 3,316 3,316 3,451 Natural gas pipe (miles) 2,586 2,586 2,576 2,539 2,488 2,432 2,408 2,408 2,408 2,400 Water distribution lines (miles) 2,152 2,152 2,139 2,117 2,068 2,300 2,040 2,015 2,015 2,010
MHS 1
Number of hospital beds — — — — — — — — — 671 Health care facilities — — — — — — — — — 16
AirportNumber of runways 3 3 3 3 3 3 3 3 3 3
ParkingNumber of parking spaces - on-street 2,553 2,453 2,415 2,415 2,416 2,417 2,400 2,400 2,389 2,360 Number of parking spaces - off-street 2,681 2,681 2,706 2,706 2,703 2,703 2,703 2,703 2,703 2,703
Sources: City, MHS and Utilities staff reports and websites.
1 Beginning in 2012, as a result of the MHS lease, MHS figures are no longer included.
296 City of Colorado Springs 2020 Annual Comprehensive Financial Report

SALES AND USE TAX REVENUECOLLECTION COSTS AND REQUIRED REFUNDSLast ten fiscal years
CITY OF COLORADO SPRINGSCOLORADO
Table 18
Fiscal YearRequired Refunds
2011 $ 518,744 2012 564,879 2013 534,003 2014 1,173,501 2015 916,479 2016 1,496,130 2017 514,490 2018 621,042 2019 395,621 2020 1,518,106
Note: This table reflects values for the General Fund only.
City of Colorado Springs 2020 Annual Comprehensive Financial Report 297

ASSESSED VALUATIONS, PROPERTY TAXLEVIES AND COLLECTIONSLast ten fiscal years
CITY OF COLORADO SPRINGSCOLORADO
Table 19
FiscalYear
AssessedValuation(in 000's)
TotalTax Levy
TotalCurrent
Collections
Collectionsas a
Percentof Levy
Current YearOutstandingDelinquent
Taxes
All YearsOutstandingDelinquent
Taxes
All YearsDelinquentTaxes as a
Percent of Levy2011 $ 4,938,341 $ 21,131,161 $ 20,617,424 97.6% $ 50,327 $ 105,906 0.5%2012 4,601,619 19,690,330 19,208,455 97.6% 52,186 132,999 0.7%2013 4,600,223 19,684,353 19,226,023 97.7% 50,149 133,289 0.7%2014 4,608,210 19,718,537 19,164,390 97.2% 21,534 45,424 0.2%2015 4,678,625 20,019,838 19,469,574 97.3% 25,572 44,165 0.2%2016 4,985,582 21,333,306 20,014,822 93.8%1 31,404 51,934 0.2%2017 5,048,413 19,368,851 18,751,296 96.8% 7,002 30,799 0.2%2018 5,414,777 20,663,441 19,939,068 96.5% 7,494 24,685 0.1%2019 5,508,082 21,019,928 20,324,600 96.7% 3,315 12,579 0.1%2020 6,280,902 24,311,078 23,479,175 96.6% 14,628 20,394 0.1%
Notes: Collections are net of positive and negative abatements.Fiscal year is the year of collection.Certification of assessed valuation and mill levies is done in the year prior to the year of collection.
1 During 2015, in the ordinance certifying the tax levy for 2015 taxes payable in 2016, City Council approved a temporary property tax credit on all taxable business personal property equal to one-half (1/2) of the gross mill levy (tax credit equal to 2.139 mills). El Paso County (EPC) was unable to reflect the temporary tax credit on the assessment rolls and property tax statements due to the timing of the request by the City. As a result, the full mill levy was assessed and the City processed refunds to effect the temporary BPPT credit. The artificially high mill levy assessment negatively impacted the collections percentage calculation for 2016. For 2017, the temporary BPPT credit was correctly reflected as a lower tax levy by EPC.
298 City of Colorado Springs 2020 Annual Comprehensive Financial Report

DIRECT AND OVERLAPPING MILL LEVYRATES - WITHIN CITY LIMITSLast ten fiscal years
CITY OF COLORADO SPRINGSCOLORADO
Table 20
FiscalYear City
CountyGovernment
SchoolDistrictNo 11
LibraryDistrict
WaterConservancy
District Total
2011 4.279 7.717 42.493 3.556 0.947 58.9922012 4.279 7.597 44.004 3.999 0.947 60.8262013 4.279 7.663 43.445 4.000 0.944 60.3312014 4.279 7.714 44.264 4.000 0.940 61.1972015 4.279 7.791 43.165 4.000 0.940 60.1752016 4.279 7.869 40.803 3.857 0.941 57.7492017 4.279 7.919 40.878 3.957 0.940 57.9732018 4.279 7.965 52.499 3.812 0.939 69.4942019 4.279 8.068 56.084 4.000 0.944 73.3752020 4.279 7.035 51.558 3.731 0.902 67.505
Notes: Fiscal year is the year of collection.Certification of assessed valuation and mill levies is done in the year prior to the year of collection.Rates include levies for operations and debt service.Representative sample of overlapping districts, other overlapping district mill levies vary.
City of Colorado Springs 2020 Annual Comprehensive Financial Report 299

MUNICIPAL SOLID WASTE LANDFILLCLOSURE AND POSTCLOSURE CARE COSTSDecember 31, 2020
CITY OF COLORADO SPRINGSCOLORADO
Table 21
FacilityClosureCosts
PostclosureCosts
TotalCost
Percentage ofCapacity Used
Estimated Lifespan in
Years
Hancock $ 341,810 $ 4,280 $ 346,090 N/A N/A
Clear Spring Gravel Pit 1 93,225 708,749 801,974 88.87-100.00% 11-32
Clear Spring Gravel Pit 2 C&D solids 152,679 66,871 219,550 67.78% 49
Clear Spring - Ash disposal 2,026,182 985,920 3,012,102 71.58% 45
Clear Spring - Biosolids 2,826,275 1,211,176 4,037,451 46.31% 80
Northfield Recovery Pond — 193,600 193,600 100.00% —
Total cost $ 5,440,171 $ 3,170,596 $ 8,610,767
Notes: Percentage of capacity used does not apply to the Hancock facility. The entire liability for this facility is recognized on the Government-wide Statement of Net Position under governmental activities.
Liabilities for the Clear Spring (formerly Hanna Ranch) facilities and Northfield Recovery Pond are recognized on a capacity used basis in the Utilities fund on Exhibit 7; total costs for the Clear Spring facilities and Northfield Recovery Pond based on capacity used are estimated at $8,264,677. The liability is recognized on the Government-wide Statement of Net Position under business-type activities. The total costs from the above table are based on the last 5 year independent assessment adjusted by inflation.
300 City of Colorado Springs 2020 Annual Comprehensive Financial Report