Creating history: documents and patient participation in nurse-patient interviews
Upload
khangminh22Category
view
1download
0
HAL Id: hal-01671644https://hal.archives-ouvertes.fr/hal-01671644
Submitted on 22 Dec 2017
HAL is a multi-disciplinary open accessarchive for the deposit and dissemination of sci-entific research documents, whether they are pub-lished or not. The documents may come fromteaching and research institutions in France orabroad, or from public or private research centers.
L’archive ouverte pluridisciplinaire HAL, estdestinée au dépôt et à la diffusion de documentsscientifiques de niveau recherche, publiés ou non,émanant des établissements d’enseignement et derecherche français ou étrangers, des laboratoirespublics ou privés.
Patient-specific fracture risk assessment of vertebrae: Amultiscale approach coupling X-ray physics and
continuum micromechanicsRomane Blanchard, Claire Morin, Andrea Malandrino, Alain Vella, Zdenka
Sant, Christian Hellmich
To cite this version:Romane Blanchard, Claire Morin, Andrea Malandrino, Alain Vella, Zdenka Sant, et al.. Patient-specific fracture risk assessment of vertebrae: A multiscale approach coupling X-ray physics andcontinuum micromechanics. International Journal for Numerical Methods in Biomedical Engineering,John Wiley and Sons, 2016. �hal-01671644�

INTERNATIONAL JOURNAL FOR NUMERICAL METHODS IN BIOMEDICAL ENGINEERINGInt. J. Numer. Meth. Biomed. Engng. (2016); e02760Published online in Wiley Online Library (wileyonlinelibrary.com). DOI: 10.1002/cnm.2760
Patient-specific fracture risk assessment of vertebrae: A multiscaleapproach coupling X-ray physics and continuum micromechanics
Romane Blanchard1, Claire Morin2, Andrea Malandrino3, Alain Vella4, Zdenka Sant4
and Christian Hellmich1,*,†
1 TU Wien–Vienna University of Technology, Institute for Mechanics of Materials and Structures, Karlsplatz 13/202,Vienna 1040, Austria
2 CIS-EMSE, CNRS:UMR 5307, LGF, Ecole Nationale Supérieure des Mines, Saint-Etienne F-42023, France3 Institute for Bioengineering of Catalonia, C/Baldiri Reixac 10–12, Barcelona 08028, Spain
4 Mechanical Engineering Department, University of Malta, Tal Qroqq, Msida MSD 2080, Malta
SUMMARY
While in clinical settings, bone mineral density measured by computed tomography (CT) remains the keyindicator for bone fracture risk, there is an ongoing quest for more engineering mechanics-based approachesfor safety analyses of the skeleton. This calls for determination of suitable material properties from respectiveCT data, where the traditional approach consists of regression analyses between attenuation-related greyvalues and mechanical properties.
We here present a physics-oriented approach, considering that elasticity and strength of bone tissue orig-inate from the material microstructure and the mechanical properties of its elementary components. Firstly,we reconstruct the linear relation between the clinically accessible grey values making up a CT, and the X-ray attenuation coefficients quantifying the intensity losses from which the image is actually reconstructed.Therefore, we combine X-ray attenuation averaging at different length scales and over different tissues, withrecently identified ‘universal’ composition characteristics of the latter.
This gives access to both the normally non-disclosed X-ray energy employed in the CT-device and to invivo patient-specific and location-specific bone composition variables, such as voxel-specific mass density,as well as collagen and mineral contents. The latter feed an experimentally validated multiscale elastoplasticmodel based on the hierarchical organization of bone. Corresponding elasticity maps across the organ enter afinite element simulation of a typical load case, and the resulting stress states are increased in a proportionalfashion, so as to check the safety against ultimate material failure. In the young patient investigated, evennormal physiological loading is probable to already imply plastic events associated with the hydrated mineralcrystals in the bone ultrastructure, while the safety factor against failure is still as high as five. Copyright ©2016 John Wiley & Sons, Ltd.
Received 14 October 2015; Accepted 15 October 2015
KEY WORDS: X-ray physics; bone mass density; spine; bone; strength; continuum micromechanics;elastoplasticity.
1. INTRODUCTION
The broad scattering of ultimate forces bearable by human vertebrae [1–4] has motivated the questfor indicators of the actual, that is, patient-specific, strength exhibited by a particular vertebral bodyof interest, and the most accepted indicator in this context remains the ‘bone mineral density –BMD’ [5, 6]. However, it is much less clear how and to which extent BMD (alone) would governbone fracture risk, and there is an ongoing discussion on additional or alternative risk indicators[7–12], based on quite comprehensive statistical analyses. At the same time, it is clearly felt that an
*Correspondence to: Christian Hellmich, TU Wien–Vienna University of Technology, Institute for Mechanics ofMaterials and Structures, Karlsplatz 16, Vienna 1040, Austria.
†E-mail: [email protected]
Copyright © 2016 John Wiley & Sons, Ltd. (1 of 36) e02760

e02760 (2 of 36) R. BLANCHARD ET AL.
engineering mechanics-based assessment of fracture risk, as it is the basis for structural design incivil and mechanical engineering, should hold the capacity to overcome the shortcomings of thepurely statistics-based and population-related approaches referred to earlier. Accordingly, computedtomography (CT)-based and finite element-based failure risk assessment of bony structures remainsone of the central desires in bone biomechanics. This topic has been dealt with extensively, butbroad clinical application has not been achieved yet. The reason for this could be that the physicalorigins of bone strength may need to be considered more deeply and rigorously than it has beenattempted so far. In fact, when screening the comprehensive literature on the topic, it becomes obvi-ous that even the most famous contributions on the topic rely on purely elastic analyses. Typically,linear regression parameters between linear elastic FE analyses and strength tests performed on thesame piece of bone are established, which are typically superior to regressions between strength andsome direct radiological measures [3, 13, 14]. In other studies, stress states derived from linear finiteelement analyses are averaged over suitably chosen ‘regions of interest’, and corresponding averagestress levels are thought to be relevant for fracture risk assessment [15]. Still, one might argue thatthe choice of such regions of interest may be quite arbitrary, but at the same time very influentialon the corresponding simulation results. This would call for a deeper theoretical involvement intothe material mechanics of bone, and a particularly notable approach was realized for human femura[16, 17], where a certain consensus has been gained in the community as regards to CT-to-mechanicscalibration schemes [18–20]. Namely, elastic properties derived from CT-based and mass density-based calibration schemes [21–24] are mapped onto finite element meshes, and for a variety of loadcases, strains as obtained from an elastic simulation are assessed with respect to a failure criterionbased on a constant maximum principal strain. The aforementioned consensus (or even enough datafor potentially reaching it) is hard to find for other types of bone where only very few studies exist[25], so that again deeper theoretical understanding is necessary, the obvious next step thereby con-cerning elastoplasticity. In fact, elastoplastic finite element simulations on bony organs have alreadybeen performed [26], and they have turned out to be useful when it comes to simulate the interac-tion between an implant and the neighboring bone. Still, this does not render the entire issue of bonestrength assessment as being solved. There is a second challenge, which needs to be overcome: thedetermination of relevant mechanical properties (elastic as well as elasto-plastic strength values),from clinically available CT images. The traditional approach [15] consists of regression analysesbetween attenuation-related grey values and mechanical properties; however, no consensus existson unique regression parameters. They most probably depend on various additional variables, suchas CT machine settings and X-ray energies used. Still, such empirical density-stiffness relations arealso used in an inverse fashion, in order to relate elastic property distributions across organs to cor-responding mass densities [27]. In this case, the elastic property distributions were determined suchthat given physiological load cases resulted in targeted strain magnitudes as proposed in the frame-work of the Mechanostat theory [28]. On the other hand, a more physics-oriented approach wouldask for the origin of elasticity and strength of the material found within each voxel to be found in acomputed tomograph – this origin being the material microstructure and the mechanical propertiesof its elementary components, in the case of bone: hydroxyapatite, collagen, and water with somenon-collageneous organics. Thanks to recent discoveries concerning universal patterns in bone tis-sue composition and microstructure [29–32], as well as their effects on the tissue’s elasticity andstrength [33–35], we are now in the position to rigorously relate tissue mass densities and porosi-ties at different scales of observation, to corresponding elastic and strength values. Still, these massdensities need to be related to the grey values defining a CT-image, in order to obtain the desired(unique and reliable) relation between CT-numbers and mechanical properties. In this context, itproved useful to translate the chemical characteristics (and hence the mass density) of the matterfound in each and every voxel making up a 3D stack of CT images, into the corresponding X-rayattenuation coefficients, based on the publicly available National Institute of Standards and Tech-nology (NIST) database [36] and the average rule for attenuation coefficients [18, 37–43]. However,such a determination of density/chemistry-attenuation relations is often challenged by the fact thatthe X-ray attenuation coefficients do not only depend on the material’s chemistry (which establishesa link to mass density) but also on the X-ray energy used for the CT image, and as a rule, the lat-ter is not documented in a clinical setting. Extending, modifying, and adapting recent results gained
Copyright © 2016 John Wiley & Sons, Ltd. Int. J. Numer. Meth. Biomed. Engng. (2016); e02760DOI: 10.1002/cnm

PATIENT-SPECIFIC FRACTURE RISK ASSESSMENT OF VERTEBRAE (3 of 36) e02760
in the context of ceramic biomaterials [44], the present paper describes, by example of a humanvertebra, how to overcome this last obstacle, through combining X-ray attenuation averaging at dif-ferent scales and over different tissues, with ‘universal’compositional characteristics of the latter.This opens the way to fully patient-specific and site-specific mass density and composition mapsthroughout the investigated organs. Using this composition as input for mathematically cast explicitquantification of the hierarchical microstructure of bone and its effect on the unique mechanicalproperties of this biological material will finally allow us to extend a safety assessment philosophy,which is used very successfully in everyday steel or concrete engineering, towards the needs of avery intricate life science problem: the breaking of bones.
As regards the use of fundamental principles, X-ray physics-derived (voxel-specific) mineral,collagen, and water contents for a human vertebra will be fed into a homogenization theory-basedmultiscale mechanics representation of bone [34, 35], which has been extensively validated experi-mentally for both elastic and strength properties. This will provide calibration-free and phantom-freeconversion of CT data into mechanical properties.
As regards the safety assessment concept, voxel-specific elastic properties gained by meansof the aforementioned conversion method will enter linear elastic finite element simulations, soas to deliver organ-wide stress distributions related to a typical load case. These local, that is,element-specific, stress states are subsequently increased in a proportional fashion, so as to checkwhich elastoplastic events would develop in the hydrated mineral crystals, before brittle fracture ofmolecular collagen would mark ultimate material failure. The corresponding proportionality factorsquantify the element-specific safety against fracture, which is a lower bound to the overall organfracture risk.
2. MATERIALS AND METHODS
2.1. Conversion of CT grey values into energy–dependent attenuation coefficients, based onstatistical image evaluation and on soft tissue composition rules
A CT scan of a motion segment of a 15-years-old male patient, consisting of two lumbar verte-bral bodies L3 and L4, was obtained from Mater Dei Hospital, Malta. The HiSpeed Dual medicalCT scanner from General Electrics was employed in helical mode, with the following parame-ters: source voltage, 140 kV; source current, 110 �A; exposure time, 1000 ms; image pixel size,0.324 mm; and slice spacing, 1.25 mm. In the respective CT images, which capture not only thebone structure of a vertebral body, but also the surrounding soft tissue, the X-ray attenuation infor-mation is stored in terms of 8-bit grey values, increasing with intensifying attenuation. In order toseparate soft and hard tissues, all the grey values found in the 3D image are evaluated first in termsof a (normalized) histogram, representing a probability density function for the grey value of onevoxel which is randomly chosen from the 3D image. More precisely, in such a histogram, we iden-tify two peaks related to the most frequently occurring grey values, containing (i) adipose tissues(GVfat) and (ii) inner organs (GVsoft), with GVfat < GVsoft. In order to separate bone tissue voxelsfrom their surroundings, we consider the first minimum value of the probability density function,which appears on the right-hand side of GVsoft, that is, for GV > GVsoft. We denote this minimumvalue as segmentation threshold GVthr.
In order to back-translate the user-selected grey scale values into the underlying X-ray attenuationvalues, we consider the linear relation between grey values and X-ray energy-dependent attenuationcoefficients, involving three unknowns: two proportionality factors a and b, and the X-ray energy Eas follows [45]:
�.E/ D a.E/ �GV C b.E/: (1)
Equation (1) expresses that the X-ray attenuation coefficient is no classical material property;namely, it depends not only on the matter contained in a specific voxel but also on the energy usedfor the X-ray penetration of the investigated object. In order to identify the energy-dependent slopeand intercept functions, a.E/ and b.E/, we specify (1) for the aforementioned two landmark valuesconcerning fat and soft tissues:
Copyright © 2016 John Wiley & Sons, Ltd. Int. J. Numer. Meth. Biomed. Engng. (2016); e02760DOI: 10.1002/cnm
e02760 (4 of 36) R. BLANCHARD ET AL.
�fat.E/ D a.E/ �GVfat C b.E/ (2)
�soft.E/ D a.E/ �GVsoft C b.E/: (3)
In order to determine the functions at the left-hand side of Equations (2) and (3), we consider twofundamental relations:
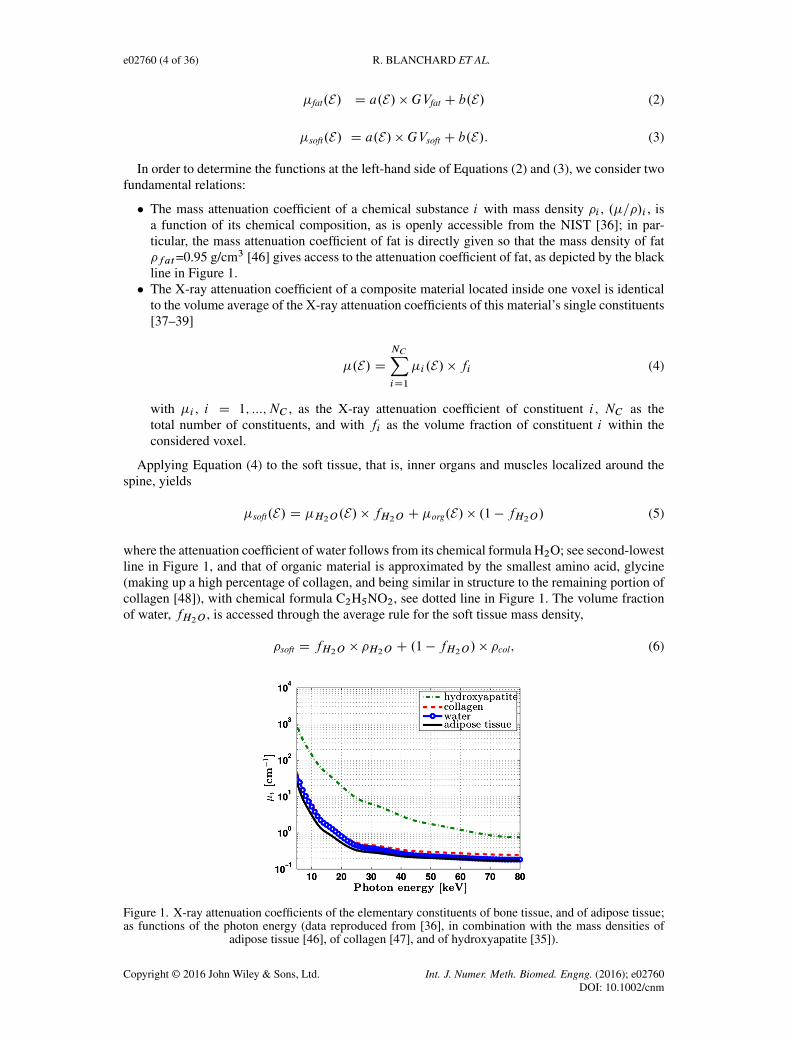
� The mass attenuation coefficient of a chemical substance i with mass density �i , .�=�/i , isa function of its chemical composition, as is openly accessible from the NIST [36]; in par-ticular, the mass attenuation coefficient of fat is directly given so that the mass density of fat�fat=0.95 g/cm3 [46] gives access to the attenuation coefficient of fat, as depicted by the blackline in Figure 1.� The X-ray attenuation coefficient of a composite material located inside one voxel is identical
to the volume average of the X-ray attenuation coefficients of this material’s single constituents[37–39]
�.E/ DNCXiD1
�i .E/ � fi (4)
with �i , i D 1; :::; NC , as the X-ray attenuation coefficient of constituent i , NC as thetotal number of constituents, and with fi as the volume fraction of constituent i within theconsidered voxel.
Applying Equation (4) to the soft tissue, that is, inner organs and muscles localized around thespine, yields
�soft.E/ D �H2O.E/ � fH2O C �org.E/ � .1 � fH2O/ (5)
where the attenuation coefficient of water follows from its chemical formula H2O; see second-lowestline in Figure 1, and that of organic material is approximated by the smallest amino acid, glycine(making up a high percentage of collagen, and being similar in structure to the remaining portion ofcollagen [48]), with chemical formula C2H5NO2, see dotted line in Figure 1. The volume fractionof water, fH2O , is accessed through the average rule for the soft tissue mass density,
�soft D fH2O � �H2O C .1 � fH2O/ � �col; (6)
Figure 1. X-ray attenuation coefficients of the elementary constituents of bone tissue, and of adipose tissue;as functions of the photon energy (data reproduced from [36], in combination with the mass densities of
adipose tissue [46], of collagen [47], and of hydroxyapatite [35]).
Copyright © 2016 John Wiley & Sons, Ltd. Int. J. Numer. Meth. Biomed. Engng. (2016); e02760DOI: 10.1002/cnm

PATIENT-SPECIFIC FRACTURE RISK ASSESSMENT OF VERTEBRAE (5 of 36) e02760
Figure 2. Micro computed tomography image of vertebra, adapted from Malandrino et al. (2012) [49],showing very thin "cortical shell", as well as original position and orientation of cubic samples cut from the
investigated mid-height vertebra.
namely, through
fH2O D�soft � �col
�H2O � �col(7)
with the soft tissue mass density of tissues around the spine being documented as �sof t= 1.052 g/cm3
[46] and �col=1.42 g/cm3 [47].Conclusively, we solve Equations (2) and (3), while considering Equations (4)–(7), for a.E/ and
b.E/.
2.2. Identification of X-ray photon energy and of extracellular bone tissue mass density, based ongeneral bone tissue composition rules
As supplementary voxels of interest, we consider the densest voxel in the corpus vertebrae,GVmax ,which hosts part of the ‘cortical shell’ of the vertebra. However, as seen from the microCT image ofFigure 2, this shell is very thin, with a typical thickness of only 230 �m [50–52], so that the densestvoxel (with a voxel size lvoxel D 324 �m) does not only contain cortical bone, but also adjacentvascular porosity or soft tissue around. Hence, we consider one additional voxel, namely, the densestneighbor of the voxel exhibiting GVmax , also containing both extravascular bone tissue resembling‘cortical bone’, as well as vascular porosity or soft tissue, with GVsoft; see Figure 3.
The grey values related to the aforementioned two voxels are used for identification of the greyvalueGVev , which is related to a (fictitious) voxel being filled by extravascular bone tissue only. Theaforementioned cortical shell thickness either lies fully within one single voxel, or it contributes tothe attenuation coefficients of two neighboring voxels. In the latter case, the cortical shell thicknessis partitioned between the two neighboring voxels, with voxel-specific parts l1 and l2, l1Cl2 D lcort ;see Figure 3, and the former case can be seen as a limit of the latter, characterized by l2 = 0 andl1 D lcort . The area of the voxel not covered by the cortical shell is considered as surroundingsoft tissue on the exterior side of the vertebra, and gel-type, watery fluid-filled and soft cells-filledvascular pore space on the interior side. Because both materials exhibit very similar attenuationproperties, we consider the same grey value for water and for soft tissue.
Copyright © 2016 John Wiley & Sons, Ltd. Int. J. Numer. Meth. Biomed. Engng. (2016); e02760DOI: 10.1002/cnm

e02760 (6 of 36) R. BLANCHARD ET AL.
Figure 3. Partition of cortical shell (with thickness lcort) between two neighboring voxels (with edgelength lvoxel).
In order to use these partitioning considerations for identification of the a priori unknown greyvalue of the extravascular tissue, GVev , we use grey value-to-attenuation relation (1) in average rule(4), so as to show the existence of an average rule for the grey values as well,
GV D
NCXiD1
GVi � fi : (8)
When applying (8) to the cortical shell partitioned between two voxels as depicted in Figure 3, onearrives at the following system of equations:
l1
lvoxel�GVev C
�1 �
l1
lvoxel
��GVsoft D GVmax (9)
l2
lvoxel�GVev C
�1 �
l2
lvoxel
��GVsoft D GVmax�1 (10)
l1 C l2 D lcort: (11)
Solving these three equations for the unknowns GVev , l1, and l2, yields in particular the soughtvalue for GVev as function of all the already identified grey values and length dimensions,
GVev Dlvoxel
lcort� .GVmax CGVmax�1 � 2GVsoft/CGVsoft: (12)
In order to identify the X-ray energy E , which then will allow for a unique scaling relation betweengrey values and attenuation coefficients, as given through Equation (1), we consider two independentways to access the attenuation coefficient of the extravascular bone material, �ev . These two waysneed to deliver one single, unique result:
� The first access to �ev is provided through
�ev.E/ D a.E/ �GVev C b.E/ (13)
fed with the energy-dependent proportionality constants derived from Equations (1)-(7).� The second access is provided through repeated use of Equation (4) for upscaling attenuation
coefficients from the level of the elementary constituents of bone tissue, up to the level of theextravascular bone material.
Copyright © 2016 John Wiley & Sons, Ltd. Int. J. Numer. Meth. Biomed. Engng. (2016); e02760DOI: 10.1002/cnm

PATIENT-SPECIFIC FRACTURE RISK ASSESSMENT OF VERTEBRAE (7 of 36) e02760
As regards the latter item, the NIST-data base allows for retrieval of the attenuation coefficientsof the (mechanically relevant) elementary constituents of extracellular bone tissue: hydroxyapatite,organic material, and water. The two latter ones have been already introduced in Section 2.1, andthe chemical formula Ca10(PO4)6(OH)2 allows for obtaining the hydroxyapatite-related attenuationcurve, as depicted in Figure 1. Use of these functions in Equation (4), that is, upscaling from theelementary to the extracellular level, yields
�upec .E/ D�HA.E/ � f ecHA C �org.E/ � f ecorg C �H2O.E/ � f ecH2O
with f ecH2O C fecorg C f
ecHA D 1:
(14)
The constituent volume fractions f ecHA, f ecorg , and f ecH2O (measured per volume of extracellular(ec) material) depend in a unique fashion on the tissue’s extracellular mass density �ec ; see Figure 4,as evidenced in [30], from a multitude of weighing tests on dried, demineralized, deorganified,and ashed samples collected over 80 years of research [47, 53–63]. This implies the existence of afunction �upec .E ; �ec/, which can then be upscaled to the extravascular level through
�upev .E ; �ec/ D �lac � �H2O.E/C .1 � �lac/ � �upec .E/ (15)
with the lacunar porosity �lac=0.10 [35, 64]. Expressions (13) and (15) need to deliver the sameresult, which we express as a ratio being equal to one,
�ev.E/=�upev .E ; �ec/ D R.E ; �ec/ D 1: (16)
Equation (16) defines a non-bijective function of the mass density as a function of the energy, thatis, one energy value, more than one energy value, or no energy value, may be related to one andthe same mass density value. From this function, the value for the extracellular mass density, whichis related to only one, that is, unique, energy value, will be identified: this provides access to boththe X-ray energy used for the image, and to the extracellular mass density of the investigated bonetissue from a human vertebra.
Figure 4. Universal composition rules in bone tissue [30]: bilinear relations between extracellular constituentvolume fractions and tissue mass density.
Copyright © 2016 John Wiley & Sons, Ltd. Int. J. Numer. Meth. Biomed. Engng. (2016); e02760DOI: 10.1002/cnm

e02760 (8 of 36) R. BLANCHARD ET AL.
2.3. Vertebra tissue mass density from weighing tests
In order to check the relevance of the value for the tissue mass density retrieved by means of thestrategy outlined in Section 2.2, an independent experimental route towards �ec is pursued, throughthe following protocol: From the mid-height portion of an elderly human vertebral body providedby the Medical University of Vienna, a slice was cut out by means of a band saw under continuouswater irrigation (300 Cp; Exakt GmbH, Ingelheim, Germany). Out of this slice, eight cubes with5–6 mm edge length were extracted by means of a wheel saw (Isomet, Buehler, USA). All thespecimens had a face containing the external vertebral cortex, as can be seen in Figure 2. Two exactlyparallel opposite surfaces orthogonal to the cortex layer were cut, whereby attention was paid onmaintaining the cortex undamaged. Then, the specimens were immersed in an ultrasonic bath with0.9% saline solution and standard soap, for 3 min at 40ıC, in order to allow for mixing of the solutionwith the soap. Afterwards, the specimens were left in soaked state, during 24 hours at the sametemperature for lipid dissolution. They were then washed with 0.9% saline solution for 10 min at40ıC under ultrasonic bath, and finally under flushing water at room temperature, in order to furtherclean the pores. The extracellular tissue density was measured by means of Archimedes’ principle:The weightWs of each specimen completely submerged in distilled water (air bubbles were removedunder vacuum) was recorded by means of an analytical balance (PG403-S, Mettler-Toledo GmbH,Switzerland), as was the weight in air, Wa, the latter being accessible after centrifugation at 400 gfor 15 min, in order to remove water from the vascular and lacunar pores. The mass density �ec ofthe extracellular bone matrix was then determined according to
�ec DWa
Wa �Ws: (17)
2.4. Voxel-specific tissue composition
Once the photon energy E is known, it gives access to the extravascular bone matrix attenuationcoefficient via Equation (15), which can then be upscaled to the macroscopic bone material level:Therefore, we specify the average rule (4) for the constituents ‘extravascular bone matrix’ [withvolume fraction (1-�vas)] and vascular porosity (with volume fraction �vas), yielding
�macro D �vas � �H2O C .1 � �vas/ � �ev: (18)
Solving this equation for �vas gives access to voxel-specific values for the vascular porosity,
�vas D�macro � �ev
�H2O � �ev: (19)
�vas can be also used to provide voxel-specific mass densities at the macroscopic scale
�macro D �vas � �H2O C .1 � �vas/ � �ev (20)
based on mass densities at the extravascular scale
�ev D �lac � �H2O C .1 � �lac/ � �ec (21)
Moreover, we are also interested in the apparent mass densities of mineral and collagen, thatis, the ‘bone mineral and collagen mass densities’, the former one being sometimes referred to asvBMD [65].
Therefore, we convert the constituent volume fractions into apparent mass densities of hydroxya-patite, collagen, and water and non-collageneous proteins,
��;ecHA D f
ecHA � �HA (22)
��;eccol D 0:9 � f
ecorg � �col (23)
��;ecH2OCncp D �ec � �
�;ecHA � �
�;eccol (24)
Copyright © 2016 John Wiley & Sons, Ltd. Int. J. Numer. Meth. Biomed. Engng. (2016); e02760DOI: 10.1002/cnm

PATIENT-SPECIFIC FRACTURE RISK ASSESSMENT OF VERTEBRAE (9 of 36) e02760
where we consider that 90% of the organic matter in extracellular bone matrix is collagen [66].The apparent mass densities (22) – (24) are upscaled from the extracellular to the macroscopiclevel through
��HA D ��;ecHA � .1 � �lac/ � .1 � �vas/
��col D ��;eccol � .1 � �lac/ � .1 � �vas/
��H2OCncp D �macro � ��col � �
�HA
(25)
2.5. Intravoxel tissue elasticity
The extracellular mass density and the spatial distribution of vascular porosities determined from aCT scan of a patient by means of a series of X-ray physics considerations, as described in Section2.4 (see in particular Figure 11 for corresponding results), are now converted into voxel-specificelastic properties, on the basis of the multiscale homogenization scheme depicted in Figure 5.
This scheme, described in great detail in [29, 33, 35, 67], quantifies how the elementary mechan-ical constituents of bone, namely, hydroxyapatite, collagen, and water with some non-collageneousorganics, as well as their dosages within the extracellular bone matrix, determine the elastic proper-ties of bone at different length scales. It has been extensively validated experimentally, through an
Figure 5. Multiscale micromechanical representation of bone material, according to Morin andHellmich [35].
Copyright © 2016 John Wiley & Sons, Ltd. Int. J. Numer. Meth. Biomed. Engng. (2016); e02760DOI: 10.1002/cnm

e02760 (10 of 36) R. BLANCHARD ET AL.
ultrasound database stemming from a wealth of bone sources – equine cortical bone [68], bovinetibia [53], drug-treated rabbit bone [69], whale malleus, incus, stapes, periotic and t. bulla [54], finwhale t. bulla [70], dugong rib, elephant radius, human femur, and deer antler [55] – in combina-tion with ‘universal’composition and mineralization rules for bone tissues [30–32, 71]. The latterwere derived from a wealth of biophysical, biochemical, and biomechanical experimental sources[53, 56, 58–61, 72–80]. In this context, bone is represented by a series of representative volume ele-ments (RVEs), the size of which is significantly larger than that of the inhomogeneities found withinsuch a volume [e.g., Figure 5(f) with the vascular pores’ diameters being scale-separated from themillimeter-size of the cortical or trabecular RVE]. Also, representation of the microstructure withinthe RVE is reduced to the bare minimum needed for elasticity homogenization: The domain withinthe RVE is subdivided into the minimum number of material phases with distinctively differingphysical properties: their volume fractions [such as the vascular porosity in Figure 5(f)], their (aver-age) elastic properties [such as those of the vascular pores and of the extravascular bone matrix inFigure 5(f)], the most fundamental shape characteristics (cylinders representing vascular pores in thecase of cortical/trabecular bone), and their interaction [pore inclusions embedded into a solid matrixin Figure 5(f)]. This representation implies the following Mori–Tanaka-scheme-type expression forthe stiffness of cortical/trabecular bone [37],
Cmacro D°�vasCH2O W ŒI C Pcyl W .CH2O �Cev/�
�1 C .1 � �vas/Cev±W
W°�vasŒI C Pcyl W .CH2O �Cev/�
�1 C .1 � �vas/I±�1 (26)
with �vas as the vascular porosity, Cev and CH2O as the elastic stiffness of the extravascular bonematrix and of water, I as the fourth-order identity tensor with components Iijkl D
12.ıikıjl C
ıilıjk/, with the Kronecker delta ıij being equal to 1 for i D j and zero otherwise, and Pcyl asthe fourth-order Hill tensor accounting for the cylindrical shape of the inclusions embedded into atransversely isotropic matrix with stiffness Cev [67].
Within the investigated vertebral body, the vascular porosity is varying from voxel to voxel, asdepicted in Figure 11; all other quantities in Equation (26) are constant. Particularly, the extravascu-lar stiffness follows from feeding the homogenization scheme of Figure 5 with an extracellular massdensity resulting from Equation (16) (and corresponding extracellular volume fractions of mineral,collagen, and water as given in Figure 12), as well as with a lacunar porosity of 10 % [35, 64].
The stiffness tensor of water reads as CH20 D 3IvolkH20, with the bulk modulus of wateramounting to kH2O=2.3 GPa [81], and with Ivol as the volumetric part of the fourth-order identitytensor, with components Ivol;ijkl D
13ıij ıkl .
2.6. Linear finite element simulations
The used finite element model is based on earlier work published in [82]; see Figure 6. It consistsof 125,253 solid elements representing the trabecular bone tissue, and 17,185 shell elements rep-resenting the cortical bone tissue. For the present study, we realized a cortical shell thickness oflcort=0.23 mm [50–52], while the caudal and cranial (bony) endplates were assigned thicknesses oflend = 1 mm [83, 84]. In order to investigate the effect of heterogeneity at the finite element level (i.e.,with gradients measured along a few millimeters), we considered two ways of assigning materialproperties to the finite element model of Figure 6:
� For the so-called ‘homogeneous model’, the entire trabecular bone compartment is assignedthe same elastic stiffness tensor, namely, that related to the average vascular porosity foundin that compartment, � trab
vas D 0:86. More precisely, given the ‘short-beam’-type nature of ourstructure, we assign the longitudinal Young’s modulus
Emacro;3 D1
C�1macro;3333
D 1322 MPa (27)
Copyright © 2016 John Wiley & Sons, Ltd. Int. J. Numer. Meth. Biomed. Engng. (2016); e02760DOI: 10.1002/cnm

PATIENT-SPECIFIC FRACTURE RISK ASSESSMENT OF VERTEBRAE (11 of 36) e02760
Figure 6. Finite element mesh of the patient-specific vertebral body.
with C�1macro;3333 as the longitudinal normal component of the compliance tensor C�1macro and thelongitudinal Poisson’s ratio
�31 D �C�1macro;1133 �Emacro;3 D 0:19 (28)
as ‘formally isotropic’ material properties to the finite element model, as is normally consideredas an appropriate approximation in bone organ mechanics [43, 85, 86]. As regards the very thincortical shell around the organ whose thickness of 230 �m does not quite allow for accommo-dation of Haversian systems (and hence of the vascular porosity), we adopt the ‘macroscopic’stiffness tensor Cmacro related to zero-porosity, that is, that of the extravascular bone matrixaccording to Equation (48). More precisely, as before, we assign as formally isotropic prop-erties, a Young’s modulus and a Poisson’s ratio of 9406 MPa and of 0.28, respectively, to theshell finite elements.� For the "heterogeneous model", the cortical shell treatment does not differ, while the element-
specific stiffness tensors are computed from the vascular porosity values assigned to thecentroids of the finite elements. The interpolation between the CT data and the finite elementsis made by finding the three CT voxels which are closest to the element centroid. The porosityvalues related to these three voxels are then averaged and assigned to the finite element.
Because the focus of the present study is on the effect of material properties rather than on differ-ent loading conditions, we consider a very basic load case, related to mild physiological activity: Apressure amounting to 1 MPa is applied to the cranial endplate, while the caudal endplate is pinnedin all space directions. The pressure magnitude is indeed related to ‘quasi-physiological conditions’:half of the body weight of a person of 65-kg mass in the gravitational field of the earth would resultsin a pressure of 0.55 MPa, when evenly distributed across the surface area AendD 571 mm2 of thecranial endplate. This would be the “static deadload”, about half of the value prescribed to accountfor mild physiological activity.
In order to test the robustness of our model, we compare the computational results of four modelswith increasing element sizes, that is, decreasing amount of elements, namely, 229,138, 143,159,105,763, and 82,848 elements. More precisely, we compute, for all element sizes, the strain energydensity n in the n-th finite element as follows:
n D1
2"n W Cmacro;n W "n (29)
with "n denoting the macroscopic strains in element n, so that the average strain energy over theentire organ reads as follows:
organ D1
Vorgan
NnXnD1
n � Vn (30)
withNn as the number of finite elements, with Vn as the volume of the n-th finite element and Vorgan
as the volume of the entire organ. The results of the linear elastic finite element simulations arethen used for safety assessment of the investigated structure. More precisely, we check by which
Copyright © 2016 John Wiley & Sons, Ltd. Int. J. Numer. Meth. Biomed. Engng. (2016); e02760DOI: 10.1002/cnm

e02760 (12 of 36) R. BLANCHARD ET AL.
proportionality factor the determined element-specific macroscopic stresses needed to be increased,so as to reach ultimate macroscopic bone material failure. This stress increase, however, is sub-jected to macroscopic bone RVEs in an incremental fashion, allowing for elastoplastic deformationstates prior to the ultimate material failure (which obviously depends on these elastoplastic defor-mations). In order to quantify them, we extend the hierarchical scheme depicted in Figure 5 to therealm of elastoplasticity, extending earlier work published in [34]. There, the liquid crystal-typewater interfaces between the mineral crystals and/or crystal clusters in the extrafibrillar space [seeFigure 5(c)] have been identified as the major nanoscopic origin of bone elastoplasticity, both fromthe high interaction energies between water and hydroxyapatite as evidenced by several moleculardynamics and nuclear magnetic resonance studies [87–91], and more importantly, by successfullypredicting, based on experimentally obtained upscaling mineral and collagen strengths [92–94], themacroscopic strengths of different types of bone [95–112]. Such successful representations of bonemicrostructure for mechanical property predictions, which do not resolve the material up to thehighest resolution ever possible, but rather focus on reliable consideration of the mechanically mostimportant micromorphological features, have not only been developed in the framework of contin-uum micromechanics or random homogenization theory, but also in alternative theoretical frames,such as that of lattice models [113].
In the present case, however, fluid-induced, mutual sliding of crystals is associated to elastoplas-tic hydroxyapatite mineral phases, which are oriented uniformly in all space directions, as giventhrough Eulerian angles � and � related to spherical coordinates. These phases obey the followingconstitutive equations. The needle-shaped mineral phase oriented in space direction (�; �) followsan elastoplastic stress–strain relation,
Figure 7. Frequency distribution plot of the attenuation information in terms of grey values of the vertebralbody L3.
Figure 8. Slope and intercept parameters a and b, as functions of the photon energy E .
Copyright © 2016 John Wiley & Sons, Ltd. Int. J. Numer. Meth. Biomed. Engng. (2016); e02760DOI: 10.1002/cnm

PATIENT-SPECIFIC FRACTURE RISK ASSESSMENT OF VERTEBRAE (13 of 36) e02760
�HA;�� D CHA W�"HA;�� � "
p
HA;��
�(31)
with CHA D 3kHAIvol C 2GHAIdev as the isotropic elasticity of hydroxyapatite, kHAD 82:6 GPaand GHAD 44:9 GPa [114], Idev D I � Ivol as the deviatoric component of the fourth-orderidentity tensor, "HA;�� and "p
HA;��as the (average) total and plastic strains in the (��)-oriented
needle-shaped phase, and �HA;�� as the corresponding average stress. Plastic events are quantifiedby means of a Mohr–Coulomb criterion,
FHA;�� D F.�HA;�� / D ˇIHA;�� � IIIHA;�� �
yHA 6 0 (32)
with ˇ as the ratio between the compressive and the tensile yield stresses (ˇ D 12), yHA as thecompressive yield stress (yHA=570 MPa), and I
HA;��> II
HA;��> III
HA;��as the (sorted) prin-
cipal stresses in the (��)-oriented mineral phase. The strength parameters follow from tests onporous hydroxyapatite polycrystals [115–123], mimicking those occurring in the extrafibrillar spaceof Figure 5(c). Potential occurence of plastic events follows the Kuhn–Tucker conditions [124](actually proposed already in 1938 by Melan [125])
PHA;�� > 0; FHA;�� 6 0 and PHA;�� � FHA;�� D 0 (33)
Figure 9. Grey value distribution throughout vertebral cross section where the densest voxel (with GVmax)and its neighbor (with GVmax�1) occur.
Figure 10. Extracellular mass density as function of photon energy, according to Equations (1)–(20), witha.E/ and b.E/ as depicted in Figure 8.
Copyright © 2016 John Wiley & Sons, Ltd. Int. J. Numer. Meth. Biomed. Engng. (2016); e02760DOI: 10.1002/cnm

e02760 (14 of 36) R. BLANCHARD ET AL.
in conjunction with the following, non-associative, isochoric flow rule:
P"p
HA;��D PHA
@G@�HA;��
with G.�HA;�� / D IHA;�� � IIIHA;�� ; (34)
whereby the dot denotes the time derivative, G denotes the flow potential, the derivative of whichaccounts for the plastic flow direction, and PHA;�� denotes the plastic multiplier quantifying theamount of plastic strain.
Such plastic events imply more and more micro-stresses to be transferred to the molecularcollagen of Figure 5(a), which finally fails in a brittle manner, according to a Rankine-type criterion,
Fcol D maxi2¹I;II;III º
j icol j � ultcol 6 0 (35)
Figure 11. Property maps in computed tomography slices in the transverse plane: (a) X-ray attenuationcoefficient in terms of grey value, (b) vascular porosity, (c) macroscopic mass density, (d) locations of the
mapped cross sections, and (e) mean values of the previous quantities.
Copyright © 2016 John Wiley & Sons, Ltd. Int. J. Numer. Meth. Biomed. Engng. (2016); e02760DOI: 10.1002/cnm

PATIENT-SPECIFIC FRACTURE RISK ASSESSMENT OF VERTEBRAE (15 of 36) e02760
with icol
, i D I:::III , as the eigenstresses in the molecular collagen assembly at the wet collagen(microfibrillar) scale (i.e. the matrix made up by crosslinked collagen molecules shown in Figure 5),and ult
colas the strength of molecular collagen. The latter quantity is derived from experiments on
rat tail tendon, which, under wet conditions, exhibits a strength of 106.1 MPa [94]. We considerclose packing of collagen, so as to obtain access to the properties of molecular collagen. It is knownfrom neutron diffraction studies [47, 76] that diffractional spacing (a measure for the lateral distanceof collagen molecules) reduces from 1.52 nm (for wet collagen) to 1.09 nm [for maximally packed(dry) collagen]. Accordingly, the cross-sectional area of a tensile specimen would reduce by the ratio.1:52=1:09/2, so that the strength of molecular collagen follows to be .1:52=1:09/2 times higherthan that of wet collagen, that is, 206 MPa.
These elastoplastic and failure laws need to be homogenized over the RVEs depicted in Figure 5,so as to determine the elastoplastic behavior of a piece of cortical/trabecular bone illustrated inFigure 5(f). This is achieved in the framework of continuum micromechanics [126] by means of
Figure 12. Property maps in computed tomography slice in the transverse plane: (a) Mineral content, (b)collagen content, (c) water and non-collageneous proteins (ncp) content, (d) locations of the mapped cross
sections, and (e) mean values of the previous quantities.
Copyright © 2016 John Wiley & Sons, Ltd. Int. J. Numer. Meth. Biomed. Engng. (2016); e02760DOI: 10.1002/cnm

e02760 (16 of 36) R. BLANCHARD ET AL.
Figure 13. Probability density plots of (a) the macroscopic mass density, (b) the mineral content, and (c) thecollagen content.
Figure 14. Translation of X-ray attenuation information into bone elasticity at the voxel scale: (a) stiffnesstensor components, (b) Young’s and shear moduli, and (c) Poisson’s ratios; 1,2 ... transverse direction, 3 ...
axial direction.
Copyright © 2016 John Wiley & Sons, Ltd. Int. J. Numer. Meth. Biomed. Engng. (2016); e02760DOI: 10.1002/cnm

PATIENT-SPECIFIC FRACTURE RISK ASSESSMENT OF VERTEBRAE (17 of 36) e02760
Figure 15. Property maps in computed tomography slices in the transverse plane: (a–c) axial Young’smodulus, and (d–f) axial Poisson’s ratio; (g) locations of the mapped cross sections.
stress and strain averaging rules [127, 128] and concentration-influence relations [129], applied toeach of the RVEs depicted in Figure 5. As regards the extrafibrillar RVE, homogeneous strains Eefare prescribed in terms of displacements
�.x/ D Eef � x (36)
Copyright © 2016 John Wiley & Sons, Ltd. Int. J. Numer. Meth. Biomed. Engng. (2016); e02760DOI: 10.1002/cnm

e02760 (18 of 36) R. BLANCHARD ET AL.
at the boundary of the RVE – x is the "microscopic" location vector with a resolution much smallerthan the RVE. This boundary condition implies that kinematically compatible microstrains ".x/
".x/ D rs�.x/ (37)
fulfill the following strain average rule [115, 126]
Eef DfefHA
Z 2�
�D0
Z �
�D0
"HA;��sin �
4�d�d� C
�1 � f
efHA
�"ic (38)
with f efHA as the volume fraction of hydroxyapatite within the extrafibrillar RVE and "ic as the(average) strains in the inter-crystalline space. Moreover, when applying the principle of virtualpowers to this RVE, resulting in the so-called Hill’s lemma [126], one arrives at the stress averagerule for the macroscopic stresses ˙ef acting on the extrafibrillar RVE,
˙ ef D fefHA
Z�
Z�
�HA;��sin �
4�d�d� C
�1 � f
efHA
�� ic (39)
with the microstresses � .x/ fulfilling the equilibrium condition
div � .x/ D 0: (40)
Linearity of Equations (40), (37), (36), and (31) implies the strains in the (��)-oriented mineralphase to depend multi-linearly on the homogeneous strains Eef and on the plastic (micro-)strains"p
HA;��found in all mineral phases,
"HA;�� DAHA;�� W Eef CZˆ
Z‚
D��ˆ‚ W "pHA;ˆ‚
sin‚
4�dˆd‚: (41)
Similarly, the microstrains "ic found in the inter-crystalline pores read as follows:
"ic DAic W Eef CZˆ
Z‚
Dic;ˆ‚ W "pHA;ˆ‚
sin‚
4�dˆd‚ (42)
with AHA;�� and Aic as the concentration tensors of the hydroxyapatite phase oriented in direc-tion (��) and of the inter-crystalline phase, respectively, and D��ˆ‚ and Dic;ˆ‚ accounting for theinfluence of plastic strains occurring in the (ˆ‚)-oriented phase, on the total strains occurring in themineral phase oriented in (��)-direction and in the inter-crystalline phase, respectively. These con-centration and influence tensors are derived from extended ‘eigenstressed’ Eshelby problems [126],as given in more detail in [130, 131]. Finally, repeated use of Hill’s lemma yields the upscaled‘macroscopic’ elastoplastic constitutive equation as follows:
˙ ef D Cef W�
Eef � Epef
�(43)
where Cef is the homogenized stiffness tensor of the extrafibrillar space, reading as follows:
Cef DfefHACHA W
Z�
Z�
AHA;��sin �
4�d�d� C
�1 � f
efHA
�CH2O W Aic (44)
Copyright © 2016 John Wiley & Sons, Ltd. Int. J. Numer. Meth. Biomed. Engng. (2016); e02760DOI: 10.1002/cnm

PATIENT-SPECIFIC FRACTURE RISK ASSESSMENT OF VERTEBRAE (19 of 36) e02760
and the extrafibrillar plastic strains Epef
fulfill
EpefD C�1ef Wf
efHA
Z�
Z�
tAHA;�� W CHA W "p
HA;��
sin �
4�d�d�; (45)
whereby the superscript t denotes the transpose of the concentration tensor (tAijkl D Aklij ).Equations (31)–(45) allow one to determine the plastic events in the crystal phases caused byextrafibrillar loading – once Equations (38), (39), (41), (42), (44), (45) are discretized in space, hereby means of the numerical scheme proposed in [132], and Equations (33) and (34) are discretized in(chronological) time, here by means of the return mapping algorithm [124, 133]. In particular, themultisurface plasticity concept is realized for Mohr–Coulomb plasticity [134]. This is carried out forall RVEs depicted in Figure 5, so as to relate macroscopic loading at the level of cortical/trabecularbone, to plastic strains in the crystalline, extrafibrillar, extracellular, and extravascular phases inFigure 5, until the molecular collagen stresses fulfill failure criterion (35).
Within this theoretical framework, two types of ‘safety factors’, ‘loading degrees’, or ‘distancesto failure’ are determined:
� The macroscopic trabecular bone-related stresses˙macro determined in each finite element arefirst multiplied with a factor �y related to just reaching the yield limit defined by equality inEquation (32);
˙macro;y D �y˙macro: (46)
This factor is called the yield safety factor; it is larger than one for elastic deformation statesand reduces to one once yielding starts. Its inverse is the ‘yield loading degree’ or ‘distanceto yielding’, being smaller than one for elastic deformation states, and increasing towards onewhen approaching yielding states.� Secondly, the aforementioned element-specific macroscopic stresses are multiplied with a
factor �ult related to reaching the ultimate load defined by equality in Equation (35);
˙macro;ult D �ult˙macro: (47)
This factor is called the (local, material-based) ultimate safety factor; it is larger than one fordeformation states, which the macroscopic bone material can still withstand and reduces to oneonce the material fails (through collagen tearing). Its inverse is the ‘ultimate loading degree’or‘distance to failure’, being smaller than one for bearable deformation states, and increasingtowards one when approaching material failure.
3. RESULTS
Evaluation of all grey values found in the investigated clinical CT image in form of the normal-ized histogram or probability density function depicted in Figure 7 allows for identification of theanatomical landmark values related to adipose tissue, asGVfat = 72, to soft tissues from inner organs,asGVsoft = 84, and to bone tissue, asGVbone = 101; see Figure 7. In addition, the histogram providesthe segmentation threshold asGVthr = 93. From the landmark grey values for the fat and soft tissues,Equations (1) to (7) allow for identification of the energy-dependent slope and intercept parametersa and b; see Figure 8. They allow for (still X-ray energy-dependent) conversion of grey values tothe actual physical quantities they represent.
As illustrated in Figure 9, the maximum grey value occurring in the corpus vertebrae amountsto GVmax = 164, and its densest neighbor exhibits a grey value of GVmax�1 = 156. Accordingto Equation (12), this allows for identification of the grey value related to extravascular bone asGVev D 298.
A unique relation between grey values and X-ray attenuation coefficients can be only obtainedfor an extracellular mass density of 1.67 g/cm3, being assigned to an X-ray energy of 24 keV,as is evident from Figure 10, drawn on the basis of Equations (13) to (16). This mass densityagrees very well with the one measured by Archimedes’ principle as determined in Section 2.3; the
Copyright © 2016 John Wiley & Sons, Ltd. Int. J. Numer. Meth. Biomed. Engng. (2016); e02760DOI: 10.1002/cnm

e02760 (20 of 36) R. BLANCHARD ET AL.
latter amounting to 1.71˙0.11 g/cm3 (mean value ˙ standard deviation). Use of �ec=1.67 g/cm3
and of corresponding extracellular volume fractions of hydroxyapatite fHA=0.27, organic matterforg=0.29, and water fH2O=0.44 in the homogenization scheme of Figure 5 yields the extravascularstiffness tensor
Cev D
0BBBBBBB@
C1111 C1122 C1133 0 0 0
C1122 C2222 C2233 0 0 0
C1133 C2233 C3333 0 0 0
0 0 0 2C2323 0 0
0 0 0 0 2C1313 0
0 0 0 0 0 2C1212
1CCCCCCCAD
D
0BBBBBBB@
10:56 4:82 5:30 0 0 0
4:82 10:56 5:30 0 0 0
5:30 5:30 13:06 0 0 0
0 0 0 5:99 0 0
0 0 0 0 5:99 0
0 0 0 0 0 5:75
1CCCCCCCA
in GPa:
(48)
Evaluation of the energy-dependent functions of Figure 8 for the photon energy as 24 keVyields the grey value-to-attenuation conversion factors a and b as a D 0:0107 cm�1 and b D�0:4154 cm�1. Evaluation of relations (20) and (25) for the grey value of each and every voxel ofthe scanned object yields density and hydroxyapatite/collagen/water content maps throughout thevertebral body; see Figure 11 and 12, as well as frequency plots of the aforementioned quantities,Figure 13.
The expected (i.e., most frequently occurring) values for macroscopic mass density, mineral,and collagen content amount to �EVmacro D 1:04 g/cm3, ��;EVHA D 54:1 mg/cm3, and ��;EV
colD
39:1 mg/cm3, while their averages over the entire vertebral body amount to �macro D 1:07 g/cm3,��HA D 87:8 mg/cm3, and ��
colD 39:2 mg/cm3.
The micromechanics-based porosity-stiffness relations based on the hierarchical representationdepicted in Figure 5; see also Equations (26) and (48), in combination with the X-ray physics-based grey value-to-porosity conversion scheme described in Section 2.4, yields organ-specific greyvalue-to-stiffness relations as depicted in Figure 14.
Figure 16. Convergence study: strain energy density averaged over all finite elements of the investigatedfinite elements mesh.
Copyright © 2016 John Wiley & Sons, Ltd. Int. J. Numer. Meth. Biomed. Engng. (2016); e02760DOI: 10.1002/cnm

PATIENT-SPECIFIC FRACTURE RISK ASSESSMENT OF VERTEBRAE (21 of 36) e02760
Figure 17. Maps of the ‘yield loading degree’1=�y , related to 1 MPa pressure loading; across the sagit-tal plane through the vertebral body, for (a) homogeneous, and (b) heterogeneous finite element model,across the coronal plane, for (c) homogeneous, and (d) heterogeneous finite element model; across thetransverse plane, for (e) homogeneous, and (f) heterogeneous finite element model. (g) Three-dimensional
representation of the organ and position of the slices. Cross-sectional dimensions are in millimeters.
Copyright © 2016 John Wiley & Sons, Ltd. Int. J. Numer. Meth. Biomed. Engng. (2016); e02760DOI: 10.1002/cnm

e02760 (22 of 36) R. BLANCHARD ET AL.
Combination of the latter with the porosity maps illustrated in Figure 11 allows for assembly ofmechanical property maps as depicted in Figure 15. The latter evidences the very inhomogeneousnature of the organ: The left side of the vertebra organ is less porous and, hence, denser and stifferthan its right-hand side. Feeding these properties into the differently fine finite element models
Figure 18. Maps of the ‘ultimate loading degree’ 1=�ult , related to 1 MPa pressure loading; acrossthe sagittal plane through the vertebral body, for (a) homogeneous, and (b) heterogeneous finite ele-ment model; across the coronal plane, for (c) homogeneous, and (d) heterogeneous finite element model;across the transverse plane, for (e) homogeneous, and (f) heterogeneous finite element model. (g)Three-dimensional representation of the organ and position of the slices. Cross-sectional dimensions are
in millimeters.
Copyright © 2016 John Wiley & Sons, Ltd. Int. J. Numer. Meth. Biomed. Engng. (2016); e02760DOI: 10.1002/cnm

PATIENT-SPECIFIC FRACTURE RISK ASSESSMENT OF VERTEBRAE (23 of 36) e02760
described in Section 2.6 and Figure 6 yields very similar results in terms of the strain energy den-sity (Figure 16), which underlines the sufficient accuracy of the employed finite element meshes.This implies at the same time that the algorithm for using the minimum of three CT-based poros-ity values for characterizing one finite element (Section 2.6) delivers satisfactorily accurate results.However, there are truly significant differences between the homogeneous and heterogeneous sim-ulations. Given the employed traction boundary conditions, this indicates that the homogeneoussimulations by far overestimate the stiffness of the investigated organ. Stress levels obtained, underaxial “physiological load”, on both homogeneous and heterogeneous simulations reach the level ofmaterial yielding (Figure 17), more pronouncedly so in the heterogeneous simulations (compareFigure 17(a, c, and e) to Figure 17(b, d, and f)), while this load level is characterized by a ‘safety fac-tor’of about 10 (for homogeneous simulations) and 5 (for heterogeneous simulations) from materialfailure [compare Figure 18(a,c, and e) to (b,d, and f)]. Corresponding element-wise increase of thelinear elastically determined stress tensors up to the level of material failure is evoking remarkablynonlinear strain evolutions, as is seen in Figure 19.
Figure 19. Proportional stress loading in chosen finite element (a), (b) principal stress components, (c)principal stress components as function of the loading degree, and (d) strain relation along principal
directions.
Copyright © 2016 John Wiley & Sons, Ltd. Int. J. Numer. Meth. Biomed. Engng. (2016); e02760DOI: 10.1002/cnm

e02760 (24 of 36) R. BLANCHARD ET AL.
4. DISCUSSION
Combining latest continuum micromechanics models with ‘universal’composition and mineraliza-tion rules for bone, which both were successfully validated against a multitude of physically andstatistically independent experimental data, and with X-ray physics and finite element modeling,allowed for patient-specific fracture-risk assessment of lumbar vertebrae. In this context, it should beemphasized that we here extended the patient specificity beyond purely geometric aspects, which aresomehow defining the current state of the art in computational patient-specific analysis [135–139];in fact, we here explicitly consider the patient-specific grey value distribution quantifying the spa-tial X-ray attenuation behavior of the scanned organs and convert the latter into patient-specificmicrostructural information. The latter then provides, via micromechanics analysis, patient-specificelasticity and strength distributions, which are finally mapped onto the patient-specific geometricaldata that we started off with.
Secondly, it is very interesting and instructive to compare the results of our novel method,which is solely based on clinical CT data, with results from well established, say ‘conventional’,methods published in the open literature. These methods comprise Archimedes’ principle, ultra-sound, microCT, macromechanical testing, nanoindentation, and micro-finite element-based tissueelasticity determination.
To begin with, two different techniques, namely, Archimedes’ principle and evaluation of clin-ical CT images based on energy-dependent, intravoxel attenuation averaging in conjunction with‘universal’ compositional rules for soft and hard tissues, delivered the same extracellular bone massdensity, when applied to two differently old human vertebrae characterized at two different hospitals.This strongly underlines the organ-specificity, but location and age independence of extracellulartissue properties (when averaged over one-to-several-millimeter-sized domains). This remarkableextracellular tissue characteristic is also evident from age-independent nanoindentation moduli onhuman proximal femora [140–142], as well as from age-independent and location-independent min-eral contents, as obtained from computerized quantitative contact radiography of whole human iliacbone [143], as observed by means of quantitative backscattered electron imaging of iliac and ver-tebral trabecular samples [144], as seen under Raman microscopy of femoral cortices [145], or asinvestigated through a microCT of an entire human radius [146].
It may also be noteworthy that mass densities obtained ex vivo, from samples being stored in afrozen state with temperature and humidity conditions varying quite strongly from those in vivo,agree very well with the mass density data retrieved from in vivo scanning protocols. This, however,agrees very well with evidence put forward by a number of studies [147–150] that the mechanicalproperties of bone tissue are preserved through storage, also when bones are frozen. Because themechanical properties of bone tissue depend on the tissue’s composition and microstructure [30,151], it appears as very natural that also the composition-related quantities, such as the tissue massdensity, would not be more than negligibly affected by the storage and testing procedure. As a sideresult, this allowed us to do without human biopsies when validating our in vivo method. In fact,a biopsy from a young healthy patient was never considered for ethical reasons, thus ruling outintrusive measurement of the patient-specific bone mineral density. This is a normal situation forany analysis performed on clinical data, such as the ones reported by [152].
Agreement of our tissue mass density result with all these prior investigations nurtures the con-fidence in our new method, which delivers fully patient-specific and site-specific data on bonetissue composition, resolved down to the single voxel level. At this stage, it already drives for-ward the highly desired knowledge on local bone composition characteristics, as it was achieved byhigh-resolution peripheral quantitative computed tomography acquisition schemes on radial bones[65, 153, 154], delivering, as a result, bone mineral densities as averages over cortical or trabecularcompartments, with values lying well within the ranges illustrated in Figures 12(a) and 13(b). Ourmethod, however, while not being dependent on high-resolution peripheral quantitative computedtomography (which is only applicable to extremities), but just based on standard clinical CTs, givesnot only compartment averages, but bone composition gradients resolved down to a voxel size of0.324�0:324�1.25 mm3. The identified mass density of 1.67 g/cm3 underlines that vertebral tissueis remarkably less dense than femoral or tibial tissue, with reported extracellullar mass densities
Copyright © 2016 John Wiley & Sons, Ltd. Int. J. Numer. Meth. Biomed. Engng. (2016); e02760DOI: 10.1002/cnm

PATIENT-SPECIFIC FRACTURE RISK ASSESSMENT OF VERTEBRAE (25 of 36) e02760
lying between 1.9 and 2.0 g/cm3 [30, 55, 58]. This is consistent with ultrasonic waves travelingslower through vertebral as compared with femoral tissues [49].
Moreover, our mineral contents derived from in vivo CT data without the need of any type ofphantom agree remarkably well with ex vivo quantitative CT studies as well as ashing studies onvertebral autopsies [155]: for an age slightly below 20 years, i.e. similar to the one of the patientinvestigated here, the latter reference reports bone mineral contents between 70 and 200 mg/cm3
relating to a similarly aged patient, a range which well frames the mean value in Figure 12(a)and 13(b). Hence, we provided a new in vivo access to values for the so-called volumetric bonemineral density – vBMD. The latter are very valuable indicators for clinical decisions, as they havebeen shown to significantly correlate to the occurrence of bone fracture [156], that is, they arevaluable indicators for bone fracture risk. However, such correlations [157–159] do not consider thewealth of knowledge on how materials break, as it has been gained in the fields of material physicsand mechanics over centuries.
To the best knowledge of the authors, we here provided the first calibration-free, X-ray physics-based and multiscale mechanics-based fracture risk analysis tool applied to human vertebra, basedon multiscale elastoplasticity. In this context, it is first interesting to compare the results of the mul-tiscale model as depicted on Figure 5 with corresponding independent experimental results foundin the open literature. Namely, the (average) axial normal stiffness component of extracellular bonematrix, amounting to 15.4 GPa, agrees virtually perfectly with the nanoindentation-derived valuereported by Wolfram et al. [142], amounting also to 15.4 GPa. At the same time, we observe that thenanoindentation measurements may reveal, when using respective protocols [160], strictly speak-ing orthotropic material properties, while the micromechanical model employed herein is based onhexagonal symmetry and hence provides transversely isotropic properties. The question arises onhow our approximation of orthotropy through transverse isotropy may influence the results of thetype of analysis as reported herein. This question can be answered in two independent ways, lead-ing to virtually the same answer. The first answer builds on computing the axial Young’s modulusof a piece of orthotropic bone matrix from both the orthotropic stiffness tensor and from the trans-versely isotropic approximation of this stiffness tensor, as obtained from rotation around the axialmaterial direction [161]. In the latter reference, it was shown the corresponding difference in axialYoung’s moduli computed for the orthotropic data of Ashman et al. [162] amounts to less than1%, and the same is true for the analogous computations based on the data of [160]. Because onlythis (axial) Young’s modulus enters our finite element analyses, we regard the latters’ results to bealmost entirely independent of the choice of transversely isotropic as compared with orthotropicmaterial properties. The second answer relates to the reliability of formally isotropic analysis asdescribed in Section 2.6: use of such formally isotropic properties as retrieved from the afore-mentioned nanoindentation campaign indeed delivered micro-finite element results, which agreedparticularly well with direct test results of entire vertebrae in both compression and torsion [163].This further increases the confidence into our method.
As regards the plastic load regime, our results for a human lumbar vertebra aged 15 years indicateplastic deformations to even occur under normal physiological loading agree well with the growingevidence of low-level plasticity in bone tissue, demonstrated by means of mechanical experimentsand finite element simulations of trabecular bone [164, 165]. The safety factor against ultimatefracture is found to be around five, corresponding to an ultimate load amounting to 4614 N, whichlies well within the broad range of values determined experimentally on different human vertebrae[1–4]. Our ultimate load particularly well agrees with the values of ultimate load measured onvertebrae of similar mean BMD [1, 3, 11], and for a bone of similar mean porosity [2, 10]. Itis very interesting that our failure also agrees very well with those determined for femurs, bothexperimentally [16] and by means of finite element strength computations [17]. This indicates largerdomains of the skeleton to be designed for bearing the same level of loading. Thereby, the criticalload may well be attained in extreme sport activities, as compressive forces of 8676 N in the blockaction of an American football player, 7500 N during a golf swing, or 7756 N during torso weightlifting [166]. The question may arise whether the large regions close to yielding under kind of a‘light loading’ make sense from an evolutionary biology standpoint. The answer may actually beaffirmative, given the evolution of the spine as a lightweight shock absorbing organ system. In
Copyright © 2016 John Wiley & Sons, Ltd. Int. J. Numer. Meth. Biomed. Engng. (2016); e02760DOI: 10.1002/cnm

e02760 (26 of 36) R. BLANCHARD ET AL.
fact, dissipative mechanical behavior of vertebral bone even under light loads seems very muchconsistent with spine’s function as kind of a ‘shock absorber’. Accordingly, even at low loading,the mechanical work put into the system would not be entirely recoverable upon unloading but bepartially dissipated into heat. Identification of related yielding phenomena critically relies on theadvanced multiscale formulation used herein, in order to describe the elastoplastic behavior of bone,in particular at the scale of the extracellular bone matrix. The plastic behavior of bone at low loadlevels at this small scale has been very recently shown also by a direct experimental method wheresingle micron-sized samples glued onto a rigid substrate have been loaded and unloaded in thecompressive regime [167]. A particular feature of our new method is the consistent considerationof heterogeneous elasticity and strength properties throughout the organ; it is remarkable that ourbottom-up approach value for the Young’s modulus of the extravascular space (see Equation (48))compares well with data stemming from top-down back-computations reported in the literature[168], and the importance of heterogeneity for fracture loads has been repeatedly stated [169]. Inour case, the heterogeneity results from the bone remodeling induced by the natural asymmetry ofthe human body, with the right part of the middle section of the vertebra being less porous, andtherefore stiffer than the left-hand part; see Figure 11(b) and 15(a). Resulting stress concentrationsgovern the organ’s compliance and safety margin against fracture: stiffness and strength propertiesbased on an averaged homogeneous vascular porosity would overestimate the strain energy densityby a factor of 5, and the safety factor by a factor of 2. This key role of tissue heterogeneity in themechanics of the investigated biological system is fully consistent with similar earlier findings on avariety of other tissues, such as human and murine femoral bone [43, 170, 171], primate skull [172],human patellar cartilage [173], or human arterial wall tissue [174].
Our method critically depended on a successful micromechanial representations of bonemicrostructure for mechanical property predictions, which does not resolve the material up to thehighest resolution ever possible, but rather focus on reliable consideration of the mechanically mostimportant micromorphological features. While in the present case, the micromechanics model wasset within the framework of continuum micromechanics or random homogenization theory, the samephilosophy can also be followed within alternative theoretical frames, such as that of lattice mod-els [113]. At the same time, our method impressively confirms the increasing expectations of theclinical environments with regard to advanced numerical methods, especially those based on thefinite element method [175].
It is also appropriate to discuss potential limitations of the new method presented here. Thephantom-free CT data evaluation critically relies on the existence of two distinguishable peaks inthe histogram of grey values as depicted in Figure 7, these peaks being related to the adipose andthe soft tissue, respectively. Certain pathological conditions or poor resolution images may renderthese two peaks as non-distinguishable. In this case, the scanning of the clinically interesting partof the body, together with a piece of material with known chemical composition (such as a phan-tom used for standard CT data calibration purposes) may deliver access to a second grey valuewith known corresponding attenuation coefficient, so that a system of equations similar to that ofEquations (2) and (3) may again provide access to the energy-dependent functions a.E/ and b.E/.Such a ‘phantom-based’ X-ray energy determination process has been described in greater detailfor ceramic biomaterials [44]. In its current formulation, the presented method is realized for thecase if the cortical shell is thinner than the voxel size; see procedure of Section 2.2. This procedurewould need modification if thick cortical shells, that is, such with thicknesses spanning one entireor even several voxels edge lengths, would appear in the scanned domain. Actually, the maximumgrey value would then coincide with the extravascular grey valueGVev , so that Equations (8) to (12)would become superfluous, while the rest of the analysis would stay unaltered.
The practical impact of our study is deemed to lie in its ability to allow for an enhanced exploita-tion of standard clinical CT data with low radiation exposure to the patient, thereby revealinginformation, which would otherwise stay unnoticed. Without any additional efforts with respect tostandard medical examinations, the method described here allows for unprecedented information onthe fracture risk of the scanned vertebrae. Such information may be deemed essential in the processof seeking a diagnosis or treatment processes [176].
Copyright © 2016 John Wiley & Sons, Ltd. Int. J. Numer. Meth. Biomed. Engng. (2016); e02760DOI: 10.1002/cnm

PATIENT-SPECIFIC FRACTURE RISK ASSESSMENT OF VERTEBRAE (27 of 36) e02760
As a side effect of the clinical orientation of our protocol (we are dealing with data from a livingpatient), the in vivo scanned object could not be used for further in situ testing. Still, the identifiedmass density agreed very well with that obtained from a cadaveric specimen. This agreement furtherconfirms earlier statements on the temporal and spatial invariance of species-specific and organ-specific adult bone tissue mass density when averaged over millimeter-sized domains [37, 140–146].
Finally, one might discuss on how to proceed this research work so as to eventually integrate itinto a real-life clinical setting. One administrative problem in this context could be the integrationof commercial finite element software as employed here, together with several in-house codes pro-duced at the university, in current workflow systems employed in the clinical everyday life; togetherwith the software and hardware computer power needed for running advanced medium-scale finiteelement computations as reported herein. In this context, advanced computational techniques such asautomated object-based image analysis [177], or statistical shape models for active feature selection[178], are gaining popularity. A more conceptually fundamental way to overcome the aforemen-tioned challenge could be to substitute the full 3D finite element analyses by similarly precise, yetcomputationally and commercially less expensive advanced beam model solutions. In fact, prelimi-nary work in our research group (which is obviously beyond the scope of the present paper) indicatesthat advanced ‘sandwich beam’-type theories turn out as theoretically challenging, but highly effec-tive alternatives to finite element models. They are particularly effective when it comes to tacklingload cases, which go beyond the basic situation of a constant pressure acting on the upper boundaryof the investigated vertebra as described in this paper. This can be already sketched here, in orderto give a first-order approximation of how the safety factors would roughly change when a typicalbending moment of some 40 Nm [179], in addition to the constant pressure of 1 MPa as discussedearlier, would be applied to the studied vertebra. Approximating the vertebral cross section as shownin Figure 9 as a homogeneous ellipse with some 50-mm width and 33-mm height results in a min-imal area moment of inertia of I=333 � 50 � �
4=1.4�106 mm4, so that the normal stresses due to
bending can be roughly estimated as =40/(1.4�10�6)�16:5 � 10�3 � 500 � 103 PaD 0:5 MPa.Hence, a typical bending mode on top of the compressive loading studied throughout this paperleads to an increase of the pseudo-uniaxial stress state of Figure 19 by around 30%, that is, theoverall safety would be expected to be around four in combined axial-bending load.
5. CONCLUSION
Based on consistent integration of micromechanics, finite element analysis, and X-ray physics,conventional clinical CT data alone allow for reliable determination of tissue mass density and min-eralization degree, as well as engineering mechanics-based fracture risk analysis considering bothpatient-specific loading and microstructurally governed conditions of mechanical integrity.
6. CONFLICT OF INTEREST STATEMENT
The authors Romane Blanchard, Claire Morin, Andrea Malandrino, Alain Vella, Zdenka Sant, andChristian Hellmich hereby declare that they have no conflict of interest.
ACKNOWLEDGEMENTS
The grey value-to-composition conversion scheme development was financially supported through projectMySPINE, grant number 269909 of EC call FP7-ICT-2009-6. Collaboration with the University of Maltaand Mater Dei Hospital, Malta, was supported through grant NAMABIO, MPNS Action COST MP1005.Completion of the strength model became possible through project MICROBONE, Grant number 257023,granted by the European Research Council (ERC). Moreover, the authors gratefully acknowledge the sup-port of Manfred Tschabitscher from the Center of Anatomy and Cell Biology at the Medical Universityof Vienna, providing a vertebra for the mass density tests. The latter were performed as part of a 2010internship of Andrea Malandrino from the Institute of Bioengineering of Catalonia (IBEC), Biomechanicsand Mechanobiology Group (headed by Damien Lacroix until 2012, and by Jerome Noailly since 2012),at Vienna University of Technology, which was made possible through the bilateral Austro-Spanish scien-tific exchange grant ES06/2010 AT2009-0029. CT scanning of the aforementioned vertebra was provided by
Copyright © 2016 John Wiley & Sons, Ltd. Int. J. Numer. Meth. Biomed. Engng. (2016); e02760DOI: 10.1002/cnm

e02760 (28 of 36) R. BLANCHARD ET AL.
Heinz Redl from the Ludwig Boltzmann Institute for Clinical and Experimental Traumatology, in theframework of the Austrian Cluster for Tissue Regeneration.
REFERENCES
1. Cheng X, Nicholson P, Boonen S, Lowet G, Brys P, Aerssens J, van der Perre G, Dequeker J. Prediction of vertebralstrength in vitro by spinal bone densitometry and calcaneal ultrasound. Journal of Bone and Mineral Research 1997;12(10):1721–1728.
2. Perilli E, Briggs AM, Kantor S, Codrington J, Wark JD, Parkinson IH, Fazzalari NL. Failure strength of humanvertebrae: prediction using bone mineral density measured by dxa and bone volume by micro-CT. Bone 2012;50(6):1416–1425.
3. Crawford RP, Rosenberg WS, Keaveny TM. Quantitative computed tomography-based finite element models of thehuman lumbar vertebral body: effect of element size on stiffness, damage, and fracture strength predictions. Journalof Biomechanical Engineering 2003; 125:434–438.
4. McBroom RJ, Hayes WC, Edwards WT, Goldberg RP, White AA. Prediction of vertebral body compressive fractureusing quantitative computed tomography. The Journal of Bone and Joint Surgery. American volume 1985; 67:1206–1214.
5. Melton III LJ, Atkinson EJ, O’Fallon WM, Wahner HW, Riggs BL. Long-term fracture prediction by bone mineralassessed at different skeletal sites. Journal of Bone and Mineral Research 1993; 8(10):1227–1233.
6. Black DM, Steinbuch M, Palermo L, Dargent-Molina P, Lindsay R, Hoseyni MS, Johnell O. An assessment toolfor predicting fracture risk in postmenopausal women. Osteoporosis International 2001; 12(7):519–528.
7. Hulme PA, Boyd SK, Ferguson SJ. Regional variation in vertebral bone morphology and its contribution to vertebralfracture strength. Bone 2007; 41:946–957.
8. Singer K, Edmondston S, Day R, Breidahl P, Price R. Prediction of thoracic and lumbar vertebral body compressivestrength: correlations with bone mineral density and vertebral region. Bone 1995; 17(2):167–174.
9. Hutton WC, Cyron BM, Stott JR. The compressive strength of lumbar vertebrae. Journal of Anatomy 1979;129(4):753–758.
10. Jiang G, Luo J, Pollintine P, Dolan P, Adams Ma, Eastell R. Vertebral fractures in the elderly may not always be‘osteoporotic’. Bone 2010; 47(1):111–6.
11. Ebbesen EN, Thomsen JS, Beck-Nielsen H, Nepper-Rasmussen HJ, Mosekilde Li. Lumbar vertebral body com-pressive strength evaluated by dual-energy X-ray absorptiometry, quantitative computed tomography, and ashing.Bone 1999; 25:713–724.
12. Rockhoff SD, Sweet E, Bleustein J. The relative contribution of trabecular and cortical bone to the strength ofhuman lumbar vertebrae. Calcified Tissue Research 1969; 3:163–175.
13. Cody DD, Gorss GJ, Hou FJ, Spencer HJ, Goldstein SA, Fyhrie DP. Femoral strength is better predicted by finiteelement models than QCT and DXA. Journal of Biomechanics 1999; 32:1013–1020.
14. MacNeil JA, Boyd SK. Bone strength at the distal radius can be estimated from high-resolution peripheralquantitative computed tomography and the finite element method. Bone 2008; 42(6):1203–1213.
15. Keyak JH, Rossi SA, Jones KA, Skinner HB. Prediction of femoral fracture load using automated finite elementmodeling. Journal of Biomechanics 1998; 31(2):125–133.
16. Schileo E, Taddei F, Cristofolini L, Viceconti M. Subject-specific Finite Element models implementing a maximumprincipal strain criterion are able to estimate failure risk and fracture location on human femurs tested in vitro.Journal of Biomechanics 2008; 41:356–367.
17. Falcinelli C, Schileo E, Balistreri L, Baruffaldi F, Bordini B, Viceconti M, Albisinni U, Ceccarelli F, Milandri L,Toni A, Taddei F. Multiple loading conditions analysis can improve the association between finite element bonestrength estimates and proximal femur fractures: A preliminary study in elderly women. Bone 2014; 67:71–80.
18. Yosibash Z, Padan R, Joskowicz L, Milgrom C. A CT-based high-order finite element analysis of the humanproximal femur compared to in-vitro experiments. Journal of Biomechanical Engineering 2007; 129(3):297–309.
19. Trabelsi N, Yosibash Z. Patient-specific finite-element analyses of the proximal femur with orthotropic materialproperties validated by experiments. Journal of Biomechanical Engineering 2011; 133(6).
20. Trabelsi N, Milgrom C, Yosibash Z. Patient-specific FE analyses of metatarsal bones with inhomogeneous isotropicmaterial properties. Journal of the Mechanical Behavior of Biomedical Materials 2014; 29:177–189.
21. Morgan EF, Bayraktar HH, Keaveny TM. Trabecular bone modulus-density relationships depend on anatomic site.Journal of Biomechanics 2003; 36(7):897–904.
22. Keyak JH, Lee IY, Skinner HB. Correlations between orthogonal mechanical properties and density of trabecularbone: Use of different densitometric measures. Journal of Biomedical Materials Research 1994; 28(11):1329–1336.
23. Goulet RW, Goldstein SA, Ciarelli MJ, Kuhn JL, Brown MB, Feldkamp LA. The relationship between the structuraland orthogonal compressive properties of trabecular bone. Journal of Biomechanics 1994; 27(4):375–389.
24. Rho JY, Hobatho MC, Ashman RB. Relations of mechanical properties to density and CT numbers in human bone.Medical Engineering & Physics 1995; 17(5):347–355.
25. Périé D, Sales de Gauzy J, Baunin C, Hobatho MC. Tomodensitometry measurements for in vivo quantification ofmechanical properties of sciolotic vertebrae. Clinical Biomechanics 2001; 16:373–379.
26. Natali AN, Carniel EL, Pavan PG. Investigation of bone inelastic response in interaction phenomena with dentalimplants. Dental Materials 2008; 24(4):561–569.
Copyright © 2016 John Wiley & Sons, Ltd. Int. J. Numer. Meth. Biomed. Engng. (2016); e02760DOI: 10.1002/cnm

PATIENT-SPECIFIC FRACTURE RISK ASSESSMENT OF VERTEBRAE (29 of 36) e02760
27. Geraldes DM, Phillips ATM. A comparative study of orthotropic and isotropic bone adaptation in the femur.International Journal for Numerical Methods in Biomedical Engineering 2014; 30:873–889.
28. Frost HM. Bone Mass and the Mechanostat : A Proposal. The Anatomical Record 1987; 219:1–9.29. Hellmich C, Ulm F, Dormieux L. Can the diverse elastic properties of trabecular and cortical bone be attributed
to only a few tissue-independent phase properties and their interactions? Arguments from a multiscale approach.Biomechanics and Modeling in Mechanobiology 2004; 2(4):219–238.
30. Vuong J, Hellmich Ch. Bone fibrillogenesis and mineralization: Quantitative analysis and implications for tissueelasticity. Journal of Theoretical Biology 2011; 287:115–130.
31. Morin C, Hellmich C, Henits P. Fibrillar structure and elasticity of hydrating collagen: a quantitative multiscaleapproach. Journal of Theoretical Biology 2013; 317:384–393.
32. Morin C, Hellmich C. Mineralization-driven bone tissue evolution follows from fluid-to-solid phase transformationsin closed thermodynamic systems. Journal of Theoretical Biology 2013; 335:185–197.
33. Fritsch A, Hellmich C. ’Universal’ microstructural patterns in cortical and trabecular, extracellular and extravacularbone materials: micromechanics-based prediction of anisotropic elasticity. Journal of Theoretical Biology 2007;244:597–620.
34. Fritsch A, Hellmich C, Dormieux L. Ductile sliding between mineral crystals followed by rupture of collagencrosslinks: experimentally supported micromechanical explanation of bone strength. Journal of Theoretical Biology2009; 260:230–252.
35. Morin C, Hellmich C. A multiscale poromicromechanical approach to wave propagation and attenuation in bone.Ultrasonics 2014; 54(5):1251–1269.
36. Hubbell JH, Seltzer SM. Tables of X-ray mass attenuation coefficients and mass energy-absorption coefficients from1 keV to 20 MeV for elements Z = 1 to 92 and 48 additional substances of dosimetric interest, 2011. http://www.nist.gov/pml/data/xraycoef/index.cfm/.
37. Hellmich C, Kober C, Erdmann B. Micromechanics-based conversion of CT data into anisotropic elasticity tensors,applied to FE simulations of a mandible. Annals of Biomedical Engineering 2008; 36(1):108–122.
38. Crawley EO, Evans WD, Owen GM. A theoretical analysis of the accuracy of single-energy CT bone measurements.Physics in Medicine and Biology 1988; 33(10):1113–1127.
39. Jackson DF, Hawkes DJ. X-ray attenuation coefficients of elements and mixtures. Physics Reports 1981; 70(3):169–233.
40. Yosibash Z, Trabelsi N, Hellmich C. Subject-specific p-FE analysis of the proximal femur utilizing micromechanics-based material properties. International Journal for Multiscale Computational Engineering 2008; 6(5):483–498.
41. Scheiner S, Sinibaldi R, Pichler B, Komlev V, Renghini C, Vitale-Brovarone C, Rustichelli F, Hellmich C.Micromechanics of bone tissue-engineering scaffolds, based on resolution error-cleared computer tomography.Biomaterials 2009; 30:2411–2419.
42. Dejaco A, Komlev VS, Jaroszewicz J, Swieszkowski W, Hellmich C. Micro CT-based multiscale elasticity ofdouble-porous (pre-cracked) hydroxyapatite granules for regenerative medicine. Journal of Biomechanics 2012;45(6):1068–1075.
43. Blanchard R, Dejaco A, Bongaers E, Hellmich C. Intravoxel bone micromechanics for microct-based finite elementsimulations. Journal of Biomechanics 2013; 46(15):2710–2721.
44. Czenek A, Blanchard R, Dejaco A, Sigurjónsson OE, Örlygsson G, Gargiulo P, Hellmich C. Quantitative intravoxelanalysis of microCT-scanned resorbing ceramic biomaterials - perspectives for computer-aided biomaterial design.Journal of Materials Research 2014; 29(23):2757–2772.
45. Medical Imaging and Technology Alliance (division of the National Electrical Manufacturers Association): DICOMPS3.3 2013-Information Object Definitions (2013).
46. Mast TD. Empirical relationships between acoustic parameters in human soft tissues. Acoustics Research LettersOnline 2000; 1(2):37–42.
47. Lees S. Considerations regarding the structure of the mammalian mineralized osteoid from viewpoint of thegeneralized packing model. Connective Tissue Research 1987; 16(4):281–303.
48. Gautieri A, Buehler MJ, Redaelli A. Deformation rate controls elasticity and unfolding pathways of singletropocollagen molecules. Journal of the Mechanical Behavior of Biomedical Materials 2009; 2:130–137.
49. Malandrino A, Fritsch A, Lahayne O, Kropik K, Redl H, Noailly J, Lacroix D, Hellmich C. Anisotropic tissueelasticity in human lumbar vertebra, by means of a coupled ultrasound-micromechanics approach. Materials Letters2012; 78:154–158.
50. Silva MJ, Wang C, Keaveny TM, Hayes WC. Direct and computed tomography thickness measurements of thehuman, lumbar vertebral shell and endplate. Bone 1994; 15(4):409–414.
51. Whitehouse WJ, Dyson ED, Jackson CK. The scanning electron microscope in studies of trabecular bone from ahuman vertebral body. Journal of Anatomy 1971; 108(3):481–496.
52. Ritzel H, Amling M, Pösl M, Hahn M, Delling G. The thickness of human vertebral cortical bone and its changes inaging and osteoporosis: a histomorphic analysis of the complete spinal column from thirty-seven autopsy specimen.Journal of Bone and Mineral Research 1997; 12(1):89–95.
53. Lees S, Cleary PF, Heeley JD, Gariepy EL. Distribution of sonic plesio-velocity in a compact bone sample. Journalof the Acoustical Society of America 1979; 66(3):641–646.
54. Lees S, Hanson D, Page E. Some acoustical properties of theotic bones of a fin whale. Journal of the AcousticalSociety of America 1995; 99(4):2421–2427.
Copyright © 2016 John Wiley & Sons, Ltd. Int. J. Numer. Meth. Biomed. Engng. (2016); e02760DOI: 10.1002/cnm

e02760 (30 of 36) R. BLANCHARD ET AL.
55. Lees S, Ahern JM, Leonard M. Parameters influencing the sonic velocity in compact calcified tissues of variousspecies. Journal of the Acoustical Society of America 1983; 74(1):28–33.
56. Lees S. Mineralization of type I collagen. Biophysical Journal 2003; 85:204–207.57. Lees S, Page EA. A study of some properties of mineralized turkey leg tendon. Connective Tissue Research 1992;
28(4):263–287.58. Biltz RM, Pellegrino ED. The chemical anatomy of bone. I. A comparative study of bone composition in sixteen
vertebrates. Journal of Bone and Joint Surgery - Series A 1969; 51(3):456–466.59. Gong JK, Arnold JS, Cohn SH. Composition of trabecular and cortical bone. The Anatomical Record 1964; 149:
325–332.60. Burns CM. XCIV. The effect of the continued ingestion of mineral acid on growth of body and bone and on the
composition of bone and of the soft tissues. Biochemical Journal 1929; 23(5):860–867.61. Hammett FS. A biochemical study of bone growth. I. Changes in the ash, organic matter and water during growth
(mus norvegicus albinus). Journal of Biological Chemistry 1925; 64:409–428.62. Hammett FS. Studies of the thyroid apparatus: XIV. The growth of the humerus and femur of male and female albino
rats thyro-parathyroidectomized and parathyroidectomized when 100 days of age. The Journal of ExperimentalZoology 1924; 39(3):465–504.
63. Chick H, Korenchevsky V, Roscoe M. LXXXIII. The difference in chemical composition of the skeletons of youngrats fed (1) on diets deprived of fat-soluble vitamins and (2) on a low phosphorus rachitic diet, compared with thoseof normally nourished animals of same age. Biochemical Journal 1926; 20(3):621–631.
64. Tai K, Pelled G, Sheyn D, Bershteyn A, Han L, Kallai I, Zilberman Y, Ortiz C, Gazit D. Nanobiomechanics ofrepair bone regenerated by genetically modified mesenchymal stem cells. Tissue Engineering: Part A 2008; 14(10):1709–1720.
65. Neu CM, Manz F, Rauch F, Merkel A, Schoenau E. Bone density and bone size at the distal radius in healthychildren and adolescents: a study using peripheral quantitative computed tomography. Bone 2001; 28(2):227–232.
66. Urist MR, DeLange RJ, Finerman GAM. Bone cell differentiation and growth factors. Science 1983; 220:680–686.67. Hellmich C, Barthélémy JF, Dormieux L. Mineral-collagen interactions in elasticity of bone ultrastructure – a
continuum micromechanics approach. European Journal of Mechanics A-Solids 2004; 23:783–810.68. McCarthy RN, Jeffcott LB, McCartney RN. Ultrasound speed in equine cortical bone: effects of orientation, density,
porosity and temperature. Journal of Biomechanics 1990; 23(11):1139–1143.69. Lees S, Hanson D, Page EA, Mook HA. Comparison of dosage-dependent effects of beta-aminopropionitrile,
sodium fluoride, and hydrocortisone on selected physical properties of cortical bone. Journal of Bone and MineralResearch 1994; 9(9):1377–1389.
70. Lees S. Ultrasonic measurements of deer antler, bovine tibia and tympanic bulla. Journal of Biomechanics 1982;15(11):867–874.
71. Hellmich C, Ulm FJ. Average hydroxyapatite concentration is uniform in extracollageneous ultrastructure ofmineralized tissue. Biomechanics and Modeling in Mechanobiology 2003; 2:21–36.
72. Zylberberg L, Traub W, de Buffrenil V, Allizard F, Arad T, Weiner S. Rostrum of a toothed whale: ultrastructuralstudy of a very dense bone. Bone 1998; 23:241–247.
73. Prostak KS, Lees S. Visualization of crystal-matrix structure. In situ demineralization of mineralized turkey legtendon and bone. Calcified Tissue International 1996; 59:474–479.
74. Lees S. Water content in type I collagen tissues calculated from the generalized packing model. InternationalJournal of Biological Macromolecules 1986; 8:66–72.
75. Bonar L, Lees S, Mook H. Neutron diffraction studies of collagen in fully mineralized bone. Journal of MolecularBiology 1985; 181:265–270.
76. Lees S, Bonar LC, Mook HA. A study of dense mineralized tissue by neutron diffraction. International Journal ofBiological Macromolecules 1984; 6(6):321–326.
77. Hodge AJ, Petruska JA. Recent studies with the electron microscope on ordered aggregates of the tropocollagenmolecule. In Aspects of protein structure – proceedings of a symposium held in madras 14 - 18 january 1963 andorganized by the university of madras, india, Ramachandran GN (ed.). Academic Press: London and New York,1963; 289–300.
78. Meek KM, Fullwood NJ, Cooke PH, Elliott GF, Maurice DM, Quantock aJ, Wall RS, Worthington C R. Syn-chrotron X-ray diffraction studies of the cornea, with implications for stromal hydration. Biophysical journal 1991;60(2):467–74.
79. Bergman I, Loxley R. Two improved and simplified methods for the spectrophotometric determination ofhydroxyproline. Analytical Chemistry 1963; 35(12):1961–1965.
80. Rougvie M, Bear R. An X-ray diffraction investigation of swelling by collagen. Journal of the American LeatherChemists Association 1953; 48(12):735–751.
81. Grosso VAD, Mader CW. Speed of sound in pure water. Journal of the Acoustical Society of America 1972;52(5B):1442–1446.
82. Sant Z, Cauchi M, Spiteri M. Analysis of stress-strain distribution within a spinal segment. Journal of Mechanicsof Materials and Structures 2012; 7(3):255–263.
83. Wang Y, Battié MC, Boyd SK, Videman T. The osseous endplates in lumbar vertebrae: thickness, bone mineraldensity and their associations with age and disk degeneration. Bone 2011; 48(4):804–809.
84. Yoganandan N, Mykiebust JB, Cusick JF, Wilson CR, Jr AS. Functional biomechanics of the thoracolumbarvertebral cortex. Clinical Biomechanics 1988; 3(1):11–18.
Copyright © 2016 John Wiley & Sons, Ltd. Int. J. Numer. Meth. Biomed. Engng. (2016); e02760DOI: 10.1002/cnm

PATIENT-SPECIFIC FRACTURE RISK ASSESSMENT OF VERTEBRAE (31 of 36) e02760
85. Rietbergen BV, Odgaard A, Kabel J, Huiskes R. Direct mechanics assessment of elastic symmetries and propertiesof trabecular bone architecture. Journal of Biomechanics 1996; 29(12):1653–1657.
86. Cowin SC. Remarks on the paper entitled ’fabric and elastic principal directions of cancellous bone are closelyrelated’. Journal of Biomechanics 1997; 30(11/12):1191–1192.
87. Bhowmik R, Katti K, Katti DR. Mechanics of molecular collagen is influenced by hydroxyapatite in naturial bone.Journal of Materials Science 2007; 42:8824–8837.
88. Bhowmik R, Katti KS, Katti DR. Mechanisms of load-deformation behavior of molecular collagen inhydroxyapatite-tropocollagen molecular system: steered molecular dynamics study. Journal of EngineeringMechanics 2009; 135(5):413–421.
89. Wilson EE, Awonusi A, Kohn MD, Tecklenburg MMJ, Beck LW. Three structural roles for water in bone observedby solid-state NMR. Biophysical Journal 2006; 90:3722–3731.
90. Pan H, Tao J, Tang R. Molecular simulation of water behaviors on crystal faces of hydroxyapatite. Frontiers ofChemistry in China 2007; 2(2):156–163.
91. Zahn D, Hochrein O. Computational study of interfaces between hydroxyapatite and water. Physical ChemistryChemical Physics 2003; 5:4004–4007.
92. Catanese J, Iverson EP, Ng RK, Keaveny TM. Heterogeneity of the mechanical properties of demineralized bone.Journal of Biomechanics 1999; 32:1365–1369.
93. Christiansen DL, Huang EK, Silver FH. Assembly of type I collagen: fusion of fibril subunits and the influence offibril diameter on mechanical properties. Matrix Biology 2000; 19:409–420.
94. Gentleman E, Lay AN, Dickerson DA, Neuman EA, Livesay GA, Dee KC. Mechanical characterization of collagenfibers and scaffolds for tissue engineering. Biomaterials 2003; 24:3805–3813.
95. Burstein AH, Currey JD, Frankel VH, Reilly DT. The ultimate properties of bone tissue: the effects of yielding.Journal of Biomechanics 1972; 5:35–44.
96. Burstein AH, Zika JM, Heiple KG, Klein L. Contribution of collagen and mineral to the elastic-plastic propertiesof bone. The Journal of Bone and Joint Surgery. American volume 1975; 57:956–961.
97. Burstein AH, Reilly DT, Martens M. Aging of bone tissue: mechanical properties. The Journal of Bone and JointSurgery. American volume 1976; 58:82–86.
98. Cezayirlioglu H, Bahniuk E, Davy DT, Heiple KG. Anisotropic yield behavior of bone under combined axial forceand tension. Journal of Biomechanics 1985; 18(1):61–69.
99. Currey JD. Differences in the tensile strength of bone of different histological types. Journal of Anatomy 1959;93:87–95.
100. Currey JD. The effects of strain rate, reconstruction and mineral content on some mechanical properties of bovinebone. Journal of Biomechanics 1975; 8:81–86.
101. Currey JD. Physical characteristics affecting the tensile failure properties of compact bone. Journal of Biomechanics1990; 23:837–844.
102. Currey JD. Tensile yield in compact bone is determined by strain, post-yield behaviour by mineral content. Journalof Biomechanics 2004; 37(4):549–556.
103. Dickenson RP, Hutton WC, Stott JR. The mechanical properties of bone in osteoporosis. The Journal of Bone andJoint Surgery. British volume 1981; 63-B:233–238.
104. Hellmich Ch, Müllner HW, Kohlhauser Ch. Mechanical (triaxial) tests on biological materials and biomaterials.Technical Report DNRT3-1.2-3, Network of excellence ’Knowledge-based Multicomponent Materials for Durableand Safe Performance –KMM-NoE’, sponsored by the European Commission, 2006.
105. Kotha S P, Guzeslu N. Modeling the tensile mechanical behavior of bone along the longitudinal direction. Journalof Theoretical Biology 2002; 219:269–279.
106. Lee SC, Coan BS, Bouxsein ML. Tibial ultrasound velocity measured in situ predicts the material properties oftibial cortical bone. Bone 1997; 21:119–125.
107. Martin RB, Burr DB. Structure, function, and adaptation of compact bone. Raven Press: New York, NY, USA, 1989.108. Reilly DT, Burstein AH, Frankel VH. The elastic modulus for bone. Journal of Biomechanics 1974; 7:271–275.109. Reilly DT, Burstein AH. The elastic and ultimate properties of compact bone tissue. Journal of Biomechanics 1975;
8:393–405.110. Riggs CM, Vaughan LC, Evans GP, Lanyon LE, Boyde A. Mechanical implications of collagen fibre orientation in
cortical bone of equine radius. Anatomy and Embryology 1993; 187:239–248.111. Evans FG, Lebow M. The strength of human compact bone as revealed by engineering technics. American Journal
of Surgery 1952; 83(3):326–31.112. Walsh WR, Guzelsu N. Ion concentration effects on bone streaming potentials and zeta potentials. Biomaterials
1993; 14(5):331–336.113. Diamant I, Shahar R, Masharawi Y, Gefen A. A method for patient-specific evaluation of vertebral cancellous bone
strength: in vitro validation. Clinical Biomechanics 2007; 22(3):282–291.114. Katz J.L., Ukraincik K. On the anisotropic elastic properties of hydroxyapatite. Journal of Biomechanics 1971;
4:221–227.115. Fritsch A, Dormieux L, Hellmich C, Sanahuja J. Mechanical behaviour of hydroxyapatite biomaterials: an exper-
imentally validated micromechanical model for elasticity and strength. Journal of Biomedical Materials Research2009; 88A:149–161.
116. Akao M, Aoki H, Kato K. Mechanical properties of sintered hydroxyapatite for prosthetic applications. Journal ofMaterials Science 1981; 16:809–812.
Copyright © 2016 John Wiley & Sons, Ltd. Int. J. Numer. Meth. Biomed. Engng. (2016); e02760DOI: 10.1002/cnm

e02760 (32 of 36) R. BLANCHARD ET AL.
117. Shareef MY, Messer PF, Noort Rv. Fabrication, characterization and fracture study of a machinable hydroxyapatiteceramic. Biomaterials 1993; 14(1):69–75.
118. Liu DM. Preparation and characterisation of porous hydroxyapatite bioceramic via a slip-casting route. CeramicsInternational 1998; 24(6):441–446.
119. Charrière E, Terrazzoni S, Pittet C, Mordasini P, Dutoit M, Lemaître J, Zysset P. Mechanical characterization ofbrushite and hydroxyapatite cements. Biomaterials 2001; 22:2937–2945.
120. Arita IH, Wilkinson DS, Mondragón MA, Castaño VM. Chemistry and sintering behaviour of thin hydroxyapatiteceramics with controlled porosity. Biomaterials 1995; 16:403–408.
121. Peelen JGJ, Rejda BV, de Groot K. Preparation and properties of sintered hydroxylapatite. Ceramurgia Interna-tional 1978; 4:71–74.
122. De With G, van Dijk H, Hattu N, Prijs K. Preparation, microstructure and mechanical properties of densepolycrystalline hydroxyapatite. Journal of Materials Science 1981; 16:1592–1598.
123. Martin RI, Brown PW. Mechanical properties of hydroxyapatite formed at physiological temperature. Journal ofMaterials Science: Materials in Medicine 1995; 6:138–143.
124. Simo JC, Hughes TJR. Computational inelasticity, Interdisciplinary Applied Mathematics, vol. 7. Springer-Verlag:New York, 1998.
125. Melan E. Zur Plastizität des räumlichen Kontinuums. Ingenieur-Archiv 1938; 9(2):116–126.126. Zaoui A. Continuum micromechanics: survey. Journal of Engineering Mechanics (ASCE) 2002; 128(8):808–816.127. Hill R. Elastic properties of reinfored solids: some theoretical principles. Journal of the Mechanics and Physics of
Solids 1963; 11:357–362.128. Hashin Z. Analysis of composite materials – a survey. Journal of Applied Mechanics (ASME) 1983; 50(3):481–503.129. Levin VM. Thermal expansion coefficient of heterogeneous materials. Mekhanika Tverdogo Tela 1967; 2(1):
83–94.130. Pichler B, Hellmich C. Estimation of influence tensors for eigenstresses multiphase elastic media with nonaligned
inclusion phases of arbitrary ellipsoidal shape. Journal of Engineering Mechanics 2010; 136(8):1043–1053.131. Fritsch A, Hellmich C, Young P. Micromechanics-derived scaling relations for poroelasticity and strength of brittle
porous polycrystals. Journal of Applied Mechanics, Transactions ASME 2013; 80(2).132. Badel PB, Leblond JB. A note on integration schemes for the microplane model of the mechanical behaviour of
concrete. Communications in Numerical Methods in Engineering 2004; 20(1):75–81.133. Simo JC, Taylor RL. Consistent tangent operators for rate-independent elastoplasticity. Computer Methods in
Applied Mechanics and Engineering 1985; 48(1):101–118.134. Clausen J, Damkilde L, Andersen L. Efficient return algorithms for associated plasticity with multiple yield planes.
International Journal for Numerical Methods in Engineering 2006; 66(6):1036–1059.135. Pant S, Fabrèges B, Gerbeau JF, Vignon-Clementel I E. A methodological paradigm for patient-specific multi-scale
CFD simulations: from clinical measurements to parameter estimates for individual analysis. International Journalfor Numerical Methods in Biomedical Engineering 2014; 30(12):1614–16 48.
136. Onishi Y, Aoki K, Amaya K, Shimizu T, Isoda H, Takehara Y, Sakahara H, Kosugi T. Accurate determination ofpatient-specific boundary conditions in computational vascular hemodynamics using 3D cine phase-contrast MRI.International Journal for Numerical Methods in Biomedical Engineering 2013; 29(10):1089–1103.
137. Liang F, Sughimoto K, Matsuo K, Liu H, Takagi S. Patient-specific assessment of cardiovascular function bycombination of clinical data and computational model with applications to patients undergoing Fontan operation.International Journal for Numerical Methods in Biomedical Engineering 2014; 30(10):1000–1018.
138. Boileau E, Bevan RLT, Sazonov I, Rees MI, Nithiarasu P. Flow-induced ATP release in patient-specific arte-rial geometries – a comparative study of computational models. International Journal for Numerical Methods inBiomedical Engineering 2013; 29(10):1038–1056.
139. Arzani A, Les AS, Dalman RL, Shadden SC. Effect of exercise on patient specific abdominal aortic aneurysmflow topology and mixing. International Journal for Numerical Methods in Biomedical Engineering 2014; 30(2):280–295.
140. Hoffler CE, Moore KE, Kozloff K, Zysset PK, Goldstein SA. Age, gender, and bone lamellae elastic moduli. Journalof Orthopaedic Research 2000; 18:432–437.
141. Rho JY, Zioupos P, Currey JD, Pharr GM. Microstructural elasticity and regional heterogeneity in human femoralbone of various ages examined by nano-indentation. Journal of Biomechanics 2002; 35:189–198.
142. Wolfram U, Wilke HJ, Zysset PK. Rehydration of vertebral trabecular bone: influences on its anisotropy, its stiffnessand the indentation work with a view to age, gender and vertebral level. Bone Febuary 2010; 46(2):348–54.
143. Boivin G, Meunier PJ. The degree of mineralization of bone tissue measured by computerized quantitative contactmicroradiography. Calcified Tissue International 2002; 70:503–511.
144. Roschger P, Gupta HS, Berzlanovich A, Ittner G, Dempster DW, Fratzl P, Cosman F, Parisien M, Lindsay R, NievesJW, Klaushofer K. Constant mineralization density distribution in cancellous human bone. Bone 2003; 32:316–323.
145. Akkus O, Polyakova-Akkus A, Adar F, Schaffler MB. Aging of microstructural compartments in human compactbone. Journal of Bone and Mineral Research 2003; 18(6):1012–1019.
146. Bossy E, Talmant M, Peyrin F, Akrout L, Cloetens P, Laugier P. In in vitro study of the ultrasonic axial transmissiontechnique at the radius: 1 MHz velocity measurements are sensitive to both mineralization and introcortical porosity.Journal of Bone and Mineral Research 2004; 19(9):1548–1556.
147. Panjabi MM, Krag M, Summers D, Videman T. Biomechanical time-tolerance of fresh cadaveric human spinespecimens. Journal of Orthopaedic Research 1985; 3(3):292–300.
Copyright © 2016 John Wiley & Sons, Ltd. Int. J. Numer. Meth. Biomed. Engng. (2016); e02760DOI: 10.1002/cnm

PATIENT-SPECIFIC FRACTURE RISK ASSESSMENT OF VERTEBRAE (33 of 36) e02760
148. Linde F, Christian H, Sorensen F. The effect of different storage methods on the mechanical properties of trabecularbone. Journal of Biomechanics 1993; 26(10):1249–1252.
149. Nazarian A, Hermannsson BJ, Muller J, Zurakowski D, Snyder BD. Effects of tissue preservation on murine bonemechanical properties. Journal of Biomechanics 2009; 42(1):82–86.
150. Fölsch C, Mittelmeier W, Bilderbeek U, Timmesfeld N, Von Garrel T, Matter HP. Effect of storage temperature onallograft bone. Transfusion Medicine and Hemotherapy 2012; 39(1):36–40.
151. Fritsch A, Hellmich C. Universal’ microstructural patterns in cortical and trabecular, extracellular and extravacularbone materials: Micromechanics-based prediction of anisotropic elasticity. Journal of Theoretical Biology 2007;244:597–620.
152. Castro I, Humbert L, Whitmarsh T, Lazary A, Del Rio Barquero LM, Frangi AF. 3D reconstruction of interverte-bral discs from T1-weighted magnetic resonance images. 2012 9th IEEE International Symposium on BiomedicalImaging (ISBI) 2012:1695–1698.
153. Hasegawa K, Hasegawa Y, Nagano A. Estimation of bone mineral density and architectural parameters of the distalradius in hemodialysis patients using peripheral quantitative computed tomography. Journal of Biomechanics 2004;37(5):751–756.
154. Nishiyama KK, Macdonald HM, Moore S, Fung T, Boyd SK, McKay H. Cortical porosity is higher in boys com-pared with girls at the distal radius and distal tibia during pubertal growth: an HR-pQCT study. Journal of Bone andMineral Research 2012; 27(2):273–82.
155. Ebbesen EN, Thomsen JS, Beck-Nielsen H, Nepper-Rasmussen HJ, Mosekilde L. Vertebral bone density evaluatedby dual-energy X-ray absorptiometry and quantitative computed tomography in vitro. Bone 1998; 23(3):283–90.
156. Lang TF, Guglielmi G, van Kuijk C, De Serio A, Cammisa M, Genant HK. Measurement of bone mineral den-sity at the spine and proximal femur by volumetric quantitative computed tomography and dual-energy X-rayabsorptiometry in elderly women with and without vertebral fractures. Bone 2002; 30(1):247–250.
157. Wachter NJ, Augat P, Mentzel M, Sarkar MR, Krischak GD, Kinzl L, Claes LE. Predictive value of bone mineraldensity and morphology determined by peripheral quantitative computed tomography for cancellous bone strengthof the proximal femur. Bone 2001; 28(1):133–139.
158. Yu WS, Chan KY, Yu FWP, Ng BKW, Lee KM, Qin L, Lam TP, Cheng JCY. Bone structural and mechanicalindices in adolescent idiopathic scoliosis evaluated by high-reolution peripheal quantitative computed tomography(HR-pQCT). Bone 2014; 61:109–115.
159. Melton III LJ, Riggs BL, van Lenthe GH, Achenbach SJ, Müller R, Bouxsein ML, Amin S, Atkinson EJ, KhoslaS. Contribution of in vivo structural measurements and load/strength ratios to the determination of forearm fracturerisk in postmenopausal women. Journal of Bone and Mineral Research 2007; 22(9):1442–1448.
160. Franzoso G, Zysset PK. Elastic anisotropy of human cortical bone secondary osteons measured by nanoindentation.Journal of Biomechanical Engineering 2009; 131(2):021001.
161. Yoon YJ, Yang G, Cowin SC. Estimation of the effective transversely isotropic elastic constants of a material fromknown values of the material’s orthotropic elastic constants. Biomechanics and Modeling in Mechanobiology 2002;1(1):83–93.
162. Ashman RB, Cowin SC, Van Buskirk WC, Rice JC. A continuous wave technique for the measurement of the elasticproperties of cortical bone. Journal of Biomechanics 1984; 17(5):349–361.
163. Wolfram U, Wilke HJ, Zysset PK. Valid micro finite element models of vertebral trabecular bone can be obtainedusing tissue properties measured with nanoindentation under wet conditions. Journal of Biomechanics June 2010;43(9):1731–1737.
164. Kelly N, Harrison NM, McDonnell P, McGarry JP. An experimental and computational investigation of thepost-yield behaviour of trabecular bone during vertebral device subsidence. Biomechanics and Modeling inMechanobiology 2013; 12(4):685–703.
165. Schwiedrzik J, Raghavan R, Bürki A, LeNader V, Wolfram U, Michler J, Zysset P. In situ micropillar compressionreveals superior strength and ductility but an absence of damage in lamellar bone. Nature materials 2014; 13:740–747.
166. Gatt CJ, Hosea TM, Palumbo RC, Zawadsky JP. Impact loading of the lumbar spine during football blocking.American Journal of Sports Medicine 1997; 25(3):317–321.
167. Luczynski KW, Steiger-Thirsfeld A, Bernardi J, Eberhardsteiner J, Hellmich Christian. Extracellular bone matrixexhibits hardening elastoplasticity and more than double cortical strength: evidence from homogeneous compres-sion of non-tapered single micron-sized pillars welded to a rigid substrate. Journal of the Mechanical Behavior ofBiomedical Materials 2015; 52:51–62.
168. Bevill G, Keaveny TM. Trabecular bone strength predictions using finite element analysis of micro-scale images atlimited spatial resolution. Bone 2009; 44(4):579–584.
169. Bürklein D, Lochmüller E, Kuhn V, Grimm J, Barkmann R, Müller R, Eckstein F. Correlation of thoracic andlumbar vertebral failure loads with in situ vs. ex situ dual energy X-ray absorptiometry. Journal of Biomechanics2001; 34(5):579–587.
170. Baca V, Horak Z, Mikulenka P, Dzupa V. Comparison of an inhomogeneous orthotropic and isotropic materialmodels used for fe analyses. Medical Engineering and Physics 2008; 30:924–930.
171. Schneider R, Faust G, Hindenlang U, Helwig P. Inhomogeneous, orthotropic material model for the cortical struc-ture of long bones modelled on the basis of clinical CT or density data. Computer Methods in Applied Mechanicsand Engineering 2009; 198(27-29):2167–217.
Copyright © 2016 John Wiley & Sons, Ltd. Int. J. Numer. Meth. Biomed. Engng. (2016); e02760DOI: 10.1002/cnm

e02760 (34 of 36) R. BLANCHARD ET AL.
172. Wroe S, Moreno K, Clausen P, McHenry C, Curnoe D. High-resolution three-dimensional computer simulation ofhomonid cranial mechanics. The Anatomical Record 2007; 290:1248–1255.
173. Pierce DM, Ricken T, Holzapfel GA. Modeling sample/patient-specific structural and diffusional responses ofcartilage using DT-MRI. International Journal for Numerical Methods in Biomedical Engineering 2013; 29(8):807–821.
174. Decorato I, Kharboutly Z, Vassallo T, Penrose J, Legallais C, Salsac AV. Numerical simulation of the fluid structureinteractions in a compliant patient-specific arteriovenous fistula. International Journal for Numerical Methods inBiomedical Engineering 2014; 30(2):143–159.
175. Sievaenen. Bone densitometry and true BMD accuracy for predicting fractures : what are the alternatives? Review.International Journal of Clinical Rheumatology 2010; 5(3):371–385.
176. Epstein NE. Are recommended spine operations either unnecessary or too complex? Evidence from secondopinions. Surgical Neurology International 2013; 4(Suppl 5):S353–S358.
177. Schwier M, Chitiboi T, Hülnhagen T, Hahn HK. Automated spine and vertebrae detection in CT images usingobject-based image analysis. International Journal for Numerical Methods in Biomedical Engineering 2013;29(9):938–963.
178. Castro-Mateos I, Pozo J, Lazary A, Frangi A. 3D Vertebra Segmentation by Feature Selection Active Shape Model.In Recent advances in computational methods and clinical applications for spine imaging, vol. 20, Yao J, Glocker B,Klinder T, Li S (eds)., Lecture Notes in Computational Vision and Biomechanics. Springer International Publishing:Switzerland, 2015; 241–245.
179. Adams MA, Dolan P. A technique for quantifying the bending moment acting on the lumbar spine in vivo. Journalof Biomechanics January 1991; 24(2):117–126.
NOMENCLATURE
Variablesa... slope of linear relation between grey values and X-ray attenuation coefficientsA... areaA... strain concentration tensorb... intercept of linear relation between grey values and X-ray attenuation coefficientsC... stiffness tensorCijkl ... stiffness tensor componentC�1ijkl
... compliance tensor componentDic;ˆ‚... influence tensor accounting for the influence of plastic strains in the (ˆ‚)-orientedmineral phase on the total strains in the inter-crystalline poresD��ˆ‚... influence tensor accounting for the influence of plastic strains in the (ˆ‚)-orientedmineral phase on the total strains in the .��/-oriented phaseE... Young’s modulusE ... photon energyE... macroscopic strainfji ... volume fraction of phase i (if specified, in the RVE j ; otherwise, in the macroscopic
RVE)F ... yield functionG... flow potentialGi ... shear modulus of constituent iGV ... X-ray attenuation-related grey valueI... fourth-order identity tensorki ... bulk modulus of constituent il ... characteristic lengthNn... total number of finite elementsNC ... number of constituents in the volume (voxel)P ... Hill tensor or morphological tensorR... ratioRVE ... representative volume elementVn... volume of the n-th finite elementW ... weightx... (microscopic) position vector inside the RVE
Copyright © 2016 John Wiley & Sons, Ltd. Int. J. Numer. Meth. Biomed. Engng. (2016); e02760DOI: 10.1002/cnm

PATIENT-SPECIFIC FRACTURE RISK ASSESSMENT OF VERTEBRAE (35 of 36) e02760
ˇ... ratio between compressive and tensile yield stress of hydroxyapatiteıij ... Kronecker delta"... microscopic strain tensorP... plastic multiplier�i ... X-ray intensity attenuation coefficient of constituent i�... Poisson’s ratio�... displacement�i ... "real" mass density of material constituent i��;ji ... apparent mass density of material constituent i per volume of space j�... average mass density� ... microscopic stress˙ ... macroscopic stress�ji ... porosity of space i (if specified, in the RVE j ; otherwise, in the macroscopic RVE)�... risk factor ... macroscopic strain energy density ... strain energy density averaged over organ
Subscripts1... in radial direction2... in circumferential direction3... in axial directiona... dried in airbone... of bonecol ... of collagencort ... of cortical shellcyl ... of cylindrical inclusionsdev... deviatoric partec... of extracellular bone matrixef ... of the extrafibrillar spaceend ... of the bony endplateev... at extravascular scalefat ... of adipose tissuesHA... of hydroxyapatiteH2O ... of waterH2O C ncp... of water and non-collageneous proteinshom... homogenizedic... of the inter-crystalline spacelac... of lacunaemacro... of macroscopic bonemax... maximum valuemax � 1... penultimate maximum valueorg... of organic matterorgan... of the full organs... submerged in watersof t ... of soft tissuessph... of spherical inclusionsthr ... at threshold valuevas... of vascular porosityvol ... volumetric partvoxel ... of one voxel of the computed tomography imageult ... ultimatey... at the start of yielding
Copyright © 2016 John Wiley & Sons, Ltd. Int. J. Numer. Meth. Biomed. Engng. (2016); e02760DOI: 10.1002/cnm

e02760 (36 of 36) R. BLANCHARD ET AL.
�; �;ˆ;‚... Euler angles defining the orientation of the crystal needles (cylindrical mineralphases)
SuperscriptsI; II; III ... eigenvaluesec... in the extracellular bone RVEef ... in the extrafibrillar spaceEV ... statistically expected valueiso... in an isotropic phasep... plastict rab... of trabecular boneult ... ultimateup... upscaledy... at the start of yielding
Mathematical symbolsrs ... symmetrized nabla operator:... second-order tensor contraction
Copyright © 2016 John Wiley & Sons, Ltd. Int. J. Numer. Meth. Biomed. Engng. (2016); e02760DOI: 10.1002/cnm
Copyright © 2022 FDOKUMEN