Multiplexed Screening of Cellular Uptake of Gold Nanoparticles Using Laser Desorption/Ionization...
13
Multiplexed Screening of Cellular Uptake of Gold Nanoparticles Using Laser Desorption/Ionization Mass Spectrometry Zheng-Jiang Zhu, Partha S. Ghosh, Oscar R. Miranda, Richard W. Vachet, and Vincent M. Rotello Department of Chemistry, University of Massachusetts, Amherst, Massachusetts 01003 Abstract Gold nanoparticles (AuNPs) are highly promising candidates as drug delivery agents into cells of interest. We describe for the first time the multiplexed analysis of nanoparticle uptake by cells using mass spectrometry. We demonstrate that the cellular uptake of functionalized gold nanoparticles with cationic or neutral surface ligands can be readily determined using laser desorption/ionization mass spectrometry of cell lysates. The surface ligands have “mass barcodes” that allow different nanoparticles to be simultaneously identified and quantified at levels as low as 30 pmol. Using this method, we find that subtle changes to AuNP surface functionalities can lead to measurable changes in cellular uptake propensities. Introduction Therapeutic nanocarriers carry drugs, genes, and/or imaging agents into cells and tissues of interest. 1-4 Various materials, such as polymeric micelles, 5 mesoporous silica nanorods, 6 carbon nanotubes, 7 and nanoparticles, 8-10 have been used as therapeutic nanocarriers, as well as probes for following intracellular processes. Effective use of nanoparticles as carriers and intracellular probes requires the ability to monitor these particles in cells, and several techniques are available for this purpose. These techniques can be classified into two groups: (1) label-free imaging techniques such as luminescent quantum dots imaging, 10,11 atomic force microscopy (AFM), 12 and transmission electron microscopy (TEM) 13 and (2) barcoding techniques such as those that encode nanoparticles with fluorescence dyes that can be “read out” by a fluorescence spectrometer. 2 Simultaneous screening of the cellular uptake of multiple particles with different surface functional groups, however, is a challenge for existing approaches. Here, we describe a new “mass barcoding” technique for monitoring the cellular uptake of multiple functionalized gold nanoparticles (AuNPs) by using laser desorption/ ionization mass spectrometry (LDI-MS). Nanoparticles have been used in mass spectrometric analyses primarily to facilitate the laser desorption/ionization of compounds of interest. Tanaka et al. 14 showed that cobalt particles (∼30 nm) suspended in glycerol facilitated the ionization of proteins. Subsequently, Ag, 15 Au, 16-22 C, 23 and Si 24,25 nanomaterials have been demonstrated as LDI-MS matrixes with different degrees of success. Meanwhile, some mass spectrometric work has also been devoted to the analysis of nanoparticles themselves. For pure samples of gold nanoparticles, electrospray ionization mass spectrometry (ESI-MS) 26,27 and LDI-MS 28,29 have been used to measure the compositions of surface functionalities and atom numbers in the NP core. E-mail: [email protected] (V.M.R.); [email protected] (R.W.V.). NIH Public Access Author Manuscript J Am Chem Soc. Author manuscript; available in PMC 2009 February 9. Published in final edited form as: J Am Chem Soc. 2008 October 29; 130(43): 14139–14143. doi:10.1021/ja805392f. NIH-PA Author Manuscript NIH-PA Author Manuscript NIH-PA Author Manuscript
-
Upload
independent -
Category
Documents
-
view
3 -
download
0
Transcript of Multiplexed Screening of Cellular Uptake of Gold Nanoparticles Using Laser Desorption/Ionization...

Multiplexed Screening of Cellular Uptake of Gold NanoparticlesUsing Laser Desorption/Ionization Mass Spectrometry
Zheng-Jiang Zhu, Partha S. Ghosh, Oscar R. Miranda, Richard W. Vachet, and Vincent M.RotelloDepartment of Chemistry, University of Massachusetts, Amherst, Massachusetts 01003
AbstractGold nanoparticles (AuNPs) are highly promising candidates as drug delivery agents into cells ofinterest. We describe for the first time the multiplexed analysis of nanoparticle uptake by cells usingmass spectrometry. We demonstrate that the cellular uptake of functionalized gold nanoparticles withcationic or neutral surface ligands can be readily determined using laser desorption/ionization massspectrometry of cell lysates. The surface ligands have “mass barcodes” that allow differentnanoparticles to be simultaneously identified and quantified at levels as low as 30 pmol. Using thismethod, we find that subtle changes to AuNP surface functionalities can lead to measurable changesin cellular uptake propensities.
IntroductionTherapeutic nanocarriers carry drugs, genes, and/or imaging agents into cells and tissues ofinterest.1-4 Various materials, such as polymeric micelles,5 mesoporous silica nanorods,6carbon nanotubes,7 and nanoparticles,8-10 have been used as therapeutic nanocarriers, as wellas probes for following intracellular processes. Effective use of nanoparticles as carriers andintracellular probes requires the ability to monitor these particles in cells, and severaltechniques are available for this purpose. These techniques can be classified into two groups:(1) label-free imaging techniques such as luminescent quantum dots imaging,10,11 atomicforce microscopy (AFM),12 and transmission electron microscopy (TEM)13 and (2) barcodingtechniques such as those that encode nanoparticles with fluorescence dyes that can be “readout” by a fluorescence spectrometer.2 Simultaneous screening of the cellular uptake of multipleparticles with different surface functional groups, however, is a challenge for existingapproaches. Here, we describe a new “mass barcoding” technique for monitoring the cellularuptake of multiple functionalized gold nanoparticles (AuNPs) by using laser desorption/ionization mass spectrometry (LDI-MS).
Nanoparticles have been used in mass spectrometric analyses primarily to facilitate the laserdesorption/ionization of compounds of interest. Tanaka et al.14 showed that cobalt particles(∼30 nm) suspended in glycerol facilitated the ionization of proteins. Subsequently, Ag,15 Au,16-22 C,23 and Si24,25 nanomaterials have been demonstrated as LDI-MS matrixes withdifferent degrees of success. Meanwhile, some mass spectrometric work has also been devotedto the analysis of nanoparticles themselves. For pure samples of gold nanoparticles,electrospray ionization mass spectrometry (ESI-MS)26,27 and LDI-MS28,29 have been usedto measure the compositions of surface functionalities and atom numbers in the NP core.
E-mail: [email protected] (V.M.R.); [email protected] (R.W.V.).
NIH Public AccessAuthor ManuscriptJ Am Chem Soc. Author manuscript; available in PMC 2009 February 9.
Published in final edited form as:J Am Chem Soc. 2008 October 29; 130(43): 14139–14143. doi:10.1021/ja805392f.
NIH
-PA Author Manuscript
NIH
-PA Author Manuscript
NIH
-PA Author Manuscript

In this study, we have tagged AuNPs with readily ionizable surface functionalities, i.e., “massbarcodes” (shown in Figure 1). These alkanethiolate cationic or neutral monolayers are barriersbetween the nanoparticle core and the environment, effectively protecting and stabilizing thegold cluster core in biological environments.30-32 Moreover, the chemical nature of thesemonolayers dictates interfacial interactions between cells and AuNPs, thus governing cellularuptake of AuNPs.33-35 Upon laser irradiation of these AuNPs, mass barcodes of alkanethiolatemonolayers rather than the AuNPs themselves can be simply read out by LDI-MS, thusproviding characteristic peaks for identifying AuNPs (e.g., Figure S1 in the SupportingInformation, LDI-MS spectrum of AuNP 1). Ionization of alkanethiolate monolayers on flatgold surfaces has also been observed using LDI36,37 and matrix-assisted LDI (MALDI).38,39 The surface ligands on the AuNPs are primarily detected because the NP core efficientlyabsorbs the laser light (337 nm), and this energy is readily transferred to desorb and ionize thesurface ligands, probably via a mechanism similar to that proposed by Tanaka.14 In this work,we investigate a potential advantage of such a mass barcoding approach—the ability tosimultaneously analyze many different functionalized AuNPs. We predicted that eachfunctionalized AuNP could be identified by its unique mass barcode. Furthermore, we explorethis LDI strategy for direct analyses of AuNPs taken up by cells. Such a multiplexed screeningof AuNPs could be very valuable for rapidly assessing the chemical and physical parametersthat influence AuNP uptake by cells. To the best of our knowledge, this is the first report ofmultiplexed analysis of cellular uptake of functionalized AuNPs with LDI-MS.
Results and DiscussionTo explore the viability of mass barcodes for determining the uptake efficiency of AuNPs, wecultured monkey kidney cells (COS-1) with AuNPs (500 nM) for 6 h (Figure 2a). Thisconcentration of AuNPs is nontoxic to the cells,40 and after 6 h of incubation, no cellmorphology changes are observed. The cells were washed three times with cold phosphate-buffered saline (PBS) to remove extra AuNPs that were not taken up by the cells. Before thecells were lysed, TEM was used to verify the cellular uptake of AuNPs. As shown for a singlecell (Figure 2b), multiple gold nanoparticles are trapped in vesicles (most likely via endosomalentrapment) in the cytoplasm, which is in agreement with results by other groups.13,41,42 Itis possible that some AuNPs have escaped from the vesicles, as NP escape depends on the NPsurface functionalities,42,43 but direct evidence for this was not found in the TEM images.After the cells were lysed, the AuNPs taken up by the cells were then collected as part of theprecipitate after centrifugation of the lysate. The precipitate was subjected to LDI-MS, andspectra similar to that shown in Figure 3a were obtained. Figure 3a illustrates the characteristicpeaks that are observed for AuNP 1. The spectrum of AuNP 1 includes an ion at m/z 422, whichcorresponds to the molecular ion (M+) of the ligand attached to AuNP 1. The spectrum alsoincludes ions at m/z 388, which corresponds to [M - H2S]+, m/z 197 and 394, which correspondto Au+ and Au2
+, respectively, and m/z 184, which corresponds to the headgroup fragment ofone of the most abundant lipids in animal cell membranes—phosphatidylcholine (PC).Moreover, a series of peaks spaced by 14 Da from m/z 262 to m/z 360 indicate successive lossesof CH2 units from the alkyl chains of the surface ligands. Each of the other AuNPs in this studyhad similar mass spectral patterns, with each AuNP featuring different m/z ratios allowingidentification (Figure S2 in the Supporting Information).
The different mass barcodes of each AuNP facilitate multiplexed screening by LDI-MS. Aftercells are simultaneously exposed to two different types of AuNPs, LDI-MS analysis of theresulting cell lysate indicates that both AuNPs can be readily identified. For example, in Figure3b, diagnostic molecular ions at m/z 422 and m/z 436 indicate the cellular uptake of AuNP 1and AuNP 2, respectively. Other characteristic peaks, such as [M - H2S]+ (m/z 388 for AuNP1 and m/z 402 for AuNP 2), also assist the identification of two AuNPs.
Zhu et al. Page 2
J Am Chem Soc. Author manuscript; available in PMC 2009 February 9.
NIH
-PA Author Manuscript
NIH
-PA Author Manuscript
NIH
-PA Author Manuscript
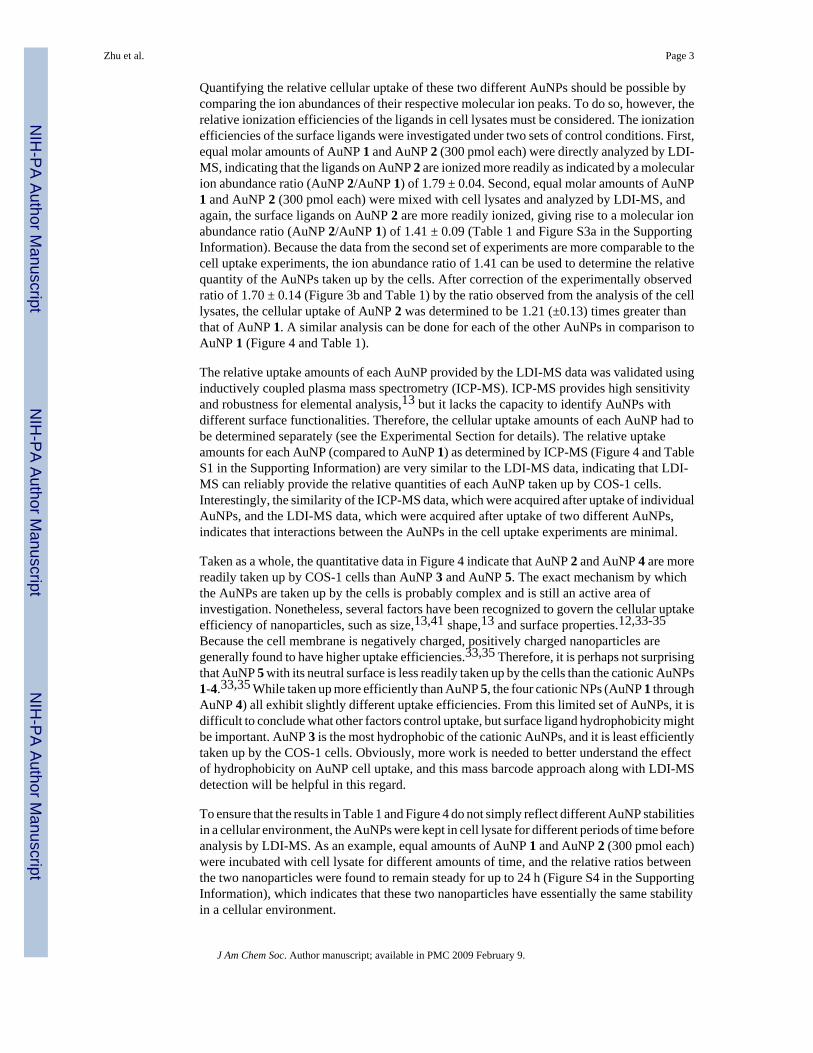
Quantifying the relative cellular uptake of these two different AuNPs should be possible bycomparing the ion abundances of their respective molecular ion peaks. To do so, however, therelative ionization efficiencies of the ligands in cell lysates must be considered. The ionizationefficiencies of the surface ligands were investigated under two sets of control conditions. First,equal molar amounts of AuNP 1 and AuNP 2 (300 pmol each) were directly analyzed by LDI-MS, indicating that the ligands on AuNP 2 are ionized more readily as indicated by a molecularion abundance ratio (AuNP 2/AuNP 1) of 1.79 ± 0.04. Second, equal molar amounts of AuNP1 and AuNP 2 (300 pmol each) were mixed with cell lysates and analyzed by LDI-MS, andagain, the surface ligands on AuNP 2 are more readily ionized, giving rise to a molecular ionabundance ratio (AuNP 2/AuNP 1) of 1.41 ± 0.09 (Table 1 and Figure S3a in the SupportingInformation). Because the data from the second set of experiments are more comparable to thecell uptake experiments, the ion abundance ratio of 1.41 can be used to determine the relativequantity of the AuNPs taken up by the cells. After correction of the experimentally observedratio of 1.70 ± 0.14 (Figure 3b and Table 1) by the ratio observed from the analysis of the celllysates, the cellular uptake of AuNP 2 was determined to be 1.21 (±0.13) times greater thanthat of AuNP 1. A similar analysis can be done for each of the other AuNPs in comparison toAuNP 1 (Figure 4 and Table 1).
The relative uptake amounts of each AuNP provided by the LDI-MS data was validated usinginductively coupled plasma mass spectrometry (ICP-MS). ICP-MS provides high sensitivityand robustness for elemental analysis,13 but it lacks the capacity to identify AuNPs withdifferent surface functionalities. Therefore, the cellular uptake amounts of each AuNP had tobe determined separately (see the Experimental Section for details). The relative uptakeamounts for each AuNP (compared to AuNP 1) as determined by ICP-MS (Figure 4 and TableS1 in the Supporting Information) are very similar to the LDI-MS data, indicating that LDI-MS can reliably provide the relative quantities of each AuNP taken up by COS-1 cells.Interestingly, the similarity of the ICP-MS data, which were acquired after uptake of individualAuNPs, and the LDI-MS data, which were acquired after uptake of two different AuNPs,indicates that interactions between the AuNPs in the cell uptake experiments are minimal.
Taken as a whole, the quantitative data in Figure 4 indicate that AuNP 2 and AuNP 4 are morereadily taken up by COS-1 cells than AuNP 3 and AuNP 5. The exact mechanism by whichthe AuNPs are taken up by the cells is probably complex and is still an active area ofinvestigation. Nonetheless, several factors have been recognized to govern the cellular uptakeefficiency of nanoparticles, such as size,13,41 shape,13 and surface properties.12,33-35Because the cell membrane is negatively charged, positively charged nanoparticles aregenerally found to have higher uptake efficiencies.33,35 Therefore, it is perhaps not surprisingthat AuNP 5 with its neutral surface is less readily taken up by the cells than the cationic AuNPs1-4.33,35 While taken up more efficiently than AuNP 5, the four cationic NPs (AuNP 1 throughAuNP 4) all exhibit slightly different uptake efficiencies. From this limited set of AuNPs, it isdifficult to conclude what other factors control uptake, but surface ligand hydrophobicity mightbe important. AuNP 3 is the most hydrophobic of the cationic AuNPs, and it is least efficientlytaken up by the COS-1 cells. Obviously, more work is needed to better understand the effectof hydrophobicity on AuNP cell uptake, and this mass barcode approach along with LDI-MSdetection will be helpful in this regard.
To ensure that the results in Table 1 and Figure 4 do not simply reflect different AuNP stabilitiesin a cellular environment, the AuNPs were kept in cell lysate for different periods of time beforeanalysis by LDI-MS. As an example, equal amounts of AuNP 1 and AuNP 2 (300 pmol each)were incubated with cell lysate for different amounts of time, and the relative ratios betweenthe two nanoparticles were found to remain steady for up to 24 h (Figure S4 in the SupportingInformation), which indicates that these two nanoparticles have essentially the same stabilityin a cellular environment.
Zhu et al. Page 3
J Am Chem Soc. Author manuscript; available in PMC 2009 February 9.
NIH
-PA Author Manuscript
NIH
-PA Author Manuscript
NIH
-PA Author Manuscript

We also investigated the sensitivity of our LDI-MS approach by culturing COS-1 cells withdiffering amounts of AuNPs. We found that AuNPs present at levels as low as 30 pmol (50nM) in cell cultures could be readily detected. Figure S5 (Supporting Information) illustratesthis for experiments with AuNP 1. The characteristic peak for AuNP 1 is readily apparent, m/z 422, with a signal-to-noise ratio of 75. With such a good signal, we feel that the AuNPs couldbe detected even when present at even lower amounts.
A key advantage of the LDI-MS measurements over the ICP-MS measurements or othermeasurements is the ability to simultaneously identify and quantitate the uptake of multipleAuNPs. To demonstrate the advantages of such a multiplexed analysis, COS-1 cells werecultured with four cationic AuNPs (AuNPs 1-4) (300 pmol each), and the resulting cellularcontents were analyzed by LDI-MS (Figure 5a). Diagnostic molecular ion peaks at m/z 422,m/z 436, m/z 492, and m/z 465 indicate the presence of AuNP 1, AuNP 2, AuNP 3, and AuNP4, respectively. The relative quantities of each AuNP (Figure 5b and Table S2 in the SupportingInformation) indicate that AuNP 2 is the most readily taken up by the cells, while AuNP 3 isthe least readily taken up, quite similar to the results in Figure 4. The slight differences mightbe explained by the greater total concentrations of AuNPs present in the experiments givingrise to Figure 4. These greater concentrations may have increased the cell uptake competitionbetween the AuNPs, causing AuNP 4, for example, to be taken up less readily.
ConclusionWe have described the use of AuNPs with mass barcodes for the multiplexed screening ofAuNP cellular uptake. We demonstrate that the relative quantities of four different AuNPstaken up by cells can be simultaneously determined using LDI-MS with this approach. We alsofind that the cellular uptake of the functionalized AuNPs is dependent on the NP surfacefunctionality, suggesting that differential cellular uptake and specific cell targeting might bepossible if the appropriate surface functionalities are chosen. In the future, we plan to use thistechnique to evaluate differential AuNP uptake by different cell states (e.g., normal anddiseased). A future improvement will be to combine the LDI-MS approach with subcellularfractionation. This combination should be able to identify the intracellular targets for theAuNPs. On the whole, this LDI-MS technique has great potential for both the development ofAuNP-based delivery vectors and probing transport of nanomaterials in vitro and in vivo.
Experimental SectionAll chemicals were obtained from Sigma-Aldrich (St. Louis, MO) unless otherwise noted.
AuNP 1-5 SynthesisThe Brust-Schiffrin two-phase synthesis method31,44 was used for synthesis of AuNPs withcore diameters around 2 nm (see Figure S6 in the Supporting Information). After that, theMurray place-exchange method was used to obtain functionalized AuNPs 1-530,32 (see theSupporting Information for details).
Cell Culture and Cellular Uptake of AuNPsMonkey kidney COS-1 cells (75 000 cells/well) were grown on a 24-well plate in high-glucoseDulbecco’s modified Eagle’s medium (DMEM; glucose (4.5 g L-1)) containing 4-(2-hydroxyethyl)-1-piperazineethanesulfonic acid (HEPES) buffer (pH 7.4, 25 mM)supplemented with fetal bovine serum (FBS; 10%). Cultures were maintained at 37 °C undera humidified condition with 5% CO2. After 24 h of plating, the cells were washed once withcold PBS, and the solutions of nanoparticles (Table S3 in the Supporting Information) wereadded. Following 6 h of incubation, the cells were washed three times with PBS to remove
Zhu et al. Page 4
J Am Chem Soc. Author manuscript; available in PMC 2009 February 9.
NIH
-PA Author Manuscript
NIH
-PA Author Manuscript
NIH
-PA Author Manuscript

extra nanoparticles and lysed for 15 min with a lysis buffer according to the kit fromGENLANTIS. A quick freeze/thaw cycle (freeze for 2 h at -20 °C and then thaw at roomtemperature) was performed to improve lysis. The lysed cells were then prepared for LDI-MSor ICP-MS analyses. For screening of four cationic nanoparticles (AuNPs 1-4) simultaneously,the COS-1 cells were plated on a six-well plate with 75 000 × 4.8 cells/well. The cells weretreated in a manner similar to that mentioned above. A mixture of four AuNPs (Table S3 inthe Supporting Information) was added to each well and incubated for 6 h.
Control Experiments for QuantificationCOS-1 cells were first lysed, and then the solutions of nanoparticles in PBS only (Table S4 inthe Supporting Information) were added to each well and kept in the incubator for 6 h. Theamount of nanoparticles and sample preparations were the same as described above except thatno medium was added.
Cell TEMCells were treated with AuNP 1 (1 μM NP in a 600 μL solution per well in a 24-well plate)and washed with PBS buffer after 6 h. Then the cells were removed from the plate bytrypsinization and centrifuged to collect the pellet. The pellet was fixed with 2% gluteraldehydefor 30 min and postfixed with 1% OsO4 for 1 h. OsO4 is highly poisonous and must be usedwith extreme caution! Following agarose (1.5%) enrobing, Spurr’s resin embedding, andultrathin (50 nm) sectioning, the samples were stained with 2% aqueous uranyl acetate and 25mg/mL lead citrate and imaged with a JEOL 100S microscope.
LDI-MS InstrumentationMost of the LDI-MS analyses were done on a Bruker Reflex III time-of-flight massspectrometer. Only the sensitivity experiments (Figure S5 in the Supporting Information) wereperformed on a Waters Micromass M@LDI L/R mass spectrometer. The Bruker Reflex III isequipped with a 337 nm nitrogen laser, a 1.0 m flight tube, and a stainless steel sample target.All mass spectra were acquired in reflectron mode using a voltage of 16 kV. All reported spectrarepresent an average of 50 shots acquired at 90% laser power. The accelerating voltage wasset to 20 kV. The Waters instrument was operated in positive reflection mode. The pulse voltagewas set to 2400 V, the source to 15 000 V, and MCP to 1850 V. Matrix suppression delay wasset to m/z 100. The spectrum represents an average of 50 shots acquired at 70% high laserpower.
LDI-MS Sample Preparation and MeasurementsThe lysed cells were centrifuged at 14 000 rpm for 10 min. AuNPs precipitated together withthe cell lysates were washed with 60% acetonitrile/40% water, applied directly to a stainlesssteel target, and allowed to dry. The dry samples were washed with 60% acetonitrile/40% waterand then allowed to dry before LDI analysis. Each AuNP experiment was performed intriplicate, and at least five spots of each replicate were measured by LDI-MS.
ICP-MS InstrumentationAll ICP-MS measurements were performed on a Perkin-Elmer Elan 6100. Operating conditionsof the ICP-MS are listed below: rf power, 1200 W; plasma Ar flow rate, 15 L/min; nebulizerAr flow rate, 0.96 L/min; isotopes monitored, 197Au and 103Rh (as an internal standard); dwelltime, 50 ms; nebulizer, cross-flow; spray chamber, Scott.
Zhu et al. Page 5
J Am Chem Soc. Author manuscript; available in PMC 2009 February 9.
NIH
-PA Author Manuscript
NIH
-PA Author Manuscript
NIH
-PA Author Manuscript

ICP-MS Sample Preparation and MeasurementsEach AuNP was incubated with COS-1 cells separately as described above (Table S3 in theSupporting Information). After incubation and lysing of the cells, the resulting cell lysate wasdigested overnight using 3 mL of HNO3 and 1 mL of H2O2. On the next day, 3 mL of aquaregia was added, and then the sample was allowed to react for another 1-2 h. Aqua regia ishighly corrosive and must be used with extreme caution! A hot plate (∼100 °C) was used toreduce the above digested solution to 1-2 mL. The concentrated sample solution was thendiluted to 100 mL with deionized water, and aqua regia and a 103Rh internal standard solutionwere also added. The final AuNP sample solution contained 5% aqua regia and 10 ppb 103Rh.The AuNP sample solution was measured by ICP-MS under the operating conditions describedabove. Cell uptake experiments with each AuNP were repeated 3 times, and each replicate wasmeasured 10 times by ICP-MS. A series of gold standard solutions (20, 10, 5, 2, 1, 0.5, 0.2,and 0 ppb) were prepared before each experiment. Each gold standard solution contained 5%aqua regia and 10 ppb 103Rh. Each standard solution was measured 10 times by ICP-MS usingthe operating conditions described above. The resulting calibration line was used to determinethe gold amount taken up by the cells in each sample. A ∼100 ppm solution of dithiothreitolwas used to wash the instrument between analyses to facilitate gold removal.
Supplementary MaterialRefer to Web version on PubMed Central for supplementary material.
AcknowledgmentThis work is supported by the Office of Naval Research under Award No. N000140510501 (R.W.V. and V.M.R.),the NIH (Grant GM077173, V.M.R.), and the NSF Center for Hierarchical Manufacturing (Grant DMI-0531171). Wethank Prof. Julian F. Tyson and Dr. Elena Dovova for access to and assistance with the ICP-MS instrumentation andDale A. Callaham for help with TEM imaging.
References(1). Peer D, Karp JM, Hong S, Farokhzad OC, Margalit R, Langer R. Nat. Nanotechnol 2007;2:751–760.
[PubMed: 18654426](2). Rosi NL, Giljohann DA, Thaxton CS, Lytton-Jean AKR, Han MS, Mirkin CA. Science
2006;312:1027–1030. [PubMed: 16709779](3). Michalet X, Pinaud FF, Bentolila LA, Tsay JM, Doose S, Li JJ, Sundaresan G, Wu AM, Gambhir
SS, Weiss S. Science 2005;307:538–544. [PubMed: 15681376](4). Han G, You C-C, Kim B-J, Turingan RS, Forbes NS, Martin CT, Rotello VM. Angew. Chem., Int.
Ed 2006;45:3165–3169.(5). Savic R, Luo L, Eisenberg A, Maysinger D. Science 2003;300:615–618. [PubMed: 12714738](6). Giri S, Trewyn BG, Stellmaker MP, Lin VSY. Angew. Chem., Int. Ed 2005;44:5038–5044.(7). Kam NWS, O’Connell M, Wisdom JA, Dai H. Proc. Natl. Acad. Sci. U.S.A 2005;102:11600–11605.
[PubMed: 16087878](8). Hong R, Han G, Fernandez JM, Kim B-J, Forbes NS, Rotello VM. J. Am. Chem. Soc 2006;128:1078–
1079. [PubMed: 16433515](9). Lewin M, Carlesso N, Tung C-H, Tang X-W, Cory D, Scadden DT, Weissleder R. Nat. Biotechnol
2000;18:410–414. [PubMed: 10748521](10). Gao X, Cui Y, Levenson RM, Chung LWK, Nie S. Nat. Biotechnol 2004;22:969–976. [PubMed:
15258594](11). Jaiswal JK, Mattoussi H, Mauro JM, Simon SM. Nat. Biotechnol 2003;21:47–51. [PubMed:
12459736](12). Yang PH, Sun X, Chiu JF, Sun H, He QY. Bioconjugate Chem 2005;16:494–496.(13). Chithrani BD, Ghazani AA, Chan WCW. Nano Lett 2006;6:662–668. [PubMed: 16608261]
Zhu et al. Page 6
J Am Chem Soc. Author manuscript; available in PMC 2009 February 9.
NIH
-PA Author Manuscript
NIH
-PA Author Manuscript
NIH
-PA Author Manuscript

(14). Tanaka K, Waki H, Ido Y, Akita S, Yoshida Y, Yoshida T, Matsuo T. Rapid Commun. MassSpectrom 1988;2:151–153.
(15). Owega S, Lai EPC, Bawagan ADO. Anal. Chem 1998;70:2360–2365.(16). Novikov A, Caroff M, Della-Negra S, Lebeyec Y, Pautrat M, Schultz JA, Tempez A, Wang HYJ,
Jackson SN, Woods AS. Anal. Chem 2004;76:7288–7293. [PubMed: 15595871](17). McLean JA, Stumpo KA, Russell DH. J. Am. Chem. Soc 2005;127:5304–5305. [PubMed:
15826152](18). Castellana ET, Russell DH. Nano Lett 2007;7:3023–3025. [PubMed: 17887713](19). Huang YF, Chang HT. Anal. Chem 2006;78:1485–1493. [PubMed: 16503598](20). Su CL, Tseng WL. Anal. Chem 2007;79:1626–1633. [PubMed: 17297965](21). Nagahori N, Nishimura S-I. Chem.—Eur. J 2006;12:6478–6485.(22). Spencer MT, Furutani H, Oldenburg SJ, Darlington TK, Prather KA. J. Phys. Chem. C
2008;112:4083–4090.(23). Sunner J, Dratz E, Chen Y-C. Anal. Chem 1995;67:4335–4342. [PubMed: 8633776](24). Wei J, Buriak JM, Siuzdak G. Nature 1999;399:243–246. [PubMed: 10353246](25). Northen TR, Yanes O, Northen MT, Marrinucci D, Urit-boonthai W, Apon J, Golledge SL,
Nordstrom A, Siuzdak G. Nature 2007;449:1033–1036. [PubMed: 17960240](26). Tracy JB, Kalyuzhny G, Crowe MC, Balasubramanian R, Choi JP, Murray RW. J. Am. Chem. Soc
2007;129:6706–6707. [PubMed: 17477534](27). Tracy JB, Crowe MC, Parker JF, Hampe O, Fields-Zinna CA, Dass A, Murray RW. J. Am. Chem.
Soc 2007;129:16209–16215. [PubMed: 18034488](28). Schaaff TG. Anal. Chem 2004;76:6187–6196. [PubMed: 15516109](29). Tsunoyama H, Negishi Y, Tsukuda T. J. Am. Chem. Soc 2006;128:6036–6037. [PubMed:
16669663](30). Templeton AC, Wuelfing WP, Murray RW. Acc. Chem. Res 2000;33:27–36. [PubMed: 10639073](31). Kanaras AG, Kamounah FS, Schaumburg K, Kiely CJ, Brust M. Chem. Commun 2002:2294–2295.(32). You C-C, Miranda OR, Gider B, Ghosh PS, Kim I-B, Erdogan B, Krovi SA, Bunz UHF, Rotello
VM. Nat. Nanotechnol 2007;2:318–323. [PubMed: 18654291](33). Leroueil P, Hong S, Mecke A, Baker J, Orr B, Banaszak Holl M. Acc. Chem. Res 2007;40:335–
342. [PubMed: 17474708](34). Sandhu KK, McIntosh CM, Simard JM, Smith SW, Rotello VM. Bioconjugate Chem 2002;13:3–
6.(35). Xu ZP, Zeng QH, Lu GQ, Yu AB. Chem. Eng. Sci 2006;61:1027–1040.(36). Trevor JL, Lykke KR, Pellin MJ, Hanley L. Langmuir 1998;14:1664–1673.(37). Gong W, Elitzin VI, Janardhanam S, Wilkins CL, Fritsch I. J. Am. Chem. Soc 2001;123:769–770.
[PubMed: 11456605](38). Su J, Mrksich M. Langmuir 2003;19:4867–4870.(39). Mrksich M. ACS Nano 2008;2:7–18.(40). Goodman CM, McCusker CD, Yilmaz T, Rotello VM. Bioconjugate Chem 2004;15:897–900.(41). Jiang W, Kim BYS, Rutka JT, Chan WCW. Nat. Nanotechnol 2008;3:145–150. [PubMed:
18654486](42). Nativo P, Prior IA, Brust M. ACS Nano 2008;2:1639–1644.(43). Yezhelyev MV, Qi L, O’Regan RM, Nie S, Gao X. J. Am. Chem. Soc 2008;130:9006–9012.
[PubMed: 18570415](44). Brust M, Walker M, Bethell D, Schiffrin DJ, Whyman R. J. Chem. Soc., Chem. Commun 1994:801–
802.
Zhu et al. Page 7
J Am Chem Soc. Author manuscript; available in PMC 2009 February 9.
NIH
-PA Author Manuscript
NIH
-PA Author Manuscript
NIH
-PA Author Manuscript
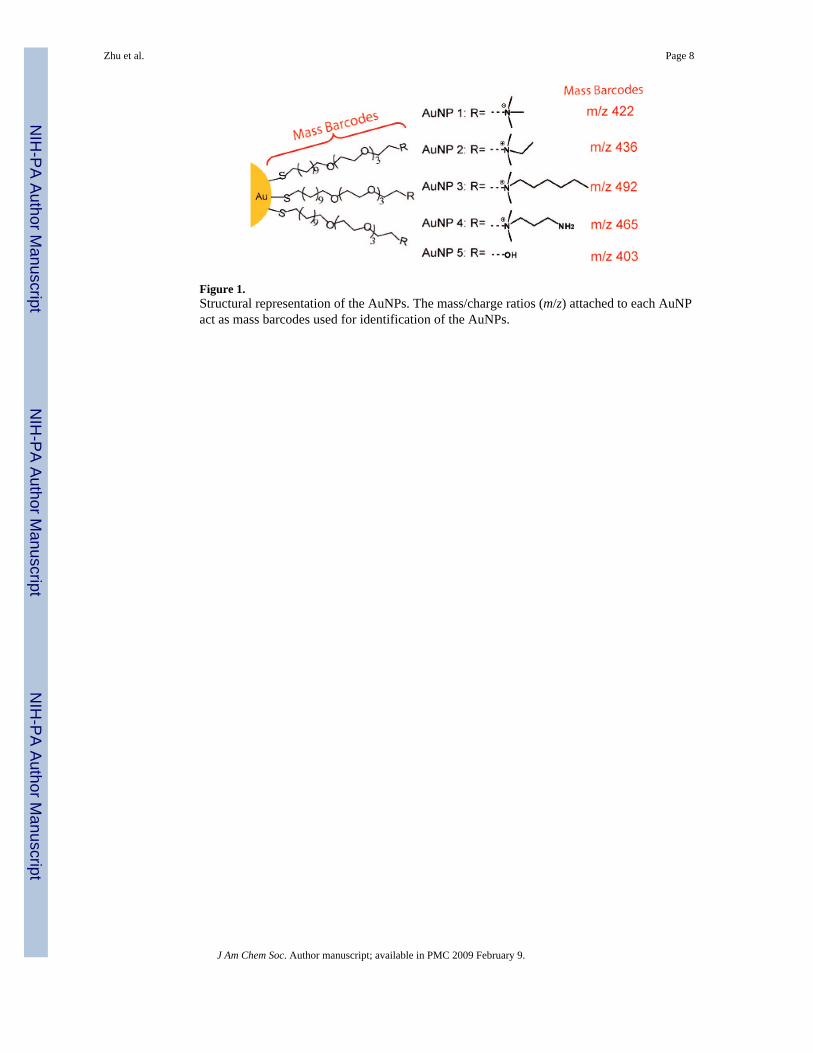
Figure 1.Structural representation of the AuNPs. The mass/charge ratios (m/z) attached to each AuNPact as mass barcodes used for identification of the AuNPs.
Zhu et al. Page 8
J Am Chem Soc. Author manuscript; available in PMC 2009 February 9.
NIH
-PA Author Manuscript
NIH
-PA Author Manuscript
NIH
-PA Author Manuscript

Figure 2.(a) Schematic illustration of the analysis of the AuNPs in cell lysates by LDI-MS. (b) TEMimages of cellular uptake of AuNP 1.
Zhu et al. Page 9
J Am Chem Soc. Author manuscript; available in PMC 2009 February 9.
NIH
-PA Author Manuscript
NIH
-PA Author Manuscript
NIH
-PA Author Manuscript

Figure 3.LDI mass spectrum of COS-1 cell lysate after uptake of (a) AuNP 1 and (b) AuNP 1 and AuNP2. m/z 422 and m/z 436 correspond to the molecular ion (M+) of the ligands attached to AuNP1 and AuNP 2, respectively. Symbol key: *, Au+ (m/z 197); @, Au2
+ (m/z 394); #, the molecularion corresponding to the headgroup fragment of phosphatidylcholine (m/z 184).
Zhu et al. Page 10
J Am Chem Soc. Author manuscript; available in PMC 2009 February 9.
NIH
-PA Author Manuscript
NIH
-PA Author Manuscript
NIH
-PA Author Manuscript

Figure 4.Relative quantities of the AuNPs in COS-1 cell lysates determined by LDI-MS and ICP-MS.In both cases, the AuNP amounts are normalized to that of AuNP 1.
Zhu et al. Page 11
J Am Chem Soc. Author manuscript; available in PMC 2009 February 9.
NIH
-PA Author Manuscript
NIH
-PA Author Manuscript
NIH
-PA Author Manuscript

Figure 5.(a) Multiplexed LDI mass spectrum of COS-1 cell lysate with the four cationic AuNPs 1-4.m/z 422, m/z 436, m/z 492, and m/z 465 correspond to AuNP 1, AuNP 2, AuNP 3, and AuNP4, respectively. The symbol key is the same as in Figure 3. (b) Relative amounts of AuNPs1-4 obtained from LDI-MS. The AuNP amounts are normalized to that of AuNP 1.
Zhu et al. Page 12
J Am Chem Soc. Author manuscript; available in PMC 2009 February 9.
NIH
-PA Author Manuscript
NIH
-PA Author Manuscript
NIH
-PA Author Manuscript

NIH
-PA Author Manuscript
NIH
-PA Author Manuscript
NIH
-PA Author Manuscript
Zhu et al. Page 13
Table 1LDI-MS Relative Quantification of Cellular Uptake of AuNPs 1-5
mass barcodes (m/z) control ratioa experimental ratiob relative ratioc
AuNP 2/AuNP 1 436/422 1.41 ± 0.09 1.70 ± 0.14 1.21 ± 0.13
AuNP 3/AuNP 1 492/422 0.72 ± 0.08 0.40 ± 0.10 0.50 ± 0.20
AuNP 4/AuNP 1 465/422 0.19 ± 0.05 0.21 ± 0.03 1.10 ± 0.30
AuNP 5/AuNP 1 369/388 0.26 ± 0.05 0.09 ± 0.02 0.34 ± 0.09
aA 300 pmol sample of each AuNP was mixed with 300 pmol of AuNP 1 in lysed COS-1 cells and subjected to LDI-MS analysis.
bA 300 pmol sample of each AuNP was mixed with 300 pmol of AuNP 1 and then cultured with living COS-1 cells. These cells were then washed, lysed,
and analyzed by LDI-MS.
cRelative ratios are generated by comparing experimental ratios with control ratios.
J Am Chem Soc. Author manuscript; available in PMC 2009 February 9.