Visualizing metabolite distribution and enzymatic conversion in plant tissues by desorption...
18
TECHNICAL ADVANCE/RESOURCE Visualizing metabolite distribution and enzymatic conversion in plant tissues by desorption electrospray ionization mass spectrometry imaging Bin Li 1 , Camilla Knudsen 2 , Natascha Krahl Hansen 2 , Kirsten Jørgensen 2 , Rubini Kannangara 2 , Søren Bak 2 , Adam Takos 2 , Fred Rook 2 , Steen H. Hansen 1 , Birger Lindberg Møller 2 , Christian Janfelt 1, * and Nanna Bjarnholt 2, * 1 Department of Pharmacy, University of Copenhagen, Universitetsparken 2, DK–2100, Copenhagen, Denmark, and 2 Department of Plant and Environmental Sciences, University of Copenhagen, Plant Biochemistry Laboratory and Villum Research Center ‘Pro-Active Plants’, Center for Synthetic Biology, Thorvaldsensvej 40, DK–1871, Frederiksberg C, Copenhagen, Denmark Received 13 November 2012; revised 08 March 2013; accepted 15 March 2013; published online 28 March 2013. *For correspondence (e-mails [email protected] or [email protected]). SUMMARY In comparison with the technology platforms developed to localize transcripts and proteins, imaging tools for visualization of metabolite distributions in plant tissues are less well developed and lack versatility. This hampers our understanding of plant metabolism and dynamics. In this study, we demonstrate that desorp- tion electrospray ionization mass spectrometry imaging (DESI-MSI) of tissue imprints on porous Teflon may be used to accurately image the distribution of even labile plant metabolites such as hydroxynitrile gluco- sides, which normally undergo enzymatic hydrolysis by specific b-glucosidases upon cell disruption. This fast and simple sample preparation resulted in no substantial differences in the distribution and ratios of all hydroxynitrile glucosides between leaves from wild-type Lotus japonicus and a b-glucosidase mutant plant that lacks the ability to hydrolyze certain hydroxynitrile glucosides. In wild-type, the enzymatic conversion of hydroxynitrile glucosides and the concomitant release of glucose were easily visualized when a restricted area of the leaf tissue was damaged prior to sample preparation. The gene encoding the first enzyme in hydroxynitrile glucoside biosynthesis in L. japonicus leaves, CYP79D3, was found to be highly expressed during the early stages of leaf development, and the hydroxynitrile glucoside distribution in mature leaves reflected this early expression pattern. The utility of direct DESI-MSI of plant tissue was demonstrated using cryo-sections of cassava (Manihot esculenta) tubers. The hydroxynitrile glucoside levels were highest in the outer cell layers, as verified by LC–MS analyses. The unexpected discovery of a hydroxynitrile-derived di-glycoside shows the potential of DESI-MSI to discover and guide investigations into new metabolic routes. Keywords: metabolite imaging, DESI-MS, cyanogenic glucosides, hydroxynitrile glucosides, Lotus japoni- cus, Manihot esculenta, Sorghum bicolor, technical advance. INTRODUCTION Although methods for imaging the tissue- and cell-specific localization of mRNA and proteins are established tools in plant science for the study of gene expression and protein function and dynamics, techniques for imaging the distri- bution of small molecules in plant tissues are mostly in the development phase. The metabolite distribution may differ from the expression pattern of the genes and the localization of the enzymes responsible for their biosynthesis and subse- quent conversions, and changes in metabolite distributions may occur in the absence of changes in gene expression. Therefore, visualizing the distribution and dynamics of small molecules is desirable for understanding the physio- logical role and fate of metabolites in plant growth and development and in defense reactions as a response to environmental challenges. The enormous structural diversity among the small molecules present in plants poses a significant challenge for development of imaging techniques that are applicable to the vast majority of © 2013 The Authors The Plant Journal © 2013 John Wiley & Sons Ltd 1059 The Plant Journal (2013) 74, 1059–1071 doi: 10.1111/tpj.12183
-
Upload
wwwchr-hansen -
Category
Documents
-
view
0 -
download
0
Transcript of Visualizing metabolite distribution and enzymatic conversion in plant tissues by desorption...

TECHNICAL ADVANCE/RESOURCE
Visualizing metabolite distribution and enzymatic conversionin plant tissues by desorption electrospray ionization massspectrometry imaging
Bin Li1, Camilla Knudsen2, Natascha Krahl Hansen2, Kirsten Jørgensen2, Rubini Kannangara2, Søren Bak2, Adam Takos2,
Fred Rook2, Steen H. Hansen1, Birger Lindberg Møller2, Christian Janfelt1,* and Nanna Bjarnholt2,*1Department of Pharmacy, University of Copenhagen, Universitetsparken 2, DK–2100, Copenhagen, Denmark, and2Department of Plant and Environmental Sciences, University of Copenhagen, Plant Biochemistry Laboratory and Villum
Research Center ‘Pro-Active Plants’, Center for Synthetic Biology, Thorvaldsensvej 40, DK–1871, Frederiksberg C,
Copenhagen, Denmark
Received 13 November 2012; revised 08 March 2013; accepted 15 March 2013; published online 28 March 2013.
*For correspondence (e-mails [email protected] or [email protected]).
SUMMARY
In comparison with the technology platforms developed to localize transcripts and proteins, imaging tools
for visualization of metabolite distributions in plant tissues are less well developed and lack versatility. This
hampers our understanding of plant metabolism and dynamics. In this study, we demonstrate that desorp-
tion electrospray ionization mass spectrometry imaging (DESI-MSI) of tissue imprints on porous Teflon may
be used to accurately image the distribution of even labile plant metabolites such as hydroxynitrile gluco-
sides, which normally undergo enzymatic hydrolysis by specific b-glucosidases upon cell disruption. This
fast and simple sample preparation resulted in no substantial differences in the distribution and ratios of all
hydroxynitrile glucosides between leaves from wild-type Lotus japonicus and a b-glucosidase mutant plant
that lacks the ability to hydrolyze certain hydroxynitrile glucosides. In wild-type, the enzymatic conversion
of hydroxynitrile glucosides and the concomitant release of glucose were easily visualized when a restricted
area of the leaf tissue was damaged prior to sample preparation. The gene encoding the first enzyme in
hydroxynitrile glucoside biosynthesis in L. japonicus leaves, CYP79D3, was found to be highly expressed
during the early stages of leaf development, and the hydroxynitrile glucoside distribution in mature leaves
reflected this early expression pattern. The utility of direct DESI-MSI of plant tissue was demonstrated using
cryo-sections of cassava (Manihot esculenta) tubers. The hydroxynitrile glucoside levels were highest in
the outer cell layers, as verified by LC–MS analyses. The unexpected discovery of a hydroxynitrile-derived
di-glycoside shows the potential of DESI-MSI to discover and guide investigations into newmetabolic routes.
Keywords: metabolite imaging, DESI-MS, cyanogenic glucosides, hydroxynitrile glucosides, Lotus japoni-
cus, Manihot esculenta, Sorghum bicolor, technical advance.
INTRODUCTION
Although methods for imaging the tissue- and cell-specific
localization of mRNA and proteins are established tools in
plant science for the study of gene expression and protein
function and dynamics, techniques for imaging the distri-
bution of small molecules in plant tissues are mostly in the
development phase. The metabolite distribution may differ
from the expression pattern of the genes and the localization
of the enzymes responsible for their biosynthesis and subse-
quent conversions, and changes in metabolite distributions
may occur in the absence of changes in gene expression.
Therefore, visualizing the distribution and dynamics of
small molecules is desirable for understanding the physio-
logical role and fate of metabolites in plant growth and
development and in defense reactions as a response
to environmental challenges. The enormous structural
diversity among the small molecules present in plants
poses a significant challenge for development of imaging
techniques that are applicable to the vast majority of
© 2013 The AuthorsThe Plant Journal © 2013 John Wiley & Sons Ltd
1059
The Plant Journal (2013) 74, 1059–1071 doi: 10.1111/tpj.12183
metabolites, rather than relying on specific chemical
characteristics, such as functional groups or antibody
recognition. In this respect, mass spectrometry (MS)-based
methods are very promising, and a number of MS-based
imaging (MSI) techniques have emerged over recent years,
making use of e.g. SIMS (secondary ion MS), LDI-MS (laser
desorption ionization MS), MALDI-MS (matrix-assisted
LDI-MS), GALDI-MS (graphite-assisted LDI-MS), DESI-MS
(desorption electrospray ionization MS) and LAESI-MS
(laser ablation ESI-MS). While there are an increasing num-
ber of reports regarding the development and applications
of various LDI-MSI techniques for plant research (Kaspar
et al., 2011; Lee et al., 2012), the use of DESI-MSI for plant
tissue is less explored, although this method is widely
applied in animal research (Wu et al., 2013). Two factors
make it difficult to obtain stable and reliable DESI-MS sig-
nals from plant material: (i) the layer of epicuticular leaf
waxes, the cuticle and the epidermal cell wall are difficult
to penetrate with the DESI spray (Li et al., 2011; M€uller
et al., 2011), and (ii) DESI works best on hard surfaces.
These issues may be resolved by mounting tissue cross-
sections on glass slides for analysis, the preferred proce-
dure for DESI-MSI of animal tissue, but this approach has
not been pursued with plant samples. For tissues such as
leaves or petals, DESI-MSI has recently been performed
using an indirect approach based on tissue imprints on
porous Teflon (Li et al., 2011; M€uller et al., 2011; Thunig
et al., 2011). In the present paper, direct DESI-MSI of cryo-
sections of plant tissue mounted on glass slides is also
presented. Both methods offer advantages over more
established methods, as the analysis takes place under
ambient conditions and does not require application of
any matrix (as in MALDI- or GALDI-MSI), nor does it rely
on the UV absorbance of the analytes of interest (LDI-MSI).
However, both of these sample preparation procedures
involve disruption of plant cells at ambient temperature,
either during thaw mounting of cryo-sections on the glass
surface, or during the imprinting process. In previous stud-
ies of indirect DESI-MS for plant metabolite imaging, the
reported metabolite distributions were either not heteroge-
neous (Li et al., 2011) or not validated (M€uller et al., 2011),
or the validation was for compounds that are exclusively
present in certain leaf glands, i.e. a +/– result (Thunig et al.,
2011). In this study, we demonstrate that, although plant
tissue is disrupted during cryo-sectioning (for direct DESI-
MSI) or imprinting (for indirect DESI-MSI), the subsequent
vacuum drying is fast enough to quench the hydrolytic
enzymatic activities sufficiently to allow reliable imaging
even of plant chemical defense compounds, which nor-
mally undergo rapid enzyme-catalyzed conversions upon
cell disruption.
Many plants produce constitutive chemical defense
compounds (phytoanticipins) that rely on enzymatic acti-
vation to exert their activity. Phytoanticipins are most
commonly glycosides that become toxic or deterrent to
herbivores and/or pathogens upon hydrolysis by specific
b-glycosidases (BGDs). Examples include cyanogenic glu-
cosides, benzoxazinoid glucosides, avenacosides and gluc-
osinolates (Morant et al., 2008a). For the latter class of
compounds, it has been demonstrated (using MALDI-MSI)
that visualization of phytoanticipin distribution may
increase our understanding of plant–herbivore interactions
(Shroff et al., 2008). Cyanogenic glucosides are widely dis-
tributed phytoanticipins, found in numerous species
across the plant kingdom (Bak et al., 2006), including sev-
eral important crop plants such as barley (Hordeum vulg-
are), sorghum (Sorghum bicolor) and cassava (Manihot
esculenta). They are often synthesized in high amounts
and stored in vacuoles, physically separated from the
BGDs, which are found either in the apoplast or chloroplast
Figure 1. Hydroxynitrile glucosides present in the analyzed plants, and the BGD-mediated activation.
All hydroxynitrile glucosides are hydrolyzed by BGDs when the plant tissue is disrupted. For cyanogenic glucosides, the resulting aglucone releases HCN with
concomitant formation of a carbonyl compound, either spontaneously or accelerated by a-hydroxynitrile lyases (HNLs). For b- and c-hydroxynitrile glucosides,
the metabolic fate of the released aglucones remains unresolved.
© 2013 The AuthorsThe Plant Journal © 2013 John Wiley & Sons Ltd, The Plant Journal, (2013), 74, 1059–1071
1060 Bin Li et al.

or stored in specific cells (Thayer and Conn, 1981; Gruhnert
et al., 1994). When cells are disrupted, e.g. by a chewing
herbivore, the two components are brought into contact,
causing bio-activation of the otherwise non-toxic cyano-
genic glucosides, and release of hydrogen cyanide (HCN)
(Figure 1). HCN is generally toxic to respiring organisms
(Teuscher and Lindequist, 1994), and deters or intoxicates
most generalist herbivores. Cyanogenic glucosides are
a-hydroxynitrile glucosides, and they co-occur with b- andc-hydroxynitrile glucosides in several plant species
(Figure 1). These may accumulate in similar amounts to
the a-hydroxynitrile glucosides, are biosynthetically linked
to cyanogenic glucosides, and are also quickly degraded
upon tissue disruption, but do not release HCN (Bjarnholt
and Møller, 2008; Takos et al., 2010, 2011). The functions
of these non-cyanogenic hydroxynitrile glucosides are
unknown, but they are also assumed to be dependent on
BGD activation to exert their activity. Due to their rapid
degradation upon cell disruption, hydroxynitrile glucosides
are excellent model compounds for investigating the
applicability of disruptive DESI-MSI methods. In the
present studies, three hydroxynitrile glucoside-containing
species were used to demonstrate that DESI-MSI provides
a fast and accurate means of determining metabolite
distributions and enzymatic reactions in various tissues.
RESULTS
The results presented here were obtained after testing a
range of experimental set-ups/conditions. Data S1 provides
details of the results of these tests.
DESI-MS profiling of hydroxynitrile glucosides in plant
tissue
Teflon imprints of L. japonicus (Japanese birdsfoot trefoil)
cv. Miyakojima (MG-20) leaves and of etiolated seedlings
of S. bicolor (L.) Moench (sorghum), and cryo-sections of
M. esculenta Crantz (cassava) tubers were profiled by
DESI-MS to identify the ions most suitable for imaging. In
order to minimize the risk of hydroxynitrile glucoside deg-
radation, sample handling time was minimized. Imprinting
was performed using a manually operated vice that takes a
few seconds to tighten completely. To minimize the effect
of small differences in pressure and tightening time, and
thus increase reproducibility, the total imprinting time was
set to 10 sec. Cryo-sections were cut on a cryo-microtome,
thaw-mounted on glass slides, stored at �80°C, and trans-
ferred directly to a vacuum desiccator on the day of analy-
sis. It has previously been shown that the DESI-MS spectra
obtained from Teflon imprints contain roughly the same
compounds as whole-leaf extracts (Li et al., 2011; M€uller
et al., 2011; Thunig et al., 2011), including metabolites that
are not found in the epidermis (Li et al., 2011; Thunig
et al., 2011). For further investigation of the imprinting
procedure, previously characterized L. japonicus mutants
were used. The cyd2-2 (cyanogenesis deficient 2-2) mutant
is defective in the BGD that is responsible for hydrolysis of
cyanogenic glucosides (LjBGD2; Takos et al., 2010). If sig-
nificant hydrolysis occurred during imprinting, this would
lead to altered ratios between cyanogenic glucosides and
non-cyanogenic hydroxynitrile glucosides in the cyd2-2
mutant compared to the MG-20 wild-type. The biosynthetic
mutant cyd1, which completely lacks hydroxynitrile gluco-
sides (Takos et al., 2011), was used as a negative control
for identification of ions.
In the presence of K+ and Na+ ions, glucosides are readily
detected as [M + K/Na]+ adduct ions in ESI–MS (Kebarle,
2000; Kristensen et al., 2005). Free ions of Na+ and K+ are
abundant in plant material, and adducts of alkali metals are
routinely observed in DESI mass spectra. Here, in direct
DESI-MS (cryo-sections) as well as indirect DESI-MS
(imprints), the hydroxynitrile glucosides were readily and
mainly detected as K+ adduct ions in positive-ion mode
(Figure 2) and as Cl� adduct ions in negative-ion mode.
Positive-ion mode was chosen for imaging because it offers
higher peak intensities compared to negative-ion mode.
The reported levels of K+ in cassava tubers, L. japonicus
leaves and sorghum leaves are respectively 200 mmol kg�1
(Kanto et al., 2012), 750 mmol kg�1 (Chen et al., 2009) and
70 mmol kg�1 (de Lacerda et al., 2003), up to 100 times
higher than reported levels of cyanogenic glucosides in
these plants (Halkier and Møller, 1989; King and Bradbury,
1995; Forslund et al., 2004). Thus, in most cases, the
amount of free K+ ions should be sufficient to ionize the
majority of analyte molecules across entire leaves and
cross-sections. The identities of the compounds were veri-
fied by ion-trap MS/MS and by comparison with authentic
standards of linamarin, lotaustralin and rhodiocyanoside A
(Figure 1). All the proposed K+ adduct ions had a common
fragment ion at m/z 201, corresponding to [Glc-H2O + K]+,
which is a diagnostic ion for glucosides. In addition, cyano-
genic glucosides display a characteristic fragment of [cya-
nogenic glucoside-HCN + K]+ (Franks et al., 2005; Bjarnholt
et al., 2008), which identified the molecular ions m/z 286 as
[linamarin + K]+, m/z 300 as [lotaustralin + K]+ (L. japonicus
and cassava, Figure 2a,b,e,f) and m/z 350 as [dhurrin + K]+
(sorghum, Figure 2d). In addition, L. japonicus contains
minute amounts of the b-hydroxynitrile glucosides rib-
esuvanins (Figure 1), which are isomeric to lotaustralin and
therefore also give rise to molecular ions of m/z 300, but
contribute very little to this peak (Bjarnholt et al., 2008). The
three isomeric rhodiocyanosides (Figure 1) found in this
plant give rise to molecular ions of m/z 298, which produce
the [Glc-H2O + K]+ fragment. In imprints of leaves from the
L. japonicusmutant, cyd1, which does not contain hydroxy-
nitrile glucosides, the corresponding ions m/z 286, 298 and
300 were absent (Figure 2c), and therefore these m/z values
are specific for the hydroxynitrile glucosides in L. japoni-
cus. Cassava contains high amounts of linamarin and
© 2013 The AuthorsThe Plant Journal © 2013 John Wiley & Sons Ltd, The Plant Journal, (2013), 74, 1059–1071
DESI–MS metabolite imaging in plant tissues 1061

smaller amounts of lotaustralin (Nartey, 1968; Lykkesfeldt
and Møller, 1995). In the DESI-MS analysis the ratio
between m/z 286 and m/z 300 across the cryo-section
(Figure 2e,f) was similar to the ratio normally observed
between linamarin and lotaustralin in metabolite extracts of
cassava tissue (e.g. King and Bradbury, 1995), supporting
the specificity in this plant also.
Imprint DESI-MSI reveals a heterogeneous distribution of
hydroxynitrile glucosides in Lotus japonicus leaves
The center leaflets from the first fully unfolded trefoils of
L. japonicus cv. MG-20 and the two mutants cyd1 and
cyd2-2 were imprinted side by side as shown in Figure 3.
Protonated c-aminobutyric acid (Figure 3c) (as identified
by m/z-value 104 and fragment ions at m/z 87 and 86 corre-
sponding to [M + H-NH3]+ and [M + H-H2O]+, respectively)
served as a positive control for the imprinting procedure,
because this compound is uniformly distributed across the
leaflets. The ions corresponding to linamarin (Figure 3d),
rhodiocyanosides (Figure 3e) and lotaustralin + ribesuva-
nins (Figure 3f) are absent from cyd1 and non-uniformly
distributed across the leaflets of MG-20 and cyd2-2. The
side-by-side imprinting approach enables simultaneous
imaging of different leaves under similar conditions, allow-
ing semi-quantitative comparison of wild-type and mutants
(Li et al., 2011). The cyd2-2 mutant is unable to hydrolyze
linamarin and lotaustralin, but still able to hydrolyze rhodi-
ocyanoside A (the major rhodiocyanoside present) upon
leaf damage (Takos et al., 2010). Here, as well as in the
profiling experiment (Figure 2a,b), there is no observable
(a) (b)
(c) (d)
(f)(e)
Figure 2. Mass spectra from DESI-MS profiling of imprints and cryo-sections. Mass spectra for (a) MG-20, (b) cyd2-2, (c) cyd1, (d) sorghum, (e) cassava (sam-
pling on the center of the tuber cryo-section), and (f) cassava (sampling on the outer layer of the tuber cryo-section).
© 2013 The AuthorsThe Plant Journal © 2013 John Wiley & Sons Ltd, The Plant Journal, (2013), 74, 1059–1071
1062 Bin Li et al.
difference between MG-20 and cyd2-2 for the ratio m/z 298
to m/z 300, as would result from BGD-mediated hydrolysis
of lotaustralin in the wild-type plant and the absence of
such hydrolysis in cyd2-2.
In the images, the intensities of all three ions corre-
sponding to hydroxynitrile glucosides are highest at the
base of the MG-20 and cyd2-2 leaflet blades, indicating
a higher accumulation of hydroxynitrile glucosides in
this area compared to the tips. In order to validate this
distribution, leaflets of both plants were dissected as
shown in Figure 3(g), and the sections were extracted
for LC–MS analysis in order to quantify the content of
the major compounds rhodiocyanoside A and lotaustra-
lin. The variation in the mean content of hydroxynitrile
glucosides in leaflet tips and bases was rather large (Fig-
ure 3h), probably due to biological variation in leaflet
morphology and in the total amount of substance per
leaflet. Statistical analyses of the mean differences in
hydroxynitrile glucoside content between base and tip
(Figure 3h, palest bars) showed that the amount of lot-
australin or rhodiocyanoside A per unit area (nmol cm�2)
was significantly higher at the base compared to the tip
for both MG-20 and cyd2-2 (� 99.5 confidence level),
confirming the DESI-MSI results. The levels of the two
hydroxynitrile glucosides per unit area at the bases were
28–53% higher than at the tips. To obtain an approxi-
mate quantification of the differences in hydroxynitrile
glucosides observed in the DESI-MS images, the cumula-
tive intensity of the relevant ions in the central part of the
base and tip leaf areas was calculated (Figure S1). The
recorded intensities of m/z 104 (the reference compound c-aminobutyric acid) were roughly identical in base and tip
areas. In contrast, the cumulative intensities of m/z 298
(rhodiocyanosides) and m/z 300 (lotaustralin + ribesuva-
nins) were 125–180% higher in the central part of the base
where hydroxynitrile glucoside abundance was highest,
compared to the central part of the tip where the abun-
dance was lowest. The differences measured by LC-MS
analysis were expected to be smaller than those observed
by recording the DESI-MS intensities because the LC-MS
(a) (b) (g)
(h)(c) (d)
(e) (f)
Figure 3. Results of DESI-MSI and LC-MS analysis of L. japonicus leaves.
(a–b) Optical images of: (a) The imprinted leaves, and (b) The Teflon imprint.
(c–f) DESI-MS images of the ions indicated in the panels. Because the intensities of the ions in the DESI-MSI analysis were quite different, the color scales in
(c–f) have been adjusted accordingly. For m/z 104, a full-color pixel corresponds to an intensity of 2000 (arbitrary units), while the thresholds for m/z 286, m/z
298 and m/z 300 are 80, 5000 and 4000, respectively.
(g) Diagram of the dissection experiment.
(h) Results of LC-MS analysis for the experiment in (g). Error bars are standard deviations (n = 9). Asterisks indicate base–tip differences that are significantly
greater than zero at *99.5 or **99.9% confidence level, as calculated using a one-tailed Student’s t test.
© 2013 The AuthorsThe Plant Journal © 2013 John Wiley & Sons Ltd, The Plant Journal, (2013), 74, 1059–1071
DESI–MS metabolite imaging in plant tissues 1063

data compare the mean content of the entire two-thirds of
the leaf comprising the tip area (Figure 3g) to the lower
third. Consequently, the two results can be said to be
roughly in the same range. Both representations describe
the distributions across a 3D structure collapsed onto a 2D
surface. However, the bases were slightly thicker than the
tips, with the mean mass per unit area of nine MG-20 or
cyd2-2 leaflets being 14.5–14.9 mg cm�2 for tips and 16.8–
17.3 mg cm�2 for bases. This means that the mean concen-
trations of lotaustralin and rhodiocyanoside A in the two
plants were 14.8–18.3 nmol mg�1 fresh weight in the tips
and 19–22.5 nmol mg�1 fresh weight in the bases, with the
base–tip difference being 1.2–6.1 nmol mg�1. Thus, mea-
sured in concentrations, there were more hydroxynitrile
glucosides at the base than at the tip, but the difference
was understandably less than the difference in total content
(24–46%).
Visualization of in situ enzymatic reactions by imprint
DESI-MSI
The Teflon imprinting technique provides a chemical snap-
shot of otherwise intact plant material, and this may be
utilized to investigate locally induced metabolite changes,
e.g. triggered by wounding, chemicals or pathogen infec-
tions. When intact L japonicus leaves were wounded in a
ring-shaped area by being squeezed between a small steel
pipe and a glass slide, BGD-mediated hydrolysis of
hydroxynitrile glucosides was triggered in the area where
the cell integrity was disrupted (Figure 4a). The wounded
leaflets were either incubated for 20 min before imprinting,
or imprinted immediately, with 1 min being the minimal
total time required for wounding, assembly of the imprint
sandwich and imprinting. The resulting images are shown
in Figure 4(b). After 20 min, the hydroxynitrile glucosides
have been hydrolyzed in a ring-shaped area corresponding
to the shape of the steel pipe, whereas the degradation is
much weaker after 1 min. The control ion m/z 104 is unaf-
fected by wounding at both time points. Calculations of
cumulative ion intensities in subsets of the wounded and
non-wounded areas (Figure S2) showed that, after 1 min,
the signal from rhodiocyanosides and lotaustralin in the
wounded area was reduced by 20% compared to the non-
wounded area. Following 20 min incubation, the signal
was reduced by 60%. The hydrolysis reaction results in
release of glucose, which is detected in DESI-MS analyses
as the potassium adduct at m/z 219, producing the frag-
ment m/z 201 corresponding to [Glc-H2O + K]+. After
1 min, only a weak signal corresponding to accumulation
of free glucose is apparent at the wounding site, but it is
clearly present after 20 min. None of the other hydrolysis
products were detected, most likely because they are vola-
tile compounds that are prone to evaporation during the
wounding period or from the Teflon imprint during
vacuum desiccation.
Lotus japonicus CYP79D3 is differentially expressed during
leaf development
In L. japonicus leaves, the cytochrome P450 enzyme
CYP79D3 catalyzes the first step in the synthesis of all
hydroxynitrile glucosides (Forslund et al., 2004; Takos
et al., 2011). To determine the tissue-specific expression of
the CYP79D3 gene, two reporter gene constructs were
used, in which either a GUS or a NLS-GFP-GUS (NLS,
(a)
(b)
Figure 4. Visualization of BGD-mediated hydrolysis of hydroxynitrile gluco-
sides in wounded leaves.
(a) The leaves were wounded by pressing with a metal pipe.
(b) Indirect DESI-MS images of the wounded leaves: m/z 104, 286, 298 and
300 as described for Figure 3, m/z 219 = [Glc + K]+.
© 2013 The AuthorsThe Plant Journal © 2013 John Wiley & Sons Ltd, The Plant Journal, (2013), 74, 1059–1071
1064 Bin Li et al.

nuclear localization signal) fusion protein was expressed
under control of the CYP79D3 promoter. The constructs
were transformed into L. japonicus cv. MG-20 and cv. Gifu,
respectively. In both cultivars, the intensity of the GUS col-
oration was high in the immature folded apical leaf and
young stems, and decreased substantially with increasing
leaf age (Figure 5). This is consistent with the rapid
decrease in CYP79D3 transcript levels from apical leaves to
basal leaves previously reported for both cultivars (Forsl-
und et al., 2004; Takos et al., 2011). The concentrations of
hydroxynitrile glucosides in L. japonicus are highest in api-
cal leaves and flowers (Forslund et al., 2004), and promi-
nent GUS coloration was also observed in flower buds
(Figure 5a,d). In immature apical leaves, GUS expression
was observed throughout the trefoil (Figure 5a,b). In fully
unfolded leaves, the staining was mainly restricted to the
petiolule and major veins of each leaflet (Figure 5a–d). The
GFP signal in the petiolule cross-sections of cv. Gifu
(Figure 5e) was highest in the epidermis and the underly-
ing cell layers.
Developmental changes in dhurrin distribution in sorghum
seedlings as visualized by imprint DESI-MSI
Etiolated sorghum seedlings were chosen as a model to
demonstrate the wide utility of the imprint DESI-MSI
method. These seedlings contain high amounts of the cya-
nogenic glucoside dhurrin, and the distribution of this
compound has been investigated in detail (Halkier and
Møller, 1989). It was shown that the main biosynthesis and
storage of dhurrin in 3-day-old 8 cm seedlings takes place
in the primordial leaves and the shoot apex. The DESI-MS
images in Figure 6(b) show that initially, in the 3 cm seed-
ling, dhurrin is uniformly distributed. Whether the biosyn-
thetic enzymes are also uniformly distributed at this stage
is not known. As the seedling grows, dhurrin accumulates
in the seedling tip. When the length of the seedling
(a) (d)
(e)
(b)
(c)
Figure 5. Localization of CYP79D3 expression during leaf development in
two L. japonicus cultivars.
(a,b) GUS coloration in cv. MG-20 expressing the pCYP79D3::GUS con-
struct.
(c,d) GUS coloration in cv. Gifu expressing the pCYP79D3::NLS-GFP-GUS
construct.
(e) Same transgenic line as (c,d): nuclear-localized GFP signal in a cross-sec-
tion of the petiolule of the first fully unfolded leaf.
p, petiolule; i, immature apical leaf; pu, partly unfolded apical leaf; m,
midvein; f, flower bud; e, epidermis; c, cortex.
(a)
(b)
Figure 6. DESI-MS images of dhurrin distribution in etiolated sorghum
seedlings at increasing age.
(a) Optical images of seedlings that are 3, 6 and 12 cm long. The 12 cm
seedling was cut in two before imprinting.
(b) Corresponding DESI-MS images of the dhurrin (m/z 350) distribution in
the seedlings. The high-intensity spot in the image of the 12 cm seedling is
most likely an artifact from the wounding site where it was cut in half.
© 2013 The AuthorsThe Plant Journal © 2013 John Wiley & Sons Ltd, The Plant Journal, (2013), 74, 1059–1071
DESI–MS metabolite imaging in plant tissues 1065

reaches 12 cm, the difference is very pronounced, and
dhurrin is not visible in the area just below the accumula-
tion site. This is in accordance with a previously reported
lower concentration in the upper part of the mesocotyl
compared to the lower part (Halkier and Møller, 1989), a
difference that is also just visible in the DESI-MS image of
the 6 cm seedling. It should be noted that the dhurrin con-
centration in the etiolated seedling tip (approximately
90 mmol kg�1; Halkier and Møller, 1989) may exceed the
K+ concentration if this is comparable to that reported by
de Lacerda et al. (2003) for leaves of green seedlings
(70 mmol kg�1), illustrating a potential weakness of the
method for imaging of very highly abundant metabolites.
Direct DESI-MSI of cassava tuber cryo-sections
Analysis of cross-sections may in theory provide more
accurate imaging results, as it should avoid inter-mixing of
contents from individual cells in the course of the imprinting
process. Cassava tubers were chosen as a test system
because of the presence of relatively large and distinct
tissues such as the cortex and vasculature. Furthermore, it
was already known that the cyanogenic glucosides are not
uniformly distributed in the tubers (Cooke, 1978), although
the details of this distribution were not known. The ion
intensity images resulting from DESI-MSI of the cryo-sec-
tions are shown in Figure 7. Linamarin and lotaustralin are
distributed all over the tuber section (Figure 7d,e), but in
much higher concentrations in the outermost layers than
in the starchy core, in accordance with previous findings.
To investigate the distribution in further detail, laser dis-
section microscopy was used to divide small sub-sections
of fresh cassava tuber cross-sections into cork, phelloderm
(outer layers), cortex and the ‘starch layer’ (Figure 7b).
Each individual tissue sample was extracted and analyzed
by LC-MS. The results for linamarin are shown in Fig-
ure 7(c), but the concentrations of lotaustralin in the
extracts were too low to permit accurate quantification.
The results confirm the high accumulation of linamarin in
(a) (c)(b)
(d) (f)(e)
(g) (i)(h)
Figure 7. Direct DESI-MS imaging of a cryo-section of a cassava tuber.
(a) Optical image of the cryo-section mounted on glass.
(b) Vibratome sections of tuber tissues dissected by laser dissection microscopy, The red lines are used to guide the eye; the tuber sections in (a) and (b) are not
the same. Yellow boxes label the sections in the laser dissection microscopy software.
(c) Results of LC-MS analysis of tissues from (b).
(d)–(i) DESI-MS images of the cryo-section from (a): m/z 286 and 300 as previously, m/z 393 = 2-((6-O-(b-D-apiofuranosyl)b-D-glucopyranosyl)oxy)propane, m/z
381 = sucrose, (h) and (i) are unknown ions.
© 2013 The AuthorsThe Plant Journal © 2013 John Wiley & Sons Ltd, The Plant Journal, (2013), 74, 1059–1071
1066 Bin Li et al.
the two outermost layers: cork and phelloderm (laser dis-
section microscopy sections 1 and 2). With direct DESI-
MSI, the resolution obtained was high enough to show
that the very high accumulation of linamarin and lotaustra-
lin was specific to these two layers, but not seen in the cor-
tex.
In the images, multiple other ions were found to accu-
mulate in specific areas and distinct patterns in the tubers,
examples of which are shown in Figure 7(f–i). The ion at
m/z 393 was found at high intensity in cork, phelloderm
and cortex, and its identity was further investigated. Accu-
rate mass and MS/MS analyses were performed on
extracts of the cryo-sections, and from these it was
deduced that the compound giving rise to m/z 393 must
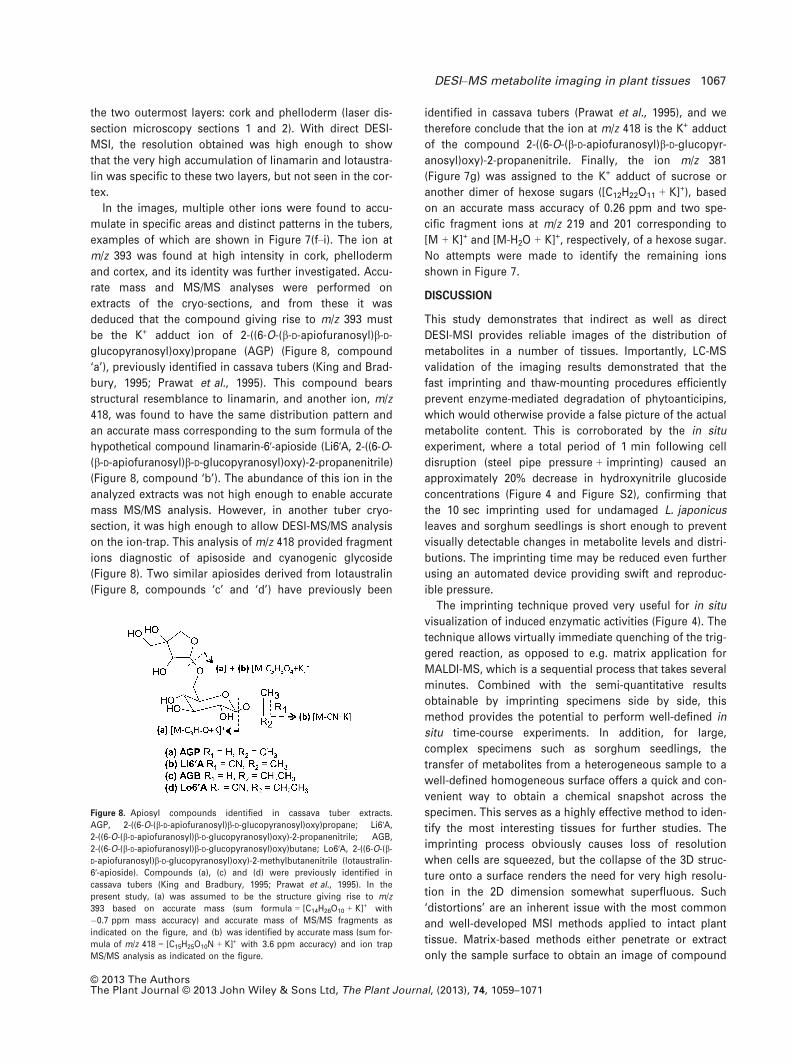
be the K+ adduct ion of 2-((6-O-(b-D-apiofuranosyl)b-D-glucopyranosyl)oxy)propane (AGP) (Figure 8, compound
‘a’), previously identified in cassava tubers (King and Brad-
bury, 1995; Prawat et al., 1995). This compound bears
structural resemblance to linamarin, and another ion, m/z
418, was found to have the same distribution pattern and
an accurate mass corresponding to the sum formula of the
hypothetical compound linamarin-6′-apioside (Li6′A, 2-((6-O-
(b-D-apiofuranosyl)b-D-glucopyranosyl)oxy)-2-propanenitrile)(Figure 8, compound ‘b’). The abundance of this ion in the
analyzed extracts was not high enough to enable accurate
mass MS/MS analysis. However, in another tuber cryo-
section, it was high enough to allow DESI-MS/MS analysis
on the ion-trap. This analysis of m/z 418 provided fragment
ions diagnostic of apisoside and cyanogenic glycoside
(Figure 8). Two similar apiosides derived from lotaustralin
(Figure 8, compounds ‘c’ and ‘d’) have previously been
identified in cassava tubers (Prawat et al., 1995), and we
therefore conclude that the ion at m/z 418 is the K+ adduct
of the compound 2-((6-O-(b-D-apiofuranosyl)b-D-glucopyr-anosyl)oxy)-2-propanenitrile. Finally, the ion m/z 381
(Figure 7g) was assigned to the K+ adduct of sucrose or
another dimer of hexose sugars ([C12H22O11 + K]+), based
on an accurate mass accuracy of 0.26 ppm and two spe-
cific fragment ions at m/z 219 and 201 corresponding to
[M + K]+ and [M-H2O + K]+, respectively, of a hexose sugar.
No attempts were made to identify the remaining ions
shown in Figure 7.
DISCUSSION
This study demonstrates that indirect as well as direct
DESI-MSI provides reliable images of the distribution of
metabolites in a number of tissues. Importantly, LC-MS
validation of the imaging results demonstrated that the
fast imprinting and thaw-mounting procedures efficiently
prevent enzyme-mediated degradation of phytoanticipins,
which would otherwise provide a false picture of the actual
metabolite content. This is corroborated by the in situ
experiment, where a total period of 1 min following cell
disruption (steel pipe pressure + imprinting) caused an
approximately 20% decrease in hydroxynitrile glucoside
concentrations (Figure 4 and Figure S2), confirming that
the 10 sec imprinting used for undamaged L. japonicus
leaves and sorghum seedlings is short enough to prevent
visually detectable changes in metabolite levels and distri-
butions. The imprinting time may be reduced even further
using an automated device providing swift and reproduc-
ible pressure.
The imprinting technique proved very useful for in situ
visualization of induced enzymatic activities (Figure 4). The
technique allows virtually immediate quenching of the trig-
gered reaction, as opposed to e.g. matrix application for
MALDI-MS, which is a sequential process that takes several
minutes. Combined with the semi-quantitative results
obtainable by imprinting specimens side by side, this
method provides the potential to perform well-defined in
situ time-course experiments. In addition, for large,
complex specimens such as sorghum seedlings, the
transfer of metabolites from a heterogeneous sample to a
well-defined homogeneous surface offers a quick and con-
venient way to obtain a chemical snapshot across the
specimen. This serves as a highly effective method to iden-
tify the most interesting tissues for further studies. The
imprinting process obviously causes loss of resolution
when cells are squeezed, but the collapse of the 3D struc-
ture onto a surface renders the need for very high resolu-
tion in the 2D dimension somewhat superfluous. Such
‘distortions’ are an inherent issue with the most common
and well-developed MSI methods applied to intact plant
tissue. Matrix-based methods either penetrate or extract
only the sample surface to obtain an image of compound
Figure 8. Apiosyl compounds identified in cassava tuber extracts.
AGP, 2-((6-O-(b-D-apiofuranosyl)b-D-glucopyranosyl)oxy)propane; Li6′A,2-((6-O-(b-D-apiofuranosyl)b-D-glucopyranosyl)oxy)-2-propanenitrile; AGB,
2-((6-O-(b-D-apiofuranosyl)b-D-glucopyranosyl)oxy)butane; Lo6′A, 2-((6-O-(b-D-apiofuranosyl)b-D-glucopyranosyl)oxy)-2-methylbutanenitrile (lotaustralin-
6′-apioside). Compounds (a), (c) and (d) were previously identified in
cassava tubers (King and Bradbury, 1995; Prawat et al., 1995). In the
present study, (a) was assumed to be the structure giving rise to m/z
393 based on accurate mass (sum formula = [C14H26O10 + K]+ with
�0.7 ppm mass accuracy) and accurate mass of MS/MS fragments as
indicated on the figure, and (b) was identified by accurate mass (sum for-
mula of m/z 418 = [C15H25O10N + K]+ with 3.6 ppm accuracy) and ion trap
MS/MS analysis as indicated on the figure.
© 2013 The AuthorsThe Plant Journal © 2013 John Wiley & Sons Ltd, The Plant Journal, (2013), 74, 1059–1071
DESI–MS metabolite imaging in plant tissues 1067

distributions in the top one or two cell layers or even only
the cuticle (Cha et al., 2008; Li et al., 2008; Jun et al., 2010),
or the entire leaf contents are collapsed into a 2D image
similar to imprint DESI-MSI (Shroff et al., 2008; Svatos,
2010). Using LAESI-MSI, it is possible to generate a 3D
image, but this method suffers from poor lateral resolution
of approximately 300 lm (Nemes et al., 2009). Analysis of
thin cross-sections partly alleviates the issue of 3D
collapse, at least to the point where distinct continuous tis-
sues such as vascular bundles may be clearly differentiated
from surrounding tissues. The DESI-MSI analysis of cryo-
sections of cassava tubers is an example of such an analy-
sis on plant specimens. The variable and distinct patterns
of all the ion images shown (Figure 7d–i) demonstrate that
the direct imaging method worked very well across the
entire tuber section, capturing detailed distributions, such
as the specific accumulation of m/z 353 around vascular
tissues (Figure 7h) and the low abundance of hexose sugar
dimers in the cortex (Figure 7g). M€uller et al. (2011) esti-
mated from light microscopy images that the smearing
caused by imprinting reduced the resolution to about 150–
200 lm. Adding the dislocation of metabolites and slight
size increase of structures that imprinting also causes due
to the collapse of the 3D structure, imprinting of the cas-
sava tuber sections would most likely have made it impos-
sible to distinguish the concentration of metabolites in the
cortex (approximately 1 mm thickness) from that in the
surrounding tissues (Figure 7g). In direct imaging, the res-
olution is mainly limited by the resolution of the DESI
spray, which, in the present set-up, can be reduced to
approximately 50 lm with no other implications than
increased rastering time.
The high accumulation of cyanogenic glucosides in the
outermost layers of the cassava tubers makes sense from
a defense point of view, as the cork and phelloderm serve
as the first physical and chemical barrier against pests. Fur-
thermore, the cork is gradually shed as the tuber grows,
which may result in continuous release of HCN into the soil
around the tuber, i.e. a natural HCN-based biofumigation,
which has been shown effective against nematodes (Wid-
mer, 2000; Widmer and Abawi, 2002). The localization of
the bio-activating enzymes in the tubers is currently under
investigation. The detected presence of AGP and the dis-
covery of Li′6A is very interesting. Both these compounds
were mainly found to accumulate in outer layers, including
the cortex, suggesting these tissues as the site for catabo-
lism of cyanogenic glucosides by an unknown mechanism
and for an unknown purpose. Various di-glycosides of cya-
nogenic glucosides have been suggested to be transport
forms that are protected against normal BGD degradation
by the presence of the additional glucose residue at
various positions (Lieberei et al., 1985; Neilson et al.,
2011). Furthermore, cyanogenic glucosides have been sug-
gested to serve additional functions in addition to those
related to plant defense, e.g. as nitrogen storage com-
pounds (Swain and Poulton, 1994; Busk and Møller, 2002;
Jørgensen et al., 2005; Møller, 2010). The presence of a di-
glycoside form of linamarin, and the apparently higher
accumulation of the corresponding compound without the
nitrogen-containing nitrile functional group, suggest that
these may represent similar transport compounds and
turnover products. Elucidation of this aspect requires fur-
ther investigation, for example involving enzyme assays
with protein fractions isolated from the cortex, identified
by DESI-MSI as the hotspot for these reactions.
DESI-MSI of L. japonicus unfolded leaflets revealed the
presence of hydroxynitrile glucosides all over the leaflet,
but with higher levels at the bases compared to the tips of
the leaflets. In contrast, expression of the CYP79D3 repor-
ter gene constructs showed a much more restricted
expression pattern at this developmental stage. The high-
est expression of CYP79D3 was observed in immature
leaves and young stems, suggesting that the majority of
the hydroxynitrile glucosides are synthesized at this early
stage and most of them are stored. Alternatively, transport
from a site of synthesis in the petiolule may play a role in
mature leaves. These observations demonstrate that gene
expression patterns and the levels of the metabolites pro-
duced by the corresponding enzymes do not necessarily
have the same temporal or spatial localization, further
emphasizing the need for accurate metabolite imaging
techniques. No hydroxynitrile glucoside transport proteins
have yet been identified, but are presumed to be present
in other cyanogenic plants, where cyanogenic glucoside
biosynthesis and accumulation appear to be spatially
separated (Nielsen et al., 2002), or where long distance
transport is known to take place (Jørgensen et al.,
2005). DESI-MSI will be a valuable tool for testing of
putative hydroxynitrile glucoside transporters, allowing a
quick means of screening for altered leaf hydroxynitrile
glucoside distributions in L. japonicus TILLING lines mutated
in candidate genes compared to wild-type plants.
In conclusion, DESI-MSI has been shown to be a useful
technique for metabolite imaging in plants, for obtaining an
overall view of metabolite distributions in whole leaves, for
more detailed assessment of distributions in cryo-sections
and for visualization of induced enzymatic activities.
Furthermore, the study resulted in tentative discovery of
the presence of a previously unknown compound, based
on combined use of DESI-MSI, DESI-MS/MS and high-
resolution MS/MS of selected extracts. Potential future
applications of DESI-MSI include studies of developmental
changes in metabolite distribution, comparison of metabo-
lite distributions in mutant and transgenic plants with
those of wild-type plants, and studies of metabolite
responses to biotic and abiotic stresses. No MSI technique
is perfect. The resolution offered by DESI-MSI (�50 lm) is
lower compared to what may be obtained using
© 2013 The AuthorsThe Plant Journal © 2013 John Wiley & Sons Ltd, The Plant Journal, (2013), 74, 1059–1071
1068 Bin Li et al.
UV-MALDI-MSI (10–100 lm) and SIMS imaging (100 nm–
100 lm) (Lee et al., 2012). However, DESI-MSI offers quick
and easy sample preparation and does not require expen-
sive investments in instrumentation. A sampling stage
may currently be purchased for a fraction of the price of a
MALDI source, or custom-built for less, and may be
mounted onto most ESI mass spectrometers. In addition,
further development of nano-DESI-MS has the potential to
improve not only resolution, but also sensitivity (Watrous
et al., 2012). Thus, it will be possible to detect the forma-
tion of even very small amounts of plant metabolites gen-
erated in situ as a response to e.g. insect feeding or fungal
infection. While MALDI-MSI and/or laser dissection micros-
copy combined with LC-MS analyses are necessary to
explore the distribution of metabolites at the single-cell
level, the resolution of nano-DESI-MS may eventually
improve to the level of a few cells. In this respect, it will
also be an advantage that DESI-MSI is a direct analysis
method that does not involve application of matrix, which
may cause dislocation of metabolites and ion suppression
(Kaspar et al., 2011; Lee et al., 2012).
EXPERIMENTAL PROCEDURES
Chemicals
Methanol and acetonitrile were LC-MS grade, chloroform and for-mic acid were analytical grade and water was prepared using aDirect-Q3 UV system (Millipore, Hellerup, Denmark). Porous Tef-lon (1.5 mm thick, medium pore size 7 lm, pore volume 36%) waspurchased from Berghof (Eningen, Germany). The standard com-pounds linamarin, lotaustralin, rhodiocyanoside A and prunasinwere either purchased, purified or synthesized as described previ-ously (Bjarnholt et al., 2008; Morant et al., 2008b).
Plant material
Seeds of L. japonicus were germinated (24°C with a 16 h lightcycle) on half-strength Murashige & Skoog basal salt mix contain-ing 1% w/v sucrose in 1% w/v agar, and the plantlets obtainedwere transferred to soil after 2 weeks. Plants were subsequentlygrown at 21°C and 70% humidity with a 16 h light cycle (115lmol m�2 s�1). Five-week-old plants were used for DESI-MSI orLC-MS analyses. Sorghum (S. bicolor (L.) Moench) seeds of thecultivar SS1000 were soaked in water for 3 h and germinated inthe dark on wetted filter paper in sealed Petri dishes at room tem-perature. The seedlings were taken directly from Petri dish toimprint after 2 days (3 cm), 3 days (6 cm) or 6 days (12 cm). Cas-sava (M. esculenta Crantz) plants of the Columbian cultivarMCol22 were grown as previously described (Jørgensen et al.,2005). Tubers were taken from plants that were approximately6 months old.
CYP79D3 promoter constructs and Lotus transformation
Two CYP79D3 promoter constructs were produced. In the first,pCYP79D3::NLS-GFP-GUS, a 5 kb SpeI/EcoRI fragment containingthe CYP79D3 promoter was sub-cloned from BAC clone BM0531(Kazusa DNA Research Institute, Kisarazu, Japan) into pBluescriptIISK+. An XbaI/EcoRI sub-clone of approximately 3.2 kb was pro-duced, and the region containing the ATG start codon was
mutated to generate an XmaI site (GATGGGG to CCCGGG). The3163 bp region upstream of the original ATG position wasremoved from pBluescriptII SK+ using SacI/XmaI, and cloned intopGBF-0 (Chytilova et al., 1999), fusing it to a NLS-GFP-GUS repor-ter gene. The second construct, pCYP79D3::GUS, contained2023 bp of upstream region and was fused on the ATG startcodon to the GUS reporter gene. Using the primers CYP79D3NcoI(5′-CGCCATGGCTTGGAAAAAGGACTTCCAATCTA-3′) and CYP79D3SacIB (5′-GCGAGCTCTGCCGTATTATCCTCCGACCCACA-3′), thisfragment was obtained by PCR on genomic DNA of L. japonicusaccession MG-20. The PCR fragment was SacI/NcoI-digested andcloned in front of the GUS reporter gene and a CaMV polyA termina-tion signal in vector pGreenII0029 (Rook et al., 2006). The first con-struct was transformed into L. japonicus accession Gifu, and thesecond was transformed into L. japonicus accession MG-20, usingthe hypocotyl explant-based transformation protocol described byLombari et al. (2005). Staining for GUS activity in the transgenic lineswas performed as described previously (Rook et al., 2006).
Sample preparation for DESI-MSI
Imprinting on porous Teflon was performed as previouslydescribed (Li et al., 2011), except that imprinting time was in allcases kept at 10 sec, after which the imprints were immediatelydried in a vacuum desiccator for a few minutes. For L. japonicus,the central leaflet of apical leaves were imprinted, whereas sor-ghum seedlings were cut off just above the seed and imprintedintact, except for the longest seedling, which had to be cut in twoto fit in the imprinting sandwich. For in situ analysis of enzymeactivity, fully unfolded leaves of L. japonicus cv. MG-20 wereremoved from the plants and placed on a glass slide. One of theleaflets was wounded by application of mild pressure using asmall steel pipe. Wounded leaflets were either immediatelyimprinted or left for 20 min at room temperature before imprint-ing and desiccation. In all cases, the time between imprinting andanalysis was kept as short as possible, and the two stepswere always performed on the same day. For direct imaging ofcross-sections, the fresh cassava tubers were sectioned to 50 lmthickness at �20°C using a Leica CM3050S cryotome (LeicaMicrosystems, Wetzlar, Germany). The slices were thaw-mountedon glass slides, and subsequently stored at �80°C. On the day ofanalysis, the sample slide was transferred directly from the freezerto a vacuum desiccator for 1 min prior to DESI analysis.
DESI-MSI instrumentation and analysis parameters
The imaging was performed using a LTQ XL linear ion trap massspectrometer (Thermo Scientific, Hvidovre, Denmark) equippedwith a custom-built DESI-MSI ion sourceas described in detailelsewhere (Thunig et al., 2011). A 50 lm internal diameter/150 lmexternal diameter fused silica capillary (SGE, Austin, TX, USA)was used for the solvent, surrounded by a 250 lm internal diame-ter/350 lm external diameter fused silica capillary (SGE) carryingthe nebulizer gas in the sprayer assembly. DESI-MSI was per-formed in a line-by-line fashion with a lateral 150–200 lm spatialresolution. The mass spectra were collected and converted toimage files (imzML files) using an imzML converter (www.maldi-msi.org), and images were created from the imzML files using Data-cube Explorer (AMOLF, Amsterdam, The Netherlands). The opti-mized MS instrumental parameters used were 6–10 bars nebulizergas (N2) pressure, 300°C heated capillary temperature, �5 kVspray voltage, �30 V capillary voltage, �70 V tube lens voltage,automatic gain control off. The ion injection time was 100 msec,and three microscans were averaged for each pixel in the images.The DESI geometry parameters were optimized, resulting in a
© 2013 The AuthorsThe Plant Journal © 2013 John Wiley & Sons Ltd, The Plant Journal, (2013), 74, 1059–1071
DESI–MS metabolite imaging in plant tissues 1069

tip-to-surface distance of 1.5–2 mm, a tip-to-inlet distance of 4–5 mm, an incident angle of 50–60° and a collection angle of 10°.The spray solvent was 4:1 methanol:water, and the solvent flowrate was 3 ll min�1. Optical images of the sections were obtainedusing a digital camera.
Identification of metabolites by high-resolution MS
Cryosections of the cassava tuber were divided into an outer layerand inner part, and these were extracted separately in methanol:water (4:1). The extracts were injected directly into the electro-spray ion source of a Thermo Q-Exactive Orbitrap mass spectro-meter (Thermo Scientific), operated in positive mode withcapillary temperature 370°C, ionization voltage 3.3 kV and resolu-tion 70 000. Mass to charge ratios were obtained with an accuracyof � 3 ppm.
Sample preparation for LC-MS analyses
The central leaflets of one fully unfolded apical leaf from ninereplicate plants each of L. japonicus cv. MG-20 (Legume Base, Miya-zaki University, Miyazaki, Japan) and cyd1 and cyd2-2 mutant plantswere dissected into base (approximately one-third of the lengthof the leaf) and tip (approximately two-thirds of the length of theleaf), frozen in liquid nitrogen and kept frozen until extraction. Ahigh-resolution optical image was taken of each dissected leafletprior to freezing using a Canon EOS 450D equipped with an 18–55 mm lens. IMAGEJ software (http://rsbweb.nih.gov/ij/) was used tocalculate leaflet section areas from these images of leaflets placed ona 1 9 1 cm grid for calibration. For laser dissection microscopy, acassava tuber was cut into slices of 0.5 cm with a sharp knifefixed in FAA (63% ethanol, 5% acetic acid, 2% formalin) for 3 h,and washed twice in a washing buffer (63% ethanol, 5% aceticacid) and once in PBS, for 10 min each. After fixation, 50 lm sec-tions were cut on a vibratome (HM 650 V, Microm, Birkerød, Den-mark). Micro-dissection of these sections was performed on aPALM MicroBeam (Zeiss, Birkerød, Denmark) at 5 9 magnifica-tion, and the isolated cells were collected into a 2 ml Eppendorftube using a scalpel under a stereomicroscope.
All plant samples were extracted in 300 ll boiling 85% methanolfor 3 min. The cassava extracts were subsequently lyophilized andre-dissolved in 60 ll 40% methanol. The L. japonicus sampleswere diluted 2:1 with mQ-water. Finally, all samples were filteredthrough 0.45 lm Multiscreen HTS HV filters (Millipore) before LC-MS analysis.
LC-MS analyses
All analyses were performed on a Dionex HPLC equipped with apump (P680), autosampler (UltiMate 3000), a column oven set to35°C (STH585) and a UV detector (UVD340U with micro-flow cell),and connected to a single quadrupole MSQplus MS detector, allfrom Thermo Scientific. Separation was performed on a ZorbaxSB-C18 column (1.8 lm particles, 2.1 i.d. 9 50 mm long; Agilent,Hørsholm, Denmark, equipped with a Fusion-RP guard column(4 lm particles, 2.1 mm i.d. 9 2 mm long; Phenomenex, Værløse,Denmark). The mobile phases were A, 50 lM NaCl, 0.1% HCOOH,and B, 50 lM NaCl, 0.1% HCOOH, 80% MeCN. The gradient programwas as follows: flow rate 0.2 ml min�1; 0–2.5 min, 0% B; 2.5–11.5 min, linear gradient from 0–60% B, followed by wash in100% B and 5 min equilibration at 0.3 ml min�1. The mass spec-trometer was run in positive-mode ESI (ionization temperature365°C, cone voltage 75–125 V, needle voltage 3 kV), and all glyco-sides of interest were detected as [M + Na]+. Samples of L. japo-nicus were analyzed in full scan mode (m/z 100–600), andhydroxynitrile glucoside contents were quantified using a stan-
dard curve of lotaustralin and rhodiocyanoside A ranging from 10to 300 lM, with 150 lM prunasin added as an internal standard toall samples and standards. For analysis of linamarin (m/z 270) incassava, the mass spectrometer was run in SIM mode forincreased sensitivity, and the linamarin contents were quantifiedusing a standard curve ranging from 0.4 to 8 lM.
ACKNOWLEDGEMENTS
Support from the Carlsberg Foundation (grant number 2008-01-0143), The Danish Councils for Independent Research (Technologyand Production Sciences, grant number 274-08-0462, and Natureand Universe, grant number 09-070675) and the Villum Founda-tion are gratefully acknowledged. David Tattersall and Anne Vin-ther Morant are thanked for generation of transgenic L. japonicuscv. Gifu plants (Plant Biochemistry Laboratory, Department ofPlant and Environmental Sciences, University of Copenhagen,Copenhagen, Denmark).
SUPPORTING INFORMATION
Additional Supporting Information may be found in the online ver-sion of this article.Figure S1. Calculation of ion intensities in selected areas ofL. japonicus imprint DESI-MS images.
Figure S2. Calculation of ion intensities in wounded and non-wounded areas of L. japonicus leaves.
Data S1. Notes on sample preparation techniques.
REFERENCES
Bak, S., Paquette, S.M., Morant, M. et al. (2006) Cyanogenic glycosides: a
case study for evolution and application of cytochromes P450. Phyto-
chem. Rev. 5, 309–329.Bjarnholt, N. and Møller, B.L. (2008) Hydroxynitrile glucosides. Phytochem-
istry, 69, 1947–1961.Bjarnholt, N., Rook, F., Motawia, M.S., Jørgensen, C., Olsen, C.E., Jar-
oszewski, J.W., Bak, S. and Møller, B.L. (2008) Diversification of an
ancient theme: hydroxynitrile glucosides. Phytochemistry, 69, 1507–1516.Busk, P.K. and Møller, B.L. (2002) Dhurrin synthesis in sorghum is regulated
at the transcriptional level and induced by nitrogen fertilization in older
plants. Plant Physiol. 129, 1222–1231.Cha, S.W., Zhang, H., Ilarslan, H.I., Wurtele, E.S., Brachova, L., Nikolau, B.J.
and Yeung, E.S. (2008) Direct profiling and imaging of plant metabolites
in intact tissues by using colloidal graphite-assisted laser desorption ion-
ization mass spectrometry. Plant J. 55, 348–360.Chen, Z., Watanabe, T., Shinano, T., Ezawa, T., Wasaki, J., Kimura, K., Osaki,
M. and Zhu, Y.G. (2009) Element interconnections in Lotus japonicus: a
systematic study of the effects of element additions on different natural
variants. Soil Sci. Plant Nutr. 55, 91–101.Chytilova, E., Macas, J. and Galbraith, D.W. (1999) Green fluorescent pro-
tein targeted to the nucleus, a transgenic phenotype useful for studies in
plant biology. Ann. Bot. 83, 645–654.Cooke, R.D. (1978) Enzymatic assay for total cyanide content of cassava
(Manihot esculenta Crantz). J. Sci. Food Agric. 29, 345–352.Forslund, K., Morant, M., Jørgensen, B., Olsen, C.E., Asamizu, E., Sato, S.,
Tabata, S. and Bak, S. (2004) Biosynthesis of the nitrile glucosides rhodi-
ocyanoside A and D and the cyanogenic glucosides lotaustralin and
linamarin in Lotus japonicus. Plant Physiol. 135, 71–84.Franks, T.K., Hayasaka, Y., Choimes, S. and van Heeswijck, R. (2005) Cyano-
genic glucosides in grapevine: polymorphism, identification and devel-
opmental patterns. Phytochemistry, 66, 165–173.Gruhnert, C., Biehl, B. and Selmar, D. (1994) Compartmentation of cyano-
genic glucosides and their degrading enzymes. Planta, 195, 36–42.Halkier, B.A. and Møller, B.L. (1989) Biosynthesis of the cyanogenic gluco-
side dhurrin in seedlings of Sorghum bicolor (L.) Moench and partial
purification of the enzyme system involved. Plant Physiol. 90, 1552–1559.Jørgensen, K., Bak, S., Busk, P.K., Sørensen, C., Olsen, C.E., Puonti-Kaerlas,
J. and Møller, B.L. (2005) Cassava plants with a depleted cyanogenic
glucoside content in leaves and tubers. Distribution of cyanogenic
© 2013 The AuthorsThe Plant Journal © 2013 John Wiley & Sons Ltd, The Plant Journal, (2013), 74, 1059–1071
1070 Bin Li et al.

glucosides, their site of synthesis and transport, and blockage of the
biosynthesis by RNA interference technology. Plant Physiol. 139, 363–374.
Jun, J.H., Song, Z.H., Liu, Z.J., Nikolau, B.J., Yeung, E.S. and Lee, Y.J.
(2010) High-spatial and high-mass resolution imaging of surface metabo-
lites of Arabidopsis thaliana by laser desorption-ionization mass spec-
trometry using colloidal silver. Anal. Chem. 82, 3255–3265.Kanto, U., Jutamanee, K., Osotsapar, Y. and Jattupornpong, S. (2012) Effect
of swine manure extract on leaf nitrogen concentration, chlorophyll con-
tent, total potassium in plant parts and starch content in fresh tuber yield
of cassava. J. Plant Nutr. 35, 688–703.Kaspar, S., Peukert, M., Svatos, A., Matros, A. and Mock, H.P. (2011)
MALDI-imaging mass spectrometry – an emerging technique in plant
biology. Proteomics, 11, 1840–1850.Kebarle, P. (2000) A brief overview of the present status of the mechanisms
involved in electrospray mass spectrometry. J. Mass Spectrom. 35,
804–817.King, N.L.R. and Bradbury, J.H. (1995) Bitterness of cassava – identification
of a new apiosyl glucoside and other compounds that affect its bitter
taste. J. Sci. Food Agric. 68, 223–230.Kristensen, C., Morant, M., Olsen, C.E., Ekstrøm, C.T., Galbraith, D.W., Møl-
ler, B.L. and Bak, S. (2005) Metabolic engineering of dhurrin in trans-
genic Arabidopsis plants with marginal inadvertent effects on the
metabolome and transcriptome. Proc. Natl Acad. Sci. USA, 102, 1779–1784.
de Lacerda, C.F., Cambraia, J., Oliva, M.A., Ruiz, H.A. and Prisco, J.T. (2003)
Solute accumulation and distribution during shoot and leaf development
in two sorghum genotypes under salt stress. Environ. Exp. Bot. 49, 107–120.
Lee, Y.J., Perdian, D.C., Song, Z.H., Yeung, E.S. and Nikolau, B.J. (2012) Use
of mass spectrometry for imaging metabolites in plants. Plant J. 70,
81–95.Li, Y., Shrestha, B. and Vertes, A. (2008) Atmospheric pressure infrared
MALDI imaging mass spectrometry for plant metabolomics. Anal. Chem.
80, 407–420.Li, B., Bjarnholt, N., Hansen, S.H. and Janfelt, C. (2011) Characterization of
barley leaf tissue using direct and indirect desorption electrospray
ionization imaging mass spectrometry. J. Mass Spectrom. 46,
1241–1246.Lieberei, R., Selmar, D. and Biehl, B. (1985) Metabolization of cyanogenic
glucosides in Hevea brasiliensis. Plant Syst. Evol. 150, 49–63.Lombari, P., Ercolano, E., El Alaoui, H. and Chiurazzi, M. (2005) Agrobacte-
rium-mediated in vitro transformation. In Lotus japonicus Handbook
(Marquez, A.J., ed.). Dordrecht, The Netherlands: Springer, pp.
251–259.Lykkesfeldt, J. and Møller, B.L. (1995) On the absence of 2-(2′-cyclopente-
nyl)glycine-derived cyanogenic glycosides in cassava, Manihot esculenta
Crantz. Acta Chem. Scand. 49, 540–542.Møller, B.L. (2010) Functional diversifications of cyanogenic glucosides.
Curr. Opin. Plant Biol. 13, 338–347.Morant, A.V., Jørgensen, K., Jørgensen, C., Paquette, S.M., S�anchez-Perez,
R., Møller, B.L. and Bak, S. (2008a) Β-glucosidases as detonators of plant
chemical defense. Phytochemistry, 69, 1795–1813.Morant, A.V., Kragh, M.E., Kjærgaard, C.H. et al. (2008b) Cyanogenic
b-glucosidases in Lotus japonicus. Plant Physiol. 147, 1–20.M€uller, T., Oradu, S., Ifa, D.R., Cooks, R.G. and Krautler, B. (2011) Direct
plant tissue analysis and imprint imaging by desorption electrospray ion-
ization mass spectrometry. Anal. Chem. 83, 5754–5761.
Nartey, F. (1968) Studies on cassava Manihot utilissima Pohl. I. Cyanogene-
sis: biosynthesis of linamarin and lotaustralin in etiolated seedlings.
Phytochemistry, 7, 1307–1312.Neilson, E.H., Goodger, J.Q.D., Motawia, M.S., Bjarnholt, N., Frisch, T.,
Olsen, C.E., Moller, B.L. and Woodrow, I.E. (2011) Phenylalanine derived
cyanogenic diglucosides from Eucalyptus camphora and their abun-
dances in relation to ontogeny and tissue type. Phytochemistry, 72,
2325–2334.Nemes, P., Barton, A.A. and Vertes, A. (2009) Three-dimensional imaging of
metabolites in tissues under ambient conditions by laser ablation elec-
trospray ionization mass spectrometry. Anal. Chem. 81, 6668–6675.Nielsen, K.A., Olsen, C.E., Pontoppidan, K. and Møller, B.L. (2002) Leucine-
derived cyano glucosides in barley. Plant Physiol. 129, 1066–1075.Prawat, H., Mahidol, C., Ruchirawat, S., Prawat, U., Tuntiwachwuttikul, P.,
Tooptakong, U., Taylor, W.C., Pakawatchai, C., Skelton, B.W. and White,
A.H. (1995) Cyanogenic and non-cyanogenic glycosides from Manihot
esculenta. Phytochemistry, 40, 1167–1173.Rook, F., Corke, F., Baier, M., Holman, R., May, A.G. and Bevan, M.W. (2006)
Impaired sucrose induction1 encodes a conserved plant-specific protein
that couples carbohydrate availability to gene expression and plant
growth. Plant J. 46, 1045–1058.Shroff, R., Vergara, F., Muck, A., Svatos, A. and Gershenzon, J. (2008) Non-
uniform distribution of glucosinolates in Arabidopsis thaliana leaves has
important consequences for plant defense. Proc. Natl Acad. Sci. USA,
105, 6196–6201.Svatos, A. (2010) Mass spectrometric imaging of small molecules. Trends.
Biotechnol. 28, 425–434.Swain, E. and Poulton, J.E. (1994) Utilization of amygdalin during seedling
development of Prunus serotina. Plant Physiol. 106, 437–445.Takos, A., Lai, D., Mikkelsen, L., Abou Hachem, M., Shelton, D., Motawia,
M.S., Olsen, C.E., Wang, T.L., Martin, C. and Rook, F. (2010) Genetic
screening identifies cyanogenesis-deficient mutants of Lotus japonicus
and reveals enzymatic specificity in hydroxynitrile glucoside metabolism.
Plant Cell, 22, 1605–1619.Takos, A.M., Knudsen, C., Lai, D. et al. (2011) Genomic clustering of cyano-
genic glucoside biosynthetic genes aids their identification in Lotus japo-
nicus and suggests the repeated evolution of this chemical defence
pathway. Plant J. 68, 273–286.Teuscher, E. and Lindequist, U. (1994) Cyanogene Verbindungen. In Bio-
gene Gifte (Hegnauer, R., ed.). Stuttgart: Gustav Fischer Verlag, pp. 332–345.
Thayer, S.S. and Conn, E.E. (1981) Subcellular localization of dhurrin
b-glucosidase and hydroxynitrile lyase in the mesophyll cells of sorghum
leaf blades. Plant Physiol. 67, 617–622.Thunig, J., Hansen, S.H. and Janfelt, C. (2011) Analysis of secondary plant
metabolites by indirect desorption electrospray ionization imaging mass
spectrometry. Anal. Chem. 83, 3256–3259.Watrous, J., Roach, P., Alexandrov, T. et al. (2012) Mass spectral molecular
networking of living microbial colonies. Proc. Natl Acad. Sci. USA, 109,
E1743–E1752.Widmer, T.L. (2000) Mechanism of suppression of Meloidogyne hapla and
its damage by a green manure of sudan grass. Plant Dis. 84, 562–568.Widmer, T.L. and Abawi, G.S. (2002) Relationship between levels of cyanide
in sudangrass hybrids incorporated into soil and suppression of Meloi-
dogyne hapla. J. Nematol. 34, 16–22.Wu, C., Dill, A.L., Eberlin, L.S., Cooks, R.G. and Ifa, D.R. (2013) Mass spec-
trometry imaging under ambient conditions. Mass Spectrom. Rev. 32,
218–243.
© 2013 The AuthorsThe Plant Journal © 2013 John Wiley & Sons Ltd, The Plant Journal, (2013), 74, 1059–1071
DESI–MS metabolite imaging in plant tissues 1071

Data S1. Notes on sample preparation techniques
The results presented were obtained following testing of other experimental set-ups/conditions. This
paragraph provides an account of some of these to the benefit of researchers who want to use the
technique.
Regarding in situ visualization of enzymatic activity, the initial idea was to carry out this experiment on
intact leaves. Leaves of the cyd1-mutant which do not contain hydroxynitrile glucosides were to be
imprinted on top of either imprints or fresh leaves of cyd2-2, which contains the compounds, but lacks the
ability to hydrolyze some of them, or on Teflon coated with hydroxynitrile glucosides. However, it was
observed that the necessary increase of imprinting time to e.g. 10 min to allow sufficient time for enzyme
catalyzed hydrolysis of the hydroxynitrile glucosides had drawbacks: (1) The images became blurry at the
edges and the size greatly exceeded those of the corresponding leaf areas. (2). The signal intensity
decreased. (3) The tissue easily got stuck on the Teflon and as a result was difficult to remove. (4)
Imprinting two leaves at the same time or sequentially caused some possible shadow effects. This may
indicate a maximum for the thickness of tissue to be imprinted with shadow effects possibly being caused
by ion suppression due to presence of too many molecules per unit area or by insufficient absorbance
capacity in the pores of the Teflon.
The cassava tuber cryo-sections (50 µm) analyzed were considerably thicker than those usually applied in
MALDI-MSI (10-20 µm). In the latter type of analyses, thick sections cause problems with decreasing signal
intensity (Peukert et al. 2012). It was not possible to obtain thinner slices of the cassava tubers, a problem
previously reported for starch rich tissues (Peukert et al. 2012). Accordingly, we do not know which impact
section thickness may have on direct DESI-MSI. However, in MALDI-MSI the problems associated with
increased section thickness are related to increased matrix effects (Peukert et al. 2012) which are obviously
not an issue in DESI-MS analysis.

We have not examined how stable the imprints are over time. All indirect imaging experiments were
carried out on the same day as imprinting was performed, as quickly as possible after imprinting.
Knowledge about the stability may be of interest for large scale experiments where it is e.g. important that
all samples are of the same physiological age and thus harvested and imprinted at the same time, whereas
the DESI-MS imaging analysis of the imprints will be time consuming and possibly take several days to
perform. To avoid loss of image quality when carrying out indirect DESI-MSI, it is crucial that the tissue sap
is absorbed during imprinting. Accordingly, the amount of tissue paper in the imprinting sandwich may vary
with species and tissue types (in the present study four layers of Kimcare 3020 Medical Wipes Interfold
were applied for L. japonicus leaves and sorghum seedlings).
References
Peukert, M., Matros, A., Lattanzio, G., Kaspar, S., Abadia, J. and Mock, H.P. (2012) Spatially resolved analysis of small molecules by matrix-assisted laser desorption/ionization mass spectrometric imaging (MALDI-MSI). New Phytol., 193, 806-815.

Supporting Information figure legends
Figure S1. Calculation of ion intensities in selected areas of L. japonicus imprint DESI-MS images.
From the images in Figure 3, the total intensities in two areas of identical size (144 pixels) from respectively
the base part of the leaf (blue) and the tip (red) were calculated to provide the spectra shown. The
asymmetric peak shapes in some spectra are due to averaging over several mass spectra, recorded over a
longer time span during which a small drift was observed in the mass calibration. Calculations were done
for m/z 104 = γ-aminobutyric acid, m/z 286 = linamarin, m/z 298 = rhodiocyanosides, m/z 300 = lotaustralin
and ribesuvanins. The blue and red numbers in the spectra are the calculated cumulative intensities (ion
counts) of the respective areas. The software Data Cube Explorer (AMOLF, Amsterdam, The Netherlands)
was used for the calculations.
Figure S2. Calculation of ion intensities in wounded and non-wounded areas of L. japonicus leaves.
From the images in figure 4, the total intensities of m/z 298 (rhodiocyanosides) and m/z 300 (lotaustralin
and ribesuvanins) in 36 pixels from respectively the inner, undamaged part of the ring (blue) and the
damaged part of the ring (red) were calculated to provide the spectra shown. The asymmetric peak shapes
are due to averaging over several mass spectra, recorded over a longer time span during which a small drift
was observed in the mass calibration. The blue and red numbers in the spectra are the calculated
cumulative intensities (ion counts) of the respective areas. The software Data Cube Explorer (AMOLF,
Amsterdam, The Netherlands) was used for the calculations.

m/z [Da]
282 284 286 288 290
Ion
co
un
t[a
.u.]
020
00
00
60
00
00
m/z [Da]
294 296 298 300 302
Ion
co
unt
[a.u
.]0
1000
00
00
30
00
00
00
m/z [Da]
292 294 296 298 300 302
Ion
co
un
t[a
.u.]
01
00
000
00
300
00
00
0
m/z [Da]
102 103 104 105 106
Ion
co
unt
[a.u
.]
0500
00
00
m/z [Da]
100 102 104 106 108
Ion
co
un
t[a
.u.]
02
000
00
060
00
00
0
m/z [Da]
284 285 286 287 288
Ion
co
unt
[a.u
.]0
20
000
040
00
00
m/z 104
m/z 300
m/z 298
m/z 286
cyd2-2
cyd2-2 cyd1 MG-20 cyd2-2
MG-20
3.73x10⁷
1.48x10⁷
2.35x10⁷
8.4x10⁶
5.09x10⁵
2.26x10⁵
7.74x10⁶
8.96x10⁶
3.25x10⁷
1.41x10⁷
4.50x10⁵
2.01x10⁵
6.89x10⁶
6.08x10⁶
1.94x10⁷
7.49x10⁶

m/z [Da]
292 293 294 295 296 297 298 299 300 301 302
Ion
cou
nt
[a.u.]
02
00
000
40
0000
600
00
08
00
000
10
000
00
m/z [Da]292 293 294 295 296 297 298 299 300 301 302
Ion
co
unt
[a.u.]
050
00
0010
00
000
15
00
000
20
00
000
25
000
00 20 min 1 min 2.54x10⁶
2.01x10⁶
1.32x10⁶
1.02x10⁶
1.07x10⁶
4.66x10⁵ 5.79x10⁵
1.87x10⁵