A novel and efficient excitation- and ionization-scheme for laser resonance ionization of mercury

Lipid imaging within the normal rat kidney usingsilver nanoparticles by matrix-assisted laserdesorption/ionization mass spectrometryLudovic Muller1,2,4, Ajay Kailas1,4, Shelley N. Jackson1, Aurelie Roux1, Damon C. Barbacci1,3,J. Albert Schultz3, Carey D. Balaban2 and Amina S. Woods1
1Structural Biology Unit, NIDA IRP, NIH, Baltimore, Maryland, USA; 2Departments of Otolaryngology, Neurobiology, CommunicationSciences & Disorders, and Bioengineering, University of Pittsburgh, Pittsburgh, Pennsylvania, USA and 3Ionwerks, Houston, Texas, USA
The well-characterized cellular and structural components
of the kidney show distinct regional compositions and
distribution of lipids. In order to more fully analyze the renal
lipidome we developed a matrix-assisted laser desorption/
ionization mass spectrometry approach for imaging that
may be used to pinpoint sites of changes from normal in
pathological conditions. This was accomplished by
implanting sagittal cryostat rat kidney sections with a stable,
quantifiable and reproducible uniform layer of silver using a
magnetron sputtering source to form silver nanoparticles.
Thirty-eight lipid species including seven ceramides, eight
diacylglycerols, 22 triacylglycerols, and cholesterol were
detected and imaged in positive ion mode. Thirty-six
lipid species consisting of seven sphingomyelins, 10
phosphatidylethanolamines, one phosphatidylglycerol, seven
phosphatidylinositols, and 11 sulfatides were imaged in
negative ion mode for a total of seventy-four high-resolution
lipidome maps of the normal kidney. Thus, our approach is a
powerful tool not only for studying structural changes in
animal models of disease, but also for diagnosing and
tracking stages of disease in human kidney tissue biopsies.
Kidney International advance online publication, 11 February 2015;
doi:10.1038/ki.2015.3
KEYWORDS: ceramides; kidney lipids; MALDI mass spectrometric imaging
(MALDI-MSI); mass spectrometry; silver nanoparticle matrix; tissue implan-
tation
The development of matrix-assisted laser desorption/ioniza-tion mass spectrometry (MALDI-MS) in the mid 1980sallowed for the surface analysis and detection of intact largebiomolecules (proteins, peptides, lipids, and so on).1,2 One ofthe major applications of MALDI-MS in the biologicalsciences has been the in situ analysis of molecules from tissue.This application was first demonstrated by Caprioli3 but hassince grown into the current technique of mass spectrometryimaging (MSI) that allows for high spatial resolution imagesthat map individual molecules in tissue sections.4–6 Althoughinitial research using MSI focused on proteins and peptides,the use of MSI for the analysis of lipids in tissue has increasedexponentially in recent years.7–12 The key step in a MALDI-MSI experiment is the addition of the matrix to the tissuesection. The ideal method would produce a dry, uniformlayer of matrix in order to preserve the integrity of thedistribution of the molecules in the tissue. Recently, we havedeveloped a method to implant silver nanoparticles (AgNPs)in tissue sections.13 The stable, reproducible, and homo-genous AgNPs matrix layer yielded high-quality images of theregional distribution of several lipid classes. As MSI is anin situ technique and thus does not allow for chromato-graphic separation, the selection of an appropriate matrixfor the analytes of interest is vital for a successful MALDIexperiment. Nanoparticle matrices have been more success-ful analyzing neutral lipids, such as cerebrosides, fromtissue when compared with traditional solid (crystalline)matrices.7,14,15 In particular, AgNPs have been used to imagefatty acids in retinas16 and triacylglycerols (TAGs) in hearttissue.13
Although most work using MALDI for in situ analysis hasfocused on the brain, several studies have applied thistechnique to the kidney.17–21 These studies have included theprofiling and imaging of lipids,17,18 proteins,19,20 and thecancer drug dasatinib.21 The kidneys are important to studyas they have essential roles in the body’s physiology suchas maintaining homeostasis, regulating electrolyte balance,secreting the hormone renin that helps control bloodpressure, serving as a blood filter, and removing waste suchas urea and creatinine. With renal disease on the rise,
http://www.kidney-international.org t e c h n i c a l n o t e s
& 2015 International Society of Nephrology
Correspondence: Amina S. Woods, Structural Biology Unit, NIDA IRP, NIH,
333 Cassell Drive, Room 1120, Baltimore 21224, Maryland, USA.
E-mail: [email protected]
4Co-first authors.
Received 25 April 2014; revised 24 November 2014; accepted 5
December 2014
Kidney International 1

MALDI-MSI is a powerful tool to investigate the renal patho-logy in animal models of kidney diseases.22–24 As applicationsof MALDI-MSI for disease models are rapidly expanding, it isvital to have a highly accurate and reproducible technique togenerate images of the kidneys. Furthemore, it is of greatinterest for the researcher to have the opportunity to analyzedifferent classes of biomolecules through the use of differentMALDI matrices. This study mapped lipids in rat kidney byMALDI-MSI using AgNPs as a matrix with a MALDI-LTQ-Orbitrap (a high-resolution mass spectrometer). Particularfocus on neutral lipid classes such as TAGs, diacylglycerols(DAGs), and ceramides (Cers) are highlighted.
RESULTS AND DISCUSSIONRat kidney structure
Figure 1 shows a light microscope picture of the kidney tissuesection/bregma used in this study. The mammalian kidney isdivided into cortex, medulla, pelvis, and hilum. The cortex isoften described as a cortical labyrinth full of renal corpusclesand adjacent tubules, whereas the medulla is less complexand contains the loop of Henle portion of the nephrons, aswell as various vessels. The hilum is where the ureter andrenal vessels are located. The pelvis, a minor region, containsthe collecting ducts. The renal artery and vein, located inthe hilum, branch off into the arcuate arteries and veins,which lie along the border between the cortex and medulla.The differential distribution of lipid species in the variousanatomical regions of the rat kidney follows.
Analysis of lipid standards with AgNPs
Initial studies were conducted on standards from major lipidclasses in the kidney. The standards were spotted directly on akidney tissue section and then the section was implanted withAgNPs. The lipid standards were then analyzed in either/bothpositive and negative ion mode. The lipid standards testedwere as follows: cholesterold7, Cer d18:1/12:0, SM d18:1/12:0,PC 14:0/14:0, PE 14:0/14:0, DAG 14:0/14:0, TAG 10:0/10:0/10:0, PG 18:1/18:1, PI 18:1/18:1, and ST d18:1/16:0. Themass spectrum obtained for each lipid is provided in the
Supplementary Data online section. Table 1 lists the majormass peaks observed for each lipid class. As has beenobserved previously,13 AgNPs in positive ion mode yield massspectra that are dominated by the Ag adduct for neutral lipids(cholesterol, Cer, DAGs, and TAGs). The silver adducts offertwo distinct advantages. First, Ag has two natural isotopes:107Ag (51.839%) and 109Ag (48.161%). The twin silverisotope peaks are easily distinguished from other lipid masspeaks/background ions in the mass spectrum as long as thereis sufficient mass resolution, B50,000 for an m/z of 800.Second, silver is not naturally abundant in tissue as are Naand K. Thus, you can be ensured that the image of a Agadduct lipid represents the natural (‘true’) distribution,unlike a Na or K adduct, in which greater scrutiny has to beundertaken to be sure you are not imaging the distribution ofNa/K. In positive mode, phosphatidylethanolamines (PE)produced several major mass peaks (M-Hþ 2K, M-Hþ 2Na,M-HþNaK, and M-phosphoethanol head groupþAg),whereas phosphatidylcholine (PC) only produced one domi-nant mass peak (M-phosphocholine head groupþAg). Asnoted in Table 1, caution has to be taken assigning PE and PCspecies based on the fragment peak corresponding to the lossof their polar head group plus Ag. The reason is that thesefragment peaks will have the same structure (DAG-H2OþAg) and thus the same m/z value if they have the same fattyacid backbone. In addition, this same fragment peak canalso be produced by DAGs and TAGs with the same fattyacid backbone. A similar pattern was also observed forsphingomyelin (SM) in which the major peak was(M-phosphocholine head groupþAg), which is the samestructure as Cer-H2OþAg. Because of this, we only usedsilver adducts of intact lipid species to produce images inpositive ion mode for this study.
In negative ion mode, AgNPs produced mass spectra thatwere very similar to those that are attained for lipids usingmore traditional organic matrices such as 2,5-dihydroxybenzoic acid (DHB). PE, phosphatidylglycerol (PG), phos-phatidylinositol (PI), and sulfatide (ST) yielded mass spectrawith one dominant mass peak (M-H), whereas SM alsoproduced only one main mass peak (M-CH2-H). Because ofthe simpler spectra, PE, PG, PI, ST, and SM were imaged innegative ion mode for the experiments below.
Distribution of Cers, cholesterol, TAGs, and DAGs in kidney inpositive ion mode
MALDI-MSI of kidney tissue sections using AgNPs in posi-tive ion mode produces several high-resolution ion imagesfor Ag adducts of cholesterol, Cers, DAGs, and TAGs(Figure 2). A total of 38 lipid species (cholesterol, sevenCers, eight DAGs, and 22 TAGs) were imaged in the m/zrange of 600–1100 Da. A list of all the lipid species imaged isprovided in Supplementary Table S1 online and images notshown in the text are provided in the Supplementary Dataonline section. All the images and m/z calculations are basedon the 107Ag isotope, except for the cholesterolþAg3 inwhich the most abundant isotope was used. However, for all
Renalhilum
Renalpelvis
Renalmedulla
Renalcortex
Figure 1 | Light microscope picture of kidney section/bregmaused for MALDI imaging in this study. MALDI, matrix-assisted laserdesorption/ionization.
t e c h n i c a l n o t e s L Muller et al.: Lipid imaging within the normal rat kidney
2 Kidney International

the species imaged the corresponding 109Ag adduct had thesame distribution as the 107Ag isotope.
Cers showed distinct and varying distribution based onthe fatty acid chain attached to the sphingosine backbone.Cer d18:1/22:0 at m/z 728.511 Da (Figure 2a) is highlylocalized in the medulla region of the kidney, whereas Cerd18:1/24:1 at m/z 754.526 Da (Figure 2b) is found in both thecortex and medulla with distribution across the corticallabyrinth and possible localization in the renal corpuscles andadjacent tubules of the nephron. Cer d18:1/26:0 at m/z784.573 was detected only in the collecting tubules of the
renal pelvis and was the only Cer to show this distribution.The ability to detect intact Cers is a major advantage forAgNPs compared with traditional organic matrices in whichCers are usually detected as a fragment ion correspondingto a neutral loss of water [CerþH-H2O]þ .25–27 Thiseliminates any confusion in assignment of Cers comparedwith the water loss fragment peak that can arise from SMsand other sphingolipids.
DAGs are a class of neutral lipids with two fatty acidsattached to a glycerol backbone. Most of the DAGs imaginedin this study were localized mainly in the medulla. An
Table 1 | Mass peaks observed for lipid standards using AgNPs
Lipid Positive ion modeNegativeion mode
Cholesterol MþAg, M-Hþ 2Ag, MþAg3 —Ceramide MþAg, M-H2OþAg (Cer-H2O) —Sphingomyelin MþAg, MþK, MþNa, M-HGþAg (Cer-H2O) M-CH2-HPhosphatidylcholine MþAg, MþK, MþNa, M-HGþAg (DAG-H2O) —Phosphatidylethanolamine MþAg, MþK, MþNa, M-HþNaAg, M-HþKAg, M-Hþ 2K, M-Hþ 2Na, M-HþNaK,
M-HGþAg (DAG-H2O)M-H
Diacylglycerol MþAg, MþK, MþNa, M-H2OþAg (DAG-H2O) —Triacylglycerol MþAg, M-acyl groupþAg (DAG-H2O) —Phosphatidylglycerol — M-HPhosphatidylinositol — M-HSulfatide — M-H
Abbreviations: AgNPs, silver nanoparticles; Cer, ceramide; DAG, diacylglycerol; HG, polar head group for lipid class (Cer-H2O) and (DAG-H2O) indicates fragment peaks thatwill have the same structure and m/z value if lipid species have the same acyl groups (fatty acid chains).Bold represents major mass peaks.
Cer d18:1/22:0+Ag, 728.511 Cer d18:1/24:1+Ag, 754.526 Cer d18:1/26:0+Ag, 784.573
100%
0%
100%
0%
Cholesterol+Ag3, 709.069DAG 34:1+Ag, 701.427DAG 32:0+Ag, 675.411
TAG 48:0+Ag, 913.641 TAG 50:2+Ag, 937.641 TAG 54:5+Ag, 987.657
Figure 2 | MALDI images of kidney lipids in positive ion mode. (a) Cer d18:1/22:0þAg, 728.511 Da, (b) Cer d18:1/24:1þAg, 754.526 Da, (c)Cer d18:1/26:0þAg, 784.573 Da, (d) DAG 32:0þAg, 675.411 Da, (e) DAG 34:1þAg, 701.427 Da, (f) CholesterolþAg3,709.069 Da, (g) TAG48:0þAg, 913.641 Da, (h) TAG 50:2þAg, 937.641 Da, and (i) TAG 54:5þAg, 987.657 in kidney tissue section with AgNPs in positive ion mode.AgNPs, silver nanoparticles; Cer, ceramide; DAG, diacylglycerol; MALDI, matrix-assisted laser desorption/ionization; TAG, triacylglycerol.
Kidney International 3
L Muller et al.: Lipid imaging within the normal rat kidney t e c h n i c a l n o t e s

example of this is DAG 34:1 (Figure 2e), which isconcentrated in the medulla and also appears to be associatedwith the arcuate vessels at the cortico-medullary border. Thelocalization of DAGs in the medulla is expected as therenal proximal tubular cells (located in the medulla) secreteendothelin-1, which generates DAG.28 DAG 32:0 at m/z675.411 (Figure 2d) showed a more evenly distributionthroughout the cortex. Cholesterol is one of the most abundantlipid species in mammalian cells. Although [cholesterolþAg]þ
was the major mass peak observed for cholesterol, we imagedthe minor peak at 709.069 Da that corresponds to[cholesterolþAg3]þ . This was done to limit the m/z rangethat we imaged in order to make the data file small enough tobe opened and analyzed in our software. The peak at709.069 Da represents the most abundant isotope and wasdistributed throughout the top of the kidney but not inthe hilum. All the isotopes of [cholesterolþAg3]þ showedthe exact same distribution, and these images are in theSupplementary Data online section. In our previous workusing DHB in positive ion mode, cholesterol was detected asa fragment ion [cholesterolþH-H2O]þ .29 However, AgNPsenabled the detection of intact cholesterol.
TAGs are a class of lipids comprised of glycerol and threefatty acids. Three main patterns of distribution for TAGs inthe kidney were observed. Figure 2g illustrates the distribu-tion of TAG 48:0 that is mainly distributed in the cortex. TAG48:0 was the only TAG specie to show this distribution. Thetwo more common patterns of distribution observed werecortex and hilum (Figure 2h, TAG 50:2) and mainly hilum(Figure 2i, TAG 54:5). In order to highlight the differentregions of the kidney, Figure 3 contains a combo plot of DAG38:4, Cer d18:1/24:0, and TAG 52:4. The combo plot showsthe overlap of DAG 38:4 and Cer d18:1/24:0 in the cortex and
medulla, whereas TAG 52:4 is concentrated in the hilum. Thepelvis region of the kidney is highlighted by the presence ofDAG 38:4.
Distribution of SMs, PEs, PGs, PIs, and STs in kidney innegative ion mode
Figure 4 highlights images obtained for a MALDI-MSI run ofa kidney tissue section using AgNPs in negative ion mode.SMs were detected as [M-CH2-H]- mass peaks, whereas allother lipid classes were imaged using the [M-H]- mass peak.A total of 36 lipid species (10 PEs, one PG, seven PIs, sevenSMs, and 11 STs) were imaged in the m/z range of600–1100 Da. A list of all the lipid species imaged is providedin Supplementary Table S2 online and images not shown inthe text are provided in the Supplementary Data onlinesection. SM is a class of lipids consisting of a phosphocholinehead group attached to a Cer backbone. SMs displayeddifferent distribution depending upon the fatty acid attachedto the sphingosine base. SM d18:1/16:1 (Figure 4a) and SMd18:1/24:0 (Figure 4c) were mainly observed throughout therenal cortex. Figure 4b shows the distribution of SM d18:1/18:0, which is concentrated in the medulla region and withindot-like structures across the cortex, which are likely renalcorpuscles of the nephron. Images from three classes ofglycerolphospholipids (PEs, PGs, and PIs) are illustrated inFigure 4d-i. The distribution appears to be more influencedby the fatty acid chains than the polar head groups. Forexample, PE 38a:4 (Figure 4e) and PI 38:4 (Figure 4h), bothhave the same fatty acid backbone, show similar distributionin which they are concentrated in the cortex region. Anotherfinding illustrated in Figure 4i is the localization of PI 32:0 inthe cortex region almost exclusively. This is very similar tothe distribution of DAG 32:0 (Figure 2d) and TAG 48:0
DAG 38:4+Ag751.443
Cer d18:1/24:0+Ag756.542
TAG 52:4+Ag961.641
Figure 3 | MALDI images of kidney tissue implanted with AgNPs in positive ion mode showing the distribution and the combinationplot for three lipids species. (a) DAG 38:4þAg, 751.443 Da, (b) Cer d18:1/24:0þAg, 756.542 Da, (c) TAG 52:4þAg, 961.641, and (d) TripleCombination Plot of 751.443 (green), 756.542 (red), and 961.641 (blue). AgNPs, silver nanoparticles; Cer, ceramide; DAG, diacylglycerol;MALDI, matrix-assisted laser desorption/ionization; TAG, triacylglycerol.
4 Kidney International
t e c h n i c a l n o t e s L Muller et al.: Lipid imaging within the normal rat kidney
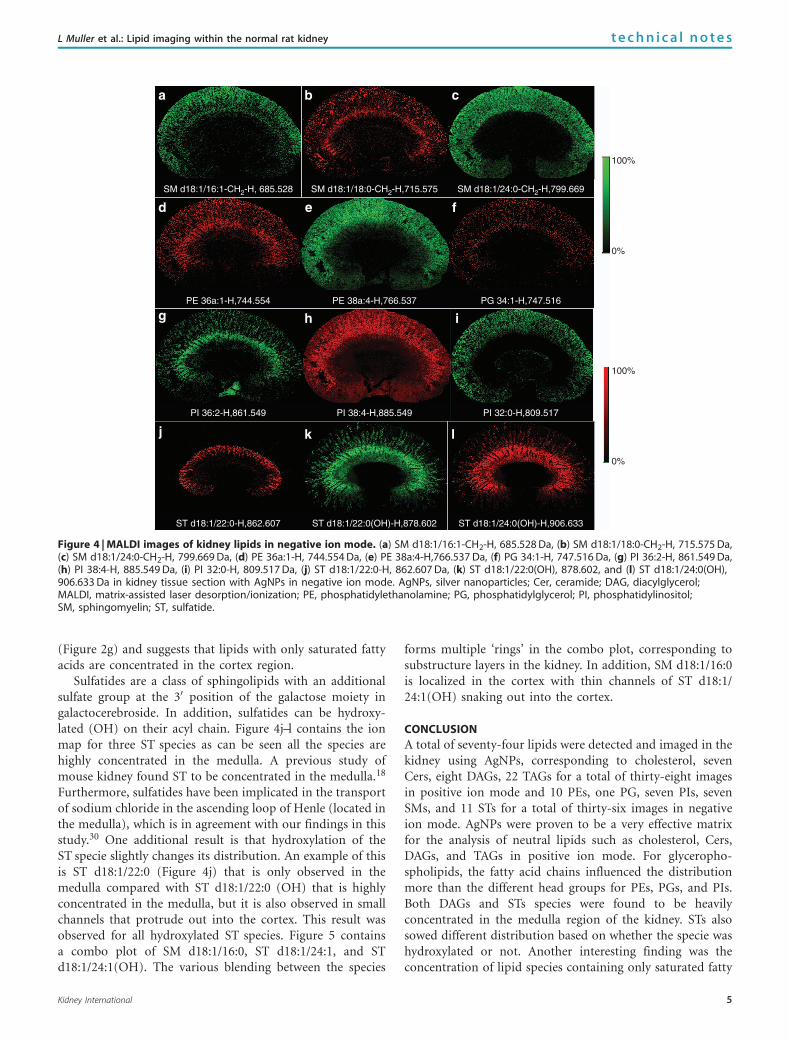
(Figure 2g) and suggests that lipids with only saturated fattyacids are concentrated in the cortex region.
Sulfatides are a class of sphingolipids with an additionalsulfate group at the 30 position of the galactose moiety ingalactocerebroside. In addition, sulfatides can be hydroxy-lated (OH) on their acyl chain. Figure 4j–l contains the ionmap for three ST species as can be seen all the species arehighly concentrated in the medulla. A previous study ofmouse kidney found ST to be concentrated in the medulla.18
Furthermore, sulfatides have been implicated in the transportof sodium chloride in the ascending loop of Henle (located inthe medulla), which is in agreement with our findings in thisstudy.30 One additional result is that hydroxylation of theST specie slightly changes its distribution. An example of thisis ST d18:1/22:0 (Figure 4j) that is only observed in themedulla compared with ST d18:1/22:0 (OH) that is highlyconcentrated in the medulla, but it is also observed in smallchannels that protrude out into the cortex. This result wasobserved for all hydroxylated ST species. Figure 5 containsa combo plot of SM d18:1/16:0, ST d18:1/24:1, and STd18:1/24:1(OH). The various blending between the species
forms multiple ‘rings’ in the combo plot, corresponding tosubstructure layers in the kidney. In addition, SM d18:1/16:0is localized in the cortex with thin channels of ST d18:1/24:1(OH) snaking out into the cortex.
CONCLUSION
A total of seventy-four lipids were detected and imaged in thekidney using AgNPs, corresponding to cholesterol, sevenCers, eight DAGs, 22 TAGs for a total of thirty-eight imagesin positive ion mode and 10 PEs, one PG, seven PIs, sevenSMs, and 11 STs for a total of thirty-six images in negativeion mode. AgNPs were proven to be a very effective matrixfor the analysis of neutral lipids such as cholesterol, Cers,DAGs, and TAGs in positive ion mode. For glyceropho-spholipids, the fatty acid chains influenced the distributionmore than the different head groups for PEs, PGs, and PIs.Both DAGs and STs species were found to be heavilyconcentrated in the medulla region of the kidney. STs alsosowed different distribution based on whether the specie washydroxylated or not. Another interesting finding was theconcentration of lipid species containing only saturated fatty
SM d18:1/16:1-CH2-H, 685.528 SM d18:1/24:0-CH2-H,799.669
100%
0%
100%
0%
PE 36a:1-H,744.554 PE 38a:4-H,766.537 PG 34:1-H,747.516
PI 32:0-H,809.517PI 38:4-H,885.549PI 36:2-H,861.549
ST d18:1/22:0-H,862.607 ST d18:1/22:0(OH)-H,878.602 ST d18:1/24:0(OH)-H,906.633
SM d18:1/18:0-CH2-H,715.575
Figure 4 | MALDI images of kidney lipids in negative ion mode. (a) SM d18:1/16:1-CH2-H, 685.528 Da, (b) SM d18:1/18:0-CH2-H, 715.575 Da,(c) SM d18:1/24:0-CH2-H, 799.669 Da, (d) PE 36a:1-H, 744.554 Da, (e) PE 38a:4-H,766.537 Da, (f) PG 34:1-H, 747.516 Da, (g) PI 36:2-H, 861.549 Da,(h) PI 38:4-H, 885.549 Da, (i) PI 32:0-H, 809.517 Da, (j) ST d18:1/22:0-H, 862.607 Da, (k) ST d18:1/22:0(OH), 878.602, and (l) ST d18:1/24:0(OH),906.633 Da in kidney tissue section with AgNPs in negative ion mode. AgNPs, silver nanoparticles; Cer, ceramide; DAG, diacylglycerol;MALDI, matrix-assisted laser desorption/ionization; PE, phosphatidylethanolamine; PG, phosphatidylglycerol; PI, phosphatidylinositol;SM, sphingomyelin; ST, sulfatide.
Kidney International 5
L Muller et al.: Lipid imaging within the normal rat kidney t e c h n i c a l n o t e s

acids in the cortex. This was observed for several differentlipid classes. Future MALDI-MSI studies should focus ontracking lipid changes as biomarkers for disease in afflictedand control rat models. Possible areas of study include butare not limited to diabetes, kidney stones, renal cancers,nephritis, and nephropathy.
MATERIALS AND METHODSLipid preparationThe following lipid standards, Cer d18:1/12:0, cholesterol d7, STd18:1/12:0, SM d18:1/12:0, DAG 14:0/14:0, PC14:0/14:0, PE 14:0a/14:0, PG14:0a/14:0, (purchased from Avanti Polar Lipids (Alabaster,AL)), and TAG 10:0/10:0/10:0 (purchased from Sigma-Aldrich(St Louis, MO)), were prepared as stock solutions at 1–5 mg/ml inCHL:MeOH (2:1 v/v). A volume of 0.5 ml of each solution wasdeposited directly on a kidney tissue section.
Tissue preparationAll the animal-related work strictly adhered to the Guidelines for theCare and use of Laboratory Animals practiced at all institutes withinthe National Institutes of Health. The animals were male Sprague-Dawley rats (10–12 weeks old). After euthanasia, the rats wereperfused with phosphate-buffered saline and their organs immedi-ately removed and frozen in dry ice chilled isopentane. Tissuesections were cut using a cryostat (Leica Microsystems CM3050S,Bannockburn, IL) at � 21 1C (cryochamber temperature) and� 18 1C (specimen cooling temperature). The kidney was attachedto the cryostat specimen disk using ice slush made with distilledwater,29 and 20 mm thick sections were obtained. The tissue sectionswere then placed on glass microscope slides for MALDI imaging.
NP formation and implantationKidney tissue sections were implanted with AgNPs using an NPlanter(Ionwerks, Houston, TX), which uses a magnetron sputtering source toform gas phase AgNP ions. AgNPs diameter range is 0.5–15 nm. Silvertargets are disks of 99.99% pure silver, 5 cm diameter� 0.31 cm
thick, purchased from Kurt J Lesker Company (Clairton, PA).Nanoparticles sizes were selected using a quadrupole mass filter witha Gaussian diameter. We set the distribution to 6 nm (2.5 nm fullwidth at half maximum). The selected particle beam was thenaccelerated to 500 eV and electronically rastered to ensure uniformdeposition. The result is a thick 2–4 monolayer silver-coated tissuesample. The deposition/tissue section takes 18 min. The NPlanterreduces the inherent variability between operators as it is an auto-mated deposition. Furthermore, it is highly reproducible and resultsin images in which you can compare raw counts from differenttissue sections without the need to normalize by the total ion count(TIC). An example of this for three serial tissue sections is includedin the Supplementary Data online section.
Mass spectrometerA MALDI LTQ-XL-Orbitrap (Thermo Fisher Scientific, San Jose, CA)was used for data acquisition. Thermo’s Imagequest and Xcalibursoftware were used for MALDI-MSI data processing. Images wereacquired in both positive and negative ion mode, within a massrange of 600–1100 Da, with three laser shots per pixel, at a laserfluency of 14mJ in positive ion mode and 16 mJ in negative ionmode. The target plate stepping distance was set to 50 mm with massresolution of 30,000 for negative ion mode and 60,000 for positiveion mode. Custom-built IDL-based software developed by Ionwerkswas employed to extract peak lists from the tissue.
Lipid assignment. Lipids were assigned as follows: PC, PI, PG,DAG, and TAG species number equal the total length and numberof double bonds of acyl chains, whereas Cer, SM, and ST speciesnumber corresponds to the length and number of double bondsof the acyl chain attached to the sphigosine base. PE speciesnumber equals the total length and number of both radyl chains,with a representing 1,2 diacyl species and p representing a1-O-(10-alkenyl)-2-acyl (plasmalogen) species. Lipids were assignedbased on a database search with a mass error less than 5 p.p.m.Tandem MS was also conducted to confirm assignments. Repre-sentative MS/MS data are provided in the Supplementary Dataonline section.
SM d18:1/16:0-CH2-H687.544
ST d18:1/24:1-H888.623
ST d18:1/24:1(OH)-H904.618
Figure 5 | MALDI images of kidney tissue implanted with AgNPs in negative ion mode showing the distribution and the combinationplot for three lipids species. (a) SM d18:1/16:0-CH2-H, 687.544 Da, (b) ST d18:1/24:1-H, 888.623 Da, (c) ST d18:1/24:1(OH), 904.618 Da, and (d)Triple Combination Plot of 687.544 (green), 888.623 (red), and 904.618 (blue). AgNPs, silver nanoparticles; MALDI, matrix-assisted laserdesorption/ionization; SM, sphingomyelin; ST, sulfatide.
6 Kidney International
t e c h n i c a l n o t e s L Muller et al.: Lipid imaging within the normal rat kidney

DISCLOSUREAll the authors declared no competing interests.
ACKNOWLEDGMENTSThis research was supported by the Intramural Research Program ofthe National Institute on Drug Abuse, NIH. The authors acknowledgeMari Prieto and Glen Gregory of the Thermo Fisher for technical andinstrumentation advices. Ionwerks and the University of Pittsburghgratefully acknowledge ARRA support through NIDA phase II SBIRgrant 1RC3DA031431-01.
SUPPLEMENTARY MATERIALTable S1. Lipid assignments in positive ion mode.Table S2. Lipid assignments in negative ion mode.Supplementary material is linked to the online version of the paper athttp://www.nature.com/ki
REFERENCES1. Tanaka K, Waki H, Ido Y et al. Protein and polymer analyses up to m/z 100
000 by laser ionization time-of-flight mass spectrometry. Rapid CommumMass Spectrom 1988; 2: 151–153.
2. Karas M, Hillenkamp F. Laser desorption ionization of proteins withmolecular masses exceeding 10 000 daltons. Anal Chem 1988; 60:2301–2303.
3. Caprioli RM, Farmer TB, Gile J. Molecular imaging of biological samples:localization of peptides and proteins using MALDI-TOF MS. Anal Chem1997; 69: 4751–4760.
4. Cornett DS, Reyzer ML, Chaurand P et al. MALDI imaging massspectrometry: molecular snapshots of biochemical systems. Nat Methods2007; 4: 828–833.
5. Amstalden van Hove ER, Smith DF, Heeren RMA. A concise review of massspectrometry imaging. J Chromatogr A 2010; 1217: 3946–3954.
6. Seeley EH, Schwamborn K, Caprioli RM. Imaging of intact tissue sections:moving beyond the microscope. J Biol Chem 2013; 286: 25459–25466.
7. Jackson SN, Ugarov M, Egan T et al. MALDI-ion mobility-TOFMS imagingof lipids in rat brain tissue. J Mass Spectrom 2007; 42: 1093–1098.
8. Colsch B, Jackson SN, Dutta S et al. Molecular microscopy of braingangliosides: illustrating their distribution in hippocampal cell layers. ACSChem Neurosci 2011; 2: 213–222.
9. Delvolve AM, Colsch B, Woods AS. Highlighting anatomical sub-structuresin rat brain tissue using lipid imaging. Anal Methods 2011; 3: 1729–1736.
10. Fernandez JA, Ochoa B, Fresnedo O et al. Matrix-assisted laser desorptionionization imaging mass spectrometry in lipidomics. Anal Bioanal Chem2011; 401: 29–51.
11. Goto-Inoue N, Hayasaka T, Zaima N et al. Imaging mass spectrometry forlipidomics. Biochim Biophys Acta 2011; 1811: 961–969.
12. Gode D, Volmer DA. Lipid imaging by mass spectrometry-a review.Analyst 2013; 138: 1289–1315.
13. Jackson S, Baldwin K, Muller L et al. Imaging of lipids in rat heart withsilver nanoparticles. Anal Bioanal Chem 2014; 406: 1377–1386.
14. Cha S, Yeung ES. Collodial graphite-assisted laser desorption/ionizationmass spectrometry and MSn of small molecules. Anal Chem 2007; 79:2373–2385.
15. Taira S, Sugiura Y, Moritake S et al. Nanoparticle-assisted laser desorption/ionization based mass imaging with cellular resolution. Anal Chem 2008;80: 4761–4766.
16. Hayasaka T, Goto-Inoue N, Zaima N et al. Imaging mass spectrometrywith silver nanoparticles reveals the distribution of fatty acids in mouseretinal sections. J Am Soc Mass Spectrom 2010; 21: 1446–1454.
17. Woods AS, Wang H-YJ, Jackson SN. A snapshot of tissue glycerolipids.Curr Pharm Des 2007; 13: 3344–3356.
18. Marsching C, Eckhardt M, Grone HJ et al. Imaging of complex sulfatidesSM3 and SB1a in mouse kidney using MALDI-TOF/TOF massspectrometry. Anal Bioanal Chem 2011; 401: 53–64.
19. Trede D, Schiffler S, Becker M et al. Exploring three-dimensional matrix-assisted laser desoprtion/ionization imaging mass spectrometry data:three-dimensional spatial segmentation of mouse kidney. Anal Chem2012; 84: 6079–6087.
20. Angel PM, Caprioli RM. Matrix-assisted laser desorption ionizationimaging mass spectrometry: in situ molecular mapping. Biochemistry2013; 52: 3818–3828.
21. Schulz S, Gerhardt D, Meyer B et al. DMSO-enhanced MALDI MSimaging with normalization against a deuterated standard for relativequantification of dasatinib in serial mouse pharmacology studies. AnalBioanal Chem 2013; 405: 9467–9476.
22. Kaneko Y, Obata Y, Kakeya H et al. Imaging mass spectrometry analysisreveals an altered lipid distribution pattern in the tubular areas of hyper-IgA murine kidneys. Exp Mol Pathol 2011; 91: 614–621.
23. Lalowski M, Magni F, Mainini V et al. Imaging mass spectrometry: a newtool for kidney disease investigations. Nephrol Dial Transplant 2013; 7:1648–1655.
24. Ruh H, Salonikios T, Fuchser J et al. MALDI imaging MS reveals candidatelipid markers of polycystic kidney disease. J Lipid Res 2013; 54: 2785–2794.
25. Hankin JA, Farias SE, Barkley RM et al. MALDI mass spectrometric imagingof lipids in rat brain injury models. J Am Soc Mass Spectrom 2011; 6:1014–1021.
26. Goto-Inoue N, Hayasaka T, Zaima N et al. Imaging mass spectrometryvisualizes ceramides and the pathogenesis of dorfman-chanarinsyndrome due to ceramide metabolic abnormality in the skin. PLos One2012; 7: e49510.
27. Wang H-YJ, Wu HW, Tsai PJ et al. MALDI-mass spectrometry imaging ofdesalted rat brain sections reveals ischemia-mediated changes of lipids.Anal Bioanal Chem 2012; 1: 113–124.
28. Beara-Lasic L, Knotek M, Cejvan K et al. The effect of big endothelin-1 inthe proximal tubule of the rat kidney. Br J Pharmacol 1997; 120: 625–630.
29. Jackson SN, Wang H-YJ, Woods AS. Direct profiling of lipid distribution inbrain tissue using MALDI-TOFMS. Anal Chem 2005; 77: 4523–4527.
30. Zalc B, Helwig JJ, Ghandour MS et al. Sulfatide in the kidney: how is thislipid involved in sodium chloride transport? FEBS Lett 1978; 92: 92–96.
Kidney International 7
L Muller et al.: Lipid imaging within the normal rat kidney t e c h n i c a l n o t e s
Copyright © 2022 FDOKUMEN