Discrimination of Penicillium isolates by matrix-assisted laser desorption/ionization time-of-flight...
6
Discrimination of Penicillium isolates by matrix-assisted laser desorption/ionization time-of-flight mass spectrometry fingerprinting y Justin M. Hettick * , Brett J. Green, Amanda D. Buskirk, Michael L. Kashon, James E. Slaven, Erika Janotka, Francoise M. Blachere, Detlef Schmechel and Donald H. Beezhold Centers for Disease Control and Prevention, National Institute for Occupational Safety and Health, Health Effects Laboratory Division, 1095 Willowdale Road, Morgantown, WV 26505, USA Received 7 March 2008; Revised 21 April 2008; Accepted 17 June 2008 Matrix-assisted laser desorption/ionization time-of-flight mass spectrometry (MALDI-TOF MS) was used to generate highly reproducible mass spectral ‘fingerprints’ for twelve Penicillium species. Prior to MALDI-TOF MS analysis, eight replicate cultures of each Penicillium species were subjected to three one-minute bead-beating cycles in an acetonitrile/trifluoroacetic acid solvent. The mass spectra contained abundant peaks in the range of m/z 5000–20 000, and allowed unambiguous discrimination between species. In addition, a biomarker common to all Penicillium mass spectra was observed at m/z 13 900. Discriminant analysis using the MALDI-TOF MS data yielded classification error rates of 0% (i.e. 100% correct identification), indicating that MALDI-TOF MS data may be a useful diagnostic tool for the objective identification of Penicillium species of environmental and clinical importance. Published in 2008 by John Wiley & Sons, Ltd. The hyphomycete genus Penicillium is a large, ubiquitous group that has a wide geographical distribution and is economically important for various industrial, biodeteriora- tion, and health applications. 1 However, the genus has been difficult to classify using traditional taxonomic methods due to lack of information on the teleomorphic states and the similarities of morphological criteria between anamorphic states, in particular, the terverticillate species within the subgenus Penicillium. 2,3 Recent advances in molecular and biochemical techniques have enabled systematic studies based on the analysis of metabolites as well as ribosomal, mitochondrial, b-tubulin, C01 and calmodulin gene sequences. 2,4–14 These studies have provided detailed insight into the taxonomy of Penicillium and its teleomorphs. 15 The detection of Penicillium species using viable and non- viable monitoring techniques is routine in the fields of indoor air hygiene, agriculture, and food microbiology. Non-viable or direct microscopic techniques are often subjective and unicellular conidia are often grouped in a combined Aspergillus/Penicillium classification. Viable or culture-based techniques can enable species differentiation; however, this is subjectively based on the taxonomic judgment of a trained mycologist. Several studies have shown that morphological similarities often exist between various Penicillium species, whereas variations in morphological and physiological characteristics have also been identified between individual strains. 2,3,16 As a consequence, the difficulties associated with identifying Penicillium species have resulted in numerous misidentifications. 17,18 Microbiological fingerprinting based on matrix-assisted laser desorption/ionization (MALDI) 19,20 time-of-flight mass spectrometry (TOF MS) 21 is a powerful tool for the analysis and discrimination of microorganisms such as bacteria. 22,23 Although MALDI-TOF MS fingerprinting techniques have been developed for a number of bacterial species such as E. coli 24,25 and M. tuberculosis, 26,27 the utility of MALDI-TOF MS to discriminate between various fungi including Penicillium has only recently been explored. 28–32 In a 2005 study, Chen and Chen reported the ability to discriminate between the fungal spores of six Penicillium species on the basis of their MALDI-TOF mass spectra. 31 In this study, we explore the utility of MALDI-TOF MS using bead disruption during sample preparation, combined with biostatistical tools to identify and discriminate between twelve Penicillium species. RAPID COMMUNICATIONS IN MASS SPECTROMETRY Rapid Commun. Mass Spectrom. 2008; 22: 2555–2560 Published online in Wiley InterScience (www.interscience.wiley.com) DOI: 10.1002/rcm.3649 *Correspondence to: J. M. Hettick, NIOSH/HELD/ACIB, 1095 Willowdale Rd., MS L-2040, Morgantown, WV 26505, USA. E-mail: [email protected] y This article is a U.S. Government work and is in the public domain in the U.S.A. Contract/grant sponsor: Inter-Agency Agreement; contract/ grant number: NIEHS Y1-ES0001-06. Published in 2008 by John Wiley & Sons, Ltd.
Transcript of Discrimination of Penicillium isolates by matrix-assisted laser desorption/ionization time-of-flight...

RAPID COMMUNICATIONS IN MASS SPECTROMETRY
Rapid Commun. Mass Spectrom. 2008; 22: 2555–2560
) DOI: 10.1002/rcm.3649
Published online in Wiley InterScience (www.interscience.wiley.comDiscrimination of Penicillium isolates by matrix-assisted
laser desorption/ionization time-of-flight mass
spectrometry fingerprintingy
Justin M. Hettick*, Brett J. Green, Amanda D. Buskirk, Michael L. Kashon,
James E. Slaven, Erika Janotka, Francoise M. Blachere, Detlef Schmechel
and Donald H. BeezholdCenters for Disease Control and Prevention, National Institute for Occupational Safety and Health, Health Effects Laboratory Division, 1095
Willowdale Road, Morgantown, WV 26505, USA
Received 7 March 2008; Revised 21 April 2008; Accepted 17 June 2008
*CorrespoWillowdaE-mail: jhyThis artidomain iContract/grant num
Matrix-assisted laser desorption/ionization time-of-flight mass spectrometry (MALDI-TOF MS) was
used to generate highly reproducible mass spectral ‘fingerprints’ for twelve Penicillium species. Prior
to MALDI-TOF MS analysis, eight replicate cultures of each Penicillium species were subjected to
three one-minute bead-beating cycles in an acetonitrile/trifluoroacetic acid solvent. The mass spectra
contained abundant peaks in the range ofm/z 5000–20 000, and allowed unambiguous discrimination
between species. In addition, a biomarker common to all Penicillium mass spectra was observed at
m/z 13 900. Discriminant analysis using theMALDI-TOFMS data yielded classification error rates of
0% (i.e. 100% correct identification), indicating that MALDI-TOFMS data may be a useful diagnostic
tool for the objective identification of Penicillium species of environmental and clinical importance.
Published in 2008 by John Wiley & Sons, Ltd.
The hyphomycete genus Penicillium is a large, ubiquitous
group that has a wide geographical distribution and is
economically important for various industrial, biodeteriora-
tion, and health applications.1 However, the genus has been
difficult to classify using traditional taxonomic methods due
to lack of information on the teleomorphic states and the
similarities of morphological criteria between anamorphic
states, in particular, the terverticillate species within the
subgenus Penicillium.2,3 Recent advances in molecular and
biochemical techniques have enabled systematic studies
based on the analysis of metabolites as well as ribosomal,
mitochondrial, b-tubulin, C01 and calmodulin gene
sequences.2,4–14 These studies have provided detailed insight
into the taxonomy of Penicillium and its teleomorphs.15
The detection of Penicillium species using viable and non-
viablemonitoring techniques is routine in the fields of indoor
air hygiene, agriculture, and food microbiology. Non-viable
or direct microscopic techniques are often subjective and
unicellular conidia are often grouped in a combined
ndence to: J. M. Hettick, NIOSH/HELD/ACIB, 1095le Rd., MS L-2040, Morgantown, WV 26505, [email protected] is a U.S. Government work and is in the publicn the U.S.A.grant sponsor: Inter-Agency Agreement; contract/ber: NIEHS Y1-ES0001-06.
Aspergillus/Penicillium classification. Viable or culture-based
techniques can enable species differentiation; however, this
is subjectively based on the taxonomic judgment of a trained
mycologist. Several studies have shown that morphological
similarities often exist between various Penicillium species,
whereas variations in morphological and physiological
characteristics have also been identified between individual
strains.2,3,16 As a consequence, the difficulties associatedwith
identifying Penicillium species have resulted in numerous
misidentifications.17,18
Microbiological fingerprinting based on matrix-assisted
laser desorption/ionization (MALDI)19,20 time-of-flight mass
spectrometry (TOF MS)21 is a powerful tool for the analysis
and discrimination of microorganisms such as bacteria.22,23
Although MALDI-TOF MS fingerprinting techniques have
been developed for a number of bacterial species such as
E. coli 24,25 and M. tuberculosis,26,27 the utility of MALDI-TOF
MS to discriminate between various fungi including
Penicillium has only recently been explored.28–32 In a 2005
study, Chen and Chen reported the ability to discriminate
between the fungal spores of six Penicillium species on
the basis of their MALDI-TOF mass spectra.31 In this study,
we explore the utility of MALDI-TOF MS using bead
disruption during sample preparation, combined with
biostatistical tools to identify and discriminate between
twelve Penicillium species.
Published in 2008 by John Wiley & Sons, Ltd.
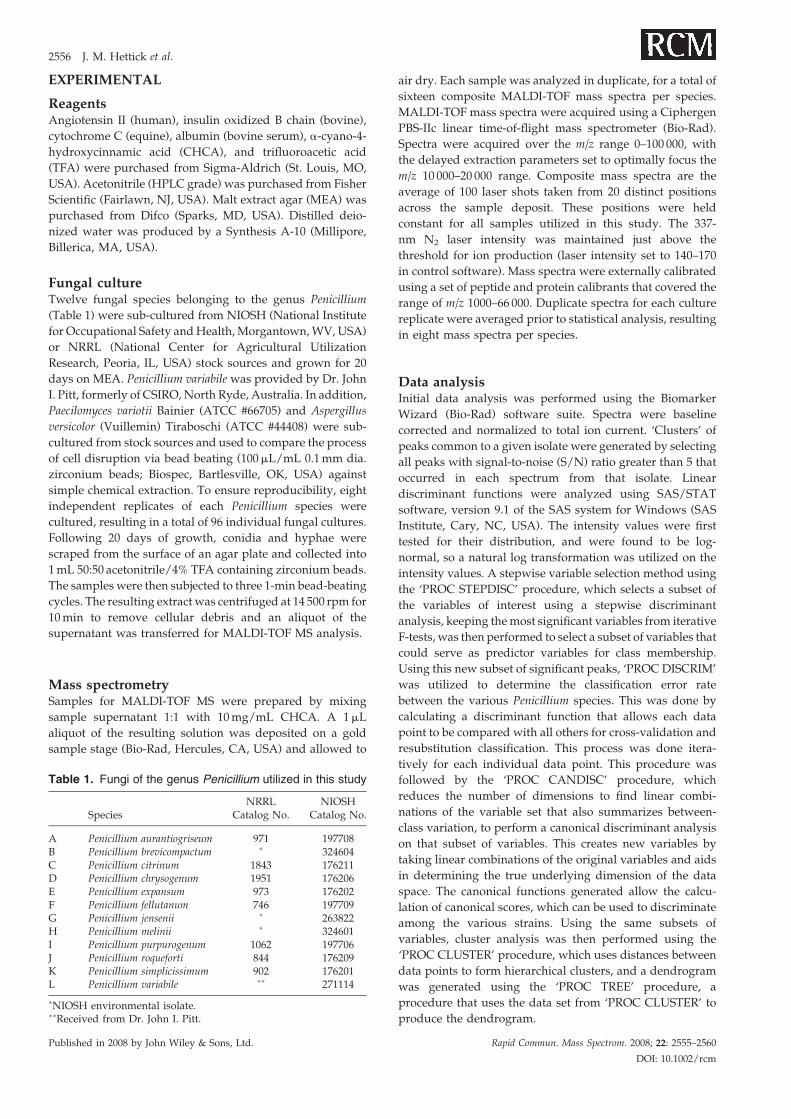
2556 J. M. Hettick et al.
EXPERIMENTAL
ReagentsAngiotensin II (human), insulin oxidized B chain (bovine),
cytochrome C (equine), albumin (bovine serum), a-cyano-4-
hydroxycinnamic acid (CHCA), and trifluoroacetic acid
(TFA) were purchased from Sigma-Aldrich (St. Louis, MO,
USA). Acetonitrile (HPLC grade) was purchased from Fisher
Scientific (Fairlawn, NJ, USA). Malt extract agar (MEA) was
purchased from Difco (Sparks, MD, USA). Distilled deio-
nized water was produced by a Synthesis A-10 (Millipore,
Billerica, MA, USA).
Fungal cultureTwelve fungal species belonging to the genus Penicillium
(Table 1) were sub-cultured from NIOSH (National Institute
for Occupational Safety andHealth, Morgantown,WV, USA)
or NRRL (National Center for Agricultural Utilization
Research, Peoria, IL, USA) stock sources and grown for 20
days on MEA. Penicillium variabile was provided by Dr. John
I. Pitt, formerly of CSIRO, North Ryde, Australia. In addition,
Paecilomyces variotii Bainier (ATCC #66705) and Aspergillus
versicolor (Vuillemin) Tiraboschi (ATCC #44408) were sub-
cultured from stock sources and used to compare the process
of cell disruption via bead beating (100mL/mL 0.1mm dia.
zirconium beads; Biospec, Bartlesville, OK, USA) against
simple chemical extraction. To ensure reproducibility, eight
independent replicates of each Penicillium species were
cultured, resulting in a total of 96 individual fungal cultures.
Following 20 days of growth, conidia and hyphae were
scraped from the surface of an agar plate and collected into
1mL 50:50 acetonitrile/4% TFA containing zirconium beads.
The samples were then subjected to three 1-min bead-beating
cycles. The resulting extract was centrifuged at 14 500 rpm for
10min to remove cellular debris and an aliquot of the
supernatant was transferred for MALDI-TOF MS analysis.
Mass spectrometrySamples for MALDI-TOF MS were prepared by mixing
sample supernatant 1:1 with 10mg/mL CHCA. A 1mL
aliquot of the resulting solution was deposited on a gold
sample stage (Bio-Rad, Hercules, CA, USA) and allowed to
Table 1. Fungi of the genus Penicillium utilized in this study
SpeciesNRRL
Catalog No.NIOSH
Catalog No.
A Penicillium aurantiogriseum 971 197708B Penicillium brevicompactum � 324604C Penicillium citrinum 1843 176211D Penicillium chrysogenum 1951 176206E Penicillium expansum 973 176202F Penicillium fellutanum 746 197709G Penicillium jensenii � 263822H Penicillium melinii � 324601I Penicillium purpurogenum 1062 197706J Penicillium roqueforti 844 176209K Penicillium simplicissimum 902 176201L Penicillium variabile �� 271114
�NIOSH environmental isolate.��Received from Dr. John I. Pitt.
Published in 2008 by John Wiley & Sons, Ltd.
air dry. Each sample was analyzed in duplicate, for a total of
sixteen composite MALDI-TOF mass spectra per species.
MALDI-TOF mass spectra were acquired using a Ciphergen
PBS-IIc linear time-of-flight mass spectrometer (Bio-Rad).
Spectra were acquired over the m/z range 0–100 000, with
the delayed extraction parameters set to optimally focus the
m/z 10 000–20 000 range. Composite mass spectra are the
average of 100 laser shots taken from 20 distinct positions
across the sample deposit. These positions were held
constant for all samples utilized in this study. The 337-
nm N2 laser intensity was maintained just above the
threshold for ion production (laser intensity set to 140–170
in control software). Mass spectra were externally calibrated
using a set of peptide and protein calibrants that covered the
range of m/z 1000–66 000. Duplicate spectra for each culture
replicate were averaged prior to statistical analysis, resulting
in eight mass spectra per species.
Data analysisInitial data analysis was performed using the Biomarker
Wizard (Bio-Rad) software suite. Spectra were baseline
corrected and normalized to total ion current. ‘Clusters’ of
peaks common to a given isolate were generated by selecting
all peaks with signal-to-noise (S/N) ratio greater than 5 that
occurred in each spectrum from that isolate. Linear
discriminant functions were analyzed using SAS/STAT
software, version 9.1 of the SAS system for Windows (SAS
Institute, Cary, NC, USA). The intensity values were first
tested for their distribution, and were found to be log-
normal, so a natural log transformation was utilized on the
intensity values. A stepwise variable selection method using
the ‘PROC STEPDISC’ procedure, which selects a subset of
the variables of interest using a stepwise discriminant
analysis, keeping themost significant variables from iterative
F-tests, was then performed to select a subset of variables that
could serve as predictor variables for class membership.
Using this new subset of significant peaks, ‘PROC DISCRIM’
was utilized to determine the classification error rate
between the various Penicillium species. This was done by
calculating a discriminant function that allows each data
point to be compared with all others for cross-validation and
resubstitution classification. This process was done itera-
tively for each individual data point. This procedure was
followed by the ‘PROC CANDISC’ procedure, which
reduces the number of dimensions to find linear combi-
nations of the variable set that also summarizes between-
class variation, to perform a canonical discriminant analysis
on that subset of variables. This creates new variables by
taking linear combinations of the original variables and aids
in determining the true underlying dimension of the data
space. The canonical functions generated allow the calcu-
lation of canonical scores, which can be used to discriminate
among the various strains. Using the same subsets of
variables, cluster analysis was then performed using the
‘PROC CLUSTER’ procedure, which uses distances between
data points to form hierarchical clusters, and a dendrogram
was generated using the ‘PROC TREE’ procedure, a
procedure that uses the data set from ‘PROC CLUSTER’ to
produce the dendrogram.
Rapid Commun. Mass Spectrom. 2008; 22: 2555–2560
DOI: 10.1002/rcm
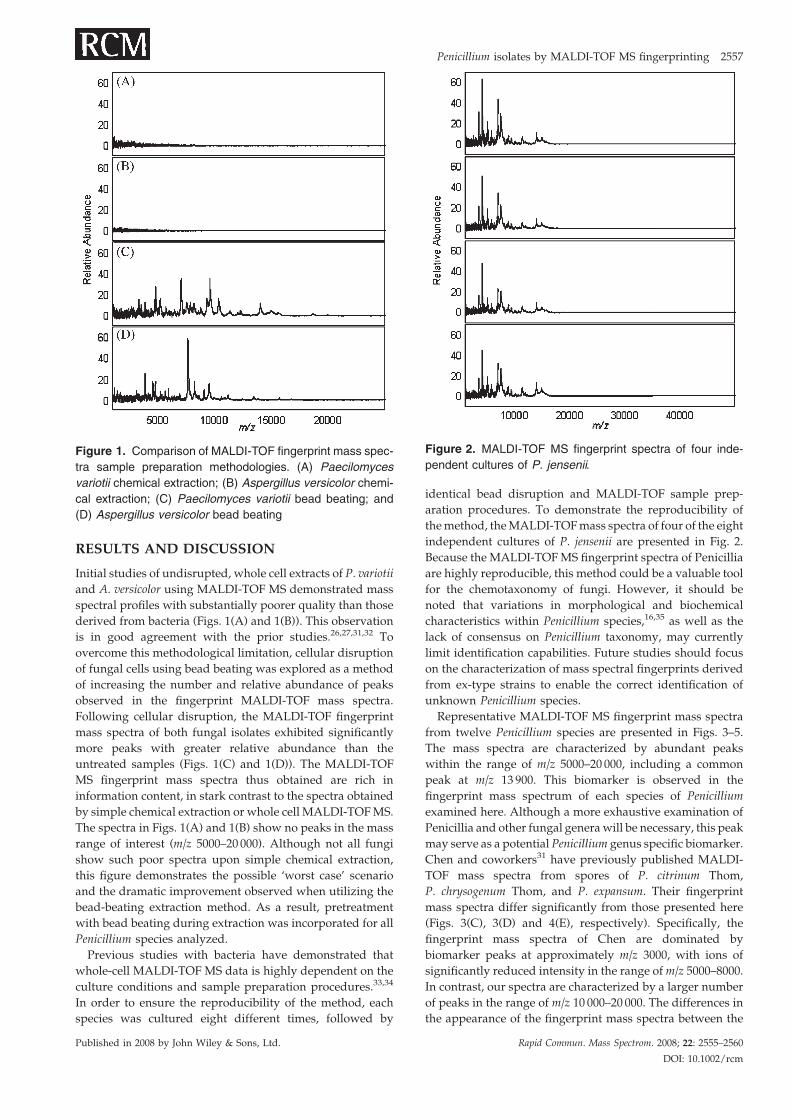
Figure 1. Comparison of MALDI-TOF fingerprint mass spec-
tra sample preparation methodologies. (A) Paecilomyces
variotii chemical extraction; (B) Aspergillus versicolor chemi-
cal extraction; (C) Paecilomyces variotii bead beating; and
(D) Aspergillus versicolor bead beating
Figure 2. MALDI-TOF MS fingerprint spectra of four inde-
pendent cultures of P. jensenii.
Penicillium isolates by MALDI-TOF MS fingerprinting 2557
RESULTS AND DISCUSSION
Initial studies of undisrupted, whole cell extracts of P. variotii
and A. versicolor using MALDI-TOF MS demonstrated mass
spectral profiles with substantially poorer quality than those
derived from bacteria (Figs. 1(A) and 1(B)). This observation
is in good agreement with the prior studies.26,27,31,32 To
overcome this methodological limitation, cellular disruption
of fungal cells using bead beating was explored as a method
of increasing the number and relative abundance of peaks
observed in the fingerprint MALDI-TOF mass spectra.
Following cellular disruption, the MALDI-TOF fingerprint
mass spectra of both fungal isolates exhibited significantly
more peaks with greater relative abundance than the
untreated samples (Figs. 1(C) and 1(D)). The MALDI-TOF
MS fingerprint mass spectra thus obtained are rich in
information content, in stark contrast to the spectra obtained
by simple chemical extraction or whole cell MALDI-TOFMS.
The spectra in Figs. 1(A) and 1(B) show no peaks in the mass
range of interest (m/z 5000–20 000). Although not all fungi
show such poor spectra upon simple chemical extraction,
this figure demonstrates the possible ‘worst case’ scenario
and the dramatic improvement observed when utilizing the
bead-beating extraction method. As a result, pretreatment
with bead beating during extraction was incorporated for all
Penicillium species analyzed.
Previous studies with bacteria have demonstrated that
whole-cell MALDI-TOF MS data is highly dependent on the
culture conditions and sample preparation procedures.33,34
In order to ensure the reproducibility of the method, each
species was cultured eight different times, followed by
Published in 2008 by John Wiley & Sons, Ltd.
identical bead disruption and MALDI-TOF sample prep-
aration procedures. To demonstrate the reproducibility of
themethod, theMALDI-TOFmass spectra of four of the eight
independent cultures of P. jensenii are presented in Fig. 2.
Because the MALDI-TOFMS fingerprint spectra of Penicillia
are highly reproducible, this method could be a valuable tool
for the chemotaxonomy of fungi. However, it should be
noted that variations in morphological and biochemical
characteristics within Penicillium species,16,35 as well as the
lack of consensus on Penicillium taxonomy, may currently
limit identification capabilities. Future studies should focus
on the characterization of mass spectral fingerprints derived
from ex-type strains to enable the correct identification of
unknown Penicillium species.
Representative MALDI-TOF MS fingerprint mass spectra
from twelve Penicillium species are presented in Figs. 3–5.
The mass spectra are characterized by abundant peaks
within the range of m/z 5000–20 000, including a common
peak at m/z 13 900. This biomarker is observed in the
fingerprint mass spectrum of each species of Penicillium
examined here. Although a more exhaustive examination of
Penicillia and other fungal generawill be necessary, this peak
may serve as a potential Penicillium genus specific biomarker.
Chen and coworkers31 have previously published MALDI-
TOF mass spectra from spores of P. citrinum Thom,
P. chrysogenum Thom, and P. expansum. Their fingerprint
mass spectra differ significantly from those presented here
(Figs. 3(C), 3(D) and 4(E), respectively). Specifically, the
fingerprint mass spectra of Chen are dominated by
biomarker peaks at approximately m/z 3000, with ions of
significantly reduced intensity in the range ofm/z 5000–8000.
In contrast, our spectra are characterized by a larger number
of peaks in the range of m/z 10 000–20 000. The differences in
the appearance of the fingerprint mass spectra between the
Rapid Commun. Mass Spectrom. 2008; 22: 2555–2560
DOI: 10.1002/rcm

Figure 5. MALDI-TOF MS fingerprint spectra of
(I) P. purpurogenum, (J) P. roqueforti, (K)
P. simplicissimum, and (L) P. variable.
Figure 3. MALDI-TOF MS fingerprint spectra of
(A) P. aurantiogriseum, (B) P. brevicompactum,
(C) P. citrinum, and (D) P. chrysogenum.
2558 J. M. Hettick et al.
two laboratories are attributable to several factors, including
instrumentation (reflectron TOF vs. linear TOF), culture
conditions (potato dextrose agar vs. MEA), sample prep-
aration (whole cell MALDI vs. bead beating), and MALDI
Figure 4. MALDI-TOF MS fingerprint spectra of
(E) P. expansum, (F) P. fellutanum, (G) P. jensenii, and
(H) P. melinii.
Published in 2008 by John Wiley & Sons, Ltd.
matrix (sinapinic acid vs. CHCA). These differences
underscore the importance of standardized methodology
for microbiological analyses utilizing MALDI-TOF MS,
whether with fungi or bacteria. Moreover, these studies
demonstrate that a standard reference library of biological
mass spectra will be difficult to implement, given the wide
variety of commercially available mass spectrometers in use
in laboratories worldwide.
The database of 96 total fingerprint mass spectra was
further analyzed using canonical discriminant analysis. This
analysis produces canonical variables that are combinations
of variables in the dataset that can be used to discriminate
between species. Figure 6 presents a plot of the first two
canonical variables, accounting for most of the variation in
the dataset. Inclusion of more canonical variables resulted in
multi-dimensional plots that are difficult to illustrate;
however, the two-dimensional plot presented in Fig. 6
demonstrates the power of this statistical tool for fungal
discrimination. All eight spectra for each fungal species are
tightly clustered, indicating a high degree of homogeneity
within the mass spectra from one species and heterogeneity
between spectra from other species. Interestingly, outlier
clusters such as P. purpurogenum Stoll and P. variabile Sopp
(Figs. 6(I) and 6(L)) belong to the Penicillium subgenus
Biverticillium.3 The remaining Penicillium species belong to
the subgenus Penicillium, which in general are clustered
together. These data demonstrate the potential utility of
chemotaxonomic interpretations of MALDI-TOF MS data,
whereas previous studies have demonstrated that metabolite
profiles alone only support broader taxonomic concepts.35
The error rates for species prediction based on theMALDI-
TOF MS dataset were calculated using both resubstitution
Rapid Commun. Mass Spectrom. 2008; 22: 2555–2560
DOI: 10.1002/rcm

Figure 6. Canonical discriminant analysis of MALDI-TOF MS data for 12 species of Penicillium as listed
in Table 1.
Penicillium isolates by MALDI-TOF MS fingerprinting 2559
and cross-validation methods. In resubstitution, the dis-
criminant function is fitted to the dataset and then applied to
each observation. In contrast, cross-validation deletes the
observation, fits the discriminant function to the remaining
dataset, and then applies the function to the deleted
observation. Resubstitution tends to underestimate classifi-
Figure 7. Cluster analysis dendrogram of MALDI-TOF
Table 1.
Published in 2008 by John Wiley & Sons, Ltd.
cation error, whereas cross-validation is unbiased and is
preferred for large datasets.36 For our dataset, resubstitution
and cross-validation correctly classified each fungal finger-
print spectrum with a 0% error rate. Similarly, after
application of the STEPDISC procedure in SAS/STAT to
select a subset of variables with which to perform the
MS data for 12 species of Penicillium as listed in
Rapid Commun. Mass Spectrom. 2008; 22: 2555–2560
DOI: 10.1002/rcm
2560 J. M. Hettick et al.
discrimination, the resubstitution and cross-validation
methods both result in 0% error rate (100% correct
identification).
Cluster analysis was also used to compare the similarity
between the various Penicillium MALDI-TOF MS datasets
(Fig. 7). Cluster analysis seeks to discover structure and/or
similarity in datasets. The data is presented in a dendrogram,
which groups together the two observations that are most
similar. In each case, the eight replicate cultures for each
species clustered together, indicating reproducibility
between mass spectra. Similarly, species belonging to the
subgenus Biverticillium and Furcatum were also clustered
together, which suggests that these species are closely
related. It is important to note that, although the cluster
analysis suggests similarities between spectra, the discrimi-
nant analysis was able to correctly classify each of these
Penicillium species. In light of the well-documented sub-
jectivity and the essential mycological training associated
with the accurate identification of environmental and
clinically derived Penicillia in viable and non-viable
samples,17 the results of the current experiments are exciting
and clearly demonstrate the utility of MALDI-TOF MS to
objectively differentiate and identify various Penicillium
species isolated from various environmental and clinical
samples.
CONCLUSIONS
MALDI-TOF MS of fungal isolates is demonstrated to be a
valuable tool for discriminating between species of the genus
Penicillium. The information content of the MALDI-TOF
fingerprint mass spectra is dramatically improved by using a
bead-beating procedure in conjunction with chemical
extraction in acetonitrile/TFA. The Penicillium species can
be correctly identified with 100% accuracy using canonical
discriminant analysis with stepwise variable selection.
Resubstitution and cross-validation error estimates both
result in a 0% error rate for the dataset of 96 fungal
fingerprint mass spectra. Although the fungal fingerprint
mass spectra produced by the described methodology are
highly reproducible, the spectra of Penicillium species
obtained in our laboratory differ from others published
previously, reiterating the importance of standardized
culture, sample preparation, and mass spectrometry con-
ditions for MS-based identification of microbiological
samples.
AcknowledgementsThis work was supported in part by the Inter-Agency Agree-
ment NIEHS Y1-ES0001-06. The findings and conclusions in
this report are those of the author(s) and do not necessarily
represent the views of theNational Institute for Occupational
Safety and Health.
Published in 2008 by John Wiley & Sons, Ltd.
REFERENCES
1. Paterson RR, Venancio A, Lima N. Res. Microbiol. 2004; 155:507.
2. Skouboe P, Frisvad JC, Taylor JW, Lauritsen D, Boysen M,Roseen L. Mycol. Res. 1999; 7: 873.
3. Pitt JI. The Genus Penicillium and Its Teleomorphic States Eupe-nicillium and Taraomyces. Academic Press: London, 1979.
4. Larsen TO, Frisvad JC. Mycol. Res. 1995; 99: 1167.5. Smedsgaard J, Frisvad JC. J. Microbiol. Methods 1996; 25: 5.6. Smedsgaard J, Frisvad JC. Biochem. Syst. Ecol. 1997; 25: 51.7. Smedsgaard J, Hansen ME, Frisvad JC. Stud. Mycol. 2004; 49:
243.8. Hong SG, Park YD, JeongW, Bae KS. J. Microbiol. 2000; 38: 62.9. Wang L, Zhuang WY. Biosystems 2007; 88: 113.10. Peterson SW. In Integration of Modern Taxonomic Methods
for Penicillium and Aspergillus Classification, Samson RA,Pitt JI (eds). Harwood Academic Publishers: Amsterdam,2000; 163.
11. Verweij PE, Meis JF, van den Hurk P, Zoll J, Samson RA,Melchers WJ. J. Med. Vet. Mycol. 1995; 33: 185.
12. Samson RA, Seifert KA, Kuijpers FA, Houbraken JAMP,Frisvad JC. Stud. Mycol. 2004; 49: 175.
13. Frisvad JC, Filtenborg O, Samson RA, Stolk AC. Antonie VanLeeuwenhoek 1990; 57: 179.
14. Seifert KA, Samson RA, Dewaard JR, Houbraken J, LevesqueCA, Moncalvo JM, Louis-Seize G, Hebert PD. Proc. Natl.Acad. Sci. USA 2007; 104: 3901.
15. Pitt JI. Can. J. Bot. 1995; 73: S768.16. La Guerche S, Garcia C, Darriet P, Dubourdieu D, Labarere J.
Curr. Microbiol. 2004; 48: 405.17. Fischer G, Braun S, Dott W. Int. J. Hyg. Environ. Health 2003;
206: 65.18. Frisvad JC, Nielsen KF, Samson RA. Adv. Exp. Med. Biol.
2005; 571: 33.19. Karas M, Hillenkamp F. Anal. Chem. 1988; 60: 2299.20. Karas M, Bachmann D, Bahr U, Hillenkamp F. Int. J. Mass
Spectrom. 1987; 78: 53.21. Cotter RJ. Anal. Chem. 1999; 71: 445A.22. Fenselau C, Demirev PA. Mass Spectrom. Rev. 2001; 20: 157.23. Lay JO Jr. Mass Spectrom. Rev. 2001; 20: 172.24. Lynn EC, Chung M, Tsai W, Han C. Rapid Commun. Mass
Spectrom. 1999; 13: 2022.25. Siegrist TJ, Anderson PD, HuenWH, Kleinheinz GT,McDer-
mott CM, Sandrin TR. J. Microbiol. Methods 2007; 68: 554.26. Hettick JM, Kashon ML, Simpson JP, Siegel PD, Mazurek
GH, Weissman DN. Anal. Chem. 2004; 76: 5769.27. Hettick JM, Kashon ML, Slaven JE, Ma Y, Simpson JP, Siegel
PD, Mazurek GN, Weissman DN. Proteomics 2006; 6: 6416.28. Amiri-Eliasi B, Fenselau C. Anal. Chem. 2001; 73: 5228.29. Welham KJ, Domin MA, Johnson K, Jones L, Ashton DS.
Rapid Commun. Mass Spectrom. 2000; 14: 307.30. Valentine NB, Wahl JH, Kingsley MT, Wahl KL. Rapid
Commun. Mass Spectrom. 2002; 16: 1352.31. Chen HY, Chen YC. Rapid Commun. Mass Spectrom. 2005; 19:
3564.32. Li T, Liu B, Chen Y. Rapid Commun. Mass Spectrom. 2000; 14:
2393.33. Saenz AJ, Petersen CE, Valentine NB, Gantt SL, Jarman KH,
Kingsley MT, Wahl KL. Rapid Commun. Mass Spectrom. 1999;13: 1580.
34. Arnold RJ, Karty JA, Ellington AD, Reilly JP. Anal. Chem.1999; 71: 1990.
35. Samson RA, Gams W. A. van Leeew. J. Microb. 1984; 50: 815.36. Braga-Neto U, Hashimoto R, Dougherty ER, Nguyen DV,
Carroll RJ. Bioinformatics 2004; 20: 253.
Rapid Commun. Mass Spectrom. 2008; 22: 2555–2560
DOI: 10.1002/rcm