Monitoring And GIS Mapping Of Ground Water Level ...
6
International Journal of Advance Engineering and Research Development Volume 5, Issue 05, May -2018 @IJAERD-2018, All rights Reserved 729 Scientific Journal of Impact Factor (SJIF): 5.71 e-ISSN (O): 2348-4470 p-ISSN (P): 2348-6406 MONITORING AND GIS MAPPING OF GROUND WATER LEVEL, NATEGAON AREA, KOPARGAON. Mungase Avinash M 1 , Naik Suraj S 2 , More Sandip S 3 , Nimbalkar Sagar H 4 , , Patil Anant M 5 , Dr. C.L. Jejurkar 6 . Civil Engineering, Pune University, Sanjivani College, Kopargaon. Abstract:- The global awareness regarding the over exploitation of the limited resources, at the expense of causing severe damages to the ecological system and environmental degradation resulted in evolving methodology for optimum land and water utilization. These necessitate an integrated approach for the optimal development of available resources minimizing hazards to environment. Nategaon is a developing village in Tal-kopargaon, Dist.-Ahmednagar,Maharastra, in India. Groundwater is a major source of water supply for the area which is reflected by regular extraction of groundwater through ever increasing number of municipal, industrial and private bore wells. Monitoring of Groundwater levels and quality is useful to understand the impact of uncontrolled drilling of bore wells, point and Non point sources of pollutants. Such studies provide early indicators of changes in groundwater resource and help to understand how to protect it. Interrelated nature of land and water resources invariably call for the integrated development of total resources available in a sustainable manner with watershed as a basis hydrological unit for development planning. GIS map showing groundwater depth and level are developed and compared with surface relief map. These maps are very useful for urban planning and sustainable groundwater usage. Key words: GIS, Mapping, Ground Water Table. Introduction India is the largest groundwater user in the world groundwater has to play a significant role in the India’s economy, environment and standard of living. The Government has no direct control over the ground water use of millions of private bore well owners both in rural and urban areas. Hence according to that problem we are decided to work on the project “Monitoring and GIS mapping of ground water level” for that we are selecting Nategaon region, This area always suffering from water scarcity, drinking water problem in every summer season. And also adversely effects on yield of crop, industrial area also facing the same problem of shortage of water. It is need of the day to know about water level in bore well, this will be useful to know the availability of water according to that we are planning water management to overcome the scarcity of water Objectives: 1) To locate the geographical locations of the study points. 2) To find out water levels for various open wells in a selected area. 3) Mapping of study area using QGIS. Study Area: Fig.1 shows the field measurement Nategaon is village in kopargaontaluka in Ahmednagar in district of maharastra state, India. It belongs to Nashik Division. It is located 118km towards north from district headquarters Ahmednagar and 13 km from kopargaontaluka and 233km from state capital Mumbai. The latitude 19.98215 and longitude 74.47664 of the geo co-ordinate of the Maharashtra.
-
Upload
khangminh22 -
Category
Documents
-
view
6 -
download
0
Transcript of Monitoring And GIS Mapping Of Ground Water Level ...
International Journal of Advance Engineering and Research Development
Volume 5, Issue 05, May -2018
@IJAERD-2018, All rights Reserved 729
Scientific Journal of Impact Factor (SJIF): 5.71 e-ISSN (O): 2348-4470 p-ISSN (P): 2348-6406
MONITORING AND GIS MAPPING OF GROUND WATER LEVEL,
NATEGAON AREA, KOPARGAON.
Mungase Avinash M1, Naik Suraj S
2, More Sandip S
3, Nimbalkar Sagar H
4 , ,
Patil Anant M5, Dr. C.L. Jejurkar
6.
Civil Engineering, Pune University, Sanjivani College, Kopargaon.
Abstract:- The global awareness regarding the over exploitation of the limited resources, at the expense of causing
severe damages to the ecological system and environmental degradation resulted in evolving methodology for optimum
land and water utilization. These necessitate an integrated approach for the optimal development of available resources
minimizing hazards to environment. Nategaon is a developing village in Tal-kopargaon, Dist.-Ahmednagar,Maharastra,
in India. Groundwater is a major source of water supply for the area which is reflected by regular extraction of
groundwater through ever increasing number of municipal, industrial and private bore wells. Monitoring of
Groundwater levels and quality is useful to understand the impact of uncontrolled drilling of bore wells, point and Non
point sources of pollutants. Such studies provide early indicators of changes in groundwater resource and help to
understand how to protect it. Interrelated nature of land and water resources invariably call for the integrated
development of total resources available in a sustainable manner with watershed as a basis hydrological unit for
development planning. GIS map showing groundwater depth and level are developed and compared with surface relief
map. These maps are very useful for urban planning and sustainable groundwater usage.
Key words: GIS, Mapping, Ground Water Table.
Introduction
India is the largest groundwater user in the world groundwater has to play a significant role in the India’s economy,
environment and standard of living. The Government has no direct control over the ground water use of millions of
private bore well owners both in rural and urban areas.
Hence according to that problem we are decided to work on the project “Monitoring and GIS mapping of ground
water level” for that we are selecting Nategaon region, This area always suffering from water scarcity, drinking water
problem in every summer season. And also adversely effects on yield of crop, industrial area also facing the same
problem of shortage of water.
It is need of the day to know about water level in bore well, this will be useful to know the availability of water according
to that we are planning water management to overcome the scarcity of water
Objectives:
1) To locate the geographical locations of the study points.
2) To find out water levels for various open wells in a selected area.
3) Mapping of study area using QGIS.
Study Area:
Fig.1 shows the field measurement
Nategaon is village in kopargaontaluka in Ahmednagar in district of maharastra state, India. It belongs to Nashik
Division. It is located 118km towards north from district headquarters Ahmednagar and 13 km from kopargaontaluka and
233km from state capital Mumbai. The latitude 19.98215 and longitude 74.47664 of the geo co-ordinate of the
Maharashtra.
International Journal of Advance Engineering and Research Development (IJAERD) Volume 5, Issue 05, May-2018, e-ISSN: 2348 - 4470, print-ISSN: 2348-6406
@IJAERD-2018, All rights Reserved 730
Data source:
1) Nategaon area map
2) Nategaon village information.
3) Data used and Software, Instrument.
a) GARMIN GPS-60
b) Google Earth pro
c) QGIS
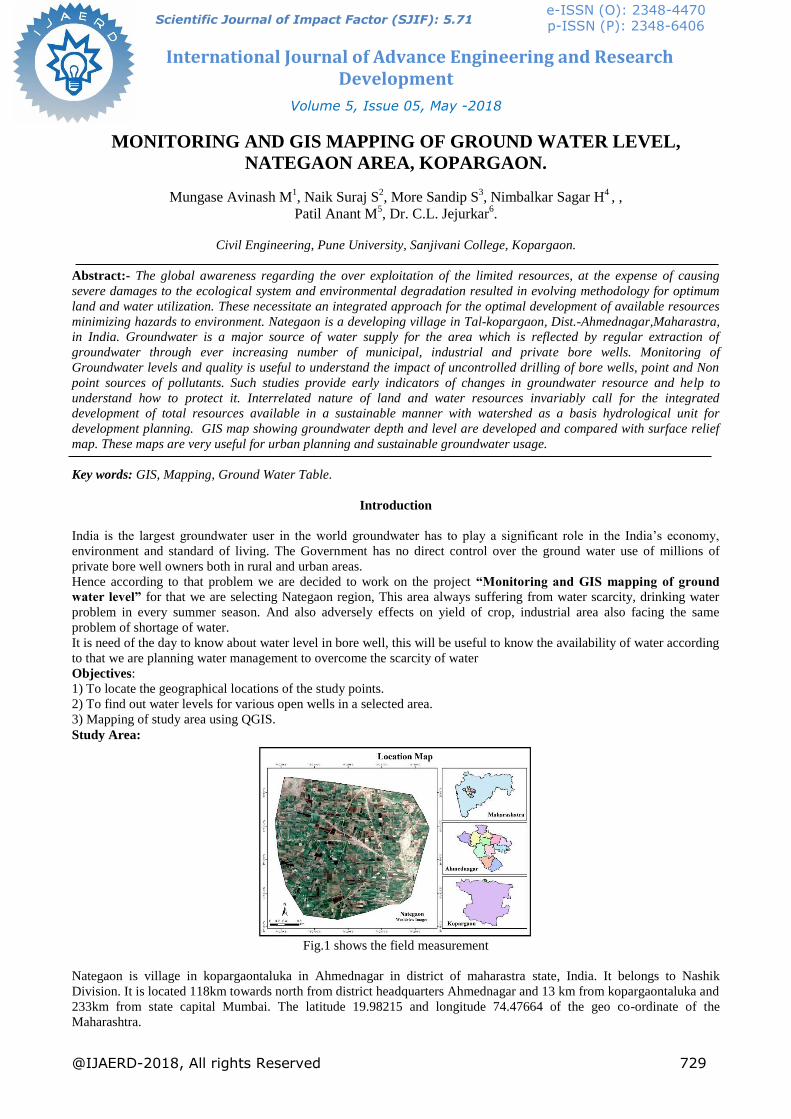
METHODOLOGY:
Based on field observation 43 Open wells were selected forgroundwater depth measurement. The selected bore wells are
distributed throughout the city with one bore well located in each municipal ward. Spatial coordinates of the sampling
bore wells were measured on site using a hand held global positioning system (GPS) instrument GARMIN GPS-
60.Groundwater depth of the sampling bore wells were measured during Pre monsoon season in the year 2017. Method
consists of partially opening cover of the bore well/ hand pump and inserting a rope attached with a weight (spanner) at
the lower end, through the casing of the bore well. This method is similar to the standard procedure described for
measuring groundwater depth using a steeltape.
Fig.2 shows the field measurement process.
Depth to groundwater level was measured in meter with the casing of the well as reference point and then deduced to
exact ground level. Google earth is used to register ground level profile of the study area and ground level above mean
sea level of the sampling bore wells. The groundwater level in MSL was obtained by deducting groundwater depth from
the ground level in MSL.
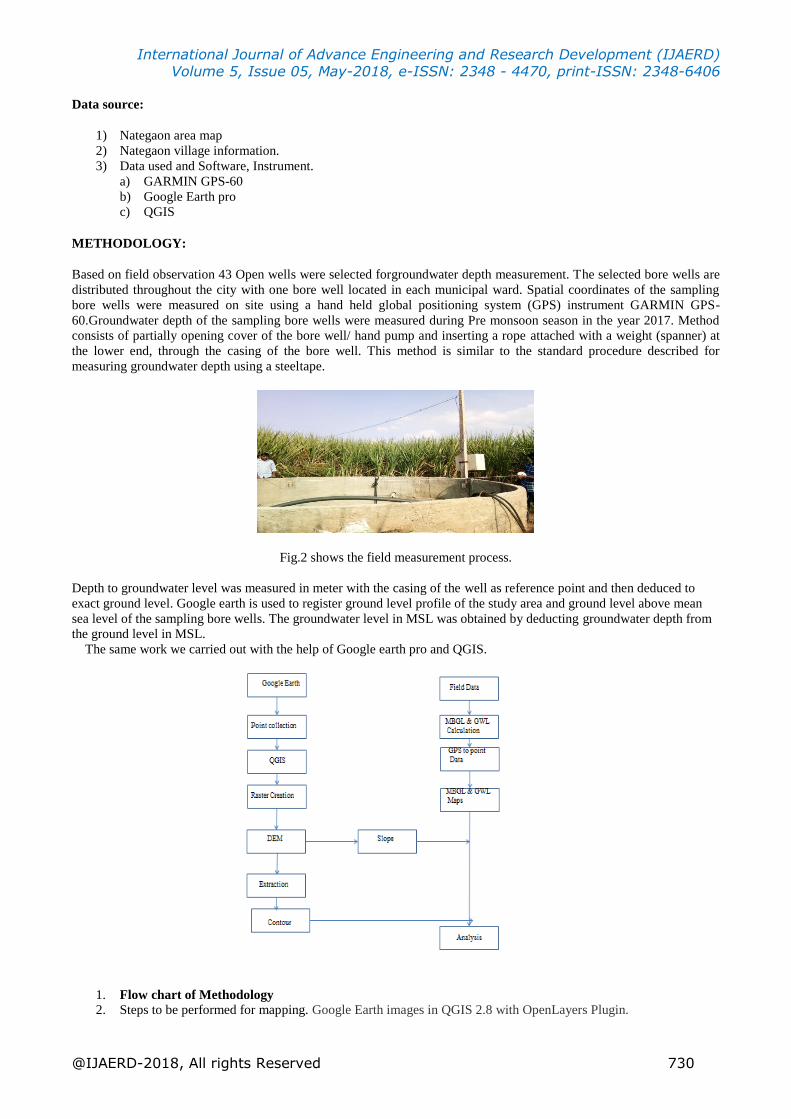
The same work we carried out with the help of Google earth pro and QGIS.
1. Flow chart of Methodology 2. Steps to be performed for mapping. Google Earth images in QGIS 2.8 with OpenLayers Plugin.
International Journal of Advance Engineering and Research Development (IJAERD) Volume 5, Issue 05, May-2018, e-ISSN: 2348 - 4470, print-ISSN: 2348-6406
@IJAERD-2018, All rights Reserved 731
The steps to do this are :
1) Localize and download the image from Google earth Pro.
2) Install the Open Layers plugin in QGIS (if it is not installed)
3) Add the Google Satellite layer of the Open Layers plugin to the QGIS map.
4) Open downloaded image in the QGIS Georeferenced.
5) Add control points the image using similar points in the Google Satellite layer….
Geo referenced images can be used in QGIS or other software like ArcGIS
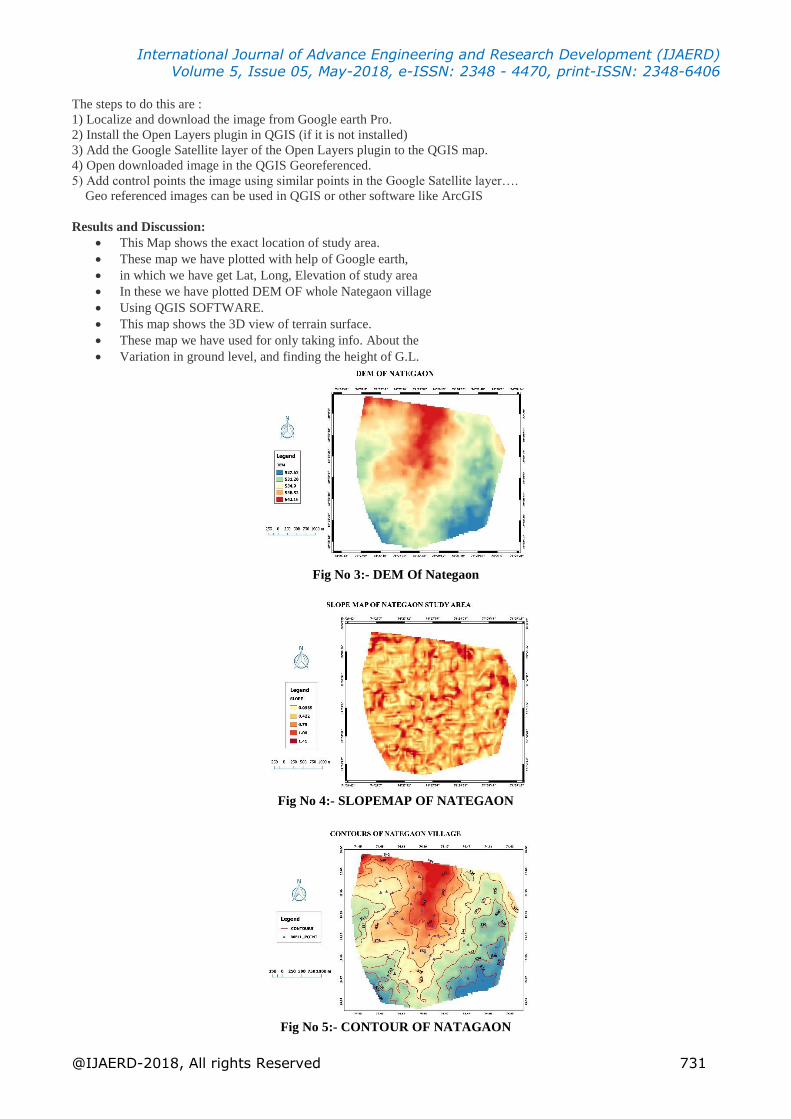
Results and Discussion:
This Map shows the exact location of study area.
These map we have plotted with help of Google earth,
in which we have get Lat, Long, Elevation of study area
In these we have plotted DEM OF whole Nategaon village
Using QGIS SOFTWARE.
This map shows the 3D view of terrain surface.
These map we have used for only taking info. About the
Variation in ground level, and finding the height of G.L.
Fig No 3:- DEM Of Nategaon
Fig No 4:- SLOPEMAP OF NATEGAON
Fig No 5:- CONTOUR OF NATAGAON
International Journal of Advance Engineering and Research Development (IJAERD) Volume 5, Issue 05, May-2018, e-ISSN: 2348 - 4470, print-ISSN: 2348-6406
@IJAERD-2018, All rights Reserved 732
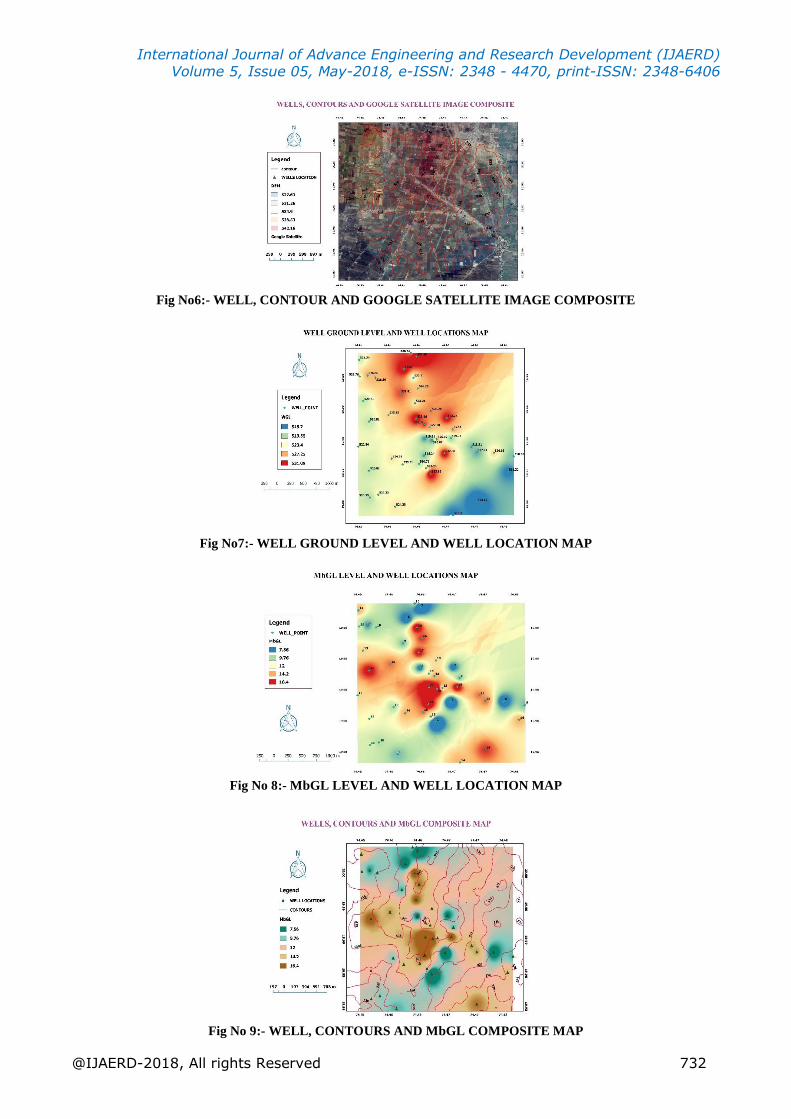
Fig No6:- WELL, CONTOUR AND GOOGLE SATELLITE IMAGE COMPOSITE
Fig No7:- WELL GROUND LEVEL AND WELL LOCATION MAP
Fig No 8:- MbGL LEVEL AND WELL LOCATION MAP
Fig No 9:- WELL, CONTOURS AND MbGL COMPOSITE MAP
International Journal of Advance Engineering and Research Development (IJAERD) Volume 5, Issue 05, May-2018, e-ISSN: 2348 - 4470, print-ISSN: 2348-6406
@IJAERD-2018, All rights Reserved 733
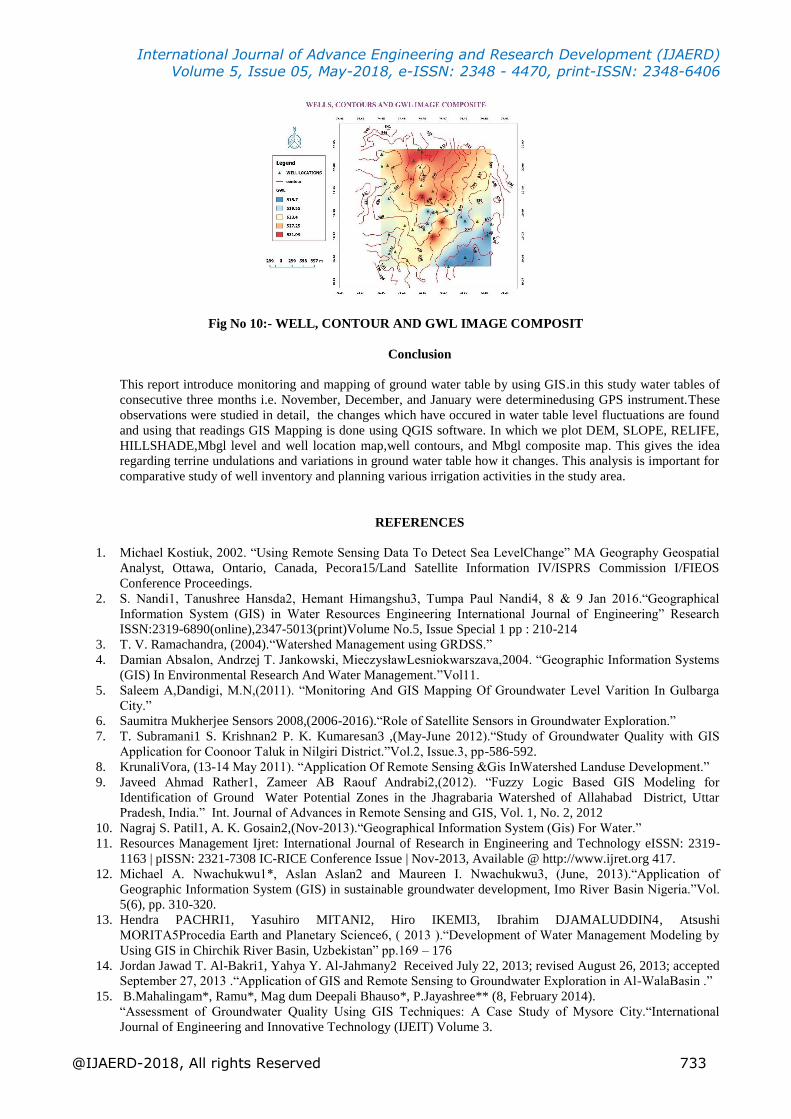
Fig No 10:- WELL, CONTOUR AND GWL IMAGE COMPOSIT
Conclusion
This report introduce monitoring and mapping of ground water table by using GIS.in this study water tables of
consecutive three months i.e. November, December, and January were determinedusing GPS instrument.These
observations were studied in detail, the changes which have occured in water table level fluctuations are found
and using that readings GIS Mapping is done using QGIS software. In which we plot DEM, SLOPE, RELIFE,
HILLSHADE,Mbgl level and well location map,well contours, and Mbgl composite map. This gives the idea
regarding terrine undulations and variations in ground water table how it changes. This analysis is important for
comparative study of well inventory and planning various irrigation activities in the study area.
REFERENCES
1. Michael Kostiuk, 2002. “Using Remote Sensing Data To Detect Sea LevelChange” MA Geography Geospatial
Analyst, Ottawa, Ontario, Canada, Pecora15/Land Satellite Information IV/ISPRS Commission I/FIEOS
Conference Proceedings.
2. S. Nandi1, Tanushree Hansda2, Hemant Himangshu3, Tumpa Paul Nandi4, 8 & 9 Jan 2016.“Geographical
Information System (GIS) in Water Resources Engineering International Journal of Engineering” Research
ISSN:2319-6890(online),2347-5013(print)Volume No.5, Issue Special 1 pp : 210-214
3. T. V. Ramachandra, (2004).“Watershed Management using GRDSS.”
4. Damian Absalon, Andrzej T. Jankowski, MieczysławLesniokwarszava,2004. “Geographic Information Systems
(GIS) In Environmental Research And Water Management.”Vol11.
5. Saleem A,Dandigi, M.N,(2011). “Monitoring And GIS Mapping Of Groundwater Level Varition In Gulbarga
City.”
6. Saumitra Mukherjee Sensors 2008,(2006-2016).“Role of Satellite Sensors in Groundwater Exploration.”
7. T. Subramani1 S. Krishnan2 P. K. Kumaresan3 ,(May-June 2012).“Study of Groundwater Quality with GIS
Application for Coonoor Taluk in Nilgiri District.”Vol.2, Issue.3, pp-586-592.
8. KrunaliVora, (13-14 May 2011). “Application Of Remote Sensing &Gis InWatershed Landuse Development.”
9. Javeed Ahmad Rather1, Zameer AB Raouf Andrabi2,(2012). “Fuzzy Logic Based GIS Modeling for
Identification of Ground Water Potential Zones in the Jhagrabaria Watershed of Allahabad District, Uttar
Pradesh, India.” Int. Journal of Advances in Remote Sensing and GIS, Vol. 1, No. 2, 2012
10. Nagraj S. Patil1, A. K. Gosain2,(Nov-2013).“Geographical Information System (Gis) For Water.”
11. Resources Management Ijret: International Journal of Research in Engineering and Technology eISSN: 2319-
1163 | pISSN: 2321-7308 IC-RICE Conference Issue | Nov-2013, Available @ http://www.ijret.org 417.
12. Michael A. Nwachukwu1*, Aslan Aslan2 and Maureen I. Nwachukwu3, (June, 2013).“Application of
Geographic Information System (GIS) in sustainable groundwater development, Imo River Basin Nigeria.”Vol.
5(6), pp. 310-320.
13. Hendra PACHRI1, Yasuhiro MITANI2, Hiro IKEMI3, Ibrahim DJAMALUDDIN4, Atsushi
MORITA5Procedia Earth and Planetary Science6, ( 2013 ).“Development of Water Management Modeling by
Using GIS in Chirchik River Basin, Uzbekistan” pp.169 – 176
14. Jordan Jawad T. Al-Bakri1, Yahya Y. Al-Jahmany2 Received July 22, 2013; revised August 26, 2013; accepted
September 27, 2013 .“Application of GIS and Remote Sensing to Groundwater Exploration in Al-WalaBasin .”
15. B.Mahalingam*, Ramu*, Mag dum Deepali Bhauso*, P.Jayashree** (8, February 2014).
“Assessment of Groundwater Quality Using GIS Techniques: A Case Study of Mysore City.“International
Journal of Engineering and Innovative Technology (IJEIT) Volume 3.
International Journal of Advance Engineering and Research Development (IJAERD) Volume 5, Issue 05, May-2018, e-ISSN: 2348 - 4470, print-ISSN: 2348-6406
@IJAERD-2018, All rights Reserved 734
16. Aniss Moumen1, HassaneJarar Oulidi2, Meryem Agadi3, Mohamed Nehmadou4, Mohamed Ben-Daoud5,
Amel Barich6,(2014). “A Sensor Web for Real-Time Groundwater Data Monitoring in Morocco.” Journal of
Geographic Information System. pp. 613-62.
17. Dr.KhaledKheder ,(May-2014). “Modeling of Groundwater Behavior using GIS and Mod Flow Software : Case
study of Al Kharj Region Al Kharj Saudi Arabia.” International Journal of Scientific & Engineering Research,
Volume 5, Issue 5460 ISSN 2229-5518.
18. Prafull Singh *, Ankit Gupta, Madhulika Singh,Hydrological 1 April 2014; revised 1 September 2014; accepted
17 September 2014. “Inferences from watershed analysis for water resource management using remote sensing
and GIS techniques.”
19. Gaurav Savant ,Lei Wang Dr. Dennis Truax Miroslav Rusko, PhD. “Remote Sensing And Geospatial
Applications For Watershed Delineation.” - Slovak University of Technology in Bratislava, Faculty of Materials
Science and Technology, Institute of Safety and Environmental Engineering, Botanická 49, 917
20. Singha Sudhakar1, Verma. M. K2, Singha Soumya3 ,(January2016) “Application of GInd MODFLOW to
Ground Water.” Hydrology- ISSN: 2248-9622, Vol. 6, Issue 1, (Part - 1), pp.36-42.