Local Binary Patterns for Spatial-Spectral Classification of Hyperspectral Imagery

Fire Ecology Special IssueVol. 3, No. 1, 2007
Lewis et al.: Mapping Ground Cover Using Hyperspectral Remote SensingPage 109
MAPPING GROUND COVER USING HYPERSPECTRAL REMOTE SENSING AFTER THE 2003 SIMI AND OLD WILDFIRES IN SOUTHERN CALIFORNIA
Sarah A. Lewis1,*, Leigh B. Lentile2, Andrew T. Hudak1, Peter R. Robichaud1, Penelope Morgan2 and Michael J. Bobbitt2
1Forest Service, US Department of Agriculture, Rocky Mountain Research Station1221 S. Main Street, Moscow, Idaho 83843
2University of Idaho, Department of Forest Resources6th and Line Street, Moscow, Idaho 83844-1133
*Corresponding author: Tel.: (208) 883-2346; e-mail: [email protected]
ABSTRACT
Wildfi re effects on the ground surface are indicative of the potential for post-fi re watershed erosion response. Areas with remaining organic ground cover will likely experience less erosion than areas of complete ground cover combustion or exposed mineral soil. The Simi and Old fi res burned ~67,000 ha in southern California in 2003. Burn severity indices calculated from pre- and post-fi re multispectral imagery were differenced (i.e., differenced Normalized Burn Ratio (dNBR)) to highlight fi re-induced changes to soil and vegetation. Aerial and fi eld hyperspectral data were also collected together with fi eld ground cover measurements soon after the fi res. Spectral endmembers representing green vegetation, nonphotosynthetic vegetation (NPV), charred NPV, and charred and uncharred inorganic materials (soil, ash, and rock) were used in a constrained linear spectral unmixing process to determine the post-fi re fractional ground cover of each component on the ground surface. The spectral unmixing results, dNBR, and a Relative dNBR (RdNBR) were validated using fi eld-measured fractional ground cover estimates to determine which product best predicted the conditions on the ground. The spectral unmixing results were signifi cantly correlated to all classes of charred and uncharred organics and inorganics, and the dNBR was the best indicator of charred soil and green vegetation. The RdNBR had several signifi cant correlations with the ground data, yet did not consistently correlate well with any specifi c ground cover types. A map of post-wildfi re ground cover and condition, especially exposed soil and remaining vegetative cover, is a good indicator of the fi re’s effect on the ground surface and the resulting potential for hydrologic response.
Keywords: burn severity, dNBR, erosion potential, hyperspectral data, Relative dNBR, southern California wildfi res, spectral mixture analysis
Citation: Lewis, S.A., L.B. Lentile, A.T. Hudak, P.R. Robichaud, P. Morgan and M.J. Bobbitt.
2007. Mapping ground cover using hyperspectral remote sensing after the 2003 Simi and Old wildfi res in southern California. Fire Ecology 3(1): 109-128.

Fire Ecology Special IssueVol. 3, No. 1, 2007
Lewis et al.: Mapping Ground Cover Using Hyperspectral Remote SensingPage 110
INTRODUCTION
Post-wildfi re maps are created from remotely sensed data as soon as the fi re is out to capture immediate post-fi re conditions of soils and vegetation. These maps are commonly referred to as burn severity maps and are primarily used to assist rapid-response Burned Area Emergency Response (BAER) teams in assessing the immediate and long-term fi re effects on vegetation, soil, and related ecological processes (Lentile et al. 2006). Standard burn severity mapping methodologies are based on classifi cation of spectral indices (such as the Normalized Burn Ratio, or NBR) calculated from differenced pre- and post-fi re multispectral satellite imagery (Key and Benson 2006, Clark et al. 2003). For these post-fi re maps, the landscape is classifi ed into categories of unburned, low, moderate, and high burn severity, corresponding to the magnitude of change in the post-wildfi re appearance of vegetation, litter, and soil (Miller and Yool 2002, Lentile et al. 2006, Lutes et al. 2006).
Effects of fi re on the ground surface with erosion-related implications include an increase in exposed soil and ash and a decrease in protective ground cover such as litter and duff. Post-fi re organic ground cover, whether charred or uncharred, can provide protection against soil erosion (Ice et al. 2004, Kokaly et al. 2007). Conversely, areas with exposed mineral soil or ash cover increase the risk for erosion by wind and water (DeBano 2000, Robichaud 2000, Ravi et al. 2006). Ash cover is indicative of complete organic material combustion. Because a water repellent soil layer may be formed when these organic materials burn on the soil surface, reduced infi ltration is often found where post-fi re ash cover is high (DeBano 2000, Lewis et al. 2006). In such cases, the top 1 cm to 5 cm of the soil profi le above the water repellent layer may hold water, but once this layer becomes saturated, as often occurs following intense rainfall, erosion is likely, particularly on steep slopes with loose,
coarse textured soils. Additionally, these fi re-induced water repellent soil conditions occur when waxy chemicals from plant materials are volatilized during burning and coat coarse textured soil particles at or near the soil surface, which is common in chaparral communities (Barro and Conard 1991, CDF 2003, Hubbert et al. 2006).
The chaparral community is a shrubby, sclerophyllous vegetation type that is common in middle elevations throughout much of California (Barro and Conard 1991). Common chaparral tree and shrub genera include Adenostoma, Arctostaphylos, Ceanothus, Cercocarpus, Prunus, Quercus, and Rhamnus. Chaparral vegetation is well adapted to frequent fi res that were historically common in the area. Chaparral plant adaptations include rapid post-fi re root sprouting, prolifi c seeding, seed banking, fi re-stimulated seed germination, and allelopathy (Hanes 1977, Keeley 2006). Frequent fi re results in conversion of shrub-dominated systems to those dominated by a mix of non-native annual grasses and forbs from the Mediterranean Basin.
The 2003 southern California wildfi res burned ~300,000 ha, much of which was in chaparral vegetation that has a more open canopy and less litter accumulation on the ground as compared to a typical coniferous forest. These conditions are due in part to the rocky soils in the area and relatively low rainfall that prevent vegetation from becoming dense, except in segregated patches. These vegetation patterns create a unique situation when classifying the severity of the fi re using a differenced index such as dNBR (differenced normalized burn ratio) that is dependent on the magnitude of change from pre- to post-fi re condition (Miller and Thode 2007). Where vegetation is sparse, the complete removal of vegetation due to fi re will be classifi ed as high burn severity, even though the relative change to the pre-fi re condition and the soil effects on the soil are less severe than similarly classifi ed burned non-chaparral systems. This potentially

Fire Ecology Special IssueVol. 3, No. 1, 2007
Lewis et al.: Mapping Ground Cover Using Hyperspectral Remote SensingPage 111
leads to unnecessary erosion mitigation efforts based on the calculated change in refl ectance, rather than the physical alteration of the soil. Miller and Thode (2007) have recently proposed a new index, the Relative dNBR (RdNBR) that takes into account the relative pre-fi re to post-fi re change in amount of vegetation across the landscape. They suggest that this relative index may be more appropriate than the dNBR for mapping sparse vegetation or mixed vegetation types.
Higher spatial and spectral resolution airborne hyperspectral data have the potential to improve traditional post-fi re maps by providing fi ne-scale quantitative information about post-fi re ground cover and conditions (Robichaud et al. 2007). Rather than applying a discrete classifi cation to an area, a fi nal product from hyperspectral imagery can provide an estimate of the percent residual post-fi re charred ground cover and ash for an area (pixel) as small as 4 m to 5 m. This information may help to identify locations where post-fi re rehabilitation treatments are necessary by better quantifying the effects of the fi re on the ground surface.
The refl ectance from a specifi c image pixel is a mixture of the individual refl ectance spectra (endmembers) of surface materials (Adams et al. 1985, Smith et al. 1990, Roberts et al. 1993). Each pixel retains the characteristic features of the individual spectra from each of the component refl ective materials. Once endmember spectra are identifi ed, spectral unmixing of individual pixels can estimate the fractional component spectra and, in turn, the physical fractional component of the materials within the pixels (Adams et al. 1985, Roberts et al. 1993, Theseira et al. 2003). Most rural landscapes can be mapped as endmember combinations of green vegetation, non-photosynthetic vegetation, soil and rock, and shade (Roberts et al. 1993, Adams et al. 1995, Theseira et al. 2003). More specifi cally related to fi re, hyperspectral imagery has been used to map fractional cover of ash, soil, green and non-photosynthetic vegetation in post-fi re areas
(Jia et al. 2006, Kokaly et al. 2007, Robichaud et al. 2007). Our objectives were to assess the potential of hyperspectral imagery to provide a better estimate of post-fi re soil condition, particularly the amount of exposed mineral soil, than had been achieved with traditional multispectral imagery.
METHODS
Study Area
The Simi and Old fi res were two of several large wildfi res that burned throughout southern California during the fall of 2003 (Figure 1). These fi res threatened thousands of homes and impacted air and water quality throughout the region. The Simi fi re began on 25 October 2003 and burned 43,800 ha in Ventura and Los Angeles counties before being contained on 2 November 2003 (Clark et al. 2003). Driven by strong Santa Ana winds, the fi re jumped State Highway 126 and burned around the densely populated towns of Simi Valley, Moorpark, and Saticoy, California. The Simi fi re burned in a mix of vegetation types including chaparral (the dominant vegetation type), coastal sage scrub, and annual grasslands across a diversity of topographic conditions including sandy, rolling hills and very steep, rocky terrain. The underlying bedrock in the area is comprised of sedimentary rock with overlying sandy loam soils (USDA, 2006). The soils and rock are light colored and large patches of rocky outcrops are common.
Immediately post-fi re, a burn severity map for the Simi fi re was created from post-fi re airborne multispectral MASTER imagery (masterweb.jpl.nasa.gov) acquired on 1 November 2003 (Clark et al. 2003). The majority of the area within the Simi fi re perimeter was burned at low or moderate severity, and BAER (Burned Area Emergency Response) teams in the fi eld reported that the burn severity map was generally representative of the conditions observed on the ground (CDF 2003, Clark et

Fire Ecology Special IssueVol. 3, No. 1, 2007
Lewis et al.: Mapping Ground Cover Using Hyperspectral Remote SensingPage 112
al. 2003). However, several watersheds were assessed at a higher severity than indicated on the map and were at risk for increased post-fi re erosion and debris fl ow (Cannon et al. 2003, CDF 2003). The BAER assessment team also noted the presence of white ash in severely burned areas, which indicated a high likelihood of water repellent soils and increased erosion potential (CDF 2003, Lewis et al. 2007).
The Old fi re began on 28 October 2003 and burned 23,300 ha north of San Bernardino, California. The Old fi re burned in chaparral at lower elevations and interior woodland vegetation at higher elevations, both on steep, rocky terrain. The Old fi re burned more in the wildland urban interface than did the Simi fi re. The area around Lake Arrowhead is densely populated with homes deep in the wooded areas, much of which had sustained damage from a serious mountain pine beetle outbreak (Savage 1997, McCullough et al. 1998). The combined effects of frequent human and
natural ignitions, hot dry summers, frequent and extended droughts, high fl ammability of chaparral vegetation, and forest trees killed by bark beetles, made these ecosystems extremely susceptible to intense crown fi res (Barro and Conard 1991, Keeley 2000, Keeley and Fotheringham 2001). The immediate post-fi re burn severity map for the Old fi re was created from MODIS imagery that was acquired on 5 November 2003 (Clark et al. 2003). Like for the Simi fi re, these maps were used in the BAER team’s assessment of the potential for increased runoff and erosion and to guide post-fi re rehabilitation activities. Based on the BAER team fi ndings that 50% of the chaparral areas and 30% of the conifer forest areas that burned at moderate or high burn severity had water repellent soils, aerial straw mulch was prescribed to mitigate erosion on slopes above areas with values at risk, such as houses, roads, and water supplies (Hubbert 2005).
Figure 1. Map of the state of California, showing the locations of the Simi and Old fi res. The fi eld plot locations are shown within each fi re.

Fire Ecology Special IssueVol. 3, No. 1, 2007
Lewis et al.: Mapping Ground Cover Using Hyperspectral Remote SensingPage 113
Field Data Collection
Post-fi re soil and vegetation data were collected in December 2003 at six sites on each fi re. These sites were selected using the immediate post-fi re burn severity maps as a guide and classifi ed by observation in the fi eld as low, moderate, or high severity if tree or shrub crowns were predominantly green, brown, or black, respectively. On the Simi fi re, two study sites were classifi ed as low burn severity, three as moderate and one as high. On the Old fi re, one site was classifi ed as low burn severity, three as moderate and two as high. These burn severity classes were only used as a general guide to ensure that the fi eld data covered the full range of burn severity conditions within each fi re. Each site was centered in a random location 80 m to 140 m from the nearest access road, within a consistent stand and burn severity condition. Each site consisted of nine 8 m x 8 m plots and each plot was comprised of fi fteen 1 m x 1 m subplots, for a total of 135 subplots. Plot centers were geolocated with a global positioning system (GPS) and differentially corrected. Subplot centers were positioned with measurement tape and compass based on systematic distances and bearings from plot center (see detailed description in Hudak et al. 2007).
At the subplot scale, the fractional cover of green vegetation, rock, mineral soil, ash, litter (new and old), and any large organic matter (logs, branches or stumps) were ocularly estimated. The percent char, if any, of each ground cover component was also recorded. Minor ground cover fractions were estimated fi rst, and a value of one percent was recorded if there was a trace of the component within the subplot. The more abundant fractional ground cover components (often exposed mineral soil and rock, ash, and litter) were then estimated in 5% increments with the largest cover component estimated last. All cover fractions were required to sum to unity. Exposed mineral soil and rock were considered ground cover for
the purpose of accounting for all physical space within a plot. New litter, mostly fallen leaves and needles deposited post-fi re from scorched shrubs and trees, was estimated separately from the other cover fractions present at the time of the burn, to better deduce the ground conditions immediately after the fi re. Thus, new litter was not included in the cover fractions that summed to unity. At the center of each site, the depth of new litter, old litter, and duff were measured; the canopy cover was estimated using a convex spherical densiometer; and a digital photo was taken for reference.
Remotely Sensed Data Collection
Field spectra. Multiple spectra of soil, rock, and green, non-photosynthetic vegetation (NPV), and charred NPV materials were collected in December 2003 after both the Simi and Old fi res using an ASD Pro-FR fi eld spectroradiometer (Analytical Spectral Devices, Boulder, Colorado, USA). Spectra were collected with the bare tip foreoptic (FOV 22°) pointed at the target material. The ASD Pro-FR sampling interval is 1.4 nm over the 350 nm to 1,050 nm wavelength range and 2 nm over the 1,000 nm to 2,500 nm range, spanning nearly the same portion of the electromagnetic (EM) spectrum as the Probe I sensor used for airborne imaging. These measurements are interpolated at every 1 nm wavelength and reported in 2,151 contiguous channels. The fi eld spectrometer was calibrated against a Spectralon (Labsphere, North Sutton, New Hampshire, USA) 100% refl ective panel immediately before and at frequent intervals during fi eld spectra collection to account for changing light and atmospheric conditions. Spectralon is a bright calibration target with well-documented refl ectance in the 400 nm to 2,500 nm region of the EM spectrum. Absolute refl ectance was calculated at the time of data collection for all spectra by dividing fi eld refl ectance by the bright target refl ectance. Representative spectra from the Old fi re are shown in Figure 2.

Fire Ecology Special IssueVol. 3, No. 1, 2007
Lewis et al.: Mapping Ground Cover Using Hyperspectral Remote SensingPage 114
Airborne hyperspectral. Airborne hyperspectral imagery, which covered the range of burn severities observed and included all fi eld sites, was collected on 4 January 2004, starting at 1123 h PST and concluding before 1300 h. On this date at the collection start time, the solar zenith angel was 57.7°, which is a higher angle than ideal (45° and lower is desirable). One fl ight line of data was collected over the Simi fi re (Figure 3) and fi ve fl ight lines of data were collected over the Old fi re (Figure 4). The Probe I whisk-broom sensor (Earth Search Sciences Inc. (ESSI), Lakeside, Montana, USA) was fl own at 2,100 m above ground level and data were collected along a track ~28 km long and 2.3 km wide, corresponding to a 512-pixel wide swath with a 4.2 m by 4.2 m Ground Instantaneous Field of View at nadir. Refl ected
EM energy from the surface was received in 128 contiguous spectral bands that spanned 432 nm to 2,512 nm, with a spectral bandwidth of 11 nm to 19 nm.
Radiometric pre-processing. The airborne hyperspectral data were converted to refl ectance using ACORN (Atmospheric CORrection Now) without any additional artifact suppression (AIG 2002). These refl ectance data were further refi ned with a radiative transfer ground-controlled (RTGC) calibration (Clark et al. 2002).
Geometric pre-processing. An on-board GPS and inertial measurement unit (IMU) acquired geolocation data that were matched with the spectral data. The geolocation data,
Figure 2. Example fi eld spectra of uncharred soil, green vegetation, non-photosynthetic vegetation, charred soil, and charred vegetation (NPV) fi eld spectra collected from the Old fi re. Water absorption bands in the ranges of 1360-1400 nm and 1800-1980 nm were removed.

Fire Ecology Special IssueVol. 3, No. 1, 2007
Lewis et al.: Mapping Ground Cover Using Hyperspectral Remote SensingPage 115
Figure 3. Hyperspectral images of the Simi fi re highlighting the spectral unmixing results of each major ground cover component. In the grayscale images, black represents zero cover while bright gray or white represents near complete cover (approaching 100%) of each particular ground cover component. The color composite is a red-green-blue image showing charred NPV (red), green vegetation (green), and uncharred soil (blue) on the Simi fi re. The six fi eld sites are marked as white crosses on the southern half of the image strip in the fi rst panel.

Fire Ecology Special IssueVol. 3, No. 1, 2007
Lewis et al.: Mapping Ground Cover Using Hyperspectral Remote SensingPage 116
Figure 4. Hyperspectral images of the Old fi re highlighting the spectral unmixing results of each major ground cover component. In the grayscale images, black represents zero cover while bright gray or white represents near complete cover (approaching 100%) of each particular ground cover component. The color composite is a red-green-blue image showing charred NPV (red), green vegetation (green), and uncharred soil (blue) on the Old fi re. The six fi eld site locations are marked as white crosses to the north-east of Lake Arrowhead in the fi rst panel. Scale bar is for color composite image only.
Fire Ecology Special IssueVol. 3, No. 1, 2007
Lewis et al.: Mapping Ground Cover Using Hyperspectral Remote SensingPage 117
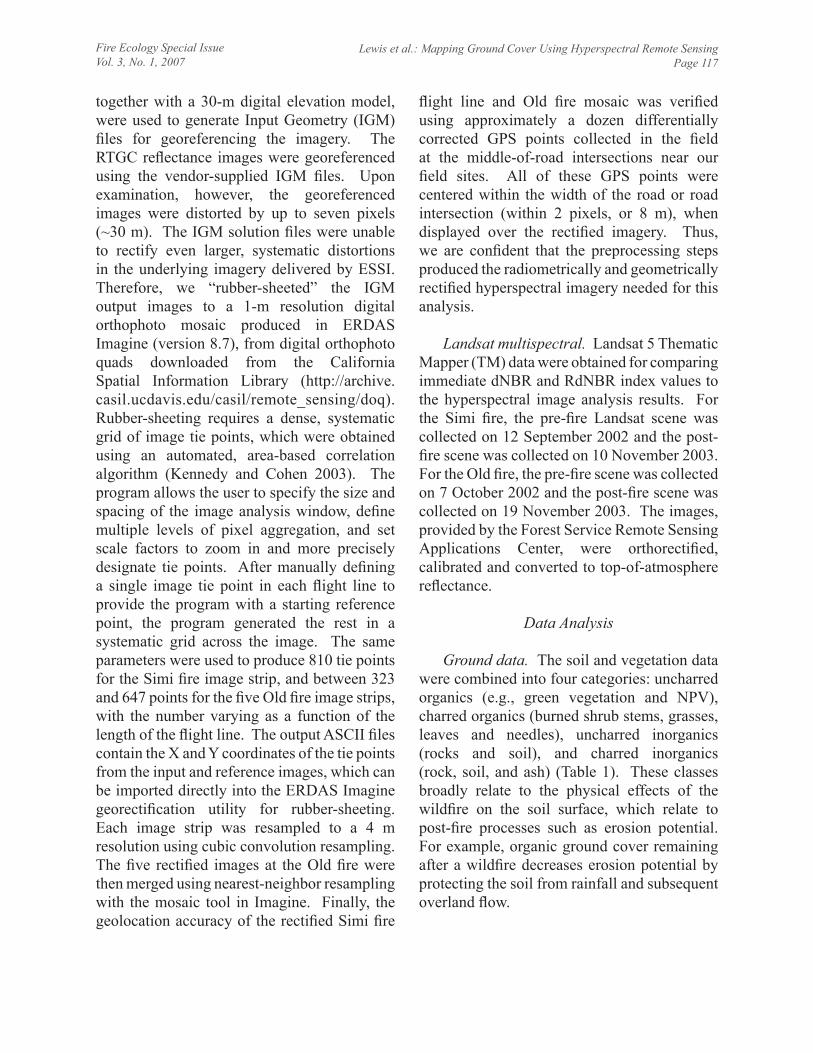
together with a 30-m digital elevation model, were used to generate Input Geometry (IGM) fi les for georeferencing the imagery. The RTGC refl ectance images were georeferenced using the vendor-supplied IGM fi les. Upon examination, however, the georeferenced images were distorted by up to seven pixels (~30 m). The IGM solution fi les were unable to rectify even larger, systematic distortions in the underlying imagery delivered by ESSI. Therefore, we “rubber-sheeted” the IGM output images to a 1-m resolution digital orthophoto mosaic produced in ERDAS Imagine (version 8.7), from digital orthophoto quads downloaded from the California Spatial Information Library (http://archive.casil.ucdavis.edu/casil/remote_sensing/doq). Rubber-sheeting requires a dense, systematic grid of image tie points, which were obtained using an automated, area-based correlation algorithm (Kennedy and Cohen 2003). The program allows the user to specify the size and spacing of the image analysis window, defi ne multiple levels of pixel aggregation, and set scale factors to zoom in and more precisely designate tie points. After manually defi ning a single image tie point in each fl ight line to provide the program with a starting reference point, the program generated the rest in a systematic grid across the image. The same parameters were used to produce 810 tie points for the Simi fi re image strip, and between 323 and 647 points for the fi ve Old fi re image strips, with the number varying as a function of the length of the fl ight line. The output ASCII fi les contain the X and Y coordinates of the tie points from the input and reference images, which can be imported directly into the ERDAS Imagine georectifi cation utility for rubber-sheeting. Each image strip was resampled to a 4 m resolution using cubic convolution resampling. The fi ve rectifi ed images at the Old fi re were then merged using nearest-neighbor resampling with the mosaic tool in Imagine. Finally, the geolocation accuracy of the rectifi ed Simi fi re
fl ight line and Old fi re mosaic was verifi ed using approximately a dozen differentially corrected GPS points collected in the fi eld at the middle-of-road intersections near our fi eld sites. All of these GPS points were centered within the width of the road or road intersection (within 2 pixels, or 8 m), when displayed over the rectifi ed imagery. Thus, we are confi dent that the preprocessing steps produced the radiometrically and geometrically rectifi ed hyperspectral imagery needed for this analysis.
Landsat multispectral. Landsat 5 Thematic Mapper (TM) data were obtained for comparing immediate dNBR and RdNBR index values to the hyperspectral image analysis results. For the Simi fi re, the pre-fi re Landsat scene was collected on 12 September 2002 and the post-fi re scene was collected on 10 November 2003. For the Old fi re, the pre-fi re scene was collected on 7 October 2002 and the post-fi re scene was collected on 19 November 2003. The images, provided by the Forest Service Remote Sensing Applications Center, were orthorectifi ed, calibrated and converted to top-of-atmosphere refl ectance.
Data Analysis
Ground data. The soil and vegetation data were combined into four categories: uncharred organics (e.g., green vegetation and NPV), charred organics (burned shrub stems, grasses, leaves and needles), uncharred inorganics (rocks and soil), and charred inorganics (rock, soil, and ash) (Table 1). These classes broadly relate to the physical effects of the wildfi re on the soil surface, which relate to post-fi re processes such as erosion potential. For example, organic ground cover remaining after a wildfi re decreases erosion potential by protecting the soil from rainfall and subsequent overland fl ow.

Fire Ecology Special IssueVol. 3, No. 1, 2007
Lewis et al.: Mapping Ground Cover Using Hyperspectral Remote SensingPage 118
Remotely sensed image data. A linear spectral unmixing algorithm was applied to the pre-processed hyperspectral data to determine pixel fractions of green vegetation (grveg), charred NPV (charveg), and uncharred (soil) and charred (charsoil) inorganic ground cover:
(1)
(2)
where ρ and C are the refl ectance and cover fraction of each endmember, respectively, and ε is an error term. The individual cover fractions sum to unity in Equation 2. The fi eld spectra used as endmembers are shown in Figure 2. The outputs of spectral mixture analysis (SMA) are fractional cover images of the input materials, which are scaled from 0 to 1. Zero indicates that none of the target material is present in
the pixel, while 1 indicates complete cover. In addition to the fractional cover images, a root mean square error (RMSE) image is also produced. This gives an indication of the degree to which the input endmembers matched the extent of the materials on the ground.
Landsat bands 4 (B4) and 7 (B7) were used to calculate the Normalized Burn Ratio (NBR) index (Equation 3), the differenced Normalized Burn Ratio (dNBR) (Equation 4) (Key and Benson 2006) and the Relative dNBR (RdNBR) (Equation 5) (Miller and Thode 2007). The index values were extracted at the plot locations and compared to the ground data.
Endmember fractions were extracted from the unmixed hyperspectral and Landsat images at all subplot locations (i.e., 135 per site). These subplot values were aggregated to the plot scale, i.e., 15 subplots per plot, resulting in 9 plots per site and 54 plots per fi re. The spectral fractions and Landsat spectral indices (NBR, dNBR, RdNBR) were compared to the fi eld-measured fractional cover estimates to evaluate how well the image captured the conditions on
Ground cover category
Burn severity class
F- value p-valueLow Moderate-low Moderate-high High
dNBR values100-269 270-439 440-659 660-1300
Simi fi re plots n = 19 n = 22 n = 13 n = 0Organic-uncharred (%) 22(3.2) 8(1.8) 5(2.0) 13.5 <0.0001Organic-charred (%) 15(2.2) 12(2.3) 7(1.6) 2.3 0.11Inorganic-uncharred (%) 40(3.2) 50(4.6) 43(6.3) 1.5 0.24Inorganic-charred (%) 21(4.4) 28(4.6) 44(6.4) 4.8 0.01
Old fi re plots n = 3 n = 8 n = 19 n = 24Organic-uncharred (%) 27(5.0) 15(6.0) 5(1.9) 1(0.2) 12.8 <0.0001Organic-charred (%) 4(2.3) 14(4.7) 8(1.1) 6(1.1) 3.3 0.03Inorganic-uncharred (%) 38(9.0) 32(7.0) 37(4.5) 16(2.4) 6.6 0.0007Inorganic-charred (%) 7(3.1) 38(9.4) 49(4.3) 77(2.4) 24.3 <0.0001
Table 1. Mean ground cover characteristics of the fi eld plots on the Simi and Old fi res by burn severity class based on dNBR class values—standard error of the mean is in parentheses. Organic ground cover refers to green and non-photosynthetic vegetation, while inorganic refers to soil, rock and ash. The Analysis of Variance (ANOVA) F-value statistic is signifi cant at p < 0.05.
=

Fire Ecology Special IssueVol. 3, No. 1, 2007
Lewis et al.: Mapping Ground Cover Using Hyperspectral Remote SensingPage 119
the ground. Analysis of Variance (ANOVA) statistics were calculated (SAS proc GLM) (SAS Institute Inc. 1999) to determine if mean values of each ground cover component were different by burn severity class as determined by dNBR classifi cations (Key and Benson 2006). Correlations between each endmember and the corresponding ground cover component were assessed using the Pearson correlation statistic at the plot scale (15 aggregated subplots). Scatterplots with ground data as the independent variables and spectral data as the dependent variables were used to further examine the relationship between the ground and spectral data. Linear regressions (SAS proc REG) were calculated from these data, and best-fi t lines and coeffi cients of determination were reported on the scatterplots.
RESULTS
As dNBR values increased, or as burn severity increased, charred inorganic cover increased and uncharred organic cover decreased on both the Simi and Old fi res (Table 1). The sparse vegetation conditions are represented by 30% to 40% organic ground cover on the lowest burn severity plots after both fi res. On the plots burned at the highest severity, total organic ground cover was 12% on the Simi fi re and 7% on the Old fi re. According to widely applied dNBR classifi cation breaks (Key and Benson 2006), none of our plots on the Simi fi re were classifi ed as high burn severity.
The ANOVA analysis showed that the four categories of ground cover (organic-uncharred, organic-charred, inorganic-uncharred, and inorganic-charred) were statistically different across the burn severity classes in most cases. On the Simi fi re, the organic-uncharred (F = 13.5, p < 0.0001) and inorganic-charred (F = 4.8, p = 0.01) categories had the greatest change from low severity to moderate-high severity (Table 1). On the Old fi re, all categories of ground data were signifi cantly different across the four burn severity classes, with inorganic-charred exhibiting the greatest difference (F = 24.3, p < 0.0001). These results indicate the four-class dNBR breaks were appropriate for investigating the change in post-fi re organic and inorganic ground cover on both fi res across the range of burn severities.
Correlations Between Ground Data and Remotely Sensed Data
The spectral fractions from the hyperspectral SMA were signifi cantly correlated to the corresponding ground cover fractions (Table 2). The strongest correlation on the Simi fi re was between the green vegetation endmember and the fi eld-measured organic-uncharred ground cover (r = 0.66). Green vegetation was spectrally distinct in the image and well-matched to the green vegetation fi eld spectrum used as an endmember. Charred NPV (organic-charred) had the next highest correlation (r = 0.52). On the Simi fi re, uncharred (r = 0.38) and charred inorganics (r = 0.35), had the
Ground cover categorySimi fi re Old fi re
SMA dNBR RdNBR SMA dNBR RdNBROrganic-uncharred 0.66 -0.65 -0.48 0.36 -0.79 -0.77Organic-charred 0.52 -0.27 -0.11 0.45 -0.17 -0.27Inorganic-uncharred 0.38 0.13 0.36 0.42 -0.48 -0.23Inorganic-charred 0.35 0.47 0.14 0.32 0.72 0.55
Table 2. Pearson correlation coeffi cients (r) comparing measured fi eld-plot ground data to hyperspectral spectral mixture analysis (SMA) and multi-spectral indices dNBR and RdNBR. Bold values are signifi cant at p < 0.05. Organic ground cover refers to green and non-photosynthetic vegetation, while inorganic refers to soil, rock and ash.

Fire Ecology Special IssueVol. 3, No. 1, 2007
Lewis et al.: Mapping Ground Cover Using Hyperspectral Remote SensingPage 120
Figure 5. Scatterplots from the Simi fi re data of the spectral mixture analysis (SMA) estimates versus the organic and inorganic ground cover components. The number of plots is 54 for all graphs.
lowest correlations between the ground and SMA data. Similar correlations were found with the Old fi re data: r = 0.36 for uncharred organics, r = 0.45 for charred organics, r = 0.42 for the uncharred inorganics and r = 0.32 for the charred inorganics (Table 2). These correlations were all statistically signifi cant at p < 0.05.
Scatterplots of each of these relationships are presented in Figure 5 (Simi fi re) and Figure 6 (Old fi re). The scatterplots illustrate the relationship between the ground and imaged fractional cover of each major ground cover component. In Figure 5a, it is clear that there was a signifi cant relationship between organic-charred ground cover and the SMA estimate;

Fire Ecology Special IssueVol. 3, No. 1, 2007
Lewis et al.: Mapping Ground Cover Using Hyperspectral Remote SensingPage 121
Figure 6. Scatterplots from the Old fi re data of the spectral mixture analysis (SMA) estimates versus the organic and inorganic ground cover components. The number of plots is 54 for all graphs.
however, this relationship is not a perfect 1:1. A range of 0 to 55% organic-uncharred ground cover was measured on the ground; however, 30% was the most detected on any of the plots in the image. This same trend was found for the other three ground cover classes—the ranges of data measured on the ground are generally higher than the ranges predicted by the SMA results.
On the Old fi re, the scatterplots illustrate how little organic cover there was on the ground on our fi eld plots (Figures 6a and 6b). The organic ground data are clustered close to the y-axis, with most of the data points falling below 20% organic ground cover. More organic-uncharred ground cover was detected in the image than on the ground. This is likely due to the presence of green tree canopies above

Fire Ecology Special IssueVol. 3, No. 1, 2007
Lewis et al.: Mapping Ground Cover Using Hyperspectral Remote SensingPage 122
some of the plots and in the nearby area. The inorganic ground cover on the plots (Figures 6c and 6d) shows a different trend as the range of inorganic ground cover on the plots is 0-80% for uncharred, and 0 to almost 100% for charred. The maximum amount of inorganic ground cover predicted by the image on any of these plots is 24%. A likely explanation is occluding canopy or shrub vegetation preventing the image from detecting the soil, ash, or rock on these plots.
For comparison, correlations between the ground data and the Landsat-derived dNBR and RdNBR were also calculated (Table 2). As expected, the strongest correlations were found by comparing the satellite imagery to uncharred organics and charred inorganics because of the greater abundance of these cover types in unburned and low burn severity areas and high burn severity areas, respectively. Lower overall correlations were found between the charred organic and uncharred inorganic classes and the dNBR and RdNBR values (Table 2). Charred organics and uncharred inorganics found in mixed quantities across the spectrum of burn severity do not by themselves defi ne a burn severity classifi cation, or the degree of change from pre-fi re conditions. Therefore, we did not expect that these cover types would be highly correlated with indices that indicate degree of change from pre-fi re conditions, such as a burn severity class.
Spectral Mixture Analysis Images
The RMSE was 0.04 or less across both fi re images, indicating that the endmembers used in the spectral unmixing corresponded well to the ground cover types in the images. The SMA results for the Simi fi re for each of the major ground cover components are shown as grayscale images (scale 0-1 where 1 is 100% cover) (Figure 3). This subset is little uncharred vegetation (green or senesced NPV) within the image. Conversely, charred NPV (organic-charred) is extensive throughout
the image. Similarly, there is little uncharred soil (inorganic-uncharred) shown in the image while charred soil, ash, and rock (inorganic-charred) is extensive. In the color composite image, charred NPV (organic-charred) is shown as red, green vegetation (organic-uncharred) as green, and uncharred soil (inorganic-uncharred) as blue. These images are a relatively small subset (~15%) of the Simi fi re, however the full range of burn severity conditions are included, as well as small portions extending outside the burn area at the north and south ends of the image. Charred NPV is present across the entire image, much of it mixed with soil, and shows as a purple or magenta color. The only green vegetation is located in discrete areas, mostly in valley bottoms. Large patches of bright blue are rocky outcrops and the darkest areas are topographic shadows.
The Old fi re burned primarily in interior woodlands with a mix of chaparral. The result was a much greater proportion of burned and unburned vegetation (organic-charred and organic-uncharred) remaining after the Old fi re than after the Simi fi re due to the higher proportion of pre-fi re vegetation (Figure 4). The grayscale images show extensive charred and uncharred vegetation throughout the area. The highlighted areas of organic-charred and organic-uncharred nearly completely cover the image area, indicating little soil or rock being detected in the images. Inorganics, both uncharred and charred, are mostly found within the burned area, because tree canopy occludes the soil in the unburned areas. The pattern of inorganic-charred is close to a mirror image of organic-uncharred. It is relatively easy to distinguish burned and unburned areas in these images. In the color composite, charred NPV (organic-charred) is shown as red, green vegetation (organic-uncharred) as green, and uncharred soil (inorganic-uncharred) as blue. The fi re perimeter is identifi able on the image where the red color within the burned area turns sharply to a green color outside of the burned area.

Fire Ecology Special IssueVol. 3, No. 1, 2007
Lewis et al.: Mapping Ground Cover Using Hyperspectral Remote SensingPage 123
DISCUSSION
The extent to which the ground surface was burned and the amount of remaining organic ground cover are good indicators of the effects of the fi re on the soil surface. Figures 3 and 4 are essentially post-fi re ground cover maps, highlighting exposed mineral soil and the charred components. An assessment of the fi re effects on the soil surface gives a reasonable indication of the potential for hydrologic response. These ground cover maps, combined with topographic data could be helpful immediately after a fi re when BAER teams must determine which areas to treat to mitigate erosion.
None of the fi eld plots on the Simi fi re were classifi ed as high burn severity using published dNBR classifi cation breaks (Key and Benson 2006). dNBR values are normally classifi ed into four categories: unburned (values < 100), low burn severity (100 – 269), moderate burn severity (270 – 659), and high burn severity (660 – 1,300). There are two sub-classes of moderate burn severity that are less commonly used: moderate-low (270 – 439), and moderate-high (440 – 659). These classes were used because none of the fi eld plots on the Simi fi re had dNBR values above 659, even though many of the moderate-high plots had characteristics of higher burn severity (Table 1). There was an average of 37% organic ground cover on the plots burned at low severity and an average of 12% organic ground cover on the plots burned at moderate-high severity. On the moderate-high plots, this leaves nearly 90% of the soil exposed for potential erosion by wind or water. A large percentage of the inorganic component is uncharred on all plots, regardless of burn severity class (Table 1). For post-fi re soil to appear charred, signifi cant combustion and surface soil heating must occur. In much of the Simi fi re area, patchy pre-fi re vegetation resulted in spotty areas of intense fi re and interspace areas of rapid fi re spread.
The steep topography of the Simi fi re area can be seen in Figure 3 from the shading on the north sides of ridges. The Old fi re burned in similarly steep terrain, which is not as obvious from the images. The combination of steep terrain, burned soils, and lack of vegetative cover increases the potential for soil erosion. Our results suggest that a signifi cant amount of vegetative cover was removed by the fi re in some areas and that the soil there likely experienced extended heating, resulting in fi re-induced water repellent soils and reduced infi ltration capacity. We measured a relative infi ltration rate on all sites using a mini-disk infi ltrometer (Decagon Devices Inc., 2003) and found that most of the soils had a very low infi ltration capacity (<1 ml min-1). For reference, a similarly unburned soil will generally have an infi ltration rate of >8 ml min-1 (Lewis et al. 2007).
Much of the Simi fi re area was covered by a combination of charred and uncharred NPV after the fi re. These components were diffi cult to separate both spectrally and in the fi eld. The spectral endmembers appeared to be a mix of charred shrub stem refl ectance and charred soil background refl ectance (Figure 2). Charred soil and charred NPV endmembers were similar with charred NPV (organic-charred) having a stronger relationship between the image and ground data than charred soil (inorganic-charred) (Table 2). The stronger correlation between uncharred organic fi eld component and the SMA results indicates that green vegetation was easy to identify in the image and the spectral endmember was a good match for the image data. One issue with green vegetation remaining in a post-fi re scene is its occlusion of the ground below (Hudak et al. 2007). In an area with extensive remaining canopy vegetation, such as on the Old fi re, the canopy will block the view of the soil surface, resulting in potentially poor correlations between ground cover data and image data. This was an issue with images from the Old fi re because of the dominance of mixed-confer

Fire Ecology Special IssueVol. 3, No. 1, 2007
Lewis et al.: Mapping Ground Cover Using Hyperspectral Remote SensingPage 124
vegetation, rather than the sparse chaparral vegetation generally found in the Simi fi re area. These results are evident on the scatterplots of ground cover versus the SMA estimates. On the plots of the Simi fi re data (Figure 5), the linear regressions show higher slopes than the plots of Old fi re data (Figure 6). This indicates the SMA estimates of ground cover were higher (although still lower overall than the ground cover measures) for the Simi fi re data than for the Old fi re data. This closer estimate is likely the result of less occlusion of the ground from remaining canopy vegetation (canopy cover >1 m high averaged 0-1% on four of six fi eld sites). On the Old fi re, SMA estimates were low for all categories except organic uncharred vegetation. Canopy cover ranged from 1% to 32% on the Old fi re fi eld plots, suggesting the organic uncharred category was refl ective of remaining canopy vegetation.
The sparse ground vegetation on our fi eld plots across the range of burn severity on the Simi fi re and the mixed vegetation on the Old fi re justifi ed the need to explore alternate methodologies other than dNBR for post-fi re mapping. Because of the lack of pre-fi re vegetation or litter to burn, dNBR results were likely skewed by the complete absence of vegetation on some sites regardless of the actual effects of the fi re at that site. To fairly assess the RdNBR relative change index, it must be acknowledged that it is not designed to identify specifi c ground cover types (Miller and Thode 2007). The NBR is derived from a near-infrared band (B4) and a shortwave infrared band (B7), which are highly sensitive to water content of vegetation—changes in live, green vegetation will therefore have the greatest impact on the index values. The dNBR and RdNBR assign a value to the absolute change (dNBR), or relative change (RdNBR), from a pre-fi re to a post-fi re condition. Areas with abundant green or non-photosynthetic (non-charred) vegetation after a fi re are generally unchanged and classifi ed as low burn severity. Areas that have little or
no vegetation remaining and have abundant charred soil and ash have generally undergone a great change and are classifi ed as high burn severity. Therefore, it is reasonable that these cover types had the strongest correlations with the dNBR and RdNBR values (Table 2).
The dNBR and RdNBR values were most strongly correlated to the organic-uncharred and inorganic-charred categories of ground cover, with few signifi cant correlations to the organic-charred and inorganic-uncharred categories (Table 2). These results indicate that the dNBR and RdNBR are good at identifying areas that were relatively unchanged (low burn severity) and signifi cantly changed (high burn severity) after a fi re. These areas are often relatively homogenous, with extensive green tree canopies or conversely, a “moonscape” with widespread charred soil, ash, and black charred vegetation. It is the moderately burned areas with mixed characteristics in the middle of the burn severity spectrum that are more diffi cult to identify using remote sensing. Moderately burned areas are often a mix of burn severity conditions and characteristics. The effects of the fi re on the ground do not always match the effects in the above-ground vegetation, which is most often refl ected in satellite imagery. The correlations between the hyperspectral SMA results and all four organic and inorganic ground cover categories were statistically signifi cant (Table 2), indicating a better ability to discern moderate burn severity effects when compared to the dNBR or RdNBR. It is important to be able to map moderate fi re effects such as uncharred inorganics and charred organics because exposed mineral soil is prone to erosion, even if it is unburned, and organic cover on the soil surface, even if it has been burned, provides soil protection from wind and water. An additional benefi t to using airborne hyperspectral imagery over satellite imagery is the scale at which post-fi re maps can be produced. The hyperspectral imagery used in this study had 4.2-m pixels

Fire Ecology Special IssueVol. 3, No. 1, 2007
Lewis et al.: Mapping Ground Cover Using Hyperspectral Remote SensingPage 125
on the ground compared to 30-m pixels in the satellite imagery. The ability to detect earth-surface components at a fi ner scale improves the accuracy at which post-fi re components and conditions can be mapped.
All correlations between the ground and remotely sensed data would likely be improved if the ground data and the hyperspectral image data were collected simultaneously. Because of logistical and safety concerns and the presence of smoke, ground data and image data are not easily acquired immediately after a fi re, or even at the same time. There was a one-month delay after the ground data were collected before the hyperspectral images were acquired and during this time, the Simi fi re BAER team observed that post-fi re wind and rain events re-distributed white ash, characteristic of complete vegetation combustion (CDF 2003). Hudak et al. (2004) also found weak correlations between similar fi eld and multispectral satellite data across multiple fi res that had burned in a variety of forest vegetation types, and speculated that the time between fi re and the collection of fi eld data was a factor. Hudak et al. (2007) quantitatively determined that time lags contributed to weaker correlations between image indices and fi eld fi re effects across the Simi and Old fi res along with four other wildfi res in Montana and two in Alaska. The inclusion of shaded vegetation and a shaded soil component in the spectral unmixing may have improved correlations due to the steep topography in many places on the Simi fi re. We experimented with a photometric shade endmember (zero refl ectance across all wavebands), but it did not improve correlations between the spectral and fi eld fractional covers; thus, it was not included in the fi nal results. It would have been diffi cult to derive a high-quality shaded soil or vegetation endmember—such an endmember would had to have been derived from the image, and we were hesitant to add a mixed image spectrum to the ‘pure’ fi eld spectra used in the rest of the analysis.
CONCLUSIONS
The endmembers used in the spectral unmixing processes for the Simi and Old fi res were representative of the burned area. There were signifi cant correlations between spectral abundance in the image and fractional cover measured on the ground for each of the endmembers used in the spectral unmixing. The Simi and Old fi res presented unique situations for exploring alternative methods for post-fi re mapping. The chaparral vegetation on both fi res was sparse both pre-and post-fi re, and the Old fi re also burned in woodland vegetation areas, creating conditions shown to be potentially incompatible with the relative change indices dNBR and RdNBR. The spectral unmixing results from the hyperspectral imagery were signifi cantly correlated to all classes of charred and uncharred organics and inorganics. The dNBR was the best indicator of charred inorganics and uncharred organics, while RdNBR had several signifi cant correlations with the ground data, yet did not consistently correlate well with any specifi c ground cover types. Overall, the results of the spectral mixture analysis were slightly better than the dNBR and RdNBR at predicting quantitative ground cover categories rather than burn severity classes.
While hyperspectral data are currently costly to obtain and time consuming to process, they will be useful in future post-fi re assessments as hyperspectral image acquisition and processing becomes more timely and affordable. The fi eld spectra used as endmembers in the Simi and Old fi re analyses will be useful on future fi res in areas with similar vegetation types. The ability to quantify the exposed soil and remaining vegetation provides a useful assessment of the fi re’s effects on the ground surface. In turn, the condition of the soil and the potential for post-fi re hydrologic response can be more accurately assessed.

Fire Ecology Special IssueVol. 3, No. 1, 2007
Lewis et al.: Mapping Ground Cover Using Hyperspectral Remote SensingPage 126
ACKNOWLEDGEMENTS
We would like to thank the US Department of the Interior and Department of Agriculture Forest Service, Joint Fire Science Program (JFSP 03-2-1-02) for funding this project. This research was supported in part by funds provided by the US Department of Agriculture, Forest Service, Rocky Mountain Research Station, to the University of Idaho (03-JV-11222065-279). Troy Hensiek, Jared Yost, Kate Schneider (RMRS) and Carter Stone (University of Idaho) assisted with fi eld data collection, and Jacob Young and Curtis Kvamme (RMRS) with data entry. We sincerely appreciate the support of local natural resources managers and Incident Management Teams in each location.
LITERATURE CITED
Adams, J.B., M.O. Smith, and P.E. Johnson. 1985. Spectral mixture modeling: a new analysis of rock and soil types at the Viking Lander 1 site. Journal of Geophysical Research 91(B8):8098-8112.
AIG (Analytical Imaging and Geophysics, LLC). 2002. ACORN 5.0 User’s Guide. Boulder, Colorado.
Barro, S.C., and S.G. Conard. 1991. Fire effects on California chaparral systems: an overview. Environment International 17(2-3):135-149.
Beyers, J.L. 2004. Postfi re seeding for erosion control: effectiveness and impacts on native plant communities. Conservation Biology 18:947-956.
Cannon, S.H., J.E. Gartner, M.G. Rupert, and J.A. Michael. 2003. Emergency assessment of debris-fl ow hazards from basins burned by the Piru, Simi, and Verdale fi res of 2003, southern California. U. S. Geological Survey Open-File Report 03-481.
California Department of Forestry and Fire Protection (CDF). 2003. Emergency watershed protection assessment, Simi and Verdale incidents. <http://frap.cdf.ca.gov/socal03/reports/SimiVerdaleFinalReport.pdf>. Accessed 30 May 2006.
Clark, J., A. Parsons, T. Zajkowski, and K. Lannom. 2003. Remote sensing imagery support for burned area emergency response teams on 2003 southern California wildfi res. USDA Forest Service Report RSAC-2003-RPT1.
Clark, R.N., G.A. Swayze, K.E. Livo, R.F. Kokaly, T.V. King, J.B. Dalton, J.S. Vance, B.W. Rockwell, T. Hoefen, and R.R. McDougal. 2002. Surface refl ectance calibration of terrestrial imaging spectroscopy data: a tutorial using AVIRIS. Proceedings of the 10th JPL Airborne Sciences Workshop. R.O. Green, editor. Jet Propulsion Laboratory, Pasadena, California. <http://speclab.cr.usgs.gov/PAPERS.calibration.tutorial>. Accessed 23 August 2007.
DeBano, L.F. 2000. The role of fi re and soil heating on water repellency in wildland environments: a review. Journal of Hydrology 231-232:195-206.
Decagon Devices Inc. 2003. Decagon Biophysical Instruments: Mini-disk infi ltrometers. <http://www.decagon.com/instruments/infi lt.html>. Accessed 3 April 2007.
Hanes, T.L. 1977. California chaparral. Pages 417-469 in: M.G. Barbour, and J. Major, editors. Terrestrial Vegetation of California. John Wiley and Sons, New York, New York, USA.
Hubbert, K.R. 2005. Treatment effectiveness monitoring for southern California wildfi res: 2003 to 2004. The Cedar, Grand Prix/Old, Piru, and Padua fi res. <http://www.fs.fed.us/psw/publications/4403/BAEREffectivenessMonitoringSoCA.pdf> Accessed 22 October 2007.

Fire Ecology Special IssueVol. 3, No. 1, 2007
Lewis et al.: Mapping Ground Cover Using Hyperspectral Remote SensingPage 127
Hubbert, K.R., H.K. Preisler, P.M. Wohlgemuth, R.C. Graham, and M.G. Narog. 2006. Prescribed burning effects on soil physical properties and soil water repellency in a steep chaparral watershed, southern California, USA. Geoderma 130:284-298.
Hudak, A.T., P. Morgan, M.J. Bobbitt, A.M.S. Smith, S.A. Lewis, L.B. Lentile, P.R. Robichaud, J.T. Clark, and R.A. McKinley. 2007. The relationship of multispectral satellite imagery to immediate fi re effects. Fire Ecology 3(1):64-90.
Hudak, A.T., P.R. Robichaud, J.B. Evans, J. Clark, K. Lannom, P. Morgan, and C. Stone. 2004. Field validation of Burned Area Refl ectance Classifi cation (BARC) products for post-fi re assessment. In: J. Greer, editor. Remote Sensing for Field Users. Proceedings of the Tenth Forest Service Remote Sensing Applications Conference. USDA Forest Service, Salt Lake City, Utah, 5-9 April 2004.
Ice, G.G., D.G. Neary, and P.W. Adams. 2004. Effects of wildfi re on soils and watershed processes. Journal of Forestry 102(6):16-20.
Jia, G.J., I.C. Burke, A.F.H. Goetz, M.R. Kaufmann, and B.C. Kindel. 2006. Assessing spatial patterns of forest fuel using AVIRIS data. Remote Sensing of Environment 102:318-327.
Keeley, J.E. 2000. Chaparral. Pages 203-205 in: M.G. Barbour and W.D. Billings, editors. North American Terrestrial Vegetation. Second edition. Cambridge University Press, United Kingdom.
Keeley, J.E. 2006. Evolution of plant adaptations. Pages 350-390 in: N.G. Sugihari, J.W. van Wagtendonk, J. Fites-Kaufman, K.E. Shaffer, and A.E. Thode, editors. Fire Ecology of California’s Ecosystems. University of California Press, Berkeley, California, USA.
Keeley, J.E., and C.J. Fotheringham. 2001. History and management of crown-fi re ecosystems: a summary and response. Conservation Biology 15:1561-1567.
Kennedy, R.E., and W.B. Cohen. 2003. Automated designation of tie-points for image-to-image coregistration. International Journal of Remote Sensing 24:3467–3490.
Key, C.H., and N.C. Benson. 2006. Landscape assessment: sampling and analysis methods. Pages 219-273 in: D.C Lutes, editor. FIREMON: Fire Effects Monitoring and Inventory System. USDA Forest Service General Technical Report RMRS-GTR-164-CD.
Kokaly, R.F., B.W. Rockwell, S.L. Haire, and T.V.V. King. 2007. Characterization of post-fi re surface cover, soils, and burn severity at the Cerro Grande fi re, New Mexico, using hyperspectral and multispectral remote sensing. Remote Sensing of Environment 106:305-325.
Lentile, L.B., Z.A. Holden, A.M.S. Smith, M.J. Falkowski, A.T. Hudak, P. Morgan, S.A. Lewis, P.E. Gessler, and N.C. Benson. 2006. Remote sensing techniques to assess active fi re characteristics and post-fi re effects. International Journal of Wildland Fire 15:319-345.
Lewis, S.A., P.R. Robichaud, B.E. Frazier, J.Q. Wu, and D.Y.M. Laes. In press. Using hyperspectral imagery to predict post-wildfi re soil water repellency. Geomorphology.
Lewis, S.A., J.Q. Wu, and P.R. Robichaud. 2006. Assessing burn severity and comparing soil water repellency, Hayman fi re, Colorado. Hydrological Processes 20:1-16.
Lutes, D.C., R.E. Keane, J.F. Caratti, C.H. Key, N.C. Benson, S. Sutherland, and L.J. Gangi. 2006. In: D.C Lutes, editor. FIREMON: Fire effects monitoring and inventory system. USDA Forest Service General Technical Report RMRS-GTR-164-CD.
McCullough, D.G., R.A. Werner, and D. Neumann. 1998. Fire and insects in northern and boreal forest ecosystems of North America. Annual Review of Entomology 43:107-127.
Miller, J.D., and A.E. Thode. 2007. Quanifying burn severity in a heterogeneous landscape with a relativized version of the delta Normalized Burn Ratio (dNBR). Remote Sensing of Environment 109:66-80.

Fire Ecology Special IssueVol. 3, No. 1, 2007
Lewis et al.: Mapping Ground Cover Using Hyperspectral Remote SensingPage 128
Miller, J. D., and S.R. Yool. 2002. Mapping forest post-fi re canopy consumption in several overstory types using Landsat TM and ETM data. Remote Sensing of Environment 82:481-496.
Ravi, S., P. D’Odorico, B. Herbert, T. Zobeck, and T.M. Over. 2006. Enhancement of wind erosion by fi re-induced water repellency. Water Resources Research 42(11):1-9.
Roberts, D.A., M.O. Smith, and J.B. Adams. 1993. Green vegetation, nonphotosynthetic vegetation and soils in AVIRIS data. Remote Sensing of Environment 44:255-269.
Robichaud, P.R. 2000. Fire effects on infi ltration rates after prescribed fi re in northern Rocky Mountain forests, USA. Journal of Hydrology 231-232:220-229.
Robichaud, P.R., S.A. Lewis, D.Y.M. Laes, A.T. Hudak, R.F. Kokaly, and J.A. Zamudio. 2007. Postfi re soil burn severity mapping with hyperspectral image unmixing. Remote Sensing of Environment 108(4):467-480.
Robichaud, P.R., J.L. Beyers, and D.G. Neary. 2000. Evaluating the effectiveness of postfi re rehabilitation treatments. USDA Forest Service General Technical Report RMRS-GTR-63.
SAS Institute Inc. 1999. SAS/STAT User’s Guide, Volume 1, Version 8.2. Statistical Analysis Systems (SAS) Institute Inc., Cary, North Carolina.
Savage, M. 1997. The role of anthropogenic infl uences in a mixed-conifer forest mortality episode. Journal of Vegetation Science 8(1):95-104.
Smith, M.O., S.L. Ustin, J.B. Adams, and A.R. Gillespie. 1990. Vegetation in deserts: I. a regional measure of abundance from multi-spectral images. Remote Sensing of Environment 31:1-26.
Theseira, M.A., G. Thomas, J.C. Taylor, F. Gemmell, and J. Varjo. 2003. Sensitivity of mixture modeling to end-member selection. International Journal of Remote Sensing 24(7):1559-1575.
US Department of Agriculture (USDA). 2006. Soil survey for Ventura area, California. <http://websoilsurvey.nrcs.usda.gov/app/WebSoilSurvey.aspx>. Accessed 13 March 2007.
Copyright © 2022 FDOKUMEN