Spectral matching approaches in hyperspectral image processing PLEASE SCROLL DOWN FOR...
36
This article was downloaded by: [Anna University] On: 07 December 2014, At: 19:08 Publisher: Taylor & Francis Informa Ltd Registered in England and Wales Registered Number: 1072954 Registered office: Mortimer House, 37-41 Mortimer Street, London W1T 3JH, UK International Journal of Remote Sensing Publication details, including instructions for authors and subscription information: http://www.tandfonline.com/loi/tres20 Spectral matching approaches in hyperspectral image processing S. Shanmugam a & P. SrinivasaPerumal a a Department of Geology, Anna University, Chennai, India Published online: 04 Dec 2014. To cite this article: S. Shanmugam & P. SrinivasaPerumal (2014) Spectral matching approaches in hyperspectral image processing, International Journal of Remote Sensing, 35:24, 8217-8251, DOI: 10.1080/01431161.2014.980922 To link to this article: http://dx.doi.org/10.1080/01431161.2014.980922 PLEASE SCROLL DOWN FOR ARTICLE Taylor & Francis makes every effort to ensure the accuracy of all the information (the “Content”) contained in the publications on our platform. However, Taylor & Francis, our agents, and our licensors make no representations or warranties whatsoever as to the accuracy, completeness, or suitability for any purpose of the Content. Any opinions and views expressed in this publication are the opinions and views of the authors, and are not the views of or endorsed by Taylor & Francis. The accuracy of the Content should not be relied upon and should be independently verified with primary sources of information. Taylor and Francis shall not be liable for any losses, actions, claims, proceedings, demands, costs, expenses, damages, and other liabilities whatsoever or howsoever caused arising directly or indirectly in connection with, in relation to or arising out of the use of the Content. This article may be used for research, teaching, and private study purposes. Any substantial or systematic reproduction, redistribution, reselling, loan, sub-licensing, systematic supply, or distribution in any form to anyone is expressly forbidden. Terms & Conditions of access and use can be found at http://www.tandfonline.com/page/terms- and-conditions
-
Upload
independent -
Category
Documents
-
view
1 -
download
0
Transcript of Spectral matching approaches in hyperspectral image processing PLEASE SCROLL DOWN FOR...

This article was downloaded by: [Anna University]On: 07 December 2014, At: 19:08Publisher: Taylor & FrancisInforma Ltd Registered in England and Wales Registered Number: 1072954 Registeredoffice: Mortimer House, 37-41 Mortimer Street, London W1T 3JH, UK
International Journal of RemoteSensingPublication details, including instructions for authors andsubscription information:http://www.tandfonline.com/loi/tres20
Spectral matching approaches inhyperspectral image processingS. Shanmugama & P. SrinivasaPerumalaa Department of Geology, Anna University, Chennai, IndiaPublished online: 04 Dec 2014.
To cite this article: S. Shanmugam & P. SrinivasaPerumal (2014) Spectral matching approaches inhyperspectral image processing, International Journal of Remote Sensing, 35:24, 8217-8251, DOI:10.1080/01431161.2014.980922
To link to this article: http://dx.doi.org/10.1080/01431161.2014.980922
PLEASE SCROLL DOWN FOR ARTICLE
Taylor & Francis makes every effort to ensure the accuracy of all the information (the“Content”) contained in the publications on our platform. However, Taylor & Francis,our agents, and our licensors make no representations or warranties whatsoever as tothe accuracy, completeness, or suitability for any purpose of the Content. Any opinionsand views expressed in this publication are the opinions and views of the authors,and are not the views of or endorsed by Taylor & Francis. The accuracy of the Contentshould not be relied upon and should be independently verified with primary sourcesof information. Taylor and Francis shall not be liable for any losses, actions, claims,proceedings, demands, costs, expenses, damages, and other liabilities whatsoever orhowsoever caused arising directly or indirectly in connection with, in relation to or arisingout of the use of the Content.
This article may be used for research, teaching, and private study purposes. Anysubstantial or systematic reproduction, redistribution, reselling, loan, sub-licensing,systematic supply, or distribution in any form to anyone is expressly forbidden. Terms &Conditions of access and use can be found at http://www.tandfonline.com/page/terms-and-conditions

REVIEW ARTICLE
Spectral matching approaches in hyperspectral image processing
S. Shanmugam and P. SrinivasaPerumal*
Department of Geology, Anna University, Chennai, India
(Received 30 April 2014; accepted 4 October 2014)
Many spectral matching algorithms, ranging from the traditional clustering techniquesto the recent automated matching models, have evolved. This paper provides a reviewand up-to-date information on the past and current role of the spectral matchingapproaches adopted in hyperspectral satellite image processing. The need for spectralmatching has been deliberated and a list of spectral matching algorithms has beencompared and described. A review of the conventional spectral angle measures and theadvanced automated spectral matching tools indicates that, for better performance oftarget detection, there is a need for combining two or more spectral matching techni-ques. From the studies of several authors, it is inferred that continuous improvement inthe matching techniques over the past few years is due to the need to handle andanalyse hyperspectral image data for various applications. The need to develop a well-built and specialized spectral library to accommodate the resources from enormousspectral data is suggested. This may improve accuracy in mineral and soil mapping,vegetation species identification and health monitoring, and target detection. Thefuture role of cloud computing in accessing globally distributed spectral libraries andperforming spectral matching is highlighted. Rather than inferring that a particularmatching algorithm is the best, this paper points out the requirements of an idealalgorithm. With increasing usage of hyperspectral data for resources mapping, thereview presented in this paper will certainly benefit the large and emerging communityof hyperspectral image users.
1. Introduction
Spectral research is the detailed analysis and interpretation of the spectra of materials.Spectral signatures define the characteristics of objects based on their absorptance,reflectance, and transmittance of electromagnetic radiation. Several spectroscopic techni-ques are available to interpret such spectral signatures. With the advent of hyperspectraldata, the dimension of research on spectral signatures and spectral matching is undergoingimmense improvization. Govender, Chetty, and Bulcock (2007), in their review onhyperspectral remote sensing for vegetation and water studies, stated that although multi-spectral imagery is useful to discriminate land surface features and landscape patterns,detailed signatures from hyperspectral imagery allow for the identification and character-ization of materials. The large amount of spectral data produced by hyperspectral imagingnecessitates the development of automated techniques that convert imagery directly tothematic maps (Vishnu, Nidamanuri, and Bremananth 2013). Hyperspectral image datasuch as the Airborne Visible/Infrared Imaging Spectrometer (AVIRIS), Compact AirborneSpectrographic Imagers (CASI) I and II, EO-1 Hyperion, Hyperspectral Digital ImageryCollection Experiment (HYDICE), and Moderate Resolution Imaging Spectroradiometer
*Corresponding author. Email: [email protected]
International Journal of Remote Sensing, 2014Vol. 35, No. 24, 8217–8251, http://dx.doi.org/10.1080/01431161.2014.980922
© 2014 Taylor & Francis
Dow
nloa
ded
by [
Ann
a U
nive
rsity
] at
19:
08 0
7 D
ecem
ber
2014
(MODIS) are constantly used in spectral matching studies. Besides, specialized hyper-spectral data sets for ocean studies (Portable Hyperspectral Imaging Low-LightSpectrometer (PHILLS), Hyperspectral Imager for the Coastal Ocean (HICO)) and forplanetary studies (OMEGA/Mars Express, Moon Mineralogy Mapper (M3)) are now inuse. With all these advanced developments, there is a need to review the aspects ofspectral matching, which is realized as a potential tool for effective utilization of thesehyperspectral resources. Hence, this paper aims to provide an extensive review on spectralmatching, algorithms and analyses the components and factors influencing their matchingperformance.
A pioneering work on spectral matching is that by Fabian (1967), who developed animaging system for agricultural surveying purposes. This work involved the developmentof x-y light-pen spectrum-matching schemes and subsequent extraction of the signaturesof vegetation types of interest. This work also discussed the confusion that occurs whileidentifying crops of similar spectral characteristics, the occurrence of false alarms, and theneed to reduce matching errors due to illumination.
The availability of abundant spectral data from laboratory and field-based spectro-radiometry and hyperspectral imagery has led to the development of diverse spectraldatabases that are utilized in varied applications. This repository of spectral signatures,called ‘spectral libraries’, further facilitates the spectral matching process. Apart fromstandard spectral libraries such as that of the United Stated Geological Survey (USGS),many research-oriented libraries such as those of the Jet Propulsion Laboratory (JPL),Johns Hopkins University (JHU), and the United Nations Educational Scientific andCultural Organization (UNESCO) have been created.
The need to speed up the search-and-match process using large spectral libraries hasresulted in the automation of matching techniques. Automation algorithms perform wellbecause they look for specific, spectrally defined targets (Manolakis et al. 2009). In arecent work, Parshakov (2012) stated that spectral matching techniques are well suited forautomation due to their ability to map data from different sensors coupled with thereduced need for additional data about the study area.
Spectral matching approaches are classified as (i) similarity match and (ii) identitymatch. In identity match, a match for the unknown spectra is assumed to be present in thespectral library, while in similarity match, the unknown spectra are not available in thespectral library for matching. The matching approaches are further classified as (i)deterministic and (ii) stochastic (Vishnu, Nidamanuri, and Bremananth 2013). In thedeterministic type, algorithms are based on the geometrical and physical aspects of theunknown and reference spectra. These include the Euclidean Distance Measure (ED),Spectral Angle Mapper (SAM), Spectral Correlation Measure (SCM), Binary Encoding(BE), and Spectral Feature Fitting (SFF) techniques. Stochastic algorithms based on thedistributions of the spectral reflectance of target pixels include Spectral InformationDivergence (SID) and Constrained Energy Minimization (CEM).
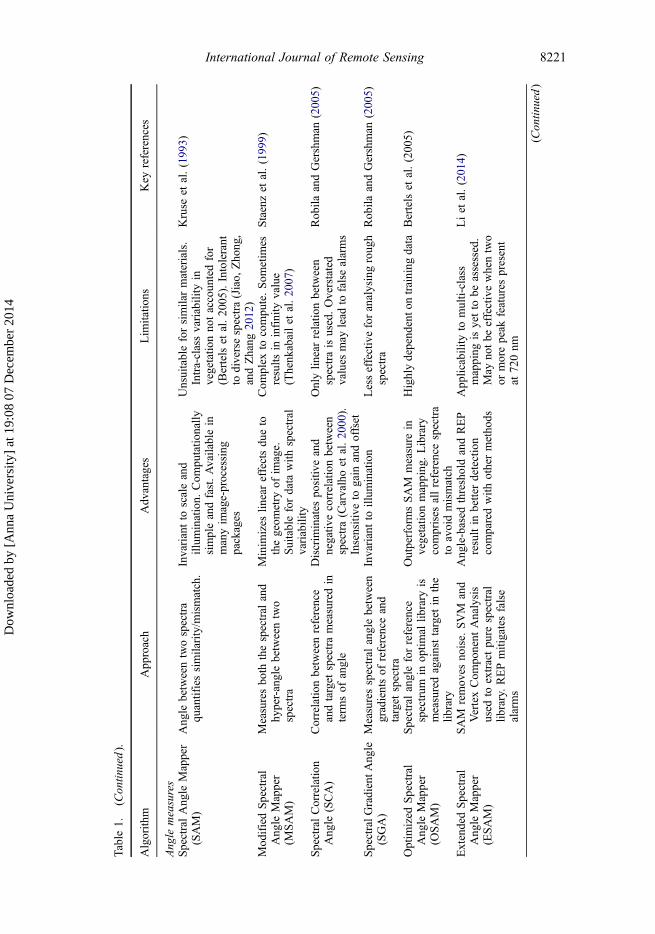
To accommodate the influencing factors (spectral library, absorption features, a prioriknowledge, false hits) and improve performance, a phenomenal evolution of spectralmatching approaches has occurred, resulting in variants of the basic algorithms. Forexample, in the traditional, deterministic technique – Spectral Angle Mapper (Kruseet al. 1993) – similarity is assessed based on the angle between the reference and targetspectra. By including the hyper-angle measure, a variant of SAM called Modified SpectralAngle Mapper (MSAM) (Staenz et al. 1999) resulted in improved accuracy by decreasingthe illumination effects. Similarly, Spectral Correlation Angle (SCA) and SpectralGradient Angle (SGA) approaches, proposed by Robila and Gershman (2005), utilize
8218 S. Shanmugam and P. SrinivasaPerumal
Dow
nloa
ded
by [
Ann
a U
nive
rsity
] at
19:
08 0
7 D
ecem
ber
2014
the correlation coefficient and gradients in terms of the angle. The correlation coefficient,being a better descriptor of the spectra, led to better performance of SCA in comparisonwith SAM. Implementing the SAM measure for an optimal spectral library resulted in theOptimal Spectral Angle Mapper (Luc et al. 2005). In the Extended Spectral Angle Mapper(ESAM) proposed by Li et al. (2014), false alarms are detected using the red edgeposition. SAM also proved to be a good contributor when used in combination withother approaches. When combined with spectral information divergence measures such asSAM-SID (Du et al. 2004), with amplitude difference measure as Normalized SpectralSimilarity Score (NS3) (Nidamanuri and Zbell 2011a) and Jeffries–Matusita distance asJM-SAM (Padma and Sanjeevi 2014), the SAM approach yielded better accuracy inmatching targets. A detailed listing of several matching approaches and a discussion ontheir advantages and limitations is presented in Table 1.
2. Applications of spectral matching
The advent of spectral matching approaches has widened the scope of hyperspectralremote sensing. Major domains such as image classification, band selection, and targetdetection have benefitted from these approaches. Matching techniques are used to matchclass spectra with the ideal spectra for several applications such as identification of croptype and plant species, and mineral exploration (Thenkabail et al. 2007). These techni-ques have increased the precision and accuracy of hyperspectral image classificationcompared with the multispectral classifiers which are affected by the Hughes phenom-enon of hyperspectral data (Xie et al. 2011). Spectral matching can also assist in theselection of pure pixels (end-members) in a scene for a given target material and it alsosearches the spectral libraries for specific targets (Schwarz and Staenz 2001).Furthermore, end-member extraction and material abundance estimation, which areconsidered as the challenges of hyperspectral image processing, can be automatedusing spectral matching techniques. Gupta and Rajan (2010) used matching algorithmssuch as Euclidean distance, Dynamic Time Warping, Derivative Dynamic TimeWarping, and Constrained Dynamic Time Warping to study the temporal shifts invegetation and crops from pixel to pixel, based on geographical location. Apart fromthe above, spectral matching aids in oil spill detection (Andreoli et al. 2007), discrimi-nating salt-affected soils (Farifteh, Van Der Meer, and Carranza 2007), bathymetrymodelling for ocean studies (Ma et al. 2014), and lithological mapping (Zhang and Li2014). Furthermore, spectral matching in planetary remote sensing was demonstrated byEvans (2007), who used the spectral correlation algorithm to map lunar geologicalfeatures. In another study by Zhu et al. (2006), Spectral Angle Mapper and SpectralFeature Fitting algorithms were used to identify lithological units on the surface of Marsusing OMEGA/Mars Express data. Cahill et al. (2010) implemented Spectral FeatureFitting and Spectral Correlation-based matching and analysed the highland and maresoils of the lunar surface using M3 imagery acquired by Chandrayaan-1. Thus, it will beseen that the number of applications and the quality of feature detection approachesusing hyperspectral images have increased with the advent of several spectral matchingalgorithms.
3. Factors influencing the performance of spectral matching algorithms
Analysis of several studies on spectral matching approaches has provided an insight intothe factors that influence their performance. These approaches have evolved from simple
International Journal of Remote Sensing 8219
Dow
nloa
ded
by [
Ann
a U
nive
rsity
] at
19:
08 0
7 D
ecem
ber
2014

Table
1.Salient
features
ofthespectral
matchingapproaches
used
inhy
perspectralremotesensing.
Algorith
mApp
roach
Adv
antages
Lim
itatio
nsKey
references
Distancemeasures
Euclid
eanDistance
(ED)
Com
putesdistance
betweentwo
spectra
Com
putatio
nally
simple.
Sensitiv
eto
differencesin
DN.
Tem
poralshiftsin
spectraare
notcaptured
Com
plex
whenDN
andnu
mber
ofbandsarelarge
Gow
er(198
5)
Dot
Produ
ct(D
P)
Cosineof
anglebetween
unkn
ownandlib
rary
spectrais
compu
ted
Treatsintensity
differencesin
acontinuo
usmanner.Assigns
maxim
umvaluewhenspectra
areidentical
Unsuitableforlargelib
raries.
Spu
riou
speaksov
erlapuseful
peaks
Stein
andScott(199
4)
Least-Squ
ares
Minim
ization(LSM)
Com
putesleast-squaresdistance
Accuratewhenused
with
look
-up
table
Loo
k-up
tablemustcontain
accurately
calib
ratedspectra
Mob
leyet
al.(200
5)
Normalized
Com
pression
Distance(N
CD)
Distancebetweenspectrais
measuredby
astandard
compressor
Resistant
tono
ise.
Requiresless
inform
ationon
data.
Com
patib
lewith
diversedata.
Resolvessimilarity
between
unclearpo
rtions
ofspectra
Depends
oninternal
parameters
ofthecompressor
Cerra
etal.(2011)
Adaptiveversionof
CICR
(dCICR)
Com
binescontinuu
mremov
edandcontinuu
mintact
spectra
Suitableto
characterize
minor,
major,andcombined
absorptio
nfeatures
Spectralvectorsto
bechosen
carefully
toavoidspurious
features
Bue,Merenyi,andCsatho
(201
0)
Z-Score
Distance(ZSD)Differencebetweenreference
spectrum
andclassmean
comparedto
standard
deviation
Perform
swell.Accurate
discriminationof
similar
vegetatio
n.Autom
ated
labelling
capability
Atm
osph
eric
correctio
ninfluences
accuracy.Suitability
forno
n-vegetatio
ntargetsno
tassessed
Parshakov
(201
2)
Mahalanob
isDistance
(MD)
Com
putesstatistical
distance
betweenareferencespectral
vector
andmultiv
ariate
distribu
tionof
points
Works
wellforno
isyspectra.
Employ
edforaccurateretrieval
ofinherent
optical
prop
erties
(IOPs)
Com
putatio
nally
complex
dueto
theinclusionof
additio
nal
covariance
matrix
Gillis,Bow
les,andMoses
(201
3)
(Con
tinued)
8220 S. Shanmugam and P. SrinivasaPerumal
Dow
nloa
ded
by [
Ann
a U
nive
rsity
] at
19:
08 0
7 D
ecem
ber
2014
Table
1.(Con
tinued).
Algorith
mApp
roach
Adv
antages
Lim
itatio
nsKey
references
Ang
lemeasures
SpectralAng
leMapper
(SAM)
Ang
lebetweentwospectra
quantifiessimilarity/m
ismatch.Invariantto
scaleand
illum
ination.
Com
putatio
nally
simpleandfast.Availablein
manyim
age-processing
packages
Unsuitableforsimilarmaterials.
Intra-classvariability
invegetatio
nno
taccoun
tedfor
(Bertelset
al.20
05).Intolerant
todiversespectra(Jiao,
Zho
ng,
andZhang
2012
)
Kruse
etal.(199
3)
Mod
ifiedSpectral
Ang
leMapper
(MSAM)
Measuresbo
ththespectral
and
hyper-anglebetweentwo
spectra
Minim
izes
lineareffectsdu
eto
thegeom
etry
ofim
age.
Suitablefordata
with
spectral
variability
Com
plex
tocompu
te.Som
etim
esresults
ininfinity
value
(Thenk
abailet
al.20
07)
Staenzet
al.(199
9)
SpectralCorrelatio
nAng
le(SCA)
Correlatio
nbetweenreference
andtarget
spectrameasuredin
term
sof
angle
Discrim
inates
positiv
eand
negativ
ecorrelationbetween
spectra(Carvalhoet
al.20
00).
Insensitive
togain
andoffset
Onlylin
earrelatio
nbetween
spectraisused.Overstated
values
may
lead
tofalsealarms
Rob
ilaandGershman
(200
5)
SpectralG
radientA
ngle
(SGA)
Measuresspectral
anglebetween
gradientsof
referenceand
target
spectra
Invariantto
illum
ination
Lesseffectiveforanalysingroug
hspectra
Rob
ilaandGershman
(200
5)
Optim
ized
Spectral
Ang
leMapper
(OSAM)
Spectralangleforreference
spectrum
inop
timal
library
ismeasuredagainsttarget
inthe
library
OutperformsSAM
measure
invegetatio
nmapping
.Library
comprises
allreferencespectra
toavoidmismatch
Highlydepend
ento
ntraining
data
Bertelset
al.(200
5)
ExtendedSpectral
Ang
leMapper
(ESAM)
SAM
remov
esno
ise.
SVM
and
VertexCom
ponent
Analysis
used
toextractpu
respectral
library.REPmitigatesfalse
alarms
Ang
le-based
thresholdandREP
resultin
betterdetection
comparedwith
othermetho
ds
App
licability
tomulti-class
mapping
isyetto
beassessed.
May
notbe
effectivewhentwo
ormorepeak
features
present
at72
0nm
Liet
al.(201
4)
(Con
tinued)
International Journal of Remote Sensing 8221
Dow
nloa
ded
by [
Ann
a U
nive
rsity
] at
19:
08 0
7 D
ecem
ber
2014

Table
1.(Con
tinued).
Algorith
mApp
roach
Adv
antages
Lim
itatio
nsKey
references
Correlatio
nmeasures
Cross-Correlogram
SpectralMatcher
(CCSM)
Cross-correlatio
nat
different
match
positio
nsin
testand
referencespectraare
calculated
Com
paresmaterialsof
different
albedo
s.‘U
niform
’no
ise
compo
nent
isno
tpresentin
the
results
Subtle
spectral
differencesnot
considered.Abilityto
resolve
issueof
mixed
pixelsisno
tassessed
Van
Der
MeerandBakker
(199
7)
CCSM
Con
tinuu
m-
Rem
oved
Algorith
m(CR-CCSM)
Cross-correlatio
nisassessed
betweencontinuu
mremov
edandreferencespectra
Sub
tlespectral
differences
identified.
Preserves
theshapes
ofcross-correlog
rams
Non-diagnostic
noisefeatures
enhanced
with
absorptio
nfeatures
Van
Der
Meer(200
0)
d CICRCCSM
Com
binescontinuu
m-rem
oved
(CR)andcontinuu
m-intact
(CI)characteristics
Perform
sbetteras
itconsiders
absorptio
nfeatureand
continuu
m-rem
oved
spectra
Apriorikn
owledg
erequ
ired
tolabelmaterials
Bue,Merenyi,andCsatho
(200
9)
Encod
ingmeasures
BitMap
Index-Based
Matching
XORlogicalop
erationused
toassess
similarity
between
know
nandun
know
nderivativ
espectra
Fastandfeasible
processing
Mixed
pixelisno
tconsidered.
App
ropriate
binsize
andbits
representatio
nof
spectral
derivativ
erequ
ired
for
matching
Kim
(2011)
New
BinaryEncod
ing
Algorith
mIm
prov
ised
BinaryEncod
ing
(Scott19
88).Spectraland
spatialdescriptorsof
region
arebinary
codedandmatched
with
target
code
using
Ham
mingdistance
measure
Spatialdescriptorsprevent
mismatch
incase
ofsimilar
spectra.
Improv
edstorageof
hyperspectralinform
ation.
Apriorikn
owledg
erequ
ired
toextractshapedescriptors.Loss
ofradiom
etricinform
ation
during
encoding
ofspectra
Xie
etal.(2011)
Feature-based
matchingmeasures
SpectralFeature
Fitting
(SFF)
Absorptionfeature-based
techniqu
ethat
uses
least-
squarestechniqu
e
Sensitiv
ityto
unique
absorptio
nfeatures
allowsaccurate
identification.
Minim
izes
effectsof
grainsize
variations
andillum
ination(W
arner,
Nellis,andFoo
dy20
09).
Availablein
expertsystem
s
Entirespectrum
isno
tutilizedfor
matching.
Noise
andnatural
variations
resultin
features
similarto
absorptio
n
Clark,Gallagh
er,and
Swayze
(199
0)
(Con
tinued)
8222 S. Shanmugam and P. SrinivasaPerumal
Dow
nloa
ded
by [
Ann
a U
nive
rsity
] at
19:
08 0
7 D
ecem
ber
2014

Table
1.(Con
tinued).
Algorith
mApp
roach
Adv
antages
Lim
itatio
nsKey
references
Multi-Range
Spectral
Feature
Fitting
(MRSFF)
Com
putesleast-squaresgo
odness
offitof
multip
leabsorptio
nfeatures
forbestmatching
Entirespectrum
isutilizedand
multip
lefeatures
are
characterizedin
different
wavelengths
Mismatch
dueto
spectraof
certainmaterialsbeingsimilar
inaspecific
wavelengthrang
ebu
tdifferentin
another
Clark
etal.(200
3)
SpectralCurve
Fitting
(SCF)
Atwo-step
automated
procedure
invo
lvingderivativ
epeak
find
inganditerativ
eleast-
squaresfitting
Utilizes
prom
inentabsorptio
npeaksof
derivativ
espectra.
Preserves
shapeof
thespectra
andissuitedto
automated
mineral
expertsystem
s
Extra
peaksdu
eto
interpolation
overlapreal
peaks.Lacks
continuu
mmod
ellin
gas
only
absorptio
nfeatures
are
analysed.Lim
itedto
SWIR
region
Brown(200
6)
Com
binedVariable-
Interval
Spectral
Average
(VISA)
metho
dandSpectral
Curve
Matching
(SCM)
Spectralfeatures
detected
from
thetarget
spectraby
VISA
methodarematched
with
alib
rary
spectrum
usingSCM
Highprecisionin
identifying
mixed
pixelsas
itutilizes
multi-scalesalient
features
and
shapecharacteristicsof
the
pixel
Onlysign
ificantvariations
inthe
spectrum
aredetected
for
fitting
.There
isapo
tentialfor
inclusionof
variations
dueto
noise
Kum
aret
al.(201
4)
Inform
ationmeasures
Con
strained
Energy
Minim
ization(CEM)
Respo
nseof
target
spectrais
maxim
ized
bysuppressing
backgrou
ndspectra
Detectsonetarget
source
ata
time.Perform
sbetterthan
SSV
andMSAM
(Hom
ayouni
and
Rou
x20
04).
Sensitiv
eto
noise.Resultsin
false
alarms.Detectio
nof
small
targetsdifficult.Lesssensitive
toshapeof
spectra(Frolovand
Smith
1999).Lessadaptiv
eto
imagecomplexity
Harsany
i(199
3)
(Con
tinued)
International Journal of Remote Sensing 8223
Dow
nloa
ded
by [
Ann
a U
nive
rsity
] at
19:
08 0
7 D
ecem
ber
2014

Table
1.(Con
tinued).
Algorith
mApp
roach
Adv
antages
Lim
itatio
nsKey
references
AdaptiveCosine
Estim
ator
(ACE)
Derived
from
theGeneralized
Likelihoo
dRatio.Uses
covariance
matrixto
identify
thebackgrou
ndandcompu
tetheratio
Invariantto
scalingof
spectra.
Con
stantfalsealarm
onscaling
(ENVIClassic
Tutorial20
14)
Rob
ustfortarget
mismatch,
variability
andbackgrou
ndinterference.Fits
reflectance
andradiance
domains
(Manolakiset
al.20
09)
Prior
know
ledg
eof
training
data
requ
ired
forcompu
ting
covariance
matrix.
Detectio
nis
poor
inthepresence
ofno
ise
(Guo
andOsher
2011)
Kraut
andScharf(199
9)
Locally
AdaptiveCEM
(LCEM)
Mod
ifiedCEM.Sam
ple
correlationmatrixisdesign
edfortarget
spectrum
and
standard
CEM
operator
isapplied
Improv
eddetectionof
small
targetsin
complex
backgrou
nddu
eto
spectral
variability
factor.Moreadaptiv
eto
image
content
Lossof
inform
ationdu
ring
matrix
compu
tatio
n.Detectio
nis
difficultwhentarget
isdo
minantin
prop
ortio
n
FrolovandSmith
(199
9)
SpectralInform
ation
Divergence(SID
)Derived
from
divergence
inform
ationtheory.Measures
prob
ability
ofspectral
discrepancy
Betterqu
antificationof
similarity
than
spectral
angle
(Nidam
anuriandZbell20
10).
Highdimension
alim
ages
accommod
ated
with
outdata
redu
ndancy
approach
(Vishn
u,Nidam
anuri,andBremananth
2013)
Works
mainlyformixed-pixel
target
spectra.
Sho
wsa
confused
dend
ogram
when
used
foracompression
process
(Cerra
etal.20
11)
Chang
(200
0)
Com
binedmeasures
SpectralSim
ilarity
Value
(SSV)
Com
binesSpectralCorrelatio
nSim
ilarity
(SCS)andED
Shape
anddistance
used
toassess
similarity.Unambigu
ousED
resolved
byshapemeasure.
OutperformsSCS,ED,and
MSAM
(Thenk
abailet
al.
2007).
Statistical
inform
ationon
spectral
band
smay
notbe
utilized
GranahanandSweet(200
1)
(Con
tinued)
8224 S. Shanmugam and P. SrinivasaPerumal
Dow
nloa
ded
by [
Ann
a U
nive
rsity
] at
19:
08 0
7 D
ecem
ber
2014

Table
1.(Con
tinued).
Algorith
mApp
roach
Adv
antages
Lim
itatio
nsKey
references
HiddenMarko
vMod
el-
Based
Divergence
(HMMID
)
Statistical
measure
ofinform
ationon
distance
betweentwoHMM-m
odelled
spectra
Higherdiscriminability
than
SAM,ED,andSID
dueto
characterizatio
nof
unob
served
spectral
prop
ertiesof
apixel
Com
putatio
nisdifficultfor
complicated
spectrum
.Results
inincreasedhidd
enstates
DuandChang
(200
1)
SpectralInform
ation
Divergence-Spectral
Ang
leMapper
(SAM-SID
)
Com
binesdeterm
inistic
SAM
andstochastic
SID
approaches
inTanandSin
Spectraldiscriminability
is5and
2tim
eshigh
erthan
individu
alSAM
andSID
,respectiv
ely.
Utilizes
band
-wisespectral
inform
ation
Quantitativ
eanglemeasure
isinsufficient
tocomplem
entthe
qualitativ
einform
ationfrom
SID
Duet
al.(200
4)
SpectralInform
ation
Divergence-Spectral
Correlatio
nAng
le(SID
-SCA)
Hyb
ridof
SID
andSCA
measuresTan
andSine
versions.
SCA
results
inhigh
erdiscriminatorypo
wer
ofSID
-SCA
than
SID
-SAM
hybrid
measure
Sensitiv
ityof
SCA
tocertain
wavelengths
affectsresults.
The
sine
versionisno
tconsidered
dueto
lower
similarity
values
NareshKum
aret
al.(2011)
Normalized
Spectral
Sim
ilarity
Score
(NS3)
Com
binesspectral
angleand
amplitu
dedifference
between
referenceandtarget
spectra
Spectralvariability
iscaptured
with
high
accuracy
byinclud
ingam
plitu
deparameter
False-positives/negativ
esoccur.
Extensive
spectral
library
with
standard
data
grou
ping
requ
ired
foraccuracy
Nidam
anuriandZbell
(2011a)
JM-SAM-based
mixed
measure
Com
binesthestochastic
Jeffries–
Matusita
distance
and
determ
inistic
SAM
Higherdiscriminability
than
JMandSAM
Suitabilityto
discriminateand
assess
prop
ortio
nswith
ina
mixed
pixelisyetto
beassessed
PadmaandSanjeevi(201
4)
International Journal of Remote Sensing 8225
Dow
nloa
ded
by [
Ann
a U
nive
rsity
] at
19:
08 0
7 D
ecem
ber
2014

cluster analysis to the advanced technique of automated matching by adapting to thefollowing factors.
3.1. Spectral library
Spectral libraries used for matching are varied by nature. In some approaches, a standardspectral library is used while in others a specialized library is developed. To exploit theefficiency of hyperspectral sensors, a well-populated spectral library is required. Whilethere is a strong need to develop the concept of ‘exemplar spectra’ to enhance spectralmatching capability (Gomez 2001), there are valid reasons for adopting a small spectrallibrary. These would provide a reduced search space and the computational time duringthe process of matching the query spectrum. Studies on the development of a qualityfactor (Q) for spectral matching techniques state that a larger library results in lowerQ-values. This is due to the likelihood of extracting different material types from theunknown in the library (Nidamanuri and Zbell 2011b). It is pertinent to mention here thatintegration of spectral libraries has resulted in increased accuracy of target matching andidentification in several applications. Spectral library transfer in spatial (library spectracollected from many geographical locations) and temporal (library spectra collected atdifferent instances) domains has been attempted for assessing spectral variability amongcrops such as alfalfa, triticale, winter barley, winter rape, winter rye, and winter wheat(Nidamanuri and Zbell 2011a).
Spectral libraries in different applications are referred to as either ‘spectral signaturedatabase’ (Ruby and Fischer 2002), ‘information service’ (Leenaars 2013) or ‘look-uptable’ (Mobley et al. 2005). An ideal spectral library in synchronization with the hyper-spectral sensor is of great significance in matching techniques. Image-processing softwarehas inbuilt spectral libraries developed by USGS, JHU, JPL, and NASA – the AdvancedSpaceborne Thermal Emission and Reflection Radiometer (ASTER). Besides, variousresearch works have been carried out to build extensive and specialized soil spectrallibraries (the Global Soil Spectral Library) (Viscarra Rossel 2008); the Czech soil spectrallibrary (Brodsky et al. 2011); urban features (Santa Barbara library) (Herold et al. 2004);Universiti Putra Malaysia’s spectral library (Nasarudin and Shafri 2011); vegetationspecies (Vegetation Spectral Library 2014) developed by Systems Ecology Laboratoryat the University of Texas with National Science Foundation support; JPL’s HyspIRIEcosystem Spectral Library (Hook 2014); wetlands of indigenous environments (web-based Poyang Lake library (Fang et al. 2007); the coastal wetlands of California, Texas,and Mississippi (Zomer, Trabucco, and Ustin 2009); and the benthic habitats library(Louchard et al. 2003).
In regard to planetary research, spectral data of analogous minerals and collectionsfrom planetary missions have created libraries, with the Reflectance ExperimentLaboratory (RELAB 2014), the Planetary Data System (PDS Geosciences SpectralLibrary 2014), Arizona State University’s Thermal Emission Laboratory (Christensenet al. 2000), and a planetary component of USGS library being typical examples.Furthermore, spectral libraries for analysis of oil spills, phenological crop changes, andmany more applications are also available. With several studies carried out on spectraldatabases, the need to publish and share their components led to the development ofonline spectral libraries, where an interactive user interface is available to view spectralplots. Functionalities for querying and downloading are also available. SPECCHIO(Bojinski et al. 2003) is one such example, having a comprehensive collection fromvaried spectral library projects.
8226 S. Shanmugam and P. SrinivasaPerumal
Dow
nloa
ded
by [
Ann
a U
nive
rsity
] at
19:
08 0
7 D
ecem
ber
2014

3.1.1. Construction of spectral libraries
Construction of a spectral library involves the extraction and preprocessing of spectralsignatures, the creation of metadata files for each signature, and storage of the collectedsignatures. The process of collecting and processing spectra varies depending on theirsource (spectroradiometry, hyperspectral images, synthetic measurements, compiledlibraries, and open-source spectrometry). Spectroradiometry comprises laboratory- orfield-based measurements of samples of interest. Preparation of samples and removal ofinstrument noise result in accurate spectral plots. Clark et al. (2007) used four types ofspectroradiometer to measure samples of varying grain size under laboratory conditionsfor USGS. Herold et al. (2004) used an Analytical Spectral Devices (ASD) spectro-radiometer to collect 4500 spectral plots of urban features. Such abundant hyperspectraldata have the potential to contribute to a library within a short duration.
Janja (2012) states that building a spectral library using image spectra avoids theproblem of atmospheric errors, which is dependent on the image and a sensor, and alsorequires an operator to select the appropriate spectra. Shwetank, Jain, and Bhatia (2011)developed a digital spectral library for five rice varieties cultivated in and around Bapaulitown in the state of Haryana in India using EO-1 Hyperion images. In this study, a chainof preprocessing methods such as radiometric correction, geometric correction, selectionof appropriate bands, detection and correction of abnormal pixels, spectral smoothing, andatmospheric correction are performed on the image before the retrieval of reflectancespectra for the library. In another study, a mineralogical spectral library for the Nili Fossaeregion on Mars was constructed using OMEGA/Mars Express data (Daswani 2011). Here,the author suggests that although OMEGA data hold good for angle measurement andstudy of spectral characteristics of large areas, they are affected by noise. The authorfurther states that Compact Reconnaissance Imaging Spectrometer (CRISM) data arebetter suited to correlation-based similarity measures for sites on Mars. Recent examplesof libraries for specific sensors include the efforts of JPL to construct a fully fledgedecosystem spectral library aiming to support users of the Hyperspectral Infrared Imager(HyspIRI). This queryable database, based on the template of the ASTER library, allowsusers to contribute their spectral data related to ecological studies. Similarly, severalresearch proposals convey the potential of building an extensive spectral library forbenthic habitats using the HICO mission.
Some libraries comprise spectral measurements from both spectroradiometry andhyperspectral images. The urban spectral library developed by Herold et al. (2004)includes spectral data measured using the ASD spectroradiometer and from AVIRISdata. Apart from these sources, synthetic or simulated spectra are also used to populatelibraries. A synthetic spectrum is formed by mixing certain proportions of the purecomponents obtained from a spectral library. Louchard et al. (2003) constructed a spectrallibrary for benthic habitats with simulated spectra created using measured values ofbottom reflectance and water-inherent optical properties. Several newly developed stan-dard spectral libraries themselves developed into a source for developing a new spectrallibrary. The ASTER spectral library is a compilation of the USGS, JPL, and JHU libraries(Baldridge et al. 2009). Another example is the Topographic Engineering Center (TEC)library (Ruby and Fischer 2002), which was compiled as a web-based library from variousprojects and their related metadata.
The collected spectral plots are stored within a spectral library using variousapproaches based on their accessibility for users. In regard to the USGS, ASTER, andRELAB libraries, each spectrum file is stored on the website as an ASCII file entry along
International Journal of Remote Sensing 8227
Dow
nloa
ded
by [
Ann
a U
nive
rsity
] at
19:
08 0
7 D
ecem
ber
2014
with its metadata. Furthermore, specialized tools in the image-processing and mineralidentification software are available for storing the spectral data as libraries in the nativeformat. Here, the user provides each spectrum file or pixel location in the hyperspectralimage from which the spectra need to be extracted as an input for generation of the library.An advanced form of this concept led to the construction of an online database(SPECCHIO), where spectral data and related ancillary information are stored within adatabase system based on the entity–relationship model. This type of database modelcontributes to open-source spectrometry, where data from varied resources are shared freeof cost and stored at a single location for access.
In addition to online spectral resources, currently portable versions of hand-heldspectroradiometers are designed with user-friendly interfaces where the spectral plotscollected during field visits are stored within the instrument. Another increasingly populartrend is the use of portable and cost-effective DIY spectrometer kits integrated withSpectral Workbench (2014) software, which allows fast and easy collection of spectra atany location (Public Lab Store, 2014). An overview of the characteristics of variousspectral libraries available online, along with a detailed listing on their construction,components, metadata, and accessibility, are presented in Tables 2 and 3.
3.1.2. Technical requirements for construction of libraries
One of the fundamental requirements for constructing a spectral library is the availabilityof appropriate tools for accurate processing of the collected spectra. The need for betterstorage, querying, and accessibility arises while creating an extensive web-based library.In the case of online or open-source spectral libraries, users are allowed to upload andshare their projects. Gomez (2001) discussed the process of obtaining spectral data fromvarious sources in a standard format as one of the characteristics of an ideal library. InSPECCHIO (Bojinski et al. 2003), the user needs to complete an inbuilt form and uploadthe spectral collections in either ENVI or ASCII format. This inbuilt form is a template forcollecting ancillary information on sensor name, type, date of collection, etc.
A database system capable of storing extensive data with integrity is required for allthese transactions. Library searching or querying led to the use of advanced databasemanagement systems such as Postgre SQL. The spectral library constructed at thePlanetary Emissivity Laboratory (PEL) of the German Aerospace Center employs thePostgre SQL database for storing and analysing 3 million spectra collected through theMESSENGER mission. It takes about 700 milliseconds for a simple query on this high-volume database and any range of keywords can be used for accessing relevant spectra.Furthermore, a data pipeline is set in this mission to transfer the collected data to PEL inthe planetary data system format (DLR – German Aerospace Centre 2014).
Such a database is integrated with the Common Gateway Interface (CGI) to enableonline access for users (Bojinski et al. 2003). Besides command-based interfaces, user-interactive tools for visualization are designed to assist in searching the library. Somelibraries can be made available in stand-alone and web-based forms. In the stand-aloneversion, plug-ins related to MATLAB and Post-GIS are designed to directly connect andvisualize the library in the corresponding software. In this context, it is also pertinent tonote that the library architecture plays a major role in the accuracy of the matchingprocess. Commenting on the limitation of sequential library architecture while matchingthe closely similar crop spectra, Nidamanuri and Zbell (2011a) state that the numericalsignificance given to each candidate spectrum in the library through sequential architec-ture will avoid the prospect of identifying subtle differences among the crop spectra.
8228 S. Shanmugam and P. SrinivasaPerumal
Dow
nloa
ded
by [
Ann
a U
nive
rsity
] at
19:
08 0
7 D
ecem
ber
2014

Table
2.Overview
ofthesalient
features
ofspectral
libraries
used
inremotesensing.
Spectral
libraryz
Sourceof
thespectra
Nature
ofsamples
Num
berof
spectra
(approximate)
Database
type
User
interface
forview
ing
spectra
Metadata
availability
Convoluted
data
Querying
facility
Special
software
for
analysis
Integration
with
other
software
Authorizatio
nrequired
Dow
nloading
facility
Upgrading
facility
Uploading
optio
n
Spectro-
radiom
etry
Airborne
sensors
Spaceborne
sensors
Com
pilatio
nField
Laboratory
USGS
–p
––
–Earth/planetary
materials
~1300
Web-based
archive
pp
p–
pp
–p
p–
San
ta Barbara
p–
–p
–Urban
materials
~4500
Web-based
archive
pp
pp
–p
–p
p–
ASTER
––
––
pEarth/planetary
materials
~2300
Web-based
archive
pp
–p
–p
–p
p–
SPECCHIO
pp
pp
pMaterialsof
variousprojects
>10,000
MyS
QL
pp
–p
pp
pp
pp
RELAB
–p
––
–Planetary
materials
*Web-based
archive
pp
––
–p
–p
p–
PDS
––
–p
pPlanetary
materials
~2463
Web-based
archive
pp
–p
–p
pp
pp
ASU
–p
––
pPlanetary
materials
>2000
Web-based
archive
pp
–p
–p
pp
pp
VSL
–p
––
pVegetationand
related
landcover
*Postgre
SQL
pp
–p
–p
–p
p
Notes:Web-based
archive–spectrum
andrelatedmetadataarearchived
inweb
interfaceas
ASCIIfiles.
*Detailsof
approxim
atenumbers
notknow
n.
International Journal of Remote Sensing 8229
Dow
nloa
ded
by [
Ann
a U
nive
rsity
] at
19:
08 0
7 D
ecem
ber
2014

Table
3.Salient
features
ofthespectral
libraries
used
inremotesensing.
Spectrallib
rary
Review
ofconstructio
nCom
ponentsof
thelib
rary
Metadataavailability
Accessibility
USGSDigital
Spectral
Library
Spectra
measuredusing:
Beckm
an52
70,ASD,Nicolet
Fou
rier
Transform
Infrared,and
NASA’sAVIRIS
radiom
eters.
Mineral
analysisdo
neby
XRD,
electron
microprob
e(EM),
XRF,
andpetrog
raph
y.For
vegetatio
n,do
cumentatio
nrelatesto
locatio
nandspecies
type.Ittook
20yearsto
construct(Clark
etal.20
07)
Current
versionissplib
06awith
1300
spectraof
minerals,rocks,
soils
andmixtures,coatings,
liquids,liq
uidmixtures,
volatiles,frozen
volatiles,man-
madechem
icals,plants,
vegetatio
nmixturesandrelated
microorganism
.andthemoon
andotherplanets.Nextversion
(splib07
)isun
derway
Docum
entatio
nisabou
torigin,
samplepu
rity,andrelated
details.Digitalph
otog
raph
sof
certainsamples
available.
SPECtrum
ProcessingRou
tines
(Specpr)(Clark
etal.19
93)
conv
olvesUSGSlib
rary
spectra
Spectralplotscanbe
downloaded
asASCIIfiles.Older
versions
(splib05
andsplib
04)arealso
prov
ided
with
conv
olved
libraries
that
areem
bedd
edin
severalim
age-processing
packages
forspectral
analysis
Santa
Barbara
Urban
Spectral
Library
Fou
rcatego
ries
ofspectraare
listed.
Eachspectrum
ismeasured(at35
0–24
00nm
)for
discriminatoryability
usingthe
Bhattacharya
distance
(Herold
etal.20
04).
4500
spectrarepresentin
g10
8unique
urbantargets(roofs/
build
ings,transportatio
nsurfaces,andno
n-bu
ilt-up
surfaces).Spectra
conv
olvedto
AVIRIS
wavelengthrang
es
Digitalph
otog
raph
sforsome
urbantargets.Location
coordinates,classnames,and
spectranamearepresent
Interactivemap
displaying
Fairview
andCathedral
Oak
sitesandtheirtargetsof
Asphalt
road.Spreadsheet
fortargets
availablefordo
wnloading
.AVIRIS
conv
olvedlib
rary
and
ASD
spectraof
roofs,
transportatio
n,andno
n-bu
iltup
surfaces
canbe
accessed
ASTERSpectral
Library
Com
piledfrom
USGS,JH
U,and
JPLlib
raries.Con
tributions
wereconv
ertedto
acommon
standard
andancillary
data
are
includ
ed.Spectra
obtained
byBeckm
an,Perkin,
Perkn
ic,and
Nicolet
radiom
eters(Baldridge
etal.20
09).
The
currentversion(2.0)contains
2300
spectra(at0.4–
15.4
µm)
ofrocks,minerals,snow
,ice,
terrestrialsoil,
meteorites,and
vegetatio
n.JPLlib
raries
are
updatedregu
larly
Eachspectrum
issupp
liedwith
details
oftype,class,particle
size,samplenu
mber,ow
ner,
wavelengthrang
e,origin,and
measurementtype.
Latestversion(2.0)canbe
downloadedor
obtained
asCD-
ROM.The
website
contains
aninteractivesearch
tool
toqu
ery
andview
thespectraof
different
targets
(Con
tinued)
8230 S. Shanmugam and P. SrinivasaPerumal
Dow
nloa
ded
by [
Ann
a U
nive
rsity
] at
19:
08 0
7 D
ecem
ber
2014
Table
3.(Con
tinued).
Spectrallib
rary
Review
ofconstructio
nCom
ponentsof
thelib
rary
Metadataavailability
Accessibility
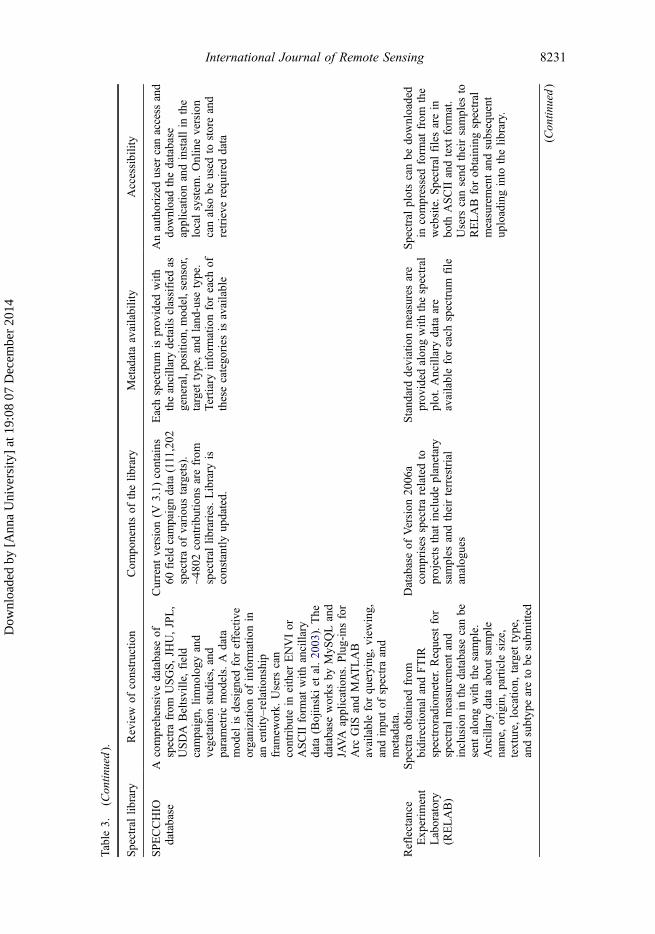
SPECCHIO
database
Acomprehensive
database
ofspectrafrom
USGS,JH
U,JPL,
USDA
Beltsville,field
campaign,
limno
logy
and
vegetatio
nstud
ies,and
parametricmod
els.A
data
mod
elisdesign
edforeffective
organizatio
nof
inform
ationin
anentity–
relatio
nship
fram
ework.
Users
can
contribu
tein
either
ENVIor
ASCIIform
atwith
ancillary
data
(Bojinskiet
al.20
03).The
database
works
byMyS
QLand
JAVA
applications.Plug-insfor
Arc
GIS
andMATLAB
availableforqu
erying
,view
ing,
andinpu
tof
spectraand
metadata.
Current
version(V
3.1)
contains
60fieldcampaigndata(111,202
spectraof
varioustargets).
~480
2contribu
tions
arefrom
spectral
libraries.Library
isconstantly
updated.
Eachspectrum
isprov
ided
with
theancillary
details
classified
asgeneral,po
sitio
n,mod
el,sensor,
target
type,andland
-use
type.
Tertiary
inform
ationforeach
ofthesecatego
ries
isavailable
Anauthorized
user
canaccess
and
downloadthedatabase
applicationandinstallin
the
localsystem
.Onlineversion
canalso
beused
tostoreand
retrieve
requ
ired
data
Reflectance
Exp
erim
ent
Laboratory
(RELAB)
Spectra
obtained
from
bidirectionalandFTIR
spectroradiometer.Requestfor
spectral
measurementand
inclusionin
thedatabase
canbe
sent
alon
gwith
thesample.
Ancillarydata
abou
tsample
name,
origin,particle
size,
texture,
locatio
n,target
type,
andsubtyp
eareto
besubm
itted
Databaseof
Version
2006
acomprises
spectrarelatedto
projectsthat
includ
eplanetary
samples
andtheirterrestrial
analog
ues
Stand
arddeviationmeasuresare
prov
ided
alon
gwith
thespectral
plot.Ancillarydata
are
availableforeach
spectrum
file
Spectralplotscanbe
downloaded
incompressedform
atfrom
the
website.Spectralfilesarein
both
ASCIIandtext
form
at.
Users
cansend
theirsamples
toRELABforob
tainingspectral
measurementandsubsequent
uploadinginto
thelib
rary.
(Con
tinued)
International Journal of Remote Sensing 8231
Dow
nloa
ded
by [
Ann
a U
nive
rsity
] at
19:
08 0
7 D
ecem
ber
2014

Table
3.(Con
tinued).
Spectrallib
rary
Review
ofconstructio
nCom
ponentsof
thelib
rary
Metadataavailability
Accessibility
Planetary
Data
System
(PDS)
Geosciences
Spectral
Library
Builtby
incorporatingthe
Com
pact
Recon
naissance
ImagingSpectrometer
(CRISM)
spectral
library
anddata
from
otherprojects.CRISM
library
comprises
2260
spectrafrom
1134
analog
uematerialsfrom
Mars.Users
cancontribu
tespectraby
subm
ittinga
prop
osal
Library
contains
measurements
relatedto
earth,
lunar,and
meteorite
materials.Spectra
of12
28specim
ensand24
63prod
uctsarepresentin
the
currentarchive
Metadataon
prod
uctID
,spectral
rang
e,prov
ider
ID,
measurementgeom
etry,
instrumentused,azim
uth,
incidence,
emission
,andph
ase
angleareprov
ided
Web
interfaceprov
ides
toolsfor
search,display,
and
downloading
.Searchisbased
onkeyw
ords,specim
enlocatio
n,texture,
compo
sitio
n,andsupp
lierinform
ation.
Interactivegraphplot
canbe
view
ed.Spectralplotsare
available.CRISM
library
canbe
downloaded
Arizona
State
University
(ASU)
Therm
alEmission
Laboratory
Spectralmeasurementsof
hand
-processedpu
reanalog
uesof
Martianrocks(710–1
000nm
)at
5–45
µm
areob
tained
using
Mattson
Cyg
nus-10
0interferom
etricspectrom
eter
(Christensen
etal.20
00).Users
canup
load
theirspectral
data
into
thelib
rary
with
metadata
Spectra
arearchived
inthecurrent
version(v
1.1)
ofASU
library
Ancillarydata
onsample
compositio
nandquality,
catego
rizedas
generalinfo,
spectral
info,microprob
eanalysis,bu
lkanalysis,XRD
analysis,andmod
almineralog
yareavailableat
theweb
interface
Users
canaccess,search,
download,
andup
load
the
spectral
data.Searchfilters
are
basedon
library
albu
ms,sample
name,
type,subg
roup
,and
quality.Spectralplotscanbe
view
edandexpo
rted
indifferentfile
form
ats
Vegetation
Spectral
Library
(VSL)
Builtusingspectraof
vegetatio
nandland
covercollected
from
differentresearch
projects.
PostgreSQLdatabase
isused
for
storage,
query,
andretrievalof
data
Alsocomprises
anextensive
collectionof
spectraof
mixed
vegetatio
n
Metadataon
file
name,
locatio
n,land
-cov
ertype,weather,date
andtim
e,instrument,and
sensor
areprov
ided.Digital
photog
raph
sof
samples
are
append
ed
Web
interfaceallowsforsearch
basedon
metadataand
downloading
ofthespectra
files.Users
cancontribu
tetheir
spectracollections
inASCII
form
at
8232 S. Shanmugam and P. SrinivasaPerumal
Dow
nloa
ded
by [
Ann
a U
nive
rsity
] at
19:
08 0
7 D
ecem
ber
2014

Listing the limitations of the database models, Rasaiah et al. (2011) mention that, as inthe case of SPECCHIO (Bojinski et al. 2003) and Hyperspectral.info (Ferwerda, Jones,and Du 2006), these models have no mechanisms for tracking updates and transactionswithin the database. Furthermore, there is no protocol for assuring data quality. Theauthors also cite the static nature of the data-storing capacity in the ASTER and USGSspectral libraries to be a limitation, despite their comprehensive structure. These limita-tions, as cited by the authors, were overcome in a data warehousing model which has aunique mechanism for tracking updates, thereby preventing data corruption and flaggingthe metadata with their respective quality measures. Further, the authors confirmed theefficiency of data warehousing models to store spectral libraries and hyperspectral data-bases from several sources in the form of a centralized repository. In another study, theauthors (Rasaiah et al. 2012) state that metadata are a central component in such modelsand suggest certain standardized, in situ metadata collection-and-documentation proce-dures that can facilitate data exchanges.
With the development of extensive libraries, the inclusion of different and currentsensor systems has to be ensured. Spectra derived using hand-held spectroradiometry andhyperspectral images differ in terms of wavelength ranges. To solve the issue of compat-ibility, spectral libraries from the USGS provide convolved spectra for different sensors.
3.2. Spectral features
The spectrum of a material is characterized by the presence of absorption features whichare exploited for accurate matching. Stein and Scott (1994) proposed the probability-basedmatching (PBM) method for a mass spectral database. This technique is based on thepeaks in the target spectrum and in the library spectrum falling within a predefinedabundance window. Here, the non-matching peaks in the target spectrum are treated asimpurities and are ‘flagged’. Another algorithm used by the authors is the Dot Productmeasure, which continuously compares the peak intensity differences in the library andreference spectra and yields maximum value in the case of a bad match. Furthermore, theauthors improved the performance of the Dot Product algorithm by adding weights to therelative intensities for spectra with many common peaks. The limitation of this approachis that, in some instances, absorption peaks are confused with spurious peaks. The flatresponse regions of a spectrum with added noise take on the appearance of small peaks.The application of the de-noising techniques might eliminate the useful absorption peaks.Spectral library search tools such as QuickMod employ spectrum–spectrum matching andscoring algorithms, where a weight is given to the intensities of matching and non-matching peaks (Ahrne et al. 2011). The small informative peaks and overlapped peaksin the spectra cannot be easily identified by the software and hence the shape of the peakcannot be described accurately. To overcome this difficulty, point-to-point matchingalgorithms were developed where all the points in the spectra are used (Li et al. 2006).Lau, Hon, and Bai (2000) developed the Effective Peak Matching technique where thepositions of three peaks in the sample spectrum are compared to the three largest peaks inthe selected reference spectrum. All reference spectra with matching peaks are selected.
The complexity of a spectrum increases with the presence of many peaks of varioussize. Stein and Scott (1994) attributed multiple major and minor peaks to such a complex-ity. The authors realized the limitation of the Dot Product algorithm in handling smallspectral peaks. Continuous improvisations have been made in eliminating spurious peakeffects and identifying real peaks (Levin 1999; Hansen and Smedsgaard 2004; Coombeset al. 2005). Clark, Gallagher, and Swayze (1990) proposed the Spectral Feature Fitting
International Journal of Remote Sensing 8233
Dow
nloa
ded
by [
Ann
a U
nive
rsity
] at
19:
08 0
7 D
ecem
ber
2014

(SFF) algorithm, which utilizes the inherent absorption patterns between two spectra formatching. This technique was modified as Multi-Range Spectral Feature Fitting (MRSFF)(Clark et al. 2003), where the absorption features at various wavelength ranges areconsidered for matching. However, similar materials may not always have matchingspectra at different ranges of wavelength. To overcome this issue, Pan, Huang, andWang (2013) devised a variance–covariance weight method for MRSFF. Here, differentialweights are assigned to the wavelength ranges of the spectrum based on their importancefor matching. Kumar et al. (2006) introduced the Variable Interval Spectral Average(VISA) method, where variance is computed for each region in the spectrum. When thevariance exceeds a threshold, the presence of a spike is confirmed. The position and linewidth of these features are stored and used as a reference for matching. In this approach,an appropriate threshold needs to be used to avoid noise features, which can also result inhigh variance like that of the absorption troughs.
Hence it could be said that starting with the spectral feature fitting technique (Clark,Gallagher, and Swayze 1990), several algorithms that utilize the patterns of the peaks andtroughs have evolved.
3.3. Illumination effects
Illumination-independent spectral signatures for matching are obtained after radiometriccorrection. In some cases, mismatch occurs when two spectra of similar materialsoriginate from surfaces of different orientation. Hence, a measure for the likelihood oftheir equality has to be applied through a threshold, for which a precise knowledge of thesurface orientation and a temporal comparison of identical objects illuminated fromdiffering sun angles is required (Wiemker and Hepp 1994). The Spectral Angle Mapper(Kruse et al. 1993) and Spectral Gradient Angle (Robila and Gershman 2005) algorithmsare insensitive to illumination differences in the spectra. Illumination effects can bemitigated by scaling each signature in the library by its Euclidean norm. Such a scalingwill discard the geometric albedo in the signatures, but preserve the spectral angles (Bue,Merenyi, and Csatho 2010). Nidamanuri and Zbell (2011a) collected spectral measure-ments only during the hours 11.00–13.00 to minimize the effects of illumination. Inanother study, Schiefer, Hostert, and Damm (2005) analysed the effects of view angleof hyperspectral data for urban areas, and stated that illumination effects severely influ-ence the spectral information.
3.4. A priori knowledge
In a few cases of spectral matching, a priori knowledge of background spectral informa-tion increases the accuracy of spectral matching. The adaptive coherence estimator (ACE),also known as the Adaptive Subspace Detector, which is an extension of the generalizedlikelihood ratio test (GLRT), employs a covariance matrix to identify the backgroundinformation (Kraut and Scharf 1999). In contrast, the template-matching approach invol-ving l1 minimization requires neither background information nor the assumption ofmultivariate normal distribution of the background during computation. The l1 minimiza-tion algorithm, however, depends only on the spectrum of the material of interest, whichin turn is dependent on the end-member extraction process (Guo and Osher 2011). Otheralgorithms that use more information from the reference spectrum include Mean SquaredError Statistics (MSES) (Staenz, Schwarz, and Cheriyan 1996), which uses per-band
8234 S. Shanmugam and P. SrinivasaPerumal
Dow
nloa
ded
by [
Ann
a U
nive
rsity
] at
19:
08 0
7 D
ecem
ber
2014

noise, and the Cross-Correlogram Spectral Matcher (CCSM) (Van Der Meer and Bakker1997), which provides more than a single-measure spectral similarity.
Xie et al. (2011) suggested an improvised version of the binary encoding algorithmthat uses shape descriptors such as area, asymmetry, elliptic fit, rectangular fit, ratio oflength-to-width, and compactness of the spectra for matching. Thus, it could be inferredthat the integration of a priori knowledge during spectral matching can reduce theoccurrence of false hits and enhance algorithm performance.
3.5. False hits
False hits are defined as poor matches of target and library spectra, which are assigned ahigh matching score. The top-scoring library spectrum is labelled as the perfect match. Inspectral searching, the top-score matches that have turned out to be a mismatch are termedfalse-positives. This refers to the number of non-target pixels incorrectly classified as thetarget (Homayouni and Roux 2004). A target spectrum may be matched with the referencespectrum of a different material due to (i) the scoring function assigning a reasonablescore to a poor spectral match and (ii) a low-quality library spectrum. A low-qualitylibrary includes noisy and contaminated query spectra. In a study of point-to-point patternmatching, Li et al. (2006) stated that even a correlation coefficient of r = 0.99 does notmean a match in all situations. It is the analyst’s responsibility to decide whether thespectral match corresponds to the real situation. While comparing the mismatch and real-time spectra, Manolakis et al. (2009) concluded that in practice, the target signature iseither imperfectly measured leading to mismatch or it exhibits spectral variability. Robustmatched filter algorithms use covariance regularization to address this problem of mis-match due to spectral variability. While studying citrus greening disease at the CitrusResearch and Education Center (CREC), Central Florida, USA, using airborne hyper-spectral images, Li et al. (2012) set the red edge position (REP) at 720 nm and filtered thefalse-positive pixels from the result of SAM-based matching. The pixel identified as‘healthy’ by SAM, but with REP below 720 nm, is categorized as false-positive andfiltered. This approach may not work well in some instances because in continuousspectra there may be a double-peak feature near 700 and 725 nm causing a disruptionin relating the REP factor to the health status of the crop. This conclusion is similar to thatof Clevers, Kooistra, and Salas (2004). In such a case, the second derivative spectra willbe required for accurate extraction of the REP factor. Though many causes for mismatchhave been listed above and reviewed, the study of other types of mismatch needs a fullinvestigation.
3.6. Distortion of spectra due to environmental factors
Hyperspectral data, derived either from hand-held spectroradiometer or hyperspectralimages, could be distorted due to several environmental factors, thus resulting in mis-match. An example of such a distortion is the vegetation index profile with differentgrowing practices (sowing, senescence, harvest, etc.) for two similar vegetation classeswhich appear as points separated by large distances. This results in labelling same speciesas different classes. Modification-tolerant tools are being developed where, even if part ofthe target spectrum is found, the result might be a number of partially matched hits (Liet al. 2004; Ahrne et al. 2011). Such instances of spectral matching with environmentallymodified spectra were reported during an oil spill analysis (Salem, El-Ghazawi, and
International Journal of Remote Sensing 8235
Dow
nloa
ded
by [
Ann
a U
nive
rsity
] at
19:
08 0
7 D
ecem
ber
2014

Kafatos 2001; Li et al. 2004), and during quality control of herbal medicines (Chau et al.2001).
3.7. Threshold requirement
Thresholding is an important step in spectral matching, used for selecting the ranges in thespectra, identifying false alarms, and flagging peaks. Despite the availability of compe-titive techniques of selecting a threshold, it still remains a difficult task because an optimalthreshold has to maintain a low number of false alarms and a high number of correctdecisions. Hence there is always a compromise in choosing a low threshold to increase theprobability of detection and a high threshold to decrease false alarm rates. (Manolakis,Marden, and Shaw 2003). According to Schwarz and Staenz (2001), the adaptive thresh-old technique, which is based on the training area statistics, can be used in combinationwith spectral matching techniques to classify the spectra. This technique was demon-strated using the Modified Spectral Angle Mapper (MSAM) on simulated data andHyperspectral CASI imagery collected over an agricultural site in southern Manitoba,Canada. In the case of the binary coding technique, simple segmentation of the spectruminto a set of uniformly sized sub-ranges can give 100% separation. The method ofchoosing multiple thresholds in an improvised binary coding consists of determiningthe mean brightness of a pixel vector and setting the upper and lower thresholds (Jiaand Richards 1993). Li et al. (2012) arrived at a threshold value based on a trial-and-errorprocess. In this study on mapping disease-prone citrus, the threshold value that resulted inhigh detection accuracy from one of the three values (0.05, 0.1, and 0.15) was used.
Galal, Hassan, and Imam (2012) introduced the concept of ‘learnable hyperspectralmeasures’ to overcome the limitations of using a static threshold in assessing similarity ordissimilarity between two spectra. In this study, the authors consolidated the statisticsobtained from nine matching measures for creating the combined similarity and dissim-ilarity pattern, which was then classified using the Support Vector Machine (SVM). Theclassifier component provides the required adaptive similarity threshold, resulting inprecise material identification.
Hence, proper setting of the threshold can help immensely in improving the perfor-mance of spectral matching approaches since these control interference by spurious peaks,false alarms, and mixed pixels.
3.8. Mixed pixels
With a diverse range of targets and backgrounds, matching approaches have to beequipped in tackling the mixed pixels in an image. Although a reasonable level ofidentification has been achieved for pure target spectra, the identification level for targetmixtures is yet to be addressed (Vishnu, Nidamanuri, and Bremananth 2013). Severalmatching approaches were insensitive to this aspect. In one study on template matching,the l1 minimization-based approach was developed to work on an inhomogeneous back-ground. Here, the algorithm obtains the correct matching pixels if the pure material’scontribution to the mixed pixel is higher (Guo and Osher 2011). The Hidden MarkovModel Information Divergence (HMMID) method, which is a statistical approach, pro-vides enhanced capability in capturing spectral variability and is effective in identifyingmixed spectra (Du and Chang 2001). Manolakis et al. (2009), in a work on identifying thebest hyperspectral detection algorithm, explained the need for spectral matchingapproaches to detect subpixel targets efficiently. In this work, the target is modelled and
8236 S. Shanmugam and P. SrinivasaPerumal
Dow
nloa
ded
by [
Ann
a U
nive
rsity
] at
19:
08 0
7 D
ecem
ber
2014

identified based on statistics such as mean, variance, and covariance, which are calculatedfrom the background information. In the case of the availability of a spectral library, allthe candidates are used to create a low-dimensional subspace or background for identify-ing the subpixel target. However, in this approach, a detailed knowledge of the back-ground and proper selection of threshold is required for accurate matching. The traditionallinear unmixing algorithm, which decomposes the subpixel into its components based onthe Euclidean distance measure, is sensitive to the magnitude of the spectrum. To over-come this issue, Chen et al. (2009) in their study on mapping biological soil crusts inGurbantunggut Desert, China, proposed a subpixel framework integrating spectral match-ing measures such as SAM, SCM, and SID to identify the best match for the unknownspectrum to a weighted sum of end-member spectra. This technique, based on theSequential Quadratic Programming (SQP) method, provided improved identification ofmixed pixels compared with the existing unmixing approaches. However, it should benoted that a well-built spectral library with the required mixture components is necessaryfor such improved performance.
4. Improvised and combined algorithms
The limitations of spectral matching techniques can be overcome by certain modificationsto the existing version. For example, although the SAM averages out the absorptionfeatures required for efficient discrimination, it is unsuitable for discriminating closelyrelated materials. Besides, it cannot distinguish the negative and positive correlationbetween the target and the reference. Staenz et al. (1999) developed the MSAM, whichcombines both the shape and magnitude of spectra. It thus overcomes the limitation ofSAM, which uses only the shape feature. Similar improvisations led to the development ofalgorithms such as the Normalized Euclidean Distance (NED) (Robila and Gershman2005) and Cross-Correlogram Spectral Matcher–Continuum Removed (CCSM-CR) (VanDer Meer 2000). The common factor in both algorithms is that matching performance isincreased by modifying the nature of the input spectrum. While NED deals with normal-ized spectra, the CCSM-CR approach makes evident the role of the continuum removalmethod as a precursor for matching.
The most effective method of improving the performance of spectral matchinginvolves the combination of two or more qualitative measures with the qualitativemeasures of matching. According to Vishnu, Nidamanuri, and Bremananth (2013), acombination of methods results in increased accuracy. Examples of combining twomatching measures include Spectral Similarity Value (Homayouni and Roux 2004;Granahan and Sweet 2001), Spectral Information Divergence–Spectral Angle Mapper(SAM-SID mixed measure) (Du et al. 2004), Spectral Information Divergence–Spectralcorrelation angle (SID-SCA mixed measure) (Naresh Kumar et al. 2011), NormalizedSpectral Similarity Score (NS3) (Nidamanuri and Zbell 2011a), and Jeffries–Matusita-Spectral Angle Mapper (JM-SAM) (Padma and Sanjeevi 2014). Homayouni and Roux(2004) proposed the fusion of Spectral Similarity Value (SSV), Constrained EnergyMinimization (CEM), and MSAM for precise matching. Here the authors confirmed thatalthough primary algorithms are important in identifying pure pixels, the hybrid techni-ques have considerable scope to increase the accuracy of the matching process. Similarly,while identifying land-use classes, Thenkabail et al. (2007) concluded that the SSVtechnique, which captures both the distance and shape measure of the spectra, is betterthan the Euclidean Distance, Modified Spectral Angle Similarity, and Spectral CorrelationSimilarity measures. It should be noted that the combined measures (SID-SAM, SID-SCA,
International Journal of Remote Sensing 8237
Dow
nloa
ded
by [
Ann
a U
nive
rsity
] at
19:
08 0
7 D
ecem
ber
2014
and NS3) handled intra-species and inter-species variability more effectively than theindividual algorithms. For instance, Dudeni and Debba (2009) described the improvedmatching ability of SID-SAM in characterizing seven spectrally similar African savannahtree species. Naresh Kumar et al. (2011) reported that the hybrid SID-SCA measureyielded an increased matching accuracy in discriminating five varieties of Vigna species.Similarly, Nidamanuri and Zbell (2011a) indicated the complementary nature of spectralamplitude and shape measures in NS3 for efficient classification of six crop varietiescollected at different phenological stages. Hence, a combination of quantitative andqualitative spectral matching techniques helps to improve accuracy and strengthen resultscompared with those obtained using individual techniques.
5. Performance measurement
The efficiency of spectral matching techniques is assessed by various measures ofperformance. The Relative Spectral Discriminability Probability (RSDPB) (Dudeni andDebba 2009) computes the likelihood that a spectrum will be identified by a selective setof spectral signatures. The higher the RSDPB value, the more likely the spectra will bediscriminated from others in that region of the electromagnetic spectrum.
In some instances, the performance of a new spectral matching approach is comparedto and evaluated against a standard approach such as the Spectral Angle Mapper. Singh,Ramakrishnan, and Mansinha (2012) evaluated matching of the target and modelledspectrum based on root mean squared error and matching scores. Qualitative approachessuch as knowledge in judging the spectral identification also exist (Arora et al. 2013).Bue, Merenyi, and Csatho (2009) devised the concept of Visual Score (VS) for assessingthe discriminatory capacity of matching techniques. The authors inspected the matchingtrends manually and assigned a score for each method. Apart from these, statisticalmethods such as Probability of Spectral Discrimination (PSD) (Chang 2003) and thePower of Spectral Discrimination (PWSD) (Van Der Meer 2006) have been used to assessthe reliability of spectral library searches in geological material mapping. PSD measuresthe probability that a spectral library or its subset will be able to identify an unknownspectrum relative to other spectra in the library. In contrast, PWSD allows the calculationof spectral confusion between the target and reference spectra by using a set of spectralsimilarity estimates. According to Nidamanuri and Zbell (2011b), both PSD and PWSDindicate the quality of a spectral library and the search results. The authors proposed theQ-factor, which functionally performs a similar role by assessing the reliability of spectralidentification. Besides, it quantifies the performance of the spectral library search methodrelative to the nature and type of the unknown materials and composition of the spectrallibrary. Another accuracy assessment method, by Manolakis et al. (2009), which utilizesthe Receiver Operating Characteristic (ROC) curves, plots the probability of detectionversus the probability of false alarm. The ROC estimation depends on the number ofavailable target and background pixels. Since the number of target pixels is often limited,the ROC method should be used in empirical detection evaluation with extreme care.
The lack of widely accessible data from well-designed algorithms with accurateground truth makes the experimental evaluation and comparison of algorithms a difficultprocess. In some cases, the implementation of the matching technique is tested usingsimulated spectra (Guo and Osher 2011). This alone may not be helpful for establishingthe superiority of the technique used. Hence it is necessary to use a good performancemeasure that identifies the influence of the quality of the spectral library, false alarms, andintrusion of background information over the accuracy of matching technique.
8238 S. Shanmugam and P. SrinivasaPerumal
Dow
nloa
ded
by [
Ann
a U
nive
rsity
] at
19:
08 0
7 D
ecem
ber
2014
6. Spectral matching tools
Development of interactive interfaces for visualizing spectral analysis has evolved withthe emergence of several specialized spectral libraries and matching approaches. Imagingsystems that emerged in this context during the early days include the Spectral ImageProcessing System (SIPS) (Kruse et al. 1993), Imaging Spectrometer Data AnalysisSystem (ISDAS) developed by the Canadian Centre for Remote Sensing in 1995, andUSGS’s Tricorder (Clark, Gallagher, and Swayze 1990). These systems have the basicfunctionalities for data input/output, interactive visualization, and analysis of imagingspectrometer data. A single algorithm such as that of SAM in SIPS, SFF in Tricorder, orMRSFF in Tetracorder govern spectral matching for applications mostly related to mineralmapping. Subsequently, based on these algorithms, an automated rule-based identificationtool called the Spectral Expert System was integrated with ENVI in 2007 as a plug-in.This expert system also works based on the principle of matching absorption features andhence has modules for continuum removal. This system worked for three kinds of input:single-target spectrum, entire spectral library, and hyperspectral image. All these devel-opments led to automation of several matching techniques and enabled their incorporationinto image processing software and mineral identification tools.
A brief look at the automated spectrum-matching tools characterizes the applicationsof these techniques to various domains, including biotechnology. The analysis of peptides,which are the chains of amino acids linked by chemical bonds, is of great significance inbiotechnology. Though peptide and hyperspectral image spectra vary considerably, thecontinuous development of automated tools of spectrum matching for peptide identifica-tion serves as a reference for hyperspectral image processing systems. Lam et al. (2007),in their work on the development of a spectral library search method for peptideidentification, stated that the SpectraST tool performed better than the SEQUEST tool.SpectraST is based on spectral searching while SEQUEST is based on sequence search-ing. SEQUEST developed by the Yates laboratory operates on the principle of cross-correlation for assessing spectral similarity. In the case of satellite image processingsoftware, ENVI, ERDAS, and PCI Geomatica include spectral analyst tools for hyper-spectral data analysis. A typical example of an automated target detection tool, availableas the Material Identification tool of Tactical Hyperspectral Operations Resource (THOR)workflow in ENVI version 5.1, is shown in Figure 1. The THOR workflow’s userinterface and its matching capability are depicted in Figure 2, where the unknown targetspectrum chosen from the AVIRIS image is matched with an appropriate candidatespectrum from the USGS library. Similarly, the Spectral Analysis Workstation inERDAS Imagine version 8.6 has routines for automated target identification and materialmapping. An overview of the capabilities of the spectral matching modules in thesesoftware programs and other stand-alone tools is presented in Table 4. Furthermore, adetailed note on their structure, operating principle, and function is given in Table 5.
It can thus be inferred that there is an increasing trend in the development of user-friendly interfaces for spectral matching and their subsequent influence on materialmapping. It is, however, important to analyse the integration of various specializedspectral libraries and the convolved multispectral and hyperspectral sensor-derived spectrafor varied environmental and resource-mapping applications. A recent tool is theadvanced mass spectral database in the form of a cloud computing. Cloud computing isa large networked environment of shared software, databases, and other computingresources from a variety of architectures. An example is the ‘mzCloud’ (Mistrik et al.2013), which comprises a web-based interface with a large collection of libraries,
International Journal of Remote Sensing 8239
Dow
nloa
ded
by [
Ann
a U
nive
rsity
] at
19:
08 0
7 D
ecem
ber
2014

appropriate metadata, and an automated target identification algorithm. One of the keyfeatures is that even if a target spectrum is not represented as a reference candidate in alibrary, this cloud-based community tends to identify the structural information of suchinput by relating several libraries. Though Rasaiah et al. (2011) opined that the lack of
Figure 1. Illustration of automated spectral identification using the Tactical HyperspectralOperations Resource (THOR) workflows in Exelis Visual Information Solutions 5.1 V (ENVI5.1). The best match for the unknown spectra is assessed by the SAM approach.
0.75
0.80
0.85
0.90
0.95
1.00
1.05
1.10
2.0 2.1 2.2 2.3 2.4 2.5Wavelength (µm)
Ref
lect
ance
(×1
00)
%
Target spectrum X:538 Y:536Library spectrum alunite3.spc
Figure 2. Target and library spectrum of alunite matched using material identification tool.
8240 S. Shanmugam and P. SrinivasaPerumal
Dow
nloa
ded
by [
Ann
a U
nive
rsity
] at
19:
08 0
7 D
ecem
ber
2014

Table
4.Overview
ofthesalient
features
ofthespectral
matchingtools.
Software
Stand-alone
software
only
for
matching
Separate
modules
availablefor
matching
Graphical
user
interface
Com
mand-
based
operation
Preprocessing
tools
Contin
uum
removal
Matching
approach
Autom
ated
target
detection
tools
Inbuilt
spectral
libraries
User-
defined
spectral
libraries
Spectral
saving
capability
Creation
of
spectral
library
Querying
capability
Application
SIPS
p–
pp
––
SAM
–p
–p
––
MTetracorder
p–
pp
pp
MRSFF
–p
–p
––
T/P
PCI Geomatica
–p
pp
p–
SAMMSAM
–p
pp
p–
C
ENVI
–p
pp
pp
Multip
le*
pp
pp
p–
Multip
le**
ERDASIM
AGIN
E–
pp
–p
–Multip
le*
pp
pp
p–
Multip
le**
TSG
p–
p–
––
Aux
Match
pp
pp
pp
MSPECMN
p–
p–
––
Feature
Search
pp
pp
pp
M
DARWIN
p–
p–
––
Weighted
Score
pp
pp
pp
M
Notes:M,Mineral
Mapping;T/P,Terrestrial/Planetary
Applications;C,Classification.
Multip
le*,
Com
prises
severalmatchingapproaches
(adetailedlistisshow
nin
Table3).
Multip
le**,Toolused
forvariousapplications
rangingfrom
mineral
mapping,classificatio
n,end-mem
berselection,
target
detection,
etc.).
International Journal of Remote Sensing 8241
Dow
nloa
ded
by [
Ann
a U
nive
rsity
] at
19:
08 0
7 D
ecem
ber
2014

Table
5.Salient
features
ofspectral
matchingtools.
Spectralmatchingtool
Structure
Operatin
gprincipleandfunctio
nsRem
arks
Tetracorder
Fun
ctionalitiessuch
asRatio
spectra,
Mod
ifiedleast-squaresspectral
feature
fitting
,Con
tinuu
mremov
al,Con
straint
andidentificationanalysisareavailable
ascommands
Preprocessing
byCon
tinuu
mremov
alfunctio
n.MRSFF(shape
matching
algo
rithm)used
toidentifyatarget.
Assessm
entof
similarity
ofthetarget
toallcand
idatespectraisthekeyfeature.
After
identification,
‘Group
ing’
functio
ncategorizesthetargets
Improv
ised
versionof
‘Tricorder’for
terrestrialandplanetaryapplications
(Clark
etal.20
03).Sou
rcecode
and
commands
availablein
USGSwebsite.
Highlydepend
enton
thespectral
libraries
(USGS,JPL,andothers)
Spectra
Handlingmod
ule
inPCIGeomatica
The
‘LocalAnalysis’mod
ulecomprises
the
SAM
andSpectra
Handlingtools.
‘Spectralplot’tool
isavailablefor
view
ingthespectra
For
SAM,theou
tput
isaraster.DN
ofpixelscorrespo
ndsto
theanglebetween
thereferenceandtarget
spectra.
‘Spectra
Handling’
tool
allowstheuser
toderive,
conv
olve,andre-format
spectrausing
I2SP,
SPCONVP,
andSP2S
Pfunctio
ns.
‘Spectralplot’im
portsspectrafrom
imageor
spectral
library
andsavesinto
XMLor
SPLlib
rary
ExceptSAM
(hyp
erspectral
classificatio
ntool),mod
ules
exclusiveforspectral
matchingareabsent.29
libraries
availablein
version9.1includ
ingUSGS
andASTER.Metadatacanbe
includ
edforeach
spectrum
usingXMLfiles
SpectralAnalystand
Tactical
Hyp
erspectral
Operatio
nsResou
rce
workflow
(THOR)of
ENVI
‘Mapping
Metho
ds’,‘SpectralAnalyst’,
‘SpectralLibrary
Builder’areavailable
intheSpectraltoolsof
ENVI(5.1).
‘TargetDetectio
n’wizardisavailable.
Alsopresentedin
THORworkflow,an
interactivetool
Con
tinuu
mremov
alandspectral
feature
fitting
possible.Targetspectrum
canbe
matched
with
thereferencespectrausing
thecombinedscoreof
SAM,BE,and
SFF.
‘Library
Builder’canview
,im
port,
andexpo
rtspectral
plot
data.THOR
performsmatchingby
SAM,MF,
ACE,
NED,SSM,SID
,CEM,OSP,
TCIM
F,andUWD.‘M
aterialidentificationtool’
matches
theun
know
nandreference
spectrum
usingSAM.‘H
yperspectral
MaterialIdentificationToo
l’uses
ACE
andthebackgrou
ndstatisticsof
thetarget
spectrum
Stand
ardlib
raries
includ
eASTER
(244
3),
IGCP26
4(139
),USGS(199
4),and
vegetatio
nlib
rary
(99).The
library
can
beim
ported
andexpo
rted
asASCIIand.
sli(nativ
eform
at).Metadata-rich
spectral
library
(MRSL)canbe
createdusing
SpectralLibrary
build
er.Sequential
spectral
library
architectureisconsidered
asalim
itatio
n
(Con
tinued)
8242 S. Shanmugam and P. SrinivasaPerumal
Dow
nloa
ded
by [
Ann
a U
nive
rsity
] at
19:
08 0
7 D
ecem
ber
2014
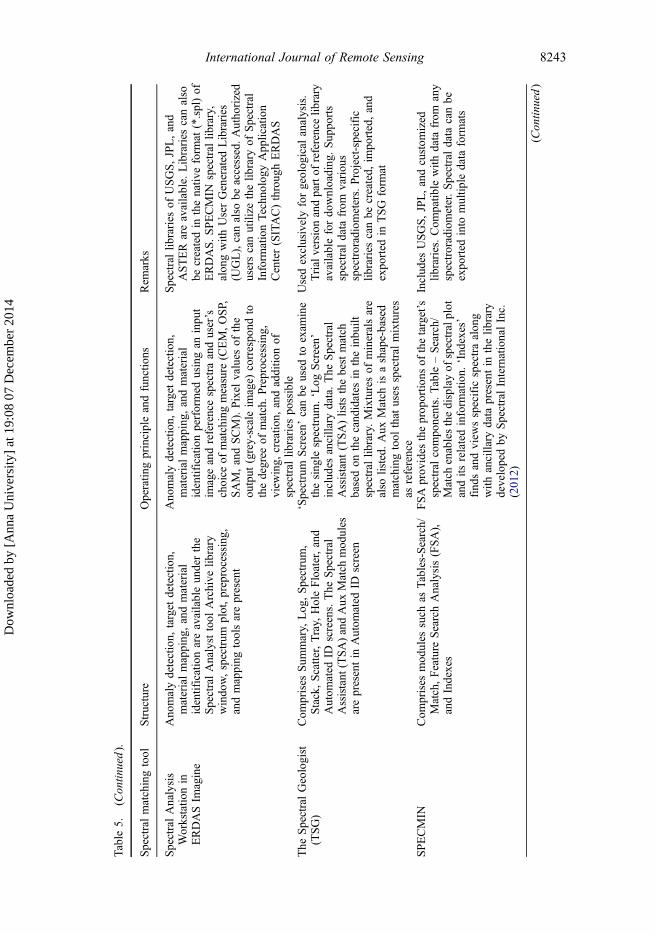
Table
5.(Con
tinued).
Spectralmatchingtool
Structure
Operatin
gprincipleandfunctio
nsRem
arks
SpectralAnalysis
Workstatio
nin
ERDASIm
agine
Ano
malydetection,
target
detection,
materialmapping
,andmaterial
identificationareavailableun
derthe
SpectralAnalysttool
Archive
library
windo
w,spectrum
plot,preprocessing,
andmapping
toolsarepresent
Ano
malydetection,
target
detection,
materialmapping,andmaterial
identificationperformed
usingan
inpu
tim
ageandreferencespectraanduser’s
choice
ofmatchingmeasure
(CEM,O
SP,
SAM,andSCM).Pixel
values
ofthe
output
(grey-scaleim
age)
correspo
ndto
thedegree
ofmatch.Preprocessing
,view
ing,
creatio
n,andadditio
nof
spectral
libraries
possible
Spectrallib
raries
ofUSGS,JPL,and
ASTER
areavailable.
Libraries
canalso
becreatedin
thenativ
eform
at(*.spl)of
ERDAS.SPECMIN
spectral
library,
alon
gwith
UserGenerated
Libraries
(UGL),canalso
beaccessed.Autho
rized
userscanutilize
thelib
rary
ofSpectral
Inform
ationTechn
olog
yApp
lication
Center(SITAC)throug
hERDAS
The
SpectralGeologist
(TSG)
Com
prises
Sum
mary,
Log
,Spectrum,
Stack,Scatter,Tray,
HoleFloater,and
Autom
ated
IDscreens.The
Spectral
Assistant
(TSA)andAux
Match
mod
ules
arepresentin
Autom
ated
IDscreen
‘Spectrum
Screen’
canbe
used
toexam
ine
thesing
lespectrum
.‘Log
Screen’
includ
esancillary
data.The
Spectral
Assistant
(TSA)liststhebestmatch
basedon
thecand
idates
intheinbu
iltspectral
library.Mixturesof
mineralsare
also
listed.
Aux
Match
isashape-based
matchingtool
that
uses
spectral
mixtures
asreference
Usedexclusivelyforgeolog
ical
analysis.
Trialversionandpartof
referencelib
rary
availablefordo
wnloading
.Sup
ports
spectral
data
from
variou
sspectroradiometers.Project-specific
libraries
canbe
created,
imported,and
expo
rted
inTSG
form
at
SPECMIN
Com
prises
mod
ules
such
asTables-Search/
Match,Feature
SearchAnalysis(FSA),
andIndexes
FSAprov
ides
theprop
ortio
nsof
thetarget’s
spectral
compo
nents.Table
–Search/
Match
enablesthedisplayof
spectralplot
andits
relatedinform
ation.
‘Ind
exes’
find
sandview
sspecific
spectraalon
gwith
ancillary
data
presentin
thelib
rary
developedby
SpectralInternationalInc.
(201
2)
Includ
esUSGS,JPL,andcustom
ized
libraries.Com
patib
lewith
data
from
any
spectroradiometer.Spectraldata
canbe
expo
rted
into
multip
ledata
form
ats
(Con
tinued)
International Journal of Remote Sensing 8243
Dow
nloa
ded
by [
Ann
a U
nive
rsity
] at
19:
08 0
7 D
ecem
ber
2014

Table
5.(Con
tinued).
Spectralmatchingtool
Structure
Operatin
gprincipleandfunctio
nsRem
arks
oreXpressDARWin
SpectralData
Acquisitio
nsoftware
Com
prises
EZ-ID
Real-tim
eMineral
Identificationtool,Library
Builder
mod
ule,
androutines
forvegetatio
nindices
Scans
thetarget
spectrum
,allowsselection
ofregion
sof
interestanddisplays
the
bestmatch
basedon
aweigh
tedscore.
Reference
spectraarefrom
USGS,
SPECMIN
,andcustom
libraries.Batch
mod
eprocessing
ofmultip
lespectrais
possible
andresults
canbe
savedon
tospreadsheetsandtext
files.‘Library
Builder’adds
new
targetsto
theexistin
glib
rary.Metadatacanbe
createdor
updatedforeach
entry
Exclusive
softwareforanalysingresults
of‘SpectralEvo
lutio
n’radiom
eters.
Portableversioncanbe
integrated
with
theradiom
eter
during
fieldw
ork.
Inbu
iltmicroph
one,
camera,
andGPSallow
the
collectionof
voiceno
tes,ph
otos,and
locatio
nof
each
target
8244 S. Shanmugam and P. SrinivasaPerumal
Dow
nloa
ded
by [
Ann
a U
nive
rsity
] at
19:
08 0
7 D
ecem
ber
2014
standardization and quality assurance methods in the cloud may result in difficulty inassessing the reliability of available data, thereby making it unsuitable for hyperspectraldata users, recent examples like ‘mzCloud’ and the advent of data integrity measuresrender cloud computing a potential option for storing and analysing hyperspectral data.Easy access to spectral resources, automated software deployment, and unlimited storagecapacity through this technology can provide a new dimension to the matching toolsdealing with hyperspectral data sets.
7. Summary
This review has been attempted after realizing the need for an appraisal of past develop-ments, present progress, and future aspects in the domain of spectral matching. Variousstudies, theses, software programs, spectral tools, and libraries were reviewed. Thelimitations and advantages of existing spectral matching approaches were evaluated anddiscussed in this paper. It was realized that spectral matching tools and libraries haveevolved in tandem with advancements in hyperspectral image acquisition and applica-tions. Furthermore, the transition from manual and semi-automatic matching tools, such asUSGS’s Tetracorder and ENVI’s Spectral Analyst, to automated target identification tools,such as ENVI’s Material Identification Workflow and ERDAS’s Spectral AnalysisWorkstation, have resulted in improved accuracy of target detection and material map-ping. Although spectral matching tools individually possess unique capabilities, they havefailed to resolve the issues related to spectral library, absorption features, illuminationeffects, false hits, distortion of spectra, and mixed pixels. Thus, it is inferred that acombination of spectral abilities of two or more algorithms such as SAM-SID mixedmeasure (Du et al. 2004), SID-SCA, (Naresh Kumar et al. 2011), and NS3 (Nidamanuriand Zbell 2011a) yield better matching performance than individual measures. Thisreview has highlighted that most spectral matching libraries and applications haverevolved around mineral mapping, agriculture and forestry, coastal and ocean bathymetry,ocean colour mapping, and planetary material mapping. Thus, the lack of any role in thefields of military applications, urban feature extraction, water quality mapping, andartefact removal is to be addressed. The operating principle and structure of commonlyused spectral matching tools is also reviewed and listed to provide a brief account. Sincecontinuous spectra of target materials form the most essential input of spectral matching,the need for spectral libraries has also been highlighted in this review. Furthermore,various works on collecting spectra, generating and compiling a library, and their usagein matching have been reviewed. In addition, a comprehensive study has been carried outon the method of construction, source of data, querying capability, metadata aspects, andapplications of extensively used libraries such as USGS, ASTER, and RELAB. Theemerging trend of developing a centralized database for uploading and sharing datafrom several sources, viz. SPECCHIO, has also been reported. The need for sensor-specific libraries pertaining to existing hyperspectral missions such as EO-1 Hyperion,CASI, PROBA/CHRIS, and the latest missions for environmental monitoring such asHICO and HyspIRI has been highlighted. The recent concept of ‘cloud’ for compilinglarge volumes of hyperspectral libraries and algorithms for efficient target identificationhas also been cited in this paper. Hence addressing and resolving these issues will increasethe performance of spectral matching in hyperspectral image analysis.
International Journal of Remote Sensing 8245
Dow
nloa
ded
by [
Ann
a U
nive
rsity
] at
19:
08 0
7 D
ecem
ber
2014
ReferencesAhrne, E., F. Nikitin, F. Lisacek, and M. MüLler. 2011. “Quickmod: A Tool for Open Modification
Spectrum Library Searches.” Journal of Proteome Research 10: 2913–2921. doi:10.1021/pr200152g.
Andreoli, G., B. Bulgarelli, B. Hosgood, and D. Tarchi. 2007. “Hyperspectral Analysis of Oil andOil-Impacted Soils for Remote Sensing Purposes.” EUR 22739 EN – DF Joint Research Centre.Luxembourg: Office for Official Publications of the European Communities, Scientific andTechnical Research Series 34: 1–30.
Arora, M. K., S. Bansal, S. Khare, and K. Chauhan. 2013. “Comparative Assessment of SomeTarget Detection Algorithms for Hyperspectral Images.” Defence Science Journal 63: 53–62.doi:10.14429/dsj.63.3764.
Baldridge, A. M., S. J. Hook, C. I. Grove, and G. Rivera. 2009. “The ASTER Spectral LibraryVersion 2.0.” Remote Sensing of Environment 113: 711–715. doi:10.1016/j.rse.2008.11.007.
Bertels, L., D. Bart, K. Pieter, D. Walter, and P. Sam. 2005. “Optimized Spectral Angle MapperClassification of Spatially Heterogeneous Dynamic Dune Vegetation, a Case Study Along theBelgian Coastline.” Proceedings of the 9th International Symposium on Physical Measurementsand Signatures in Remote Sensing (ISPMSRS), Beijing, October 17–19.
Bojinski, S., M. Schaepman, D. Schläpfer, and K. Itten. 2003. “SPECCHIO: A Spectrum Databasefor Remote Sensing Applications 2003.” Computers and Geosciences 29: 27–38. doi:10.1016/S0098-3004(02)00107-3.
Brodsky, L., A. Klement, V. Penizek, R. Kodesova, and L. Boruvka. 2011. “Building Soil SpectralLibrary of the Czech Soils for Quantitative Digital Soil Mapping.” Soil and Water Research 6:165–172.
Brown, A. J. 2006. “Spectral Curve Fitting for Automatic Hyperspectral Data Analysis.” IEEETransactions onGeoscience and Remote Sensing 44: 1601–1608. doi:10.1109/TGRS.2006.870435.
Bue, B. D., E. Merenyi, and B. Csatho. 2009. “Automated Labeling of Segmented HyperspectralImagery via Spectral Matching.” Proceedings of IEEE WHISPERS 2009, Grenoble, August 26–28.
Bue, B. D., E. Merenyi, and B. Csatho. 2010. “Automated Labeling of Materials in HyperspectralImagery.” IEEE Transactions on Geoscience and Remote Sensing 48: 4059–4070.
Cahill, J. T. S., P. G. Lucey, K. R. Stockstill-Cahill, and B. R. Hawke. 2010. “Radiative TransferModeling of Near-Infrared Reflectance of Lunar Highland and Mare Soils.” Journal ofGeophysical Research 115: E12013. doi:10.1029/2009JE003500.
Cerra, D., J. Bieniarz, J. Avbelj, R. Muller, and P. Reinartz. 2011. “Spectral Matching through DataCompression. ISPRS Archives.” In ISPRS Workshop on High-Resolution Earth Imaging forGeospatial Information, Germany, June 14–17, 2011.
Chang, C. I. 2000. “An Information-Theoretic Approach to Spectral Variability, Similarity, andDiscrimination for Hyperspectral Image Analysis.” IEEE Transactions on Information Theory46: 1927–1932. doi:10.1109/18.857802.
Chang, C. I., ed. 2003. Hyperspectral Imaging: Techniques for Spectral Detection andClassification. New York: Kluwer Academic.
Chau, F. T., D. K. W. Mok, F. Gong, S. K. Tsui, S. K. Wong, L. Q. Huang, Y. Z. Liang, and B. T. P.Chan. 2001. “Fingerprinting Analysis of Raw Herb: Application of Chemometrics Techniquesfor Finding Out Chemical Fingerprint of Chinese Herb.” Analytical Sciences 17: 419–422.
Chen, J., X. Jia, W. Yang, and B. Matsushita. 2009. “Generalization of Subpixel Analysis forHyperspectral Data with Flexibility in Spectral Similarity Measures.” IEEE Transactions onGeoscience and Remote Sensing 47: 2165–2171. doi:10.1109/TGRS.2008.2011432.
Christensen, P. R., J. L. Bandfield, V. E. Hamilton, D. A. Howard, M. D. Lane, J. L. Piatek, S. W.Ruff, and W. L. Stefanov. 2000. “A Thermal Emission Spectral Library of Rock-FormingMinerals.” Journal of Geophysical Research 105: 9735–9739. doi:10.1029/1998JE000624.
Clark, R. N. 1993. “SPECtrum Processing Routines User’s Manual Version 3 (program SPECPR).”U.S. Geological Survey, Open File Report 93-595, 210 p.
Clark, R. N., A. J. Gallagher, and G. A. Swayze. 1990. “Material Absorption Band Depth Mappingof Imaging Spectrometer Data Using the Complete Band Shape Least-Squares AlgorithmSimultaneously Fit to Multiple Spectral Features from Multiple Materials.” In Proceedings ofthe Third AVIRIS Workshop, 176–186. Los Angeles, CA: JPL Publication.
8246 S. Shanmugam and P. SrinivasaPerumal
Dow
nloa
ded
by [
Ann
a U
nive
rsity
] at
19:
08 0
7 D
ecem
ber
2014
Clark, R. N., G. A. Swayze, K. E. Livo, R. F. Kokaly, and S. J. Sutley. 2003. “ImagingSpectroscopy: Earth and Planetary Remote Sensing with the USGS Tetracorder and ExpertSystems.” Journal of Geophysical Research 108: 1–44. doi:10.1029/2002JE001847.
Clark, R. N., G. A. Swayze, R. Wise, E. Livo, T. Hoefen, R. Kokaly, and S. J. Sutley. 2007. “USGSDigital Spectral Library Splib06a.” U.S. Geological Survey, Digital Data Series 231.
Clevers, J. G. P. W., L. Kooistra, and E. A. L. Salas. 2004. “Study of Heavy Metal Contamination inRiver Floodplains Using the Red-Edge Position in Spectroscopic Data.” International Journalof Remote Sensing 25: 3883–3895. doi:10.1080/01431160310001654473.
Coombes, K. R., S. Tsavachidis, J. S. Morris, K. A. Baggerly, M. C. Hung, and H. M. Kuerer. 2005.“Improved Peak Detection and Quantification of Mass Spectrometry Data Acquired from Surface-Enhanced Laser Desorption and Ionization by Denoising Spectra with the Undecimated DiscreteWavelet Transform.” Proteomics 5: 4107–4117. doi:10.1002/pmic.200401261.
Daswani, M. M. 2011. “Mineral Spectra Extraction and Analysis of the Surface Mineralogy of Marswith Hyperspectral Remote Sensing.” Master of Science, University of Twente.
De Carvalho, O., and P. Meneses. 2000. “Spectral Correlation Mapper (SCM): An Improvement onthe Spectral Angle Mapper (SAM).” Summaries of the 9th Annual JPL Airborne Earth SciencesWorkshop, vol. 18, p. 9. Pasadena, CA: JPL Publication.
DLR – German Aerospace Centre. 2014. http://www.dlr.de/dlr/en/desktopdefault.aspx/tabid-10002/Du, Q., and C. I. Chang. 2001. “Hidden Markov Model Approach to Spectral Analysis for
Hyperspectral Imagery.” Optical Engineering 40: 2277–2284. doi:10.1117/1.1404430.Du, Y., C. I. Chang, H. Ren, C. C. Chang, J. O. Jensen, and F. M. D’Amico. 2004. “New
Hyperspectral Discrimination Measure for Spectral Characterization.” Optical Engineering 43:1777–1786. doi:10.1117/1.1766301.
Dudeni, N., and P. Debba. 2009. “Evaluation of Discrimination Measures to Characterize SpectrallySimilar Leaves of African Savannah Trees.” In 57th Biennial Session of the InternationalStatistical Institute, South Africa, August 16–22, 2009.
ENVI Classic Tutorial: Target Detection. 2014. Boulder, CO: Exelis Visual Information Solutions.Evans, R. 2007. “Amateur Lunar Photoclinometry, Spectroscopy and Astrophotography.” http://
www.freewebs.com/revans01420Fabian, C. P. 1967. “Semiannual Report on the Investigation of Spectrum Matching Sensing in
Agriculture.” University of Michigan.Fang, L., S. Chen, X. Zhou, S. Liao, and L. Chen. 2007. “A Web-Based Spectrum Library for
Remote Sensing Applications of Poyang Lake Wetland, Geographic Information Sciences.” AJournal of the Association of Chinese Professionals in Geographic Information Systems 13:3–9.
Farifteh, J., F. Van Der Meer, and E. J. M. Carranza. 2007. “Similarity Measures for SpectralDiscrimination of Salt‐Affected Soils.” International Journal of Remote Sensing 28:5273–5293. doi:10.1080/01431160701227604.
Ferwerda, J. G., S. D. Jones, and P. J. Du 2006. “A Web-Based, Open-Source Database for theDistribution of Hyperspectral Signatures.” SPIE Proceedings of the 14th GeoinformaticsConference: Geospatial Information Technology, Wuhan, China, Vol. 6421, 64210G-1–64210G-7, October 28–29.
Frolov, D., and R. B. Smith. 1999. “Locally Adaptive Constrained Energy Minimization for AVIRISImage.” In Eighth JPL Airborne Earth Science (AVIRS). Pasadena, CA: JPL Publication. http://www.microimages.com/papers
Galal, A., H. Hassan, and I. F. Imam. 2012. “A Novel Approach for Measuring HyperspectralSimilarity.” Applied Soft Computing 12: 3115–3123. doi:10.1016/j.asoc.2012.06.018.
Gillis, D. B., J. H. Bowles, and W. J. Moses. 2013. “Improving the Retrieval of Water InherentOptical Properties in Noisy Hyperspectral Data Through Statistical Modeling.” Optics Express21: 21306–21316. doi:10.1364/OE.21.021306.
Gomez, R. B. 2001. “Spectral Library Issues in Hyperspectral Imaging Applications.” 5th JointConference on Standoff Detection for Chemical and Biological Defense, Williamsburg, VA,September 24–28.
Govender, M., K. Chetty, and H. Bulcock. 2007. “A Review of Hyperspectral Remote Sensing andIts Application in Vegetation and Water Resource Studies.” Water SA 33: 145–152.
Gower, J. C. 1985. “Properties of Euclidean and Non-Euclidean Distance Matrices.” Linear Algebraand Its Applications 67: 81–97. doi:10.1016/0024-3795(85)90187-9.
International Journal of Remote Sensing 8247
Dow
nloa
ded
by [
Ann
a U
nive
rsity
] at
19:
08 0
7 D
ecem
ber
2014

Granahan, J. C., and J. N. Sweet. 2001. “An Evaluation of Atmospheric Correction TechniquesUsing the Spectral Similarity Scale.” Proceedings of the IEEE 2001 International Geoscienceand Remote Sensing Symposium 5: 2022–2024.
Guo, Z., and S. Osher. 2011. “Template Matching via L1 Minimization and Its Application toHyperspectral Data.” Inverse Problems Imaging 1: 19–35. doi:10.3934/ipi.2011.5.19.
Gupta, S., and K. S. Rajan. 2010. “Temporal Signature Matching for Land Cover Classification.”International Society for Photogrammetry and Remote Sensing – Technical Commission VIIISymposium, Kyoto, August 9–12.
Hansen, M. E., and J. Smedsgaard. 2004. “A New Matching Algorithm for High Resolution MassSpectra.” Journal of the American Society for Mass Spectrometry 15: 1173–1180.doi:10.1016/j.jasms.2004.03.008.
Harsanyi, J. C. 1993. “Detection and Classification of Subpixel Spectral Signatures in HyperspectralImage Sequences.” PhD diss., University of Maryland, 116.
Herold, M., D. A. Roberts, M. E. Gardner, and P. E. Dennison. 2004. “Spectrometry for Urban AreaRemote Sensing – Development and Analysis of a Spectral Library from 350 to 2400 nm.”Remote Sensing of Environment 91: 304–319. doi:10.1016/j.rse.2004.02.013.
Homayouni, S., and M. Roux. 2004. “Hyperspectral Image Analysis for Material Mapping UsingSpectral Matching.” ISPRS Congress Proceedings, Istanbul, Turkey, July 12–23.
Hook, S. J. 2014. “HyspIRI Ecosystem Spectral Library.” http://hesl.jpl.nasa.govJanja, A. 2012. “Spectral Information Retrieval for Sub-Pixel Building Edge Detection.” XXII
Congress of the International Society for Photogrammetry and Remote Sensing, Melbourne,Australia, August 25–September 1. Melbourne Convention and Exhibition Centre.
Jia, X., and J. A. Richards. 1993. “Binary Coding of Imaging Spectrometer Data for Fast SpectralMatching and Classification.” Remote Sensing of Environment 43: 47–53. doi:10.1016/0034-4257(93)90063-4.
Jiao, H., Y. Zhong, and L. Zhang. 2012. “Artificial DNA Computing-Based Spectral Encoding andMatching Algorithm for Hyperspectral Remote Sensing Data.” IEEE Transactions onGeoscience and Remote Sensing 50: 4085–4104. doi:10.1109/TGRS.2012.2188856.
Kim, R. S. 2011. “Spectral Matching using Bitmap Indices of Spectral Derivatives for the Analysisof Hyperspectral Imagery.” Master in Science, Ohio State University.
Kraut, S., and L. L. Scharf. 1999. “The CFAR Adaptive Subspace Detector Is a Scale-InvariantGLRT.” IEEE Transactions on Signal Processing 47: 2538–2541. doi:10.1109/78.782198.
Kruse, F. A., A. B. Lefkoff, J. W. Boardman, K. B. Heidebrecht, A. T. Shapiro, P. J. Barloon, andA. F. H. Goetz. 1993. “The Spectral Image Processing System (SIPS) – Interactive Visualizationand Analysis of Imaging Spectrometer Data.” Remote Sensing of Environment 44: 145–163.doi:10.1016/0034-4257(93)90013-N.
Kumar, A. S., S. Jayabharathi, A. S. Manjunath, and K. M. M. Rao. 2006. “Fast Searching ofSpectral Library Database Using Variable Interval Spectral Average Method.” Proceedings ofSPIE Asia-Pacific Remote Sensing Symposium on Multispectral, Hyperspectral andUltraspectral Remote Sensing Technology and Applications, Goa, November 13–17,6405–6440.
Kumar, A. S., V. Keerthi, A. S. Manjunath, H. van der Werff, and F. van der Meer. 2014.“Hyperspectral Image Classification by a Variable Interval Spectral Average and SpectralCurve Matching Combined Algorithm.” International Journal of Applied Earth Observationand Geoinformation 12: 261–269. doi:10.1016/j.jag.2010.03.004.
Lam, H., E. W. Deutsch, J. S. Eddes, J. K. Eng, N. King, S. E. Stein, and R. Aebersold. 2007.“Development and Validation of a Spectral Library Searching Method for Peptide Identificationfrom MS/MS.” Proteomics 7: 655–667. doi:10.1002/pmic.200600625.
Lau, O. W., P. K. Hon, and T. Bai. 2000. “A New Approach to a Coding and Retrieval System forInfrared Spectral Data: The effective Peaks Matching Method.” Vibrational Spectroscopy 23:23–30. doi:10.1016/S0924-2031(99)00084-3.
Leenaars, J. G. B. 2013. “Africa Soil Profiles Database, Version 1.1.A Compilation ofGeoreferenced and Standardised Legacy Soil Profile Data for Sub-Saharan Africa (WithDataset).” ISRIC Report 2013/03. Africa Soil Information Service (AfSIS) Project. ISRIC-World Soil Information, Wageningen, Netherlands, 160.
Levin, S. 1999. “Considerations in Peak Purity Measurements in HPLC.” 2nd Conference of theIsrael Analytical Chemical Society, Analyza, Exhibition Park, Tel Aviv, January.
8248 S. Shanmugam and P. SrinivasaPerumal
Dow
nloa
ded
by [
Ann
a U
nive
rsity
] at
19:
08 0
7 D
ecem
ber
2014

Li, H., W. S. Lee, K. Wang, R. Ehsani, and C. Yang. 2014. “Extended Spectral Angle Mapping(ESAM) for Citrus Greening Disease Detection Using Airborne Hyperspectral Imaging.”Precision Agriculture 15: 162–183. doi:10.1007/s11119-013-9325-6.
Li, H., W. S. Lee, R. Wang, R. Ehsani, and C. Yang. 2012. “Spectral Angle Mapper (SAM) BasedCitrus Greening Disease Detection Using Airborne Hyperspectral Imaging.” 11th InternationalConference on Precision Agriculture, Indianapolis, IN, July 15–18.
Li, J., S. Fuller, J. Cattle, W. C. Pang Way, and H. D. Brynn Hibbert. 2004. “Matching FluorescenceSpectra of Oil Spills with Spectra from Suspect Sources.” Analytica Chimica Acta 514: 51–56.doi:10.1016/j.aca.2004.03.053.
Li, J., D. B. Hibbert, S. Fuller, and G. Vaughn. 2006. “A Comparative Study of Point-To-PointAlgorithms for Matching Spectra.” Chemometrics and Intelligent Laboratory Systems 82:50–58. doi:10.1016/j.chemolab.2005.05.015.
Louchard, E. M., R. P. Reid, F. C. Stephens, C. O. Davis, R. A. Leathers, and T. V. Downes. 2003.“Optical Remote Sensing of Benthic Habitats and Bathymetry in Coastal Environments at LeeStocking Island, Bahamas: A Comparative Spectral Classification Approach.” Limnology andOceanography 48: 511–521. doi:10.4319/lo.2003.48.1_part_2.0511.
Luc, B., B. Deronde, P. Kempeneers, W. Debruyn, and S. Provoost. 2005. “Optimized SpectralAngle Mapper Classification of Spatially Heterogeneous Dynamic Dune Vegetation, a CaseStudy along the Belgian Coastline.” 9th International Symposium on Physical Measurementsand Signatures in Remote Sensing (ISPMSRS), Beijing, October 17–19.
Ma, S., Z. Tao, X. Yang, Y. Yu, X. Zhou, and Z. Li. 2014. “Bathymetry Retrieval FromHyperspectral Remote Sensing Data in Optical-Shallow Water.” IEEE Transactions onGeoscience and Remote Sensing 52: 1205–1212. doi:10.1109/TGRS.2013.2248372.
Manolakis, D., R. Lockwood, T. Cooley, and J. Jacobson. 2009. “Is There a Best HyperspectralDetection Algorithm?” Algorithms and Technologies for Multispectral, Hyperspectral, andUltraspectral Imagery XV, SPIE 7334: 733402–733416. doi:10.1117/12.816917.
Manolakis, D., D. Marden, and G. A. Shaw. 2003. “Hyperspectral Image Processing for AutomaticTarget Detection Applications.” Lincoln Laboratory Journal 14: 79–116.
Mistrik, R., J. Lutisan, Y. Huang, M. Suchy, J. Wang, and M. Raab. 2013. “mzCloud: A KeyConceptual Shift to Understand ‘Who’s Who’ in Untargeted Metabolomics.” MetabolomicsSociety 2013 Conference, Glasgow, July 1–4.
Mobley, C. D., L. K. Sundman, C. O. Davis, J. H. Bowles, T. V. Downes, R. A. Leathers, M. J.Montes, W. P. Bissett, D. D. R. Kohler, R. P. Reid, E. M. Louchard, and A. Gleason. 2005.“Interpretation of Hyperspectral Remote Sensing Imagery by Spectrum Matching and Look-UpTables.” Applied Optics 44: 3576–3592. doi:10.1364/AO.44.003576.
Naresh Kumar, M., V. R. Seshasai, K. S. Vara Prasad, V. Kamala, K. V. Ramana, R. S. Dwivedi, andP. S. Roy. 2011. “A New Hybrid Spectral Similarity Measure for Discriminationamong VignaSpecies.” International Journal of Remote Sensing 32: 4041–4053. doi:10.1080/01431161.2010.484431.
Nasarudin, N. E. M., and H. Z. M. Shafri. 2011. “Development and Utilization of Urban SpectralLibrary for Remote Sensing of Urban Environment.” Journal of Urban and EnvironmentalEngineering 5: 44–56. doi:10.4090/juee.2011.v5n1.044056.
Nidamanuri, R. R., and B. Zbell. 2010. “A Method for Selecting Optimal Spectral Resolution andComparison Metric for Material Mapping by Spectral Library Search.” Progress in PhysicalGeography 34: 47–58. doi:10.1177/0309133309356376.
Nidamanuri, R. R., and B. Zbell. 2011a. “Normalized Spectral Similarity Score.” IEEE Journal ofSelected Topics in Applied Earth Observations and Remote Sensing 4: 226–240. doi:10.1109/JSTARS.2010.2086435.
Nidamanuri, R. R., and B. Zbell. 2011b. “A Spectral Matching Quality Indicator for MaterialMapping Using Spectral Library Search Methods.” International Journal of Remote Sensing32: 7151–7162. doi:10.1080/01431161.2010.519005.
Padma, S., and S. Sanjeevi. 2014. “Jeffries Matusita Based Mixed-Measure for Improved SpectralMatching in Hyperspectral Image Analysis.” International Journal of Applied EarthObservation and Geoinformation 32: 138–151. doi:10.1016/j.jag.2014.04.001.
Pan, Z., J. Huang, and F. Wang. 2013. “Multi Range Spectral Feature Fitting for HyperspectralImagery in Extracting Oilseed Rape Planting Area.” International Journal of Applied EarthObservation and Geoinformation 25: 21–29.
International Journal of Remote Sensing 8249
Dow
nloa
ded
by [
Ann
a U
nive
rsity
] at
19:
08 0
7 D
ecem
ber
2014
Parshakov, I. 2012. “Automatic Class Labeling of Classified Imagery Using a HyperspectralLibrary.” Bachelor of Science diss., University of Lethbridge.
PDS Geosciences Spectral Library. 2014. http://speclib.rsl.wustl.edu/search.aspxPublic Lab Store: Starter kits for DIY Environmental Science. 2014. http://store.publiclab.orgRasaiah, B., S. Jones, T. J. Malthus, and C. Bellman. 2012. “Critical Metadata Protocols in
Hyperspectral Field Campaigns for Building Robust Hyperspectral Datasets.” ISPRS-International Archives of the Photogrammetry, Remote Sensing and Spatial InformationSciences XXXIX-B2: 161–165. doi:10.5194/isprsarchives-XXXIX-B2-161-2012.
Rasaiah, B., T. J. Malthus, S. D. Jones, and C. Bellman. 2011. “The Role of Hyperspectral Metadatain Hyperspectral Data Exchange and Warehousing.” Proceedings of the 7th Earsel Workshop,Edinburgh, Scotland, April 11–13.
RELAB: NASA Reflectance Experiment Laboratory. 2014. http://www.planetary.brown.edu/relab-docs/relab_disclaimer.htm
Robila, S. A., and A. Gershman. 2005. “Spectral Matching Accuracy in Processing HyperspectralData.” IEEE International Symposium on Signals, Circuits and Systems 1: 163–166.
Ruby, J. G., and R. L. Fischer. 2002. “Spectral Signatures Database for Remote SensingApplications.” International Symposium on Optical Science and Technology, ImagingSpectrometry VIII SPIE 4816: 156–163. doi:10.1117/12.453793.
Salem, F., T. El-Ghazawi, and M. Kafatos. 2001. “Remote Sensing and Image Analysis for Oil SpillMitigation in the Red Sea.” Proceedings of the 2nd Biennial Coastal GeoTools Conference,Charleston, SC, January 8–11.
Schiefer, S., P. Hostert, and A. Damm. 2005. “Analysis of View-Angle Effects in HyperspectralData of Urban Areas.” 3rd International Symposium Remote Sensing and Data Fusion OverUrban Areas (URBAN 2005). International Archives of Photogrammetry, Remote Sensing andSpatial Information Services 36: W27.
Schwarz, J., and K. Staenz. 2001. “Adaptive Threshold for Spectral Matching of Hyperspectral Data.”Canadian Journal of Remote Sensing 27: 216–224. doi:10.1080/07038992.2001.10854938.
Scott, D. R. 1988. “Effects of Binary Encoding on Pattern Recognition and Library Matching ofSpectral Data.” Chemometrics and Intelligent Laboratory Systems 4: 47–63. doi:10.1016/0169-7439(88)80012-1.
Shwetank, S., K. Jain, and K. Bhatia. 2011. “Development of Digital Spectral Library andSupervised Classification of Rice Crop Varieties Using Hyperspectral Image Processing.”Asian Journal of Geoinformatics 11: 43–51.
Singh, K. D., D. Ramakrishnan, and L. Mansinha. 2012. “Relevance of Transformation Techniquesin Rapid End-Member Identification and Spectral Unmixing: A Hypespectral Remote SensingPerspective.” In Proceedings of IGARSS – 2012, Munich, 4066–4069.
Spectral International Inc. 2012. http://www.spectral-international.comSpectral Workbench. 2014. http://publiclab.org/wiki/spectral-workbenchStaenz, K., J. Schwarz, and J. Cheriyan. 1996. “Processing/Analysis Capabilities for Data Acquired
with Hyperspectral Spaceborne Sensors.” ACTA Astronautica 39: 923–931. doi:10.1016/S0094-5765(97)00078-7.
Staenz, K., J. Schwarz, L. Vernaccini, F. Vachon, and C. Nadeau. 1999. “Classification ofHyperspectral Agricultural Data with Spectral Matching Techniques.” Proceedings of theInternational Symposium on Spectral Sensing Research (ISSSR 99), Las Vegas, NV,October 31–November 4.
Stein, S. E., and D. R. Scott. 1994. “Optimization and Testing of Mass Spectral Library SearchAlgorithms for Compound Identification.” Journal of the American Society for MassSpectrometry 5: 859–866. doi:10.1016/1044-0305(94)87009-8.
Thenkabail, P. S., R. A. O. Gangadhara, T. W. Biggs, M. Krishna, and H. Turral. 2007. “SpectralMatching Techniques to Determine Historical Landuse/Land-Cover (LULC) and Irrigated AreasUsing Time-Series 0.1 Degree AVHRR Pathfinder Datasets.” Photogrammetric Engineering &Remote Sensing 73: 1029–1040.
Van Der Meer, F. 2000. “Spectral Curve Shape Matching with a Continuum Removed CCSMAlgorithm.” International Journal of Remote Sensing 21: 3179–3185. doi:10.1080/01431160050145063.
Van Der Meer, F. 2006. “The Effectiveness of Spectral Similarity Measures for the Analysis ofHyperspectral Imagery.” International Journal of Applied Earth Observation andGeoinformation 8: 3–17. doi:10.1016/j.jag.2005.06.001.
8250 S. Shanmugam and P. SrinivasaPerumal
Dow
nloa
ded
by [
Ann
a U
nive
rsity
] at
19:
08 0
7 D
ecem
ber
2014

Van Der Meer, F., and W. Bakker. 1997. “CCSM: Cross Correlogram Spectral Matching.”International Journal of Remote Sensing 18: 1197–1201. doi:10.1080/014311697218674.
Vegetation Spectral Library. 2014. http://spectrallibrary.utep.edu/Viscarra Rossel, R. 2008. “The Soil Spectroscopy Group and the Development of a Global Soil
Spectral Library”. Pedometron, The Newsletter of the Pedometrrics Commission of the IUSS,Vol. 25.
Vishnu, S., R. R. Nidamanuri, and R. Bremananth. 2013. “Spectral Material Mapping UsingHyperspectral Imagery: A Review of Spectral Matching and Library Search Methods.”Geocarto International 28: 171–190. doi:10.1080/10106049.2012.665498.
Warner, T. A., M. D. Nellis, and G. M. Foody, eds. 2009. The SAGE Handbook of Remote Sensing.London: SAGE.
Wiemker, R., and T. Hepp. 1994. “Surface Orientation Invariant Matching of Spectral Signatures.”In Spatial Information from Digital Photogrammetry and Computer Vision: ISPRS CommissionIII Symposium, International Society for Optics and Photonics, vol. 2357, edited by H. Ebner,C. Heipke, and K. Eder, Munich, 916–923. Bellingham, WA: International Society for Opticsand Photonics (SPIE).
Xie, H., C. Heipke, P. Lohmann, U. Soergel, X. Tong, and W. Shi. 2011. “A New Binary EncodingAlgorithm for the Simultaneous Region-Based Classification of Hyperspectral Data and DigitalSurface Models.” Photogrammetrie – Fernerkundung – Geoinformation 2011 (1): 17–33.doi:10.1127/1432-8364/2011/0072.
Zhang, X., and P. Li. 2014. “Lithological Mapping from Hyperspectral Data by Improved UseOfspectral Angle Mapper.” International Journal of Applied Earth Observation andGeoinformation 31: 95–109. doi:10.1016/j.jag.2014.03.007.
Zhu, M., H. Xie, G. Guan, and R. K. Smith. 2006. “Mineral and Lithologic Mapping of MartianLow Albedo Regions Using OMEGA Data.” 37th Annual Lunar and Planetary ScienceConference 37: 2173.
Zomer, R. J., A. Trabucco, and S. L. Ustin. 2009. “Building Spectral Libraries for Wetlands LandCover Classification and Hyperspectral Remote Sensing.” Journal of EnvironmentalManagement 90: 2170–2177. doi:10.1016/j.jenvman.2007.06.028.
International Journal of Remote Sensing 8251
Dow
nloa
ded
by [
Ann
a U
nive
rsity
] at
19:
08 0
7 D
ecem
ber
2014