Compact active hyperspectral imaging system for the detection of concealed targets
Upload
khangminh22Category
view
2download
0
USING SPATIAL STRUCTURE ANALYSIS OF HYPERSPECTRAL IMAGING DATA AND FOURIER TRANSFORMED INFRARED ANALYSIS TO DETERMINE BIOACTIVITY OF
SURFACE PESTICIDE TREATMENT
The Texas Tech community has made this publication openly available. Please share how this access benefits you. Your story matters to us.
Title page template design credit to Harvard DASH.
Citation Nansen C, Abidi N, Sidumo AJ, Gharalari AH. Using Spatial Structure Analysis of Hyperspectral Imaging Data and Fourier Transformed Infrared Analysis to Determine Bioactivity of Surface Pesticide Treatment. Remote Sensing. 2010; 2(4):908-925. https://doi.org/10.3390/rs2040908
Citable Link https://hdl.handle.net/2346/89333
Terms of Use CC BY 3.0

Remote Sensing 2010, 2, 908-925; doi:10.3390/rs2040908
Remote Sensing ISSN 2072-4292
www.mdpi.com/journaL/remotesensing
Article
Using Spatial Structure Analysis of Hyperspectral Imaging Data
and Fourier Transformed Infrared Analysis to Determine
Bioactivity of Surface Pesticide Treatment
Christian Nansen 1,2,
*, Noureddine Abidi 3, Amelia Jorge Sidumo
2 and Ali Hosseini Gharalari
1
1 Texas AgriLife Research, 1102 East FM 1294, Lubbock, TX 79403 USA;
E-Mail: [email protected] 2
Department of Plant and Soil Science, Texas Tech University, Campus Box 42122, Lubbock, TX
79409 USA; E-Mail: [email protected] 3
Fiber and Biopolymer Research Institute, Department of Plant and Soil Science, Texas Tech
University, Campus Box 45019, Lubbock, TX 79409 USA; E-Mail: [email protected]
* Author to whom correspondence should be addressed; E-Mail: [email protected];
Tel.: +1-806-746-6101; Fax: +1-806-746-6528.
Received: 26 January 2010; in revised form: 10 March 2010 / Accepted: 22 March 2010 / Published: 26 March 2010
Abstract: Many food products are subjected to quality control analyses for detection of
surface residue/contaminants, and there is a trend of requiring more and more
documentation and reporting by farmers regarding their use of pesticides. Recent outbreaks
of food borne illnesses have been a major contributor to this trend. With a growing need
for food safety measures and ―smart applications‖ of insecticides, it is important to develop
methods for rapid and accurate assessments of surface residues on food and feed items. As
a model system, we investigated detection of a miticide applied to maize leaves and its
miticidal bioactivity over time, and we compared two types of reflectance data: fourier
transformed infrared (FTIR) data and hyperspectral imaging (HI) data. The miticide
(bifenazate) was applied at a commercial field rate to maize leaves in the field, with or
without application of a surfactant, and with or without application of a simulated ―rain
event‖. In addition, we collected FTIR and HI from untreated control leaves (total of five
treatments). Maize leaf data were collected at seven time intervals from 0 to 48 hours after
application. FTIR data were analyzed using conventional analysis of variance of
miticide-specific vibration peaks. Two unique FTIR vibration peaks were associated with
miticide application (1,700 cm−1
and 763 cm−1
). The integrated intensities of these two
OPEN ACCESS

Remote Sensing 2010, 2
909
peaks, miticide application, surfactant, rain event, time between miticide application, and
rain event were used as explanatory variables in a linear multi-regression fit to spider mite
mortality. The same linear multi-regression approach was applied to variogram parameters
derived from HI data in five selected spectral bands (664, 683, 706, 740, and 747 nm). For
each spectral band, we conducted a spatial structure analysis, and the three standard
variogram parameters (―sill‖, ―range‖, and ―nugget‖) were examined as possible
―indicators‖ of miticide bioactivity. We demonstrated that both FTIR peaks and standard
variogram parameters could be used to accurately predict spider mite mortality, but linear
multi-regression fits based on standard variogram parameters had the highest accuracy and
were successfully validated with independent data. Based on experimental manipulation of
HI data, the use of spatial structure analysis in classification of HI data was discussed.
Keywords: hyperspectral imaging; fourier transformed infrared analysis; variogram
analysis; residue analysis; miticide
1. Introduction
Many food products are subjected to quality control analyses before sold to consumers, and there is
a trend of requiring more and more documentation and reporting by farmers regarding their use of
pesticides. At the same time, reflectance-based quality control systems are becoming increasingly
more versatile, robust and more affordable. Pesticide and contaminant (i.e., fecal) residues and surface
defects on vegetables and fruits [1-4] and meat [5] are of particular interest due to recent concerns
about outbreaks of food borne illnesses [3]. Thus, among farmers, crop consultants, extension services,
food processors, food distributors, and agricultural inspection entities there is a need for real-time tools
to detect and quantify pesticides and other surface residues on food and feed materials. Precision
agriculture [6,7], food quality and safety [8-11], and pharmaceutical industries [12] are just some of
the areas in which reflectance-based analysis is becoming increasingly important. It is obviously
important to continue improving the quality and robustness of spectral sensors, but it is equally
important to develop classification algorithms that allow accurate, rapid and reliable processing and
analysis of large reflectance data sets. Objects reflect electromagnetic energy according to their
chemical composition, particle size, physical structure, and temperature [13], and different chemical
bonds absorb and transmit light in uniquely different ways. The acquired signal of reflected
electromagnetic energy is determined by the illumination source, projection angle, and type of spectral
sensor. Reflection from a theoretically constant light source constitutes a ―radiometric fingerprint‖,
which are compared with reflectance data from training data set and subsequently
classified/distinguished based on their chemical or physical properties. The driving factors behind
widespread implementation of reflectance-based systems are: (1) data is acquired, processed and
analyzed real-time due to increasingly faster and more powerful telecommunication systems and
computer processing, (2) data acquisition is non-destructive, (3) labor intensive chemical procedures
and/or qualitative/subjective evaluation procedures can be automated and replaced by quantitative
standards, and (4) the technology is becoming increasingly cost-effective.
Remote Sensing 2010, 2
910
Fourier Transform Infrared spectroscopy (FTIR) is a rapid, non-destructive technique that can
quantitatively detect a range of functional groups in the sample. It has been successfully used to
investigate contaminated cotton fibers and yarn defects [14,15]. Furthermore, FTIR has emerged as a
key technique for the study of plant growth and development [16-25]. Hyperspectral imaging (HI) data
are acquired with line-scanning devices in which individual pixels are associated with a reflectance
profile with reflectance values in narrow wavelength bands. Most HI sensors collect reflectance or
transmission data within 350–2,500 nm (visible and near-infrared spectra).
Standard analytical approaches used in analysis of reflectance data include (see [9] for review):
discriminant analysis [10,11,26], principal component analysis [3,21,26-28], multi-regression
approaches, like partial least square (PLS) [12,29,30], use of spectral band ratios (indices) [3,31-33],
decision trees [34], artificial neural networks [17,28,34], and support vector machines [8,35]. One
common denominator in all of these analytical approaches is that they do not incorporate—or take
advantage of —the spatial information available in a HI data.
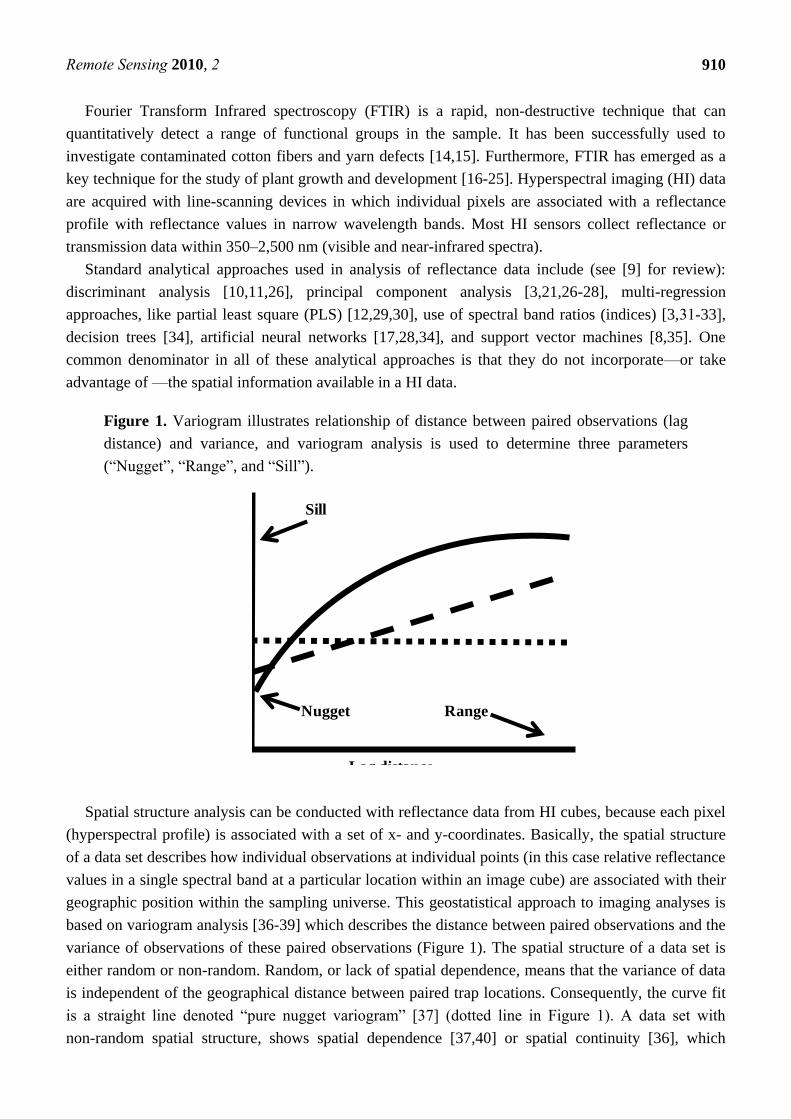
Figure 1. Variogram illustrates relationship of distance between paired observations (lag
distance) and variance, and variogram analysis is used to determine three parameters
(―Nugget‖, ―Range‖, and ―Sill‖).
Va
ria
nce
Lag distance
Nugget
Sill
Range
Spatial structure analysis can be conducted with reflectance data from HI cubes, because each pixel
(hyperspectral profile) is associated with a set of x- and y-coordinates. Basically, the spatial structure
of a data set describes how individual observations at individual points (in this case relative reflectance
values in a single spectral band at a particular location within an image cube) are associated with their
geographic position within the sampling universe. This geostatistical approach to imaging analyses is
based on variogram analysis [36-39] which describes the distance between paired observations and the
variance of observations of these paired observations (Figure 1). The spatial structure of a data set is
either random or non-random. Random, or lack of spatial dependence, means that the variance of data
is independent of the geographical distance between paired trap locations. Consequently, the curve fit
is a straight line denoted ―pure nugget variogram‖ [37] (dotted line in Figure 1). A data set with
non-random spatial structure, shows spatial dependence [37,40] or spatial continuity [36], which

Remote Sensing 2010, 2
911
means that data points close to each other are generally more similar than observations at locations
further apart. Spatial dependence is linear (dashed line in Figure 1) when the variance in counts
increases proportionally with lag distance, or asymptotic when the variance of counts levels off after a
certain lag distance and becomes constant (solid line in Figure 1). Asymptotic spatial dependence is
the most commonly observed phenomenon, because it suggests that data points are spatially correlated
up to a certain distance and then become uncorrelated. Once the variogram has been generated, a
regression curve fit is used to characterize the spatial structure, and this regression fit includes three
standard parameters, ―nugget‖, ―range‖, and ―sill‖. The nugget represents an estimate of the variance
between observations collected at ―zero distance apart‖, which equals the noise or stochasticity in the
data set. The range is an estimate of the maximum distance at which point observations are spatially
auto-correlated, beyond this distance point observations are to be considered spatially uncorrelated. As
the distance between point observations increase, the variance asymptotically approaches the sill,
which is an estimate of the total variance explained within the spatial structure analysis. For instance,
in ecology, it is often seen that environmental observations collected in close proximity to each other
are more similar than observations collected further apart. Thus, variance among paired observations is
correlated to the distance between points. Analysis of the spatial structure of reflectance values in a
single spectral band can be used as indicator of plant stress [41]. The underlying assumption in these
studies is that reflectance data from a healthy crop leaf are more uniform than those acquired from a
stressed crop leaves. A change in variance among adjacent spectral profiles will inherently cause a
change in standard variogram parameters. The exact biological meaning of these three standard
variogram parameters is not fully understood, but the use of variogram parameters as indicators of crop
stress was a more consistent analytical approach more conventional analyses of mean/variance
reflectance values and standard indices.
In this study, we investigated the hypothesis that standard variogram parameters can be used to
assess the bioactivity of a miticide applied to crop leaves. We applied a miticide [Acramite (Chemtura
Corporation, Middlebury, CT. AI: bifenazate)] at a known rate to portions of maize leaves under field
conditions and subsequently tested spider mite mortality and conducted Fourier transformed infrared
analysis (FTIR) and HI analyses of treated and untreated maize leaves. We examined miticide
applications with or without addition of a surfactant and with or without a subsequent simulated rain
event. Variogram analysis was used to identify standard variogram parameters from each experimental
unit, while FTIR data were analyzed using conventional parametric statistics. We examined to what
extent absolute FTIR peak values acquired from maize leaves were associated with spider mite
mortality. Standard variogram parameters from HI analysis acquired from maize leaves were also
examined as possible explanatory variables of spider mite mortality. A training regression model of HI
data was successfully validated with an independent data set. As part of a ―robustness test‖, HI data
were experimentally manipulated (systematic and random changes in reflectance values), and we
evaluated the effects of data manipulations on variogram parameters. Based on experimental
re-manipulation of HI data, we discuss the use of spatial structure analysis in classification of HI data.

Remote Sensing 2010, 2
912
2. Materials and Methods
2.1. Experimental Design
2.1.1. Treatment with Miticide of Maize Leaves Under Field Conditions
Data were collected from a maize field plot (50 m wide and 50 m long) at the Texas AgriLife
Research and Extension Center in Lubbock, TX, USA. The maize was planted on June 2 and leaf data
were collected at tasseling stage on two separate dates (data set 1: July 30, 2008, data set 2: August 6,
2008). Within each of 5 rows, we selected 32 plants, 3–5 plants apart, and all selected plants within
each row were treated the same way (see below). The 10 cm diameter mid portion of the 7th or 8th leaf
(counting from the lowest leaf) on a maize plant constituted the experimental unit in this study, and
only one leaf on each selected plant was included. Data set 1 included five treatments including
miticide (Chemtura Corporation, Middlebury, CT. AI: bifenazate) at a single rate [4.7 nL/cm2 (12
ounces per acre) in a 1.5 µL/cm2 (20 gallon per acre) water formulation]: (1) miticide only and no rain
event, (2) miticide only and rain event, (3) miticide and a surfactant but no rain event, (4) miticide and
a surfactant and rain event, and (5) no treatment (untreated control). The used application rate of the
surfactant, Silwet L-77 (Setre Chemical Company, Memphis, TN, USA), was 1.0 nL/cm2 (2.5 ounces
per acre). Data set 2 included 10 treatments: miticide (bifenazate) applied at four rates [4.7 (12 ounces
per acre), 6.3 (16 ounces per acre), 7.8 (20 ounces per acre), and 9.4 (24 ounces per acre) nL/cm2 in a
1.5 µL/cm2 (20 gallon per acre)] water formulation) with/without rain event, and we included untreated
controls (negative control) and water only treatment (positive control).
The miticide was applied onto carefully marked (marked with a sharpie) portions of leaves in the
field, using a custom-built device, here referred to as the ―bottle sprayer‖ [41]. In brief, the bottle
sprayer consists of an airbrush (Master Airbrush model G22, TCP Global®
, San Diego, CA, USA)
inside a plastic funnel which is inside a 2-liter soda bottle, spraying at a fixed distance (20 cm). A CO2
gas cylinder with corresponding regulator (JO Series, Compressed Gas Regulator, Chudnow, MFG.
CO. Inc., Oceanside, NY, USA) and connecting tubes provide a controlled and consistent pressure.
Based on a priori calibration, we used a CO2 pressure of 10 psi and sprayed for 1 second (measured
with a metronome). In data set 1, all five treatments (including untreated control) were applied to each
of 32 experimental units at two pm (total of 160 experimental units), and four replicated experimental
units were collected at 0, 1, 4, 6, 12, 24, and 48 h later. In data set 2, all treatments were applied at two
pm and collected two hours later. Regarding treatments involving simulated rain, we used a
transformed 2-liter soda bottle with a perforated bottom, and it was held 20 cm above the leaf when
simulating the rain event. Perforations were made in a regular grid (1 cm between holes) with a total
of 52 perforations. Preliminary analysis of the last five years weather data obtained from weather
stations located on the Southern High Plains indicated that most rain events produce 2.5–12.5 mm
water. Therefore, the equivalent of 13 mm rain fall was applied to experimental units as a simulated
rain event. Ideally, leaf samples should be collected from maize plants, which had been sprayed
according to commercial standards. However, dosage of miticide applied to individual leaves varies
tremendously—both within and between plants (this can be tested easily by comparing water sensitive
spray cards placed in fields prior to pesticide application). Although, used methods for applying both
miticide and simulate rain provided applications that were different from ‗real-world‘ applications,

Remote Sensing 2010, 2
913
they permitted us to acquire highly repeatable data. Immediately after collection of leaf material,
experimental units were placed on dry ice and transferred to laboratory conditions and divided into
three parts: ½ for spider mite bioassay, ¼ for FTIR analysis, and ¼ for HI analysis.
2.1.2. Spider Mite Bioactivity
In analyses of agro-chemicals applied to crops, there are multiple chemical-based techniques,
including high pressure liquid chromatography, to quantify the amount applied. However, in studies of
pesticides, the most valuable information is whether a given application is efficacious or not—whether
it provides control of the target pest or not. Thus, in this study we did not quantify how much miticide
was applied to each leaf but examined its ―bioactivity‖ against spider mites (Tetranychidae). Spider
mites are important pests on maize in the southern high plains [42]. Spider mites used in this study
originated from naturally infested maize fields near Lubbock (TX, USA) in the summer of 2007, and
they had been reared on maize plants in a greenhouse at the Texas AgriLife Research and Extension
Center (Lubbock, TX, USA). The spider mite bioassay was conducted in Petri dishes (100 × 15 mm)
containing a 2.3 % water agar solution. In each bioassay, maize leaf pieces (6 × 4 cm) were placed on
water agar solution with the top side upwards. Three adult female mites were transferred to each maize
leaf piece. Within five min after transfer to Petri dishes, spider mites were observed to ensure they
were alive and behaved normally. In this spider mite bioassay, Petri dishes were kept under ambient
conditions in a laboratory (19–21 C and 40–60% RH), and spider mite survival and mortality were
assessed 48 h after infestation.
2.2. Fourier Transformed Infrared Spectroscopy (FTIR)
FTIR spectra of maize leaves were recorded in an environmentally-controlled laboratory (21 1 C
and 65 2% RH) using the Spectrum-One equipped with an UATR (Universal Attenuated Total
Reflectance) accessory (PerkinElmer, USA). The UATR-FTIR was equipped with a ZnSe-Diamond
crystal composite that allows collection of FTIR spectra directly on a sample without any special
preparation. The instrument is equipped with a ―pressure arm‖ which is used to apply a constant
pressure to maize leaves positioned on top of the ZnSe-Diamond crystal to ensure a good contact
between the sample and the incident IR beam. The amount of pressure applied is monitored by the
Perkin-Elmer FTIR software. We collected 30 FTIR spectra from each maize leaf. All FTIR spectra
were collected at a spectrum resolution of 4 cm−1
, with 32 co-added scans over the range from
4,000 cm−1
to 650 cm−1
. A background scan of clean ZnSe-Diamond crystal was acquired before
scanning the samples. The Perkin-Elmer software was used to perform spectra normalization, baseline
corrections, and peak integration. Data set 1 was used for FTIR analysis. Comparisons of absorption
spectra from miticide-treated and untreated maize leaves were used to identify the FTIR bands that
were specific to the miticide. Spectra of pure miticide were also collected as a reference (standard).
After baseline correction and normalization, the integrated peak intensities of specific peaks
were determined.

Remote Sensing 2010, 2
914
2.3. Hyperspectral Imaging (HI)
We used a line-scanning hyperspectral camera (PIKA II, www.resonon.com) acquiring 160 spectral
bands within the wavelength range from 405 to 907 nm (wavelength resolution of 3.1 nm) mounted on
an aluminum tower-structure about 35 cm above a Petri dish (9-cm diameter) holding individual maize
leaf pieces. Details about the image acquisition conditions are available in [11]. Hyperspectral images
of individual maize leaf pieces were acquired at a magnification representing about 166 hyperspectral
profiles (pixels) per mm2. All hyperspectral images were collected in a dark room, and artificial
lighting consisted of two 12V 20W 20° and four 12V 5W 30° halogen light bulbs mounted in two
angled rows—one on either side of the lens. As lighting power source, we used a voltage stabilizer
(Tripp-Lite®, PR-7b, www.radioreference.com). A piece of white Teflon (K-Mac Plastics, MI, USA)
was used for calibration, and for each spectral band, hyperspectral reflectance profiles were converted
into proportions of the reflection from Teflon (denoted relative reflectance). The hyperspectral camera
used in this study has 640 sensors in linear array, and an image representing 100 lines/frames is equal to
64,000 hyperspectral profiles or pixels (3.85 cm2), which was collected from each piece of maize leaf.
Each image data file was imported into PC-SAS 9.1 (SAS Institute Inc., Cary, NC, USA) for statistical
analysis. In data set 1 (training data), comprising of five treatments, seven time points, and four
replications, we acquired spectral data from 140 experimental units. In data set 2 (validation), comprising
of three treatments and four replications, we acquired spectral data from 12 experimental units.
2.4. Non-Spatial Statistical Analysis
The statistical analyses of both FTIR and HI data were based on examination of the following four
treatment effects: miticide treatment (denoted ―miticide‖) (yes = 1/no = 0), surfactant (yes = 1/no = 0)
(denoted ―surfactant‖), rain event (yes = 1/no = 0) (denoted ―rain‖), and time between treatment and
collection of leaf (0–48 hours) (denoted ―time‖). Finally, the response variable ―bioactivity‖ refers to
spider mite mortality from the bioassay (see above). All data were analyzed using procedures in
PC-SAS 9.1 (SAS Institute Inc., Cary, NC, USA). Analysis of variance (PROC MIXED) was used to
examine the four treatment effects on spider mite mortality in data set 1. Separate analyses were
conducted for each time interval.
In the analysis of FTIR analysis of data set 1, only two peaks (1,700 cm−1
and 763 cm−1
) appeared
to be consistently associated with miticide applications, and a linear regression analysis with forward
stepwise selection option (PROC REG) was conducted with spider mite bioactivity as response
variable and the following six explanatory variables: vibration peaks at 1,700 cm−1
and 763 cm−1
,
―miticide‖, ―surfactant‖, ―rain‖, and ―time‖. The forward selection of the six explanatory variables
with significant contributions was based on calculation of F-statistics.
In the analysis of HI data, we compiled spectral data from time 0 (5 treatment classes × 4
replications × 64,000 hyperspectral profiles = 1,280,000 hyperspectral profiles) and conducted a
stepwise discriminant analysis (PROC STEPDISC) based on calculation of F-statistics with bioactivity
as response variable to determine which five spectral bands that provided the best indication of
miticide treatment immediately after the miticide application had occurred (664, 683, 706, 740,
and 747 nm). Separate analyses of variance (PROC MIXED) were conducted to examine effects of the

Remote Sensing 2010, 2
915
four treatment effects (―miticide‖, ―surfactant‖, ―rain‖, and ―time‖) on average reflectance values in
those five spectral bands.
2.5. Spatial Statistical Analysis
Spatial structure analysis of HI data was based on variogram analysis and the selection of spectral
bands was based on an a priori stepwise dicriminant analysis. We conducted a total of 140 variogram
analyses (PROC VARIOGRAM) of data from data set 1 and 12 from data set 2 for each of the five
spectral bands (total of 760 variogram analysis, each based on 64,000 data points). In each variogram
analysis, we used the following settings: lag distance = 1, maxlags = 10, outpdistance = 100. The
variogram (relationship between distance between paired observations and variance) was fitted to a
commonly used regression model [39]:
cD
ebavFEquation3
1:1
In which ―a-c‖ are fitted coefficients. The main conveniences of using Equation 1 for model fit of
the spatial structure are that ―a‖ denotes the nugget, ―b‖ the sill, and ―c‖ the ―range‖.
We conducted analyses of variance for each combination of spectral band and standard variogram
parameter and examined their response to the four treatment effects. In addition, we conducted a linear
multi-regression analysis (PROC REG) with forward selection option with bioactivity as response
variable and the following explanatory variables: the four treatment effects (―miticide‖, ―surfactant‖,
―rain‖, and ―time‖) and standard variogram parameters for each of the five selected spectral band (664,
683, 706, 740, and 747 nm). The forward selection of the six explanatory variables with significant
contributions was based on calculation of F-statistics. A separate multi-regression analysis was
conducted for each of the five spectral bands. The five linear regression fits were validated with an
independent data set (data set 2), and the relationship between observed and predicted was examined.
We constructed an experimental HI data set from a single spectral band (683 nm) of an untreated
maize leaf. This data set was chosen as a priori analysis showed that it was representative for HI data
sets acquired from untreated maize leaves. The 64,000 reflectance values were sorted by descending
x- and y-coordinates, and all reflectance values were multiplied by either 1.025 or 1.050 to simulate a
2.5% and 5.0% increase in all reflectance values. We also conducted random selections of reflectance
values and multiplied half the values with 1.025 and one-third of the reflectance values with 1.050—to
simulate random increase to simulate, for instance, spray application of a comparatively brighter
material onto the leaf surface. The actual variogram parameters from the non-manipulated data were
compared with variograms from the four manipulations.
3. Results
3.1. Spider Mite Bioassay
The spider mite bioassay enabled us, in a repeatable and controlled manner, to determine the
bioactivity of the miticide. Of the four treatment effects, only miticide was significant (df = 1, 128,
F-value = 160.9, P < 0.001), and although mortality in untreated controls was slightly higher than

Remote Sensing 2010, 2
916
expected, the miticide provided >80% mortality on most treated leaves (Figure 2). In the pairwise
contrasts for each time interval between miticide application and rain event, we found a consistent
significant effect of miticide treatment, while effects of rain event and/or addition of surfactant
appeared to have negligible and/or inconsistent effects on the performance of the miticide (Table 1).
Figure 2. Average miticide bioactivity (spider mite mortality) from different treatments.
Statistical analyses of spider mite bioassay results are presented in Table 1.
Hours after application
0 1 4 6 12 24 48
Mit
icid
e b
ioa
ctiv
ity
(s.
e.)
(N=
4)
0.0
0.2
0.4
0.6
0.8
1.0
Miticide only
Miticide and rain event
Miticide and surfactant
Miticide, rain event, and surfactant
Untreated controls
Table 1. F-values from pairwise comparisons of miticide treatments (analysis of variance).
Hours after miticide application Contrast Effect 0 1 4 6 8 12 24 48
1 vs. 5 Acramite no water 14.15** 7.71* 92.76*** 25.52*** 19.76*** 5.41* 8.4* 6.02*
1 vs. 2 Acramite and water 0.05 0.04 0.01 2.34 5.99* 1.02 2.88 5.02*
3 vs. 4 Acramite/surfactant and water 0.17 4.94* 0.75 2.34 0.32 0.09 0.03 0.21
1 vs. 3 Surfactant no water 0.01 2.78 0.75 0.01 1.03 1.52 0.42 0.05
2 vs. 4 Surfactant and water 0.39 0.13 3.01 0.01 0.74 0.43 1.56 8.47*
Hours between miticide application and leaf collection ―*‖: Contrast numbers refer to treatment classes, and separate
analyses of variance were conducted for each time point. ―*‖: significant difference with P < 0.05, ―**‖: significant
difference with P < 0.01, ―***‖: significant difference with P < 0.001.

Remote Sensing 2010, 2
917
3.2. FTIR Analysis
Figure 3 shows the FTIR spectra of untreated maize leaf (green), maize leaf treated with miticides
without rain event (blue), and maize leaf treated with miticides with rain event 1 h after miticide
application (red). Specifically peaks located at 3,313 cm−1
, 1,700 cm−1
, and 763 cm−1
appeared to be
associated with miticide application, and these peaks were also present in the spectrum of pure
miticide (not shown). The vibration located at 3,313 cm−1
is attributed to N-H stretching, the vibration
located at 1,700 cm−1
is attributed to C=O stretching, and the vibration located at 763 cm−1
is attributed
to N-H out-of-plane bending [43]. Both vibrations at 1,700 cm−1
and 763 cm−1
were uniquely
associated with miticide application and not found in FTIR spectra from untreated controls. The results
showed highly significant effects of both miticide and surfactant on both vibration peaks (P < 0.001).
Regarding the vibration peak at 1,700 cm−1
, we also obtained a significant effect of rain (df = 1,135,
F-value = 3.92, P-value = 0.049), but there was no significant effect of time for any of the two
vibration peaks (P > 0.050). In the linear multi-regression analysis of bioactivity, only two variables,
miticide and vibrations at 1,700 cm−1
, contributed significantly to the regression fit (df = 2, 138,
adjusted R2-value = 0.490, F-value = 67.20, P-value < 0.001). The FTIR-based detection of bioactivity
explained about 50% of the variance, which was considerably lower than was obtained based on
spatial structure analysis of HI data (see below), so although significant and interesting because of
unique miticide vibration peaks, the FTIR approach was not pursued further.
Figure 3. Fourier transformed infrared analysis (FTIR) spectra from maize leaves.
Untreated control maize leaf (in green), maize leaf treated with miticide before rain event
(blue), and maize leaf treated with miticide after simulated rain (red).
3.3. Regression Analysis of Average Hi Data per Leaf
Hyperspectral data were collected from small pieces of maize leaf (3.85 cm2) (a). Average
hyperspectral profiles from untreated maize leaves (b) and leaves treated with miticide (c) 0, 4, 12, and
Remote Sensing 2010, 2
918
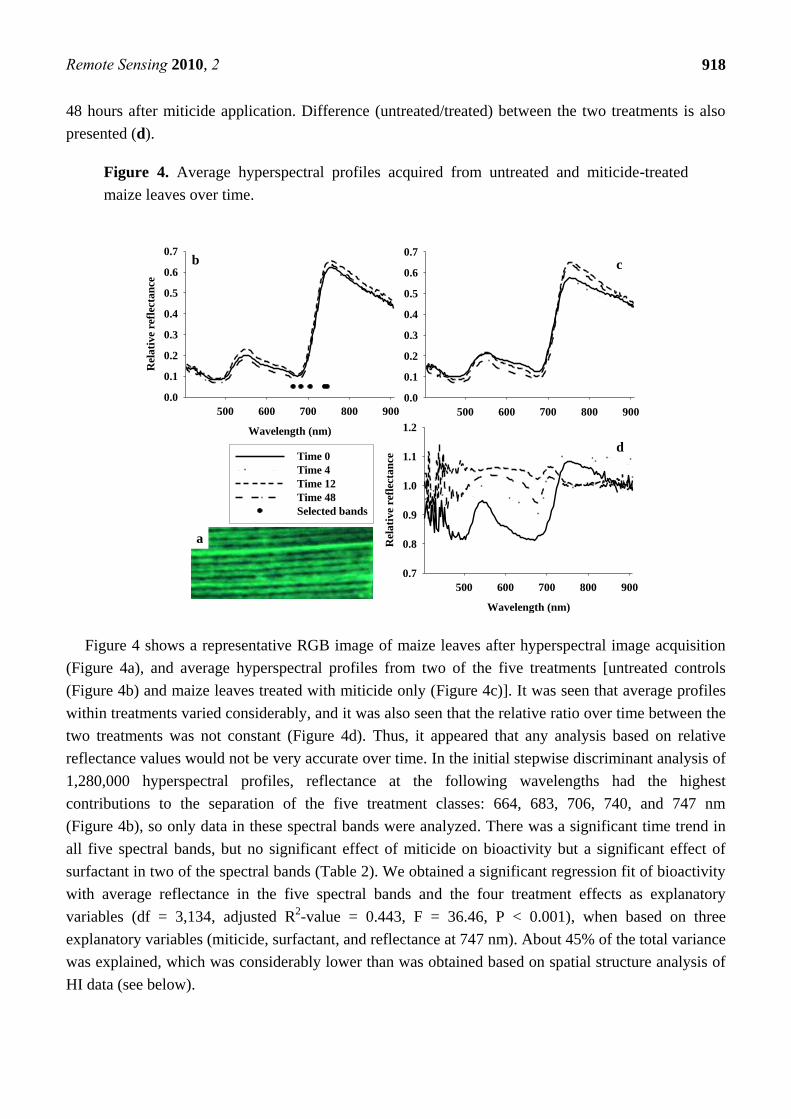
48 hours after miticide application. Difference (untreated/treated) between the two treatments is also
presented (d).
Figure 4. Average hyperspectral profiles acquired from untreated and miticide-treated
maize leaves over time.
Wavelength (nm)
500 600 700 800 900
Rel
ati
ve
refl
ecta
nce
0.0
0.1
0.2
0.3
0.4
0.5
0.6
0.7
Time 0
Time 4
Time 12
Time 48
Selected bands
500 600 700 800 900
0.0
0.1
0.2
0.3
0.4
0.5
0.6
0.7
Wavelength (nm)
500 600 700 800 900
Rel
ati
ve
refl
ecta
nce
0.7
0.8
0.9
1.0
1.1
1.2
a
d
cb
Figure 4 shows a representative RGB image of maize leaves after hyperspectral image acquisition
(Figure 4a), and average hyperspectral profiles from two of the five treatments [untreated controls
(Figure 4b) and maize leaves treated with miticide only (Figure 4c)]. It was seen that average profiles
within treatments varied considerably, and it was also seen that the relative ratio over time between the
two treatments was not constant (Figure 4d). Thus, it appeared that any analysis based on relative
reflectance values would not be very accurate over time. In the initial stepwise discriminant analysis of
1,280,000 hyperspectral profiles, reflectance at the following wavelengths had the highest
contributions to the separation of the five treatment classes: 664, 683, 706, 740, and 747 nm
(Figure 4b), so only data in these spectral bands were analyzed. There was a significant time trend in
all five spectral bands, but no significant effect of miticide on bioactivity but a significant effect of
surfactant in two of the spectral bands (Table 2). We obtained a significant regression fit of bioactivity
with average reflectance in the five spectral bands and the four treatment effects as explanatory
variables (df = 3,134, adjusted R2-value = 0.443, F = 36.46, P < 0.001), when based on three
explanatory variables (miticide, surfactant, and reflectance at 747 nm). About 45% of the total variance
was explained, which was considerably lower than was obtained based on spatial structure analysis of
HI data (see below).

Remote Sensing 2010, 2
919
Table 2. F-values from analysis of variance of average reflectance data in five
spectral bands.
Spectral band (nm) Effect 664 706 740 683 747
Miticide 1.1 0.09 0.01 0.73 0.10
Surfactant 0.1 0.61 9.24** 0.18 10.00***
Water 1.32 0.46 1.42 0.83 1.14
Time 14.02*** 8.51*** 2.33* 11.3*** 2.28*
Miticide treatment (yes/no), time between miticide application and leaf collection, surfactant (yes/no), rain event
(yes/no) were used as explanatory variable of relative reflectance, and statistics from regression fits to both
training and validation data sets are provided. ―*‖: significant difference with P < 0.05, ―**‖: significant
difference with P < 0.01, ―***‖: significant difference with P < 0.001.
3.4. Spatial Structure Analysis of HI Data
Based on 700 separate spatial structure analyses (140 for each of the five spectral bands), it was
seen that nugget values and range values in all five spectral bands showed a highly significant time
trend, while there was only sporadic significant effects by the other three treatments (Table 2). In other
words, the standard variogram parameters did not appear to respond as clearly to treatment effects as
FTIR vibration peaks. However, we used multi-linear regression with forward selection to determine
to what extent the three standard variogram parameters and the four treatment effects could explain
bioactivity. For all five spectral bands, we obtained significant curve fits and were able to
explain >62% of the total variance (Table 3). Miticide treatment, surfactant, and the nugget parameter
contributed significantly to all five regression analyses. Rain effect did not contribute significantly to
any of the regression fits, while the range parameter and time effect only contributed significantly to
the regression fit that involved standard variogram parameters of reflectance data at 747 nm.
Table 3. Parameters and coefficients from regression fits to miticide bioactivity based on
variogram parameters (Nugget, Sill, and Range) and treatment factors (miticide, surfactant,
and time).
Explanatory Variables Training Validation Wavelength (nm) Nugget Sill Range Miticide Surfactant Time Adj R2-value Adj R2-value
664 702.11 88.66 0.059 −0.061 0.639 0.961
706 202.07 44.29 0.059 −0.038 0.629 0.961
740 69.1 0.059 −0.048 0.645 0.96
683 475.14 58.00 0.059 −0.057 0.641 0.962
747 56.44 0.002 0.059 −0.055 −0.003 0.649 0.958
Forward selection based on F-statistics were used to select variogram parameters and treatment
effects that contributed significantly to regression fits to miticide bioactivity (Figure 2). Regression
models were developed based on data set 1 and validated with data set 2.

Remote Sensing 2010, 2
920
3.5. HI Validation and Parameter Investigation
Spatial structure analysis was conducted based on data set 2, and the 12 sets (Three treatment
classes and four replications) of standard variogram parameters were validated based on the
coefficients in Table 3. All five validations (each of the five spectral bands) were highly significant
with adjusted coefficients of determination (adjusted R2-value) > 0.96 (Table 3). The correlation
between observed and predicted bioactivity was highest using standard variogram parameters from the
spectral band at 683 nm with predicted bioactivity as a function of a range of nugget and sill values
(surfactant and miticide treatment were kept constant at 1 and 12, respectively). The coefficients in
Table 3 suggest that even a fairly small increase in nugget value causes a marked increase in predicted
bioactivity. A follow-up question is therefore: what change in a HI data set will change the spatial
structure with particular reference to the nugget value? We addressed this question through
experimental manipulation of reflectance data at 683 nm data from an untreated maize leaf. The
following manipulations were examined: (1) increase all 64,000 reflectance values by 2.5% or 5.0%,
or (2) randomly increase half or one-third of the reflectance values at 683 nm by 2.5% or 5.0%,
respectively. Figure 5 shows that increasing all reflectance values by 2.5% caused an increase in
nugget value by about 5% (from 0.0034 to 0.0036) and sill value by about 5% (0.00059 to 0.00062),
and increasing all reflectance values by 5.0% caused an increase in nugget value by about 10% (from
0.0034 to 0.0079) and sill value by about 10% (from 0.00059 to 0.00065). On the other hand, range
values were unaffected. Thus, the increase in stochastic variance (nugget value) and total variance
explained by the spatial structure was twice the increase in reflectance values. Figure 4 also showed
that randomly increasing portions of the reflectance values appeared to have comparatively highest
impact on nugget values.
Figure 5. Variogram analysis of reflectance data from single spectral band (683 nm) of an
untreated maize leaf were experimentally manipulated in four ways and compared with
actual: multiplying all reflectance values with either 1.025 or 1.050 to simulate a 2.5% and
5.0% increase in all reflectance values or multiplying half the reflectance values (random
selection) with 1.025 or one-third of the reflectance values (random selection) with 1.050.
Lag distance (number of pixels apart)
0 5 10 15 20 25
Va
ria
nce
0.0034
0.0036
0.0038
0.0040
0.0042
0.0044
Actural
+2.5%
+5.0%
+2.5% to random half
+5.0% to random third

Remote Sensing 2010, 2
921
4. Discussion
Reflectance-based analyses are becoming increasingly important in agriculture and elsewhere,
because the technology is highly sensitive and therefore can be used to classify/distinguish objects
with only subtle physical or chemical differences. There are many chemical-based approaches to
residue analysis of insecticides on crops and food items, such as, HPLC [44,45], ELISA [46], gas
chromatography [47,48]. While all of these methods are highly accurate and able to detect very low
residue levels, they require specially trained personnel, fairly sophisticated laboratory conditions, and
are time-consuming. The two analytical approaches used in this study also require certain equipment
capabilities but both are non-destructive procedures that require a minimum of sample preparation, and
they both have the potential of providing results real-time. Due to high sensitivity of reflectance-based
technologies, it is common to see prediction accuracies of training data sets exceeding 85%, but the
real test is how well a given classification algorithm performs on independent data sets. Independent
validations are not always included, and several authors have highlighted some of the challenges
associated with radiometric noise/stochasticity in reflectance-based studies [49,50]. It was within this
context that the potential of spatial structure analysis of HI data was investigated and compared with
analysis of FTIR data.
This study showed that: Two unique FTIR vibration peaks were associated with miticide application
(1,700 cm−1
and 763 cm−1
). The integrated intensities of these two peaks, miticide application, surfactant,
rain event, time between miticide application, and rain event were used successfully as explanatory
variables in a linear multi-regression fit to spider mite mortality. Reference [20] used FTIR to
characterize isolated endodermal cell walls from plant roots and assigned FTIR frequencies to
functional groups present in the cell wall, including the relative amounts of the cell wall biopolymers
suberin and lignin, as well as cell wall carbohydrates and proteins. FTIR absorption spectra indicated
structural differences for three developmental stages of the endodermal cell wall under study. The
authors concluded that FTIR could be used as a direct and non-destructive method suitable for the
rapid investigation of isolated plant cell walls. The approach has since been successfully applied to
screen large numbers of mutants for a broad range of cell wall phenotypes using FTIR of leaves of
Arabidopsis thaliana and flax (Linum usitatissimum) [21]. Also, FTIR and Fourier-Transform Raman
spectroscopy have been successfully used to investigate the primary cell wall architecture at a
molecular level [23] Dynamic changes in cell wall composition of hybrid maize coleoptiles (Zea mays)
were investigated by FTIR [17].
Spatial structure analysis is a novel approach to analysis of ground based remote sensing data, but it
can only be applied to data sets in which reflectance data are georeferenced (i.e., associated with a pixel
in an image cube). Published studies suggest that the spatial structure of reflectance data within a given
spectral band may be more consistent over space and time (and therefore less susceptible to radiometric
stochasticity) than absolute reflectance values [51]. The same linear multi-regression approach applied to
FTIR vibration peaks was also applied to average reflectance peaks and variogram parameters (both
derived from HI data in five selected spectral bands: 664, 683, 706, 740, and 747 nm). Highest accuracy
was obtained using variogram parameters as explanatory variables in regression analysis of miticide
bioactivity, and a regression model was successfully validated with independent data.

Remote Sensing 2010, 2
922
Based on experimental manipulation of HI data, we increased overall stochastic variance by 2.5%
or 5.0% and showed that nugget and sill values increased 5.0 and 10%, respectively, while range
values were less affected (Figure 5). For comparison, we can select, for instance, 25 or 100 random
numbers and calculate their variance. Multiply each number by 1.025 (to add 2.5%), and the new
variance is about 2.5% higher—in other words, the variance increases proportionally with the random
numbers. However, sill and nugget values doubled in response to value increases. This simple
phenomenon may explain why subtle changes in reflectance values do not show statistical difference
in common parametric statistical analyses but indeed contribute significantly when HI data are
analyzed in the context of a spatial data structure analysis. Our experimental manipulation of spectral
data also showed that there was little difference between increasing all reflectance values by 2.5% or
increasing a random selection of half of the reflectance values by 2.5%. Randomly increasing a
random half (or any other portion) of the reflectance values may be considered a simplified simulation
of a fairly uniform spray application (assuming that the liquid sprayed is brighter than the surface), and
it generated a clearly detectable change in sill and nugget values.
References
1. Kim, M.S.; Chen, Y.R.; Mehl, P.M. Hyperspectral reflectance and fluorescence imaging system
and safety. Trans ASAE 2001, 44, 721-729.
2. Mehl, P.M.; Chen, Y.; Kim, M.S.; Chan, D.E. Development of hyperspectral imaging technique
for the detection of apple surface defects and contaminations. J. Food Eng. 2004, 61, 67-81.
3. Vargas, A.M.; Kim, M.S.; Tao, Y.; Lefcourt, A.M.; Chen, Y.-R.; Luo, Y.; Song, Y.; Buchanan, R.
Detection of fecal contamination on cantaloupes using hyperspectral fluorescence imagery. J. Food Sci. 2005, 70, 471-476.
4. Lefcout, A.M.; Kim, M.S. Technique for normalizing intensity histograms of images when the
approximate size of the target is known: Detection of feces on apples using fluorescence imaging.
Comput. Electron. Agric. 2006, 50, 135-147.
5. Park, B.; Lawrence, K.C.; Windham, R.W.; Smith, D.P. Performance of hyperspectral imaging
system for poultry surface fecal contaminant detection. J. Food Eng. 2006, 75, 340-348.
6. Haché, C.; Shibusawa, S.; Sasao, A.; Suhama, T.; Sah, B.P. Field-derived spectral characteristics
to classify conventional and conservation agricultural practices. Comput. Electron. Agric. 2007,
57, 47-61.
7. Miao, G-X.; Müller, M.; Moodera, J.S. Magnetoresistance in double spin filter tunnel junctions
with nonmagnetic electrodes and its unconventional bias dependence. Phys. Rev. Lett. 2009, 102,
doi:10.1103/PhysRevLett.102.076601.
8. Pierna, J.A.F.; Baeten, V.; Renier, A.M.; Cogdill, R.A.; Dardenne, P. Combination of support
vector machines (SVM) and near infrared (NIR) imaging spectroscopy for the detection of meat
and bonemeal (MBM) in compound feeds. Chemometrics. 2004, 18, 341-349.
9. Gowen, A.A.; O‘Donnell, C.P.; Taghizadeh, M.; Gaston, E., O‘Gorman, A.; Cullen, P.J.; Frias,
J.M.; Esquerre; C.; Downey, G. Hyperspectral imaging for the investigation of quality
deterioration in sliced mushrooms (Agaricus bisporus) during storage. Sens. Instrum. Food Qual. Safety 2007, 2, 133-143.

Remote Sensing 2010, 2
923
10. Garcia-Allende, P.B.; Conde, O.M.; Mirapeix, J.; Cobo, A.; Lopez-Higuera, J.M. Quality control
of industrial processes by combining a hyperspectral sensor and Fisher‘s linear discriminant
analysis. Sensor. Actuator. B-Chem. 2008, 129, 977-984.
11. Nansen, C.; Kolomiets, M.; Gao, X. Considerations regarding use of hyperspectral imaging data
in classifications of food products—exemplified by analysis of maize kernels. J. Agr. Food Chem. 2008, 56, 2933-2938.
12. Kolomiets, O.; Hoffmann, U.; Geladi, P.; Siesler, H.W. Quantitative determination of
pharmaceutical drug formulations by near-infrared sprotroscopic imaging. Appl. Spectrosc. 2008,
62, 1200-1208.
13. Hunt, G.R. Spectroscopic properties of rocks and minerals. In Handbook of Physical Properties of Rocks, Carmichael, R.S., Ed.; CRC Press: Boca Raton, FL, USA, 1982; pp. 295-385.
14. Abidi, N.; Hequet, E. Fourier Transform Infrared analysis of cotton contamination. Textile Res. J. 2007, 77, 77-84.
15. Abidi, N.; Hequet, E.. Fourier Transform Infrared analysis of trehalulose and sticky cotton yarn
defects using ZnSe-Diamond Universal Attenuated Total Reflectance. Textile Res. J. 2005, 75,
645-652.
16. Abidi, N.; Hequet, E.; Cabrales, L.; Gannaway, J.; Wilkins, T.; Wells, L.W. Evaluating cell wall
structure and composition of developing cotton fibers using Fourier transform infrared
spectroscopy and thermogravimetric analysis. J. Appl. Polym. Sci. 2008, 107,476-486.
17. McCann, M.C.; Defernez, M.; Urbanowicz, B.R.; Tewari, J.C.; Langewisch, T.; Olek, A.; Wells,
B.; Wilson, R.H.; Carpita, N.C. Neural network analyses of infrared spectra for classifying cell
wall architectures. Plant Physiol. 2007, 143, 1314-1326.
18. Yong, W.; Link, B.; O‘Malley, R.; Tewari, J.; Hunter, C.T.; Lu, C.-A.; Li, X.; Bleecker, A.B.;
Koch, K.E.; McCann, M.C.; McCarty, D.R.; Patterson, S.E.; Reiter, W.-D.; Staiger, C.; Thomas,
S.R.; Vermerris, W.; Carpita, N.C. Genomics of plant cell wall biogenesis. Planta 2005, 221,
747-751.
19. Carpita, N.C.; Defernez, M.; Findlay, K.; Wells, B.; Shoue, D.A.; Catchpole, G.; Wilson, R.H.;
McCann, M.C. Cell wall architecture of the elongating Maize Coleoptile. Plant Physiol. 2001,
127, 551-565.
20. Zeier, J.; Schreiber, L. Fourier transform infrared-spectroscopic characterization of isolated
endodermal cell walls from plant roots: chemical nature in relation to anatomical development.
Planta. 1999, 209, 537-542.
21. Chen, L.; Carpita, N.C.; Reiter, W.-D.; Wilson, R.H.; Jeffries, C.; McCann, M.C. A rapid method
to screen for cell-wall mutants using discriminant analysis of Fourier transform spectra. Plant J. 1998, 16, 385-392.
22. McCann, M.C.; Chen, L.; Roberts, L.; Kemsley, E.K.; Sene, C.; Carpita, N.C.; Stacey, N.J.;
Wilson, R.H. Infrared microspectroscopy: sampling heterogeneity in plant cell wall composition
and architecture. Physiol Plant. 1997, 100, 729-738.
23. Séné, C.F.B.; McCann, M.C.; Wilson, R.H.; Grinter, R. Fourier-transform Raman and
Fourier-transform infrared spectroscopy an investigation of five higher plant cell walls and their
components. Plant Physiol. 1994, 106, 1623-1631.

Remote Sensing 2010, 2
924
24. McCann, M.C.; Stacey, N.J.; Wilson, R.; Roberts, K. Orientation of macromolecules in the walls
of elongating carrot cells. J. Cell Sci. 1993, 106, 1347-1356.
25. McCann, M.C.; Wells, B.; Roberts, K.; Complexity in the spatial localization and length
distribution of plant cell-wall matrix polysaccharides. J. Microsc. 1992, 166, 123-136.
26. Rutlidge, H.T.; Reedy, B.J. Classification of heterogeneous solids using infrared hyperspectral
imaging. Appl. Spectrosc. 2008, 63, 162-179.
27. Kong, S.G.; Chen, Y.; Kim, I.; Kim, M.S. Analysis of hyperspectral fluorescence images for
poultry skin tumor inspection. Appl. Optics. 2004, 43, 824-832.
28. Qiao, J.; Ngadi, M.O.; Wang, N.; Garieepy, C.; Prasher, S.O. Pork quality and marbling level
assessment uing a hyperspectral imaging system. J. Food Eng. 2007, 83, 10-16.
29. Delwiche. S.R. Protein content of single kernels of wheat by near-infrared reflectance
spectroscopy. J. Cereal Sci. 1996, 27, 241-254.
30. Cogdill, R.; Hurburgh, C.; Rippke, G. Single-kernel maize analysis by near-infrared hyperspectral
imaging. Trans. ASAE 2004, 47, 311-320.
31. Zhao, D.K.; Raja Reddy, K.;. Kakani, V.G.; Read, J.J.; Carter, G.A. Corn (Zea mays L) growth,
leaf pigment concentration, photosynthesis and leaf hyperspectral reflectance properties as
affected by nitrogen supply. Plant Soil 2003, 257, 205-217.
32. El-Sebai, O.A.; Sanderson, R.; Bleiweiss, M.P.; Schmidt, N. Detection of Sitotroga cerealella
(Olivier) infestation of wheat kernbels using hyperspectral reflectance. J. Entomol. Sci. 2006, 41,
155-164.
33. Campbell, P.K.E.; Middleton, E.M.; McMurtrey, J.E.; Corp, L.A.; Chappelle, E.W. Assessment of
vegetation stress using reflectance or fluorescence measurements. J. Environ. Qual. 2007, 36,
832-845.
34. Goel, P.K.; Prasher, S.O.; Patel, R.M.; Landry, J.A.; Bonnell, R.B.; Viau, A.A. Classification of
hyperspectral data by decision trees and artificial neural networks to identify weed stress and
nitrogen status of corn. Comput. Electron. Agric. 2003, 39, 67-93.
35. Jiang, L.; Zhu, B.; Rao, X.; Berney, G.; Tao, Y. Discrimination of black walnut shell and pulp in
hyperspectral fluorescence imagery using Gaussian kernel function approach. J. Food Eng. 2007,
81, 108-117.
36. Isaaks, E.H.; Srivastava, R.M. Applied Geostatistics; Oxford University Press: New York, NY,
USA, 1989.
37. Liebhold, A.M.; Rossi, R.E.; Kemp, W.P. Geostatistics and geographic information systems in
applied insect ecology. Ann. Rev. Entomol. 1993, 38, 303-327.
38. Brenner, R.J.; Focks, D.A.; Arbogast, R.T.; Weaver, D.K.; Shuman, D. Practical use of spatial
analysis in precision targeting for integrated pest management. Am. Entomol. 1998, 44, 79-101.
39. Liebhold, A.M.; Sharov, A.A. Testing for correlation in the presence of spatial autocorrelation in
insect count data. In Population and Community Ecology for Insect Management and Conservation; Baumgartner, J., Brandmayr, P., Manly, B.F.J., Eds.; A. A. Balkema: Rotterdam,
the Netherlands, 1998; pp. 111-117.
40. Rossi, R.E.; Mulla, D.J.; Journel, A.G.; Franz, E.H. Geostatistical tools for modeling and
interpreting ecological spatial dependence. Ecol. Monogr. 1992, 62, 277-314.

Remote Sensing 2010, 2
925
41. Nansen, C.; Hinson, B.; Davidson, D.; Vaughn, K.; Hosseini, A. Novel approaches to application
and performance assessment of insecticide applications to crop leaves. J. Econ. Entomol. 2009,
Accepted.
42. Porter, P.; Troxclair, N.; Schuster, G., Porter, D.O.; Cronholm, G.; Bynum, E., Jr.; Patrick, C.;
Davis, S.G. Texas Corn Production: Emphasizing Pest Management & Irrigation; Texas
Cooperative Extension, The Texas A&M University System: College Station, TX, USA, 2005;
B-6177, 08/05.
43. Smith, B. Infrared Spectral Interpretation: A Systematic Approach; CRC Press: New York, NY,
USA, 1999.
44. Gopal, M.; Mishra E. Analytical method for estimation of a new insecticide Flubendiamide and its
safety evaluation for usage in rice crop. Bull. Environ. Contam. Toxicol. 2008, 81, 360-364.
45. Sharma, A.; Gupta, M.; Shanker, A. Fenvalerate residue level and dissipation in tea and in its
infusion. Food Add. Contam. 2008, 25, 97-104.
46. Zhang, Q.; Sun, Q.; Hua, B.; Shen, Q.; Yang, G.; Liang, X.; Sun, X.;, Liu, F. Development of a
sensitive ELISA for the analysis of the organophosphorous insecticide fenthion in fruit samples.
Food Chem. 2008, 106, 1278-1284.
47. Arrebola, F.J.; Martínez Vidal, J.L.; Gonzaález-Rodríguez, M.J.; Garrido-Frenich, A.; Sánchez
Morito, N. Reduction of analysis time in gas chromatography. Application of low-pressure gas
chromatography-tandem mass spectrometry to the determination of pesticide residues in
vegetables. J. Chrom. A. 2003, 1005, 131-141.
48. Caldas, E.; Jardim, A.; Ambrus, A.; Souza, L.C. Variability of organophosphorus insecticide
residues in large size crops grown in commercial farms in Brazil. Food Add. Contam. 2006, 23,
148-158.
49. Baghzouz, M.; Devitt, D.A.; Morris, R.L. Evaluating temporal variability in the spectral
reflectance response of annual ryegrass to changes in nitrogen applications and leaching fractions. Int. J. Remote Sens. 2006, 27, 4137-4157.
50. Okamoto, H.; Lee, W.S. Green citrus detection using hyperspectral imaging. Comput. Electron. Agric. 2009, 66, 201-208.
51. Nansen, C.; Macedo, T.; Swanson, R.; Weaver, D.K. Use of spatial structure analysis of
hyperspectral data cubes for detection of insect-induced stress in wheat plants. Int. J. Remote Sens. 2009, 30, 2447-2464.
© 2010 by the authors; licensee Molecular Diversity Preservation International, Basel, Switzerland.
This article is an open-access article distributed under the terms and conditions of the Creative
Commons Attribution license (http://creativecommons.org/licenses/by/3.0/).
Copyright © 2022 FDOKUMEN