A novel system for spatial and temporal imaging of intrinsic plant water use efficiency
15
Journal of Experimental Botany, Vol. 64, No. 16, pp. 4993–5007, 2013 doi:10.1093/jxb/ert288 Advance Access publication 16 September, 2013 This paper is available online free of all access charges (see http://jxb.oxfordjournals.org/open_access.html for further details) This is an Open Access article distributed under the terms of the Creative Commons Attribution License (http://creativecommons.org/licenses/by/3.0/), which permits unrestricted reuse, distribution, and reproduction in any medium, provided the original work is properly cited. © The Author 2013. Published by Oxford University Press on behalf of the Society for Experimental Biology Abbreviations: A, CO 2 assimilation; C a , extracellular CO 2 concentration; C i , intracellular CO 2 concentration; F´, steady-state fluorescence measured under light; F m ´, maximum fluorescence measured under light; F q ´/F m ´, photosystem II operating efficiency; g c , cuticle conductance; g l , leaf conductance to water vapour; g s , stomatal conductance; GUI, graphical user interface; I g , index of stomatal conductance; IRGA, infrared gas analysis; IWUE i , imaged intrinsic water use efficiency; PPFD, photosynthetic flux density; r aw , leaf boundary layer resistance to water vapour; r HR , parallel resistance to heat and radiative transfer; r w , leaf resistance to water vapour; s, slope of the curve relating saturation vapour pressure to temperature; T Dry , mean temperature of the dry standard; T Leaf , mean temperature of the leaf surface; T Wet , mean temperature of the wet standard; VPD, vapour pressure deficit, WUE, water use efficiency; WUE i , intrinsic WUE; γ, psychrometric constant; θ, temperature phrase normalizing leaf temperature with the wet and dry standards. RESEARCH PAPER A novel system for spatial and temporal imaging of intrinsic plant water use efficiency L. McAusland 1 , P. A. Davey 1 , N. Kanwal 2 , N. R. Baker 1 and T. Lawson* 1 School of Biological Sciences, University of Essex, Wivenhoe Park, Colchester, Essex CO4 3SQ, UK 2 School of Computing and Engineering Science, University of Essex, Wivenhoe Park, Colchester, Essex CO4 3SQ, UK * To whom correspondence should be addressed. E-mail: [email protected] Received 24 May 2013; Revised 10 July 2013; Accepted 30 July 2013 Abstract Instrumentation and methods for rapid screening and selection of plants with improved water use efficiency are essential to address current issues of global food and fuel security. A new imaging system that combines chlorophyll fluorescence and thermal imaging has been developed to generate images of assimilation rate (A), stomatal con- ductance (g s ), and intrinsic water use efficiency (WUE i ) from whole plants or leaves under controlled environmental conditions. This is the first demonstration of the production of images of WUE i and the first to determine images of g s from themography at the whole-plant scale. Data are presented illustrating the use of this system for rapidly and non-destructively screening plants for alterations in WUE i by comparing Arabidopsis thaliana mutants (OST1-1) that have altered WUE i driven by open stomata, with wild-type plants. This novel instrument not only provides the poten- tial to monitor multiple plants simultaneously, but enables intra- and interspecies variation to be taken into account both spatially and temporally. The ability to measure A, g s , and WUE i progressively was developed to facilitate and encourage the development of new dynamic protocols. Images illustrating the instrument’s dynamic capabilities are demonstrated by analysing plant responses to changing photosynthetic photon flux density (PPFD). Applications of this system will augment the research community’s need for novel screening methods to identify rapidly novel lines, cultivars, or species with improved A and WUE i in order to meet the current demands on modern agriculture and food production. Key words: Chlorophyll fluorescence imaging, dynamic responses, leaf heterogeneity, screening, thermal imaging, water use efficiency. Introduction One of the greatest challenges plant scientists currently face is global food and fuel security. Water availability is a major constraint of crop yield (Sinclair and Rufty, 2012) and is the single most important factor limiting food production, with significant yield losses reported under water deficit (Boyer, 1982; Mueller et al., 2012; van Ittersum et al., 2012). In order to combat the predicted impacts of increasing drought epi- sodes on crop yield, there is an urgency to identify plants and the underlying mechanisms for improved water use effi- ciency (WUE). Unfortunately, a major constraint for such crop improvements is the ability to monitor WUE rapidly and non-destructively. It is essential that new techniques
-
Upload
independent -
Category
Documents
-
view
2 -
download
0
Transcript of A novel system for spatial and temporal imaging of intrinsic plant water use efficiency

Journal of Experimental Botany, Vol. 64, No. 16, pp. 4993–5007, 2013doi:10.1093/jxb/ert288 Advance Access publication 16 September, 2013This paper is available online free of all access charges (see http://jxb.oxfordjournals.org/open_access.html for further details)
This is an Open Access article distributed under the terms of the Creative Commons Attribution License (http://creativecommons.org/licenses/by/3.0/), which permits unrestricted reuse, distribution, and reproduction in any medium, provided the original work is properly cited.
© The Author 2013. Published by Oxford University Press on behalf of the Society for Experimental Biology
Abbreviations: A, CO2 assimilation; Ca, extracellular CO2 concentration; Ci, intracellular CO2 concentration; F´, steady-state fluorescence measured under light; Fm´, maximum fluorescence measured under light; Fq´/Fm´, photosystem II operating efficiency; gc, cuticle conductance; gl, leaf conductance to water vapour; gs, stomatal conductance; GUI, graphical user interface; Ig, index of stomatal conductance; IRGA, infrared gas analysis; IWUEi, imaged intrinsic water use efficiency; PPFD, photosynthetic flux density; raw, leaf boundary layer resistance to water vapour; rHR, parallel resistance to heat and radiative transfer; rw, leaf resistance to water vapour; s, slope of the curve relating saturation vapour pressure to temperature; TDry, mean temperature of the dry standard; TLeaf, mean temperature of the leaf surface; TWet, mean temperature of the wet standard; VPD, vapour pressure deficit, WUE, water use efficiency; WUEi, intrinsic WUE; γ, psychrometric constant; θ, temperature phrase normalizing leaf temperature with the wet and dry standards.
ReseaRch papeR
A novel system for spatial and temporal imaging of intrinsic plant water use efficiency
L. McAusland1, P. A. Davey1, N. Kanwal2, N. R. Baker1 and T. Lawson*1 School of Biological Sciences, University of Essex, Wivenhoe Park, Colchester, Essex CO4 3SQ, UK2 School of Computing and Engineering Science, University of Essex, Wivenhoe Park, Colchester, Essex CO4 3SQ, UK
* To whom correspondence should be addressed. E-mail: [email protected]
Received 24 May 2013; Revised 10 July 2013; Accepted 30 July 2013
Abstract
Instrumentation and methods for rapid screening and selection of plants with improved water use efficiency are essential to address current issues of global food and fuel security. A new imaging system that combines chlorophyll fluorescence and thermal imaging has been developed to generate images of assimilation rate (A), stomatal con-ductance (gs), and intrinsic water use efficiency (WUEi) from whole plants or leaves under controlled environmental conditions. This is the first demonstration of the production of images of WUEi and the first to determine images of gs from themography at the whole-plant scale. Data are presented illustrating the use of this system for rapidly and non-destructively screening plants for alterations in WUEi by comparing Arabidopsis thaliana mutants (OST1-1) that have altered WUEi driven by open stomata, with wild-type plants. This novel instrument not only provides the poten-tial to monitor multiple plants simultaneously, but enables intra- and interspecies variation to be taken into account both spatially and temporally. The ability to measure A, gs, and WUEi progressively was developed to facilitate and encourage the development of new dynamic protocols. Images illustrating the instrument’s dynamic capabilities are demonstrated by analysing plant responses to changing photosynthetic photon flux density (PPFD). Applications of this system will augment the research community’s need for novel screening methods to identify rapidly novel lines, cultivars, or species with improved A and WUEi in order to meet the current demands on modern agriculture and food production.
Key words: Chlorophyll fluorescence imaging, dynamic responses, leaf heterogeneity, screening, thermal imaging, water use efficiency.
Introduction
One of the greatest challenges plant scientists currently face is global food and fuel security. Water availability is a major constraint of crop yield (Sinclair and Rufty, 2012) and is the single most important factor limiting food production, with significant yield losses reported under water deficit (Boyer, 1982; Mueller et al., 2012; van Ittersum et al., 2012). In order
to combat the predicted impacts of increasing drought epi-sodes on crop yield, there is an urgency to identify plants and the underlying mechanisms for improved water use effi-ciency (WUE). Unfortunately, a major constraint for such crop improvements is the ability to monitor WUE rapidly and non-destructively. It is essential that new techniques

4994 | McAusland et al.
and approaches are developed for phenotyping (Fiorani and Schurr, 2013) and to screen for limitations in WUE.
Traditional methods of determining WUE that quantify plant yield or biomass relative to the amount of water used (Stanhill, 1986; Bacon, 2004; Passioura, 2004) are unsuitable for rapid screening for several reasons. These agronomic tech-niques are not only destructive but also rely on an integrated measurement of biomass/yield at the end of the growing season relative to the amount of water used over the growth period (Chaerle et al., 2005; Morison et al., 2008). Carbon isotope discrimination (Farquhar et al., 1982) has been suc-cessfully used to identify crop cultivars with greater WUE (Condon et al., 2004); however, this technique also relies on an integrated measure of WUE over a period of plant growth. Additionally, the technique does not provide an indication of whether differences in WUE are driven by CO2 assimila-tion (A) or water loss (Farquhar et al., 1989; Jones, 2004b), although the incorporation of oxygen isotope measurements can provide an indication of rates of evaporation from the leaf surface (Farquhar et al., 1998; Barbour, 2007). Leaf-level gas exchange measurements of the rate of A relative to transpira-tion provide an immediate and non-destructive measure of instantaneous WUE (Penman and Schofield, 1951) or ‘intrin-sic water use efficiency’ (WUEi), when stomatal conductance (gs) is used instead of transpiration as a measure of water loss (Meidner and Mansfield, 1968; Jones, 1998). Although this approach is flexible in term of the time scale of when measurements can be made, an infrared gas analyser (IRGA) can only take singular measurements on one plant or leaf, at one point in time. Thus, all of the techniques described above to assess WUE have limitations as screening tools, as they tend to be time-consuming and/or destructive. Additionally, biomass and carbon isotope measurements only provide a lifetime measure of WUE based on cumulative seasonal con-ditions, which may mask specific phenotypic traits that could be advantageous in future breeding programmes (Weyers and Meidner, 1990; Chaerle et al., 2005). Using a combined chlo-rophyll fluorescence and thermography imaging approach, a non-invasive, high-throughput, high resolution tool has been developed to screen WUEi based on calculated images of A and gs produced from measurements of photosynthetic effi-ciency (Fq´/Fm´) and leaf temperature, respectively.
Chlorophyll fluorescence has long been used to examine various photosynthetic parameters in leaves (Baker, 2008) and it is well established that the operating efficiency of pho-tosystem II (PSII; Fq´/Fm´) is related to changes in CO2 assim-ilation in leaves (Genty et al., 1989, 1990; Krall and Edwards, 1990; Cornic and Ghashghaie 1991; Edwards and Baker, 1993; Siebke et al., 1997). However, the relationship is com-plex and depends on the surrounding gaseous environmental conditions. In C3 plants, the relationship between the operat-ing efficiency of PSII is linearly related to photosynthetic CO2 fixation of leaves, but only when photorespiration is inhibited and CO2 assimilation represents the major sink for the end-products of electron transport, namely ATP and NADPH (Baker and Oxborough, 2004; Baker, 2008). Chlorophyll fluo-rescence images taken on C3 plants under a low [O2] (20 mmol mol–1) can be converted to images of CO2 assimilation using
suitable calibrations (Di Marco et al., 1990; Genty et al., 1990; Cornic and Ghashghaie, 1991; Cornic, 1994; Genty and Meyer, 1995).
Infrared thermography (IRT) provides a powerful imag-ing tool for rapidly, non-invasively, and remotely measur-ing leaf temperature as a surrogate for gs (Omasa et al., 1981; Hashimoto et al., 1984; Jones, 1999). Leaf tempera-ture depends on evaporative cooling, and is a function of gs (Jones, 1992). For example, leaf temperature increases as sto-mata close and restrict evaporative water loss. Thermography has been used for rapid screening of genotypic variation in gs (Wang et al., 2004) as well as early diagnosis of drought stress-induced changes in gs (Grant et al., 2006; Morison et al., 2008). In the last 20 years there has been increasing interest in quantitative evaluation of stomatal conductance from meas-urements of leaf temperature, using the basic energy balance equations (Jones, 1999, 2004a; Leinonen et al., 2006; Grant et al., 2007). The use of thermography to determine gs has been optimized through the development of standard proto-cols which take into account the surrounding environment, and even the distribution of stomata between the two leaf surfaces (Jones, 1999; Guilioni et al., 2008). Thermography has become a standard technique to determine gs in both glasshouse (Grant et al., 2006) and field environments (Grant et al., 2007).
Here the development of a novel imaging system that incor-porates measurements of chlorophyll fluorescence and ther-mal imaging under controlled gaseous conditions is described. Chlorophyll fluorescence images of Fq´/Fm´ provide a quanti-tative image of A, whilst images of leaf temperature are con-verted to gs using well-defined methods that take into account the surrounding environment. Further manipulation of these two images provides for the first time an image of intrinsic water use efficiency (IWUEi=A/gs). Previous researchers have used combined chlorophyll fluorescence and thermal imaging approaches to evaluate photosynthetic performance in relation to stomatal behaviour (e.g. Chaerle et al., 2005, 2007; Lawson, 2009; Glenn, 2012), but the majority of these studies have been carried out at the leaf or tissue scale (Omasa and Takayama, 2003; Messinger et al., 2006) and have not been used to deter-mine WUE, but have been focused on physiological analysis of mechanisms that coordinate responses observed between mesophyll photosynthesis and stomatal behaviour. A major advantage of the combined imaging approach reported here is the ability for multiple samples to be measured at any one time and the fact that spatial heterogeneity within plants and leaves can be readily identified. Differences between wild-type (WT) and open stomatal mutant (OST1-1; Merlot et al., 2002) Arabidopsis thaliana plants are demonstrated using the system, with spatial and temporal heterogeneity in A, gs, and IWUEi being observed in the images. It is important to take into account such heterogeneity as it is well established that gs and photosynthesis are not uniform over a leaf sur-face (Oxborough and Baker, 1997; Weyers and Lawson, 1997; Weyers et al., 1997; Mott and Buckley, 1998; Lawson et al., 2002; Peak et al., 2004; West et al., 2005; Kamakura et al., 2012) and that such heterogeneity is also dynamic (Lawson and Weyers, 1999) often being driven by variations in the
Imaging of water use efficiency | 4995
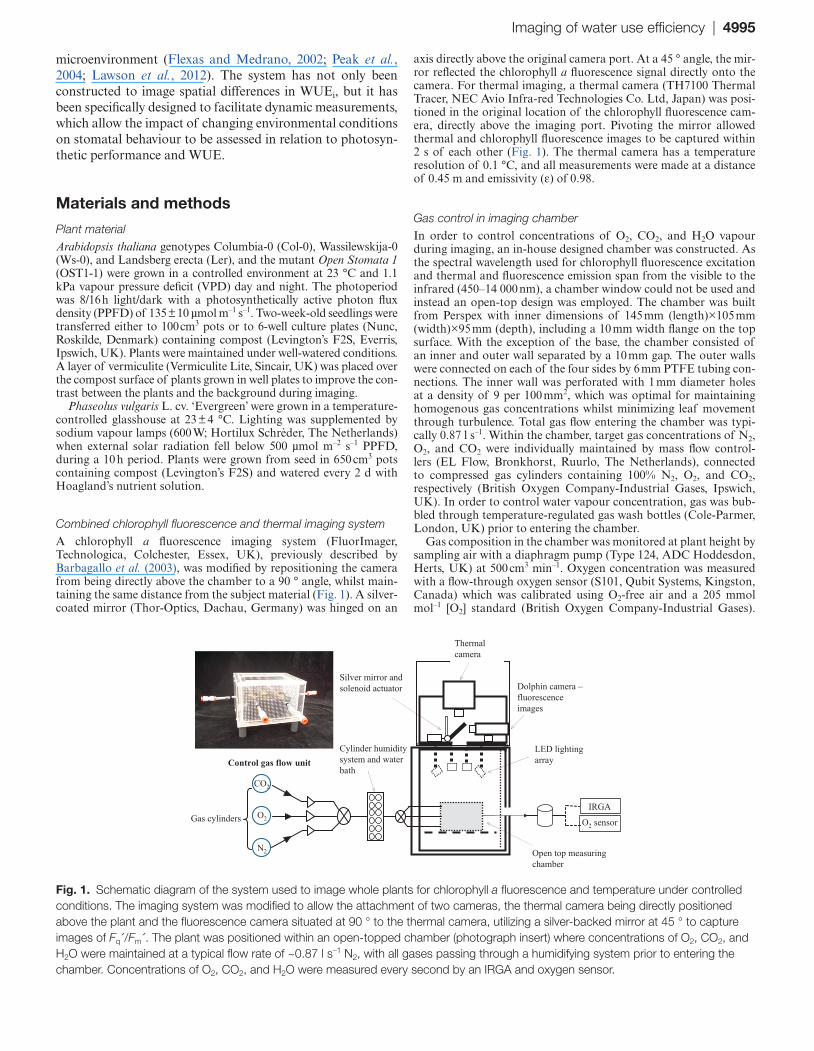
microenvironment (Flexas and Medrano, 2002; Peak et al., 2004; Lawson et al., 2012). The system has not only been constructed to image spatial differences in WUEi, but it has been specifically designed to facilitate dynamic measurements, which allow the impact of changing environmental conditions on stomatal behaviour to be assessed in relation to photosyn-thetic performance and WUE.
Materials and methods
Plant materialArabidopsis thaliana genotypes Columbia-0 (Col-0), Wassilewskija-0 (Ws-0), and Landsberg erecta (Ler), and the mutant Open Stomata 1 (OST1-1) were grown in a controlled environment at 23 °C and 1.1 kPa vapour pressure deficit (VPD) day and night. The photoperiod was 8/16 h light/dark with a photosynthetically active photon flux density (PPFD) of 135 ± 10 µmol m–1 s–1. Two-week-old seedlings were transferred either to 100 cm3 pots or to 6-well culture plates (Nunc, Roskilde, Denmark) containing compost (Levington’s F2S, Everris, Ipswich, UK). Plants were maintained under well-watered conditions. A layer of vermiculite (Vermiculite Lite, Sincair, UK) was placed over the compost surface of plants grown in well plates to improve the con-trast between the plants and the background during imaging.
Phaseolus vulgaris L. cv. ‘Evergreen’ were grown in a temperature-controlled glasshouse at 23 ± 4 °C. Lighting was supplemented by sodium vapour lamps (600 W; Hortilux Schrèder, The Netherlands) when external solar radiation fell below 500 µmol m–2 s–1 PPFD, during a 10 h period. Plants were grown from seed in 650 cm3 pots containing compost (Levington’s F2S) and watered every 2 d with Hoagland’s nutrient solution.
Combined chlorophyll fluorescence and thermal imaging systemA chlorophyll a fluorescence imaging system (FluorImager, Technologica, Colchester, Essex, UK), previously described by Barbagallo et al. (2003), was modified by repositioning the camera from being directly above the chamber to a 90 ° angle, whilst main-taining the same distance from the subject material (Fig. 1). A silver-coated mirror (Thor-Optics, Dachau, Germany) was hinged on an
axis directly above the original camera port. At a 45 ° angle, the mir-ror reflected the chlorophyll a fluorescence signal directly onto the camera. For thermal imaging, a thermal camera (TH7100 Thermal Tracer, NEC Avio Infra-red Technologies Co. Ltd, Japan) was posi-tioned in the original location of the chlorophyll fluorescence cam-era, directly above the imaging port. Pivoting the mirror allowed thermal and chlorophyll fluorescence images to be captured within 2 s of each other (Fig. 1). The thermal camera has a temperature resolution of 0.1 °C, and all measurements were made at a distance of 0.45 m and emissivity (ε) of 0.98.
Gas control in imaging chamberIn order to control concentrations of O2, CO2, and H2O vapour during imaging, an in-house designed chamber was constructed. As the spectral wavelength used for chlorophyll fluorescence excitation and thermal and fluorescence emission span from the visible to the infrared (450–14 000 nm), a chamber window could not be used and instead an open-top design was employed. The chamber was built from Perspex with inner dimensions of 145 mm (length)×105 mm (width)×95 mm (depth), including a 10 mm width flange on the top surface. With the exception of the base, the chamber consisted of an inner and outer wall separated by a 10 mm gap. The outer walls were connected on each of the four sides by 6 mm PTFE tubing con-nections. The inner wall was perforated with 1 mm diameter holes at a density of 9 per 100 mm2, which was optimal for maintaining homogenous gas concentrations whilst minimizing leaf movement through turbulence. Total gas flow entering the chamber was typi-cally 0.87 l s–1. Within the chamber, target gas concentrations of N2, O2, and CO2 were individually maintained by mass flow control-lers (EL Flow, Bronkhorst, Ruurlo, The Netherlands), connected to compressed gas cylinders containing 100% N2, O2, and CO2, respectively (British Oxygen Company-Industrial Gases, Ipswich, UK). In order to control water vapour concentration, gas was bub-bled through temperature-regulated gas wash bottles (Cole-Parmer, London, UK) prior to entering the chamber.
Gas composition in the chamber was monitored at plant height by sampling air with a diaphragm pump (Type 124, ADC Hoddesdon, Herts, UK) at 500 cm3 min–1. Oxygen concentration was measured with a flow-through oxygen sensor (S101, Qubit Systems, Kingston, Canada) which was calibrated using O2-free air and a 205 mmol mol–1 [O2] standard (British Oxygen Company-Industrial Gases).
Silver mirror and solenoid actuator
Thermal camera
Dolphin camera –fluorescence images
LED lighting array
Open top measuring chamber
Control gas flow unit
Gas cylinders
CO2
O2
N2
IRGA
O2 sensor
Cylinder humidity system and water bath
Fig. 1. Schematic diagram of the system used to image whole plants for chlorophyll a fluorescence and temperature under controlled conditions. The imaging system was modified to allow the attachment of two cameras, the thermal camera being directly positioned above the plant and the fluorescence camera situated at 90 ° to the thermal camera, utilizing a silver-backed mirror at 45 ° to capture images of Fq´/Fm´. The plant was positioned within an open-topped chamber (photograph insert) where concentrations of O2, CO2, and H2O were maintained at a typical flow rate of ~0.87 l s–1 N2, with all gases passing through a humidifying system prior to entering the chamber. Concentrations of O2, CO2, and H2O were measured every second by an IRGA and oxygen sensor.
4996 | McAusland et al.
Both CO2 and H2O vapour concentrations were measured with an IRGA (Li- 840, Li-Cor, NE, USA) calibrated weekly using a stand-ard gas for CO2 (±2.5% tolerance) (British Oxygen Company) and a dewpoint generator (LI-610; Li-Cor) for H2O vapour.
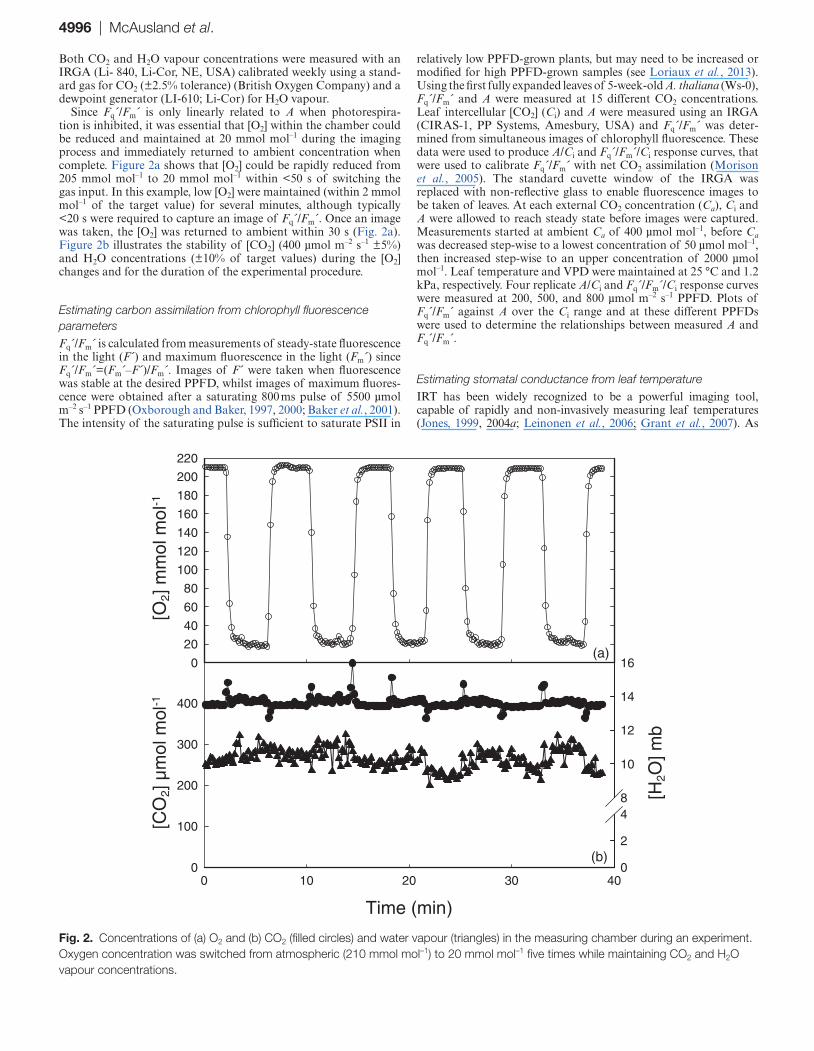
Since Fq´/Fm´ is only linearly related to A when photorespira-tion is inhibited, it was essential that [O2] within the chamber could be reduced and maintained at 20 mmol mol–1 during the imaging process and immediately returned to ambient concentration when complete. Figure 2a shows that [O2] could be rapidly reduced from 205 mmol mol–1 to 20 mmol mol–1 within <50 s of switching the gas input. In this example, low [O2] were maintained (within 2 mmol mol–1 of the target value) for several minutes, although typically <20 s were required to capture an image of Fq´/Fm´. Once an image was taken, the [O2] was returned to ambient within 30 s (Fig. 2a). Figure 2b illustrates the stability of [CO2] (400 µmol m–2 s–1 ±5%) and H2O concentrations (±10% of target values) during the [O2] changes and for the duration of the experimental procedure.
Estimating carbon assimilation from chlorophyll fluorescence parametersFq´/Fm´ is calculated from measurements of steady-state fluorescence in the light (F´) and maximum fluorescence in the light (Fm´) since Fq´/Fm´=(Fm´–F´)/Fm´. Images of F´ were taken when fluorescence was stable at the desired PPFD, whilst images of maximum fluores-cence were obtained after a saturating 800 ms pulse of 5500 µmol m–2 s–1 PPFD (Oxborough and Baker, 1997, 2000; Baker et al., 2001). The intensity of the saturating pulse is sufficient to saturate PSII in
relatively low PPFD-grown plants, but may need to be increased or modified for high PPFD-grown samples (see Loriaux et al., 2013). Using the first fully expanded leaves of 5-week-old A. thaliana (Ws-0), Fq´/Fm´ and A were measured at 15 different CO2 concentrations. Leaf intercellular [CO2] (Ci) and A were measured using an IRGA (CIRAS-1, PP Systems, Amesbury, USA) and Fq´/Fm´ was deter-mined from simultaneous images of chlorophyll fluorescence. These data were used to produce A/Ci and Fq´/Fm´/Ci response curves, that were used to calibrate Fq´/Fm´ with net CO2 assimilation (Morison et al., 2005). The standard cuvette window of the IRGA was replaced with non-reflective glass to enable fluorescence images to be taken of leaves. At each external CO2 concentration (Ca), Ci and A were allowed to reach steady state before images were captured. Measurements started at ambient Ca of 400 µmol mol–1, before Ca was decreased step-wise to a lowest concentration of 50 µmol mol–1, then increased step-wise to an upper concentration of 2000 µmol mol–1. Leaf temperature and VPD were maintained at 25 °C and 1.2 kPa, respectively. Four replicate A/Ci and Fq´/Fm´/Ci response curves were measured at 200, 500, and 800 µmol m–2 s–1 PPFD. Plots of Fq´/Fm´ against A over the Ci range and at these different PPFDs were used to determine the relationships between measured A and Fq´/Fm´.
Estimating stomatal conductance from leaf temperatureIRT has been widely recognized to be a powerful imaging tool, capable of rapidly and non-invasively measuring leaf temperatures (Jones, 1999, 2004a; Leinonen et al., 2006; Grant et al., 2007). As
(a)
[O2]
mm
ol m
ol-1
0
20
40
60
80
100
120
140
160
180
200
220
(b)
Time (min)
0 10 20 30 40
[CO
2]
mol
mol
-1
0
100
200
300
400
[H2O
] mb
0
2
48
10
12
14
16
Fig. 2. Concentrations of (a) O2 and (b) CO2 (filled circles) and water vapour (triangles) in the measuring chamber during an experiment. Oxygen concentration was switched from atmospheric (210 mmol mol–1) to 20 mmol mol–1 five times while maintaining CO2 and H2O vapour concentrations.

Imaging of water use efficiency | 4997
leaf temperature is dependent on evaporative cooling, it can be used as an indirect measure of leaf conductance to water vapour (gl) or its reciprocal, leaf resistance (rw) (Jones, 1992, 1999; Guilioni et al., 2008). Although this measure of leaf conductance also includes the water lost through the cuticle, termed cuticle conductance (gc), the value is relatively small and usually neglected, subsequently the terms leaf and stomatal conductance (gs) are used interchangeably (see Jones, 1999). Leaf temperature also depends on the environmen-tal conditions around the leaf (Jones, 1992, 2004a) and, in order to determine gs from thermal images, an estimation of the boundary layer resistance to water vapour (raw) is needed along with known wet and dry temperature reference standards (Jones, 1999). Two tempera-ture references are required, one that provides an infinite resistance to water vapour (e.g. leaf material greased on both sides), whilst the second provides a near-zero resistance to water vapour (e.g. leaf sur-face painted with a detergent–water mix). The temperature standards normalize the measured leaf temperature to the environmental con-ditions surrounding it and it is assumed that these surfaces have the same radiative properties (Jones, 2004a). The application of the wet standard to either one or both sides of the leaf is used to account for the distribution of the stomata (Guilioni et al., 2008). In this study, a one-sided wet standard was used for Phaseolus vulgaris leaves and a two-sided wet standard was used for A. thaliana leaves.
Leaf resistance to water vapour (rw) was calculated from thermal images (Guilioni et al., 2008) for anisolateral leaves using the follow-ing equation:
r rsr rw aw HR aw= +
+γq
where raw is the leaf boundary layer resistance to water vapour, s is the slope of the curve relating saturation vapour pressure to temperature, and γ is the psychrometric constant. rHR represents the par-allel resistance to heat and radiative transfer, and θ is the temperature phrase, normalizing leaf temperature with the wet and dry standards;
θ =−( )−( )
T T
T TLeaf Wet
Dry Leaf
,
where TLeaf, TWet, and TDry are the mean temperatures of the leaf wet and dry standards, respectively. This temperature phrase normalizes leaf temperature (TLeaf) between a surface of lower resistance and temperature (TWet) and a surface of higher temperature and a resist-ance greater than that of the leaf (TDry). Estimates of gs were made from the reciprocals of rw; gs=1/ rw.
In order to test how robust the method was for estimating gs from leaf temperature, IRGA measurements of gs were taken alongside estimates determined from images of leaf temperature from P. vul-garis and A. thaliana (WS-0 and Col-0). raw values were calculated using damp filter paper leaf replicates with areas of 0.0025 m2 and 0.00044 m2 for P. vulgaris and A. thaliana, respectively, following the vapour-flux density method of Weyers and Meidner (1990).
The rate of water loss from the leaf replicates was determined under the imaging system from the change in weight (±1 mg), meas-ured every 30 s for a period of 15 min. The average surface tem-perature of the filter paper was analysed using thermal imager software (Radiometric Thermography Studio Complete, Metrum, Wokingham, UK) to monitor temperature stability throughout the measurement period. VPD was maintained at 1.7 kPa (±0.006 SE) and air temperature at 21.7 °C (±0.04 °C SE). Concurrent measure-ments of air speed (average 0.11 m s–1) over the filter paper were made using a hot-wire anemometer (Model 425, Testo, Alton, Hampshire, UK).
Leaves of P. vulgaris were kept flat by a wire support, with the adaxial surface facing upwards. Five-week-old A. thaliana plants were maintained in pots large enough to ensure leaves were parallel to the soil surface. A 30% Tween (Sigma, Gillingham, Kent, UK)
solution or vacuum grease (Dow Corning, Midland, Michigan, USA) were applied to different 1 cm2 areas of the leaf to create the wet and dry standards, respectively (see above). To generate a range of stomatal conductances, plants were left for 30 min to reach steady state at PPFDs ranging from 100 µmol m–2 s–1 to 1000 µmol m–2 s–1. The plant was then placed under the imaging system and a thermal image was taken followed immediately by an IRGA measurement. Conditions inside the imager were maintained at 1.7 kPa VPD and 21.7 °C air temperature.
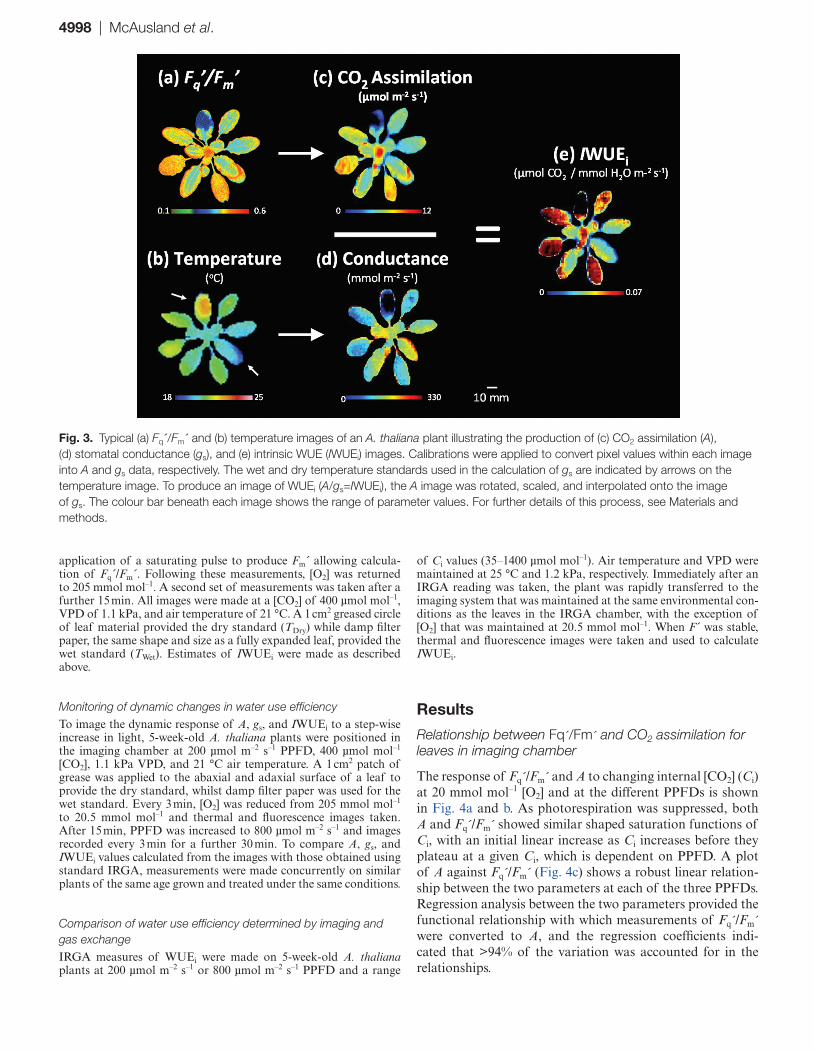
Construction of images of water use efficiencyThe rationale and approach to constructing images of WUEi (IWUEi) is illustrated in Fig. 3. Image values of Fq´/Fm´ (Fig. 3a) and leaf temperature (Fig. 3b) are converted to A (Fig. 3c) and gs (Fig. 3d) using the calibrations described above. To produce the image of IWUEi, the A image (Fig. 3c) was rotated, scaled, and interpolated to re-map spatially pixel values of A to values of gs. At the individual pixel level, values of A were divided by values of gs to produce pixel values of IWUEi (Fig. 2e; A/gs=IWUEi).
Software development for image constructionIn-house specifically designed software (ImFluTem; IFT) with a graphical user interface (GUI) was developed using Matlab (Mathworks, Natick, MA, USA) to facilitate data processing and construction of images of WUEi. Leaf temperature and Fq´/Fm´ data were downloaded from their respective commercial image capture programs and stored in a x,y,z matrix format which were uploaded into the Matlab program as text files. The maximum image area for leaf temperature images was 150 cm2 (240 × 320 pix-els) whilst chlorophyll fluorescence images were smaller (90 cm2) with a greater pixel resolution (700 × 520 pixels). The program allowed users to select the PPFD used and to map the data to A using the appropriate calibration (see Fig. 4). It also allowed manual input of other environmental variables (including air tem-perature, wet and dry reference temperature, and boundary layer resistance) required for the conversion of leaf temperature data into gs. Alternatively, an option was available that allowed user selection of areas of the images that corresponded to wet and dry standard reference material. As mentioned above, A images were rotated, scaled, and interpolated within the program to align pixels between the two images. Although the majority of the scaling and rotation values were embedded in the coding of the program, manual input options were designed to allow users full control over the mapping of images. Frequency distribution of the raw data provided a ref-erence check for the range of interpolated and calculated values of the new images produced, with the removal of any pixel values falling out of the original distribution. Images of IWUEi were con-structed from individual pixels values of A divided by their cor-responding pixel value of calculated gs to produce pixel values of IWUEi. Values were mapped to a colour pallet that corresponded to 10 evenly distributed data bins determined by user-defined maxi-mum and minimum values. Output data were stored as text files along with corresponding JPEG images of A, gs, and IWUEi. An additional GUI assisted with processing multiple images (particu-larly imported when dynamic protocols were employed) and area selection for analysis. Multiple files were uploaded using a wildcard input function. The images and data generated used the same num-bered wild card function as the original file.
Screening for differences in water use efficiencyThree (4-week-old) plants of A. thaliana WT (Ler) and three OST1-1 mutants grown in a well plate were dark adapted for 20 min before being placed in the imaging system and exposed to a PPFD of 200 µmol m–2 s–1. After a minimum of 20 min and at stable F´, the [O2] was decreased from 205 mmol mol–1 to 20 mmol mol–1 for ~50 s and a thermal image recorded. This was immediately followed by the
4998 | McAusland et al.
application of a saturating pulse to produce Fm´ allowing calcula-tion of Fq´/Fm´. Following these measurements, [O2] was returned to 205 mmol mol–1. A second set of measurements was taken after a further 15 min. All images were made at a [CO2] of 400 µmol mol–1, VPD of 1.1 kPa, and air temperature of 21 °C. A 1 cm2 greased circle of leaf material provided the dry standard (TDry) while damp filter paper, the same shape and size as a fully expanded leaf, provided the wet standard (TWet). Estimates of IWUEi were made as described above.
Monitoring of dynamic changes in water use efficiencyTo image the dynamic response of A, gs, and IWUEi to a step-wise increase in light, 5-week-old A. thaliana plants were positioned in the imaging chamber at 200 µmol m–2 s–1 PPFD, 400 µmol mol–1 [CO2], 1.1 kPa VPD, and 21 °C air temperature. A 1 cm2 patch of grease was applied to the abaxial and adaxial surface of a leaf to provide the dry standard, whilst damp filter paper was used for the wet standard. Every 3 min, [O2] was reduced from 205 mmol mol–1 to 20.5 mmol mol–1 and thermal and fluorescence images taken. After 15 min, PPFD was increased to 800 µmol m–2 s–1 and images recorded every 3 min for a further 30 min. To compare A, gs, and IWUEi values calculated from the images with those obtained using standard IRGA, measurements were made concurrently on similar plants of the same age grown and treated under the same conditions.
Comparison of water use efficiency determined by imaging and gas exchangeIRGA measures of WUEi were made on 5-week-old A. thaliana plants at 200 µmol m–2 s–1 or 800 µmol m–2 s–1 PPFD and a range
of Ci values (35–1400 µmol mol–1). Air temperature and VPD were maintained at 25 °C and 1.2 kPa, respectively. Immediately after an IRGA reading was taken, the plant was rapidly transferred to the imaging system that was maintained at the same environmental con-ditions as the leaves in the IRGA chamber, with the exception of [O2] that was maintained at 20.5 mmol mol–1. When F´ was stable, thermal and fluorescence images were taken and used to calculate IWUEi.
Results
Relationship between Fq´/Fm´ and CO2 assimilation for leaves in imaging chamber
The response of Fq´/Fm´ and A to changing internal [CO2] (Ci) at 20 mmol mol–1 [O2] and at the different PPFDs is shown in Fig. 4a and b. As photorespiration was suppressed, both A and Fq´/Fm´ showed similar shaped saturation functions of Ci, with an initial linear increase as Ci increases before they plateau at a given Ci, which is dependent on PPFD. A plot of A against Fq´/Fm´ (Fig. 4c) shows a robust linear relation-ship between the two parameters at each of the three PPFDs. Regression analysis between the two parameters provided the functional relationship with which measurements of Fq´/Fm´ were converted to A, and the regression coefficients indi-cated that >94% of the variation was accounted for in the relationships.
Fig. 3. Typical (a) Fq´/Fm´ and (b) temperature images of an A. thaliana plant illustrating the production of (c) CO2 assimilation (A), (d) stomatal conductance (gs), and (e) intrinsic WUE (IWUEi) images. Calibrations were applied to convert pixel values within each image into A and gs data, respectively. The wet and dry temperature standards used in the calculation of gs are indicated by arrows on the temperature image. To produce an image of WUEi (A/gs=IWUEi), the A image was rotated, scaled, and interpolated onto the image of gs. The colour bar beneath each image shows the range of parameter values. For further details of this process, see Materials and methods.

Imaging of water use efficiency | 4999
(a)
CO
2 A
ssim
ilatio
n
(m
ol m
-2 s
-1)
-5
0
5
10
15
20
25
(b)
Ci ( mol mol-1)
0 200 400 600 800 1000 1200 1400 1600 1800
PS
II O
pera
ting
Effi
cien
cy
0.1
0.2
0.3
0.4
0.5
CO2 Assimilation ( mol m-2 s-1)0 5 10 15 20
PS
II O
pera
ting
Effi
cien
cy
0.0
0.1
0.2
0.3
0.4
0.5
0.6(c)
Fig. 4. The response of CO2 assimilation (a) and PSII operating efficiency (b), estimated from Fq´/Fm´, to changes in internal CO2 concentration (Ci) under 20 mmol mol–1 O2 and at 200 (open circles), 500 (grey circles), and 800 (filled circles) µmol m–2 s–1 PPFD. The correlation between CO2 assimilation and PSII operating efficiency (c) was fitted using a linear regression for each PPFD intensity. All measurements were made on 5-week-old A. thaliana. Air temperature and VPD were 25 °C and 1.2 kPa, respectively. Data are the means with standard errors (n=3–5).

5000 | McAusland et al.
Validity of estimating stomatal conductance from thermal images
Stomatal conductance calculated from images of leaf tem-perature were compared with independent measurements of gs obtained by infrared gas exchange analysis (Fig. 5). These data demonstrated a significant correlation between meas-ured and calculated gs ranging from 40–640 mmol m–2 s–1 to 640 mmol m–2 s–1, for both plant species. This relationship validates the use of thermography to evaluate gs accurately.
Demonstration of use of fluorescence and thermal imaging to detect differences in water use efficiency
Images of A (Fig. 6a, d) and gs (Fig. 6b, e) determined from images of Fq´/Fm´ and leaf temperature, respectively, were used to calculate images of IWUEi (Fig. 6c, f) for WT and OST1-1 A. thaliana measured after 20 min and 35 min of applying 200 µmol m–2 s–1 PPFD. After 20 min (T20) in the light, there was no significant difference in A between the WT and OST1-1 (Fig. 6a), with all plants showing a mean value of 3.1 µmol m–2 s–1. OST1-1 exhibited a lower A than the WT, although the difference was not significant. The distribution of pixel values within each image indicated that the majority of OST1-1 values were below 4 µmol m–2 s–1 (Supplementary Fig. S1 available at JXB online), whereas WT values covered a greater distribution range (0.5–8 µmol m–2 s–1) and were more evenly distributed within it. Stomatal conductance was
significantly (P=0.069) higher in OST1-1 plants (Fig. 6b); mean gs values for OST1-1 were 395 mmol m–2 s–1 which were 31% greater than the average WT values. This difference was also reflected in the distribution of values within the images (see Supplementary Fig. S1). The mutant showed a frequency distribution that was skewed toward higher conductance val-ues (> 500 mmol m–2 s–1) compared with the WT, where the greatest frequency of pixel values were <200 mmol m–2 s–1. The higher gs value observed in the OST1-1 plants, in con-junction with no difference in A, resulted in a significantly (P=0.019) lower IWUEi compared with the WT. The average IWUEi in WT plants was 44% greater than in the mutants (Fig. 6c). After a further 15 min (T35) at 200 µmol m–2 s–1 PPFD, A in both plant types increased by 1.9 to 5.2 µmol m–2 s–1 and 4.8 µmol m–2 s–1 for WT and OST1-1 plants, respectively. Average gs in the WT had increased by 43% (118 mmol m–2 s–1); however, there was no change in mean OST1-1 gs (Fig. 6e). The higher gs and A after 35 min in WT plants (Fig. 6d) resulted in these plants having a similar IWUEi to the OST1-1 mutants (Fig. 6f). The frequency distribution of pixels reflected the considerable variation observed in the images, with values ranging from 0.5 µmol m–2 s–1 to 10 µmol m–2 s–1 for A, 500 mmol m–2 s–1 to 1000 mmol m–2 s–1 for gs, and 0.0025 µmol CO2 / mmol H2O m–2 s–1 to 0.05 µmol CO2 / mmol H2O m–2 s–1 for IWUEi (Supplementary Fig. S1). However no difference in distributions were observed between the two plant types at 35 min.
Imaging dynamic changes in water use efficiency
WUEi can oscillate rapidly with changes in both A and gs, driven by fluctuations in the environment and in particular light. To demonstrate the effect of changing light on stomatal behaviour and the impacts on A and WUEi, an A. thaliana plant was subjected to a step-wise increase of 600 µmol m–2 s–1 PPFD following stabilization at 200 µmol m–2 s–1 PPFD. In order to verify that the values obtained from the images were typical of those obtained using standard gas exchange meth-ods, simultaneous measurements of A, gs, and WUEi were captured using an IRGA (Fig. 7) and the combined imaging system (Fig. 8). There were no significant differences between measurements obtained using the two methods. A increased from 6.8 µmol m–2 s–1 to 11.9 µmol m–2 s–1 at 800 µmol m–2 s–1 PPFD (Fig. 7a). At 200 µmol m–2 s–1 PPFD, steady-state mean gs was 165 mmol m–2 s–1 and 196 mmol m–2 s–1 in imaged and IRGA measured plants, respectively. Stomatal conduct-ance increased ~30% in both measured and calculated data after 30 min at 800 µmol m–2 s–1 PPFD (Fig. 7b). Although the response of gs determined from the imaging system mir-rored that of IRGA measurements, the values on average were 13% lower. This discrepancy is most probably due to differences in the size of the boundary layer surrounding the leaves under the imaging system and inside the IRGA cuvette (see Discussion). Steady-state WUEi increased from ~0.036 µmol CO2 mmol / H2O m–2 s–1 at 200 µmol m–2 s–1 PPFD to 0.052 µmol CO2 / mmol H2O m–2 s–1 at 800 µmol m–2 s–1 PPFD in measurements obtained using the IRGA (Fig. 7c). IWUEi was slightly higher than IRGA measurements at
Measured Stomatal Conductance (mmol m-2 s-1)
0 200 400 600 800
Cal
cula
ted
Sto
mat
al C
ondu
ctan
ce (
mm
ol m
-2 s
-1)
0
200
400
600
800
Fig. 5. A comparison between stomatal conductance calculated from thermal images with that measured using an IRGA. To stimulate a range of conductances, leaves of Phaseolus vulgaris (filled circles) and A. thaliana thaliana Col-0 (grey circles) and WS-0 (triangles) were exposed to PPFDs between 200 µmol m–2 s–1 and 2000 µmol m–2 s–1. The solid line represents a 1:1 relationship (P < 0.0001, Rs=0.96).

Imaging of water use efficiency | 5001
200 µmol m–2 s–1 PPFD, with an average value of 0.043 µmol CO2 / mmol H2O m–2 s–1. IWUEi steadily increased after PPFD was increased to 800 µmol m–2 s–1 PPFD and reached a maximum value of 0.072 µmol CO2 / mmol H2O m–2 s–1 before stabilizing at a slightly lower value of 0.056 µmol CO2 /mmol H2O m–2 s–1, identical to the IRGA measurements. IWUEi was significantly greater (P=0.02) at 800 µmol m–2 s–1 due primarily to the significant and rapid increase in A and the slower, smaller increase in gs following the step-wise increase in PPFD (Fig. 7c). The small non-significant differ-ences observed between measured and calculated values were most probably due to the heterogeneity observed between leaves and across plants. This variation cannot be taken into account by IRGA measurements of individual leaves. Images taken at 9, 21, and 30 min illustrate considerable variation in A, gs, and IWUEi within and between leaves of an individual plant at any one time point (Fig. 8), as well as the change in parameter values with time and PPFD. At 200 µmol m–2 s–1 PPFD, ~70% of A values were between 5 µmol m–2 s–1 and 9 µmol m–2 s–1. When PPFD was increased to 800 µmol m–2 s–1, the median A value increased from 6.1 µmol m–2 s–1 to 10.3 µmol m–2 s–1 along with increased variation in the dis-tribution of pixel values (1–30 µmol m–2 s–1; Supplementary Fig. S2a at JXB online). The variation in A and gs resulted in
heterogeneous patterns of IWUEi; for example, older leaves generally exhibited a 25% lower IWUEi under 800 µmol m–2 s–1 than younger leaves (Fig. 9; Supplementary Fig. S2).
Comparison of water use efficiency determined by imaging and gas exchange
A direct comparison between WUEi determined from the combined imaging system and measurements taken using an IRGA (Fig. 9) showed a strong positive correlation. The measurements were taken under different environmental con-ditions including a range of PPFDs (200–800 µmol m–2 s–1) and a range of Ci values (35–1400 µmol mol–1) on different leaves from different A. thaliana plants. Measurements of WUEi varied substantially with these different conditions, with values ranging from 0.008 µmol CO2 / mmol H2O m–2 s–1 to 0.07 µmol CO2 / mmol H2O m–2 s–1.
Discussion
A new imaging system capable of near-instantaneous com-bined chlorophyll fluorescence and thermal imaging has been developed in order to generate images of A, gs, and IWUEi from attached individual leaves and whole plants under
Fig. 6. Screening of mutant OST1-1 (left column of three plants) and wild-type Ler (right column of three plants) for differences in CO2 assimilation (A), stomatal conductance (gs), and IWUEi. The plants were dark adapted for 20 min before the PPFD was increased to 200 µmol m–2 s–1. Images were taken after 20 min (a–c) and after 35 min (d–f). Images of A (a and d), gs (b and e), and IWUEi (c and f) were calculated. All images were captured at 400 µmol mol–1 [CO2], 21 °C air temperature, and 1.1 kPa VPD. The colour bar between each image shows the range of parameter values.

5002 | McAusland et al.
strictly controlled environmental conditions. This is the first demonstration of the production of images of WUEi and pro-vides the prospect of rapid and non-destructive screening of plants for alterations in A, gs, and WUEi. Using this system, the impact of stomatal behaviour on IWUEi was examined by comparing WT and known stomatal mutant A. thaliana plants and by monitoring plant responses to changing PPFD, as a driver of stomatal behaviour.
Values of gs indicating the extent of stomatal open-ing (Omasa et al., 1981; Jones, 1992) have previously been inferred from thermal images (Omasa et al., 1981; Croxdale and Omasa, 1990; Inoue, 1990; Taconet et al., 1995; Jones, 1999; Costa et al., 2013); however, to date, only one study has produced images of gs based on thermography. Omasa and Takayama (2003) analysed abscisic acid (ABA)-driven
spatiotemporal changes in gs in conjunction with fluorescence measurements of Fq´/Fm´ and non-photochemical quenching (NPQ) using a combined imaging system. The authors pro-duced images of gs from measurements of leaf temperature; however, these images only examined a small area of a sin-gle leaf (30 × 30 mm). This present study also illustrated the potential for quantitative analysis of spatial and temporal variation in gs and fluorescence in intact leaves that could pro-vide valuable information regarding the coordination of sto-matal and photosynthetic responses (Omasa and Takayama, 2003; West et al., 2005; Aldea et al., 2006; Chaerle et al., 2007). Values of gs estimated from thermal images have been found to be closely correlated with direct measurements of gs from both porometry (Jones, 1999) and IRGA (Fig. 5) meas-urements, consequently giving a high degree of confidence in
(a)
CO
2 A
ssim
ilatio
n (
mol
m-2
s-1
)0
2
4
6
8
10
12
14
16
(b)
Sto
mat
al C
ondu
ctan
ce
(mm
ol m
-2 s
-1)
0
100
200
300
(c)
Time (min)
0 10 20 30 40 50
WU
Ei /
IWU
Ei
(m
ol C
O2
/ mm
ol H
2O m
-2 s
-1)
0.00
0.02
0.04
0.06
0.08
*
* *
* * *
*
* *
Fig. 7. Changes in measured (filled circles) and calculated (open circles) values of CO2 assimilation, stomatal conductance, and WUEi/IWUEi were determined on leaves of 5-week-old A. thaliana plants during a stepwise increase in PPFD from 200 µmol m–2 s–1 to 800 µmol m–2 s–1 PPFD after 15 min (↑). The asterisk (*) denotes data points presented as images in Fig. 9. Air temperature and VPD were 25 °C and 1.2 kPa, respectively. Data are means with standard errors (n=3).

Imaging of water use efficiency | 5003
the images of gs generated from this system. This has enabled spatial and temporal variation in gs to be routinely moni-tored, allowing heterogeneity in IWUEi to be assessed when gs images are mapped to images of A (Fig. 3).
In ‘unstressed’ A. thaliana plants, spatial variation in A, gs, and IWUEi was apparent within and between measure-ments of individual leaves, even under stable gas concentra-tions, PPFD, and temperature (Fig. 6, 8). However, once an intentional perturbation is introduced, such as the step-wise increase in PPFD, this variation in IWUEi was greatly increased. These differences in magnitude and rate of change were mostly driven by gs. It is well established that stomatal responses are an order of magnitude slower than A, which often results in a disconnection between A and gs following an alteration in the environment (Lawson et al., 2011, 2012), that manifests itself in spatial and temporal variation in A and gs (Barradas and Jones, 1996; Weyers et al., 1997; Lawson and Weyers, 1999; Lawson et al., 2002). The degree of variation and the patterns observed are not surprising and are simi-lar to many previous studies that have reported spatial and temporal variation in either A or gs or other related variables (reviewed by Pospíšilová and Šantrůček, 1994; Weyers and Lawson, 1997; Lawson and Weyers, 1999) at scales that range from leaf to canopy (Weyers et al., 1997) and in response to various abiotic and biotic stresses (Tang et al., 2006; Ehlert and Hincha, 2008; Scholes and Rolfe, 2009; Bauriegel et al., 2011; Nabity et al., 2012). A lack of coordination between A and gs and a lag in stomatal behaviour of between 5 min and 10 min is observed when gs does not initially change as PPFD is increased, whereas A responds immediately to increasing
PPFD (Fig. 7). The response of A generally occurs within 1 min, while the response of gs only occurs after a lag of several minutes and may take tens of minutes to complete (Meidner and Mansfield, 1968; Barradas and Jones, 1996; Wilmer and Fricker, 1996; Lawson and Weyers, 1999). It should however be noted that this is not the only explana-tion for variation in photosynthetic capacity (Miranda et al., 1981); leaf anatomy (Sharkey, 1985; Terashima, 1992), leaf temperature (Hashimoto et al., 1984), boundary layer thick-ness (van Gardingen and Grace, 1991), and water relations (Slavík, 1963) all possibly play a role. Such spatial and tem-poral heterogeneity accentuates the value and benefit of using an imaging approach to A, gs and WUEi over alternative tra-ditional cuvette-based methods, which are generally confined to taking a single reading on an individual leaf or area of leaf which may or may not represent the average of the entire plant. The close relationship between WUEi determined from images and traditional IRGA measurements (Fig. 9) illus-trates the robustness of this imaging approach for rapidly assessing WUEi. Although not statistically significant, the imaged values in Fig. 9 tended to be in general lower than those measured directly. There are two plausible explana-tions for this; first, measurements were not taken on identical plants and, secondly, and more probably, these small differ-ences are the result of a higher boundary layer conductance in the IRGA compared with the imaging system.
Although the potential to couple chlorophyll fluorescence and thermal imaging techniques has been explored in several studies (Omasa and Takayama, 2003; Chaerle et al., 2007, 2009), most of these have been conducted at the small scale
Fig. 8. Images of CO2 assimilation, stomatal conductance, and IWUEi taken at 9, 21, and 30 min as shown in Fig. 7. Arrows indicate older leaves selected for analysis. Air temperature and VPD were 25 °C and 1.2 kPa, respectively. The colour bars on the right show the range of parameter values.

5004 | McAusland et al.
(Omasa and Takayama, 2003; Messinger et al., 2006) and have focused on evaluating stomatal behaviour relative to photo-synthetic performance (e.g. Chaerle et al., 2005, 2007), includ-ing stomatal patchiness (Terashima et al., 1988; Terashima, 1992; Beyschlag and Eckstein, 1998; West et al., 2005), pho-toinhibition treatment (Badger et al., 2009), and abiotic and biotic stress (Omasa and Takayama, 2003; Aldea et al., 2006). Morison et al. (2008) were the first to highlight that the Fq´/Fm´ ratio from fluorescence, along with an indicator proportional to gs (Ig; see Jones, 1992) from thermography, provided the possibility to screen plant material non-destructively for A and the assimilation transpiration ratio (ATR; a parameter mathematically equivalent to WUE). Several previous stud-ies have overlaid images of chlorophyll fluorescence and leaf temperature to detail the relationships between A and gs. However, crucially, this is the first study that has converted image data to values of A and gs (using well-defined calibra-tions) and used these data to produce quantitative images of WUEi collectively.
An important potential application of the imaging system is to screen plants for differences in WUEi. A demonstra-tion of this potential is shown in Fig. 6 where clear differ-ences in IWUEi images between three WT A. thaliana and OST1-1 mutant plants were observed. Images of A and gs from these plants indicate that differences in gs, rather than A, between the WT and the mutant are primarily responsi-ble for the differences in IWUEi. As WUEi is a function of
both photosynthesis and stomatal behaviour, it is essential that future screening and selection of plants with improved WUEi is not at the expense of overall carbon gain that may translate into reduced crop yield. The ability to deter-mine whether differences in A or gs account for differences in IWUEi is essential for understanding the physiological mechanisms limiting WUEi, as high values of WUEi can also be achieved with low A and gs, highlighting the importance of developing a system that can measure these two param-eters independently. The effects of the differential contribu-tion of A and gs to WUEi is exemplified in Fig. 6 showing a higher stomatal conductance in the OST mutants com-pared with the WT at 20 min, but with no net gain in net CO2 assimilation, which resulted in a reduced WUE in these plants. Additionally, after 35 min, gs had increased in both the WT and mutant plants, although this increase was sig-nificantly greater in the WT plants, resulting in a greater A. The corresponding images of IWUEi at this time point are in general lower than those observed 15 min earlier, and the initial advantage observed in the WT plants has been lost although an overall greater carbon assimilation rate is appar-ent. These data provide a prime example of the importance of assessing the phenotypic components that drive WUEi in screening approaches and protocols to ensure the appro-priate combination of physiological traits is selected for improved WUEi. The ability to quantify A from images of Fq´/Fm´ is only possible due the built in capability of switch-ing from atmospheric to low O2 in the measuring chamber which allows a linear relationship between Fq´/Fm´ and A to be observed, facilitating rapid comparative measurements of A, gs, and IWUEi. Six plants were imaged by the system in Fig. 6; however, it would be possible to image a greater number of smaller plants but with reduced pixel resolution. Lowering the O2 concentration to 20 mmol mol–1 has little effect on gs over the short time periods required for the meas-urement of Fq´/Fm´, with stomatal responses only apparent after ~5–10 min. However, it should be noted that determin-ing WUE under non-photorespiratory conditions may differ if, for example, mesophyll conductance was different in one specimen relative to another under investigation.
Generally protocols for screening differences in A and gs are made at steady state (Merlot et al., 2002; Schurr et al., 2006; Fiorani and Schurr, 2013); however the potential for plants to modify A and/or gs in changing environments, such as those found in the field, may well be important in determining optimal productivity. The imaging system was designed to facilitate rapid changes in CO2 and O2 concentra-tions, humidity, PPFD, and temperature to generate dynamic responses of A, gs and IWUEi (Figs 7, 8). The success of this type of dynamic screening protocol depends entirely upon the ability to control the measurement conditions tightly, which does not usually take priority in many of the existing phenotypic platforms.
In conclusion, this novel imaging system provides the opportunity rapidly to assess spatial and dynamic differ-ences in A, gs and WUEi in multiple plants under well-defined environmental conditions. This should facilitate improve-ments in the throughput of plants in phenotyping and
Fig. 9. A comparison of IRGA measurements of WUEi and calculated values of IWUEi from images captured using the combined imaging system. WUEi was measured from leaves (circles) of A. thaliana during a step-wise change in light at a CO2 concentration of 400 µmol mol–1 (see Fig. 8); data are means with standard errors (n=5–8). Measurements were taken from individual leaves (squares) at CO2 concentrations between 100 µmol mol–1 and 2000 µmol mol–1. Air temperature and VPD were 25 °C and 1.2 kPa, respectively. The solid line represents a 1:1 relationship.

Imaging of water use efficiency | 5005
screening protocols and consequently in the development of programmes for improved crop productivity.
Supplementary data
Supplementary data are available at JXB online.Figure S1. Pixel value distributions for images of CO2
assimilation (a and d), stomatal conductance (b and e), and IWUEi (c and f) for a single WT (black) and OST mutant (grey) at 20 min (T20) and at 35 min (T35) under 200 µmol m–2 s–1 PPFD (see also Fig. 6).
Figure S2. Pixel value distributions for images of CO2 assimilation (a), stomatal conductance (b), and IWUEi (c) for a single plant during a step-wise increase in PPFD (see also Figs 8 and 9).
Acknowledgements
We would like to acknowledge Professor Lynn Jones (University of Dundee) for his guidance and assistance in determining stomatal conductance from thermal imagery. Dr James Morison (Forest Research, UK) is acknowledged for discussions on developing a combined chlorophyll fluo-rescence and thermal imaging system. Dr Steven Yates is acknowledged for helpful discussion on data analysis. T.A. Hofmann is thanked for comments.
References
Aldea M, Frank TD, DeLucia EH. 2006. A method for quantitative analysis of spatially variable physiological processes across leaf surfaces. Photosynthesis Research 90, 161–172.
Bacon MA. 2004. Water use efficiency in plant biology. In: Bacon MA, ed. Water use efficiency in plant biology. Oxford: Blackwell Publishing, 1–26.
Badger MR, Fallahi H, Kaines S, Takahashi S. 2009. Chlorophyll fluorescence screening of Arabidopsis thaliana for CO2 sensitive photorespiration and photoinhibition mutants. Functional Plant Biology 36, 867–873.
Baker NR. 2008. Chlorophyll fluorescence: a probe of photosynthesis in vivo. Annual Review of Plant Biology 59, 89–113.
Baker NR, Oxborough K. 2004. Chlorophyll fluorescence as a probe of photosynthetic productivity. Berlin: Springer.
Baker NR, Oxborough K, Lawson T, Morison JIL. 2001. High resolution imaging of photosynthetic activities of tissues, cells and chloroplasts in leaves. Journal of Experimental Botany 52, 615–621.
Barbagallo RP, Oxborough K, Pallett KE, Baker NR. 2003. Rapid, non invasive screening for perturbations of metabolism and plant growth using chlorophyll fluorescence imaging. Plant Physiology 132, 485–493.
Barbour MM. 2007. Stable oxygen isotope composition of plant tissue: a review. Functional Plant Biology 34, 83–94.
Barradas VL, Jones HG. 1996. Responses of CO2 assimilation to changes in irradiance: laboratory and field data and a model for beans (Phaseolus vulgaris L.). Journal of Experimental Botany 47, 639.
Bauriegel E, Giebel A, Herppich WB. 2011. Hyperspectral and chlorophyll fluorescence imaging to analyse the impact of Fusarium culmorum on the photosynthetic integrity of infected wheat ears. Sensors 11, 3765–3779.
Beyschlag W, Eckstein J. 1998. Stomatal patchiness. In: Progress in botany. Berlin: Springer, 283–298.
Boyer JS. 1982. Plant productivity and environment. Science 218, 443–448.
Chaerle L, Leinonen I, Jones HG, Van Der Straeten D. 2007. Monitoring and screening plant populations with combined thermal and chlorophyll fluorescence imaging. Journal of Experimental Botany 58, 773–784.
Chaerle L, Lenk S, Leinonen I, Jones HG, Van Der Straeten D, Buschmann C. 2009. Multi-sensor plant imaging: towards the development of a stress-catalogue. Biotechnology Journal 4, 1152–1167.
Chaerle L, Saibo N, Van Der Straeten D. 2005. Tuning the pores: towards engineering plants for improved water use efficiency. Trends in Biotechnology 23, 308–315.
Condon A, Richards R, Rebetzke G, Farquhar G. 2004. Breeding for high water-use efficiency. Journal of Experimental Botany 55, 2447–2460.
Cornic G. 1994. Drought stress and high light effects on leaf photosynthesis. In: Baker NR, Bowyer JR, eds. Photoinhibition of photosynthesis. Oxford: BIOS Scientific Publishers, 297–313.
Cornic G, Ghashghaie J. 1991. Effect of temperature on net CO2 assimilation and photosystem II quantum yield of electron transfer of French bean (Phaseolus vulgaris L.) leaves during drought stress. Planta 185, 255–260.
Costa JM, Grant OM, Chaves MM. 2013. Thermography to explore plant–environment interactions. Journal of Experimental Botany 64 (in press).
Croxdale JG, Omasa K. 1990. Chlorophyll a fluorescence and carbon assimilation in developing leaves of light-grown cucumber. Plant Physiology 93, 1078–1082.
Di Marco G, Manes F, Tricoli D, Vitale E. 1990. Fluorescence parameters measured concurrently with net photosynthesis to investigate chloroplastic CO2 concentration in leaves of Quercus ilex L. Journal of Plant Physiology 136, 538–543.
Edwards GE, Baker NR. 1993. Can CO2 assimilation in maize leaves be predicted accurately from chlorophyll fluorescence analysis? Photosynthesis Research 37, 89–102.
Ehlert B, Hincha DK. 2008. Chlorophyll fluorescence imaging accurately quantifies freezing damage and cold acclimation responses in Arabidopsis leaves. Plant Methods 4, 12.
Farquhar G, Barbour M, Henry B. 1998. Interpretation of oxygen isotope composition of leaf material. In: Griffiths H, ed. Stable isotopes: integration of biological, ecological, and geochemical processes. Oxford: BIOS Scientific Publishers, 27–48.
Farquhar GD, Ehleringer JR, Hubick KT. 1989. Carbon isotope discrimination and photosynthesis. Annual Review of Plant Biology 40, 503–537.
Farquhar GD, O’Leary M, Berry J. 1982. On the relationship between carbon isotope discrimination and the intercellular carbon dioxide concentration in leaves. Functional Plant Biology 9, 121–137.

5006 | McAusland et al.
Fiorani F, Schurr U. 2013. Future scenarios for plant phenotyping. Annual Review of Plant Biology 64, 267–294.
Flexas J, Medrano H. 2002. Drought-inhibition of photosynthesis in C3 plants: stomatal and non-stomatal limitations revisited. Annals of Botany 89, 183–189.
Genty B, Briantais JM, Baker NR. 1989. The relationship between the quantum yield of photosynthetic electron transport and quenching of chlorophyll fluorescence. Biochimica et Biophysica Acta 990, 87–92.
Genty B, Harbinson J, Baker N. 1990. Relative quantum efficiencies of the two-photosystems of leaves in photorespiratory and non-photorespiratory conditions. Plant Physiology and Biochemistry 28, 1–10.
Genty B, Meyer S. 1995. Quantitative mapping of leaf photosynthesis using chlorophyll fluorescence imaging. Functional Plant Biology 22, 277–284.
Glenn DM. 2012. Infrared and chlorophyll fluorescence imaging methods for stress evaluation. HortScience 47, 697–698.
Grant OM, Manuela Chaves M, Jones HG. 2006. Optimizing thermal imaging as a technique for detecting stomatal closure induced by drought stress under greenhouse conditions. Physiologia Plantarum 127, 507–518.
Grant OM, Tronina L, Jones HG, Chaves M. 2007. Exploring thermal imaging variables for the detection of stress responses in grapevine under different irrigation regimes. Journal of Experimental Botany 58, 815–825.
Guilioni L, Jones HG, Leinonen I, Lhomme JP. 2008. On the relationships between stomatal resistance and leaf temperatures in thermography. Agricultural and Forest Meteorology 148, 1908–1912.
Hashimoto Y, Ino T, Kramer PJ, Naylor AW, Strain BR. 1984. Dynamic analysis of water stress of sunflower leaves by means of a thermal image processing system. Plant Physiology 76, 266–269.
Inoue Y. 1990. Remote detection of physiological depression in crop plants with infrared thermal imagery. Japanese Journal of Crop Science 59, 762–768.
Jones HG. 1992. Plants and microclimate: a quantitative approach to environmental plant physiology. Cambridge: Cambridge University Press.
Jones HG. 1998. Stomatal control of photosynthesis and transpiration. Journal of Experimental Botany 49, 387–398.
Jones HG. 1999. Use of thermography for quantitative studies of spatial and temporal variation of stomatal conductance over leaf surfaces. Plant, Cell and Environment 22, 1043–1055.
Jones HG. 2004a. Application of thermal imaging and infrared sensing in plant physiology and ecophysiology. Advances in Botanical Research 41, 107–163.
Jones HG. 2004b. What is water use efficiency? Oxford: Blackwell Publishing.
Kamakura M, Kosugi Y, Takanashi S, Tobita H, Uemura A, Utsugi H. 2012. Observation of the scale of patchy stomatal behavior in leaves of Quercus crispula using an Imaging-PAM chlorophyll fluorometer. Tree Physiology 32, 839–846.
Krall J, Edwards G. 1990. Quantum yields of photosystem II electron transport and carbon dioxide fixation in C4 plants. Functional Plant Biology 17, 579–588.
Lawson T. 2009. Guard cell photosynthesis and stomatal function. New Phytologist 181, 13–34.
Lawson T, Caemmerer S, Baroli I. 2011. Photosynthesis and stomatal behaviour. Progress in Botany 72, 265–304.
Lawson T, Craigon J, Black CR, Colls JJ, Landon G, Weyers JD. 2002. Impact of elevated CO2 and O3 on gas exchange parameters and epidermal characteristics in potato (Solanum tuberosum L.). Journal of Experimental Botany 53, 737–746.
Lawson T, Kramer DM, Raines CA. 2012. Improving yield by exploiting mechanisms underlying natural variation of photosynthesis. Current Opinion in Biotechnology 23, 215–220.
Lawson T, Weyers J. 1999. Spatial and temporal variation in gas exchange over the lower surface of Phaseolus vulgaris L. primary leaves. Journal of Experimental Botany 50, 1381–1391.
Leinonen I, Grant OM, Tagliavivia CPP, Chaves MM, Jones HG. 2006. Estimating stomatal conductance with thermal imagery. Plant, Cell and Environment 29, 1508–1518.
Loriaux S, Avenson T, Welles J, McDermitt D, Eckles R, Riensche B, Genty B. 2013. Closing in on maximum yield of chlorophyll fluorescence using a single multiphase flash of sub-saturating intensity. Plant, Cell and Environment (in press).
Meidner H, Mansfield T. 1968. Physiology of stomata. New York: McGraw-Hill.
Merlot S, Mustilli AC, Genty B, North H, Lefebvre V, Sotta B, Vavasseur A, Giraudat J. 2002. Use of infrared thermal imaging to isolate Arabidopsis mutants defective in stomatal regulation. The Plant Journal 30, 601–609.
Messinger SM, Buckley TN, Mott KA. 2006. Evidence for involvement of photosynthetic processes in the stomatal response to CO2. Plant Physiology 140, 771–778.
Miranda V, Baker NR, Long SP. 1981. Limitations of photosynthesis in different regions of the Zea mays leaf. New Phytologist 89, 179–190.
Morison JIL, Baker NR, Mullineaux PM, Davies WJ. 2008. Improving water use in crop production. Philosophical Transactions of the Royal Society B: Biological Sciences 363, 639–658.
Morison JIL, Gallouët E, Lawson T, Cornic G, Herbin R, Baker NR. 2005. Lateral diffusion of CO2 in leaves is not sufficient to support photosynthesis. Plant Physiology 139, 254–266.
Mott KA, Buckley TN. 1998. Stomatal heterogeneity. Journal of Experimental Botany 49, 407–417.
Mueller ND, Gerber JS, Johnston M, Ray DK, Ramankutty N, Foley JA. 2012. Closing yield gaps through nutrient and water management. Nature 490, 254–257.
Nabity PD, Hillstrom ML, Lindroth RL, DeLucia EH. 2012. Elevated CO2 interacts with herbivory to alter chlorophyll fluorescence and leaf temperature in Betula papyrifera and Populus tremuloides. Oecologia 169, 905–913.
Omasa K, Abo F, Aiga I, Hashimoto Y. 1981. Image instrumentation of plants exposed to air pollutants: quantification of physiological information included in thermal infrared images. Transactions of the Society of Instrument and Control Engineers 17, 657–663.
Omasa K, Takayama K. 2003. Simultaneous measurement of stomatal conductance, non-photochemical quenching, and

Imaging of water use efficiency | 5007
photochemical yield of photosystem II in intact leaves by thermal and chlorophyll fluorescence imaging. Plant and Cell Physiology 44, 1290–1300.
Oxborough K, Baker N. 1997. An instrument capable of imaging chlorophyll a fluorescence from intact leaves at very low irradiance and at cellular and subcellular levels of organization. Plant, Cell and Environment 20, 1473–1483.
Oxborough K, Baker NR. 2000. An evaluation of the potential triggers of photoinactivation of photosystem II in the context of a Stern–Volmer model for downregulation and the reversible radical pair equilibrium model. Philosophical Transactions of the Royal Society B: Biological Sciences 355, 1489–1498.
Passioura J. 2004. Water-use efficiency in farmers’ fields. Oxford: Blackwell, 302–321.
Peak D, West JD, Messinger SM, Mott KA. 2004. Evidence for complex, collective dynamics and emergent, distributed computation in plants. Proceedings of the National Academy of Sciences, USA 101, 918–922.
Penman H, Schofield R. 1951. Some physical aspects of assimilation and transpiration. Symposia of the Society for Experimental Biology 5, 115–129.
Pospíšilová J, Šantrůček J. 1994. Stomatal patchiness. Biologia Plantarum 36, 481–510.
Scholes JD, Rolfe SA. 2009. Chlorophyll fluorescence imaging as tool for understanding the impact of fungal diseases on plant performance: a phenomics perspective. Functional Plant Biology 36, 880–892.
Schurr U, Walter A, Rascher U. 2006. Functional dynamics of plant growth and photosynthesis—from steady-state to dynamics—from homogeneity to heterogeneity. Plant, Cell and Environment 29, 340–352.
Sharkey TD. 1985. Photosynthesis in intact leaves of C3 plants: physics, physiology and rate limitations. Botanical Review 51, 53–105.
Siebke K, von Caemmerer S, Badger M, Furbank RT. 1997. Expressing an RbcS antisense gene in transgenic Flaveria bidentis leads to an increased quantum requirement for CO2 fixed in photosystems I and II. Plant Physiology 115, 1163–1174.
Sinclair TR, Rufty TW. 2012. Nitrogen and water resources commonly limit crop yield increases, not necessarily plant genetics. Global Food Security 1, 94–98.
Slavík B. 1963. Relationship between the osmotic potential of cell sap and the water saturation deficit during the wilting of leaf tissue. Biologia Plantarum 5, 258–264.
Stanhill G. 1986. Water use efficiency. Advances in Agronomy 39, 53–85.
Taconet O, Olioso A, Ben Mehrez M, Brisson N. 1995. Seasonal estimation of evaporation and stomatal conductance over a soybean field using surface IR temperatures. Agricultural and Forest Meteorology 73, 321–337.
Tang JY, Zielinski RE, Zangerl AR, Crofts AR, Berenbaum MR, DeLucia EH. 2006. The differential effects of herbivory by first and fourth instars of Trichoplusia ni (Lepidoptera: Noctuidae) on photosynthesis in Arabidopsis thaliana. Journal of Experimental Botany 57, 527–536.
Terashima I. 1992. Anatomy of non-uniform leaf photosynthesis. Photosynthesis Research 31, 195–212.
Terashima I, Wong SC, Osmond CB, Farquhar GD. 1988. Characterisation of non-uniform photosynthesis induced by abscisic acid in leaves having different mesophyll anatomies. Plant and Cell Physiology 29, 385.
van Gardingen PR, Grace J. 1991. Plants and wind. New York: Academic Press.
van Ittersum MK, Cassman KG, Grassini P, Wolf J, Tittonell P, Hochman Z. 2012. Yield gap analysis with local to global relevance—a review. Field Crops Research 143, 4–17.
Wang Y, Holroyd G, Hetherington AM, Ng CKY. 2004. Seeing ‘cool’ and ‘hot’—infrared thermography as a tool for non-invasive, high-throughput screening of Arabidopsis guard cell signalling mutants. Journal of Experimental Botany 55, 1187–1193.
West JD, Peak D, Peterson JQ, Mott KA. 2005. Dynamics of stomatal patches for a single surface of Xanthium strumarium L. leaves observed with fluorescence and thermal images. Plant, Cell and Environment 28, 633–641.
Weyers J, Lawson T, Peng Z. 1997. Variation in stomatal characteristics at the whole-leaf level. SEB Seminar Series 63, 129–150.
Weyers JDB, Lawson T. 1997. Heterogeneity in stomatal characteristics. Advances in Botanical Research 26, 317–352.
Weyers JDB, Meidner H. 1990. Methods of stomatal research. Longman Scientific & Technical.
Wilmer C, Fricker M. 1996. Stomata. London: Chapman and Hall.