
Development of a Novel Embedded Relay Lens Microscopic Hyperspectral Imaging System for Cancer...
14
Hindawi Publishing Corporation International Journal of Spectroscopy Volume 2012, Article ID 710803, 13 pages doi:10.1155/2012/710803 Research Article Development of a Novel Embedded Relay Lens Microscopic Hyperspectral Imaging System for Cancer Diagnosis: Use of the Mice with Oral Cancer to Be the Example Yao-Fang Hsieh, 1 Mang Ou-Yang, 2 Jeng-Ren Duann, 3, 4 Jin-Chern Chiou, 2, 4 Nai-Wen Chang, 5 Chia-Ing Jan, 6, 7, 8 Ming-Hsui Tsai, 9, 10 Shuen-De Wu, 11 Yung-Jiun Lin, 4 and Cheng-Chung Lee 1 1 Department of Optics and Photonics, National Central University, 300 Jhongda Road, Taoyuan, Chungli 32001, Taiwan 2 Department of Electrical and Computer Engineering, National Chiao Tung University, 1001 University Road, Hsinchu 30010, Taiwan 3 Graduate Institute of Clinical Medical Science, China Medical University, 91 Hsueh-Shih Road, Taichung 40402, Taiwan 4 Biomedical Engineering Research and Development Center, China Medical University Hospital, 2 Yuh-Der Road, Taichung 40447, Taiwan 5 Department of Biochemistry, College of Medicine, China Medical University, 91 Hsueh-Shih Road, Taichung 40402, Taiwan 6 Department of Pathology, China Medical University Hospital, 2 Yuh-Der Road, Taichung 40447, Taiwan 7 Department of Dentistry, National Yang-Ming University, 155 Linong Street Section 2, Taipei 112, Taiwan 8 Department of Pathology, China Medical University Beigang Hospital, 123 Xinde Road, Yunlin 651, Taiwan 9 Department of Otolaryngology, China Medical University, 91 Hsueh-Shih Road, Taichung 40402, Taiwan 10 Department of Otolaryngology Head Neck Surgery, China Medical University Hospital, 2 Yuh-Der Road, Taichung 40447, Taiwan 11 Department of Mechatronic Technology, National Taiwan Normal University, 162 Heping East Road Section 1, Taipei 106, Taiwan Correspondence should be addressed to Mang Ou-Yang, [email protected] Received 30 June 2012; Revised 6 October 2012; Accepted 20 October 2012 Academic Editor: Mohammed A. Gondal Copyright © 2012 Yao-Fang Hsieh et al. This is an open access article distributed under the Creative Commons Attribution License, which permits unrestricted use, distribution, and reproduction in any medium, provided the original work is properly cited. This paper develops a novel embedded relay lens microscopic hyperspectral imaging system (ERL-MHSI) with high spectral resolution (nominal spectral resolution of 2.8 nm) and spatial resolution (30 μm × 10 μm) for cancer diagnosis. The ERL-MHSI system has transmittance and fluorescence mode. The transmittance can provide the morphological information for pathological diagnosis, and the fluorescence of cells or tissue can provide the characteristic signature for identification of normal and abnormal. In this work, the development of the ERL-MHSI system is discussed and the capability of the system is demonstrated by diagnosing early stage oral cancer of twenty mice in vitro. The best sensitivity for identifying normal cells and squamous cell carcinoma (SCC) was 100%. The best specificity for identifying normal cells and SCC was 99%. The best sensitivity for identifying normal cells and dysplasia was 99%. The best specificity for identifying normal cells and dysplasia was 97%. This work also utilizes fractal dimension to analyze the morphological information and find the significant different values between normal and SCC. 1. Introduction The hyperspectral image (HSI) is capable of simultaneously presenting spectral and spatial information with high resolu- tion. The spectral information provides the characteristic of objects, and the spatial information provides the mor- phological information of objects. The combination allows for spectral analysis of each pixel on the acquired image and assists statistical image analysis of the acquired image. Therefore, the HSI has been widely applied to many areas, such as remote sensing, digital archives, biomedical inspec- tion, and so on [1]. In the biomedical inspection, the HSI is a useful modality in diagnostic medicine including applica- tions for retinal image [2, 3], skin diagnosis [4–7], tumor microvasculature change, and cancer diagnosis [8– 10]. Biological tissues have optical characteristics reflecting
-
Upload
independent -
Category
Documents
-
view
2 -
download
0
Transcript of Development of a Novel Embedded Relay Lens Microscopic Hyperspectral Imaging System for Cancer...
Hindawi Publishing CorporationInternational Journal of SpectroscopyVolume 2012, Article ID 710803, 13 pagesdoi:10.1155/2012/710803
Research Article
Development of a Novel Embedded Relay LensMicroscopic Hyperspectral Imaging System for Cancer Diagnosis:Use of the Mice with Oral Cancer to Be the Example
Yao-Fang Hsieh,1 Mang Ou-Yang,2 Jeng-Ren Duann,3, 4 Jin-Chern Chiou,2, 4
Nai-Wen Chang,5 Chia-Ing Jan,6, 7, 8 Ming-Hsui Tsai,9, 10 Shuen-De Wu,11
Yung-Jiun Lin,4 and Cheng-Chung Lee1
1Department of Optics and Photonics, National Central University, 300 Jhongda Road, Taoyuan, Chungli 32001, Taiwan2Department of Electrical and Computer Engineering, National Chiao Tung University, 1001 University Road, Hsinchu 30010, Taiwan3Graduate Institute of Clinical Medical Science, China Medical University, 91 Hsueh-Shih Road, Taichung 40402, Taiwan4Biomedical Engineering Research and Development Center, China Medical University Hospital, 2 Yuh-Der Road,Taichung 40447, Taiwan
5Department of Biochemistry, College of Medicine, China Medical University, 91 Hsueh-Shih Road, Taichung 40402, Taiwan6Department of Pathology, China Medical University Hospital, 2 Yuh-Der Road, Taichung 40447, Taiwan7Department of Dentistry, National Yang-Ming University, 155 Linong Street Section 2, Taipei 112, Taiwan8Department of Pathology, China Medical University Beigang Hospital, 123 Xinde Road, Yunlin 651, Taiwan9Department of Otolaryngology, China Medical University, 91 Hsueh-Shih Road, Taichung 40402, Taiwan
10Department of Otolaryngology Head Neck Surgery, China Medical University Hospital, 2 Yuh-Der Road, Taichung 40447, Taiwan11Department of Mechatronic Technology, National Taiwan Normal University, 162 Heping East Road Section 1, Taipei 106, Taiwan
Correspondence should be addressed to Mang Ou-Yang, [email protected]
Received 30 June 2012; Revised 6 October 2012; Accepted 20 October 2012
Academic Editor: Mohammed A. Gondal
Copyright © 2012 Yao-Fang Hsieh et al. This is an open access article distributed under the Creative Commons AttributionLicense, which permits unrestricted use, distribution, and reproduction in any medium, provided the original work is properlycited.
This paper develops a novel embedded relay lens microscopic hyperspectral imaging system (ERL-MHSI) with high spectralresolution (nominal spectral resolution of 2.8 nm) and spatial resolution (30 μm× 10 μm) for cancer diagnosis. The ERL-MHSIsystem has transmittance and fluorescence mode. The transmittance can provide the morphological information for pathologicaldiagnosis, and the fluorescence of cells or tissue can provide the characteristic signature for identification of normal and abnormal.In this work, the development of the ERL-MHSI system is discussed and the capability of the system is demonstrated by diagnosingearly stage oral cancer of twenty mice in vitro. The best sensitivity for identifying normal cells and squamous cell carcinoma (SCC)was 100%. The best specificity for identifying normal cells and SCC was 99%. The best sensitivity for identifying normal cells anddysplasia was 99%. The best specificity for identifying normal cells and dysplasia was 97%. This work also utilizes fractal dimensionto analyze the morphological information and find the significant different values between normal and SCC.
1. Introduction
The hyperspectral image (HSI) is capable of simultaneouslypresenting spectral and spatial information with high resolu-tion. The spectral information provides the characteristicof objects, and the spatial information provides the mor-phological information of objects. The combination allowsfor spectral analysis of each pixel on the acquired image
and assists statistical image analysis of the acquired image.Therefore, the HSI has been widely applied to many areas,such as remote sensing, digital archives, biomedical inspec-tion, and so on [1]. In the biomedical inspection, the HSI isa useful modality in diagnostic medicine including applica-tions for retinal image [2, 3], skin diagnosis [4–7],tumor microvasculature change, and cancer diagnosis [8–10]. Biological tissues have optical characteristics reflecting
2 International Journal of Spectroscopy
the chemical characteristics to provide information withregard to the health or disease of tissue. Because the canceris the high mortality and morbidity disease, the physicianhopes to find the characteristic of cancer in the early stage.The most accurate way to diagnose cancer relies on patho-logist to study biopsy under the optical microscopic image.Although the optical microscope provides the direct image ofthe biopsy and is the most important instrument to researchpathological change of cancer cell, the optical microscopestill has the limitations. The interaction between light andthe object changes the phase of the light wave and producesthe interference effects. Also, the different experience anddegree of subjectivity for identification borderline dysplasticcells among pathologists need to be considered. Therefore,the technique of combination of microscopic image and HSIhas been developed to diagnose cancer [11]. The techniquenamed microscopic hyperspectral image (MHSI) can recordthe morphological property of tissue and the spectral signalsof each pixel of tissue image. The spectral information ofMHSI always bases on the fluorescent signal. The fluores-cence signal depends on the interaction of light with somecomponents of cell. Proteins, enzymes (collagen, porphyrin),amino acid, and coenzymes (NADH, riboflavins) interactwith the light of specific wavelength. The qualitative andquantitative differences of cell fluorophores were utilizedto distinguish malignant from normal tissues [12–15]. Thecommon useful fluorescence-based optical techniques arecompared in Table 1. The Anwer’s team used the morpho-logic image and fluorescent signal of MHSI to diagnose thecervical cancer [16]. They totally took 308 fibroblast cellsto be the sample for analysis. The system identified normalcervical cells with a specificity of 95.8%. As to low-gradeprecancerous cells and high-grade precancerous, the sen-sitivity was 66.7% and 93.5%, respectively. The Matthew’steam used the MHSI to diagnose the skin cancer of mouse,and the difference of spectral information between normalmouse and malignant mouse was obvious [17]. They usedfive mice to be the sample and got 116 hyperspectral images.Finally, they find that the optimized excitation wavelengthof fluorescence was 420 nm. The Hamed’s team used tenresected stomach to be the sample and got 101 infraredhyperspectral images [18]. They showed 90% specification.The Masood’s team used the morphologic image of MHSI toclassify the colon tissue and got 84% classification rate [19].The MHSI system was preliminary successful applied to thecancer detection.
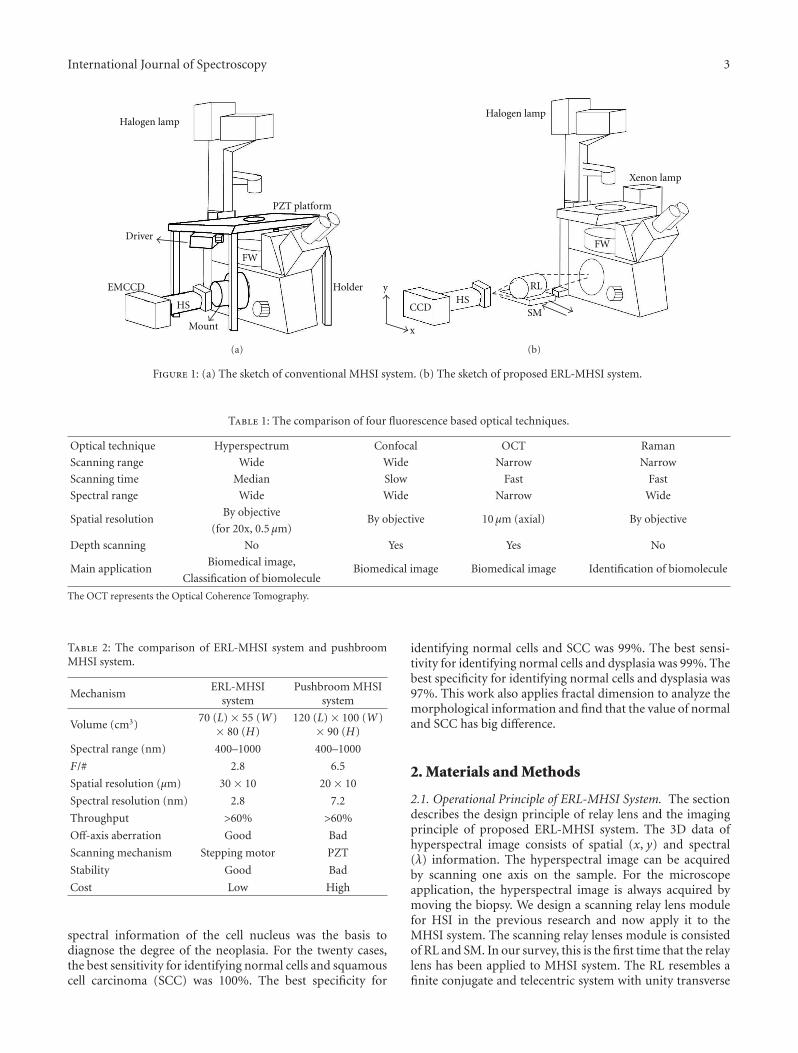
However, according to the principle of hyperspectralimage, the MHSI system needed a scanning platform to scanthe image and then acquire the entire hyperspectral imagedata. The previous researches [1, 8–12, 16–19] used the push-broom structure to be the scanning mechanism of MHSIsystem. Figure 1(a) shows the structure of traditional push-broom MHSI system. The system was enormous and com-plicated which needed larger space for usage. Because thepushbroom scanning mechanism was under the samplestage, the slightly vibration would affect the imaging quality.Hence, the stability and precision of the mechanism werevery important. The driver of the pushbroom scanningmechanism utilized piezoelectric transducer (PZT) which
was expensive. Also, when the objective power was changed,the moving distance of the PZT by per scan must be changed.This would cause more scanning time and inconvenience ofusage. Because the structure was complexity, the optical axisof the pushbroom MHSI also was not easy to align. When theoptical axis of system canot have good alignment, the qualityand spectral information of the image were not good becauseof the optical aberration (e.g., color aberration). The coloraberration was a very important parameter for the MHSI sys-tem, because it affected the fluorescence spectral informationof cells. Besides, the off-axis aberration was the big problemof the pushbroom MHSI system especially in the high magni-fication of objective lens condition, because the entire systemhad no off-axis calibration. The off-axis aberration causedthe serious image distortion. The distortion would affect themorphological information of the image. Hence, this paperproposes a novel embedded relay lens microscopic hyper-spectral imaging (ERL-MHSI) system that used our previousdesign to be the scanning part [20]. The demonstrateddiagrams of the proposed system are showed in Figure 1(b).The designed relay lens (RL) for scanning is put between themicroscope and the hyperspectrometer (HS). The steppingmotor (SM) is under the RL. The RL is particularly designedwith symmetric infinite conjugate lenses for scanning andtransferring images with optimal off-axis optical aberration(distortion < 0.02%, field curvature < 0.2 μm). The mecha-nism of proposed system makes the objective plane (IMP1)and imaging plane (IMP2) on the same optical plane. Whenthe objective lens changes the magnification, the image ofobject and the image on the slit of hyperspectrometer havethe same magnification, the moving distance by per scandoes not need to change. Hence, the novel system canoptically change the scanning mechanism of nanometer-levelresolution needed in a conventional MHSI system, which canonly be accomplished by utilizing a PZT mechanism, that ofmicrometer-level resolution. The latter can be easily carriedout by an ordinary SM, which dramatically reduces the costof the proposed ERL-MHSI system. The entire volume ofthe proposed system (70 cm (L) × 55 cm (W) × 80 cm (H))is smaller than the conventional system (120 cm (L) ×100 cm (W)× 95 cm (H)). A comparison of the ERL-MHSIsystem and pushbroom MHSI system is listed in Table 2.
According to the statistics of the American CancerSociety, approximately 40,250 new cases of oral and throatcancer are expected in the 2012. The oral cancer is the sixthcommon cancer and leads to about 570,000 deaths every yearworldwide [21]. In the USA, the overall 5-year survival is61% of all stages and decreases to 56% of the regional disease.The incidences rates of men are higher than women. Despitethe advances in therapy, the 5-year survival rate has notobviously raised during the past two decades, because thetherapy is more effective for patients in early stage, but, mostpatients appear to be the advanced stage for which therapyis less effective and brings worry in swallowing, talking,and face. Early detection of neoplastic changes is the bestway to improve these events. Therefore, this paper demon-strates the capability of the proposed ERL-MHSI system byidentifying the early stage oral cancer of mice. Twenty micewere utilized to be the biopsy samples. The fluorescence
International Journal of Spectroscopy 3
Halogen lamp
FW
PZT platform
Driver
HS
EMCCD
Mount
Holder
(a)
CCD HS
RL
SM
Halogen lamp
Xenon lamp
FW
x
y
(b)
Figure 1: (a) The sketch of conventional MHSI system. (b) The sketch of proposed ERL-MHSI system.
Table 1: The comparison of four fluorescence based optical techniques.
Optical technique Hyperspectrum Confocal OCT Raman
Scanning range Wide Wide Narrow Narrow
Scanning time Median Slow Fast Fast
Spectral range Wide Wide Narrow Wide
Spatial resolutionBy objective
By objective 10 μm (axial) By objective(for 20x, 0.5 μm)
Depth scanning No Yes Yes No
Main applicationBiomedical image,
Biomedical image Biomedical image Identification of biomoleculeClassification of biomolecule
The OCT represents the Optical Coherence Tomography.
Table 2: The comparison of ERL-MHSI system and pushbroomMHSI system.
MechanismERL-MHSI
systemPushbroom MHSI
system
Volume (cm3)70 (L) × 55 (W)
× 80 (H)120 (L) × 100 (W)
× 90 (H)
Spectral range (nm) 400–1000 400–1000
F/# 2.8 6.5
Spatial resolution (μm) 30 × 10 20 × 10
Spectral resolution (nm) 2.8 7.2
Throughput >60% >60%
Off-axis aberration Good Bad
Scanning mechanism Stepping motor PZT
Stability Good Bad
Cost Low High
spectral information of the cell nucleus was the basis todiagnose the degree of the neoplasia. For the twenty cases,the best sensitivity for identifying normal cells and squamouscell carcinoma (SCC) was 100%. The best specificity for
identifying normal cells and SCC was 99%. The best sensi-tivity for identifying normal cells and dysplasia was 99%. Thebest specificity for identifying normal cells and dysplasia was97%. This work also applies fractal dimension to analyze themorphological information and find that the value of normaland SCC has big difference.
2. Materials and Methods
2.1. Operational Principle of ERL-MHSI System. The sectiondescribes the design principle of relay lens and the imagingprinciple of proposed ERL-MHSI system. The 3D data ofhyperspectral image consists of spatial (x, y) and spectral(λ) information. The hyperspectral image can be acquiredby scanning one axis on the sample. For the microscopeapplication, the hyperspectral image is always acquired bymoving the biopsy. We design a scanning relay lens modulefor HSI in the previous research and now apply it to theMHSI system. The scanning relay lenses module is consistedof RL and SM. In our survey, this is the first time that the relaylens has been applied to MHSI system. The RL resembles afinite conjugate and telecentric system with unity transverse
4 International Journal of Spectroscopy
1
Distdrtion
0.90.80.70.60.50.40.30.20.1
00 10 20 30 40 50 60 70 80 90 100
Mod
ulu
s of
th
e O
TF
Spatial frequency in cycles per MM10−1 0.50−0.5
Millimeters
Maximum field is 7.25 millimeters
(%)
TS 0 MM TS 3 MMTS 4 MM
TS 5 MM
TS 6 MMTS 7.25 MM
TS 1.5 MM
Field curvature
2D layout
S SSSTTS T
+Y +Y
Polychromatic diffraction MTF
Relay LX A (exported from optalIX)Sat May 14 2011Data for 0.4 to 1 μmSurface: image
MTF
Relay IX A 20090907·ZMXConfiguration 1 of 1
Field curvature/distortion
Relay LX A (exported from optalIX)Sat May 14 2011
1 0.05 0.7 0.55 0.4
Distortion
Relay IX A 20090907·ZMXConfiguration 1 of 1Wavelengths:
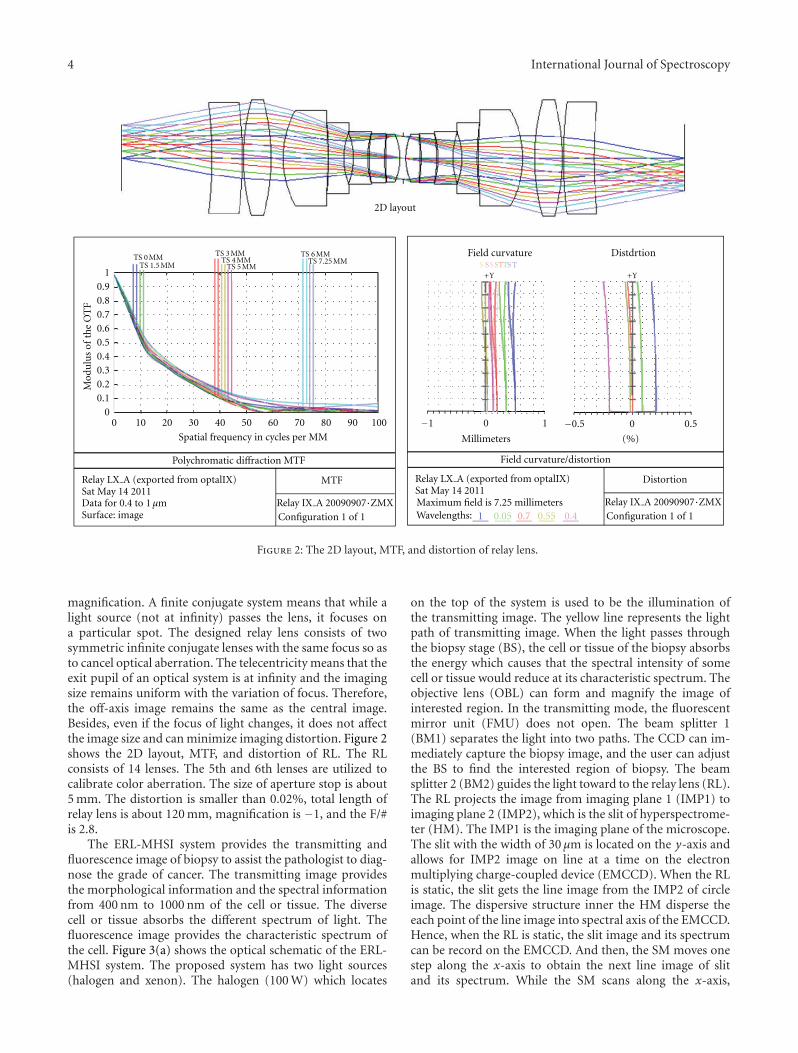
Figure 2: The 2D layout, MTF, and distortion of relay lens.
magnification. A finite conjugate system means that while alight source (not at infinity) passes the lens, it focuses ona particular spot. The designed relay lens consists of twosymmetric infinite conjugate lenses with the same focus so asto cancel optical aberration. The telecentricity means that theexit pupil of an optical system is at infinity and the imagingsize remains uniform with the variation of focus. Therefore,the off-axis image remains the same as the central image.Besides, even if the focus of light changes, it does not affectthe image size and can minimize imaging distortion. Figure 2shows the 2D layout, MTF, and distortion of RL. The RLconsists of 14 lenses. The 5th and 6th lenses are utilized tocalibrate color aberration. The size of aperture stop is about5 mm. The distortion is smaller than 0.02%, total length ofrelay lens is about 120 mm, magnification is −1, and the F/#is 2.8.
The ERL-MHSI system provides the transmitting andfluorescence image of biopsy to assist the pathologist to diag-nose the grade of cancer. The transmitting image providesthe morphological information and the spectral informationfrom 400 nm to 1000 nm of the cell or tissue. The diversecell or tissue absorbs the different spectrum of light. Thefluorescence image provides the characteristic spectrum ofthe cell. Figure 3(a) shows the optical schematic of the ERL-MHSI system. The proposed system has two light sources(halogen and xenon). The halogen (100 W) which locates
on the top of the system is used to be the illumination ofthe transmitting image. The yellow line represents the lightpath of transmitting image. When the light passes throughthe biopsy stage (BS), the cell or tissue of the biopsy absorbsthe energy which causes that the spectral intensity of somecell or tissue would reduce at its characteristic spectrum. Theobjective lens (OBL) can form and magnify the image ofinterested region. In the transmitting mode, the fluorescentmirror unit (FMU) does not open. The beam splitter 1(BM1) separates the light into two paths. The CCD can im-mediately capture the biopsy image, and the user can adjustthe BS to find the interested region of biopsy. The beamsplitter 2 (BM2) guides the light toward to the relay lens (RL).The RL projects the image from imaging plane 1 (IMP1) toimaging plane 2 (IMP2), which is the slit of hyperspectrome-ter (HM). The IMP1 is the imaging plane of the microscope.The slit with the width of 30 μm is located on the y-axis andallows for IMP2 image on line at a time on the electronmultiplying charge-coupled device (EMCCD). When the RLis static, the slit gets the line image from the IMP2 of circleimage. The dispersive structure inner the HM disperse theeach point of the line image into spectral axis of the EMCCD.Hence, when the RL is static, the slit image and its spectrumcan be record on the EMCCD. And then, the SM moves onestep along the x-axis to obtain the next line image of slitand its spectrum. While the SM scans along the x-axis,

International Journal of Spectroscopy 5
x y
z
FMU
Xenon
OBL
BM1
BM2
RL
SM
CCD
B
S
Halogen
IMP1
HM
EMCCD
2
IMP2
(b) Region ARegion BRegion CRegion D
Region ERegion FReference
Wavelength (nm)
54.5
4
33.5
2.52
1.51
0.50350 400 450 500 550 600 700 750 800
Normalized sample spectra
×10−3
Lowa test data (BF1 10x) normalized
λ
Δx
(a)
BS
OBL
Xenon
ECF
DF
EMF
Stray light absorb
Excitation light
Fluorescent light for observation
(b)
Figure 3: (a) The optical schematic of the ERL-MHSI. (b) The optical schematic of fluorescent mirror unit (FMU).
the separate line image is recorded on the y-λ plane of theEMCCD. After the line images are all obtained, the data cubeof all of the y-λ files is loaded to the memory.
In the fluorescent mode, the excitation light source offluorescent image is xenon lamp which has the wide rangespectrum, and the FMU is open. As Figure 3(b) shows, theFMU is composed of excitation filter (ECF), dichromatic
mirror (DM), and emission filter (EMF). The excitation bandis determined by the ECF. The DM reflects the light to theBS, and then the excitation fluorescent light of the cell ortissue goes back to the DM. However, some stray light of theexcitation light transmits without reflection by the DM. TheFMU incorporates a mechanism that absorbs more than 99%of the stray light. The EMF determines the passing spectral
6 International Journal of Spectroscopy
band of the excitation fluorescent light. And then the lightarrives the RL. The following light path and procedure arethe same as transmitting mode.
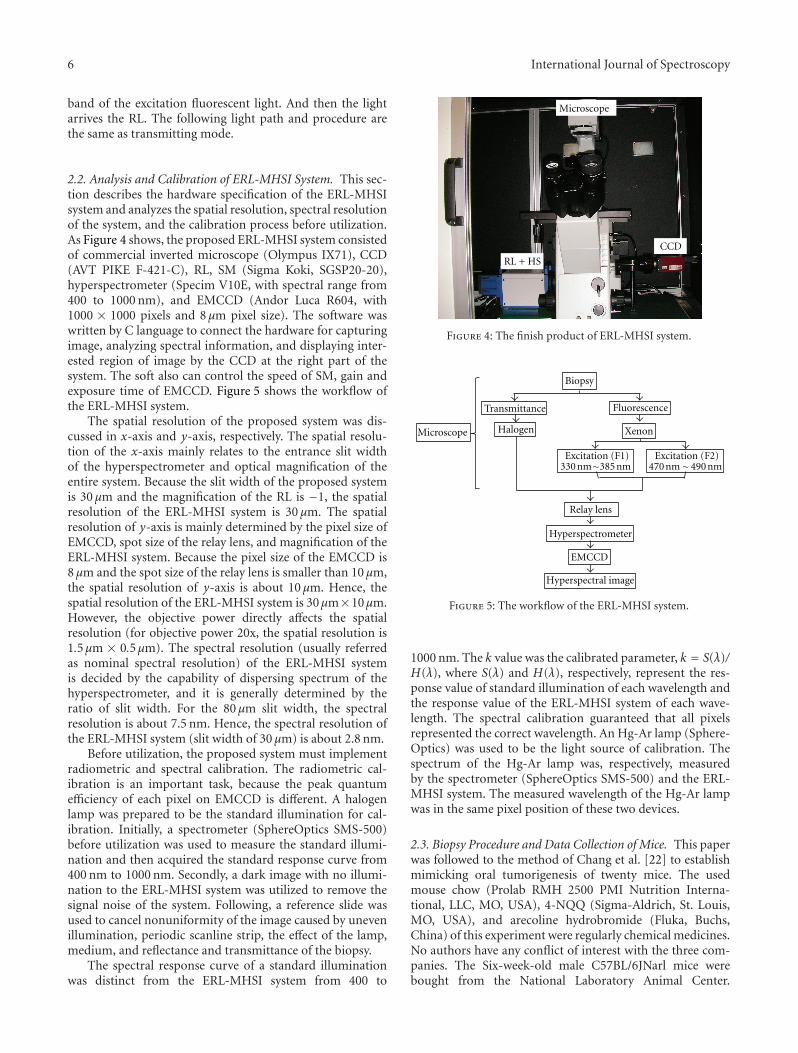
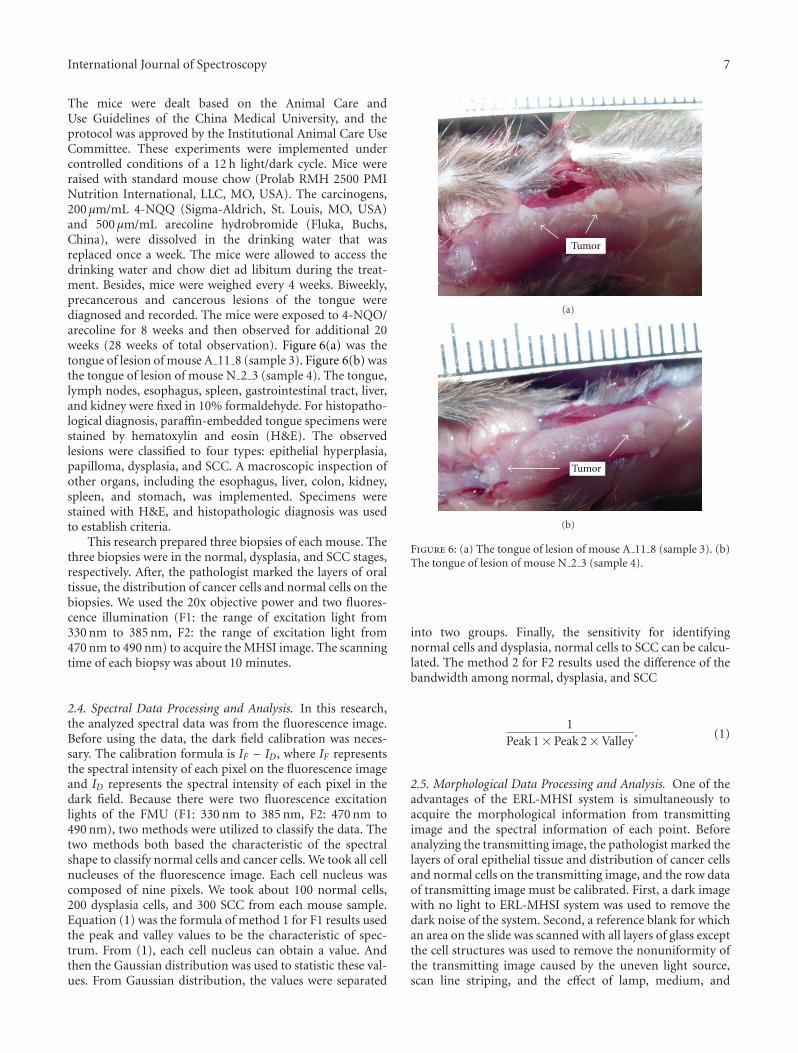
2.2. Analysis and Calibration of ERL-MHSI System. This sec-tion describes the hardware specification of the ERL-MHSIsystem and analyzes the spatial resolution, spectral resolutionof the system, and the calibration process before utilization.As Figure 4 shows, the proposed ERL-MHSI system consistedof commercial inverted microscope (Olympus IX71), CCD(AVT PIKE F-421-C), RL, SM (Sigma Koki, SGSP20-20),hyperspectrometer (Specim V10E, with spectral range from400 to 1000 nm), and EMCCD (Andor Luca R604, with1000 × 1000 pixels and 8 μm pixel size). The software waswritten by C language to connect the hardware for capturingimage, analyzing spectral information, and displaying inter-ested region of image by the CCD at the right part of thesystem. The soft also can control the speed of SM, gain andexposure time of EMCCD. Figure 5 shows the workflow ofthe ERL-MHSI system.
The spatial resolution of the proposed system was dis-cussed in x-axis and y-axis, respectively. The spatial resolu-tion of the x-axis mainly relates to the entrance slit widthof the hyperspectrometer and optical magnification of theentire system. Because the slit width of the proposed systemis 30 μm and the magnification of the RL is −1, the spatialresolution of the ERL-MHSI system is 30 μm. The spatialresolution of y-axis is mainly determined by the pixel size ofEMCCD, spot size of the relay lens, and magnification of theERL-MHSI system. Because the pixel size of the EMCCD is8 μm and the spot size of the relay lens is smaller than 10 μm,the spatial resolution of y-axis is about 10 μm. Hence, thespatial resolution of the ERL-MHSI system is 30μm×10μm.However, the objective power directly affects the spatialresolution (for objective power 20x, the spatial resolution is1.5μm × 0.5μm). The spectral resolution (usually referredas nominal spectral resolution) of the ERL-MHSI systemis decided by the capability of dispersing spectrum of thehyperspectrometer, and it is generally determined by theratio of slit width. For the 80 μm slit width, the spectralresolution is about 7.5 nm. Hence, the spectral resolution ofthe ERL-MHSI system (slit width of 30 μm) is about 2.8 nm.
Before utilization, the proposed system must implementradiometric and spectral calibration. The radiometric cal-ibration is an important task, because the peak quantumefficiency of each pixel on EMCCD is different. A halogenlamp was prepared to be the standard illumination for cal-ibration. Initially, a spectrometer (SphereOptics SMS-500)before utilization was used to measure the standard illumi-nation and then acquired the standard response curve from400 nm to 1000 nm. Secondly, a dark image with no illumi-nation to the ERL-MHSI system was utilized to remove thesignal noise of the system. Following, a reference slide wasused to cancel nonuniformity of the image caused by unevenillumination, periodic scanline strip, the effect of the lamp,medium, and reflectance and transmittance of the biopsy.
The spectral response curve of a standard illuminationwas distinct from the ERL-MHSI system from 400 to
CCD
RL + HS
Microscope
Figure 4: The finish product of ERL-MHSI system.
Biopsy
FluorescenceTransmittance
XenonHalogen
Relay lens
Hyperspectrometer
EMCCD
Hyperspectral image
Microscope
Excitation (F1)330 nm∼385 nm
Excitation (F2)470 nm∼490 nm
Figure 5: The workflow of the ERL-MHSI system.
1000 nm. The k value was the calibrated parameter, k = S(λ)/H(λ), where S(λ) and H(λ), respectively, represent the res-ponse value of standard illumination of each wavelength andthe response value of the ERL-MHSI system of each wave-length. The spectral calibration guaranteed that all pixelsrepresented the correct wavelength. An Hg-Ar lamp (Sphere-Optics) was used to be the light source of calibration. Thespectrum of the Hg-Ar lamp was, respectively, measuredby the spectrometer (SphereOptics SMS-500) and the ERL-MHSI system. The measured wavelength of the Hg-Ar lampwas in the same pixel position of these two devices.
2.3. Biopsy Procedure and Data Collection of Mice. This paperwas followed to the method of Chang et al. [22] to establishmimicking oral tumorigenesis of twenty mice. The usedmouse chow (Prolab RMH 2500 PMI Nutrition Interna-tional, LLC, MO, USA), 4-NQQ (Sigma-Aldrich, St. Louis,MO, USA), and arecoline hydrobromide (Fluka, Buchs,China) of this experiment were regularly chemical medicines.No authors have any conflict of interest with the three com-panies. The Six-week-old male C57BL/6JNarl mice werebought from the National Laboratory Animal Center.
International Journal of Spectroscopy 7
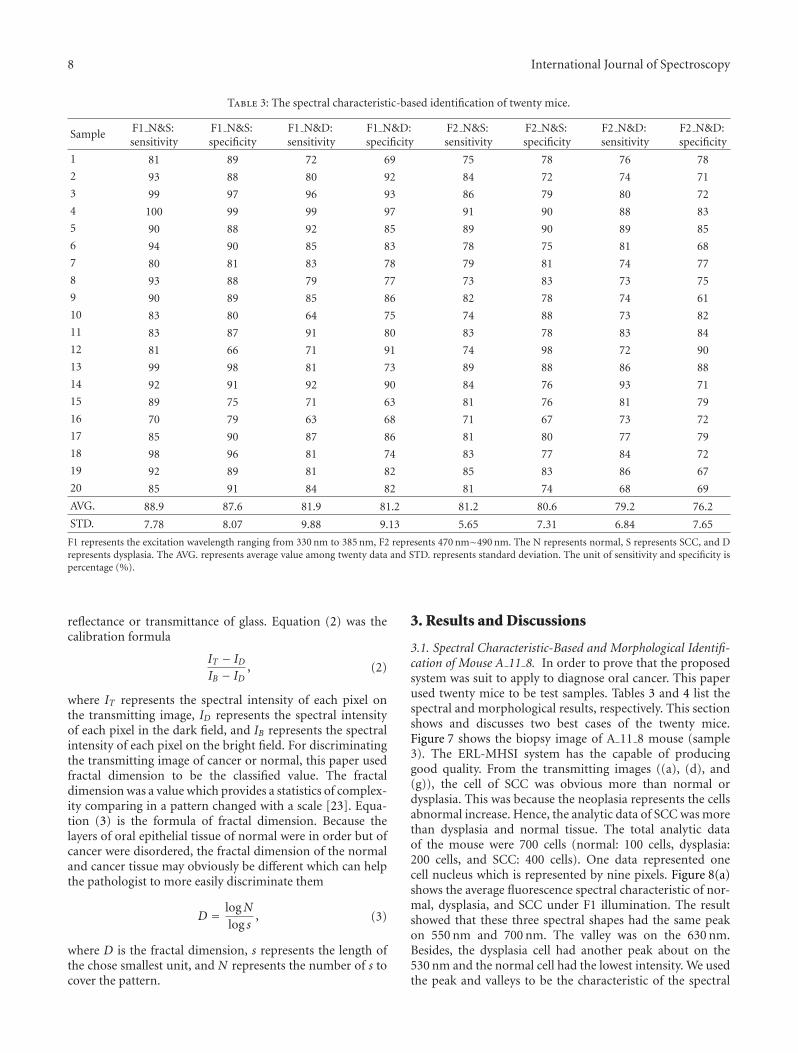
The mice were dealt based on the Animal Care andUse Guidelines of the China Medical University, and theprotocol was approved by the Institutional Animal Care UseCommittee. These experiments were implemented undercontrolled conditions of a 12 h light/dark cycle. Mice wereraised with standard mouse chow (Prolab RMH 2500 PMINutrition International, LLC, MO, USA). The carcinogens,200 μm/mL 4-NQQ (Sigma-Aldrich, St. Louis, MO, USA)and 500 μm/mL arecoline hydrobromide (Fluka, Buchs,China), were dissolved in the drinking water that wasreplaced once a week. The mice were allowed to access thedrinking water and chow diet ad libitum during the treat-ment. Besides, mice were weighed every 4 weeks. Biweekly,precancerous and cancerous lesions of the tongue werediagnosed and recorded. The mice were exposed to 4-NQO/arecoline for 8 weeks and then observed for additional 20weeks (28 weeks of total observation). Figure 6(a) was thetongue of lesion of mouse A 11 8 (sample 3). Figure 6(b) wasthe tongue of lesion of mouse N 2 3 (sample 4). The tongue,lymph nodes, esophagus, spleen, gastrointestinal tract, liver,and kidney were fixed in 10% formaldehyde. For histopatho-logical diagnosis, paraffin-embedded tongue specimens werestained by hematoxylin and eosin (H&E). The observedlesions were classified to four types: epithelial hyperplasia,papilloma, dysplasia, and SCC. A macroscopic inspection ofother organs, including the esophagus, liver, colon, kidney,spleen, and stomach, was implemented. Specimens werestained with H&E, and histopathologic diagnosis was usedto establish criteria.
This research prepared three biopsies of each mouse. Thethree biopsies were in the normal, dysplasia, and SCC stages,respectively. After, the pathologist marked the layers of oraltissue, the distribution of cancer cells and normal cells on thebiopsies. We used the 20x objective power and two fluores-cence illumination (F1: the range of excitation light from330 nm to 385 nm, F2: the range of excitation light from470 nm to 490 nm) to acquire the MHSI image. The scanningtime of each biopsy was about 10 minutes.
2.4. Spectral Data Processing and Analysis. In this research,the analyzed spectral data was from the fluorescence image.Before using the data, the dark field calibration was neces-sary. The calibration formula is IF − ID, where IF representsthe spectral intensity of each pixel on the fluorescence imageand ID represents the spectral intensity of each pixel in thedark field. Because there were two fluorescence excitationlights of the FMU (F1: 330 nm to 385 nm, F2: 470 nm to490 nm), two methods were utilized to classify the data. Thetwo methods both based the characteristic of the spectralshape to classify normal cells and cancer cells. We took all cellnucleuses of the fluorescence image. Each cell nucleus wascomposed of nine pixels. We took about 100 normal cells,200 dysplasia cells, and 300 SCC from each mouse sample.Equation (1) was the formula of method 1 for F1 results usedthe peak and valley values to be the characteristic of spec-trum. From (1), each cell nucleus can obtain a value. Andthen the Gaussian distribution was used to statistic these val-ues. From Gaussian distribution, the values were separated
TumorTumor
(a)
Tumor
(b)
Figure 6: (a) The tongue of lesion of mouse A 11 8 (sample 3). (b)The tongue of lesion of mouse N 2 3 (sample 4).
into two groups. Finally, the sensitivity for identifyingnormal cells and dysplasia, normal cells to SCC can be calcu-lated. The method 2 for F2 results used the difference of thebandwidth among normal, dysplasia, and SCC
1Peak 1× Peak 2×Valley
. (1)
2.5. Morphological Data Processing and Analysis. One of theadvantages of the ERL-MHSI system is simultaneously toacquire the morphological information from transmittingimage and the spectral information of each point. Beforeanalyzing the transmitting image, the pathologist marked thelayers of oral epithelial tissue and distribution of cancer cellsand normal cells on the transmitting image, and the row dataof transmitting image must be calibrated. First, a dark imagewith no light to ERL-MHSI system was used to remove thedark noise of the system. Second, a reference blank for whichan area on the slide was scanned with all layers of glass exceptthe cell structures was used to remove the nonuniformity ofthe transmitting image caused by the uneven light source,scan line striping, and the effect of lamp, medium, and
8 International Journal of Spectroscopy
Table 3: The spectral characteristic-based identification of twenty mice.
Sample F1 N&S:sensitivity
F1 N&S:specificity
F1 N&D:sensitivity
F1 N&D:specificity
F2 N&S:sensitivity
F2 N&S:specificity
F2 N&D:sensitivity
F2 N&D:specificity
1 81 89 72 69 75 78 76 78
2 93 88 80 92 84 72 74 71
3 99 97 96 93 86 79 80 72
4 100 99 99 97 91 90 88 83
5 90 88 92 85 89 90 89 85
6 94 90 85 83 78 75 81 68
7 80 81 83 78 79 81 74 77
8 93 88 79 77 73 83 73 75
9 90 89 85 86 82 78 74 61
10 83 80 64 75 74 88 73 82
11 83 87 91 80 83 78 83 84
12 81 66 71 91 74 98 72 90
13 99 98 81 73 89 88 86 88
14 92 91 92 90 84 76 93 71
15 89 75 71 63 81 76 81 79
16 70 79 63 68 71 67 73 72
17 85 90 87 86 81 80 77 79
18 98 96 81 74 83 77 84 72
19 92 89 81 82 85 83 86 67
20 85 91 84 82 81 74 68 69
AVG. 88.9 87.6 81.9 81.2 81.2 80.6 79.2 76.2
STD. 7.78 8.07 9.88 9.13 5.65 7.31 6.84 7.65
F1 represents the excitation wavelength ranging from 330 nm to 385 nm, F2 represents 470 nm∼490 nm. The N represents normal, S represents SCC, and Drepresents dysplasia. The AVG. represents average value among twenty data and STD. represents standard deviation. The unit of sensitivity and specificity ispercentage (%).
reflectance or transmittance of glass. Equation (2) was thecalibration formula
IT − IDIB − ID
, (2)
where IT represents the spectral intensity of each pixel onthe transmitting image, ID represents the spectral intensityof each pixel in the dark field, and IB represents the spectralintensity of each pixel on the bright field. For discriminatingthe transmitting image of cancer or normal, this paper usedfractal dimension to be the classified value. The fractaldimension was a value which provides a statistics of complex-ity comparing in a pattern changed with a scale [23]. Equa-tion (3) is the formula of fractal dimension. Because thelayers of oral epithelial tissue of normal were in order but ofcancer were disordered, the fractal dimension of the normaland cancer tissue may obviously be different which can helpthe pathologist to more easily discriminate them
D = logNlog s
, (3)
where D is the fractal dimension, s represents the length ofthe chose smallest unit, and N represents the number of s tocover the pattern.
3. Results and Discussions
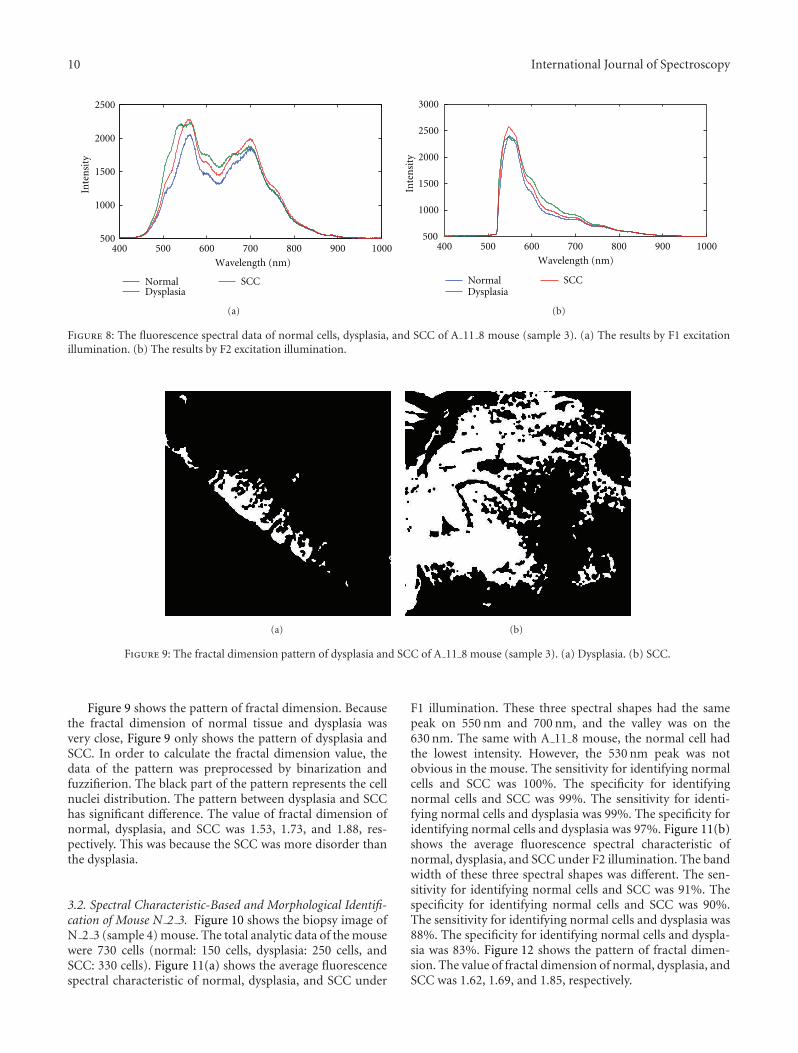
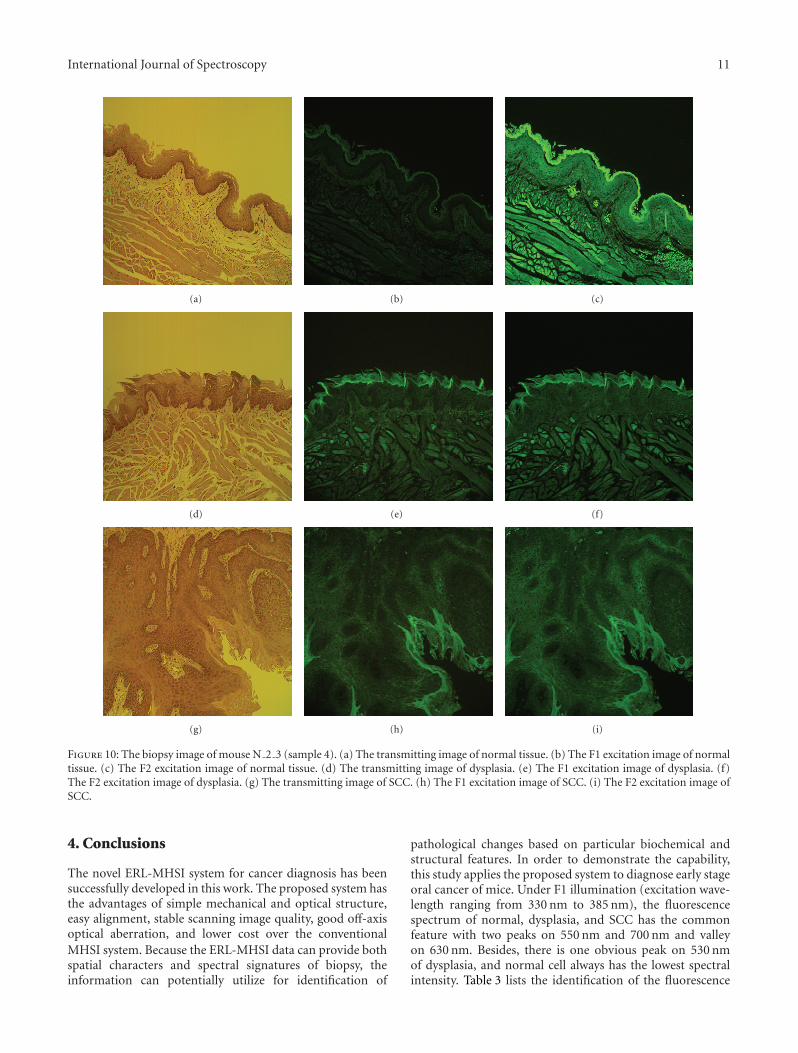
3.1. Spectral Characteristic-Based and Morphological Identifi-cation of Mouse A 11 8. In order to prove that the proposedsystem was suit to apply to diagnose oral cancer. This paperused twenty mice to be test samples. Tables 3 and 4 list thespectral and morphological results, respectively. This sectionshows and discusses two best cases of the twenty mice.Figure 7 shows the biopsy image of A 11 8 mouse (sample3). The ERL-MHSI system has the capable of producinggood quality. From the transmitting images ((a), (d), and(g)), the cell of SCC was obvious more than normal ordysplasia. This was because the neoplasia represents the cellsabnormal increase. Hence, the analytic data of SCC was morethan dysplasia and normal tissue. The total analytic dataof the mouse were 700 cells (normal: 100 cells, dysplasia:200 cells, and SCC: 400 cells). One data represented onecell nucleus which is represented by nine pixels. Figure 8(a)shows the average fluorescence spectral characteristic of nor-mal, dysplasia, and SCC under F1 illumination. The resultshowed that these three spectral shapes had the same peakon 550 nm and 700 nm. The valley was on the 630 nm.Besides, the dysplasia cell had another peak about on the530 nm and the normal cell had the lowest intensity. We usedthe peak and valleys to be the characteristic of the spectral
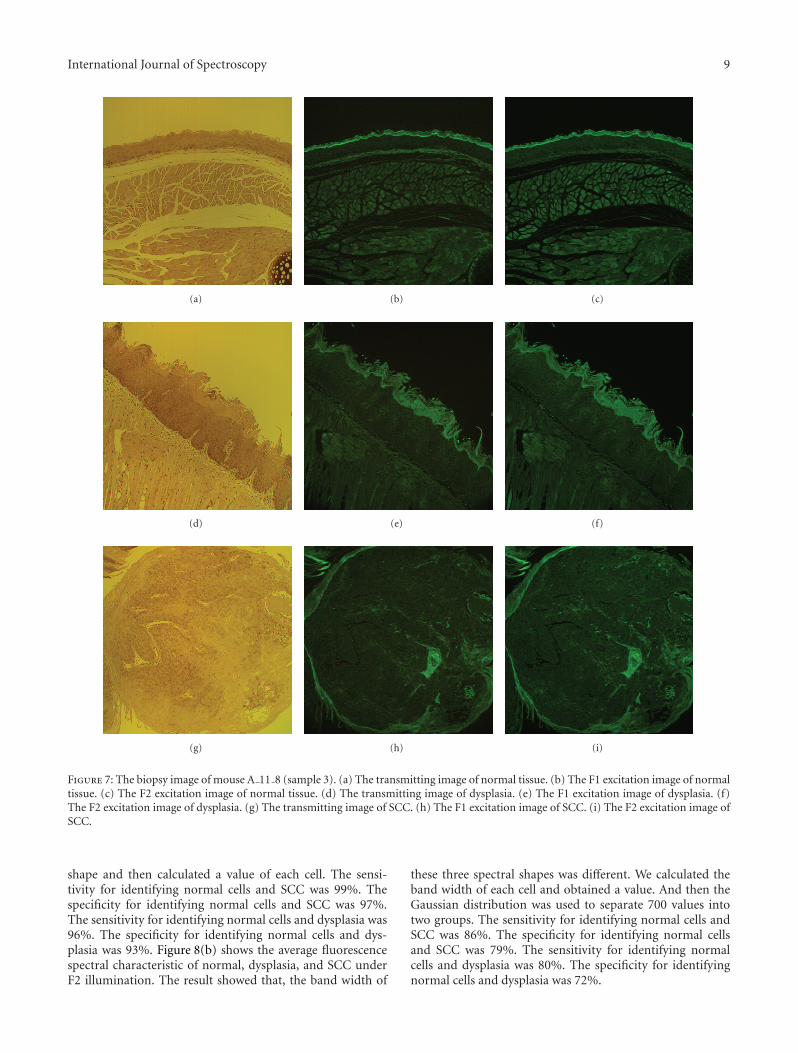
International Journal of Spectroscopy 9
(a) (b) (c)
(d) (e) (f)
(g) (h) (i)
Figure 7: The biopsy image of mouse A 11 8 (sample 3). (a) The transmitting image of normal tissue. (b) The F1 excitation image of normaltissue. (c) The F2 excitation image of normal tissue. (d) The transmitting image of dysplasia. (e) The F1 excitation image of dysplasia. (f)The F2 excitation image of dysplasia. (g) The transmitting image of SCC. (h) The F1 excitation image of SCC. (i) The F2 excitation image ofSCC.
shape and then calculated a value of each cell. The sensi-tivity for identifying normal cells and SCC was 99%. Thespecificity for identifying normal cells and SCC was 97%.The sensitivity for identifying normal cells and dysplasia was96%. The specificity for identifying normal cells and dys-plasia was 93%. Figure 8(b) shows the average fluorescencespectral characteristic of normal, dysplasia, and SCC underF2 illumination. The result showed that, the band width of
these three spectral shapes was different. We calculated theband width of each cell and obtained a value. And then theGaussian distribution was used to separate 700 values intotwo groups. The sensitivity for identifying normal cells andSCC was 86%. The specificity for identifying normal cellsand SCC was 79%. The sensitivity for identifying normalcells and dysplasia was 80%. The specificity for identifyingnormal cells and dysplasia was 72%.
10 International Journal of Spectroscopy
400 500 600 700 800 900 1000500
1000
1500
2000
2500
Wavelength (nm)
Inte
nsi
ty
NormalDysplasia
SCC
(a)
400 500 600 700 800 900 1000500
1000
1500
2000
2500
3000
Wavelength (nm)
Inte
nsi
ty
NormalDysplasia
SCC
(b)
Figure 8: The fluorescence spectral data of normal cells, dysplasia, and SCC of A 11 8 mouse (sample 3). (a) The results by F1 excitationillumination. (b) The results by F2 excitation illumination.
(a) (b)
Figure 9: The fractal dimension pattern of dysplasia and SCC of A 11 8 mouse (sample 3). (a) Dysplasia. (b) SCC.
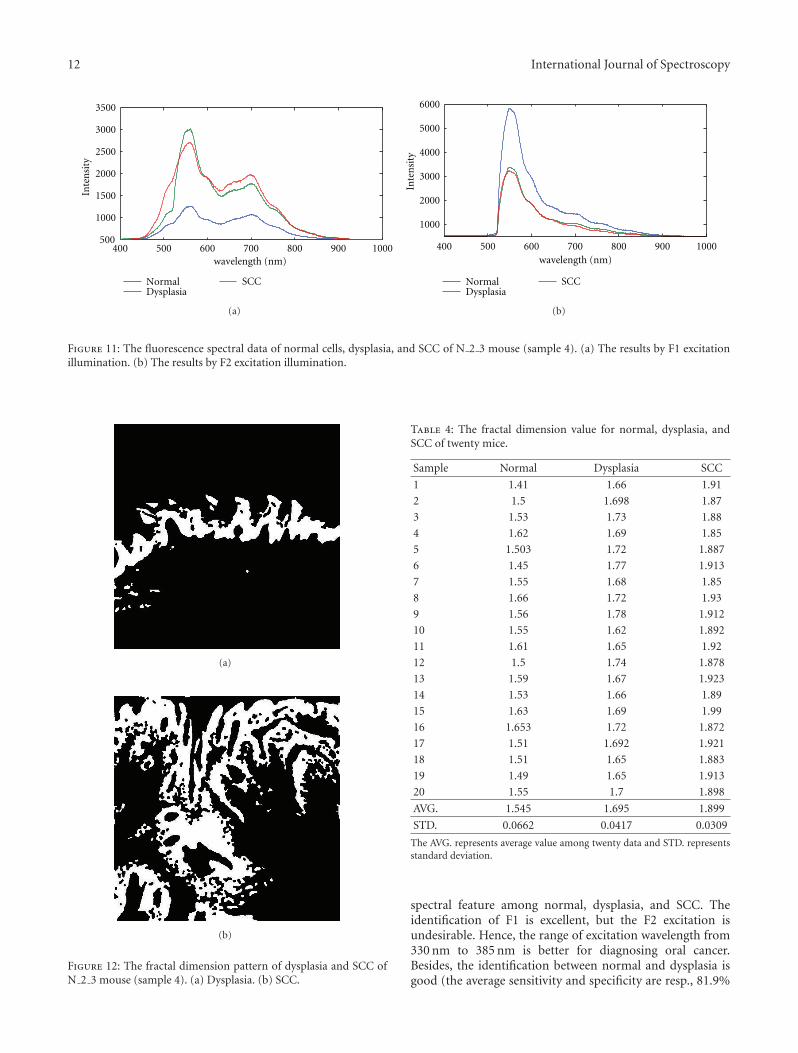
Figure 9 shows the pattern of fractal dimension. Becausethe fractal dimension of normal tissue and dysplasia wasvery close, Figure 9 only shows the pattern of dysplasia andSCC. In order to calculate the fractal dimension value, thedata of the pattern was preprocessed by binarization andfuzzifierion. The black part of the pattern represents the cellnuclei distribution. The pattern between dysplasia and SCChas significant difference. The value of fractal dimension ofnormal, dysplasia, and SCC was 1.53, 1.73, and 1.88, res-pectively. This was because the SCC was more disorder thanthe dysplasia.
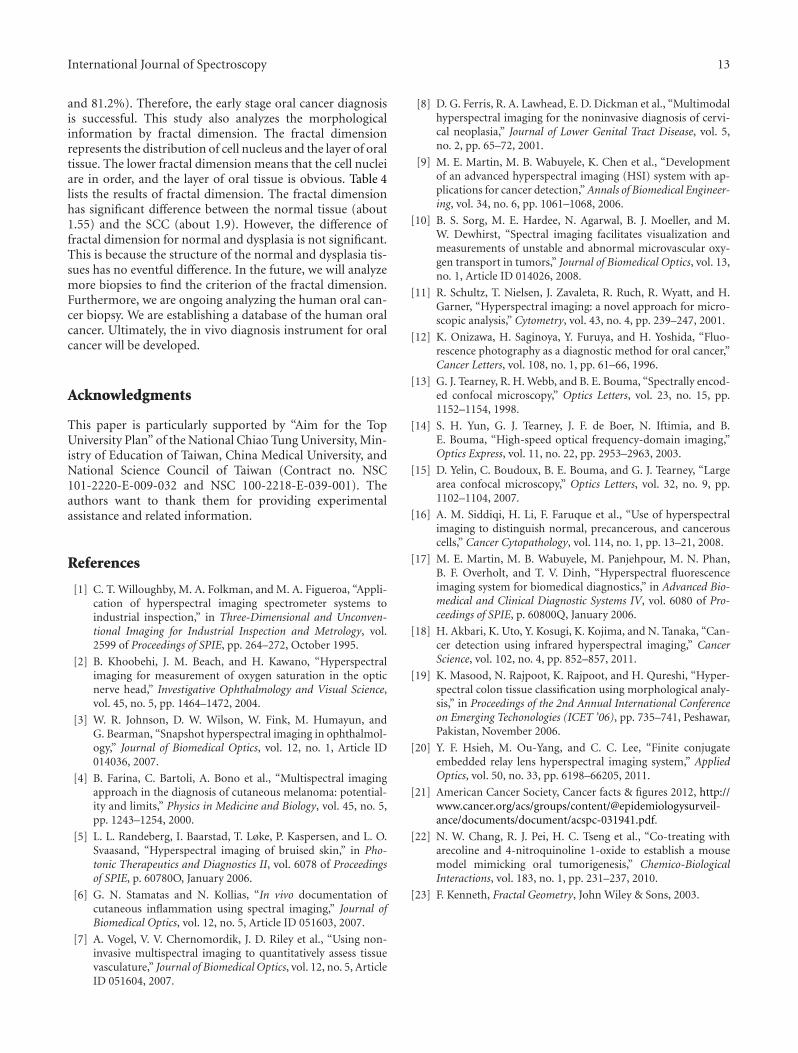
3.2. Spectral Characteristic-Based and Morphological Identifi-cation of Mouse N 2 3. Figure 10 shows the biopsy image ofN 2 3 (sample 4) mouse. The total analytic data of the mousewere 730 cells (normal: 150 cells, dysplasia: 250 cells, andSCC: 330 cells). Figure 11(a) shows the average fluorescencespectral characteristic of normal, dysplasia, and SCC under
F1 illumination. These three spectral shapes had the samepeak on 550 nm and 700 nm, and the valley was on the630 nm. The same with A 11 8 mouse, the normal cell hadthe lowest intensity. However, the 530 nm peak was notobvious in the mouse. The sensitivity for identifying normalcells and SCC was 100%. The specificity for identifyingnormal cells and SCC was 99%. The sensitivity for identi-fying normal cells and dysplasia was 99%. The specificity foridentifying normal cells and dysplasia was 97%. Figure 11(b)shows the average fluorescence spectral characteristic ofnormal, dysplasia, and SCC under F2 illumination. The bandwidth of these three spectral shapes was different. The sen-sitivity for identifying normal cells and SCC was 91%. Thespecificity for identifying normal cells and SCC was 90%.The sensitivity for identifying normal cells and dysplasia was88%. The specificity for identifying normal cells and dyspla-sia was 83%. Figure 12 shows the pattern of fractal dimen-sion. The value of fractal dimension of normal, dysplasia, andSCC was 1.62, 1.69, and 1.85, respectively.
International Journal of Spectroscopy 11
(a) (b) (c)
(d) (e) (f)
(g) (h) (i)
Figure 10: The biopsy image of mouse N 2 3 (sample 4). (a) The transmitting image of normal tissue. (b) The F1 excitation image of normaltissue. (c) The F2 excitation image of normal tissue. (d) The transmitting image of dysplasia. (e) The F1 excitation image of dysplasia. (f)The F2 excitation image of dysplasia. (g) The transmitting image of SCC. (h) The F1 excitation image of SCC. (i) The F2 excitation image ofSCC.
4. Conclusions
The novel ERL-MHSI system for cancer diagnosis has beensuccessfully developed in this work. The proposed system hasthe advantages of simple mechanical and optical structure,easy alignment, stable scanning image quality, good off-axisoptical aberration, and lower cost over the conventionalMHSI system. Because the ERL-MHSI data can provide bothspatial characters and spectral signatures of biopsy, theinformation can potentially utilize for identification of
pathological changes based on particular biochemical andstructural features. In order to demonstrate the capability,this study applies the proposed system to diagnose early stageoral cancer of mice. Under F1 illumination (excitation wave-length ranging from 330 nm to 385 nm), the fluorescencespectrum of normal, dysplasia, and SCC has the commonfeature with two peaks on 550 nm and 700 nm and valleyon 630 nm. Besides, there is one obvious peak on 530 nmof dysplasia, and normal cell always has the lowest spectralintensity. Table 3 lists the identification of the fluorescence
12 International Journal of Spectroscopy
400 500 600 700 800 900 1000500
1000
1500
2000
2500
3000
3500
wavelength (nm)
Inte
nsi
ty
NormalDysplasia
SCC
(a)
400 500 600 700 800 900 1000
1000
2000
3000
4000
5000
6000
wavelength (nm)
Inte
nsi
ty
NormalDysplasia
SCC
(b)
Figure 11: The fluorescence spectral data of normal cells, dysplasia, and SCC of N 2 3 mouse (sample 4). (a) The results by F1 excitationillumination. (b) The results by F2 excitation illumination.
(a)
(b)
Figure 12: The fractal dimension pattern of dysplasia and SCC ofN 2 3 mouse (sample 4). (a) Dysplasia. (b) SCC.
Table 4: The fractal dimension value for normal, dysplasia, andSCC of twenty mice.
Sample Normal Dysplasia SCC
1 1.41 1.66 1.91
2 1.5 1.698 1.87
3 1.53 1.73 1.88
4 1.62 1.69 1.85
5 1.503 1.72 1.887
6 1.45 1.77 1.913
7 1.55 1.68 1.85
8 1.66 1.72 1.93
9 1.56 1.78 1.912
10 1.55 1.62 1.892
11 1.61 1.65 1.92
12 1.5 1.74 1.878
13 1.59 1.67 1.923
14 1.53 1.66 1.89
15 1.63 1.69 1.99
16 1.653 1.72 1.872
17 1.51 1.692 1.921
18 1.51 1.65 1.883
19 1.49 1.65 1.913
20 1.55 1.7 1.898
AVG. 1.545 1.695 1.899
STD. 0.0662 0.0417 0.0309
The AVG. represents average value among twenty data and STD. representsstandard deviation.
spectral feature among normal, dysplasia, and SCC. Theidentification of F1 is excellent, but the F2 excitation isundesirable. Hence, the range of excitation wavelength from330 nm to 385 nm is better for diagnosing oral cancer.Besides, the identification between normal and dysplasia isgood (the average sensitivity and specificity are resp., 81.9%
International Journal of Spectroscopy 13
and 81.2%). Therefore, the early stage oral cancer diagnosisis successful. This study also analyzes the morphologicalinformation by fractal dimension. The fractal dimensionrepresents the distribution of cell nucleus and the layer of oraltissue. The lower fractal dimension means that the cell nucleiare in order, and the layer of oral tissue is obvious. Table 4lists the results of fractal dimension. The fractal dimensionhas significant difference between the normal tissue (about1.55) and the SCC (about 1.9). However, the difference offractal dimension for normal and dysplasia is not significant.This is because the structure of the normal and dysplasia tis-sues has no eventful difference. In the future, we will analyzemore biopsies to find the criterion of the fractal dimension.Furthermore, we are ongoing analyzing the human oral can-cer biopsy. We are establishing a database of the human oralcancer. Ultimately, the in vivo diagnosis instrument for oralcancer will be developed.
Acknowledgments
This paper is particularly supported by “Aim for the TopUniversity Plan” of the National Chiao Tung University, Min-istry of Education of Taiwan, China Medical University, andNational Science Council of Taiwan (Contract no. NSC101-2220-E-009-032 and NSC 100-2218-E-039-001). Theauthors want to thank them for providing experimentalassistance and related information.
References
[1] C. T. Willoughby, M. A. Folkman, and M. A. Figueroa, “Appli-cation of hyperspectral imaging spectrometer systems toindustrial inspection,” in Three-Dimensional and Unconven-tional Imaging for Industrial Inspection and Metrology, vol.2599 of Proceedings of SPIE, pp. 264–272, October 1995.
[2] B. Khoobehi, J. M. Beach, and H. Kawano, “Hyperspectralimaging for measurement of oxygen saturation in the opticnerve head,” Investigative Ophthalmology and Visual Science,vol. 45, no. 5, pp. 1464–1472, 2004.
[3] W. R. Johnson, D. W. Wilson, W. Fink, M. Humayun, andG. Bearman, “Snapshot hyperspectral imaging in ophthalmol-ogy,” Journal of Biomedical Optics, vol. 12, no. 1, Article ID014036, 2007.
[4] B. Farina, C. Bartoli, A. Bono et al., “Multispectral imagingapproach in the diagnosis of cutaneous melanoma: potential-ity and limits,” Physics in Medicine and Biology, vol. 45, no. 5,pp. 1243–1254, 2000.
[5] L. L. Randeberg, I. Baarstad, T. Løke, P. Kaspersen, and L. O.Svaasand, “Hyperspectral imaging of bruised skin,” in Pho-tonic Therapeutics and Diagnostics II, vol. 6078 of Proceedingsof SPIE, p. 60780O, January 2006.
[6] G. N. Stamatas and N. Kollias, “In vivo documentation ofcutaneous inflammation using spectral imaging,” Journal ofBiomedical Optics, vol. 12, no. 5, Article ID 051603, 2007.
[7] A. Vogel, V. V. Chernomordik, J. D. Riley et al., “Using non-invasive multispectral imaging to quantitatively assess tissuevasculature,” Journal of Biomedical Optics, vol. 12, no. 5, ArticleID 051604, 2007.
[8] D. G. Ferris, R. A. Lawhead, E. D. Dickman et al., “Multimodalhyperspectral imaging for the noninvasive diagnosis of cervi-cal neoplasia,” Journal of Lower Genital Tract Disease, vol. 5,no. 2, pp. 65–72, 2001.
[9] M. E. Martin, M. B. Wabuyele, K. Chen et al., “Developmentof an advanced hyperspectral imaging (HSI) system with ap-plications for cancer detection,” Annals of Biomedical Engineer-ing, vol. 34, no. 6, pp. 1061–1068, 2006.
[10] B. S. Sorg, M. E. Hardee, N. Agarwal, B. J. Moeller, and M.W. Dewhirst, “Spectral imaging facilitates visualization andmeasurements of unstable and abnormal microvascular oxy-gen transport in tumors,” Journal of Biomedical Optics, vol. 13,no. 1, Article ID 014026, 2008.
[11] R. Schultz, T. Nielsen, J. Zavaleta, R. Ruch, R. Wyatt, and H.Garner, “Hyperspectral imaging: a novel approach for micro-scopic analysis,” Cytometry, vol. 43, no. 4, pp. 239–247, 2001.
[12] K. Onizawa, H. Saginoya, Y. Furuya, and H. Yoshida, “Fluo-rescence photography as a diagnostic method for oral cancer,”Cancer Letters, vol. 108, no. 1, pp. 61–66, 1996.
[13] G. J. Tearney, R. H. Webb, and B. E. Bouma, “Spectrally encod-ed confocal microscopy,” Optics Letters, vol. 23, no. 15, pp.1152–1154, 1998.
[14] S. H. Yun, G. J. Tearney, J. F. de Boer, N. Iftimia, and B.E. Bouma, “High-speed optical frequency-domain imaging,”Optics Express, vol. 11, no. 22, pp. 2953–2963, 2003.
[15] D. Yelin, C. Boudoux, B. E. Bouma, and G. J. Tearney, “Largearea confocal microscopy,” Optics Letters, vol. 32, no. 9, pp.1102–1104, 2007.
[16] A. M. Siddiqi, H. Li, F. Faruque et al., “Use of hyperspectralimaging to distinguish normal, precancerous, and cancerouscells,” Cancer Cytopathology, vol. 114, no. 1, pp. 13–21, 2008.
[17] M. E. Martin, M. B. Wabuyele, M. Panjehpour, M. N. Phan,B. F. Overholt, and T. V. Dinh, “Hyperspectral fluorescenceimaging system for biomedical diagnostics,” in Advanced Bio-medical and Clinical Diagnostic Systems IV, vol. 6080 of Pro-ceedings of SPIE, p. 60800Q, January 2006.
[18] H. Akbari, K. Uto, Y. Kosugi, K. Kojima, and N. Tanaka, “Can-cer detection using infrared hyperspectral imaging,” CancerScience, vol. 102, no. 4, pp. 852–857, 2011.
[19] K. Masood, N. Rajpoot, K. Rajpoot, and H. Qureshi, “Hyper-spectral colon tissue classification using morphological analy-sis,” in Proceedings of the 2nd Annual International Conferenceon Emerging Techonologies (ICET ’06), pp. 735–741, Peshawar,Pakistan, November 2006.
[20] Y. F. Hsieh, M. Ou-Yang, and C. C. Lee, “Finite conjugateembedded relay lens hyperspectral imaging system,” AppliedOptics, vol. 50, no. 33, pp. 6198–66205, 2011.
[21] American Cancer Society, Cancer facts & figures 2012, http://www.cancer.org/acs/groups/content/@epidemiologysurveil-ance/documents/document/acspc-031941.pdf.
[22] N. W. Chang, R. J. Pei, H. C. Tseng et al., “Co-treating witharecoline and 4-nitroquinoline 1-oxide to establish a mousemodel mimicking oral tumorigenesis,” Chemico-BiologicalInteractions, vol. 183, no. 1, pp. 231–237, 2010.
[23] F. Kenneth, Fractal Geometry, John Wiley & Sons, 2003.

Submit your manuscripts athttp://www.hindawi.com
Hindawi Publishing Corporationhttp://www.hindawi.com Volume 2014
Inorganic ChemistryInternational Journal of
Hindawi Publishing Corporation http://www.hindawi.com Volume 2014
International Journal ofPhotoenergy
Hindawi Publishing Corporationhttp://www.hindawi.com Volume 2014
Carbohydrate Chemistry
International Journal of
Hindawi Publishing Corporationhttp://www.hindawi.com Volume 2014
Journal of
Chemistry
Hindawi Publishing Corporationhttp://www.hindawi.com Volume 2014
Advances in
Physical Chemistry
Hindawi Publishing Corporationhttp://www.hindawi.com
Analytical Methods in Chemistry
Journal of
Volume 2014
Bioinorganic Chemistry and ApplicationsHindawi Publishing Corporationhttp://www.hindawi.com Volume 2014
SpectroscopyInternational Journal of
Hindawi Publishing Corporationhttp://www.hindawi.com Volume 2014
The Scientific World JournalHindawi Publishing Corporation http://www.hindawi.com Volume 2014
Medicinal ChemistryInternational Journal of
Hindawi Publishing Corporationhttp://www.hindawi.com Volume 2014
Chromatography Research International
Hindawi Publishing Corporationhttp://www.hindawi.com Volume 2014
Applied ChemistryJournal of
Hindawi Publishing Corporationhttp://www.hindawi.com Volume 2014
Hindawi Publishing Corporationhttp://www.hindawi.com Volume 2014
Theoretical ChemistryJournal of
Hindawi Publishing Corporationhttp://www.hindawi.com Volume 2014
Journal of
Spectroscopy
Analytical ChemistryInternational Journal of
Hindawi Publishing Corporationhttp://www.hindawi.com Volume 2014
Journal of
Hindawi Publishing Corporationhttp://www.hindawi.com Volume 2014
Quantum Chemistry
Hindawi Publishing Corporationhttp://www.hindawi.com Volume 2014
Organic Chemistry International
ElectrochemistryInternational Journal of
Hindawi Publishing Corporation http://www.hindawi.com Volume 2014
Hindawi Publishing Corporationhttp://www.hindawi.com Volume 2014
CatalystsJournal of