Formation of precipitates and recrystallization resistance in Al–Sc–Zr alloys
Upload
vanderbiltCategory
view
0download
0
rXXXX American Chemical Society A dx.doi.org/10.1021/ac200998a |Anal. Chem. XXXX, XXX, 000–000
ARTICLE
pubs.acs.org/ac
Matrix Sublimation/Recrystallization for Imaging Proteins by MassSpectrometry at High Spatial ResolutionJunhai Yang and Richard M. Caprioli*
Department of Biochemistry and the Mass Spectrometry Research Center, Vanderbilt University, 9160 MRB3, 465 21st Avenue South,Nashville, Tennessee 37235, United States
MALDI imaging mass spectrometry (IMS) of tissue sectionsprovides spatial information for a wide variety of com-
pounds in a given section and plays an important role indiscovery because it does not require target-specific reagentssuch as antibodies.1 The imaging process involves sequentialsteps of tissue sectioning, matrix deposition, data acquisition, andimage construction.1a,2 For protein analysis, the matrix is usuallydeposited on the surface of a tissue section by spraying ormicrospotting. With spraying techniques, the spreading of liquidon the surface can be minimized by not allowing the tissue tobecome overly wet, and this is typically accomplished by applyingthe matrix in cycles with drying between cycles. With microspot-ting techniques, potential delocalization is limited to the dia-meter of the matrix spot. Each protocol has particular attributes:spraying is capable of producing higher spatial resolution toabout 10�20 μm but is less sensitive because of limited proteinextraction.3 Microspotting provides increased sensitivity throughhigher extraction efficiency but is generally limited to a spatialresolution of the size of the spot, or about 100�200 μm withcurrent spotters. It has been reported that matrix applicationusing a modified desktop inkjet printer can obtain 3 pL dropletvolumes. However, the size of the matrix spot on the surface istens of micrometers due to diffusion, giving a spatial resolution of20 μm or greater.4
To image at cellular and subcellular levels, both smaller laserspot sizes (1�5 μm) and suitable sample preparation methodsmust be developed that provide minimal delocalization andachieve crystal sizes smaller than the diameter of the laser beamon the target. MALDI profiling and imaging of peptides has beenreported at the “cellular length scale”, with the matrix applied by
spray coating, giving crystal sizes generally ranging from 10 to50 μm diameter.5 However, more efficient sample preparationprotocols are needed for routine protein imaging at cellular andsubcellular levels.
Sublimation of the matrix was introduced for lipid imaging at aspatial resolution up to 5 μm by Hankin et al.,6 but this has notbeen effective for protein imaging due to poor analyte extraction.A recrystallization step after sublimation has been reportedwhere MALDI MS was used for the analysis of a structured silicatarget for analytes with m/z < 2000.7 However, sublimation forimaging analytes with m/z > 2000 from thin tissue sections hasnot been demonstrated.
We describe here a sample preparation method for proteinimaging using sublimation for analytes with m/z up to 30 000 athigh spatial resolution. The sample preparation protocol consistsof two phases: first, washing (fixing) of the tissue to optimizesensitivity and, second, matrix deposition and recrystallization.We systematically investigated each step of the protocol with thintissue sections with respect to washing conditions, section thick-ness, amount of sublimated matrix per unit area, and recrystalli-zation parameters. With the optimized protocol, ion imagesof mouse and rat brain at high spatial resolution were acquiredwith high sensitivity up to m/z 30 000. We further developed ahistology-directed imaging method on the tissue for targetedhigh-spatial-resolution imaging.
Received: April 18, 2011Accepted: June 3, 2011
ABSTRACT: We have employed matrix deposition by sublimationfor protein image analysis on tissue sections using a hydration/recrystallization process that produces high-quality MALDI massspectra and high-spatial-resolution ion images. We systematicallyinvestigated different washing protocols, the effect of tissue sectionthickness, the amount of sublimated matrix per unit area, anddifferent recrystallization conditions. The results show that anorganic solvent rinse followed by ethanol/water rinses substantiallyincreased sensitivity for the detection of proteins. Both the thicknessof the tissue section and the amount of sinapinic acid sublimated perunit area have optimal ranges for maximal protein signal intensity. Ion images of mouse and rat brain sections at 50, 20, and 10 μmspatial resolution are presented and are correlated with hematoxylin and eosin (H&E)-stained optical images. For targeted analysis,histology-directed imaging can be performed using this protocol where MS analysis and H&E staining are performed on the samesection.
B dx.doi.org/10.1021/ac200998a |Anal. Chem. XXXX, XXX, 000–000
Analytical Chemistry ARTICLE
’MATERIAL AND METHODS
Ethanol, methanol, acetonitrile (ACN), and acetic acid werepurchased from Fisher Scientific (Suwanee, GA), trifluoroa-cetic acid (TFA) and xylene from Acros (Morris Plains, NJ),and chloroform, 2-propanol, n-butyl alcohol (n-BuOH), andtert-butyl alcohol (t-BuOH) from Sigma-Aldrich (Milwaukee,WI). Sinapinic acid (SA) was purchased from Oakwood Prod-ucts, Inc. (West Columbia, SC) and recrystallized twice with70% ACN. Conductive indium tin oxide (ITO)-coated micro-scope glass slides were purchased from Delta Technologies(Stillwater, MN) and stainless steel plates from Applied Biosystems(Carlsbad, CA).
Carnoy’s fluid was prepared from 60 mL of ethanol, 30 mL ofchloroform, and 10 mL of acetic acid. Fresh frozen mouse brain, ratbrain, and chicken liver were purchased from Pel-Freez Biologicals(Rogers, AZ) and were sectioned at 12 μm thickness unlessotherwise noted using a Leica CM3050 cryostat (Leica Microsys-tems GmbH, Wetzlar, Germany). Frozen tissue sections were thaw
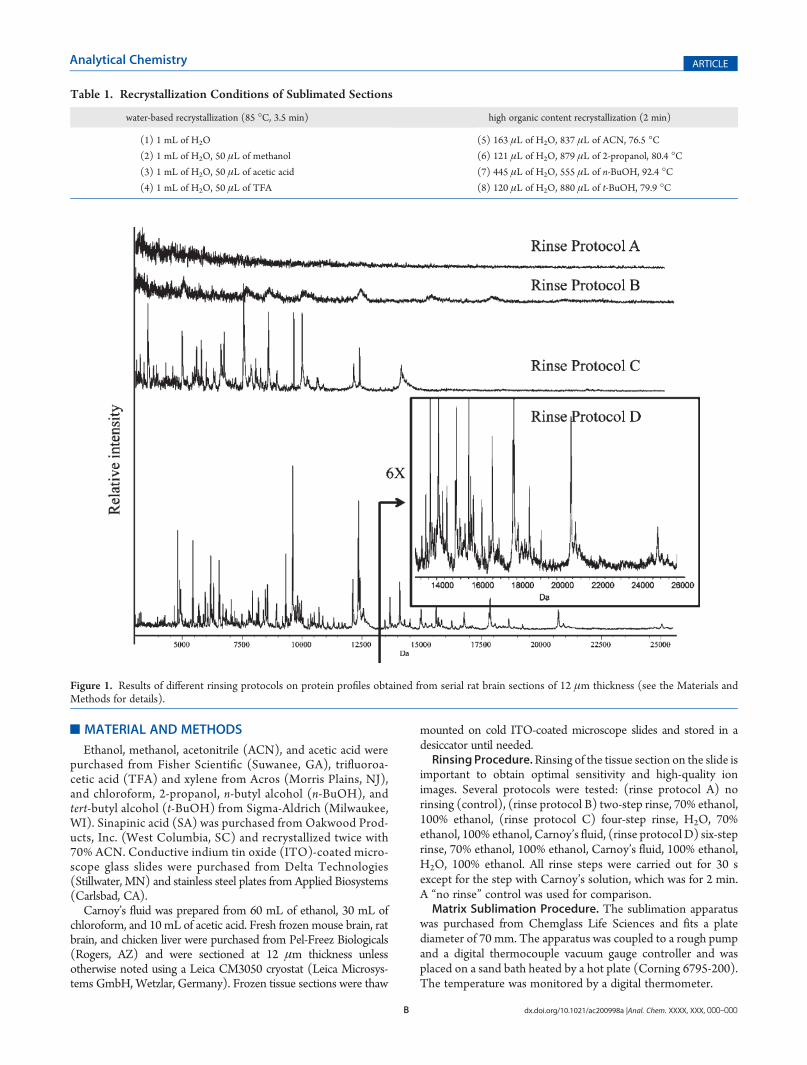
mounted on cold ITO-coated microscope slides and stored in adesiccator until needed.RinsingProcedure.Rinsing of the tissue section on the slide is
important to obtain optimal sensitivity and high-quality ionimages. Several protocols were tested: (rinse protocol A) norinsing (control), (rinse protocol B) two-step rinse, 70% ethanol,100% ethanol, (rinse protocol C) four-step rinse, H2O, 70%ethanol, 100% ethanol, Carnoy’s fluid, (rinse protocol D) six-steprinse, 70% ethanol, 100% ethanol, Carnoy’s fluid, 100% ethanol,H2O, 100% ethanol. All rinse steps were carried out for 30 sexcept for the step with Carnoy’s solution, which was for 2 min.A “no rinse” control was used for comparison.Matrix Sublimation Procedure. The sublimation apparatus
was purchased from Chemglass Life Sciences and fits a platediameter of 70 mm. The apparatus was coupled to a rough pumpand a digital thermocouple vacuum gauge controller and wasplaced on a sand bath heated by a hot plate (Corning 6795-200).The temperature was monitored by a digital thermometer.
Table 1. Recrystallization Conditions of Sublimated Sections
water-based recrystallization (85 �C, 3.5 min) high organic content recrystallization (2 min)
(1) 1 mL of H2O (5) 163 μL of H2O, 837 μL of ACN, 76.5 �C(2) 1 mL of H2O, 50 μL of methanol (6) 121 μL of H2O, 879 μL of 2-propanol, 80.4 �C(3) 1 mL of H2O, 50 μL of acetic acid (7) 445 μL of H2O, 555 μL of n-BuOH, 92.4 �C(4) 1 mL of H2O, 50 μL of TFA (8) 120 μL of H2O, 880 μL of t-BuOH, 79.9 �C
Figure 1. Results of different rinsing protocols on protein profiles obtained from serial rat brain sections of 12 μm thickness (see the Materials andMethods for details).

C dx.doi.org/10.1021/ac200998a |Anal. Chem. XXXX, XXX, 000–000
Analytical Chemistry ARTICLE
ITO-coated glass slides were used as target mounts forinstruments having high voltage sources. For tissue sectionsmounted on shortened ITO microscope glass slides (2.5 �6 cm), sublimation was performed using 300 mg of sinapinic acidat 145 �C and a 25mTorr vacuum. The amount of matrix coatingper unit area with these conditions was controlled by time toobtain a coating at 0.2 mg/cm2, assessed by weight. In terms oftime, a shortenedmicroscope slide takes 18min to coat using thisprocedure.Matrix Recrystallization Conditions. Recrystallization con-
ditions tested are listed in Table 1. An inexpensive recrystalliza-tion chamber was fashioned using a normal glass Petri dish(100 mm diameter � 15 mm depth; Fisher, model 3160101).The slide with sublimated matrix was attached to a stainless steelplate (used as a heat sink), and the plate was attached to theunderside of the top part of the Petri dish using a heat-conductivecopper tape (Electron Microscopy Sciences, model 77801). Thiswas placed into a preheated oven (set at a temperature noted inTable 1) for 2 min. A piece of filter paper was placed in thebottom part of the Petri dish, and one of several solutions(Table 1) was pipetted onto the paper to subsequently create avapor for the recrystallization process. The Petri dish wasreassembled to form a hydration chamber, sealed using tape(Fisher, 35901R), and left in the oven for the time indicated inTable 1. The Petri dish was then opened to allow the slide to dryin the oven.Analysis of a Standard Protein Solution. The standard
protein stock solution contained a mixture of the followingproteins: bovine pancreas insulin (0.5 pmol/μL), equine heartcytochrome c (2 pmol/μL), equine apomyoglobin (4 pmol/μL),and bovine pancreas trypsinogen (8 pmol/μL).A 1 μL volume of the standard protein solution (5 μL of stock
solution was diluted in 25 μL of H2O) was pipetted onto fourclean glass slides. The slides were sublimated with SA to form acoating containing 0.2 mg/cm2. Recrystallization was carried outwith conditions 1�4 in Table 1.Tissue Analysis. Serial sections of chicken liver sectioned at 1,
2, 3, 4, 6, 8, 10, 12, and 16 μm thickness were placed on an ITO-coated microscope slide, rinsed with rinse protocol D, subli-mated with sinapinic acid at 0.2 mg of sinapinic acid/cm2, andrecrystallized with recrystallization condition 3 in Table 1.Amount of Matrix Deposited per Unit Area. Serial sections
of chicken liver of 12 μm thickness were subjected to rinseprotocol D and then sublimated with SA for different amounts oftime: 8, 12, 18, 20, 24, 30, 36, 40, and 45 min. The weight of theslide before and after sublimation was measured with a Toledoanalytical balance to obtain the average amount of matrix persquare centimeter that was deposited. The slides were thentreated with recrystallization condition 3.Matrix Coating Thickness Measurement. A slide with
sublimated matrix at 0.214 mg/cm2 was irradiated by the laserof an Autoflex MALDI Speed mass spectrometer to produce anarray of 100�120 μm diameter holes in the surface (60 holeswere placed, center to center 2 mm, within a 10� 28 mm size areaon the slide). The thickness of the matrix coating was measuredusing the 3D stack function of an Olympus BX50 microscope(Olympus America Inc., Center Valley, PA) by focusing at thesurface near the holes and the bottom of the holes.Hematoxylin and Eosin Stain for Imaged Sections. After
MALDI imaging, slides were rinsed with ethanol and acetone toremove the matrix. The tissue sections were then subjected to astandard hematoxylin and eosin (H&E) staining procedure.8
H&E-stained sections were scanned with a Mirax slide scannerfrom Zeiss or photographed with an Olympus BX50 microscopeequipped with aMicropublisher 3.3 RTV digital camera (Q Imaging,Surrey, BC, Canada).Histology-Guided MS Imaging. An ITO-coated slide con-
taining a rat brain section was first stained withH&E and scannedwith the Mirax slide scanner. The slide was immersed in xylenefor 20 min and the coverslip of the slide removed. TheH&E stainwas removed by incubating the slide in 2� 12 mL of 95% ethanolwith 3%HCl for 10 min each on a LAB-LINEmultipurpose rotatorplatform. The slide was then subjected to the optimized sublimationpreparation and recrystallization procedure described above.Mass Spectrometry and Data Analysis. MALDI MS ana-
lyses of proteins were performed on a Bruker Autoflex MALDISpeed mass spectrometer in the positive ion linear mode usingFlexControl 3.3 software. Approximately 100 shots/spot wereacquired with a 1 kHz repetition rate Smartbeam II Nd:YAGlaser. Image acquisition was carried out using FlexImaging 2.1,and spectral analysis was performed with FlexAnalysis 3.3 andClinProTools software programs (Bruker).
’RESULTS AND DISCUSSION
Characterization of the Sublimated Matrix Layer. A glassslide with a matrix coating at 0.214 mg/cm2 covering an area of10 � 28 mm was measured for thickness using ablated 100�120 μm diameter holes at 2 mm steps. The average thickness of
Figure 2. Spectra from sublimated slides spotted with a standardprotein mixture using different recrystallization conditions: (1) H2O,(2) H2O/methanol, (3) H2O/acetic acid, (4) H2O/TFA, (5) control,manually spotted mixture of SA (20mg in 1:1 ACN/H2O) and standardprotein solution.

D dx.doi.org/10.1021/ac200998a |Anal. Chem. XXXX, XXX, 000–000
Analytical Chemistry ARTICLE
the matrix coating was measured at 2.09( 0.14 μm using the 3Dstack function of the microscope. A total of 60 ablated spotsevenly distributed across the entire slide were measured in thisevaluation, and each spot was measured four times.Optimization of Tissue Washing. To optimize tissue wash-
ing conditions prior to sublimation, we employed serial sectionsof a rat brain and a series of different washing conditions.Commonly used tissue washing (fixing) protocols,9 e.g., rinsingthe tissue section first with 70% ethanol for 30 s and then 95% or100% ethanol for 30 s, did not significantly improve the sensi-tivity for protein analysis using matrix deposition by sublimation(Figure 1 B). Two new protocols were tested that gave high-quality mass spectra as shown in Figure 1C,D. All the spectrawere acquired from the same location on each serial section with100 laser shots at the same laser intensity.Rinse protocol D gave the best results, where the tissue was
rinsed with 70% ethanol followed by 100% ethanol to fixthe section, a standard protocol used in classical histology.Carnoy’s fluid then efficiently removed most of the lipids fromthe section, followed by washing with 100% ethanol to removethe remaining chloroform from Carnoy’s fluid (this step canbe replaced by placing the slide under a vacuum for 2 min).Next a water rinse removed salts, and a final step of 100%ethanol removed excess water. The mass spectrum obtainedusing this procedure (rinse protocol D) shows a robustprotein profile and mass range over 25 kDa.
Optimization of Matrix Recrystallization Conditions. Theprocess of incorporation of analytes into the sublimated matrixusing water vapor has been previously reported for specieswith m/z < 3000 with 2,5-dihydroxybenzoic acid (DHB) as thematrix;7,10 however, none of these methods were developed forimaging analytes on thin tissue sections. In the current work, wehave developed a recrystallization procedure with sinapinic acidsuitable for imaging proteins on thin tissue sections that can beaccomplished quickly (<10 min) using simple laboratory glass-ware, i.e., a Petri dish, a stainless steel plate as a heat sink, and aconstant-temperature (85 �C) oven. In this process, the micro-scope slide is fixed to a stainless steel plate to introduce athermally conductive substrate to allow a temperature gradientfor vapor condensation. This is a key element for recrystallizationso that it can be accomplished in a short time. The optimalrecrystallization time was found to be 3�4 min at 85 �C forwater-based solutions. With exposure to solvent vapor for muchlonger than 4 min, excessive water condensation was found onthe surface, with the formation of nonhomogenous areas of thematrix that potentially could lead to analyte delocalization.Four slides spotted with a standard protein solution were
coated with sinapinic acid by a sublimation and recrystallizationprocess corresponding to conditions 1�4. As shown in Figure 2,there was no detectable signal from the slide recrystallized withwater alone (Figure 2, panel 1) while slides recrystallized withH2O/acetic acid and H2O/methanol gave spectra similar to
Figure 3. Impact of different recrystallization procedures (1�8; see the recrystallization conditions in the Materials and Methods) on the proteinprofiles obtained from serial sections of chicken liver of 12 μm thickness.
E dx.doi.org/10.1021/ac200998a |Anal. Chem. XXXX, XXX, 000–000
Analytical Chemistry ARTICLE
those spotted manually (Figure 2, panels 2 and 3). The spectrumshown in panel 4 employed a recrystallization process that usedTFA, and this was found to produce lower intensity high-masssignals.We performed the same recrystallization condition procedures on
chicken liver sections to determine theoptimal recrystallization condi-tion for this more complex sample. Again, as in the case of thestandard protein mixture, both H2O/acetic acid and H2O/methanolgave excellent protein profiles with the greatest number of peaks inthe spectrum and the highest peak intensities (Figure 3, panels 1�4).Since sinapinic acid has a low solubility in water, we investi-
gated methods to condense a layer of higher organic content onthe surface of the matrix. Conditions were employed on the basis ofknown azeotropic mixtures.11 For initial experiments, n-butyl alcohol,tert-butyl alcohol, 2-propanol, and acetonitrile were chosen for theirhigh ratioof solvent towater at the azeotropic point. A total of 1mLofeach azeotropic solution (see Table 1) was used to recrystallize thesublimated serial sections of chicken liver. The oven was set up at thetemperature of the azeotropic point for each solution. We found that2 min of recrystallization with these solutions gave a satisfactorycoating of solution on the surface. The water/tert-butyl alcoholmixture was optimal for the organic-based vapors in that it producedthe highest number of peaks in the spectra and the highest S/N ratiocompared to the other preparations (Figure 3, panels 5�8).
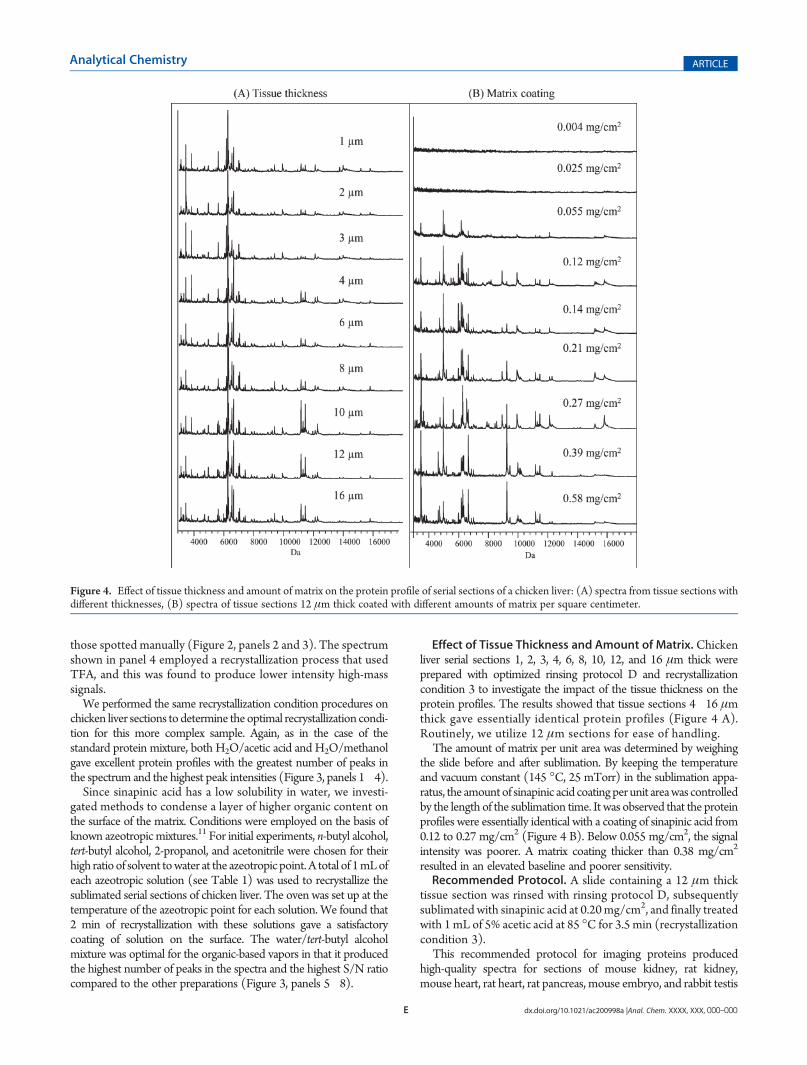
Effect of Tissue Thickness and Amount of Matrix. Chickenliver serial sections 1, 2, 3, 4, 6, 8, 10, 12, and 16 μm thick wereprepared with optimized rinsing protocol D and recrystallizationcondition 3 to investigate the impact of the tissue thickness on theprotein profiles. The results showed that tissue sections 4�16 μmthick gave essentially identical protein profiles (Figure 4 A).Routinely, we utilize 12 μm sections for ease of handling.The amount of matrix per unit area was determined by weighing
the slide before and after sublimation. By keeping the temperatureand vacuum constant (145 �C, 25 mTorr) in the sublimation appa-ratus, the amountof sinapinic acid coatingperunit areawas controlledby the length of the sublimation time. It was observed that the proteinprofiles were essentially identical with a coating of sinapinic acid from0.12 to 0.27 mg/cm2 (Figure 4 B). Below 0.055 mg/cm2, the signalintensity was poorer. A matrix coating thicker than 0.38 mg/cm2
resulted in an elevated baseline and poorer sensitivity.Recommended Protocol. A slide containing a 12 μm thick
tissue section was rinsed with rinsing protocol D, subsequentlysublimated with sinapinic acid at 0.20mg/cm2, and finally treatedwith 1 mL of 5% acetic acid at 85 �C for 3.5 min (recrystallizationcondition 3).This recommended protocol for imaging proteins produced
high-quality spectra for sections of mouse kidney, rat kidney,mouse heart, rat heart, rat pancreas, mouse embryo, and rabbit testis
Figure 4. Effect of tissue thickness and amount of matrix on the protein profile of serial sections of a chicken liver: (A) spectra from tissue sections withdifferent thicknesses, (B) spectra of tissue sections 12 μm thick coated with different amounts of matrix per square centimeter.

F dx.doi.org/10.1021/ac200998a |Anal. Chem. XXXX, XXX, 000–000
Analytical Chemistry ARTICLE
(data not shown). By modifying some parameters of this recom-mended protocol (solvent ratio, temperature, etc.), it can be opti-mized for any type of tissue.To test image quality using the optimized method, we imaged
a 12μmthick coronal section of amouse brain with a raster of 50μmsteps using a laser spot diameter of about 40 μm on the target.Representative ion images are shown in Figure 5a. TheH&E-stainedoptical image of the same section obtained after MALDI imaging isshown at the top left of Figure 5a.As a further illustration of the capability for high spatial
resolution using this sample preparation protocol, first, a 20 μmraster was performed on a rostral section across the cerebellumof ratbrain (Figure 5b) using a laser spot size on the target of 25 μm.Excellent correlation of the H&E-stained optical image with ionimages was observed. Next an image having a spatial resolution of10 μmwas performedwhere the stage wasmoved at 10 μm steps sothat only a 10� 10 μm area of the tissue was ablated per pixel. Theions of thymosin β-4 (m/z 4955), neurogranin (m/z 7528), andtwo isoforms of myelin basic protein (m/z 14 103 and 18 380) thatwere previously identified in our laboratory were localized on asection of rat brain (Figure 6).Performing Histology Prior to MALDI Imaging. In cases
where classical histology stainingmust be used to help define theMS
imaging, we have modified our procedure. This is similar tohistology-directed profiling,12 although in this case a defined areawas imaged instead of cell clusters. At high spatial resolution of10�35 μm, adjacent tissue sections may not necessarily register oralign well. Thus, we have employed a protocol whereby H&Estaining and MALDI imaging are conducted on the same section.Briefly, the section is stained by standardH&E, and an optical imageof this section is annotated with the area of interest. The section isthen destained and prepared with the optimized sublimationprotocol for MALDI imaging. The optical image of the stainedsection is then aligned with the image of the destained/matrix-coated section. Representative ion images of the hippocampus in arat brain section are presented in Figure 7, showing an excellentcorrelation between the optical image and ion images. The value ofthis procedure is that only the area of interest is imaged, allowingfaster acquisition time and avoiding unnecessarily large data files.
’CONCLUSION
A procedure is described for imaging proteins between 3 and30 kDa using a sublimation-based sample preparation protocolthat allows a spatial resolution of 10 μm.With histology-directed
Figure 5. (a) Ion images from a 12 μm thick mouse brain section at50 μm spatial resolution. (b) Ion images from a 12 μm thick rat brainsection at 20 μm spatial resolution.
Figure 6. Ion images from a 12 μm thick section of rat brain at 10 μmspatial resolution.
Figure 7. Representative ion images of the hippocampus in a 12 μmthick rat brain section where histology was used to guide the area to beimaged. The spatial resolution was 35 μm.

G dx.doi.org/10.1021/ac200998a |Anal. Chem. XXXX, XXX, 000–000
Analytical Chemistry ARTICLE
profiling, high-resolution molecular analysis was carried out in atargeted manner for high-throughput analysis. Sublimation isa solvent-free coating approach that produces matrix crystalsgenerally less than 1 μm in diameter.13 We obtained matrixcrystals 0.5�3 μm in size measured by scanning electron micro-scopy; therefore, this protocol is amenable for higher spatialresolution imaging. More importantly, the sublimated surface ishomogeneous under properly controlled conditions. Thesecharacteristics make sublimation suitable for cellular level ima-ging and preferred over other solvent-free coating methods.Chemical bias may exist for high-molecular-weight species dueto poor extraction efficiency using water-based solvents. Furtherstudies of different rehydration systems could be potentiallybeneficial in this regard. Sublimation-coated tissue sections areamenable to high-spatial-resolution imaging and recrystallizationprotocols that allow high-sensitivity and high-mass analysis to beachieved.
’AUTHOR INFORMATION
Corresponding Author*Phone: (615) 343-9207. Fax: (615) 343-8372. E-mail: [email protected].
’ACKNOWLEDGMENT
We acknowledge funding from the National Institutes of Health(Grants 5RO1 GM058008-11 and 1P41 RR031461-01).
’REFERENCES
(1) (a) Stoeckli, M.; Chaurand, P.; Hallahan, D. E.; Caprioli, R. M.Nat. Med. 2001, No. 7, 493–496. (b) Franck, J.; Arafah, K.; Elayed, M.;Bonnel, D.; Vergara, D.; Jacquet, A.; Vinatier, D.; Wisztorski, M.; Day, R.;Fournier, I.; Salzet, M. Mol. Cell. Proteomics 2009, 8 (9), 2023–2033.(2) (a) Chaurand, P.; Norris, J. L.; Cornett, D. S.; Mobley, J. A.;
Caprioli, R. M. J. Proteome Res. 2006, 5 (11), 2889–2900. (b) Chaurand,P.; Schwartz, S. A.; Caprioli, R. M. Anal. Chem. 2004, 76 (5), 86A–93A.(3) Lagarrigue, M.; Becker, M.; Lavigne, R.; Deininger, S.-O.; Walch,
A.; Aubry, F.; Suckau, D.; Pineau, C.Mol. Cell. Proteomics 2011, 3 (10),M110.005991.(4) Baluya, D. L.; Garrett, T. J.; Yost, R. A. Anal. Chem. 2007,
79 (17), 6862–6867.(5) (a) Li, L.; Garden, R. W.; Sweedler, J. V. Trends Biotechnol. 2000,
18 (4), 151–160. (b) Altelaar, A. F. M.; Taban, I. M.; McDonnell, L. A.;Verhaert, P.D. E.M.; de Lange, R. P. J.; Adan, R. A.H.;Mooi,W. J.; Heeren,R. M. A.; Piersma, S. R. Int. J. Mass Spectrom. 2007, 260 (2�3), 203–211.(6) (a) Hankin, J. A.; Barkley, R. M.; Murphy, R. C. J. Am. Soc. Mass
Spectrom. 2007, 18 (9), 1646–1652. (b) Chaurand, P.; Cornett, D. S.;Angel, P. M.; Caprioli, R. M. Mol. Cell. Proteomics 2011, 2 (10),O110.004259.(7) Bouschen,W.; Schulz, O.; Eikel, D.; Spengler, B. Rapid Commun.
Mass Spectrom. 2010, 24 (3), 355–364.(8) Prophet, E. B., Armed Forces Institute of Pathology. Laboratory
Methods inHistotechnology; American Registry of Pathology:Washington,DC, 1992.(9) Seeley, E. H.; Oppenheimer, S. R.; Mi, D.; Chaurand, P.;
Caprioli, R. M. J. Am. Soc. Mass Spectrom. 2008, 19 (8), 1069–1077.(10) (a) Monroe, E. B.; Koszczuk, B. A.; Losh, J. L.; Jurchen, J. C.;
Sweedler, J. V. Int. J. Mass Spectrom. 2007, 260 (2�3), 237–242. (b)Dekker, L. J. M.; van Kampen, J. J. A.; Reedijk, M. L.; Burgers, P. C.;Gruters, R. A.; Osterhaus, A. D. M. E.; Luider, T. M. Rapid Commun.Mass Spectrom. 2009, 23 (8), 1183–1188.(11) Speight, J. G. Lange’s Handbook of Chemistry, 16th ed.;
McGraw-Hill: New York, 2005.
(12) Cornett, D. S.; Mobley, J. A.; Dias, E. C.; Andersson, M.;Arteaga, C. L.; Sanders, M. E.; Caprioli, R. M.Mol. Cell. Proteomics 2006,5 (10), 1975–1983.
(13) Poetsch, A.; Schl€usener, D.; Florizone, C.; Eltis, L.; Menzel, C.;R€ogner, M.; Steinert, K.; Roth, U. J. Biomol. Tech. 2008, 19 (2), 129–138.
Copyright © 2022 FDOKUMEN