
Modelling snowdrift sublimation on an Antarctic ice shelf
12
The Cryosphere, 4, 179–190, 2010 www.the-cryosphere.net/4/179/2010/ doi:10.5194/tc-4-179-2010 © Author(s) 2010. CC Attribution 3.0 License. The Cryosphere Modelling snowdrift sublimation on an Antarctic ice shelf J. T. M. Lenaerts 1 , M. R. van den Broeke 1 , S. J. D´ ery 2 , G. K ¨ onig-Langlo 3 , J. Ettema 1 , and P. K. Munneke 1 1 Institute for Marine and Atmospheric research Utrecht, Utrecht University, Utrecht, The Netherlands 2 University of Northern British Columbia, Prince George, Canada 3 Alfred Wegener Instit¨ ut f ¨ ur Polar- und Meeresforschung, Bremerhaven, Germany Received: 23 December 2009 – Published in The Cryosphere Discuss.: 9 February 2010 Revised: 20 April 2010 – Accepted: 2 May 2010 – Published: 10 May 2010 Abstract. In this paper, we estimate the contribution of snowdrift sublimation (SU ds ) to the surface mass balance at Neumayer, located on the Ekstr¨ om ice shelf in Eastern Antarctica. A single column version of the RACMO2-ANT model is used as a physical interpolation tool of high-quality radiosonde and surface measurements for a 15-yr period (1993–2007), and combined with a routine to calculate snow- drift sublimation and horizontal snow transport. The site is characterised by a relatively mild, wet and windy climate, so snowdrift is a common phenomenon. The modelled tim- ing and frequency of snowdrift events compares well with observations. This is further illustrated by an additional sim- ulation for Kohnen base, where the timing of snowdrift is re- alistic, although the modelled horizontal transport is overes- timated. Snowdrift sublimation is mainly dependent on wind speed, but also on relative humidity and temperature. Dur- ing high wind speeds, SU ds saturates and cools the air, limit- ing its own strength. We estimate that SU ds removes around 16%±8% of the accumulated snow from the surface. The total sublimation more than triples when snowdrift is con- sidered, although snowdrift sublimation limits sublimation at the surface. SU ds shows a strong seasonal cycle, as well as large inter-annual variability. This variability can be related to the variability of the atmospheric conditions in the surface layer. Correspondence to: J. T. M. Lenaerts ([email protected]) 1 Introduction The surface mass balance (SMB), together with the flow of ice, determines the net mass change of the Antarctic ice sheet and the corresponding sea-level change (Vaughan et al., 1999; Rignot et al., 2008). The specific SMB of a snow/ice surface (mm yr -1 , Van de Berg et al., 2006) can be written as the annual sum of precipitation (P), sublimation at the sur- face (SU), runoff (RU) and erosion (∇·TR ds ) and sublimation (SU ds ) of drifting snow: SMB = year (P - SU - RU -∇· TR ds - SU ds )dt (1) Figure 1 shows that the modelled SMB varies strongly on the Antarctic continent. The high inland plateau is dry (SMB below 70 mm yr -1 ), whereas in the coastal regions the SMB is much larger, especially in the Antarctic Peninsula (Turner et al., 2002). A considerable effort has been made to determine the accumulation (precipitation minus sublimation, P-SU) in Antarctica (e.g., Giovinetto et al., 1992; Van de Berg et al., 2006). The contribution of SU ds to the SMB, however, is largely unknown because direct measurements are unavail- able (Pomeroy and Essery, 1999). Although assumed im- portant on a local scale, earlier studies considered snowdrift sublimation to be a negligible term in the continent-wide sur- face mass budget (e.g., Turner et al., 1999). Different mod- elling studies, however, demonstrated that sublimation due to snowdrift equals surface sublimation (King et al., 1996; Mann et al., 2000) or even exceeds surface sublimation at coastal and katabatic wind-controlled Antarctic sites (Bin- tanja, 2001a; Bintanja and Reijmer, 2001; Frezzotti et al., 2004). On a continental scale, estimates indicate a removal of Published by Copernicus Publications on behalf of the European Geosciences Union.
Transcript of Modelling snowdrift sublimation on an Antarctic ice shelf

The Cryosphere, 4, 179–190, 2010www.the-cryosphere.net/4/179/2010/doi:10.5194/tc-4-179-2010© Author(s) 2010. CC Attribution 3.0 License.
The Cryosphere
Modelling snowdrift sublimation on an Antarctic ice shelf
J. T. M. Lenaerts1, M. R. van den Broeke1, S. J. Dery2, G. Konig-Langlo3, J. Ettema1, and P. K. Munneke1
1Institute for Marine and Atmospheric research Utrecht, Utrecht University, Utrecht, The Netherlands2University of Northern British Columbia, Prince George, Canada3Alfred Wegener Institut fur Polar- und Meeresforschung, Bremerhaven, Germany
Received: 23 December 2009 – Published in The Cryosphere Discuss.: 9 February 2010Revised: 20 April 2010 – Accepted: 2 May 2010 – Published: 10 May 2010
Abstract. In this paper, we estimate the contribution ofsnowdrift sublimation (SUds) to the surface mass balanceat Neumayer, located on the Ekstrom ice shelf in EasternAntarctica. A single column version of the RACMO2-ANTmodel is used as a physical interpolation tool of high-qualityradiosonde and surface measurements for a 15-yr period(1993–2007), and combined with a routine to calculate snow-drift sublimation and horizontal snow transport. The site ischaracterised by a relatively mild, wet and windy climate,so snowdrift is a common phenomenon. The modelled tim-ing and frequency of snowdrift events compares well withobservations. This is further illustrated by an additional sim-ulation for Kohnen base, where the timing of snowdrift is re-alistic, although the modelled horizontal transport is overes-timated. Snowdrift sublimation is mainly dependent on windspeed, but also on relative humidity and temperature. Dur-ing high wind speeds, SUds saturates and cools the air, limit-ing its own strength. We estimate that SUds removes around16%±8% of the accumulated snow from the surface. Thetotal sublimation more than triples when snowdrift is con-sidered, although snowdrift sublimation limits sublimationat the surface. SUds shows a strong seasonal cycle, as well aslarge inter-annual variability. This variability can be relatedto the variability of the atmospheric conditions in the surfacelayer.
Correspondence to:J. T. M. Lenaerts([email protected])
1 Introduction
The surface mass balance (SMB), together with the flowof ice, determines the net mass change of the Antarctic icesheet and the corresponding sea-level change (Vaughan et al.,1999; Rignot et al., 2008). The specific SMB of a snow/icesurface (mm yr−1, Van de Berg et al., 2006) can be writtenas the annual sum of precipitation (P), sublimation at the sur-face (SU), runoff (RU) and erosion (∇·TRds) and sublimation(SUds) of drifting snow:
SMB =
∫year
(P− SU− RU − ∇ · TRds − SUds)dt (1)
Figure 1 shows that the modelled SMB varies strongly onthe Antarctic continent. The high inland plateau is dry (SMBbelow 70 mm yr−1), whereas in the coastal regions the SMBis much larger, especially in the Antarctic Peninsula (Turneret al., 2002).
A considerable effort has been made to determine theaccumulation (precipitation minus sublimation, P−SU) inAntarctica (e.g.,Giovinetto et al., 1992; Van de Berg et al.,2006). The contribution of SUds to the SMB, however, islargely unknown because direct measurements are unavail-able (Pomeroy and Essery, 1999). Although assumed im-portant on a local scale, earlier studies considered snowdriftsublimation to be a negligible term in the continent-wide sur-face mass budget (e.g.,Turner et al., 1999). Different mod-elling studies, however, demonstrated that sublimation dueto snowdrift equals surface sublimation (King et al., 1996;Mann et al., 2000) or even exceeds surface sublimation atcoastal and katabatic wind-controlled Antarctic sites (Bin-tanja, 2001a; Bintanja and Reijmer, 2001; Frezzotti et al.,2004). On a continental scale, estimates indicate a removal of
Published by Copernicus Publications on behalf of the European Geosciences Union.

180 J. T. M. Lenaerts et al.: Snowdrift sublimation on Antarctic ice shelf
Fig. 1. The SMB distribution (from RACMO2/ANT for the period1958–2002,Van de Berg et al., 2005) on the whole Antarctic conti-nent (left) and zoomed in on the region between 20◦ E and 20◦ W,as indicated with the circle in the left plot. Note the different scaleon both plots. The locations of Neumayer and Kohnen stations areindicated on the right plot. The distance between both stations isabout 550 km. The topography is shown in both plots by the dashedheight contours (500 m resolution).
10–50% of snowfall in the North American (seasonal) snow-covered regions (Pomeroy and Essery, 1999), 5% in Green-land (Box et al., 2006) and around 15–20% in Antarctica(Bintanja, 1998), although the latter may be overestimated.
The snowdrift layer can extend several hundreds of metresabove the surface (Budd, 1966) and affects vertical profiles ofwind, temperature and humidity in the atmospheric boundarylayer (Dery et al., 1998; Bintanja, 2000). Most regional cli-mate models lack horizontal and vertical resolution to fullycapture this process. This negatively affects the represen-tation of the SMB by these models.Schlosser(1999) con-cluded that the limited agreement between her atmosphericmodel and observations on the accumulation rates at Neu-mayer (Fig.1) could be related to the absence of representa-tion of the snowdrift physics in the model. Moreover, mostmodels neglect the negative feedback between SUds and thethermodynamic conditions of the atmosphere and the result-ing self-limiting behaviour of SUds (Bintanja, 2001b; Deryand Yau, 2002; Mann et al., 2000). This may result in a sig-nificant error in the SUds estimates (Dery et al., 1998). Thepurpose of this paper is to estimate as realistically as possi-ble the contribution of SUds to the SMB at Neumayer sta-tion, which is situated on the Ekstrom ice shelf in coastalEast Antarctica (Fig.1). Neumayer has a relatively mild andwindy climate with frequent snowfalls, and snowdrift is acommon occurrence at this location. Assuming runoff dueto melt and snowdrift erosion to be negligible, we can alsoprovide an estimate of precipitation at Neumayer.
We use the updated single column version (SCM) ofthe coupled land-atmosphere ECMWF model. To sim-ulate snowdrift sublimation at Neumayer, it contains thesame physical parameterizations as RACMO2/ANT, whichhas proven to realistically simulate Antarctic climate condi-tions (Van de Berg et al., 2005). The model is driven by
high-quality observations, ensuring that the interactions be-tween SUds and atmosphere and surface roughness are con-sidered. The seasonal as well as the inter-annual variabilityof SUds are discussed. Another simulation is performed fora station on the Antarctic plateau (Kohnen base, Fig.1) tohighlight the importance of the meteorological conditions onthe snowdrift sublimation process at these different locations.
2 Methods
2.1 Snowdrift model
In order to calculate the horizontal transport of snow (TRds)in models and from observations, several authors have devel-oped a simple relation between friction velocityu∗ and snow-drift flux, using a threshold wind speed for snowdrift (e.g.,Mann et al., 2000; Dery and Yau, 2002). Snowdrift sublima-tion, however, is usually not considered in atmospheric mod-els. The physics of this process is complex because of themany interactions and feedbacks: snowdrift exerts friction onthe flow and cools and moistens the surface layer, in turn lim-iting snowdrift and surface sublimation. Existing models thatinclude SUds are based on similar physical concepts (Xiaoet al., 2000). Due to the high vertical resolution and manysnow grain size classes (≥50) required to resolve the sizeparticle spectrum, these models are computationally very ex-pensive. Therefore,Dery and Yau(1999) developed a sim-plified bulk version of one of these models. In this routine, anew variable, the mixing ratio of blowing snowqb(kg kg−1)is introduced, which is related to the spectral number density.Moreover, a prognostic equation for blowing snow particlenumbers is defined in the model (Dery and Yau, 2001). Inaddition toqb, temperature and humidity are also calculatedprognostically on a vertical grid (24 levels), to ensure con-servation of heat and moisture in the snowdrift layer. Thecompeting processes of turbulent diffusion, settling and sub-limation influence the snowdrift variables, whereas only tur-bulent diffusion and sublimation affect the thermodynamicvariables. Based on the simulated profiles of snowdrift, themodel provides estimates of the column-integrated rates ofhorizontal snowdrift transport TRds (kg m−1 s−1) and subli-mation SUds (mm d−1 water equivalent or we). Although thebulk method is simplified compared to the spectral method,tests indicated that the bulk model matches very well with itsspectral variant, simulating similar thermodynamic tenden-cies and sublimation rates (Dery and Yau, 1999; Xiao et al.,2000). In the SCM, the bulk snowdrift model is driven bynear-surface temperature, relative humidity with respect toice (RHi), wind speed and surface pressure at each time step.
The snowdrift routine in the model is limited in the ver-tical dimension from 0.1 m to 100 m height. The snowdriftroutine is activated when the friction velocityu∗ exceedsa threshold valueu∗,t , here set to 0.3 m s−1, and if the tem-perature is below freezing.u∗,t depends on snow surface
The Cryosphere, 4, 179–190, 2010 www.the-cryosphere.net/4/179/2010/

J. T. M. Lenaerts et al.: Snowdrift sublimation on Antarctic ice shelf 181
characteristics. Snowdrift is suppressed when the surfacesnow is more consolidated. In this respect, the density ofsnow can be a suitable parameter to define the onset of snow-drift (Gallee et al., 2001). Moreover, snowdrift increases thefriction velocity, reducing near-surface wind speed (Bintanjaand Reijmer, 2001). Because we force the model with ob-served wind speed, this effect is implicitly considered in thisstudy. Moreover, fresh snow is accumulated frequently atNeumayer, implying that the consolidation of snow is lim-ited and the surface snow density is rather constant with time.We, therefore, keptu∗,t constant.
2.2 Atmospheric and snow model
For this study, the single column version of the updated cou-pled land-atmosphere ECMWF model (cycle C23YR;White,2001) is used and referred to as RACMO2/SCM. Physicalparameterizations are adapted to realistically simulate theAntarctic climate conditions, similar to the RACMO2/ANTmodel (Van de Berg et al., 2005). Moreover, the model hasbeen expanded with a snow model, calculating density, tem-perature and liquid water in the snow (Ettema et al., 2009).A single grid cell (“column”) is defined, in which only verti-cal exchange can occur between 60 vertical levels. Fourteenof these are situated in the lowest 2 km of the atmosphere, toobtain a realistic representation of the boundary layer. Thelowest model level is located around 7 m above the surface.A time step of 15 min is used, which is sufficient to resolvethe interactions between the surface conditions and SUds.
For the purpose of this study, it is vital that the modelrepresents the atmospheric conditions realistically, especiallynear the surface. Therefore, we created a continuous datasetof boundary conditions from available radiosondes and mastmeasurements of a period of 15 consecutive years (1993–2007). In essence, this means that the SCM is used as aphysical interpolator of the forcing data. These data are useddirectly by the SCM to calculate the prognostic variables ateach model time step.
At Neumayer, radiosondes are released every 24 h, some-times every 12 h. The vertical distance between two adjacentmeasurement points varies between 25 to 100 m throughoutthe profile, with a median value of around 40 m in the lowertroposphere. Measured variables are temperature, relativehumidity (converted to dew-point temperature), wind speedand direction and pressure. Relative humidity is measuredwith respect to water, which we have converted to relativehumidity with respect to ice (RHi) according toHyland andWexler (1984) and rescaled using a technique described byAnderson(1994). We linearly interpolated the radiosondedata to a regular time grid of 12 h, which is used to forcethe SCM. Next, linear interpolation is also used to convertthe observations to model levels. Because of occasional er-roneous and incomplete radiosonde data near the surface, wereplaced the near-surface radiosonde data by mast measure-ments of 2 m temperature, 2 m RHi and 10 m wind speed.
Table 1. Overview of geographical and land surface parameters atNeumayer in RACMO2/SCM.
Parameter Value Unit
Altitude 42 m a.s.l.Latitude 70.65 ◦ SLongitude 8.25 ◦ WAlbedo 0.85 –Roughness length 0.00025 mSurface snow density 400 kg m−3
Initial snow temperature 268.15 K
This implies that the lowest two model levels (around 7 and18 m) partly obtain values which are linearly interpolated be-tween the mast measurement and the first atmospheric mea-surement of the radiosonde (±40 m). Wind speed at the low-est level is equal to the 10 m wind times 0.76, so that theresulting annual mean 10 m wind speed in the model equalsthe mean observed 10 m wind speed. As a final step, the RHi
values are converted to specific humidity. This is done in thefinal stage, because the calculation of snowdrift sublimationis directly dependent on the RH input; interpolating specificinstead of relative humidity would decrease the accuracy ofthe RH input values.
Apart from the vertical profiles, land surface parametersare adapted in order to simulate surface characteristics atNeumayer (Table1). The albedo is assumed to be con-stant in time (0.85) to ensure a realistic shortwave energybalance. The roughness length for momentum is set to0.25 mm (typical for ice shelf surfaces during strong snow-drift, seeKonig, 1985), while the roughness length for heatis calculated using the scalar roughness length formulationgiven byAndreas(1987). Including a dependency of rough-ness length to friction velocity (followingBintanja and Rei-jmer, 2001) did not significantly change the results. Fora 1-year simulation (1997) the averagez0 value increasedfrom 0.25 mm to 0.34 mm and the snowdrift sublimation de-creased by 2 mm, which is only 1.5% of the original value.Surface pressure is available from mast measurements.
The measurement site (Kohnen, 75◦ S–0◦ W) is located onthe Antarctic Plateau at a height of 2893 m above sea level(Fig. 1). The location is characterised by low temperaturesand little precipitation. For Kohnen, the data is collected inan identical manner and the above adaptations of the land-surface parameters are used.
2.3 Implementation
In practice, snow particles suspended in the flow will ex-hibit mass loss due to sublimation, thereby adding moistureto and extracting heat from the surrounding air. The snow-drift routine is implemented in the turbulent diffusion schemeof RACMO2/SCM (Fig.2), which solves the energy balance
www.the-cryosphere.net/4/179/2010/ The Cryosphere, 4, 179–190, 2010
182 J. T. M. Lenaerts et al.: Snowdrift sublimation on Antarctic ice shelf
(b)!
(a)!
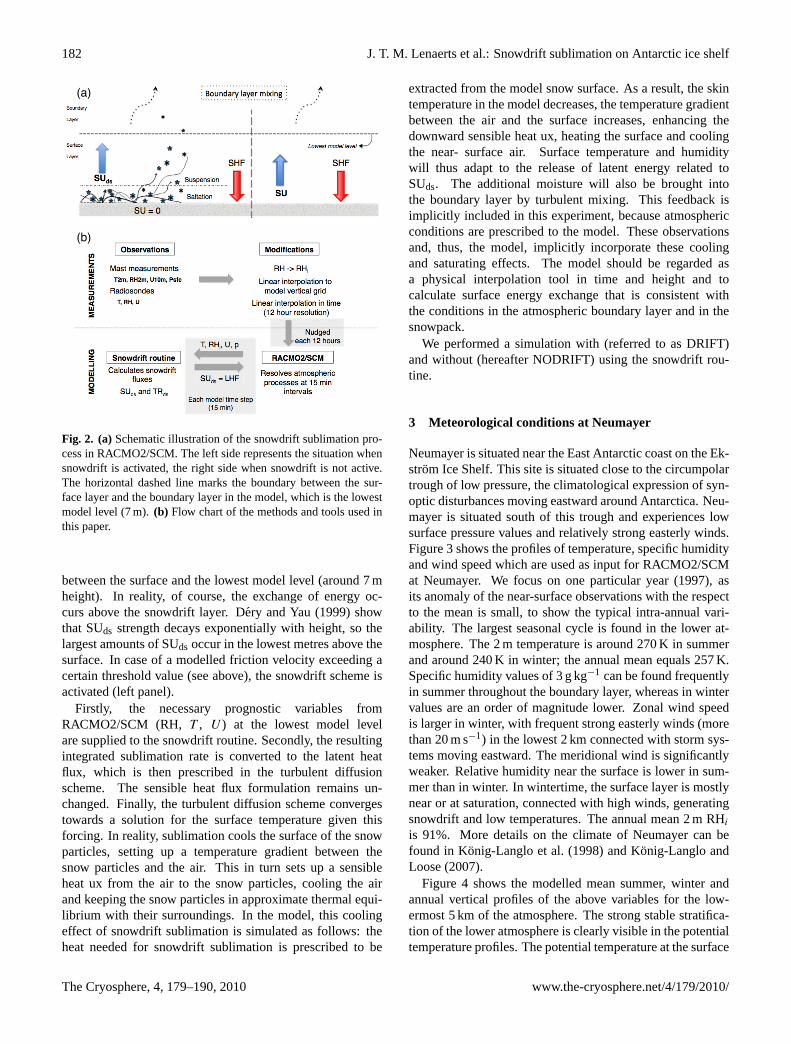
Fig. 2. (a)Schematic illustration of the snowdrift sublimation pro-cess in RACMO2/SCM. The left side represents the situation whensnowdrift is activated, the right side when snowdrift is not active.The horizontal dashed line marks the boundary between the sur-face layer and the boundary layer in the model, which is the lowestmodel level (7 m).(b) Flow chart of the methods and tools used inthis paper.
between the surface and the lowest model level (around 7 mheight). In reality, of course, the exchange of energy oc-curs above the snowdrift layer.Dery and Yau(1999) showthat SUds strength decays exponentially with height, so thelargest amounts of SUds occur in the lowest metres above thesurface. In case of a modelled friction velocity exceeding acertain threshold value (see above), the snowdrift scheme isactivated (left panel).
Firstly, the necessary prognostic variables fromRACMO2/SCM (RH, T , U ) at the lowest model levelare supplied to the snowdrift routine. Secondly, the resultingintegrated sublimation rate is converted to the latent heatflux, which is then prescribed in the turbulent diffusionscheme. The sensible heat flux formulation remains un-changed. Finally, the turbulent diffusion scheme convergestowards a solution for the surface temperature given thisforcing. In reality, sublimation cools the surface of the snowparticles, setting up a temperature gradient between thesnow particles and the air. This in turn sets up a sensibleheat ux from the air to the snow particles, cooling the airand keeping the snow particles in approximate thermal equi-librium with their surroundings. In the model, this coolingeffect of snowdrift sublimation is simulated as follows: theheat needed for snowdrift sublimation is prescribed to be
extracted from the model snow surface. As a result, the skintemperature in the model decreases, the temperature gradientbetween the air and the surface increases, enhancing thedownward sensible heat ux, heating the surface and coolingthe near- surface air. Surface temperature and humiditywill thus adapt to the release of latent energy related toSUds. The additional moisture will also be brought intothe boundary layer by turbulent mixing. This feedback isimplicitly included in this experiment, because atmosphericconditions are prescribed to the model. These observationsand, thus, the model, implicitly incorporate these coolingand saturating effects. The model should be regarded asa physical interpolation tool in time and height and tocalculate surface energy exchange that is consistent withthe conditions in the atmospheric boundary layer and in thesnowpack.
We performed a simulation with (referred to as DRIFT)and without (hereafter NODRIFT) using the snowdrift rou-tine.
3 Meteorological conditions at Neumayer
Neumayer is situated near the East Antarctic coast on the Ek-strom Ice Shelf. This site is situated close to the circumpolartrough of low pressure, the climatological expression of syn-optic disturbances moving eastward around Antarctica. Neu-mayer is situated south of this trough and experiences lowsurface pressure values and relatively strong easterly winds.Figure3 shows the profiles of temperature, specific humidityand wind speed which are used as input for RACMO2/SCMat Neumayer. We focus on one particular year (1997), asits anomaly of the near-surface observations with the respectto the mean is small, to show the typical intra-annual vari-ability. The largest seasonal cycle is found in the lower at-mosphere. The 2 m temperature is around 270 K in summerand around 240 K in winter; the annual mean equals 257 K.Specific humidity values of 3 g kg−1 can be found frequentlyin summer throughout the boundary layer, whereas in wintervalues are an order of magnitude lower. Zonal wind speedis larger in winter, with frequent strong easterly winds (morethan 20 m s−1) in the lowest 2 km connected with storm sys-tems moving eastward. The meridional wind is significantlyweaker. Relative humidity near the surface is lower in sum-mer than in winter. In wintertime, the surface layer is mostlynear or at saturation, connected with high winds, generatingsnowdrift and low temperatures. The annual mean 2 m RHi
is 91%. More details on the climate of Neumayer can befound in Konig-Langlo et al.(1998) andKonig-Langlo andLoose(2007).
Figure 4 shows the modelled mean summer, winter andannual vertical profiles of the above variables for the low-ermost 5 km of the atmosphere. The strong stable stratifica-tion of the lower atmosphere is clearly visible in the potentialtemperature profiles. The potential temperature at the surface
The Cryosphere, 4, 179–190, 2010 www.the-cryosphere.net/4/179/2010/

J. T. M. Lenaerts et al.: Snowdrift sublimation on Antarctic ice shelf 183
Fig. 3. Time-height sections of temperature (T ), specific humidity (q) and wind speed components (U andV ) from available radiosondedata and mast measurements at Neumayer, year 1997. The height coordinates are shown according to the vertical resolution in the model,i.e. higher resolution towards the surface. The lowest plot shows the time evolution of RHi at the lowest model level (7 m) and the frictionvelocityu∗, together withu∗,t (horizontal line).
is about 6 K lower than at 200 m height, while RHi is about20% higher. Zonal flow dominates; the meridional flow isrestricted to the lower atmosphere and is strongly reducednear the surface due to friction. This plot also confirms thatwinter wind speeds are significantly larger than in summer,especially the zonal component, by about 2 m s−1. The windspeed maximum inU is caused by thermal wind effects, forc-ing near-surface easterlies to change in upper-atmospherewesterlies. Neumayer is situated in a region with strong hor-izontal meridional temperature gradients, which explains thestrong east-to-west turning of the zonal flow (Van den Broekeet al., 2002b, 2003).
Figure5 gives the seasonal cycle of the modelled mean en-ergy balance components using observations, without snow-drift allowed (Van den Broeke et al., 2010). The annualmean net shortwave energy flux is positive (19 W m−2),whereas the longwave energy balance is strongly negative(−30 W m−2). The sum of the radiative fluxes is clearly neg-ative in winter, due to the absence of incoming solar radiationand only positive from November to January. The shortageof solar energy is compensated by a positive sensible heatflux in winter (13 W m−2 annual mean). The latent heat fluxis slightly positive in winter and negative in summer dueto sublimation. The annual mean LHF is−2 W m−2. Theground heat flux is small and positive in winter and negative
in summer. Melt occurs only in December and January andis small compared to the other surface fluxes.
4 Snowdrift climate
4.1 Effects of interpolation
Snowdrift sublimation is greatly influenced by the near-surface atmospheric conditions (Dery and Yau, 2002). Themodel is forced by observations every 12 h. To examine theeffects of temporal and spatial interpolation on the condi-tions near the surface, key modelled and observed variablesare shown in Fig.6, again for the year 1997. The interpo-lated near-surface temperature, wind and relative humiditymatch well with hourly observations. The input at the low-est levels comes from hourly mast measurements, and thesurface energy balance is calculated in the model, which en-sures that the daily cycle is well represented. Small scat-ter is seen in temperature (R2=0.94) but is somewhat largerin wind (R2=0.87) and relative humidity (R2=0.88). Modelwind and RH depart from observations in some cases, be-cause observed rapid fluctuations within 12 h are not cap-tured by the model. In general, however, model wind speedcompares very well with observations and the model simu-lates a similar timing and frequency of the snowdrift events
www.the-cryosphere.net/4/179/2010/ The Cryosphere, 4, 179–190, 2010

184 J. T. M. Lenaerts et al.: Snowdrift sublimation on Antarctic ice shelf
Fig. 4. Average vertical profiles in the lower atmosphere of po-tential temperature (θ ), specific (q) and relative humidity (RH) andwind speed components (U andV ) of summer (January–March andOctober–December), winter (April–October) and year 1997, simu-lated by RACMO2/SCM.
(Fig. 7b). Snowdrift occurs around 40% of the time in themodel, which is a slight overestimation compared to the 3-hobservations (33%). These snowdrift observations are “syn-ops”, i.e. measurements performed at Neumayer accordingto WMO standards (Konig-Langlo and Loose, 2007).
Despite the good agreement between interpolated modelvalues and observations, it is important to check whether theoutliers in wind and relative humidity would greatly affectthe simulated SUds. To examine this, we forced a simple pa-rameterization for SUds, derived byDery and Yau(2001),with hourly observations and with hourly model variables(Fig. 7a). This parameterization is defined as an empiricallyderived function of near-surface temperature, RHi and windspeed (Dery and Yau, 2001). The agreement is good, yield-ing a cumulative amount of around 90 mm in the year 1997(Fig. 7a). This confirms that the effect of the spatial and tem-poral interpolation is small. Note that this simple parameter-ization overestimates SUds by around 25% compared to thebulk snowdrift model used in this study.
The surface energy balance is altered by snowdrift subli-mation, because latent heat is extracted from the air in thesurface layer (Fig.7b). During events of snowdrift, the mag-nitude of the latent heat flux becomes as large as 90 W m−2,while surface sublimation ceases. When snowdrift occurs(see markers), the latent heat release due to snowdrift subli-mation (green line) is mostly larger than the latent heat lossconnected to surface sublimation (red line). This suggeststhat SUds takes over the surface sublimation during highwind speeds. This latent heat release cools the surface. In
Fig. 5. Monthly mean energy balance components and their inter-annual variability (1993–2007) from the surface energy balancemodel, driven by observation, which is described byVan denBroeke et al.(2006). The error bars indicate two standard devia-tions from the mean. Shown are the balance of shortwave and long-wave fluxes (Rnet), latent heat flux (LHF), sensible heat flux (SHF),ground heat flux (G) and melt (M).
order to maintain the energy balance at the surface, the sen-sible heat flux increases during snowdrift events (Fig.7c).
4.2 Horizontal snowdrift transport
Apart from SUds, snowdrift also constitutes the horizontaltransport of drifting snow, which leads to local movement ofsnow from wind-exposed locations towards sheltered regions(Fig. 7d). Transport divergence represents a net mass lossat the surface (∇· TRds). It may be highly significant at thelocal scale, but its contribution to the regional SMB has beenassumed to be two or three orders of magnitude smaller thanSUds (Dery and Yau, 2002).
For the purpose of additional validation of the model,modelled horizontal snow transport fluxes were comparedwith observations from particle impact sensors (Van denBroeke et al., 2002a) during the ENABLE campaign in Jan-uary and February 2002 at Kohnen base (Van As et al., 2006).The observed 10 m wind speed reached 16 m s−1 around12 January before decreasing rapidly towards values between3 and 12 m s−1 between 13 and 20 January. After this period,winds did not exceed 8 m s−1. The average 2 m temperatureduring the campaign was 244.7 K and the average 10 m windspeed 5.3 m s−1. During the measurement campaign, threesnowdrift events were observed (Fig.8). The first, strongestevent yielded a horizontal transport flux of 0.07 kg m−1 s−1.The model overestimates the horizontal flux by a factor oftwo to three, but agrees on the timing of the event. The
The Cryosphere, 4, 179–190, 2010 www.the-cryosphere.net/4/179/2010/

J. T. M. Lenaerts et al.: Snowdrift sublimation on Antarctic ice shelf 185
Fig. 6. Time evolution (above) and scatter plots (below) of 12-h interpolated model results vs. hourly observations of near-surface temperature(left), wind (middle) and relative humidity (right) for the year 1997 at Neumayer. Green lines represent the model results and black lines areobservations. The 7 m RH is shown because it serves as direct input for the snowdrift routine.
Fig. 7. Time evolution of(A): cumulative SUds derived by the simple parameterization (see text), modelled surface fluxes –(B): latent heatflux; (C): sensible heat flux, both in W m−2– and snowdrift variables – (B): timing of the snowdrift events in the observations (black) andmodel (green) and(D): TRds. In panel (B) and (C), the green line represents the DRIFT simulation and the red line shows the NODRIFTsimulation.
second (DOY 16) and third (DOY 20) events are not detectedby the model, but their intensity is observed to be very small.This overestimation of TRds was also seen inXiao et al.(2000), where PIEKTUK-D calculated higher transport ratescompared to other models in idealized experiments.Yangand Yau(2008) compared modelled and measured particlespectra at Byrd station, and showed that the overall patternof the distribution is well represented, but that there are dis-crepancies between model and measurements. Another pos-sible reason for the overestimated transport is the assump-tion of a logarithmic vertical profile of wind speed, whichcould result in too high modelled transport rates in very sta-ble near-surface conditions. The modelled amount of net SUand SUds is negligible during this event, because the relativehumidity was 100% (Fig.8).
At Neumayer, horizontal transport can reach1.6 kg m−1 s−1 during strong snowdrift events (Fig.7d),which is 10 times larger than the modelled transport fluxat the ENABLE site. Stronger winds, higher temperaturesand more frequent snowfall cause SUds to be much moresignificant in coastal Antarctica compared to the inlandplateau. Although strong wind events do occur on theplateau (Van As et al., 2007), they are less severe and lessfrequent than the ones near the coast (Turner et al., 2009).
4.3 Seasonal cycle
Figure 9 presents the mean (1993–2007) seasonal cycleand its inter-annual variability, based on monthly means ofSUds, TRds, snowdrift frequency and of 2 m temperature,
www.the-cryosphere.net/4/179/2010/ The Cryosphere, 4, 179–190, 2010

186 J. T. M. Lenaerts et al.: Snowdrift sublimation on Antarctic ice shelf
Fig. 8. Time evolution of the snow drift fluxes at Kohnen during thefirst part of the EPICA-ENABLE campaign, from 9 January until29 January 2002. The upper panel shows TRds, the panel belowgives cumulative SUds, together with surface sublimation (SU). Thegreen line in the upper panel gives the observed mass fluxes, the redline shows the model results. After this period no snowdrift eventswere observed or modelled.
10 m wind and 7 m relative humidity. SUds varies stronglythroughout the year. Minimum values of 0.1 to 0.15 mm d−1
occur in January and December. Strongest SUds occurs be-tween March and November, with daily amounts of 0.2 to0.25 mm. Inter-annual variability is larger in winter than in
Fig. 9. 15-yr (1993–2007) monthly means (dots) and variability (thedoubled standard deviation on the error bars) of SUds (A), TRds (C),snowdrift frequency(E) and the 10 m wind speed(B), 7 m relativehumidity (D) and 2 m temperature(F).
summer. SUds variations can be correlated with variations inthe other near-surface variables. Wind speed is characterisedby a strong seasonal cycle. Monthly mean 10 m wind speedvaries between 7 m s−1 in January and more than 11 m s−1 inAugust. The correlation between the seasonal (R2=0.88) aswell as the inter-annual variability (R2=0.72) of wind speedand SUds is strong. However, a part of the variability is notexplained by wind speed. For example, the amount of SUds islarger in autumn (April and May) and in spring (November)than in winter (July and August), although the wind speed isclearly higher in winter. The explanation is that the relativehumidity near the surface also shows a significant seasonalvariability, with values ranging from 87% in summer to 96%in winter. This reduces the capacity of the air to take upmoisture and consequently weakens SUds in winter. So windspeed, relative humidity and temperature all play an impor-tant role in determining SUds. The horizontal transport ismostly related to wind speed variability (R2=0.99).
4.4 Inter-annual variability
Figure10 shows the annual means of the key variables forthe 10 yr simulation (1993–2007) for Neumayer. Due to thehigh mean wind speed, snowdrift is a frequent phenomenonat Neumayer. The frequency of snowdrift varies between33% (2004) and 49% (1995) and is proportionally related(R2=0.92) to the annual mean 10 m wind speed.
The Cryosphere, 4, 179–190, 2010 www.the-cryosphere.net/4/179/2010/

J. T. M. Lenaerts et al.: Snowdrift sublimation on Antarctic ice shelf 187
Fig. 10. Annual means (1993–2007) of 2 m temperature(A), 7 m relative humidity(B), 10 m wind speed(C), snowdrift horizontal trans-port (E) and snowdrift frequency(F), combined with the cumulative amounts of snowdrift sublimation(D) and surface sublimation in thecase without snowdrift(G) and with snowdrift(H), respectively. All variables are shown relative to their 10 yr mean value.
The mean annual amount of snowdrift sublimation is80 mm. The annual cumulative amount of SUds varies be-tween 50 mm (1998) and 127 mm (1995) and has a standarddeviation of 24 mm. Due to the strong nonlinear nature of thesnowdrift phenomenon, there is no significant correlation be-tween annual mean values of cumulative SUds and 2 m tem-perature, 10 m wind speed or 7 m RHi .
Sublimation at the surface (SU) is reduced significantlywhen SUds is strong due to the moistening of the surfacelayer (Mann et al., 2000). To analyze the feedback betweenSU and SUds, we compare the model simulations with andwithout snowdrift physics implemented. In the NODRIFTsimulation, the cumulative net surface sublimation, definedas the sum of deposition and sublimation, varies between7 mm (2002) and 56 mm (2007). The 15-yr annual meansurface sublimation equals 28 mm. In the model simula-tion including snowdrift net SU decreases to 14 mm whichmeans a reduction of 50% compared to the NODRIFT sim-ulation. In the DRIFT simulation, surface sublimation onlyoccurs during 7% of the time, whereas when no snowdrift isallowed, it occurs around 50% of the time.
Annual snow accumulation amounts to 425 mm in Neu-mayer (Schlosser and van Lipzig, 2002), which suggests thatSUds removes on average 16% of the precipitated snow atthe surface, which is very significant. Total sublimation morethan triples (94 versus 28 mm yr−1) compared to the situationwithout snowdrift. Melt is a minor contribution to the SMBat Neumayer, because temperatures rarely reach the meltingpoint. Snowdrift erosion is assumed to be small (Dery and
Yau, 2002). Therefore, we can estimate the annual precipita-tion amount at Neumayer by adding the total sublimation tothe mean accumulation provided bySchlosser and van Lipzig(2002). The 15-year mean precipitation amount is then esti-mated to be 519 mm yr−1.
4.5 Self-limiting behaviour
SUds cools and moistens the near-surface air. When the airapproaches saturation during winter due to high sublimationrates and low temperatures, the snowdrift sublimation pro-cess ceases. As demonstrated byDery et al.(1998), neglect-ing this feedback could result in a substantial overestimationof SUds, especially during high wind speeds. In this study,the interactions are incorporated implicitly in our model, aswe use near-surface observations to force the model. To in-vestigate this further, Fig.11 shows a strong snowdrift eventat the end of February 1997, whenu∗,t is exceeded andSUds starts during DOY 55. Wind speed increases graduallyto 20 m s−1, yielding a maximum latent heat release due tosnowdrift sublimation of around 70 W m−2 on DOY 56. But,due to SUds, relative humidity also increases during DOY 55,reaching 97% on DOY 56. The high RHi reduces the addi-tional SUds during DOY 57 and 58, although the wind speedremains large enough for snowdrift. At the same time, theskin temperature decreases due to SUds, increasing the sen-sible heat flux. This example illustrates that the feedback be-tween the thermodynamic conditions near the surface and thesnowdrift sublimation process is well captured by the model.
www.the-cryosphere.net/4/179/2010/ The Cryosphere, 4, 179–190, 2010

188 J. T. M. Lenaerts et al.: Snowdrift sublimation on Antarctic ice shelf
Fig. 11.Time evolution of 10 m wind speed, 7 m relative humidity, skin temperature, latent heat flux, sensible heat flux and TRds as modelledby RACMO2-SCM, of DOY 54–59 in the year 1997 (23–28 February). The green lines represent the simulation with snowdrift, the red lineis the NODRIFT simulation.
4.6 Sensitivity to measurement errors
The uncertainty in the measurements of the near-surface vari-ables results in uncertainties in the modelled snowdrift sub-limation amounts. To estimate these uncertainties, we haveintroduced systematic errors in these variables. Results fromthese experiments are given in Table2. SUds is mainly sen-sitive to errors in relative humidity and temperature. Thesevariables change the specific humidity content of the snow-drift layer, which is used for the calculation of SUds. Theseresults also indicate that the magnitude of change in SUds isdifferent for a positive or negative error, which illustrates thenonlinear behaviour of this process. Errors inu∗,t and windspeed yield still a significant, but smaller, effect on SUds.
5 Conclusions
The snowdrift sublimation process depends on near-surfacewind speed, temperature and relative humidity. In Antarc-tica, the latter is generally lower at higher temperatures.SUds shows a clear annual cycle, and is stronger in winterthan in summer, which is mainly related to the annual cyclein wind speed.
In this study, we estimated that snowdrift sublimation re-moves around 16%±8% of the precipitated snow at the sur-face at Neumayer, which is equivalent to around 80 mm yr−1.This means that SUds cannot be neglected in the SMB ofAntarctica, especially in locations with a relatively windy,wet and mild climate. The interannual variability is signif-icant, but the annual cumulative SUds cannot be related toannual mean climate variables, due to the nonlinear nature ofthe snowdrift process. Direct observations of SUds are notavailable, because no reliable method to measure snowdriftsublimation exist to date. In view of the demonstrated sen-sitivity of the results to near-surface data, future field cam-paigns should greatly improve snowdrift sublimation esti-mates. Additionally, direct validation data are needed, suchas impact particle and sublimation sensors as well as opti-cal particle counters to improve model estimates of snow-drift transport and sublimation. For additional evaluation,
Table 2. Sensitivity of annual accumulated SUds(% change com-pared to default value) to systematic changes of different sur-face variables. These adaptations are applied to 1 yr of simula-tion (1997). The original SUds amount in 1997 is 70 mm.
Parameter Average Change Impact on SUds
RHi 91% +5% −49%−5% +63%
T 257.7 K +0.3 K +50%−0.3 K −34%
u∗,t 0.3 m s−1 +0.05 m s−1 +25%−0.05 m s−1
−21%U 9.6 m s−1 +0.5 m s−1 +10%
−0.5 m s−1−9%
we compared observed and modelled horizontal transportfluxes at Kohnen on the Antarctic Plateau. Modelled fluxesare smaller than the observed fluxes, but the timing is good,which gives some confidence in a realistic representation ofthe snowdrift variables by the model.
The technique presented in this paper is not only appli-cable to regions where radiosonde measurements are avail-able: the input for the snowdrift routine can also come froma 3-D meteorological model or reanalysis data, although thiswill introduce an additional uncertainty and does not allowfeedbacks into the model. In the future, high-resolution 3-D modelling of the surface mass balance of the Antarcticice sheet including snowdrift will lead to more detailed in-formation about the spatial variation of SUds in Antarctica.Direct feedback between snowdrift sublimation and the at-mosphere will be considered. Further work will also includea dynamic surface snow density evolution to explicitly cal-culate the feedback between snowdrift and the surface snowstructure. However, this will only be useful when more de-tailed observations of surface snow density andu∗,t becomeavailable. Based on the results presented here, we expect thatsnowdrift sublimation is a significant component of the SMBin the coastal regions of the Antarctic ice sheet.
The Cryosphere, 4, 179–190, 2010 www.the-cryosphere.net/4/179/2010/

J. T. M. Lenaerts et al.: Snowdrift sublimation on Antarctic ice shelf 189
Acknowledgements.Stephen J. Dery acknowledges support fromthe Natural Sciences and Engineering Research Council and theResearch Chair Program of Canada. We thank Andy Clifton,Richard Essery and an anonymous reviewer for their constructivecomments.
Edited by: E. Hanna
References
Anderson, P.: A Method for Rescaling Humidity Sensors at Tem-peratures Well Below Freezing, J. Atmos. Ocean. Tech., 11,1388–1391, 1994.
Andreas, E.: A theory for the scalar roughness and the scalar trans-fer coefficients over snow and sea ice, Bound.-Lay. Meteorol.,38, 159–184, 1987.
Bintanja, R.: The contribution of snowdrift sublimation to the sur-face mass balance of Antarctica, Ann. Glaciol., 27, 251–259,1998.
Bintanja, R.: Snowdrift suspension and atmospheric turbulence,Part 2: Results of model simulations, Bound.-Lay. Meteorol., 95,369–395, 2000.
Bintanja, R.: Snowdrift sublimation in a katabatic wind regionof the Antarctic ice sheet, J. Appl. Meteorol., 40, 1952–1966,2001a.
Bintanja, R.: Modelling snowdrift sublimation and its effect on themoisture budget of the atmospheric boundary layer, Tellus A, 53,215–232, 2001b.
Bintanja, R. and Reijmer, C.: A simple parameterization for snow-drift sublimation over Antarctic snow surfaces, J. Geophys. Res.,106, 31739–31748, 2001.
Box, J., Bromwich, D., Veenhuis, B., Bai, L.-S., Stroeve, J., Rogers,J., Steffen, K., Haran, T., and Wang, S.-H.: Greenland Ice SheetSurface Mass Balance Variability (1988–2004) from CalibratedPolar MM5 Output, J. Climate, 19, 2783–2800, 2006.
Budd, W.: The drifting of non-uniform snow particles, Studies inAntarctic Meteorology, 1966.
Dery, S. J. and Yau, M. K.: A bulk blowing snow model, Bound.-Lay. Meteorol., 93, 237–251, 1999.
Dery, S. J. and Yau, M. K.: Simulation of blowing snow in the Cana-dian Arctic using a double-moment model, Bound.-Lay. Meteo-rol., 99, 297–316, 2001.
Dery, S. J. and Yau, M. K.: Large-scale mass balance effects ofblowing snow and surface sublimation, J. Geophys. Res., 107,4679, doi:10.1029/2001JD001251, 2002.
Dery, S. J., Taylor, P. A., and Xiao, J. B.: The thermodynamic ef-fects of sublimating, blowing snow in the atmospheric boundarylayer, Bound.-Lay. Meteorol., 89, 251–283, 1998.
Ettema, J., Van den Broeke, M., Van Meijgaard, E., Van de Berg,W., Bamber, J., Box, J., and Bales, R.: Higher surface mass bal-ance of the Greenland ice sheet revealed by high-resolution cli-mate modeling, Geophys. Res. Lett., 36, L12501,, doi:10.1029/2009GL038110, 2009.
Frezzotti, M., Pourchet, M., Flora, O., Gandolfi, S., Gay, M.,Urbini, S., Vincent, C., Becagli, S., Gragnani, R., Proposito, M.,Severi, M., Traversi, R., Udisti, R., and Fily, M.: New Estima-tions of Precipitation and Surface Sublimation in East Antarc-tica from Snow Accumulation Measurements, Clim. Dynam., 23,803–813, 2004.
Gallee, H., Guyomarch, G., and Brun, E.: Impact of Snow Drifton the Antarctic Ice Sheet Surface Mass Balance: Possible Sen-sitivity to Snow-Surface Properties, Bound.-Lay. Meteorol., 99,1–19, 2001.
Giovinetto, M. B., Bromwich, D. H., and Wendler, G.: Atmosphericnet transport of water vapor and latent heat across 70 degrees S,J. Geophys. Res., 97, 917–930, 1992.
Hyland, R. W. and Wexler, A.: Formulations for the Thermody-namic Properties of the saturated Phases of H2O from 173.15 Kto 473.15 K, American Society of Heating, Refrigerating, andAir-Conditioning Engineers Trans, 89, 500–519, 1984.
King, J., Anderson, P., Smith, M., and Mobbs, S.: The SurfaceEnergy and Mass Balance at Halley, Antarctica during winter, J.Geophys. Res., 101, 19119–19128, 1996.
Konig, G.: Roughness length of an Antarctic ice shelf, Polar-forschung, 55, 27–32, 1985.
Konig-Langlo, G., King, J., and Pettre, P.: Climatology of theThree Coastal Antarctic Stations Dumont d’Urville, Neumayer,and Halley, J. Geophys. Res., 103, 10935–10946, 1998.
Konig-Langlo, G. C. and Loose, B.: The meteorological observa-tory at Neumayer stations (GvN and NM-II), Antarctica, Polar-forschung, 76, 25–38, 2007.
Mann, G., Anderson, P., and Mobbs, S.: Profile measurementsof blowing snow at Halley, Antarctica, J. Geophys. Res., 105,24491–24508, 2000.
Pomeroy, J. and Essery, R.: Turbulent fluxes during blowing snow:field tests of model sublimation predictions, Hydrol. Process., 13,2963–2975, 1999.
Rignot, E., Bamber, J. L., van den Broeke, M. R., Davis, C., Li,Y., van de Berg, W. J., and van Meijgaard, E.: Recent Antarc-tic ice mass loss from radar interferometry and regional climatemodelling, Nat. Geosci., 1, 106–110, 2008.
Schlosser, E.: Effects of Seasonal Variability of Accumulation onYearly Meanδ18O Values in Antarctic Snow, J. Glaciol., 45,463–468, 1999.
Schlosser, E. and van Lipzig, N.: Temporal Variability of Accumu-lation at Neumayer Station, Antarctica, from Stake Array Mea-surements and a Regional Atmospheric Model, J. Glaciol., 48,87–94, 2002.
Turner, J., Connelley, W. M., Leonard, S., Marshall, G. J., andVaughan, D. G.: Spatial and Temporal Variability of Net SnowAccumulation over the Antarctic from ECMWF Re-AnalysisProject Data, Int. J. Climatol., 19, 697–724, 1999.
Turner, J., Lachlan-Cope, T., Marshall, G., Morris, E., Mulvaney,R., and Winter, W.: Spatial variability of Antarctic Peninsula netsurface mass balance, J. Geophys. Res., 107, 4173, doi:10.1029/2001JD000755, 2002.
Turner, J., Chenoli, S. N., Abu Samah, A., Marshall, G., Phillips,T., and Orr, A.: Strong wind events in the Antarctic, J. Geophys.Res., 114, D18103, doi:10.1029/2008JD011642, 2009.
Van As, D., van den Broeke, M., and Helsen, M.: Structure anddynamics of the summertime atmospheric boundary layer overthe Antarctic Plateau: 1. Measurements and model validation, J.Geophys. Res., 111, D07102, doi:10.1029/2005JD005948, 2006.
Van As, D., Van den Broeke, M., and Helsen, M. M.: Strong-windevents and their impact on the near-surface climate at KohnenStation on the Antarctic Plateau, Antarct. Sci., 19, 507–519,2007.
www.the-cryosphere.net/4/179/2010/ The Cryosphere, 4, 179–190, 2010
190 J. T. M. Lenaerts et al.: Snowdrift sublimation on Antarctic ice shelf
Van de Berg, W., van den Broeke, M., Reijmer, C., and van Meij-gaard, E.: Characteristics of the Antarctic surface mass balance(1958–2002) using a regional atmospheric climate model, Ann.Glaciol., 41, 97–104, 2005.
Van de Berg, W., van den Broeke, M., Reijmer, C., and van Mei-jgaard, E.: Reassessment of the Antarctic surface mass balanceusing calibrated output of a regional atmospheric climate model,J. Geophys. Res., 111, D11104, doi:10.1029/2005JD006495,2006.
Van den Broeke, M., Van As, D., Boot, W., and Snellen, H.:EPICA-Netherlands Atmospheric Boundary Layer Experiment(ENABLE), Tech. rep., IMAU, 2002a.
Van den Broeke, M., van Lipzig, N., and van Meijgaard, E.:Momentum budget of the East-Antarctic atmospheric boundarylayer: results of a regional climate model, J. Atmos. Sci., 59,3117–3129, 2002b.
Van den Broeke, M., van Lipzig, N., and van Meijgaard, E.: Fac-tors controlling the near-surface wind field in Antarctica, Mon.Weather Rev., 131, 733–743, 2003.
Van den Broeke, M., Reijmer, C., van As, D., and Boot, W.: Dailycycle of the surface energy balance in Antarctica and the influ-ence of clouds, Int. J. Climatol., 26, 1587–1605, 2006.
Van den Broeke, M., Konig-Langlo, G., Picard, G.,Kuipers Munneke, P., and Lenaerts, J.: Surface energy balance,melt and sublimation at Neumayer Station, East Antarctica,Antarct. Sci., 22, 87–96, 2010.
Vaughan, D., Bamber, J., Giovinetto, M., Russel, J., and Cooper,A.: Reassessment of net surface mass balance in Antarctica, J.Climate, 12, 933–946, 1999.
White, P.: Physical processes (CY23R4), Tech. rep., European Cen-tre for Medium-Range Weather Forecasts (ECMWF), 2001.
Xiao, J. B., Bintanja, R., Dery, S. J., Mann, G. W., and Taylor,P. A.: An intercomparison among four models of blowing snow,Bound.-Lay. Meteorol., 97, 109–135, 2000.
Yang, J. and Yau, M.: A new triple-moment blowing snow model,Bound.-Lay. Meteorol., 126, 137–155, doi:10.1007/s10546-007-9215-4, 2008.
The Cryosphere, 4, 179–190, 2010 www.the-cryosphere.net/4/179/2010/