Southern hemisphere atmospheric circulation: impacts on Antarctic climate and reconstructions from...
47
Climatic Change manuscript No. (will be inserted by the editor) Southern Hemisphere atmospheric circulation: impacts on Antarctic climate and reconstructions from Antarctic ice core data Andrew Russell ?1 , Glenn R. McGregor 2 1 School of Earth, Atmospheric and Environmental Sciences, University of Manch- ester, M13 9PL, UK. 2 School of Geography, Geology and Environmental Science, University of Auck- land, New Zealand. Received: date / Revised version: date Abstract The atmospheric circulation patterns in the Southern Hemi- sphere have had a significant impact on the climate of the Antarctic and there is much evidence that these circulation patterns have changed in the recent past. This change is thought to have contributed to the warming trend observed at the Antarctic Peninsula over the last 50 years — one of the largest trends observed in this period on the planet. The trends associ- ated with the continental Antarctic climate are less clear but are likely to be impacted less directly by atmospheric circulation changes. The circulation changes can be put into the context of longer timescales by considering at- mospheric circulation reconstructions that have been performed using data from Antarctic ice cores. In this review paper we look at the main body of work examining: Antarctic climate trends; the understanding and impact of atmospheric circulation of the mid- to high-latitudes of the Southern Hemisphere; and the usefulness and reliability of atmospheric circulation reconstructions from Antarctic ice core data. Finally, beyond several of the more quantitative reconstructions, it is deemed that an assessment of their consistency is not possible due to the variety of circulation characteristics that the various reconstructions consider. Key words Palaeoatmospheric reconstructions – Antarctic climate change – glaciochemistry ? e-mail: [email protected]
Transcript of Southern hemisphere atmospheric circulation: impacts on Antarctic climate and reconstructions from...

Climatic Change manuscript No.(will be inserted by the editor)
Southern Hemisphere atmosphericcirculation: impacts on Antarctic climate andreconstructions from Antarctic ice core data
Andrew Russell?1, Glenn R. McGregor2
1 School of Earth, Atmospheric and Environmental Sciences, University of Manch-ester, M13 9PL, UK.
2 School of Geography, Geology and Environmental Science, University of Auck-land, New Zealand.
Received: date / Revised version: date
Abstract The atmospheric circulation patterns in the Southern Hemi-sphere have had a significant impact on the climate of the Antarctic andthere is much evidence that these circulation patterns have changed in therecent past. This change is thought to have contributed to the warmingtrend observed at the Antarctic Peninsula over the last 50 years — one ofthe largest trends observed in this period on the planet. The trends associ-ated with the continental Antarctic climate are less clear but are likely to beimpacted less directly by atmospheric circulation changes. The circulationchanges can be put into the context of longer timescales by considering at-mospheric circulation reconstructions that have been performed using datafrom Antarctic ice cores. In this review paper we look at the main body ofwork examining: Antarctic climate trends; the understanding and impactof atmospheric circulation of the mid- to high-latitudes of the SouthernHemisphere; and the usefulness and reliability of atmospheric circulationreconstructions from Antarctic ice core data. Finally, beyond several of themore quantitative reconstructions, it is deemed that an assessment of theirconsistency is not possible due to the variety of circulation characteristicsthat the various reconstructions consider.
Key words Palaeoatmospheric reconstructions – Antarctic climate change– glaciochemistry
? e-mail: [email protected]

2 Andrew Russell, Glenn R. McGregor
1 Introduction
Ice core records from the Antarctic have been used extensively to interpretpast atmospheric temperature changes. The longest of these records covermany thousands of years, indeed the recently drilled core from Dome C (seeFigure 1 for the locations referred to in this paper) spans at least 740000years (EPICA community members, 2004). These palaeoclimatic observa-tions are of great importance in the scientific community’s effort to place thecurrent climate in context and to aid predictions of future climate changes;see Jones and Mann (2004) or Mayewski et al. (2009) for recent reviews ofthis point. Ironically, though, whilst these ice core records cover very longperiods, Antarctic meteorological observational records are both sparse andshort compared to those from the other continents — see Monaghan andBromwich (2008) for a detailed discussion of this point. Furthermore, theobservational records that are available show that one region, the AntarcticPeninsula, has experienced one of the largest and fastest surface (Hansenet al., 1999; Vaughan et al., 2001, 2003) and upper-level (Turner et al.,2006a) temperature increases. This is in contrast to the climatic regime ofthe continental interior, which is less clear; this latter point is well high-lighted by the reported widespread cooling claims of Doran et al. (2002)and the subsequent questioning of the statistical techniques employed inthat work by Turner et al. (2002). Despite the fact that there are manystudies of the Antarctic climate regime, employing various datasets — forexample: satellite (Comiso, 2000); re-analysis (Cullather et al., 1997; Mar-shall, 2000); climate model (Turner et al., 2006b); ice pit (Doran et al., 2002;Bertler et al., 2004); and station data (Jacka et al., 2004; Turner et al.,2005; Gillett et al., 2006) — it is difficult to glean a consistent perspectiveof continental Antarctic temperature changes (Chapman and Walsh, 2007).Recently, however, Steig et al. (2009) have shown that positive temperaturetrends have occurred over most of the Antarctic since 1957 by employinga statistical reconstruction technique that exploits the high spatial coher-ence of the Antarctic temperature pattern, which is confirmed by satellitethermal infrared data.
Looking to climate predictions, the Intergovernmental Panel on ClimateChange (IPCC) Fourth Assessment Report (AR4) on the physical basisof climate change (IPCC, 2007) have discussed how the lack of reliableobservations also makes future projections difficult. However, a study ofclimate model and re-analysis data (Lynch et al., 2006) has shown a highlevel of coherence between atmospheric circulation and Antarctic temper-ature and precipitation anomalies and trends. Similarly, Monaghan et al.(2008) have uncovered some potentially reliable trends within the “warm-Peninsula-cold-continent” pattern that often arises in the literature by re-constructing near-surface temperature from multiple sources. Furthermore,Orr et al. (2004) and Marshall et al. (2006) have shown how a circula-tion regime increasingly dominated by relatively warm, maritime westerliescan explain much of the western Antarctic Peninsula warming, Thomas

Southern Hemisphere atmospheric circulation 3
Fig. 1 Map of the Antarctic showing the locations of all the places referred to inthe text.
et al. (2008) have uncovered a link between these westerlies and a dou-bling in snow accumulation in the western Antarctic Peninsula since 1850and Schneider et al. (2006) have shown an anti-phase relationship betweentemperature reconstructions from Peninsula and continental ice core sites.This shows that the impact of atmospheric circulation on the Antarctic isof paramount importance.
A particular point of concern with respect to the global climate systemis the stability of the Antarctic ice sheets and the ice shelves around thecontinent. The collapse of the Larsen B ice shelf from the eastern Antarc-tic Peninsula in 2002 was one such event. Examination of sediment in thevicinity of Larsen B confirmed that such a break up is unprecedented forthe duration of the Holocene (Pudsey and Evans, 2001; Domack et al.,2005). The forcing of the collapse is thought to have been related, in part,to the air temperature changes that occurred above (Rack and Rott, 2004)with the ocean also playing a major role (Shepherd et al., 2003; Glasserand Scambos, 2008). Furthermore, van den Broeke (2005) has shown thatatmospheric circulation anomalies (i.e. an increase in north-westerly andnorth-easterly winds recorded by an AWS on the ice shelf) during the meltseason of 2001/2 led to increased surface melting of Larsen B prior to itscollapse. This highlights the potential scale of the Southern Hemisphere at-mospheric circulation changes on Antarctica and that our understandingof this dynamic region is lacking and in urgent need of clarification. This

4 Andrew Russell, Glenn R. McGregor
is particularly so given that the Weddell Sea is a very important region ofdownwelling in the thermohaline circulation and alteration of this wouldhave global consequences. It is also suspected that the increasing strengthof winds over the Southern Ocean has reduced the uptake of CO2 (Le Quereet al., 2007).
More generally, it is well established that atmospheric circulation changeshave an important impact on climate (Trenberth, 1995). It can also be spec-ulated that circulation modifications, which will, in turn, affect precipitationdelivery mechanisms, will have an impact on the chemical composition andaccumulation of the snow and ice found at Antarctic ice core sites1. There-fore, study of the links between atmospheric circulation and ice core data isimportant for two reasons: it will improve our interpretation of the ice coredata; and will increase our understanding of the atmospheric circulationimpacts on Antarctic climate. As such, this paper is structured to first givean overview of the mid- to high-latitude Southern Hemisphere atmosphericcirculation and its impact on Antarctic climate (Section 2). This focusesmainly on the Peninsula as it is most strongly influenced by atmosphericcirculation changes. It is also necessary to understand the glaciochemistryof Antarctic ice cores (Section 3) and the common precipitation sources forthe Antarctic (Section 4) in order to comprehend the work discussed laterin this paper . We will then review the major works of atmospheric circula-tion reconstructions from Antarctic ice cores in Section 5. Finally, we willprovide a summary and some potential future directions of this emergingand important field of cross-disciplinary research in Section 6.
2 Current Understanding of Atmospheric Circulation Patterns
This section presents an overview of the typical Southern Hemisphere stormtracks and regions of blocking, as well as the important modes that dominatethe mid- to high-latitude atmospheric circulation of the Southern Hemi-sphere. As well as having a strong influence on climate, as discussed inChapter 3 of the IPCC AR4 (Trenberth et al., 2007), these modes are ofinterest in the field of circulation reconstructions as their relative strengthand/or phase are often responsible for driving changes in atmospheric cir-culation that are subsequently detectable in ice cores.
2.1 Storm Tracks
King and Turner (1997) discuss how the climatology of Southern Hemi-sphere cyclones represents an interesting example of how improvements inthe observational network has led to an evolution of understanding. For ex-ample, from data acquired during the International Geophysical Year (IGY;
1 This has been investigated and reviewed to a certain degree, from the per-spective of isotopic composition, by Masson-Delmotte et al. (2008).
Southern Hemisphere atmospheric circulation 5
1957/8), van Loon (1965) and Taljaard (1967) agreed that the formationof Southern Hemisphere cyclones generally occurred in the mid-latitudes.They also thought that, after their cyclogenesis, these depressions usuallymigrated south-eastward towards the pole. This picture was believed to beconfirmed via the classification of cloud vortices from early satellite im-agery (Streten and Troup, 1973), a method that also suggested that theregion south of 60◦S is dominated by dissipating vortices. Indeed, Taljaard(1967) described the Antarctic coast as a “depression’s graveyard”. Physick(1981) reinforced this view with his analysis of data collected during the1979 First GARP (Global Atmospheric Research Programme) Global Ex-periment (FGGE).
In contrast to these early studies, Jones and Simmonds (1993) appliedan automatic cyclone identification scheme to 15 years of Australian Bureauof Meteorology (ABM) synoptic observations and found two mid-latitudebranches of cyclone movement from the Tasman Sea area and from aroundSouth America. The former of these tends to “merge” with the circumpolartrough (CPT; see region south of 60◦S in Figure 2) near the Drake Passage.However, Jones and Simmonds (1993) also highlighted a high level of cyclo-genesis in the CPT that was not considered to be important until the 1980swhen satellite imagery had reached an adequate level of spatial resolution toidentify it (King and Turner, 1997). Cyclogenesis at these high latitudes hassince been reported by Turner et al. (1998) in their study of Advanced VeryHigh Resolution Radiometer (AVHRR) satellite imagery, particularly overthe Bellingshausen Sea and in the lee of the Antarctic Peninsula. Indeed, itis in this region (around 150◦W) that we find the “pole of variability” (Con-nolley, 1997), which has the highest standard deviation of mean sea-levelpressure (MSLP) for the entire Southern Hemisphere, and is, therefore, con-sidered of particular importance for atmospheric circulation driven climatevariability of the Antarctic.
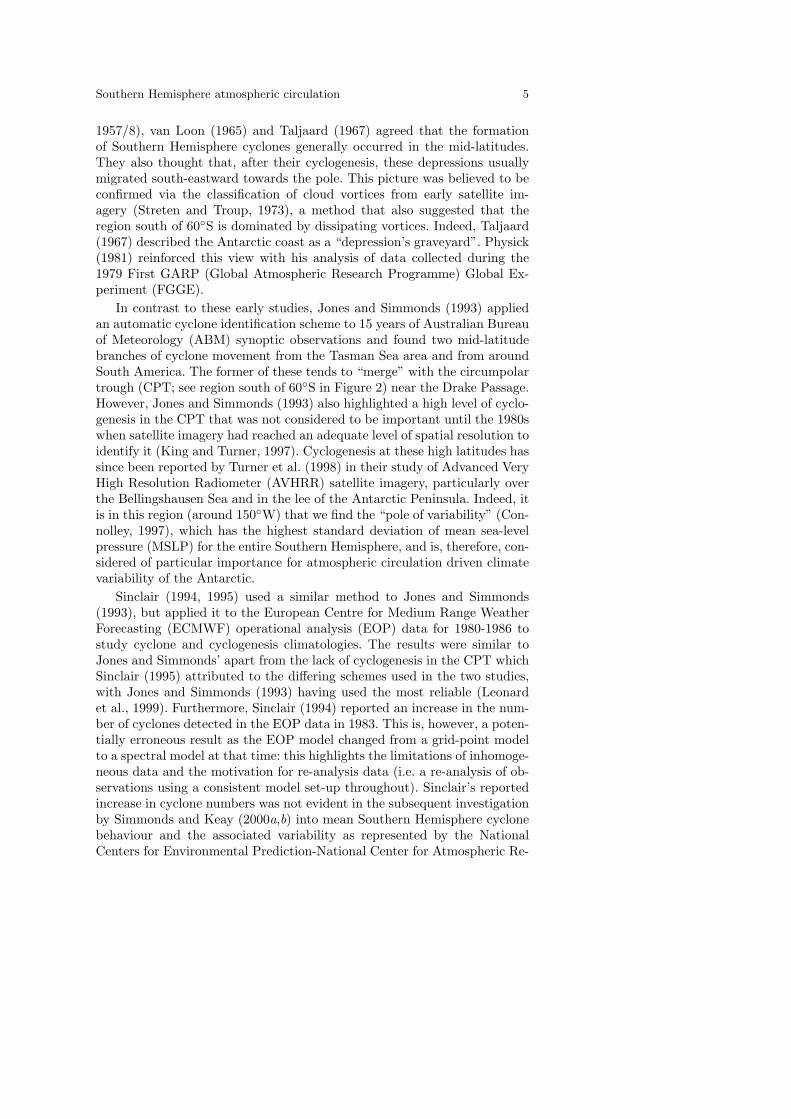
Sinclair (1994, 1995) used a similar method to Jones and Simmonds(1993), but applied it to the European Centre for Medium Range WeatherForecasting (ECMWF) operational analysis (EOP) data for 1980-1986 tostudy cyclone and cyclogenesis climatologies. The results were similar toJones and Simmonds’ apart from the lack of cyclogenesis in the CPT whichSinclair (1995) attributed to the differing schemes used in the two studies,with Jones and Simmonds (1993) having used the most reliable (Leonardet al., 1999). Furthermore, Sinclair (1994) reported an increase in the num-ber of cyclones detected in the EOP data in 1983. This is, however, a poten-tially erroneous result as the EOP model changed from a grid-point modelto a spectral model at that time: this highlights the limitations of inhomoge-neous data and the motivation for re-analysis data (i.e. a re-analysis of ob-servations using a consistent model set-up throughout). Sinclair’s reportedincrease in cyclone numbers was not evident in the subsequent investigationby Simmonds and Keay (2000a,b) into mean Southern Hemisphere cyclonebehaviour and the associated variability as represented by the NationalCenters for Environmental Prediction-National Center for Atmospheric Re-

6 Andrew Russell, Glenn R. McGregor
Fig. 2 MSLP climatology for the Southern Hemisphere derived from the Eu-ropean Centre for Medium Range Weather Forecasting (ECMWF) 40-year re-analysis dataset (ERA-40) for the period 1979–2001. Contour interval is 4hPaand bold contours are used for the 1000hPa and 1020hPa contours.
search (NCEP-NCAR) re-analysis (NNR) data (Kalnay et al., 1996) for theperiod 1958-1997. Simmonds and Keay (2000a,b) also describe some otherinteresting features of Southern Hemisphere cyclone behaviour in the NNR,which can be summarised thus:
– cyclone density increased over the eastern Antarctic Peninsula;– intensity of systems increased over the Weddell Sea;– cyclogenesis exceeds cyclosis north of 50◦S;– cyclosis exceeds cyclogenesis south of 50◦S;– average lifetime of cyclones between 50-70◦S is 4 days;– cyclone density generally decreased over the Southern Ocean;– mean cyclone pressure decreased;– the combination of these latter two factors (i.e. less frequent but deeper
cyclones) resulted in an overall MSLP decrease over the Southern Hemi-sphere.
While the NNR has facilitated the development of detailed climatolo-gies for the Southern Hemisphere, it must be borne in mind that the NNRinitially had some problems associated with the data quality in the highsouthern latitudes (Hines et al., 2000; Bromwich and Fogt, 2004). Becauseof this, Simmonds et al. (2003) published a similar analysis to Simmonds and
Southern Hemisphere atmospheric circulation 7
Keay (2000a,b) of the sub-Antarctic region using the NCEP-Department ofEnergy (NCEP-DOE) re-analysis-2 (NNR-2; Kanamitsu et al. (2002); a re-analysis that attempted to eliminate some of the errors in the original NNR)for the period 1979-2000. The main result of this work, beyond the findingsof Simmonds and Keay (2000a,b), was that a very high level of cyclogen-esis was found over the northern Antarctic Peninsula (in both winter andsummer) and over the Weddell Sea (mainly in winter). They also reportthat winter cyclones generally exceed their summer occurrence. Pezza et al.(2007) also note that around Anarctica pressure is generally lower (higher)during a positive (negative) phase of the Pacific Decadal Oscillation (PDO;see Section 2.5) suggesting PDO related moderation of cyclogenesis at thedecadal scale.
2.2 Blocking
The EOP data has also been used to develop a climatology of SouthernHemisphere anticyclones. For the period 1980-1989, Sinclair (1996) foundthat the highest density of anticyclones occurred in the latitudinal range of25-45◦S, which coincides with the sub-tropical high-pressure zone (STHP;see region around 30◦S in Figure 2). Sinclair (1996) also showed that thereis an appreciable number of anticyclones over the Weddell Sea, particularlyin summer and early winter. The only other region near the Antarctic coastthat experiences a significant occurrence of anticyclones is the Pacific sec-tor. This is of interest as anticyclones in these regions induce an anomalousbreakdown in the westerlies which has an impact on the precipitation deliv-ery mechanisms for the western Antarctic and, in particular, the AntarcticPeninsula because of the associated weak westerly flow.
Jones and Simmonds (1994) performed a similar analysis to Sinclair(1996) and found, in 15 years of ABM analyses, that the highest anticyclonedensity was over the eastern ocean basins at around 25-42◦S. They alsofound a significant anticorrelation (r=-0.6) between the Southern OscillationIndex (SOI; see Section 2.5) and the anticyclone density at 120◦W i.e. nearthe Amundsen Sea Low (ASL). This implies that a more negative SOI willresult in blocking over the Amundsen Sea.
To further highlight the importance of blocking to the Antarctic precip-itation regime, Noone et al. (1999) and Masson-Delmotte et al. (2004) havedemonstrated mechanisms by which blocking over the Southern Ocean canforce significant precipitation events to occur over Dronning Maud Land(DML) and the East Antarctic interior, respectively.
2.3 The Southern Annular Mode (SAM)
The SAM (Limpasuvan and Hartmann, 1999) is also known as the AntarcticOscillation (Gong and Wang, 1999) and the High Latitude Mode (Rogersand van Loon, 1982). In this review, this pattern will only be referred to as

8 Andrew Russell, Glenn R. McGregor
the SAM. The most widely accepted definition of the SAM is that of Gongand Wang (1999): “the alternation of atmospheric mass between the mid-latitude and high-latitude surface pressure”. However, the polar vortex thatthe SAM describes is also present throughout the troposphere and some-times into the stratosphere. It can be represented as the leading EmpiricalOrthogonal Function (EOF) of the Southern Hemisphere MSLP — see fig-ure 1 from Gong and Wang (1999). Based on an analysis of the NNR data,Gong and Wang (1999) found that the SAM explains 22.5% of the South-ern Hemisphere MSLP variance. Furthermore, Trenberth et al. (2005) haveshown the SAM is responsible for 10% of the variance of global atmosphericmass transport and Tietavainen and Vihma (2008) have shown that east-ward (northward) moisture transport has a positive (negative) significant,at the 95% confidence level, correlation with the SAM index at 60◦S.
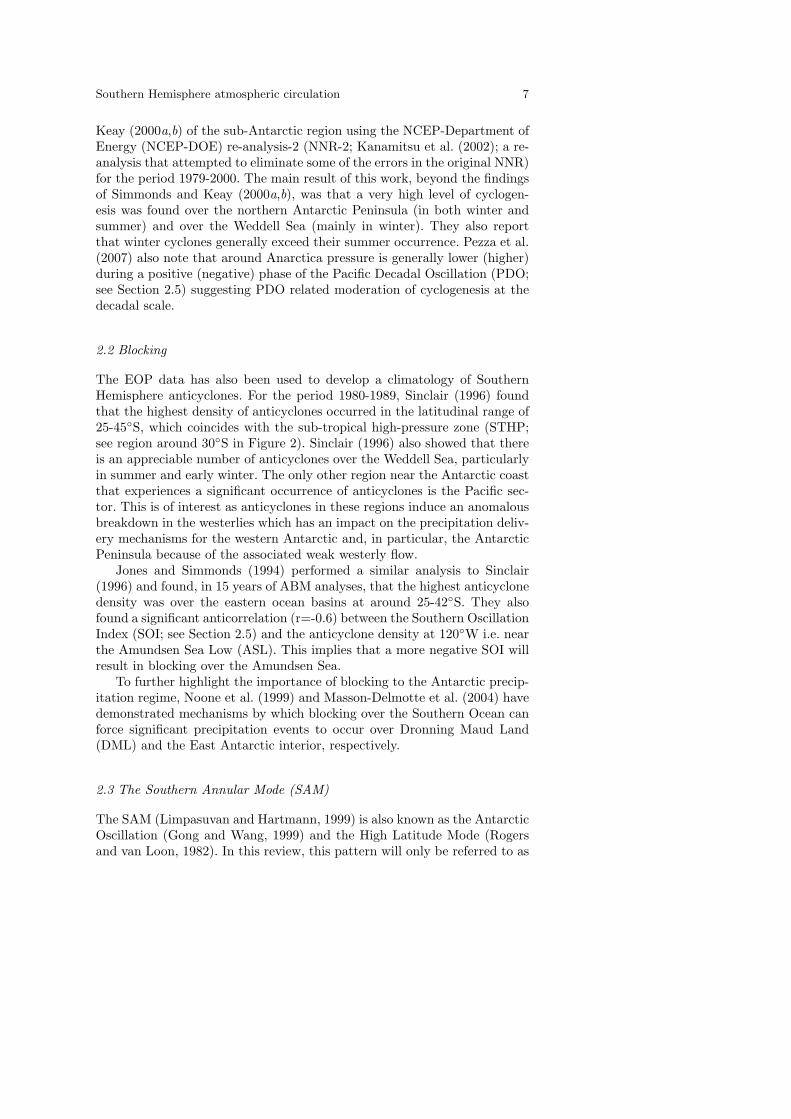
Gong and Wang (1999) also define a SAM Index based on the differenceof the normalised zonal mean pressure between 40◦S and 65◦S. This defini-tion implies that a more positive SAM index will be associated with strongercircumpolar westerlies, increased cyclonicity and stronger zonal winds. How-ever, the Gong and Wang (1999) index is based on the NNR data whichhas anomalous pressure trends in the high southern latitudes (Hines et al.,2000). Marshall (2003), on the other hand, has used station data from theSouthern Hemisphere at approximately 40◦S and 65◦S to present a morereliable SAM index2 (Figure 3). There are noticeable differences betweenthe Marshall (2003) and the Gong and Wang (1999) indices, especially inthe trends observed. Marshall (2003) found a pronounced positive trendin the 1970s of his index and showed that the overall trend in the NNRSAM index is exaggerated by a factor of two relative to his index. Also,the greatest positive trend in the Marshall SAM index occurred in the sum-mer months whereas the NNR data showed it occurred in winter. Marshall(2002) documented a statistically significant increase in the circumpolarwesterlies over the northern Antarctic Peninsula, which is consistent withthe trends presented by Marshall (2003). Indeed, the SAM is particularlyimportant to climatic variations observed on the Antarctic Peninsula, as dis-cussed by Marshall (2007), because the Peninsula extends out to much lowerlatitudes than the rest of the Antarctic. It is, therefore, heavily impactedby the circumpolar vortex and hemispheric westerlies that the Peninsulaperpendicularly bisects. Furthermore, van Lipzig et al. (1999) and van denBroeke and van Lipzig (2003) have studied this phenomenon using a rela-tively high-resolution regional climate model (RCM). They found that theMSLP charts from the model for years with a positive and negative SAMindex showed a 90◦ change in the direction of the pressure gradient over theWeddell Sea; it was shown that a positive SAM index resulted in isobarsperpendicular to the Peninsula and parallel to it for periods with a nega-
2 Jones et al. (2009) have produced a similar, seasonal station-derived SAMindex reconstructed back to 1865, calibrated using the Marshall (2003) index,which is due to be published immanently.

Southern Hemisphere atmospheric circulation 9
Fig. 3 The seasonal SAM index calculated from station data. The smooth lineshows variations of the decadal scale. Source: IPCC (2007) (updated from Marshall(2003)).
tive SAM index. These patterns are similar to the first and second EOFs ofAntarctic Peninsula MSLP station data as presented by King (1994) and,given these points, it seems likely that the SAM exerts a strong influenceover the atmospheric circulation in this region. This idea is developed fur-ther by van Lipzig et al. (2008) who demonstrate, using a high resolutionRCM, that changes in temperature with changes in the SAM are strongerover the eastern AP compared to the western AP because of lee side com-pressional warming during periods dominated by strong westerly (upwind)flows. It is also of interest that, despite projections showing that the positiveSAM trend will continue into the 21st Century, the Peninsula warming isnot expected to continue (IPCC, 2007).
There is much evidence for, and debate over, the impact of the SAMon Antarctic climate and its driving force; the major works are summa-rized here. Thompson and Solomon (2002), for example, believe that thepositive trend in the SAM is predominantly responsible for the pattern ofcirculation and temperature trends that they showed to be present in ra-diosonde observations. Schneider et al. (2004) have also shown that theleading EOF of Antarctic temperature variability recorded by satellite in-frared and passive microwave data correlates well with the SAM, although,there are limitations in this satellite data as the former only operates inclear sky conditions and the latter is influenced by snow and ice variations.Kwok and Comiso (2002b) have suggested that the recent changes in theSAM have led to negative temperature anomalies over the entire Antarcticcontinent, except for the Peninsula, where positive anomalies are seen. Hur-rell and van Loon (1994) have argued that similar — SAM-like — changesin the Semi-annual Oscillation (SAO; see next section) were responsible forthe temperature trends observed over the Antarctic and, like Thompson andSolomon (2002), they also point out that these circulation changes have oc-curred largely in parallel with the ozone depletion in the stratosphere aboveAntarctica and hypothesise that they are linked. Furthermore, the largesttrends in the tropospheric SAM index appear to occur after the lower level
10 Andrew Russell, Glenn R. McGregor
vortex amplifies into the stratosphere in November of each year (Thomp-son and Wallace, 2000) and also after the major ozone loses occur in theSouthern Hemisphere summer (Thompson et al., 2000). Thus, the proposedcoupling of ozone depletion with a positive trend in the SAM index is tem-porally justifiable on a seasonal timescale as well as the interannual scale,as discussed by Thompson and Solomon (2002).
Gillett and Thompson (2003) attempted to ratify the link between ozonedepletion and the positive trend in the SAM by employing an atmosphericmodel forced solely by stratospheric ozone changes3. This method achievestheir goal, in that they model similar 500hPa geopotential height, 925hPawind and temperature trends to the observations. However, their inferencethat ozone depletion is, therefore, the driving force behind recent South-ern Hemisphere climate changes is largely unsubstantiated as the simplifiedmodel they use shows merely moderate correlation between the two phenom-ena, but no causality. Hartmann et al. (2000) presented a causal mechanismwhereby reduced stratospheric ozone and increased greenhouse gases wouldlead to a cooler stratosphere, resulting in a greater stratospheric meridionaltemperature gradient. This would, in turn, lead to a stronger circumpolarvortex via a greater level of vertical shear in the zonal wind; Limpasuvan andHartmann (1999) have used a CGM to show that this vertical shear occursat the same time as the variations in the SAM. However, this mechanismwas not discussed by Gillett and Thompson (2003).
Although there is an increasing body of research that supports the theorythat the recent Southern Hemisphere climate changes have been driven bystratospheric influences, Marshall (2002) and Roscoe et al. (2006) note thatmuch of the warming on the western Antarctic Peninsula occurred beforeany significant trends in the SAM were observed and are, therefore, unlikelyto be linked. Furthermore, Marshall et al. (2004) point out that the trend inthe SAM itself began approximately a decade before any ozone loss occurredin the Southern Hemisphere stratosphere. These factors are obviously notconsistent with the hypothesis presented by Thompson and Solomon (2002)and other workers.
Marshall et al. (2004) also investigated the influences of natural andanthropogenic forcings on a GCM in order to assess the relative importanceof these forcings to the changes in the SAM. Their findings imply thatthe observed trend in the SAM, despite being unlikely to have been forcedsolely by internal variations, was consistent with a combined, non-linearinteraction of natural and anthropogenic forcings. Indeed, Marshall (2003)had discussed how the tropics could influence the SAM in the Pacific region.This connection has also been considered by Fogt and Bromwich (2006) whofound that ENSO is most strongly teleconnected to the Antarctic when ithas an in-phase relationship with the SAM, which was the case in the 1990sbut less so throughout the 1980s.
3 A similar model experiment had previously been implemented by Sexton(2001) but was later found to include erroneous trends in the ozone data used.
Southern Hemisphere atmospheric circulation 11
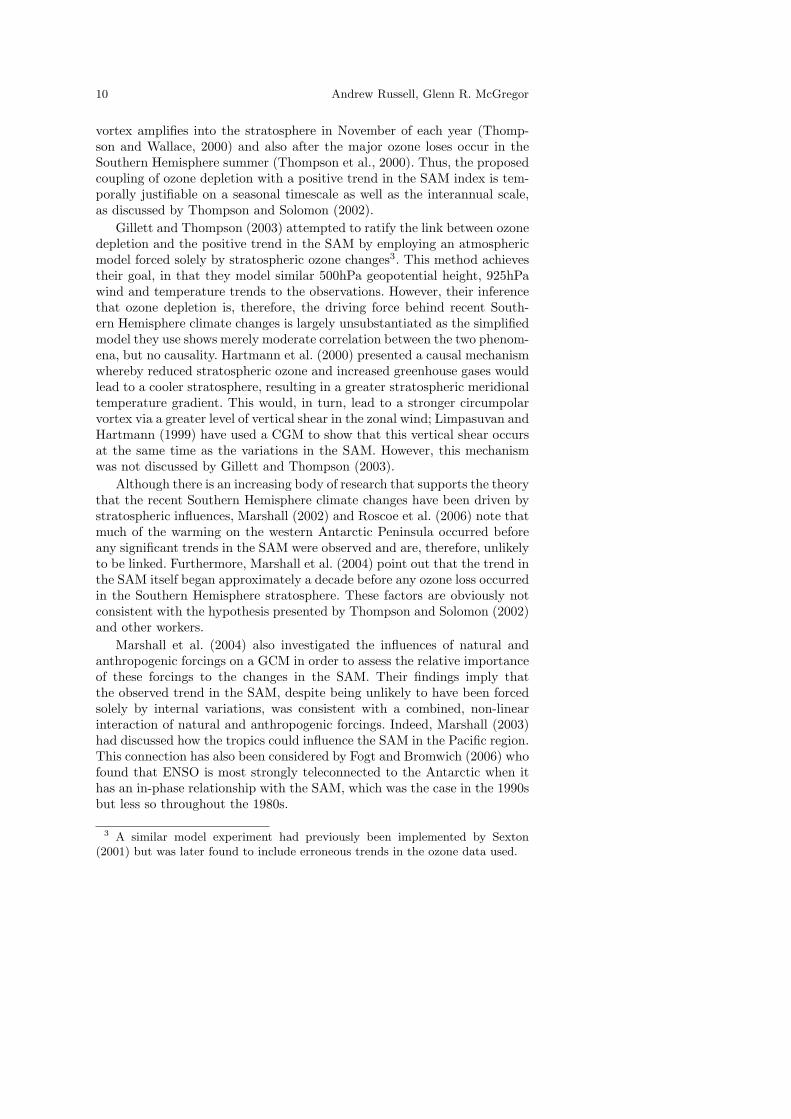
Fig. 4 “Smoothed mean annual cycle of pressure differences between mid-latitudeislands and Antarctic coastal stations, for 1957-79 (solid line) and 1980-96 (dashedline). Values for Chatham-Rothera on right axis, for the other two stations pairson left axis.” This plot shows the changing nature of the SAO in the three oceanbasins between the two time periods. Source: van den Broeke (1998b).
Despite these contentions, the importance of the SAM in studies ofSouthern Hemisphere climate variability is still of great importance, asrecognised by the IPCC in Chapter 3 (Trenberth et al., 2007). Indeed, anumber of independent GCM based analyses have shown that, using sce-narios of increasing greenhouse gas and sulphate emissions, Southern Hemi-sphere climate changes manifest themselves almost exclusively as changesin the SAM (Fyfe et al., 1999; Kushner et al., 2001; Fyfe and Saenko, 2006).
2.4 The Semi-Annual Oscillation (SAO)
The SAO represents a twice-yearly expansion and contraction of the CPT,with it being deepest and furthest south in the equinoctial (MAM and SON)seasons (van Loon, 1967) as shown in Figure 4. This pattern occurs as thereis a significant difference in the levels of heat storage by the Antarctic andthe Southern Ocean; the shift in atmospheric mass described by the SAOresolves to balance this.
The SAO and the SAM describe similar modes of pressure variation inthe mid- to high-southern latitudes so it is worth distinguishing them at thisstage. The SAO is a reflection of the pattern of the annual cycle of pressureat a certain longitude. In a year when the SAO is strong, two peaks and twotroughs (i.e. a y=sin(2x) curve) will be clearly seen in the annual pressure
12 Andrew Russell, Glenn R. McGregor
data. The SAO can, therefore, vary longitudinally around the region that itaffects, both in terms of amplitude and phase. The SAM index, on the otherhand, is a description of the pressure gradient between 40◦S and 65◦S. TheSAM is a hemispheric indication of the strength of the westerlies, althoughit also contains longitudinal variability. The data used to calculate this isnormalised and will, thus, have had the SAO signal removed.
It has been suggested that the SAO is responsible for the distribution ofwarming and cooling trends that have been observed over the Antarctic. Forexample, by analysing temperature observations, van den Broeke (1998a)reported that a significant portion of the annual variation can be explainedby the second harmonic therein i.e. the semi-annual variation associatedwith the SAO. At Faraday/Vernadsky (western Antarctic Peninsula), al-most 80% of the pressure variance is explained by the second harmonic forthe period 1957-1979. For the same period on the eastern Antarctic Penin-sula, this drops to 53% and 37% for Esperanza and Matienzo, respectively.Further, the amplification of the wavenumber-3 pattern inherent in the cir-cumpolar circulation (Figure 2) is also proposed to be an important factorfor those continental stations that have undergone a cooling.
However, a change has occurred in the SAO (Meehl et al., 1998; van denBroeke, 1998b) meaning that from the late 1970s and into the 1980s, theSAO has undergone a significant weakening, with the second harmonic dis-appearing in the South Pacific region in the early 1980s (Figure 4). Thischange manifested itself as a failure of the CPT to expand north in the latespring (Hurrell and van Loon, 1994) leaving a strong polar vortex. This isindicative of a more positive SAM index (van den Broeke, 1998b) and con-sistent with the trends observed in that mode (Marshall, 2003). This hasalso led to a dramatic drop in the pressure variance explained by the secondharmonic for the period 1980-1996 as reported by van den Broeke (1998b):the figure at Faraday dropped to just 10% for 1980-1996; and at Esperanzathe variance explained changed to 7%. This is obviously a mode of variabil-ity that has important links to the climate of the Antarctic, particularly forthe western coast of the Peninsula.
2.5 The El Nino-Southern Oscillation (ENSO)
ENSO is principally a description of the oceanic and atmospheric conditionsover the Pacific. The atmospheric component — the Southern Oscillation(Walker, 1928) — represents the “seesaw” in atmospheric pressure acrossthe Pacific, operating over periods of between two and ten years (Trenberth,1984). This variability is most often described by the Southern OscillationIndex (SOI), which is used to represent the phase and amplitude of anENSO event. A negative (positive) SOI indicates a “warm” (“cold”) ENSO,or El Nino (La Nina), event. There are other, more regional definitions ofEl Nino (Trenberth, 1997, for example) but the SOI is most often used inthe examples shown below. Over a longer timescale, Quinn and Neal (1992)

Southern Hemisphere atmospheric circulation 13
have constructed a useful chronology of El Nino events using data from thelogs of sailing vessels that traveled to Ecuador and Peru that indicate ENSOphase. This record starts in 1525 and provides a record for comparison withthe atmospheric circulation reconstructions. Garcia et al. (2001) have alsoperformed a similar El Nino reconstruction.
ENSO is teleconnected with the Antarctic climate to a significant de-gree and these connections have been comprehensively reviewed by Turner(2004). As such, we have simply summarized the major reported ENSOsignals found in various Southern Hemisphere high-latitude datasets in Ta-bles 1 and 2. However, of most relevance to the Antarctic beyond thoseworks listed in Tables 1 and 2 is how the ENSO signal is transported pole-ward by the South Pacific convergence zone (SPCZ). The SPCZ movesnorth-east relative to its mean position during “cold” (La Nina) events andsouth-west during “warm” (El Nino) events (Vincent, 1994). This allowsthe ENSO signal to propagate to the south-eastern Pacific and has been de-tected as positive height anomalies in the 500hPa level over the Amundsenand Bellingshausen Seas (Houseago et al., 1998; Renwick, 2005). Given thatthe western Antarctic and the Peninsula face the area where ENSO has itsgreatest impact (i.e. the Pacific) this will undoubtedly influence the highlatitude atmospheric circulation features that are detectable.
Within these ENSO-Antarctic connections there are certain oceanic, orocean driven, patterns intrinsically linked to the variability of ENSO, such asthe Pacific-South America teleconnections (Mo and Ghil, 1987), the PacificDecadal Oscillation (Mantua et al., 1997), the Interdecadal Pacific Oscilla-tion (Power et al., 1999) and the Antarctic Dipole (Yuan and Martinson,2001). These patterns have been noted to exert an influence on the Antarc-tic climate. Additionally, the Antarctic Circumpolar Wave (ACW) has alsobeen discussed as having a significant impact on the climate of the highsouthern latitudes in recent years (White and Peterson, 1996). However,the importance and existence of the ACW has been questioned (Connolley,2002; Park et al., 2004), although, Fischer et al. (2004) believe that theyhave uncovered an ice core signal from DML showing the ACW over thelast 2000 years. Whilst these oceanic patterns do require consideration fora full understanding of Antarctic climate variability, they are deemed to bebeyond the scope of this review of atmospheric circulation. This omissionis justifiable, given that the re-distribution of energy from the equator tothe poles is dominated by atmospheric transport, especially in the high-latitude Southern Hemisphere (Trenberth and Stepaniak, 2003a,b). How-ever, for further details on the impacts of these oceanic factors and theirlinks with atmospheric circulation, the reader is referred to Carleton (2003)and Mayewski et al. (2009).
2.6 Section summary
Throughout this section the conflicts in our understanding of the recent/currentatmospheric circulation regime in the Southern Hemisphere have been high-
14 Andrew Russell, Glenn R. McGregor
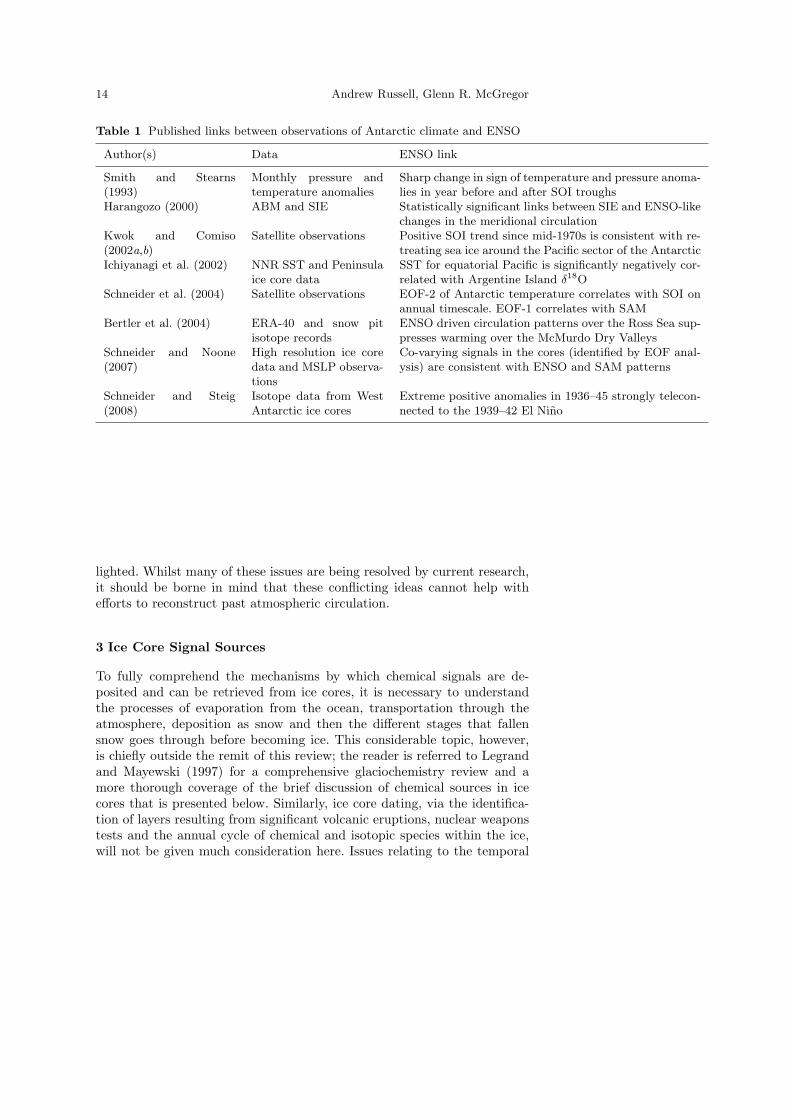
Table 1 Published links between observations of Antarctic climate and ENSO
Author(s) Data ENSO link
Smith and Stearns(1993)
Monthly pressure andtemperature anomalies
Sharp change in sign of temperature and pressure anoma-lies in year before and after SOI troughs
Harangozo (2000) ABM and SIE Statistically significant links between SIE and ENSO-likechanges in the meridional circulation
Kwok and Comiso(2002a,b)
Satellite observations Positive SOI trend since mid-1970s is consistent with re-treating sea ice around the Pacific sector of the Antarctic
Ichiyanagi et al. (2002) NNR SST and Peninsulaice core data
SST for equatorial Pacific is significantly negatively cor-related with Argentine Island δ18O
Schneider et al. (2004) Satellite observations EOF-2 of Antarctic temperature correlates with SOI onannual timescale. EOF-1 correlates with SAM
Bertler et al. (2004) ERA-40 and snow pitisotope records
ENSO driven circulation patterns over the Ross Sea sup-presses warming over the McMurdo Dry Valleys
Schneider and Noone(2007)
High resolution ice coredata and MSLP observa-tions
Co-varying signals in the cores (identified by EOF anal-ysis) are consistent with ENSO and SAM patterns
Schneider and Steig(2008)
Isotope data from WestAntarctic ice cores
Extreme positive anomalies in 1936–45 strongly telecon-nected to the 1939–42 El Nino
lighted. Whilst many of these issues are being resolved by current research,it should be borne in mind that these conflicting ideas cannot help withefforts to reconstruct past atmospheric circulation.
3 Ice Core Signal Sources
To fully comprehend the mechanisms by which chemical signals are de-posited and can be retrieved from ice cores, it is necessary to understandthe processes of evaporation from the ocean, transportation through theatmosphere, deposition as snow and then the different stages that fallensnow goes through before becoming ice. This considerable topic, however,is chiefly outside the remit of this review; the reader is referred to Legrandand Mayewski (1997) for a comprehensive glaciochemistry review and amore thorough coverage of the brief discussion of chemical sources in icecores that is presented below. Similarly, ice core dating, via the identifica-tion of layers resulting from significant volcanic eruptions, nuclear weaponstests and the annual cycle of chemical and isotopic species within the ice,will not be given much consideration here. Issues relating to the temporal

Southern Hemisphere atmospheric circulation 15
Table 2 Published links between Antarctic climate in model data and ENSO
Author(s) Data ENSO link
Cullather et al. (1996) EOP Positive correlation between precipitation and SOI pre-1990, negative correlation post-1990
Gerreaud and Battisti(1999)
NNR Southern Hemisphere SST anomalies associated withENSO-like atmospheric circulation anomalies
Noone et al. (1999) ECMWF 15-year re-analysis (ERA-15)
Synoptic conditions for DML precipitation events showedENSO-like variability
Bromwich et al. (2000) EOP and ERA-15 Similar findings to Cullather et al. (1996)Marshall (2000) ERA-15 Small, statistically significant correlation between
Thurston Island precipitation and ENSOGenthon et al. (2003) NNR, ERA-15, GCM
and SatelliteLinks between EOF-1 of precipitation data and ENSO
Genthon and Cosme(2003)
ECMWF 40-year re-analysis (ERA-40)
ENSO signals in Genthon et al. (2003) and ERA-40 areintermittent and unlikely to last far into the future
Guo et al. (2004) NNR-2 and ERA-15 Negative correlation between ENSO and Antarctic pre-cipitation for 120◦W-180◦, positive for 30◦-60◦W
Fogt and Bromwich(2006)
ERA-40 ENSO teleconnections with the South Pacific region aregoverned by coupling with the SAM
resolution of the data (i.e. the number of ice samples analysed and the an-nual accumulation at the ice core site) are important but cannot be coveredhere either — see Bradley (1999) for more details on these subjects.
3.1 Isotopic Data
Ice cores are often used to reconstruct past air temperature from the accu-mulated ice, i.e. the temperature at the time that the snow formed. Studyingthe isotopic ratios of the H2O molecules deposited achieves this; a methodthat was first discussed by Dansgaard (1964). The basis of this method lieswith the fact that there is a vapour pressure difference between H2
16O andthe less common isotope, H2
18O. Therefore, water that evaporates fromthe sea becomes depleted in H2
18O due to its lower vapour pressure com-pared to H2
16O. This heavier fraction is also the most likely to be lost viacondensation during transport in the atmosphere. Both of these depletioneffects will be amplified by a cold moisture source or by the moist air beingtransported through a cold environment. Subsequently, the amount of 18Oin an ice sample can be calculated as a ratio, 18O:16O, and then expressed

16 Andrew Russell, Glenn R. McGregor
as a delta (δ) value to give a proxy measure of temperature. This δ valueincorporates a comparison to a standard seawater sample, referred to asthe standard mean ocean water (SMOW). The SMOW has its δ18O set toequal zero and the δ18O value of an ice sample being examined representsthe departure from the SMOW δ18O value (Bradley, 1999). Similarly, it ispossible to calculate a δD (delta deuterium) value as a heavy isotope ofhydrogen, 2H or D, is also found in precipitation as HDO. This isotopicvariant also has a lower vapour pressure than H2O so all of the above re-garding H2
18O can be applied to HDO. Finally, deuterium excess, or d, canbe defined as d = δD - 8×δ18O. This quantity is particularly pertinent inthe context of this review as the different behaviour of the isotopes of H andO during fractionation allow inferences to be made regarding the moisturesource (Schlosser et al., 2008).
3.2 Chemical Data
Considering the aim of palaeoatmospheric reconstructions in the SouthernHemisphere, isotopic details are not of considerable interest: any relation-ships uncovered between atmospheric circulation and δ18O (or δD) cannotbe assumed to be stationary during circulation changes as the tempera-ture of the precipitation sources may be different. Of greater interest fortracing precipitation sources in the Antarctic is the information on pastatmospheric composition from ice cores. This can be found by analysingair trapped within pores of the ice and the concentration of various water-soluble chemicals and aerosols that were taken up by the cloud droplets.Legrand and Mayewski (1997) considered the typical sources of the chemi-cals that are often found in ice cores. They discuss how the oceans, combinedwith the processes of waves and wind, are the major source for speciesderived from sea salt i.e. sodium (Na+), chlorine (Cl−) and some mag-nesium (Mg2+), calcium (Ca2+), sulphate (SO4
2−) and potassium (K+).Continental shelves are the primary source of terrestrial salts in the ice,such as Mg, Ca, carbonate (CO3
2−), SO4 and aluminosilicates. Their fi-nal source category is biogenic and anthropogenic gas emissions, the pri-mary aerosols from which are usually transformed during transport in theatmosphere and are found in ice cores as secondary aerosols: ammonium(NH4
+); Cl; nitrate (NO3−); SO4; methyl sulfonate (CH3SO3
−); fluorine(F−); methanoate/formate (HCOO−); methyl sulphonic acid (MSA); andother organic compounds. The Legrand and Mayewski (1997) scheme con-siders both Antarctic and Greenland ice cores so not all of these aerosolswill be relevant to studies of the Southern Hemisphere. For example, com-pared to Greenland, there is very little evidence of anthropogenic emissionsat the Antarctic. The authors concluded that the major ions that should bedetectable at Antarctica are Na, Ca, Mg, Cl, NO3 and SO4. In addition tothese species, it is possible to calculate non-sea-salt sulphate (nssSO4
2−) byusing a relationship between sulphate and chloride (which is assumed to be
Southern Hemisphere atmospheric circulation 17
exclusively derived from sea-salt) in ice cores. It is also possible to measurethe quantity and particle size of dust that is trapped in ice cores — thesefactors can also used to infer information about the source of precipitationcomprising ice core layers.
Looking specifically at the origins of particular species for the Antarctic,the source of nitrate is a subject of minor contention. Liss et al. (2004) havesuggested that it sourced from biogenic activity in the southern ocean. How-ever, Legrand and Delmas (1986), Legrand and Kirchner (1990) and Good-win et al. (2003) believe that the major source of nitrate is via transportfrom the stratosphere in the polar vortex. It will be important to considerthis disagreement in the interpretation of work presented in the followingsection. Furthermore, Rankin et al. (2002) and Wolff et al. (2003) haveargued that increases in species derived from sea salt in eastern AntarcticPeninsula ice cores are likely to be derived from highly saline “frost flowers”that form on new sea ice and, therefore, are not an indication of increasedopen water nearby as had previously been suggested (Peel and Mulvaney,1992, for example). Indeed, Rankin et al. (2004) deem that the interpre-tation of sea-salt concentrations for all Antarctic and Greenland ice coresneed to be revisited — this would affect a significant amount of work, as wewill discuss further in Section 5.
4 Antarctic Precipitation Source Studies
This section considers work that has attempted to identify the source ofprecipitation for Antarctica as a whole and for specific sites over the in-strumental era. This gives us some important background information forthe next section of this review: the consideration of atmospheric circulationreconstructions from Antarctic ice core data. Throughout this section it isworth bearing in mind that Monaghan et al. (2006) have shown that therehave been no significant changes in Antarctic snowfall since the IGY.
4.1 Precipitation source studies considering the Antarctic as a whole
The ability to establish the sources of Antarctic precipitation is fundamentalto identifying and understanding any atmospheric circulation signals thatmay be found in ice core data. Some of the earliest and most basic stud-ies on this subject analysed the precipitation source for the Antarctic asa whole. For example, Howarth and Rayner (1986) and Peixoto and Oort(1992) both presented the results from water balance studies that suggestedthe water vapour that reaches the Antarctic as precipitation comes from theapproximate region of 8-40◦S. Petit et al. (1991) agreed that the subtrop-ics are an important source of moisture for central and eastern Antarcticafrom their models of δ18O and δD in the Southern Hemisphere. These find-ings, however, are hard to justify meteorologically given that storms in theSouthern Hemisphere are unlikely to reach the Antarctic from north of 40◦S

18 Andrew Russell, Glenn R. McGregor
(see Section 2). These source study results are also largely in disagreementwith the low resolution GCM (8◦ × 10◦) based findings of Delaygue et al.(2000b), who reported that moisture from 30-60◦S plays a significant rolein the precipitation climatology of Antarctica as a whole. Bromwich (1988),in a paper summarising southern high-latitude snowfall, importantly notesthat sufficient water evaporates in the region bounded by the 62◦S paral-lel and the mean sea ice extent (SIE) to account for all of the precipitationthat falls over Antarctica. There is obviously a contention here that requiresfurther investigation.
4.2 Precipitation source studies considering specific Antarctic sites
Studies from individual sites give a different view, for example, Bromwichand Weaver (1983) investigated the δ18O record for 1974 from the coastalstation Syowa (69◦S, 39◦E). They inferred, from examining the δ18O rela-tionship with sea surface temperature (SST) and SIE, that the moisturesource was around 55-58◦S. Turner et al. (1995) have examined the pre-cipitation source for the Rothera station, located on the western AntarcticPeninsula: using meteorological observations and satellite imagery for a oneyear period, they concluded that half of the cyclones that deliver precipita-tion to Rothera develop south of the 60◦S parallel. The importance of suchunderstanding is highlighted by Schlosser (1999) who suggested that thevariability of the position of the CPT has had a significant effect on the Neu-mayer δ18O record; for the period 1982-1991, the δ18O record implied thatthe temperature varied in the order of 5◦C whereas the observed variabilityfrom the station itself was less than 1◦C. In addition, Noone et al. (1999)studied the signals from atmospheric circulation that could be detectedin the accumulation of an Antarctic ice core from DML. They concludedthat the glaciological record is connected to global atmospheric circulationcharacteristics and could, thus, be used as a tool in reconstructing past at-mospheric circulation changes. This hypothesis will generally only hold forcoastal ice cores sites as these reflect the high variability of the atmosphericcirculation in the CPT much more directly than central Antarctica wherethe “isotopic thermometer” is more reliable (Delaygue et al., 2000a). Simi-lar to Turner et al. (1995), Marshall et al. (1998) tracked cyclones between45-135◦W and south of 50◦S in the ERA-15 data to compile a climatologyof precipitation delivery to the southern Antarctic Peninsula. Of particularinterest, given the focus of the following section, they also found that pre-cipitation events delivered by northerlies were detectable in short ice coresfrom the region due to spikes in the acidity of the snow delivered by thosecyclones. McMorrow et al. (2002) successfully applied a similar methodol-ogy to identify precipitation event signals in the Law Dome ice core for anumber of events during the 1999/2000 austral summer. Elsewhere, Ciaiset al. (1995) concluded, from a study of snow deuterium excess data froma South Pole snow pit and a 1-D isotopic model, that the dominant mois-ture source was 20-40◦S. This result, like those discussed in Section 4.1,

Southern Hemisphere atmospheric circulation 19
again seems unsound given the prevailing atmospheric circulation in this re-gion. However, it is not inconceivable when considering the vapour transportacross the Southern Oceans; Bromwich (1988) suggests that water balancestudies “do not describe the behaviour of moist air parcels, but rather thenet effect of water substance change within an atmospheric volume” and asimilar observation could be made of δ18O studies when they are used toidentify precipitation sources. Despite this, Masson-Delmotte et al. (2003)have combined the isotope record for 1934-1992 from Law Dome with anisotope-GCM to interpret the fluctuation therein. This method uncoveredan abrupt shift in meridional circulation during the 1970s.
In view of the above, it is suggested that the study of air parcels wouldprove more fruitful with respect to the aim of identifying precipitationsources for Antarctic ice core sites. In identifying how far back these airparcels should be tracked, it is of note that Simmonds and Keay (2000a)have shown that the average lifetime of depressions around the Antarctic is3-4 days. Further, Reijmer and van den Broeke (2001) used back trajecto-ries and associated moisture data from the ERA-15 data to conclude thatmost of the moisture uptake for precipitation at DML in 1998 occurred 3-5days before the event. These are the only published attempts to identify thelocation of moisture uptake for Antarctic precipitation events and they im-ply that the 5 days preceding a precipitation event represents a physicallyrealistic time frame for identifying precipitation sources via atmosphericanalyses such as back trajectories.
Reijmer et al. (2002) have analysed air parcel back trajectories, runfor 5 days, for a number of ice core sites, mainly from eastern Antarctica.Looking at the mean trajectories associated with “significant” precipitationevents, they found that the main moisture sources for all their sites werelocated in the latitude range of 50-60◦S from the nearest ocean to the westof the site in question. In a similar back trajectory analysis, Harris (1992)has also demonstrated the dominance of westerlies for air parcels arrivingat the South Pole. Simmonds et al. (2003) used back trajectories run for4-days from two coastal sites at 90◦W and 90◦E to show that most airmasses originated from the west and from south of 60◦S and 50◦S respec-tively for the two sites, a result that is in agreement with the observationsof Turner et al. (1995). Whilst these studies are important for beginningto understand the sources of the precipitation that comprise Antarctic icecores, they do not examine individual, or categories of, trajectories deliver-ing precipitation to the sites. That said, much of the Antarctic precipitationregime is driven by a rather homogeneous westerly circulation related to theCPT. Taking this into consideration, Russell et al. (2004) analysed ERA-15driven back trajectories for precipitation events (and over the climatologicaltimescale) at Dolleman Island, eastern Antarctic Peninsula. The accuracy ofsome of these precipitation bearing back trajectories was also investigatedand deemed good via a number of AVHRR image based case studies (Russellet al., 2008). Using cluster analysis to identify distinct precipitation deliverymechanisms from the back trajectories, Russell et al. (2004) uncovered two

20 Andrew Russell, Glenn R. McGregor
Fig. 5 Composite back trajectory (BT) patterns for the Dolleman Island BTsassociated with: a) the significant precipitation events; and b) the BT climatology.The BT patterns have been numbered so that BT1 has the most eastern originand the highest numbered BT has the most western origin. Source: Russell et al.(2004).
major mechanisms of note (Figure 5). Firstly, they demonstrated that west-erlies were prevalent under conditions of a deep circumpolar trough, which,in turn, can be related to a positive SAM index. This is a result that wouldhave been predictable given knowledge of the prevailing atmospheric circu-lation conditions in this region as discussed above. The second mechanismwas related to the southward migration of the South Pacific convergencezone (SPCZ) during El Nino events, which leads to blocking west of theAntarctic Peninsula, thus allowing easterlies to dominate precipitation de-livery at Dolleman Island — this is an unusual direction of precipitationdelivery for an Antarctic site and occurs due to the interaction of the SPCZand the physical barrier of the Peninsula. We will discuss later how theseprecipitation delivery mechanisms can be linked to ice core data.
Over shorter timescales, Helsen et al. (2006) have applied observations,back trajectory analyses, GCM and isotopic modelling to individual pre-cipitation events at DML, which were themselves diagnosed using snow pitdata. Their primary findings show that most of the moisture was derivedfrom the southern Atlantic Ocean and that most of the isotopic depletion oc-curred during the final day of transport. However, this work also highlightsthe ability to perform such analyses for individual precipitation events andHelsen et al. (2007) have applied a similar method over larger areas of theAntarctic. Schlosser et al. (2008) have looked at d in surface snow in relationto its source, which was identified using back trajectories, and found thatthe change in moisture source influenced a phase lag between d and δ18Owhich has important implications for ice core climate records reconstructedfrom isotopic data. Indeed, it is worth emphasising that isotopic composi-tion is sensitive to precipitation source, a subject that has been reviewedby Masson-Delmotte et al. (2008).

Southern Hemisphere atmospheric circulation 21
5 Atmospheric Circulation Reconstructions from Ice Core Data
In this section we present a largely, though not exclusively, chronologicalreview of atmospheric circulation reconstructions from Antarctic ice coredata. Whilst similar work has been performed for the Northern Hemisphere(Mayewski et al., 1994; Appenzeller et al., 1998; Fischer, 2001, for example),we limit our review here to the Southern Hemisphere.
5.1 Early Reconstructions
Legrand and Kirchner (1988) published one of the first works specificallyidentifying atmospheric circulation signals in Antarctic ice core data. Theynoted that the concentration of Na (derived from sea-salt) in the wintersnow layer of at the South Pole was indicative of meridional transport andthat this had weakened since the early 1980s. This result is consistent witha more positive SAM index and weaker SAO, as discussed previously. Fur-thermore, in the same South Pole ice core Legrand and Feniet-Saigne (1991)found that increases in the record of MSA were concurrent with El Ninoevents over the period 1922-1984. Whilst these studies demonstrated only asimple correlation between a mode of atmospheric circulation and ice corechemistry, they set in motion the idea that Antarctic ice cores could be usedas a tool by which to reconstruct more than just proxy temperature andcomposition records. Indeed, this train of thought can be traced directly for-ward to similar work, such as Meyerson et al. (2002) who performed a verysimilar analysis to Legrand and Feniet-Saigne (1991), again, for MSA in theSouth Pole ice core. Considering the details of these results, one mechanismoften proposed to be the driving force of the MSA-ENSO link is the im-pact that El Nino has on the SIE around Antarctica. For example, Curranet al. (2003) have shown how the concentration of MSA in an ice core fromLaw Dome is clearly correlated with SIE in that region. Wolff et al. (2003)agreed with this hypothesis — MSA is derived from DMS, which is releasedbiogenically from the oceans and this link, therefore, appears logical. Morerecently still, though, Abram et al. (2007) have shown that the MSA-SIE re-lationship breaks down in the Weddell Sea area of Antarctica — they showthat when “cold offshore wind anomalies” dominant they not only increaseSIE production but also decrease MSA delivery. If, as has been shown byHarangozo (2000, 2006) and Kwok and Comiso (2002a), SIE is itself linkedto ENSO related atmospheric circulation anomalies, then this completes theconnection between MSA and ENSO. However, there are two points worthbearing in mind: firstly, that Pasteur and Mulvaney (1999, 2000) and Cur-ran et al. (2002) have shown that MSA can migrate within ice in both thelaboratory and Antarctic ice cores; and secondly, that SIE-ENSO links havebeen questioned with these unlikely to be consistent around the entire coastof the Antarctic (Carleton, 1989). Indeed, Fundel et al. (2006) examinedthe extreme MSA years found in a core from DML alongside NNR reanal-ysis fields, taking into account the potential MSA migration, and found no

22 Andrew Russell, Glenn R. McGregor
direct link with El Nino events. Nevertheless, they did show that the MSAepisodes were likely to be related to the Antarctic Dipole (ADP), which,as described in Section 2.5, is an oceanic phenomenon. This link was madebecause of the clear 13.9 year MSA period throughout the 2000 year longrecord — the ADP also has a similar length period. Furthermore, this workshowed that the years 1200-1600AD were distinctive because of efficientatmospheric transport, which Fundel et al. (2006) believe is linked with aprominent ADP.
An alternative method of atmospheric circulation reconstruction, pio-neered by Peel and Mulvaney (1992), required individual species or groupsof species in the ice core data to be linked to specific precipitation deliverymechanisms. They used δ18O, δD, Cl and nssSO4 data from the DollemanIsland ice core for the period 1795-1985 to draw inferences regarding the na-ture of atmospheric moisture transport paths. Their results, however, couldbe questioned with respect to one of their assumptions: that increases insea-salt derived ions, such as chloride (Cl), are an indication of increasedopen sea. It has since been argued that much of the sea-salt in this regionis derived from “frost flowers” that form on new sea ice (see Section 3.2).Despite this, the work still represents an important methodological advance.
Enomoto (1991), on the other hand, discovered significant correlationsbetween accumulation data from South Pole, Dome C and Law Dome andSLP observations from stations located between 40-50◦S. This allowed areconstruction of SLP for this region to be created for a 100 year window.Spectral analysis of this reconstruction shows a 20-30 year period, which, itwas proposed, is due to an oscillation feature of the wave-number zero SLPvariation but this could equally be related to the sparseness of the inputobservations.
5.2 More recent/advanced reconstructions
Kreutz et al. (1997) used the assumption that the concentrations of sea saltions (i.e. Na, Mg, Cl and K) are proportional to the level of meridionaltropospheric transport. This was used to infer that circulation of this typereaching the Siple Dome core site (149◦W, 82◦S) increased around the startof the little ice age (LIA) i.e. around 1400AD. They also believe that cir-culation conditions similar to those in the LIA have persisted into the 20thCentury. Again, this is a very simple but conceptually strong method ofinferring past atmospheric circulation characteristics. However, it should benoted that terms like the LIA and the medieval warm period (MWP) areoften discussed as being of limited utility due to their temporal and spatialirregularity (Jones and Mann, 2004).
More recently, Goodwin et al. (2004) have found a significant anticorre-lation between the “early winter” (i.e. May, June and July) concentrationof Na from the Law Dome ice core and SAM related MSLP patterns fromthe NNR and approximately 60 years of meteorological station data from

Southern Hemisphere atmospheric circulation 23
Fig. 6 Anomalies from the 1950–1995 mean (dashed line) of the Na early winterdata from Law Dome for 1300–1995. MSLP anomalies for the southwest Pacificregion (Campbell Island and Macquarie Island) are shown on the right-hand axis.Source: Goodwin et al. (2004).
the south Indian and south-west Pacific Ocean regions. This Na link is,again, assumed to be driven by changes in meridional transport. From thissimple but relatively robust relationship, the authors have reconstructed awell calibrated “early winter” SAM for the last 700 years (Figure 6). Theirrecord shows that the SAM was more negative before 1600AD than it hasbeen during the last 400 years. It also includes the recent positive SAMtrend discussed in Section 2. Furthermore, spectral analysis of the proxySAM shows periods of variability mainly associated with ENSO but also astrong 10.5 year period in the early record and 23 year period in the latter.Whilst discussing possible links to the solar cycle with similar periods ofvariation, Goodwin et al. (2004) concede that there is no clear evidence tojustify such a link.
The reconstruction of such circulation indices is a particularly power-ful tool, as also demonstrated by Jones and Widmann (2003, 2004) whohave produced a SAM index for early summer, reconstructed from South-ern Hemisphere tree-ring (1743–2000) and station (1905–2000) data. Treering data has limitations (i.e. non-SAM factors cannot be separated outfrom the data) but both reconstructions capture recent peaks in the indexaround 1960 and 2000, a period of high variation between 1880-1900 andshow that the current SAM trend is not unparalleled over longer time scales.
Kreutz and Mayewski (1999) presented a review of the spatial distri-bution of glaciochemistry over Antarctica and considered the implicationsfor palaeoatmospheric circulation reconstruction. Their main conclusionsregarding the circulation characteristics that are associated with differentspecies were that: nitrate concentration reduces with increased accumula-tion; Ca, K and Mg are derived from terrestrial dust or exposed bedrock onthe Antarctic or South America (indicating either changes in atmosphericcirculation to incorporate these features or changes in SIE); and that MSAcan be a proxy for SIE (as discussed in Section 5.1), ocean productivityor ENSO. They were also one of the first to perform an EOF analysis onAntarctic ice core data4 and uncovered five EOFs of note from the SipleDome data. They also attempted to assign atmospheric delivery charac-
4 Reusch et al. (1999) also performed an EOF analysis in the same year on aseries of cores from near Byrd.

24 Andrew Russell, Glenn R. McGregor
teristics to each of these EOFs, albeit quite basically. The EOF analysisworked particularly well for this ice core and the EOFs show interestingand distinct glaciochemical variability — this is driven largely by changesto the Amundsen Sea Low (ASL) — and they found that the majority ofsea-salt is transported to the site in spring (SON), depending on regionalcirculation strength. This analysis was extended by Kreutz et al. (2000) toinclude more detailed examination of atmospheric data (EOP) as well asSIE and meteorological station data. They found that MSLP from EOPshowed a close relationship with the strength of the ASL, as Kreutz andMayewski (1999) inferred it would. As, at the time, there was only a 10year overlap between the ice core data and EOP, Kreutz et al. (2000) usedstation data from the Australia/New Zealand and South America/AntarcticPeninsula regions to construct a spring trans-polar index (STPI), similar tothe TPI of Pittock (1980), back to 1903. This was done so that there wasa much longer overlap between the ice core and a representation of ASLfor calibration. They found that their EOF1 from the Siple Dome data wassignificantly, if not strongly (r=0.32), correlated with the STPI. Therefore,EOF1 was treated as an indicator of Amundsen Sea region MSLP variabil-ity over the past 1150 years. This reconstruction displayed periodicities of3.3 and 3.7 years, which implies a link to ENSO and that this relationshipchanged during the 1400-1900AD interlude; a similar finding was made byKreutz et al. (1997). As discussed in Section 2, an anomalously deep ASLis linked with ENSO variability — albeit to temporally changeable degrees(Cullather et al., 1996) — so these findings appear to be sound and justifi-able.
A similar method was used by Souney et al. (2002) for a 700 year corefrom Law Dome, east Antarctica. This study found a dominant EOF thatwas linked to some characteristic of atmospheric circulation, i.e. that sea-salt concentration for the June layer in the core is related to winter circu-lation “intensity”. This led them to conclude that the most intense wintercirculation occurred during the 19th Century and the least intense duringthe 18th Century. Whilst their meteorological analysis does show signifi-cant correlations with over half of the June datasets from the 20 Antarcticstations they examined (and some links with meridional pressure gradientsfrom the NNR), these were quite basic analyses. It is also worth noting thatthese links rely on the sea-salt derived species that dominated their EOF1and that the origin of sea-salt has been questioned (see Section 3.2). Indeed,Souney et al. (2002) and others (Legrand and Delmas, 1984; Prospero et al.,1991; Whitlow et al., 1992; Mulvaney and Wolff, 1994; Curran et al., 1998;Hall and Wolff, 1998; Kreutz et al., 1998; Wagenbach et al., 1998, for exam-ple) all show that sea-salt in ice cores peak in winter when sea-ice growthis at a maximum. Therefore, it appears that the “frost flower” source ofsea-salt in ice cores is feasible and that many atmospheric circulation re-constructions should be re-examined, as Rankin et al. (2004) suggest.
Mayewski et al. (2004) examined the Siple Dome ice core data along-side two other Antarctic cores (South Pole and Law Dome). Their analysis
Southern Hemisphere atmospheric circulation 25
compared the 700 year Siple Dome record with the two dominant patterns(or EOFs) of Southern Hemisphere atmospheric circulation, as identified byThompson and Wallace (2000) and Thompson and Solomon (2002). EOF1 of the 850 hPa pressure field represents the SAM (see Section 2.3) whilstEOF 2 describes a pressure “seesaw” between the South Pacific and Antarc-tica/South Atlantic. EOF 2 is driven by the ENSO cycle (see Section 2.5)and impacts on the position and strength of the Amundsen Sea Low (ASL).Proxies of SLP from the ice cores show that the period 1700-1850AD de-parted from the usual pattern seen over the 700 year record studied: theydescribe a switch from the “out-of-phase alternation of multi-decadal longphases of EOF1 and EOF2 modes of the 850hPa field” to a lower tropo-spheric circulation regime characterised by “in-phase behaviour of the ofthe ASL component of EOF2 and the East Antarctic High component ofEOF1” during this period. This obviously has implications for the atmo-spheric circulation patterns delivering precipitation to these sites and theyare also able to discuss a rise in temperature at Siple Dome during the 19thCentury and its relationship with an increased frequency of El Nino eventspenetrating as far south as the pole during this period.
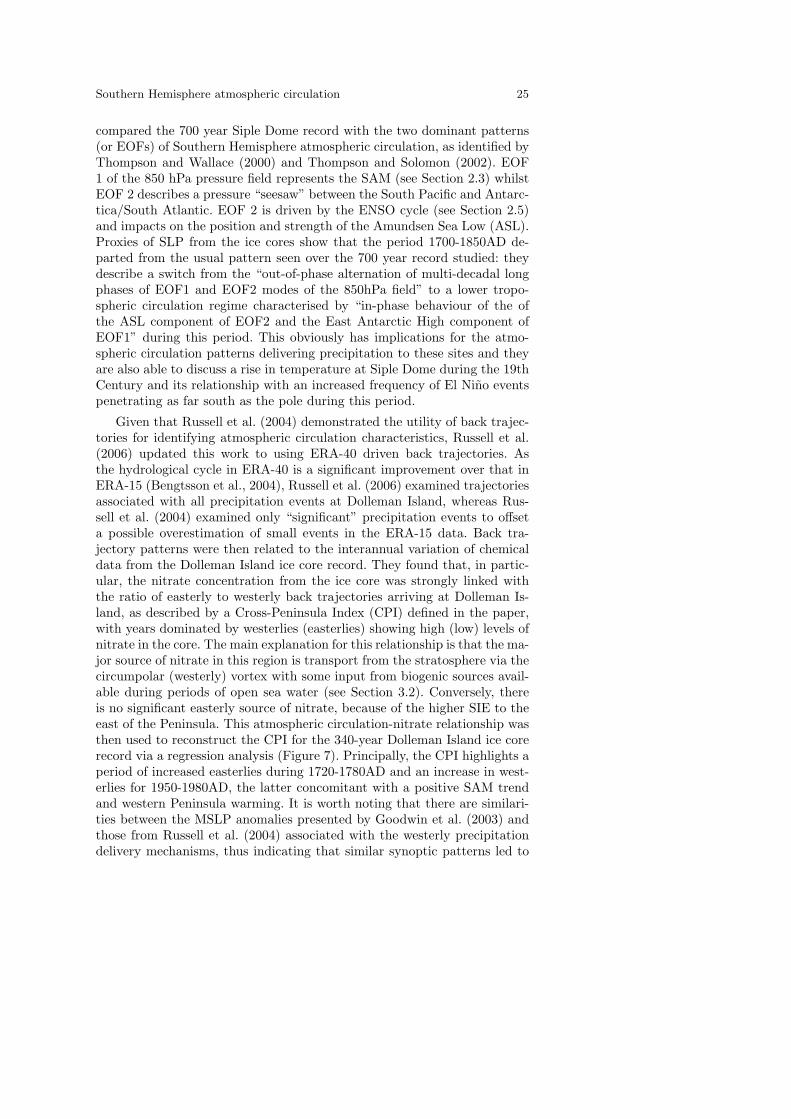
Given that Russell et al. (2004) demonstrated the utility of back trajec-tories for identifying atmospheric circulation characteristics, Russell et al.(2006) updated this work to using ERA-40 driven back trajectories. Asthe hydrological cycle in ERA-40 is a significant improvement over that inERA-15 (Bengtsson et al., 2004), Russell et al. (2006) examined trajectoriesassociated with all precipitation events at Dolleman Island, whereas Rus-sell et al. (2004) examined only “significant” precipitation events to offseta possible overestimation of small events in the ERA-15 data. Back tra-jectory patterns were then related to the interannual variation of chemicaldata from the Dolleman Island ice core record. They found that, in partic-ular, the nitrate concentration from the ice core was strongly linked withthe ratio of easterly to westerly back trajectories arriving at Dolleman Is-land, as described by a Cross-Peninsula Index (CPI) defined in the paper,with years dominated by westerlies (easterlies) showing high (low) levels ofnitrate in the core. The main explanation for this relationship is that the ma-jor source of nitrate in this region is transport from the stratosphere via thecircumpolar (westerly) vortex with some input from biogenic sources avail-able during periods of open sea water (see Section 3.2). Conversely, thereis no significant easterly source of nitrate, because of the higher SIE to theeast of the Peninsula. This atmospheric circulation-nitrate relationship wasthen used to reconstruct the CPI for the 340-year Dolleman Island ice corerecord via a regression analysis (Figure 7). Principally, the CPI highlights aperiod of increased easterlies during 1720-1780AD and an increase in west-erlies for 1950-1980AD, the latter concomitant with a positive SAM trendand western Peninsula warming. It is worth noting that there are similari-ties between the MSLP anomalies presented by Goodwin et al. (2003) andthose from Russell et al. (2004) associated with the westerly precipitationdelivery mechanisms, thus indicating that similar synoptic patterns led to

26 Andrew Russell, Glenn R. McGregor
Fig. 7 The Cross-Peninsula Index (CPI) calculated from: a) the frequency of BTpatterns (CPIBT ; heaviest solid line); b) a regression of the 1993 ice core chemicalspecies onto the CPIBT (CPI93; thinnest solid line); and c) the regression equationapplied to the chemical species from the 1985 ice core (CPI85; dashed line). Themedium solid line shows the 10-point moving average of the CPI85. The bars aboveand below the plot represent the timings of moderate (thin bar), strong (mediumbar) or very strong (thick bar) El Nino events (top) and SAM years (bottom).Source: Russell et al. (2006)
the entrainment of nitrate to Dolleman Island and Wilkes Land — the sitestudied by Goodwin et al. (2003). However, a long calibration was not pos-sible in the Russell et al. (2006) analysis due to a short temporal overlapbetween the Dolleman Island ice core data (drilled in 1993) and the reliableperiod of ERA-40 data in the high southern latitudes i.e. from 1979 onwardswhen satellite data started being assimilated (Bromwich and Fogt, 2004;Dell’Aquila et al., 2007). Furthermore, there are known post-depositionalproblems relating to the nitrate concentration in ice cores (Mulvaney et al.,1998, for example). This is less of a problem at higher accumulation sites,such as those on the Peninsula, where clear seasonal cycles remain in nitrateprofiles and the re-emission of nitrate accounts for a loss of only around athird. Considering this data over the annual timescale, the relative changesyear to year will be discernable but there may still be some influence onthe reconstructed CPI. Even so, the findings of Russell et al. (2006) are ofconsiderable interest given the very strong correlations over the overlap pe-riod: r=0.74 (-0.75) for NO3 concentration versus the frequency of westerlies(easterlies).
Xiao et al. (2004) have analysed a 250 year long ice core from PrincessElizabeth Land and found that EOF1 of the data described the majority ofthe variability of sea-salt. Furthermore, their EOF1 was also shown to besignificantly, negatively correlated with instrumental records of MSLP fromtwo Southern Indian Ocean (SIO) stations and a reconstruction of MSLP

Southern Hemisphere atmospheric circulation 27
Fig. 8 Na data from the LGB65 ice core (right hand axis, scale reversed) plottedwith the reconstructed summer transpolar index (STPI; Villalba et al. (1997))and the first EOF of the LGB65 data (left hand axis). A 10-year smoothing wasapplied to all data. The triangles show Na peaks. Source: Xiao et al. (2004).
from sub-Antarctic tree-rings (Villalba et al., 1997). This allowed Xiao et al.(2004) to deduce periods of strong and weak SIO low linked to a shifting ofthe polar vortex (Figure 8). Given that this variability has an approximately21 year period, the authors speculate that it is linked with the 22 year solarHale cycle.
Reusch et al. (1999) have analysed and interpreted a series of 4 short(approximately 40 years of accumulation) ice cores from near Byrd sta-tion, west Antarctica, that were separated by only 200km in total. Whilstthis multisite technique represents an interesting methodological advance,the circulation reconstruction presented in this work was basic: they iden-tified two EOFs of note — marine sea-salt influenced winter air massesand biogenically and stratospherically influenced summer air masses. Thesemechanisms were shown to be consistent between sites despite average con-centration and accumulation not being so. Therefore, over the four sites, thelarge scale atmospheric circulation delivering precipitation is assumed to beuniform and imposed upon the synoptic and mesoscale spatial variability.Again conducting a multisite analysis, Reusch et al. (2005) used a neuralnetworks technique in order to define transfer functions between synopticweather patterns (from ERA-15 and AWS data) and annual accumulationand major ion chemistry from the same four relatively short Antarctic icecores. They present an atmospheric circulation reconstruction from the shortice cores using this method and, despite noise related problems, they believethat the results are acceptable and that neural networks represent a usefultool in the upscaling of ice core data to synoptic conditions.
5.3 Reconstructions using dust
The size and concentration of dust particles found in ice cores have alsobeen used on a number of occasions to make inferences regarding atmo-spheric circulation and climate forcings on a larger scale. Indeed, Fischeret al. (2007) have reviewed the sources, transport, and deposition of dust

28 Andrew Russell, Glenn R. McGregor
in ice cores over glacial-intergalcial timescales. To give a flavour of suchwork, we can look to Delmotte et al. (2005) who have uncovered a 200 yearoscillation between layers of course and fine dust in two eastern AntarcticHolocene ice cores — Vostok and Dome C — albeit, out of phase for thetwo cores. The authors justify the assumptions that course dust is derivedfrom the lower and mid-troposphere, fine dust from the upper-troposphereand that the overall mass of dust is an indication of mid- to high-latitudeSouthern Hemisphere pressure gradient i.e. the SAM. Combining these hy-potheses with the observed out of phase oscillations in dust from the cores,Delmotte et al. (2005) believe that this is evidence for a gradual reduc-tion in polar vortex eccentricity, driving an atmospheric circulation dipoleover the eastern Antarctic region. It is also speculated that this 200 yearmode is related to changes in solar activity. Interestingly, Delmotte et al.(2004) have reported that dust input was constant during the Last GlacialMaximum (LGM), implying a change in atmospheric circulation patternsbetween the LGM and the Holocene. This conclusion is partly supportedby the multi-model climate simulations of Justino and Peltier (2008).
Over longer timescales, Mayewski et al. (1996) have inferred atmosphericcirculation change signals during the last deglaciation recorded in an icecore from Taylor Dome. They assumed that the amount of terrestrial dustin the core is related to the “scale” of the atmospheric circulation cell.They concluded that the meridional circulation necessary to carry this dustto Antarctica was not present during the period 10000-14600 years beforepresent. It was also proposed that rapid climate changes had occurred morefrequently for the Antarctic than previously thought.
Narcisi et al. (2005), on the other hand, utilized volcanic eruption derivedtephra layers from the Dome C core to conclude that circumpolar westerlieshave prevailed in the Southern Hemisphere over the past 200000 years.However, these and similar results (Basile et al., 2001, for example) arepotentially of limited use for palaeoatmospheric reconstructions as the datais only available for the irregular instances of volcanic eruptions and arestrongly dependant on the eruption strength and location.
6 Summary and Future Directions
6.1 Overview
In this review we have shown how an understanding of the atmosphericcirculation regimes in the Southern Hemisphere benefits our perspective onAntarctic climate change. By combining this with knowledge of ice coredata, this has allowed us to not only consider the context of the currentAntarctic climate but also to draw conclusions on how atmospheric circula-tion may have changed over periods longer than observations are available.We have reviewed many of these palaeoatmospheric circulation reconstruc-tions undertaken for the Antarctic; the major findings of which are summa-rized in Figure 9. Furthermore, comparing Figure 9 with Figure 10, which
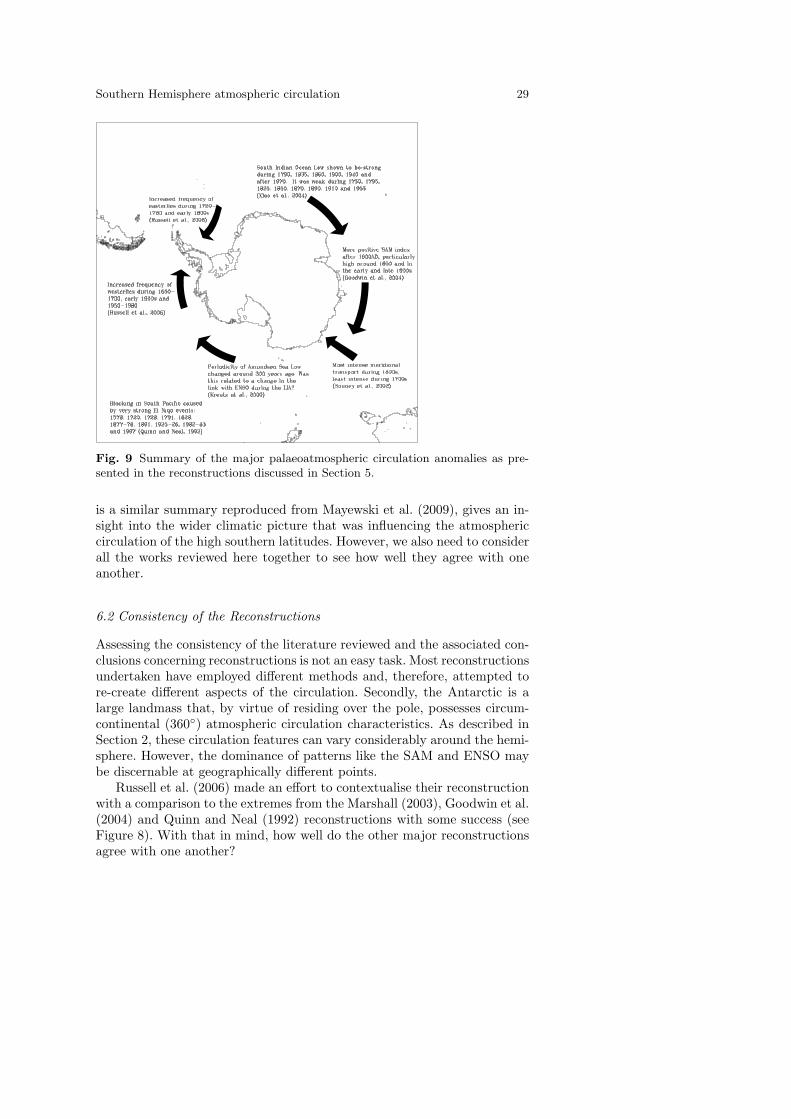
Southern Hemisphere atmospheric circulation 29
Fig. 9 Summary of the major palaeoatmospheric circulation anomalies as pre-sented in the reconstructions discussed in Section 5.
is a similar summary reproduced from Mayewski et al. (2009), gives an in-sight into the wider climatic picture that was influencing the atmosphericcirculation of the high southern latitudes. However, we also need to considerall the works reviewed here together to see how well they agree with oneanother.
6.2 Consistency of the Reconstructions
Assessing the consistency of the literature reviewed and the associated con-clusions concerning reconstructions is not an easy task. Most reconstructionsundertaken have employed different methods and, therefore, attempted tore-create different aspects of the circulation. Secondly, the Antarctic is alarge landmass that, by virtue of residing over the pole, possesses circum-continental (360◦) atmospheric circulation characteristics. As described inSection 2, these circulation features can vary considerably around the hemi-sphere. However, the dominance of patterns like the SAM and ENSO maybe discernable at geographically different points.
Russell et al. (2006) made an effort to contextualise their reconstructionwith a comparison to the extremes from the Marshall (2003), Goodwin et al.(2004) and Quinn and Neal (1992) reconstructions with some success (seeFigure 8). With that in mind, how well do the other major reconstructionsagree with one another?

30 Andrew Russell, Glenn R. McGregor
Fig. 10 “Main climatic events of the last 12,000 years: the Antarctic context.NH, Northern Hemisphere; SH, Southern Hemisphere; WA, West Antarctica; EA,East Antarctica; MDV, McMurdo Dry Valleys.” The reader is referred to thesource paper for details on how this summary was compiled. Source: Mayewskiet al. (2009).
As mentioned above, the reconstructions vary in their presentation of re-sults as qualitative or quantitative. This makes their intercomparison trou-blesome. There appears to be some agreement that Southern Hemisphereatmospheric circulation characteristics were perturbed in some way duringthe LIA but discussion of what each analysis found is not easy given theoften rudimentary meteorological language that is used — this is, of course,often forced by the long timescales that are being considered. Whilst it isdisappointing to conclude that a measure of consistency between studies isalmost impossible to gauge, this is hopefully something that will becomemore of a focus in the future as meteorologists and glaciologists work to-gether more closely, as appears to have started to happen recently, particu-larly with the efforts of the Scientific Committee on Antarctic Research —see Mayewski and Goodwin (2008), for example. However, this inconsistentoutput perhaps also explains why palaeoatmospheric circulation reconstruc-

Southern Hemisphere atmospheric circulation 31
tions were almost completely absent from the discussion within the IPCCAR4 (IPCC, 2007).
In this respect it is important to revisit the major questions raised by thisreview as these in many ways set the context for future research directions.In summary these questions are:
– What are the sources of precipitation for different sites? (Section 4)– How reliable are the datasets being used to analyse the recent atmo-
spheric circulation? (Section 2)– How trustworthy are ice core based atmospheric circulation reconstruc-
tions when analyses of recent circulation regimes are relatively uncer-tain? (Section 2)
– What are the mechanisms driving the SAM and how can our under-standing of its recent state be improved? (Section 2.3)
– What are the sources of aerosol in the ice? (Section 3.2)– What is the relationship between MSA, ENSO and SIE? (Section 5.1)– Is there any evidence of post-depositional migration of species within ice
and can such problems be worked with? (Section 5)– How reliable is ice core data, particularly if we attempt to look at sea-
sonal timescales? (Section 5)– How can we resolve issues caused by the spatial variability of ice core
data? (Section 5)
6.3 Future Directions
To significantly advance our understanding of Antarctic precipitation sourcesa network of ice cores from higher accumulation western Antarctic andPeninsula sites, that receive precipitation from a wide area of sources, needsto be secured. Such multisite cores should be analysed at high resolution inorder to allow for seasonal analyses, which are necessary to identify patternslike the SAO within ice core data. It appears from the analysis of Russellet al. (2004) that the eastern Antarctic Peninsula, and its southern extent,are good potential sites for such work. It is also suggested that back tra-jectory analyses from other sites near the Peninsula should be conductedto find the best region for new work before drilling is initiated. This alsoraises the issue that most of the ice core data that is currently available isfrom Eastern Antarctica — a much greater understanding of the WesternAntarctica is required and this should be reflected in the planning of futureice core drilling programmes.
Detailed atmospheric circulation analyses for established ice core sitesshould be performed in order to assess the impact of circulation changes onboth the isotopic thermometer for these sites and the potential for recon-structing meteorological characteristics of the precipitation delivery mecha-nisms. This is starting to become more common in isotopic analyses (Helsenet al., 2007; Masson-Delmotte et al., 2008, for example) but it is important

32 Andrew Russell, Glenn R. McGregor
that links are established and maintained between the ice core and meteoro-logical communities in order to achieve the most robust and comprehensiveresults possible from the data that is extracted, at considerable effort, fromfuture and past ice cores. It is also important that the findings of such workare discussed in the context of previous reconstructions, something that hasnot been a feature of past work, as highlighted in our Section 6.2.
Finally, it is unequivocal that anthropogenic influences on atmosphericcomposition are changing global climate (IPCC, 2007). However, the non-linear effects related to circulation changes (Palmer, 1999; Corti et al., 1999,for example) are also of paramount importance, especially in the southernhigh-latitudes (Marshall et al., 2006). As such, any rigorous circulation re-constructions that can be deduced from palaeoclimatic observations will beof importance in the validation of climate simulations, which are often foundwanting in their representation of circulation changes (IPCC, 2007). Mod-elling studies, such as Fyfe et al. (1999) and Lynch et al. (2006), have alreadyshown important results derived from such changes in circulation — it is im-portant that such work is continued and that palaeoatmospheric circulationreconstructions are used as a valuable context for modelling studies.
Acknowledgements We are grateful to the Natural Environment Research Coun-cil’s (NERC) British Antarctic Survey (BAS) who provided some financial andcomputational support for this work. Dr. Gareth J. Marshall and Dr. Rob Mul-vaney (BAS) are acknowledged for their helpful comments on earlier drafts of thispaper. The anonymous reviewers of this paper also require acknowledgement fortheir constructive comments. Some of this work was supported by the Universityof Birmingham via a School of Geography, Earth and Environmental SciencesPhD studentship.
References
Abram, N. J., R. Mulvaney, E. W. Wolff and M. Mudelsee (2007), ‘Icecore records as sea ice proxies: an evaluation from the Weddell Searegion of Antarctica’, Journal of Geophysical Research 112, D15101,doi:10.1029/2006JD008139.
Appenzeller, C., T. F. Stocker and M. Anklin (1998), ‘North Atlantic Oscil-lation dynamics recorded in Greenland ice cores’, Science 282, 446–449.
Basile, I., J. R. Petit, S. Touron, F. E. Grousset and N. Barkov (2001),‘Volcanic layers in Antarctic (Vostok) ice cores: Source identifica-tion and atmospheric implications’, Journal of Geophysical Research106(D23), 31915–31931.
Bengtsson, L., K. I. Hodges and S. Hagemann (2004), ‘Sensitivity of large-scale atmospheric analyses to humidity observations and its impact onthe global water cycle and tropical and extratropical weather systems inERA40’, Tellus 56A, 202–217.

Southern Hemisphere atmospheric circulation 33
Bertler, N. A. N., P. J. Barrett, P. A. Mayewski, R. L. Fogt, K. J. Kreutzand J. Shulmeister (2004), ‘El Nino suppresses Antarctic warming’, Geo-physical Research Letters 31, L15207, doi:10.1029/2004GL020749.
Bradley, R. S. (1999), Palaeoclimatology: reconstructing climates of the Qua-ternary, 2nd edn, Academic Press, San Diego.
Bromwich, D. H. (1988), ‘Snowfall in high southern latitudes’, Reviews ofGeophysics 26, 149–168.
Bromwich, D. H., A. N. Rogers, P. Kallberg, R. I. Cullather, J. W. C. Whiteand K. J. Kreutz (2000), ‘ECMWF analyses and reanalyses depiction ofENSO signal in Antarctic precipitation’, Journal of Climate 13, 1406–1420.
Bromwich, D. H. and C. J. Weaver (1983), ‘Latitudinal displacement frommain moisture source controls δ18O of snow in coastal Antarctica’, Nature301, 145–147.
Bromwich, D. H. and R. L. Fogt (2004), ‘Strong trends in the skill of theERA-40 and NCEP/NCAR reanalyses in the high and middle latitudes ofthe Southern Hemisphere, 1958-2001’, Journal of Climate 17, 4603–4619.
Carleton, A. M. (1989), ‘Antarctic sea-ice relationships with indices of theatmospheric circulation of the Southern Hemisphere’, Climate Dynamics3, 207–220.
Carleton, A. M. (2003), ‘Atmospheric teleconnections involving theSouthern Ocean’, Journal of Geophysical Research 108(C4), 8080,doi:10.1029/2000JC000379.
Chapman, W. L. and J. E. Walsh (2007), ‘A synthesis of Antarctic temper-atures’, Journal of Climate 20, 4096–4117.
Ciais, P., J. W. C. White, J. Jouzel and J. R. Petit (1995), ‘The origin ofpresent-day Antarctic precipitation from surface snow deuterium excessdata’, Journal of Geophysical Research 100(D9), 18917–18927.
Comiso, J. C. (2000), ‘Variability and trends in Antarctic surface tempera-tures from in situ and satellite infrared measurements’, Journal of Climate13, 1674–1696.
Connolley, W. M. (1997), ‘Variability in annual mean circulation in thesouthern high latitudes’, Climate Dynamics 13, 745–756.
Connolley, W. M. (2002), ‘Long-term variation of the Antarctic Cir-cumpolar Wave’, Journal of Geophysical Research 108(C4), 8076,doi:10.1029/2000JC000380.
Corti, S., F. Molteni and T. N. Palmer (1999), ‘Signature of recent climatechange in frequencies of natural atmospheric circulation regimes’, Nature398, 799–802.
Cullather, R. I., D. H. Bromwich and M. L. van Woert (1996), ‘Interannualvariations in the Antarctic precipitation related to El Nino-Southern Os-cillation’, Journal of Geophysical Research 101(D14), 19109–19118.
Cullather, R. I., D. H. Bromwich and R. W. Grumbine (1997), ‘Valida-tion of operational numerical analyses in Antarctic latitudes’, Journal ofGeophysical Research 102(D12), 13761–13784.

34 Andrew Russell, Glenn R. McGregor
Curran, M. A. J., A. S. Palmer, T. D. van Ommen, V. I. Morgan, K. L.Phillips, A. J. McMorrow and P. A. Mayewski (2002), ‘Post-depositionalmovement of methanesulphonic acid at Law Dome, Antarctica, and theinfluence of accumulation rate’, Annals of Glaciology 35, 333–339.
Curran, M. A. J., T. D. van Ommen, V. I. Morgan, K. L. Phillips and A. S.Palmer (2003), ‘Ice core evidence for Antarctic sea ice decline since the1950s’, Science 302, 1203–1206.
Curran, M. A. J., T. D. van Ommen and V. Morgan (1998), ‘Seasonalcharacteristics of the major ions in the high-accumulation Dome SummitSouth ice core, Law Dome, Antarctica’, Annals of Glaciology 27, 385–390.
Dansgaard, W. (1964), ‘Stable isotopes in precipitation’, Tellus 16, 436–468.Delaygue, G., J. Jouzel, V. Masson, R. D. Koster and E. Bard (2000a),
‘Validity of the isotopic thermometer in central Antarctica: limited im-pact of glacial precipitation seasonality and moisture origin’, GeophysicalResearch Letters 27, 2677–2860.
Delaygue, G., V. Masson, J. Jouzel, R. D. Koster and R. J. Healy (2000b),‘The origin of Antarctic precipitation: a modelling approach’, Tellus52B, 19–36.
Dell’Aquila, A., P. M. Ruti, S. Calmanti and V. Lucarini (2007), ‘South-ern Hemisphere midlatitude atmospheric variability of the NCEP-NCARand ECMWF reanalyses’, Journal of Geophysical Research 112, D08106,doi:10.1029/2006JD007376.
Delmotte, B., J. R. Petit, G. Krinner, V. Maggi, J. Jouzel and R. Ud-isti (2005), ‘Ice core evidence for secular variability and 200-year dipolaroscillations in atmospheric circulation over East Antarctica during theHolocene’, Climate Dynamics 24, 641–654.
Delmotte, B., J. R. Petit, K. K. Andersen, I. Basile-Doelseh, V. Maggi andV. Y. Lipenkov (2004), ‘Dust size evidence for opposite regional atmo-spheric circulation changes over east Antarctica during the last climatictransition’, Climate Dynamics 23, 427–438.
Domack, E., D. Duran, A. Leventer, S. Ishman, S. Doane, S. McCallum,D. Amblas, J. Ring, R. Gilbert and M. Prentice (2005), ‘Stability of theLarsen B ice shelf on the Antarctic Peninsula during the Holocene epoch’,Nature 436, 681–685.
Doran, P. T., J. C. Priscu, W. B. Lyons, J. E. Walsh, A. G. Fountain, D. M.McKnight, D. L. Moorhead, R. A. Virginia, D. H. Wall, G. D. Clow, C. H.Fritsen, C. P. McKay and A. N. Parsons (2002), ‘Antarctic climate coolingand terrestrial ecosystem response’, Nature 415, 517–520.
Enomoto, H. (1991), ‘Fluctuations of snow accumulation in the Antarcticand sea level pressure in the Southern Hemisphere in the last 100 years’,Climatic Change 18, 67–87.
EPICA community members (2004), ‘Eight glacial cycles from an Antarcticice core’, Nature 429, 623–628.
Fischer, H. (2001), ‘Imprint of large-scale atmospheric transport patterns onsea-salt records in northern Greenland ice cores’, Journal of GeophysicalResearch 106(D20), 23977–23984.
Southern Hemisphere atmospheric circulation 35
Fischer, H., F. Traufetter, H. Oerter, R. Weller and H. Miller (2004),‘Prevalence of the Antarctic Circumpolar Wave over the last two mil-lenia recorded in Dronning Maud Land ice’, Geophysical Research Letters31, L08202, doi:10.1029/2003GL019186.
Fischer, H., M.-L. Siggaard-Andersen, U. Ruth, R. Rthlisberger and E. Wolff(2007), ‘Glacial/interglacial changes in mineral dust and sea-salt recordsin polar ice cores: sources, transport, and deposition’, Reviews of Geo-physics 45, RG1002, doi:10.1029/2005RG000192.
Fogt, R. L. and D. H. Bromwich (2006), ‘Decadal variability of the ENSOteleconnection to the high-latitude South Pacific governed by couplingwith the southern annular mode’, Journal of Climate 19, 979–997.
Fundel, F., H. Fischer, R. Weller, F. Traufetter, H. Oerter and H. Miller(2006), ‘Influence of large-scale teleconnection patterns on methane sul-fonate ice core records in Dronning Maud Land’, Journal of GeophysicalResearch 111(D4), D04103, doi:10.1029/2005JD005872.
Fyfe, J. C., G. J. Boer and G. M. Flato (1999), ‘The Arctic and Antarcticoscillations and their projected changes under global warming’, Geophys-ical Research Letters 26, 1601–1604.
Fyfe, J. C. and O. A. Saenko (2006), ‘Simulated changes in the extratropicalsouthern hemisphere winds and currents’, Geophysical Research Letters33, L06701, doi:10.1029/2005GL025332.
Garcia, R. R., H. F. Diaz, R. G. Herrera, J. Eischeid, M. D. Prieto, E. Her-nandez, L. Gimeno, F. R. Duran and A. M. Bascary (2001), ‘Atmosphericcirculation changes in the tropical Pacific inferred from the voyages ofthe Manila galleons in the sixteenth-eighteenth centuries’, Bulletin of theAmerican Meteorological Society 82, 2435–2455.
Genthon, C. and E. Cosme (2003), ‘Intermittent signature of ENSO inwest-Antarctic precipitation’, Geophysical Research Letters 30, 2081,doi:10.1029/2003GL018280.
Genthon, C., G. Krinner and M. Sacchettini (2003), ‘Interannual Antarctictropospheric circulation and precipitation variability’, Climate Dynamics21, 289–307.
Gerreaud, R. D. and D. S. Battisti (1999), ‘Interannual (ENSO) and inter-decadal (ENSO-like) variability in the Southern Hemisphere troposphericcirculation’, Journal of Climate 12, 2113–2123.
Gillett, N. P. and D. W. J. Thompson (2003), ‘Simulation of recent SouthernHemisphere climate change’, Science 302, 273–275.
Gillett, N. P., T. D. Kell and P. D. Jones (2006), ‘Regional climate impactsof the Southern Annular Mode’, Geophysical Research Letters 33, L23704,doi:10.1029/2006GL027721.
Glasser, N. F. and T. A. Scambos (2008), ‘A structural glaciological analysisof the 2002 Larsen B ice-shelf collapse’, Journal of Glaciology 53, 3–16.
Gong, D. and S. Wang (1999), ‘Definition of Antrctic Oscillation Index’,Geophysical Research Letters 26, 459–462.
Goodwin, I. D., T. D. van Ommen, M. A. J. Curran and P. A. Mayewski(2004), ‘Mid latitude climate variability in the south Indian and south-

36 Andrew Russell, Glenn R. McGregor
west Pacific regions since 1300 AD’, Climate Dynamics 22, 783–794.Goodwin, I., M. de Angelis, M. Pook and N. W. Young (2003), ‘Snow accu-
mulation variability in Wilkes Land, East Antarctica and the relationshipto atmospheric ridging in the 130◦-170◦E region since 1930’, Journal ofGeophysical Research 108(D21), 4673, doi:10.1029/2002JD002995.
Guo, Z., D. H. Bromwich and K. M. Hines (2004), ‘Modeled Antarctic pre-cipitation. Part II: ENSO modulation over west Antarctica’, Journal ofClimate 17, 448–465.
Hall, J. S. and E. W. Wolff (1998), ‘Causes of seasonal and daily varia-tions in aerosol sea-salt concentrations at a coastal Antarctic station’,Atmospheric Environment 32, 3669–3677.
Hansen, J., R. Ruedy, J. Glascoe and M. Sato (1999), ‘GISS analy-sis of surface temperature change’, Journal of Geophysical Research104(D24), 30997–31022.
Harangozo, S. A. (2000), ‘A search for ENSO teleconnections in the westAntarctic Peninsula climate in Austral winter’, International Journal ofClimatology 20, 663–679.
Harangozo, S. A. (2006), ‘Atmospheric circulation impacts on winter max-imum sea ice extent in the west Antarctic Peninsula region (1979-2001)’,Geophysical Research Letters 33, L02502, doi:10.1029/2005GL024978.
Harris, J. M. (1992), ‘An analysis of 5-day midtropospheric flow patternsfor the South Pole: 1985-1989’, Tellus 44B, 409–421.
Hartmann, D. L., J. M. Wallace, V. Limpasuvan, D. W. J. Thompson andJ. R. Holton (2000), ‘Can ozone depletion and global warming interactto produce rapid climate change?’, Proceedings of the National Academyof Sciences 97, 1412–1417.
Helsen, M. M., R. S. W. van de Wal and M. R. van den Broeke (2007),‘The isotopic composition of present-day antarctic snow in a lagrangianatmospheric simulation’, Journal of Climate 20, 739–756.
Helsen, M. M., R. S. W. van de Wal, M. R. van den Broeke, V. Masson-Delmotte, H. A. J. Meijer, M. P. Scheele and M. Werner (2006), ‘Mod-eling the isotopic composition of Antarctic snow using backward trajec-tories: Simulation of snow pit records’, Journal of Geophysical Research111, D15109, doi:10.1029/2005JD006524.
Hines, K. M., D. H. Bromwich and G. J. Marshall (2000), ‘Aritificial surfacepressure trends in the NCEP-NCAR reanalysis over the southern oceanand Antarctica’, Journal of Climate 13, 3940–3952.
Houseago, R. E., G. R. McGregor, J. C. King and S. A. Harangozo (1998),‘Climate anomaly wave-train patterns linking southern low and high lat-itudes during south Pacific warm and cold events’, International Journalof Climatology 18, 1181–1193.
Howarth, D. A. and J. N. Rayner (1986), Estimates of sources and sinks ofatmospheric moisture in the Southern Hemisphere, in ‘Second Interna-tional Conference on Southern Hemisphere Meteorology’, American Me-teorological Society, Boston, Mass., pp. 163–166.
Southern Hemisphere atmospheric circulation 37
Hurrell, J. W. and H. van Loon (1994), ‘A modulation of the atmosphericannual cycle in the Southern Hemisphere’, Tellus 46A, 325–338.
Ichiyanagi, K., A. Numaguti and K. Kato (2002), ‘Interannual variation ofstable isotopes in Antarctic precipitation in response to El Nino-SouthernOscillation’, Geophysical Research Letters 29, 10.1029/2000GL012815.
IPCC (2007), Climate Change 2007: The Physical Science Basis. Contribu-tion of Working Group I to the Fourth Assessment Report of the Intergov-ernmental Panel on Climate Change, [Solomon, S., D. Qin, M. Manning,Z. Chen, M. Marquis, K. B. Averyt, M. Tignor and H. L. Miller (eds.)].Cambridge University Press, Cambridge, United Kingdom and New York,NY, USA.
Jacka, T. H., W. F. Budd and A. Holder (2004), ‘A further assessment ofsurface temperature changes at stations in the Antarctic and SouthernOcean, 1949-2002’, Annals of Glaciology 39, 331–338.
Jones, D. A. and I. H. Simmonds (1993), ‘A climatology of Southern Hemi-sphere extratropical cyclones’, Climate Dynamics 9, 131–145.
Jones, D. A. and I. H. Simmonds (1994), ‘A climatology of Southern Hemi-sphere anticyclones’, Climate Dynamics 10, 333–348.
Jones, J. M. and M. Widmann (2003), ‘Instrument- and tree-ring-basedestimates of the Antarctic Oscillation’, Journal of Climate 16, 3511–3524.
Jones, J. M. and M. Widmann (2004), ‘Early peak in Antarctic Oscillationindex’, Nature 432, 290–291.
Jones, J. M., R. L. Fogt, M. Widmann, G. J. Marshall, P. D. Jones andM. Visbeck (2009), ‘Historical Southern Hemisphere Annular Mode vari-ability. Part I: Century length seasonal reconstructions of the SouthernHemisphere Annular Mode’, Journal of Climate 22, in press.
Jones, P.D. and M. E. Mann (2004), ‘Climate over past millennia’, Reviewsof Geophysics 42, RG2002, doi:10.1029/2003RG000143.
Justino, F. and W. R. Peltier (2008), ‘Climate anomalies induced by theArctic and Antarctic Oscillations: Glacial maximum and present-day per-spectives’, Journal of Climate 21, 459–475.
Kalnay, E., M. Kanamitsu, R. Kistler, W. Collins, D. Deaven, L. Gandin, M.Iredell, S. Saha, G. White, J. Woollen, Y. Zhu, M. Chelliah, W. Ebisuzaki,W. Higgins, J. Janowiak, K. C. Mo, C. Ropelewski, J. Wang, A. Leetmaa,R. Reynolds, R. Jenne and D. Josepth (1996), ‘The NCEP/NCAR 40-year reanalysis preoject’, Bulletin of the American Meteorological Society77, 437–471.
Kanamitsu, M., W. Ebisuzaki, J. Woollen, S.-K. Yang, J. J. Hnilo, M. Fior-ino and G. L. Potter (2002), ‘NCEP-DOE AMIP-II reanalysis (R-2)’,Bulletin of the American Meteorological Society 83, 1631–1643.
King, J. C. (1994), ‘Recent climatic variability in the vicinity of the Antarc-tic Peninsula’, International Journal of Climatology 14, 357–369.
King, J. C. and J. Turner (1997), Antarctic Meteorology and Climatology,Cambridge University Press, Cambridge.
Kreutz, K. A., P. A. Mayewski, S. Whitlow and M. S. Twickler (1998),‘Limited migration of soluable ionic species in a Siple Dome, Antarctica,

38 Andrew Russell, Glenn R. McGregor
ice core’, Annals of Glaciology 27, 371–377.Kreutz, K. J. and P. A. Mayewski (1999), ‘Spatial variability of Antarctic
surface snow glaciochemistry: implications for paleoatmospheric circula-tion reconstruction’, Antarctic Science 11, 105–118.
Kreutz, K. J., P. A. Mayewski, I. I. Pittalwala, L. D. Meeker, M. S. Twicklerand S. I. Whitlow (2000), ‘Sea level pressure variability in the AmundsenSea region inferred from a west Antarctic glaciochemical record’, Journalof Geophysical Research 105(D3), 4047–4059.
Kreutz, K. J., P. A. Mayewski, L. D. Meeker, M. S. Twickler, S. I. Whitlowand I. I. Pittalwala (1997), ‘Bipolar changes in atmospheric circulationduring the Little Ice Age’, Science 277, 1294–1296.
Kushner, P. J., I. M. Held and T. L. Delworth (2001), ‘Southern Hemisphereatmospheric circulation response to global warming’, Journal of Climate14, 2238–2249.
Kwok, R. and J. C. Comiso (2002a), ‘Southern ocean climate and sea iceanomalies associated with the Southern Oscillation’, Journal of Climate15, 487–501.
Kwok, R. and J. C. Comiso (2002b), ‘Spatial patterns of variability inAntarctic surface temperature: Connections to the Southern HemisphereAnnular Mode and the Southern Oscillation’, Geophysical Research Let-ters 29, doi:10.1029/2002GL015415.
Le Quere, C., C. Rodenbeck, E. T. Buitenhuis, T. J. Conway, R. Langen-felds, A. Gomez, C. Labuschagne, M. Ramonet, T. Nakazawa, N. Metzl,N. Gillett and M. Heimann (2007), ‘Saturation of the Southern OceanCO2 sink due to recent climate change’, Science 316, doi: 10.1126/sci-ence.1136188.
Legrand, M. R. and C. Feniet-Saigne (1991), ‘Methanesulfonic acid in southpolar snow layers: a record of strong El Nino?’, Geophysical ResearchLetters 18, 187–190.
Legrand, M. R. and P. A. Mayewski (1997), ‘Glaciochemistry of polar icecores: a review’, Reviews of Geophysics 35, 219–243.
Legrand, M. R. and R. J. Delmas (1984), ‘The ionic balance of Antarcticsnow: a 10-year detailed record’, Atmospheric Environment 18, 1867–1874.
Legrand, M. R. and R. J. Delmas (1986), ‘Relative contributions of tro-pospheric and stratospheric sources to nitrate in Antarctic snow’, Tellus38B, 236–249.
Legrand, M. R. and S. Kirchner (1988), ‘Polar atmospheric circulation andchemistry of recent (1957-1983) South Polar precipitation’, GeophysicalResearch Letters 15, 879–882.
Legrand, M. R. and S. Kirchner (1990), ‘Origins and variations of nitratein South Polar precipitation’, Journal of Geophysical Research 95, 3493–3507.
Leonard, S., J. Turner and A. van der Wal (1999), ‘An assessment ofthree automatic depression tracking schemes’, Meteoroloical Applications6, 173–183.
Southern Hemisphere atmospheric circulation 39
Limpasuvan, V. and D. L. Hartmann (1999), ‘Eddies and the annular modeof climate variability’, Geophysical Research Letters 26, 3133–3136.
Liss, P. S., A. L. Chuck, S. M. Turner and A. J. Watson (2004), ‘Air-seagas exchange in Antarctic waters’, Antarctic Science 16, 517 529.
Lynch, A., P. Uotila and J. J. Cassano (2006), ‘Changes in synoptic weatherpatterns in the polar regions in the twentieth and twenty-first centuries,part 2: Antarctic’, International Journal of Climatology 26, 1181–1199.
Mantua, N. J., S. R. Hare, Y. Zhang, J. M. Wallace and R. C. Francis(1997), ‘A Pacific interdecadal climate oscillation with impacts on salmonproduction’, Bulletin of the American Meteorological Society 78, 1069–1079.
Marshall, G. J. (2000), ‘An examination of the precipitation regime atThurston Island, Antarctica, from ECMWF re-analysis data’, Interna-tional Journal of Climatology 20, 255–277.
Marshall, G. J. (2002), ‘Analysis of recent circulation and thermal advectionchange in the northern Antarctic Peninsula’, International Journal ofClimatology 22, 1557–1567.
Marshall, G. J. (2003), ‘Trends in the Southern Annular Mode from obser-vations and reanalyses’, Journal of Climate 16, 4134–4143.
Marshall, G. J. (2007), ‘Half-century seasonal relationships between theSouthern Annular Mode and Antarctic temperatures’, International Jour-nal of Climatology 27, 373–383.
Marshall, G. J., A. Orr, N. P. M. van Lipzig and J. C. King (2006), ‘Theimpact of a changing Southern Hemisphere Annular Mode on AntarcticPeninsula summer temperatures’, Journal of Climate 19, 5388–5404.
Marshall, G. J., J. Turner and W. D. Miners (1998), ‘Interpreting recentaccumulation records through an understanding of the regional synopticclimatology: an example from the southern Antarctic Peninsula’, Annalsof Glaciology 27, 610–616.
Marshall, G. J., P. A. Stott, J. Turner, W. M. Connolley, J. C. King andT. A. Lachlan-Cope (2004), ‘Causes of exceptional atmospheric circula-tion changes in the Southern Hemisphere’, Geophysical Research Letters31, L14205, doi:10.1029/2004GL019952.
Masson-Delmotte, V., B. Stenni and J. Jouzel (2004), ‘Common millenial-scale variability of Antarctic and Southern Ocean temperatures duringthe past 5000 years reconstructed from the EPICA Dome C ice core’,The Holocene 14, 145–151.
Masson-Delmotte, V., M. Delmotte, V. Morgan, D. Etheridge, T. van Om-men, S. Tartarin and G. Hoffmann (2003), ‘Recent southern Indian Oceanclimate variability inferred from a Law Dome ice core: new insights forthe interpretation of coastal Antarctic isotopic records’, Climate Dynam-ics 21, 153–166.
Masson-Delmotte, V., S. Hou, A. Ekaykin, J. Jouzel, A. Aristarain, R. T.Bernardo, D. Bromwich, O. Cattani, M. Delmotte, S. Falourd, M. Frez-zotti, H. Galle, L. Genoni, E. Isaksson, A. Landais, M. Helsen, G. Hoff-mann, J. Lopez, V. Morgan, H. Motoyama, D. Noone, H. Oerter, J. R.
40 Andrew Russell, Glenn R. McGregor
Petit, A. Royer, R. Uemura, G. A. Schmidt ., E. Schlosser, J. C. Simes,E. Steig, B. Stenni, M. Stievenard, M. van den Broeke, R. van de Wal,W.-J. van den Berg, F. Vimeux and J. W. C. White (2008), ‘A review ofAntarctic surface snow isotopic composition : observations, atmosphericcirculation and isotopic modelling’, Journal of Climate 21, 3359–3387.
Mayewski, P. A. and I. Goodwin, eds (2008), SCAR report No. 33: ITASESynthesis Workshop Final Report, Castine, Maine, September 2008, In-ternational Council for Science, Paris, France.
Mayewski, P. A., K. A. Maasch, J. W. C. White, E. J. Steig, E. Meyerson,I. Goodwin, V. I. Morgan, T. van Ommen, M. A. J. Curran, J. Souneyand K. J. Kreutz (2004), ‘700 year record of Southern Hemisphere extra-tropical climate variability’, Annals of Glaciology 39, 127–132.
Mayewski, P. A., L. D. Meeker, S. I. Whitlow, M. S. Twickler, M. C. Mor-rison, P. Bloomfield, G. C. Bond, R. B. Alley, A. J. Gow, P. M. Grootes,D. Meese, M. Ram, K. C. Taylor and W. Wumkes (1994), ‘Changes in at-mospheric circulation and ocean ice cover over the North Atlantic duringthe last 41,000 years’, Science 263, 1747–1751.
Mayewski, P. A., M. P. Meredith, C. P. Summerhayes, J. Turner, A. Worby,P. J. Barrett, G. Casassa, N. A. N. Bertler, T. Bracegirdle, A. C. Naveira-Garabato, D. Bromwich, H. Campbell, G. S. Hamilton, W. B. Lyons,K. A. Maasch, S. Aoki, C. Xiao and T. van Ommen (2009), ‘State of theAntarctic and Southern Ocean climate system’, Reviews of Geophysics47, doi:10.1029/2007RG000231, in press.
Mayewski, P. A., M. S. Twickler, S. I. Whitlow, L. D. Meeker, Q. Yang,J. Thomas, K. J. Kreutz, P. M. Grootes, D. L. Morse, E. J. Steig,E. D. Waddington, E. S. Saltzman, P.-Y. Whung and K. C. Taylor(1996), ‘Climate change during the last deglaciation in Antarctica’, Sci-ence 272, 1636–1638.
McMorrow, A. J., M. A. J. Curran, T. D. van Ommen, V. I. Morgan andI. Allison (2002), ‘Features of meteorological events preserved in a high-resolution Law Dome (East Antarctica) snow pit’, Annals of Glaciology35, 463–470.
Meehl, G. A., J. W. Hurrel and H. van Loon (1998), ‘A modulation of themechanism of the semiannual oscillation in the Southern Hemisphere’,Tellus 50A, 442–450.
Meyerson, E. A., P. A. Mayewski, K. J. Kreutz, L. D. Meeker, S. I. Whitlowand M. S. Twickler (2002), ‘The polar expression of ENSO and sea-icevariability as recorded in a South Pole ice core’, Annals of Glaciology25, 430–436.
Mo, K. C. and M. Ghil (1987), ‘Statistics and dynamics of persistent anoma-lies’, Journal of the Atmospheric Sciences 44, 877–901.
Monaghan, A. J. and D. H. Bromwich (2008), ‘Advances in describing re-cent Antarctic climate variablity’, Bulletin of the American MeteorologicalSociety 89, 1295–1306.
Monaghan, A. J., D. H. Bromwich, R. L. Fogt, S.-H. Wang, P. A. Mayewski,D. A. Dixon, A. Ekaykin, M. Frezzotti, I. Goodwin, E. Isaaksson, S. D.

Southern Hemisphere atmospheric circulation 41
Kaspari, V. I. Morgan, H. Oerter, T. D. van Ommen, C. J. van der Veenand J. Wen (2006), ‘Insignificant change in Antarctic snowfall since theInternational Geophysical Year’, Science 313, 827–831.
Monaghan, A. J., D. H. Bromwich, W. Chapman and J. C.Comiso (2008), ‘Recent variability and trends of antarctic near-surface temperature’, Journal of Geophysical Research 113, D04105,doi:10.1029/2007JD009094.
Mulvaney, R., D. Wagenbach and E. W. Wolff (1998), ‘Postdeposi-tional change in snowpack nitrate from observation of year-round near-surface snow in coastal Antarctica’, Journal of Geophysical Research103(D9), 11021–11032.
Mulvaney, R. and E. W. Wolff (1994), ‘Spatial variability of the majorchemistry of the Antarctic ice sheet’, Annals of Glaciology 20, 440–447.
Narcisi, B., J. R. Petit, B. Delmotte, I. Basile-Doelseh and V. Maggi (2005),‘Characteristics and sources of tephra layers in the EPICA-Dome C icerecord (East Antarctica): implications for past atmospheric circulationand ice core stratigraphic correlations’, Earth and Planetary Science Let-ters 239, 253–265.
Noone, D., J. Turner and R. Mulvaney (1999), ‘Atmospheric signals andcharacteristics of accumulation in Dronning Maud Land, Antarctica’,Journal of Geophysical Research 104(D16), 19191–19211.
Orr, A., D. Cresswell, G. J. Marshall, J. C. R. Hunt, J. Sommeria, C. G.Wang and M. Light (2004), ‘A ’low level’ explanation for the recent largewarming trend over the western Antarctic Peninsula involving blockedwinds and changes in zonal circulation’, Geophysical Research Letters31, L06204, doi:10.1029/2003GL019160.
Palmer, T. N. (1999), ‘A nonlinear dynamical perspective on climate pre-diction’, Journal of Climate 12, 575–591.
Park, Y., F. Roquet and F. Vivier (2004), ‘Quasi-stationary ENSO wavesignals versus the Antarctic Circumpolar Wave scenario’, Geophysical Re-search Letters 31, L09315, doi:10.1029/2004GL019806.
Pasteur, E. C. and R. Mulvaney (1999), ‘Laboratory study of the migrationof methane sulphonate in firn’, Journal of Glaciology 45, 214–218.
Pasteur, E. C. and R. Mulvaney (2000), ‘Migration of methane sulphonate inAntarctic firn and ice’, Journal of Geophysical Research 105(D9), 11525–11534.
Peel, D. A. and R. Mulvaney (1992), ‘Time-trends in the pattern of ocean-atmosphere exchanges in an ice core from the Weddell Sea sector ofAntarctica’, Tellus 44B, 430–442.
Peixoto, J. P. and A. H. Oort (1992), Physics of Climate, American Instituteof Physics, New York.
Petit, J. R., J. W. C. White, N. W. Young, J. Jouzel and Y. S. Korotkevich(1991), ‘Deuterium excess in recent Antarctic snow’, Journal of Geophys-ical Research 96(D3), 5113–5122.
Pezza, A. B., I. Simmonds and J. A. Renwick (2007), ‘Southern Hemispherecyclones and anticyclones: recent trends and links with decadal variability
42 Andrew Russell, Glenn R. McGregor
in the Pacific Ocean’, International Journal of Climatology 27, 1403–1419.Physick, W. L. (1981), ‘Winter depression tracks and climatological jet
streams in the Southern Hemisphere during the FGGE year’, QuarterlyJournal of the Royal Meteorological Society 107, 883–898.
Pittock, A. B. (1980), ‘Patterns of climatic variation in Argentina and Chile- 1: precipitation, 1931-60’, Monthly Weather Review 108, 1347–1361.
Power, S., T. Casey, C. Folland, A. Colman and V. Mehta (1999), ‘Inter-decadal modulation of the impact of ENSO on Australia’, Climate Dy-namics 15, 319–324.
Prospero, J. M., D. L. Savoie, E. S. Saltzman and R. Larsen (1991), ‘Impactof oceanic sources of biogenic sulfur on sulfate aerosol concentrations atMawson, Antarctica’, Nature 350, 221–223.
Pudsey, C. J. and J. Evans (2001), ‘First survey of Antarctic sub-ice shelfsediments reveals mid-holocene ice shelf retreat’, Geology 29, 787–790.
Quinn, W. H. and V. T. Neal (1992), The historical record of El Ninoevents, in R. S. Bradley and P. D. Jones, eds, ‘Climate since A.D. 1500’,Routledge, London, pp. 623–648.
Rack, W. and H. Rott (2004), ‘Pattern of retreat and disintegration of theLarsen B ice shelf, Antarctic Peninsula’, Annals of Glaciology 39, 505–510.
Rankin, A. M., E. W. Wolff and R. Mulvaney (2004), ‘A reinterpretation ofsea-salt records in Greenland and Antarctic ice cores?’, Annals of Glaciol-ogy 39, 276282.
Rankin, A. M., E. W. Wolff and S. Martin (2002), ‘Frost flowers: implica-tions for tropospheric chemistry and ice core interpretation’, Journal ofGeophysical Research 107(D23), 4683, doi:10.1029/2002JD002492.
Reijmer, C. H. and M. R. van den Broeke (2001), ‘Moisture source of precip-itation in western Dronning Maud Land, Antarctica’, Antarctic Science13, 210–220.
Reijmer, C. H., M. R. van den Broeke and M. P. Scheele (2002), ‘Air parceltrajectories and snowfall related in five deep drilling locations in Antarc-tica based on the ERA-15 dataset’, Journal of Climate 15, 1957–1968.
Renwick, J. A. (2005), ‘Persistent positive anomalies in the Southern Hemi-sphere circulation’, Monthly Weather Review 133, 977988.
Reusch, D. B., B. C. Hewitson and R. B. Alley (2005), ‘Towards ice-core-based synoptic reconstructions of west Antarctic climate with artificialneural networks’, International Journal of Climatology 25, 581–610.
Reusch, D. B., P. A. Mayewski, S. I. Whitlow, I. I. Pittalwala and M. S.Twickler (1999), ‘Spatial variability of climate and past atmospheric cir-culation patterns from central west Antarctic glaciochemistry’, Journalof Geophysical Research 104(D6), 5985–6001.
Rogers, J. C. and H. van Loon (1982), ‘Spatial variability of sea level pres-sure and 500mb height anomalies over the Southern Hemisphere’, MonthlyWeather Review 110, 13751392.
Roscoe, H. K., G. J. Marshall and J. C. King (2006), ‘Low potential forstratospheric dynamical change to be implicated in the large winter warm-

Southern Hemisphere atmospheric circulation 43
ing in the central Antarctic Peninsula’, Quarterly Journal of the RoyalMeteorological Society 132, 803–820.
Russell, A., G. R. McGregor and G. J. Marshall (2004), ‘An examinationof the precipitation delivery mechanisms for Dolleman Island, easternAntarctic Peninsula’, Tellus 56A, 501–513.
Russell, A., G. R. McGregor and G. J. Marshall (2006), ‘340 years ofatmospheric circulation characteristics reconstructed from an easternAntarctic Peninsula ice core’, Geophysical Research Letters 33, L08702,doi:10.1029/2006GL025899.
Russell, A., G. R. McGregor and G. J. Marshall (2008), ‘Eastern AntarcticPeninsula precipitation delivery mechanisms: process studies and backtrajectory evaluation’, Atmospheric Science Letters 9, 214–221.
Schlosser, E. (1999), ‘Effects of seasonal variability of accumulation onyearly mean δ18O values in Antarctic snow’, Journal of Glaciology45, 463–468.
Schlosser, E., H. Oerter, V. Masson-Delmotte and C. Reijmer (2008), ‘Ef-fects of seasonal variability of accumulation on yearly mean δ18O valuesin Antarctic snow’, Journal of Glaciology 54, 117–124.
Schneider, D. P. and D. C. Noone (2007), ‘Spatial covariance of water iso-topes in ice cores during 20th century climate change’, Journal of Geo-physical Research 112, doi:10.1029/2007JD008652.
Schneider, D. P., E. J. Steig and J. C. Comiso (2004), ‘Recent climatevariability in Antarctica from satellite-derived temperature data’, Journalof Climate 17, 1569–1583.
Schneider, D. P. and E. Steig (2008), ‘Ice cores record significant 1940sAntarctic warmth related to tropical climate variability’, Proceedingsof the National Academy Of Sciences of the United States of America105, 12154–12158.
Schneider, D. P., E. Steig, T. D. van Ommen, D. A. Dixon, P. Mayewski,J. M. Jones and C. M. Bitz (2006), ‘Antarctic temperatures over the pasttwo centuries from ice cores’, Geophysical Research Letters 33, Art. No.L16707.
Sexton, D. M. H. (2001), ‘The effect of stratospheric ozone depletion onthe phase of the Antarctic Oscillation’, Geophysical Research Letters28, 3697–3700.
Shepherd, A., D. Wingham, T. Payne and P. Skvarca (2003), ‘Larsen iceshelf has progressively thinned’, Science 302, 856–859.
Simmonds, I. H. and K. Keay (2000a), ‘Mean Southern Hemisphere ex-tratropical cyclone behaviour in the 40-year NCEP-NCAR reanalysis’,Journal of Climate 13, 873–885.
Simmonds, I. H. and K. Keay (2000b), ‘Variability of Southern Hemisphereextratropical cyclone behaviour, 1958-97’, Journal of Climate 13, 550–561.
Simmonds, I. H., K. Keay and E.-P. Lim (2003), ‘Synoptic activity in theseas around Antarctica’, Monthly Weather Review 131, 272–288.

44 Andrew Russell, Glenn R. McGregor
Sinclair, M. R. (1994), ‘An objective cyclone climatology for the SouthernHemisphere’, Monthly Weather Review 122, 2239–2256.
Sinclair, M. R. (1995), ‘A climatology of cyclogenesis for the Southern Hemi-sphere’, Monthly Weather Review 123, 1601–1619.
Sinclair, M. R. (1996), ‘A climatology of anticyclones and blocking for theSouthern Hemisphere’, Monthly Weather Review 124, 245–263.
Smith, S. R. and C. R. Stearns (1993), ‘Antarctic pressure and temperatureanomalies surrounding the minimum in the Southern Oscillation index’,Journal of Geophysical Research 98(D7), 13071–13083.
Souney, J. M., P. A. Mayewski, I. D. Goodwin, L. D. Meeker, V.Morgan, M. A. J. Curran, T. D. van Ommen and A. S. Palmer(2002), ‘A 700-year record of atmospheric circulation developed from theLaw Dome ice core, east Antarctica’, Journal of Geophysical Research107(D22), 10.1029/2002JD002104.
Steig, E. J., D. P. Schneider, S. D. Rutherford, M. E. Mann, J. C. Comisoand D. T. Shindell (2009), ‘Warming of the Antarctic ice-sheet surfacesince the 1957 International Geophysical Year’, Nature 457, 459–463.
Streten, N. A. and A. J. Troup (1973), ‘A synoptic climatology of satelliteobserved cloud vortices over the Southern Hemisphere’, Quarterly Journalof the Royal Meteorological Society 99, 56–72.
Taljaard, J. J. (1967), ‘Development, distribution and movement of cyclonesand anticyclones in the Southern Hemisphere during the IGY’, Journalof Applied Meteorology 6, 973–987.
Thomas, E. R., G. J. Marshall and J. R. McConnell (2008), ‘A doublingin snow accumulation in the western Antarctic Peninsula since 1850’,Geophysical Research Letters 35, L01706, doi:10.1029/2007GL032529.
Thompson, D. W. J. and J. M. Wallace (2000), ‘Annular modes of extratrop-ical circulation. Part I: month-to-month variability’, Journal of Climate13, 1000–1016.
Thompson, D. W. J., J. M. Wallace and G. C. Hegerl (2000), ‘Annularmodes in the extratropical circulation. Part II: trends’, Journal of Climate13, 1018–1036.
Thompson, D. W. J. and S. Solomon (2002), ‘Interpretation of recent South-ern Hemisphere climate change’, Science 296, 895–899.
Tietavainen, H. and T. Vihma (2008), ‘Atmospheric moisture budget overAntarctica and the Southern Ocean on the basis of ERA-40 reanalysis’,International Journal of Climatology 28, 1977–1995.
Trenberth, K. E. (1984), ‘Interannual variability of the Southern-Hemisphere circulation-representativeness of the year of the GlobalWeather Experiment’, Monthly Weather Review 112, 108–123.
Trenberth, K. E. (1995), ‘Atmospheric circulation climate changes’, ClimaticChange 31, 427–453.
Trenberth, K. E. (1997), ‘The definition of El Nino’, Bulletin of the Amer-ican Meteorological Society 78, 2771–2777.
Trenberth, K. E. and D. P. Stepaniak (2003a), ‘Covariability of componentsof poleward atmospheric energy transports on seasonal and interannual

Southern Hemisphere atmospheric circulation 45
timescales’, Journal of Climate 16, 3691–3705.Trenberth, K. E. and D. P. Stepaniak (2003b), ‘Seamless poleward atmo-
spheric energy transports and implications for the Hadley Circulation’,Journal of Climate 16, 3706–3722.
Trenberth, K. E., D. P. Stepaniak and L. Smith (2005), ‘Interannual variabil-ity of the patterns of atmospheric mass distribution’, Journal of Climate18, 28122825.
Trenberth, K. E., P. D. Jones, P. Ambenje, R. Bojariu, D. Easterling,A. Klein Tank, D. Parker, F. Rahimzadeh, J. A. Renwick, M. Rusticucci,B. Soden and P. Zhai (2007), Observations: Surface and atmospheric cli-mate change, in S. Solomon, D. Qin, M. Manning, Z. Chen, M. Marquis,K. B. Averyt, M. Tignor and H. L. Miller, eds, ‘Climate Change 2007: ThePhysical Science Basis. Contribution of Working Group I to the FourthAssessment Report of the Intergovernmental Panel on Climate Change’,Cambridge University Press, Cambridge, United Kingdom and New York,NY, USA, pp. 235–336.
Turner, J. (2004), ‘The El Nino-Southern Oscillation and the Antarctic’,International Journal of Climatology 24, 1–31.
Turner, J., G. J. Marshall and T. Lachlan-Cope (1998), ‘Analysis ofsynoptic-scale low pressure systems within the Antarctic Peninsula sectorof the circumpolar trough’, International Journal of Climatology 18, 253–280.
Turner, J., J. C. King, T. Lachlan-Cope and P. D. Jones (2002), ‘Recenttemperature trends in the Antarctic’, Nature 418, 291–292.
Turner, J., S. R. Colwell, G. J. Marshall, T. Lachlan-Cope, A. M. Carleton,P. D. Jones, V. Lagun, P. A. Reid and S. Iagovkina (2005), ‘Antarcticclimate change during the last 50 years’, International Journal of Clima-tology 25, 279–294.
Turner, J., T. A. Lachlan-Cope, S. Colwell, G. J. Marshall and W. M. Con-nolley (2006a), ‘Significant warming of the Antarctic winter troposphere’,Science 311, 1914–1917.
Turner, J., T. Lachlan-Cope, J. P. Thomas and S. R. Colwell (1995), ‘Thesynoptic origins of precipitation over the Antarctic Peninsula’, AntarcticScience 7, 327–337.
Turner, J., W. M. Connolley, T. Lachlan-Cope and G. J. Marshall (2006b),‘The performance of the Hadley Centre climate model (HadCM3) in highsouthern latitudes’, International Journal of Climatology 26, 91–112.
van den Broeke, M. R. (1998a), ‘The semi-annual oscillation and Antarc-tic climate. Part 1: influence on near surface temperatures (1957-79)’,Antarctic Science 10, 175–183.
van den Broeke, M. R. (1998b), ‘The semi-annual oscillation and Antarcticclimate. Part 2: recent changes’, Antarctic Science 10, 184–191.
van den Broeke, M. R. (2005), ‘Strong surface melting preceded collapse ofAntarctic Peninsula ice shelf’, Geophysical Research Letters 32, L12815,doi:10.1029/2005GL023247.

46 Andrew Russell, Glenn R. McGregor
van den Broeke, M. R. and N. P. M. van Lipzig (2003), ‘Factors control-ling the near-surface wind field in Antarctica’, Monthly Weather Review131, 733–743.
van Lipzig, N. P. M., E. van Meijgaard and J. Oerlemans (1999), ‘Evalua-tion of a regional atmospheric model using measurements of surface heatexchange processes from a site in Antarctica’, Monthly Weather Review127, 1994–2011.
van Lipzig, N. P. M., G. J. Marshall, A. Orr and J. C. King (2008), ‘The re-lationship between the Southern Hemisphere Annular Mode and Antarc-tic Peninsula summer temperatures: Analysis of a high-resolution modelclimatology’, Journal of Climate 21, 1649–1668.
van Loon, H. (1965), ‘A climatological study of the atmospheric circulationin the Southern Hemisphere during the IGY. Part I: 1 July 1957 - 31March 1958’, Journal of Applied Meteorology 4, 479–491.
van Loon, H. (1967), ‘The half-yearly oscillations in middle and high south-ern latitudes and the Coreless Winter’, Journal of the Atmospheric Sci-ences 24, 472–486.
Vaughan, D. G., G. J. Marshall, W. M. Connolley, C. L. Parkinson, R. Mul-vaney, D. A. Hodgsen, J. C. King, C. J. Pudsey and J. Turner (2003),‘Recent rapid regional climate warming on the Antarctic Peninsula’, Cli-matic Change 60, 243–274.
Vaughan, D. G., G. J. Marshall, W. M. Connolley, J. C. King and R. Mul-vaney (2001), ‘Devil in the detail’, Science 293, 1777–1779.
Villalba, R., E. R. Cook, R. D. DArrigo, G. C. Jacoby, P. D. Jones, M. S.Salinger and J. Palmer (1997), ‘Sea-level pressure variability aroundAntarctica since A.D. 1750 inferred from sub-Antarctic tree-ring records’,Climate Dynamics 13, 375 390.
Vincent, D. G. (1994), ‘The South Pacific Convergence Zone (SPCZ) : areview’, Monthly Weather Review 122, 1949–1970.
Wagenbach, D., F. Ducroz, R. Mulvaney, K. Keck, A. Minikin, M. R.Legrand, J. S. Hall and E. W. Wolff (1998), ‘Sea-salt aerosol in coastalAntarctic regions’, Journal of Geophysical Research 103, 10961–10974.
Walker, G. T. (1928), ‘World weather’, Quarterly Journal of the Royal Me-teorological Society 54, 79–87.
White, W. B. and R. G. Peterson (1996), ‘An Antarctic circumpolar wavein surface pressure, wind and sea-ice extent’, Nature 380, 699–702.
Whitlow, S., P. A. Mayewski and J. E. Dibb (1992), ‘A comparison of majorchemical species seasonal concentration and accumulation at the SouthPole and Summit, Greenland’, Atmospheric Environment 26A, 2045–2054.
Wolff, E. W., A. M. Rankin and R. Rthlisberger (2003), ‘An ice core in-dicator of Antarctic sea ice production?’, Geophysical Research Letters30, 2158, doi: 10.1029/2003GL018454.
Xiao, C. D., P. A. Mayewski, D. H. Qin, Z. Q. Li, M. J. Zhang andY. P. Yan (2004), ‘Sea level pressure variability over the southern IndianOcean inferred from a glaciochemical record in Princess Elizabeth Land,

Southern Hemisphere atmospheric circulation 47
east Antarctica’, Journal of Geophysical Research 109(D16), D16101,doi:10.1029/2003JD004065.
Yuan, X. and D. G. Martinson (2001), ‘The Antarctic dipole and its pre-dictability’, Geophysical Research Letters 28, 3609–3612.