Technetium species induced in maize as measured by phosphorimager
Upload
independentCategory
view
0download
0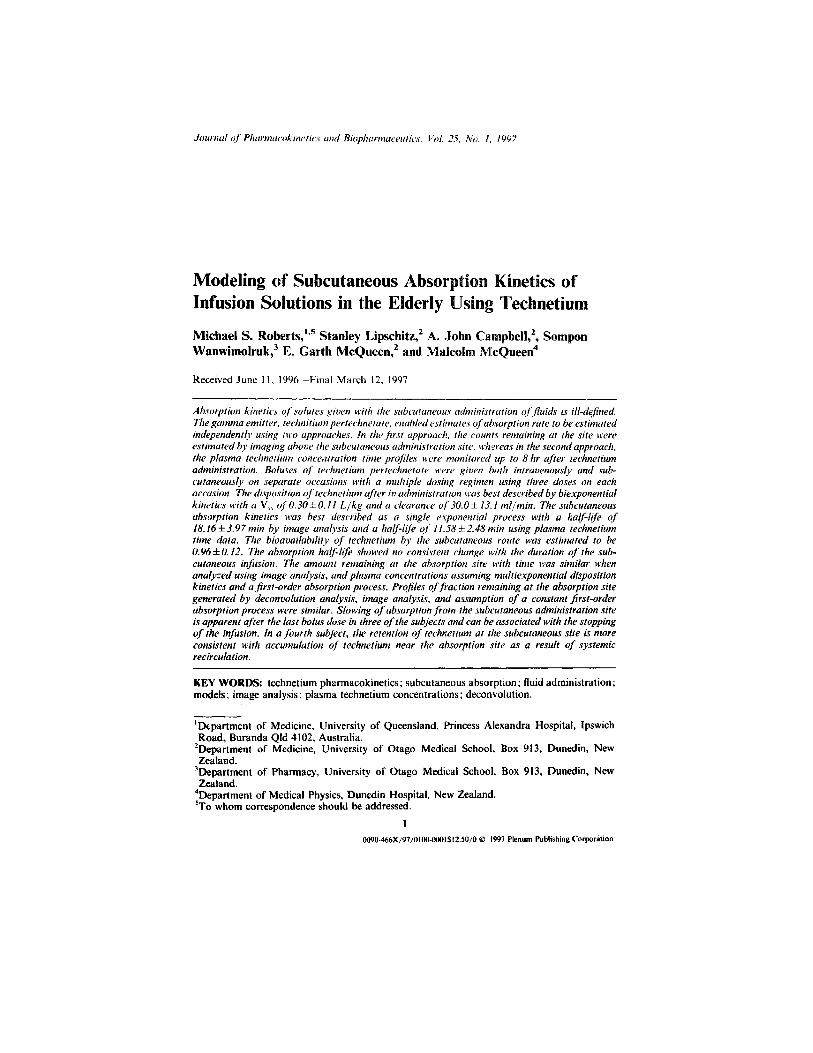
Journal of Pharmacokinetics and Biopharmaceutics, Vol. 25. No. I. 1997
Modeling of Subcutaneous Absorption Kinetics ofInfusion Solutions in the Elderly Using Technetium
Michael S. Roberts,1,5 Stanley Lipschitz,2 A. John Campbell,2, SomponWanwimolruk,3 E. Garth McQueen,2 and Malcolm McQueen4
Received June 11, 1996—Final March 12, 1997
Absorption kinetics of solutes given with the subcutaneous administration of fluids is ill-defined.The gamma emitter, technitium pertechnetate, enabled estimates of absorption rate to be estimatedindependently using two approaches. In the first approach, the counts remaining at the site wereestimated by imaging above the subcutaneous administration site, whereas in the second approach,the plasma technetium concentration-lime profiles were monitored up to 8 hr after technetiumadministration. Boluses of technetium pertechnetate were given both intravenously and sub-cutaneously on separate occasions with a multiple dosing regimen using three doses on eachoccasion The disposition of technetium after iv administration was best described by biexponentialkinetics with a Vxx of 0.30±0.11 L/kg and a clearance of 30.0± 13.1 ml/min. The subcutaneousabsorption kinetics was best described as a single exponential process with a half-life of18.16±3.97 min by image analysis and a half-life of li.58±2.48 min using plasma technetiumtime data. The bioavailability of technetium by the subcutaneous route was estimated to be0.96±0.12. The absorption half-life showed no consistent change with the duration of the sub-cutaneous infusion. The amount remaining at the absorption site with time was similar whenanalyzed using image analysis, and plasma concentrations assuming multiexponential dispositionkinetics and a first-order absorption process. Profiles of fraction remaining at the absorption sitegenerated by deconvolution analysis, image analysis, and assumption of a constant first-orderabsorption process were similar. Slowing of absorption from the subcutaneous administration siteis apparent after the last bolus dose in three of the subjects and can be associated with the stoppingof the infusion. In a fourth subject, the retention of technetium at the subcutaneous site is moreconsistent with accumulation of technetium near the absorption site as a result of systemicrecirculation.
1Department of Medicine, University of Queensland, Princess Alexandra Hospital, IpswichRoad, Buranda Qld 4102, Australia.
2Department of Medicine, University of Otago Medical School, Box 913, Dunedin, NewZealand.
3Department of Pharmacy, University of Otago Medical School, Box 913, Dunedin, NewZealand.
4Department of Medical Physics, Dunedin Hospital, New Zealand.5To whom correspondence should be addressed.
KEY WORDS: technetium pharmacokinetics; subcutaneous absorption; fluid administration;models; image analysis; plasma technetium concentrations; deconvolution.
10090-466X/97/OIOO-0001$l2.SO/Oe 1997 Plenum Publishing Corporation
INTRODUCTION
Little information is available on the absorption kinetics of solutionsgiven as infusions subcutaneously for dehydration. The subcutaneous routehas a number of advantages compared to the intravenous route whichinclude ease of administration, low incidence of infection, less discomfort,avoidance of prolonged immobilisation, and minimal medical supervision.Fluids given by the subcutaneous route are commonly given at a rate of150-200 ml/hr over about 3 hr and often include hyaluronidase to improveabsorption. In clinical practice, up to 2.5-L of fluid has been administeredin one infusion (1).
A number of studies have quantified subcutaneous absorption kineticsof solutes from small volumes of solutions. Many of these studies have beenconcerned with the modeling of insulin absorption. The modeling of thelatter is suggested to be complicated by factors such as local diffusion ratesin tissue, insulin binding in tissue, local blood flow (2), multimeric forms ofinsulin, and degradation (3,4). The disappearance of radiolabeled insulinfrom the subcutaneous site following bolus injection has been shown by anumber of groups to generally follow a monoexponential expression (2),enabling the representation of the subcutaneous site as a single compartment.A two-compartment model representation of the subcutaneous site has beenused to account for an initial delay phase in insulin absorption (2,5) anduptake of local anesthetics into adjacent tissues (6). A single-compartmentmodel appears to be commonly used to represent the subcutaneous site forstudies on the absorption of cyclosporin (7), benzyl alcohol (8), and N-acetylsulphamethoxazole (9).
Given the lack of information on the absorption kinetics of solutes fromsubcutaneous sites in elderly patients, boluses of technetium pertechnetate(30 MBq) and tritiated water (20 MBq) were administered during subcutan-eous and intravenous infusions. A preliminary communication advocatingthe use of subcutaneous infusions as an effective method for giving fluid toelderly people has been reported (10).
In this paper, we analyze the pharmacokinetics of technetium pertech-netate after subcutaneous and intravenous administration. The absorptionkinetics were evaluated by nonlinear regression kinetics assuming first-orderabsorption kinetics, by deconvolution analysis, in which it was assumed thatthe intravenous disposition of technetium could be described by multiexpon-ential kinetics, and by analyzing the imaged counts at the subcutaneous site.
MATERIALS AND METHODS
Subjects and Study Design
Six volunteers, 4 men and 2 women, ages over 65 years, were recruitedfrom the Otago Medical Research Foundation Auxiliary through a written
2 Roberts et al.
invitation outlining the study followed by a formal interview. The numberof subjects was limited because of the use of radiolabeled materials and theinvasive nature of the study in elderly volunteers. All subjects were in goodhealth, living independently in the community. They had no evidence ofcongestive heart failure or hypertension. They had normal laboratory valuesfor serum, urea, and electrolytes, liver function tests, and a normal full bloodscreen. A crossover design was used with all subjects assigned to receive asubcutaneous or intravenous infusion and repeat infusion via the alternativeroute at 8 weeks. However, Subject 4 received only the intravenous schedule.The protocol for this study was approved by the Otago Area Health BoardEthics Committee as well as the National Radiation Safety Laboratory.
Technetium Pertechnetate Administration and Blood Sampling
The subcutaneous infusion followed the standard protocol used in theclinical situation and has been described (10,11). Administration was madeat the infraclavicular site, 3 cm beneath the midpoint of the left clavicle tofacilitate ready imaging with the gamma camera. A 500-ml bag of normalsaline was connected to a standard giving set and the set primed with fluid.Hyaluronidase (750 IU) plus 1% lignocaine was injected into the site beneaththe skin with a 21G butterfly cannula and a syringe. The normal salinewas given through an infusion pump to standardize the subcutaneous andintravenous rates of administration.
The intravenous infusion was given via an 18G cannula in the forearmusing an identical bag, infusion set, and infusion pump. All infusions weregiven at a rate of 167 ml/hr (500 ml saline over 3 hr). Sodium pertechnate(1 g) was given orally 30 min prior to each infusion to block uptake oftechnetium by the thyroid gland. A bolus of radioisotope consisting of30 mBq technetium pertechnetate and 20 MBq tritiated water in 5 ml wasadded to the infusion via a junction at 0, 1.5 and 3 hr with the giving setblocked proximally. The amount of technetium administered was estimatedfrom the difference in the amount of technetium added to the syringe andresidual activity remaining in the syringe after each bolus after correctionfor decay.
Blood samples were collected through a peripheral heparinized 18Gcannula inserted into the forearm, contralateral to the iv infusion. Venousblood (5 ml) was collected after discarding an initial 1 ml, before the initialbolus and at 5, 10, 15, 30, 45, 60, and 90 min after each bolus. Blood sampleswere centrifuged at 2000 rpm for 15 min and the plasma separated. Theplasma was analyzed for technetium activity within 4 hr of collection.
Analysis
Technetium activity was quantified in 0.5-ml plasma samples and, as acontrol for the loss in technetium activity, also in 0.5-ml of injection solution
Technetium Subcutaneous Absorption Kinetics 3
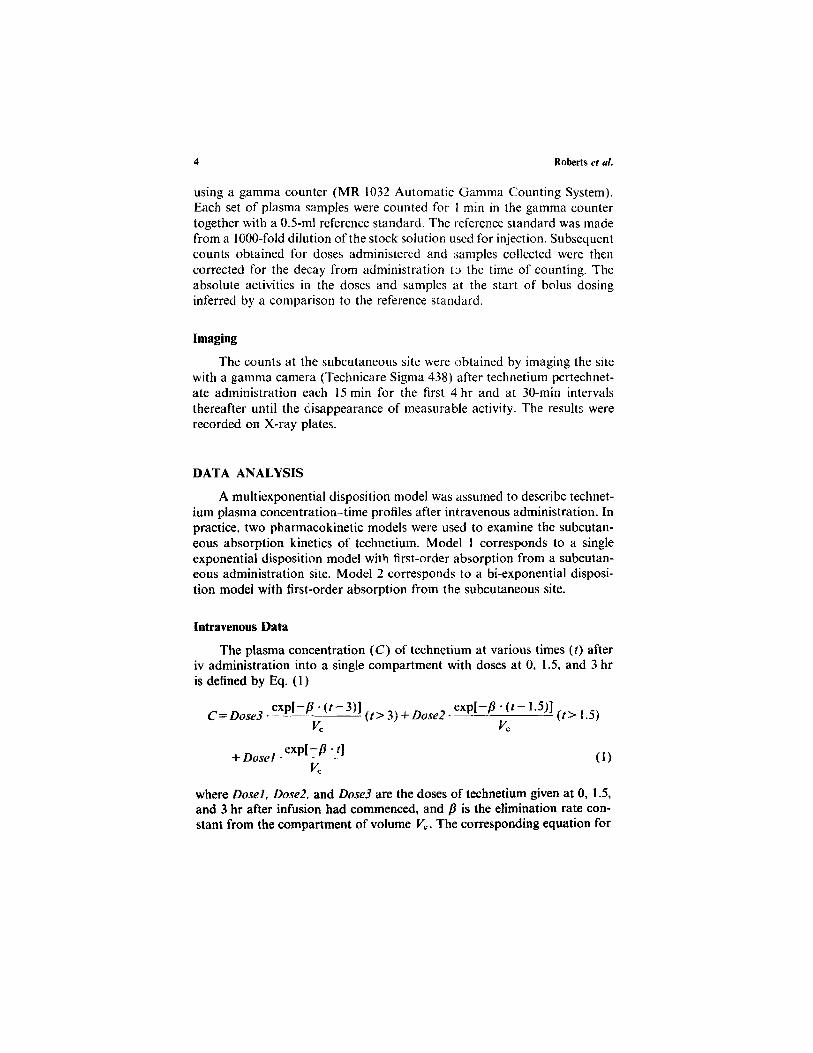
using a gamma counter (MR 1032 Automatic Gamma Counting System).Each set of plasma samples were counted for 1 min in the gamma countertogether with a 0.5-ml reference standard. The reference standard was madefrom a 1000-fold dilution of the stock solution used for injection. Subsequentcounts obtained for doses administered and samples collected were thencorrected for the decay from administration to the time of counting. Theabsolute activities in the doses and samples at the start of bolus dosinginferred by a comparison to the reference standard.
Imaging
The counts at the subcutaneous site were obtained by imaging the sitewith a gamma camera (Technicare Sigma 438) after technetium pertechnet-ate administration each 15 min for the first 4 hr and at 30-min intervalsthereafter until the disappearance of measurable activity. The results wererecorded on X-ray plates.
DATA ANALYSIS
A multiexponential disposition model was assumed to describe technet-ium plasma concentration-time profiles after intravenous administration. Inpractice, two pharmacokinetic models were used to examine the subcutan-eous absorption kinetics of technetium. Model 1 corresponds to a singleexponential disposition model with first-order absorption from a subcutan-eous administration site. Model 2 corresponds to a bi-exponential disposi-tion model with first-order absorption from the subcutaneous site.
4 Roberts et al.
Intravenous Data
The plasma concentration (C) of technetium at various times (t) afteriv administration into a single compartment with doses at 0, 1.5, and 3 hris defined by Eq. (1)
where Dosel, Dose2, and Dose3 are the doses of technetium given at 0, 1.5,and 3 hr after infusion had commenced, and B is the elimination rate con-stant from the compartment of volume Vc. The corresponding equation for
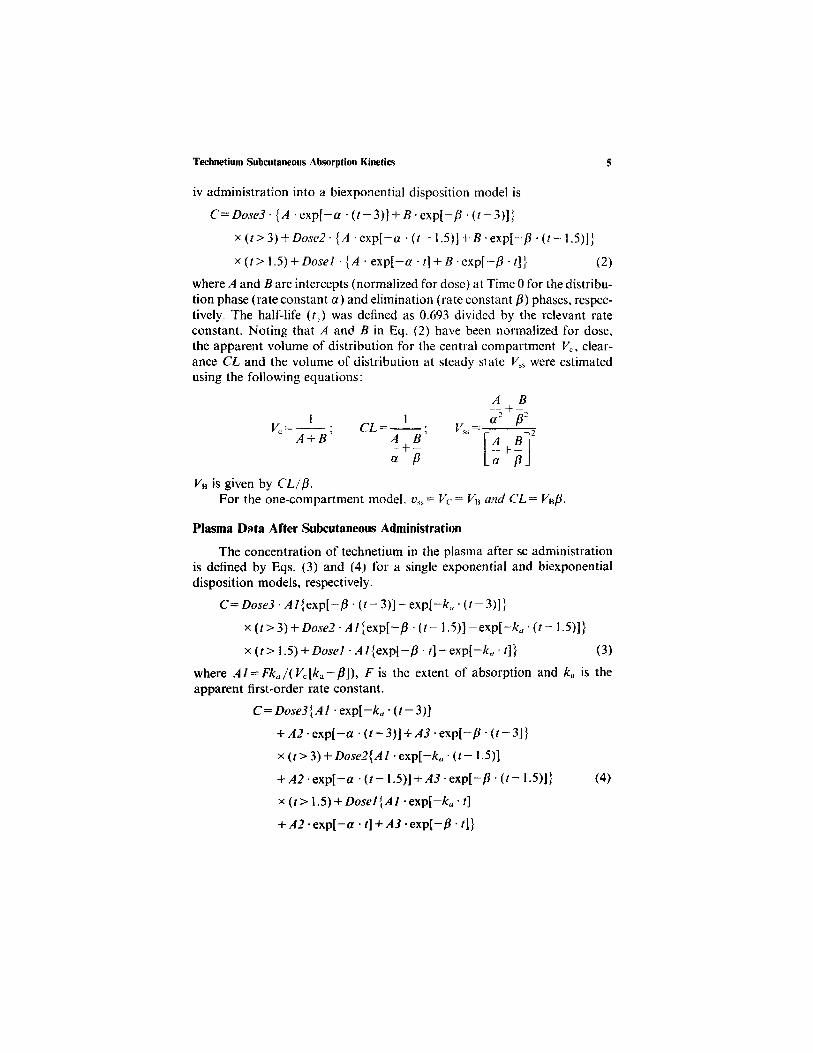
iv administration into a biexponential disposition model is
VB is given by CL/B.For the one-compartment model, vss = VC= VB and CL= VBB.
Plasma Data After Subcutaneous Administration
The concentration of technetium in the plasma after sc administrationis defined by Eqs. (3) and (4) for a single exponential and biexponentialdisposition models, respectively.
Technetium Subcutaneous Absorption Kinetics 5
where A and B are intercepts (normalized for dose) at Time 0 for the distribu-tion phase (rate constant a) and elimination (rate constant B) phases, respec-tively. The half-life (t2) was defined as 0.693 divided by the relevant rateconstant. Noting that A and B in Eq. (2) have been normalized for dose,the apparent volume of distribution for the central compartment Vc, clear-ance CL and the volume of distribution at steady state Vss were estimatedusing the following equations:
where Al = FA:,,/(Vc[Ka- B]), F is the extent of absorption and Ka is theapparent first-order rate constant.
6 Roberts el al.
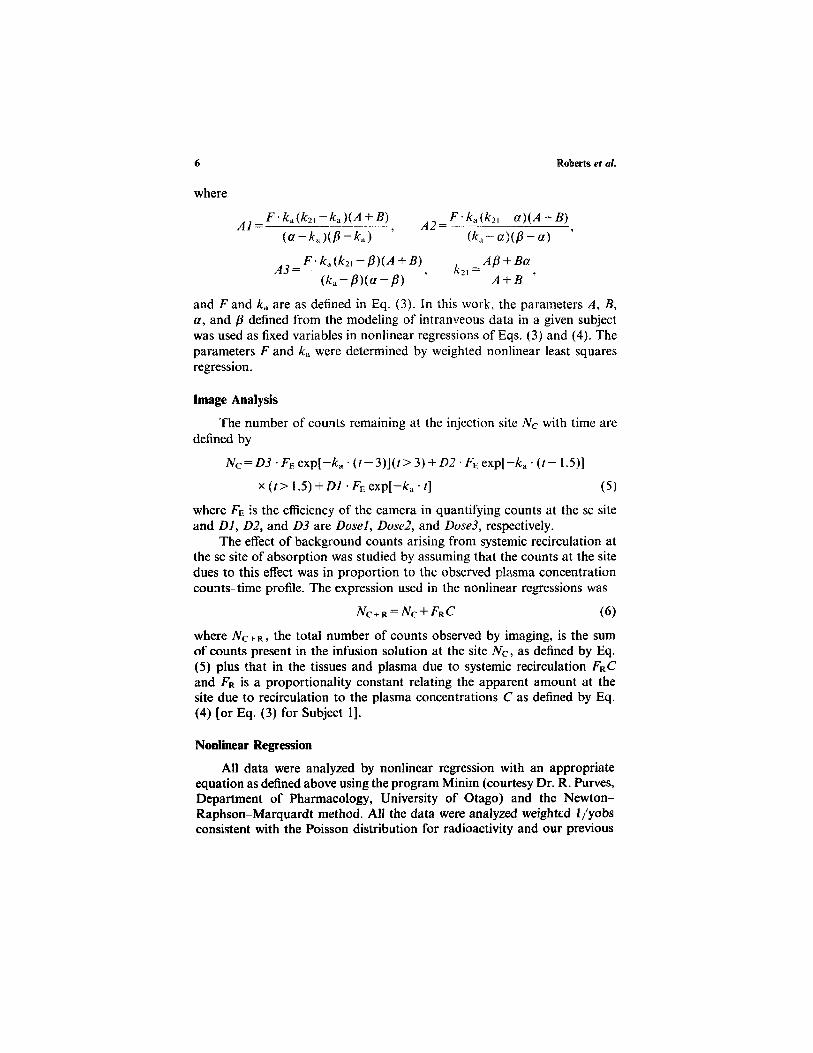
where
and F and ka are as defined in Eq. (3). In this work, the parameters A, B,a, and B defined from the modeling of intranveous data in a given subjectwas used as fixed variables in nonlinear regressions of Eqs. (3) and (4). Theparameters F and ka were determined by weighted nonlinear least squaresregression.
Image Analysis
The number of counts remaining at the injection site Nc with time aredefined by
where FE is the efficiency of the camera in quantifying counts at the sc siteand D1, D2, and D3 are Dose1, Dose2, and Dose3, respectively.
The effect of background counts arising from systemic recirculation atthe sc site of absorption was studied by assuming that the counts at the sitedues to this effect was in proportion to the observed plasma concentrationcounts-time profile. The expression used in the nonlinear regressions was
where NC+R, the total number of counts observed by imaging, is the sumof counts present in the infusion solution at the site NC, as defined by Eq.(5) plus that in the tissues and plasma due to systemic recirculation FRCand FR is a proportionality constant relating the apparent amount at thesite due to recirculation to the plasma concentrations C as defined by Eq.(4) [or Eq. (3) for Subject 1].
Nonlinear Regression
All data were analyzed by nonlinear regression with an appropriateequation as defined above using the program Minim (courtesy Dr. R. Purves,Department of Pharmacology, University of Otago) and the Newton-Raphson-Marquardt method. All the data were analyzed weighted 1/yobsconsistent with the Poisson distribution for radioactivity and our previous
Technetium Subcutaneous Absorption Kinetics 7
study on appropriate weighting for radiolabeled solutes (14). The choicebetween tri-, bi-, and monoexponential kinetics as the choice for a givendisposition model after iv administration was made on the basis of (i)whether convergence was observed, (ii) only negative exponents beingpresent, (iii) Akaike criteria, and (iv) residual analysis.
Deconvolution Analysts
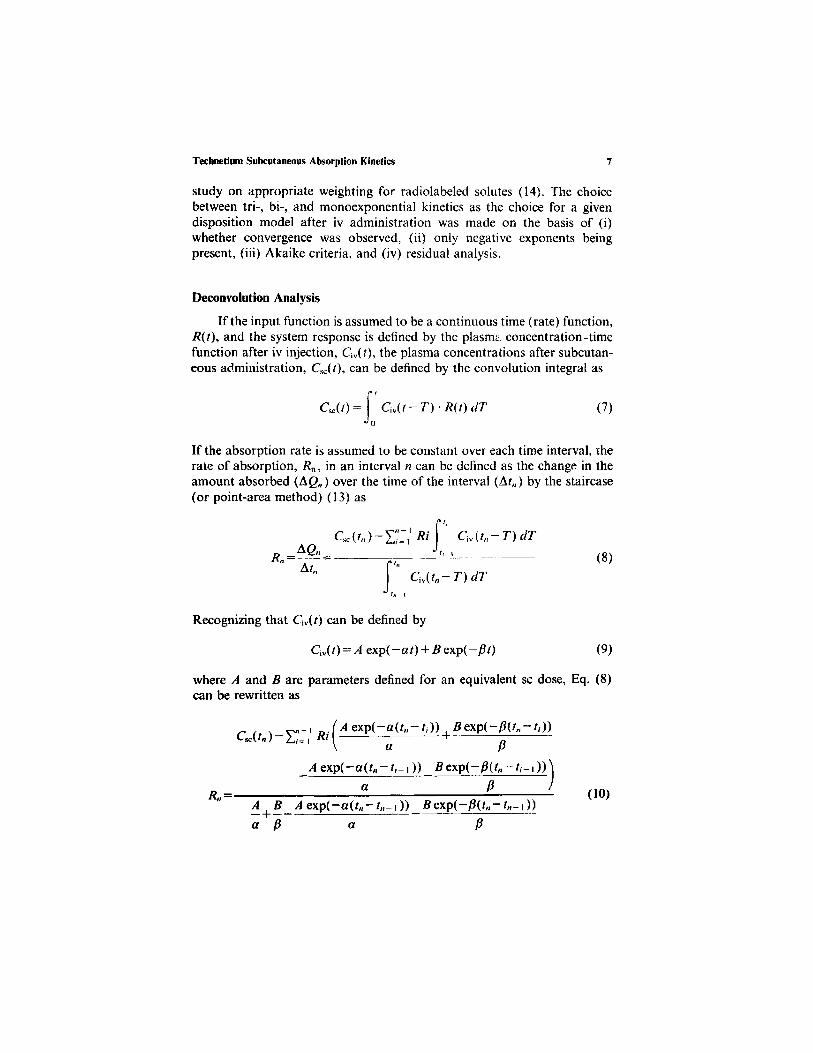
If the input function is assumed to be a continuous time (rate) function,R(t), and the system response is defined by the plasma concentration-timefunction after iv injection, Civ(t), the plasma concentrations after subcutan-eous administration, Csc(t), can be defined by the convolution integral as
If the absorption rate is assumed to be constant over each time interval, therate of absorption, Rn, in an interval n can be defined as the change in theamount absorbed (AQR) over the time of the interval (Atn) by the staircase(or point-area method) (13) as
Recognizing that C i v ( t ) can be defined by
where A and B are parameters defined for an equivalent sc dose, Eq. (8)can be rewritten as
8 Roberts et at.
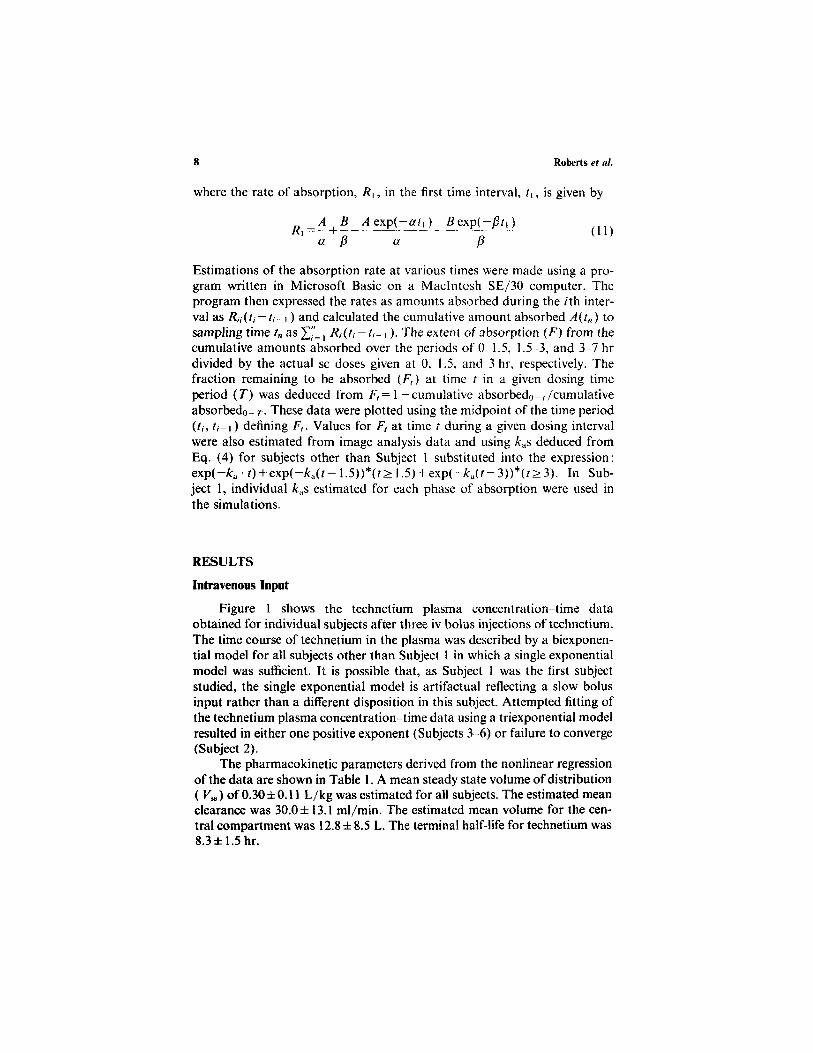
where the rate of absorption, R1, in the first time interval, t1, is given by
Estimations of the absorption rate at various times were made using a pro-gram written in Microsoft Basic on a Macintosh SE/30 computer. Theprogram then expressed the rates as amounts absorbed during the ith inter-val as R i i ( t i — ti-1) and calculated the cumulative amount absorbed A(tn) tosampling time tn as £"i=1 Ri(ti-ti-1). The extent of absorption (F) from thecumulative amounts absorbed over the periods of 0-1.5, 1.5 3, and 3-7 hrdivided by the actual sc doses given at 0, 1.5, and 3 hr, respectively. Thefraction remaining to be absorbed (F 1 ) at time t in a given dosing timeperiod (T) was deduced from F,= 1 —cumulative absorbed0-t/cumulativeabsorbed0- r. These data were plotted using the midpoint of the time period(/,, ti-1) defining Ft. Values for Ft at time t during a given dosing intervalwere also estimated from image analysis data and using kas deduced fromEq. (4) for subjects other than Subject 1 substituted into the expression:exp(-ka0+exp(-ka(t-1.5))*(?>1.5) + exp(-ka(t-3))*(/>3). In Sub-ject 1, individual kas estimated for each phase of absorption were used inthe simulations.
RESULTS
Intravenous Input
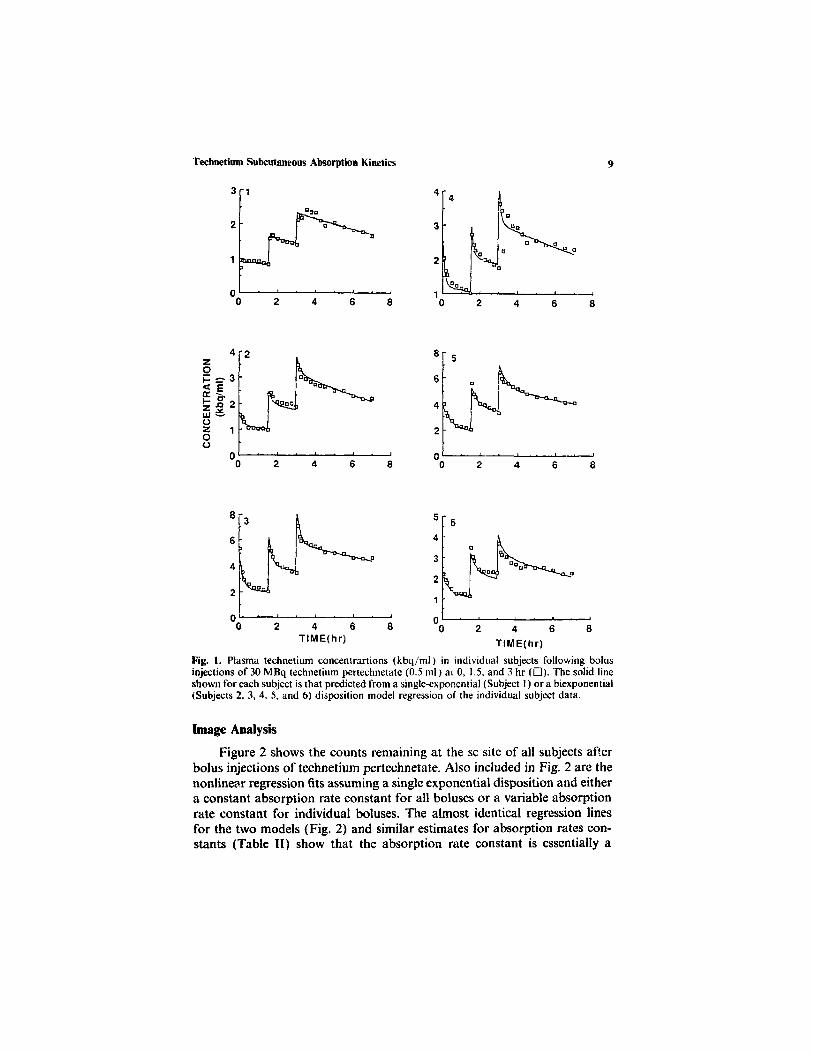
Figure 1 shows the technetium plasma concentration-time dataobtained for individual subjects after three iv bolus injections of technetium.The time course of technetium in the plasma was described by a biexponen-tial model for all subjects other than Subject 1 in which a single exponentialmodel was sufficient. It is possible that, as Subject 1 was the first subjectstudied, the single exponential mode! is artifactual reflecting a slow bolusinput rather than a different disposition in this subject. Attempted fitting ofthe technetium plasma concentration-time data using a triexponential modelresulted in either one positive exponent (Subjects 3-6) or failure to converge(Subject 2).
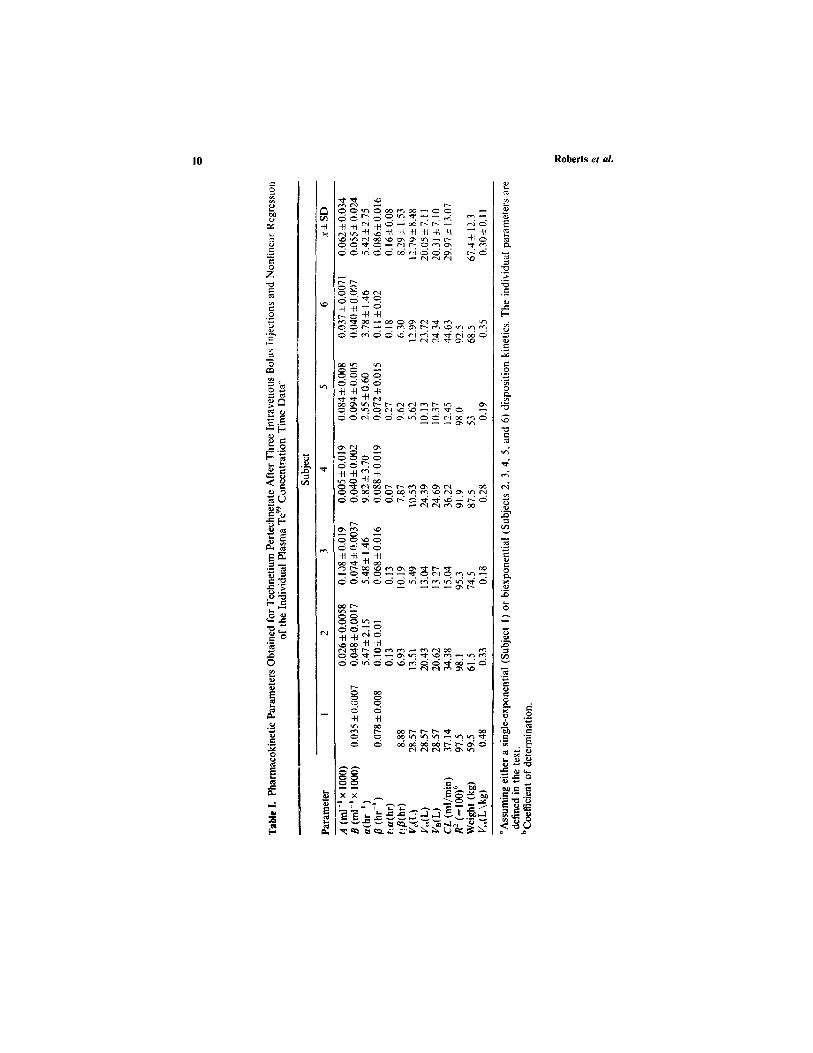
The pharmacokinetic parameters derived from the nonlinear regressionof the data are shown in Table 1. A mean steady state volume of distribution( Vss) of 0.30±0.11 L/kg was estimated for all subjects. The estimated meanclearance was 30.0 ± 13.1 ml/min. The estimated mean volume for the cen-tral compartment was 12.8 ± 8.5 L. The terminal half-life for technetium was8.3±1.5hr.
Technetium Subcutaneous Absorption Kinetics 9
Fig. 1. Plasma technetium concentrartions (kbq/ml) in individual subjects following bolusinjections of 30 MBq technetium pertechnetate (0.5 ml) at 0, 1.5, and 3 hr (D). The solid lineshown for each subject is that predicted from a single-exponential (Subject 1) or a biexponential(Subjects 2, 3, 4, 5, and 6) disposition model regression of the individual subject data.
Image Analysis
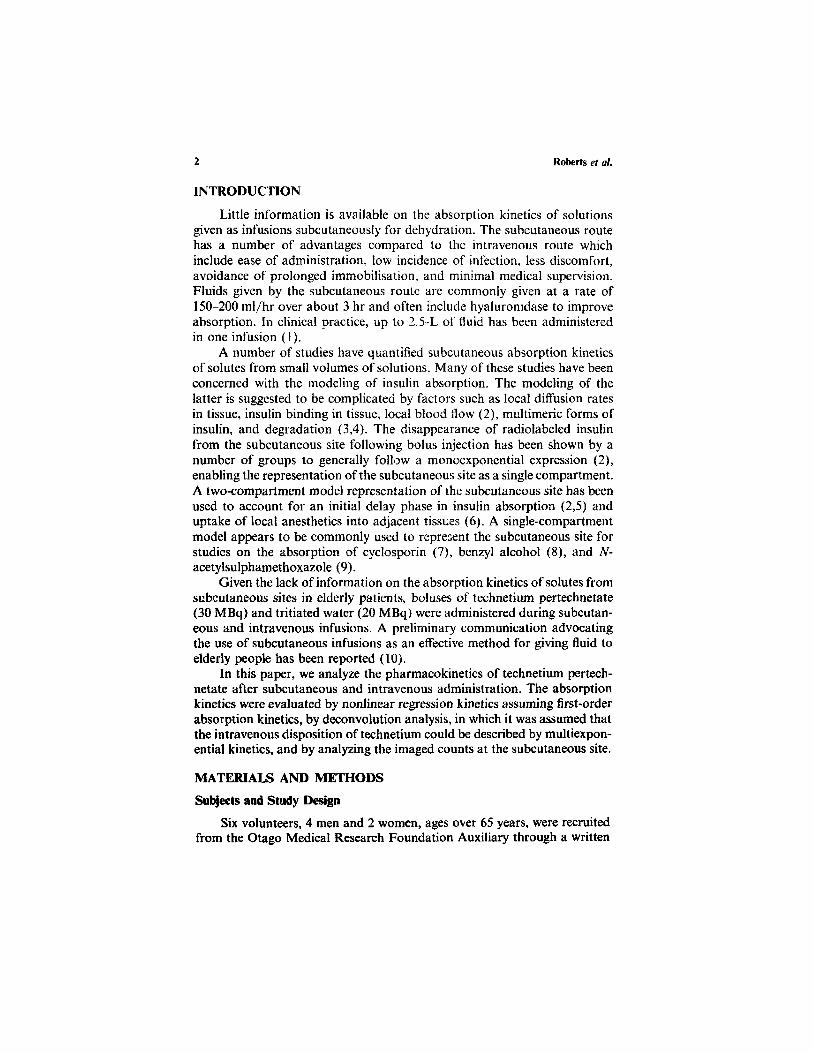
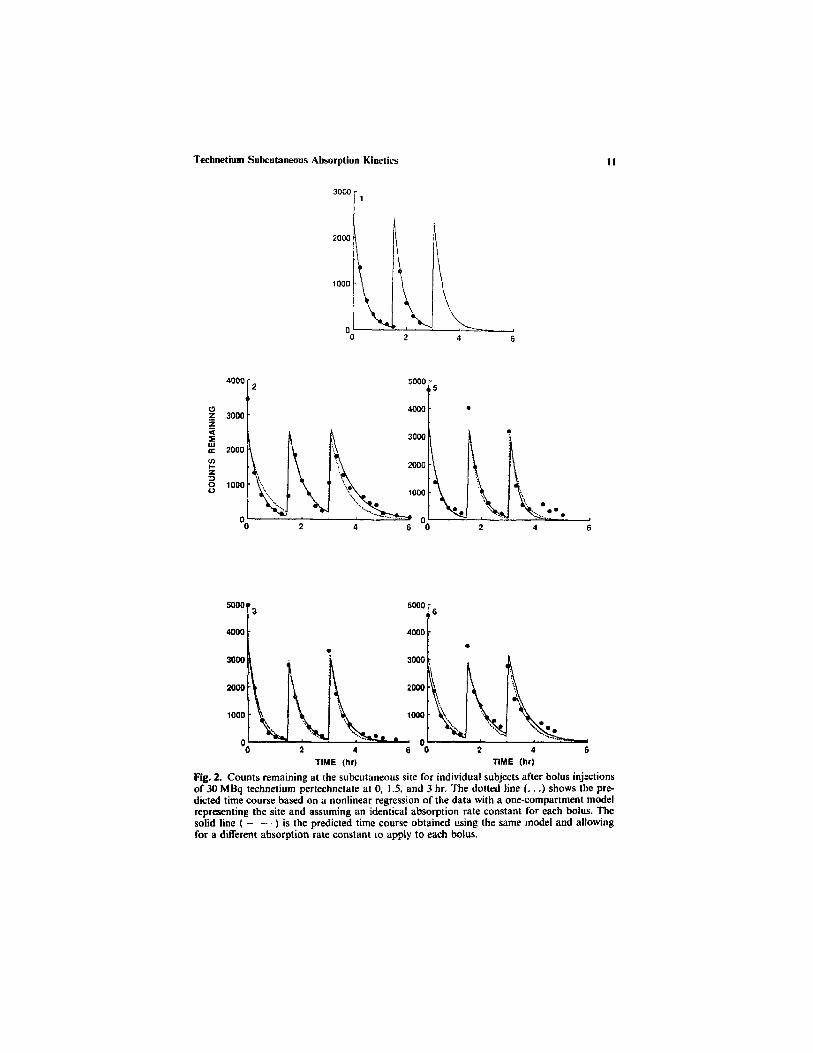
Figure 2 shows the counts remaining at the sc site of all subjects afterbolus injections of technetium pertechnetate. Also included in Fig. 2 are thenonlinear regression fits assuming a single exponential disposition and eithera constant absorption rate constant for all boluses or a variable absorptionrate constant for individual boluses. The almost identical regression linesfor the two models (Fig. 2) and similar estimates for absorption rates con-stants (Table II) show that the absorption rate constant is essentially a
10 Roberts el al.
Technetium Subcutaneous Absorption Kinetics
Fig. 2. Counts remaining at the subcutaneous site for individual subjects after bolus injectionsof 30 MBq technetium pertechnetate at 0, 1.5, and 3 hr. The dotted line (...) shows the pre-dicted time course based on a nonlinear regression of the data with a one-compartment modelrepresenting the site and assuming an identical absorption rate constant for each bolus. Thesolid line ( ) is the predicted time course obtained using the same model and allowingfor a different absorption rate constant to apply to each bolus.
11
12 Roberts et al.
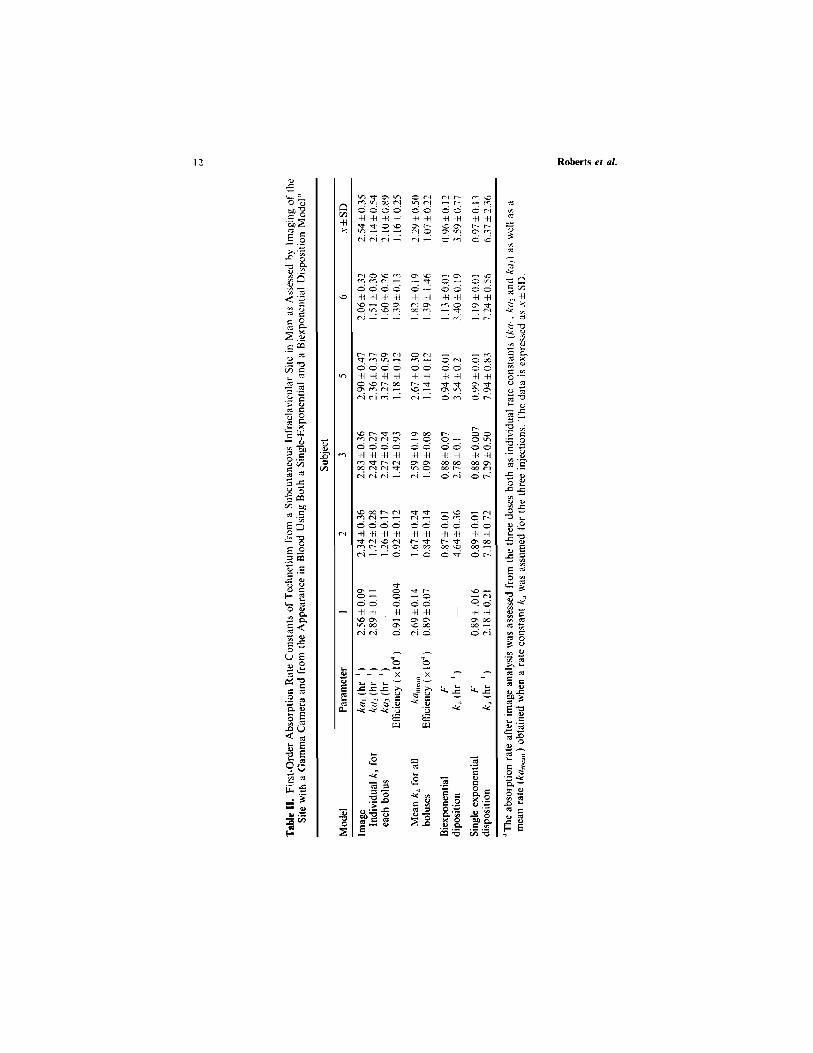
single value independent of the time of administration. The absorption rateconstants for all subjects are similar, irrespective of dose time or phase incrossover design. Table TI shows that overall mean absorption rate constantfor the sc absorption of technetium is 2.29 ±0.5 hr - 1 . The correspondinghalf-life for absorption is 18.16±3.97 min. The efficiency of countingbetween subjects was relatively consistent (x±SD: 1.16 x 10- 4 , Table II),despite the variability expected as a consequence in varation in cameraplacement and tissue effects.
Image analysis can also be affected by background counts being createdby blood circulation and diffusion of solute beneath the site of injection.The positive deviation in counts from the exponential process at the latertimes after the third injection could be accounted for by either a backgroundeffect or a slower absorption process. The addition of background using Eq.(6) improves the fitting of data for Subjects 3, 5, and 6 at low countsand yield a slightly shorter average absorption half-life of 13.30± 1.81 min.However, as considered later in this paper, the improved fitting for Subjects5 and 6 is more likely to be a kinetic than a background effect.
Absorption Kinetics Deduced from Plasma Concentrations
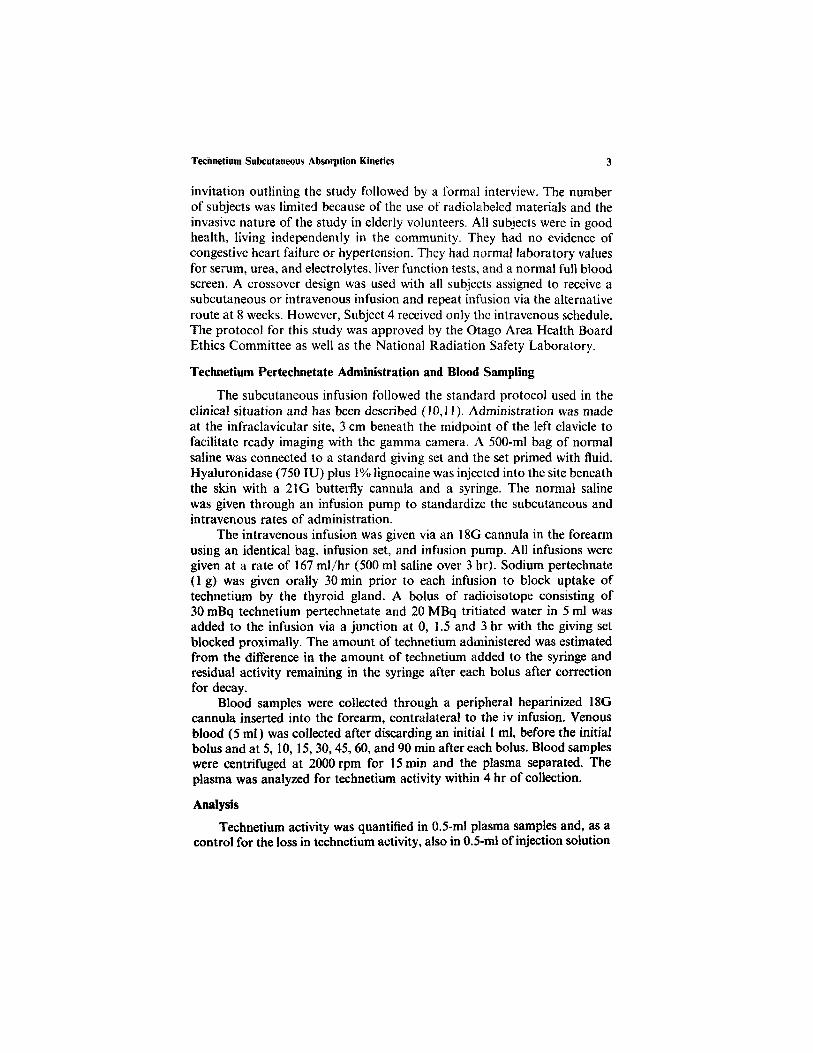
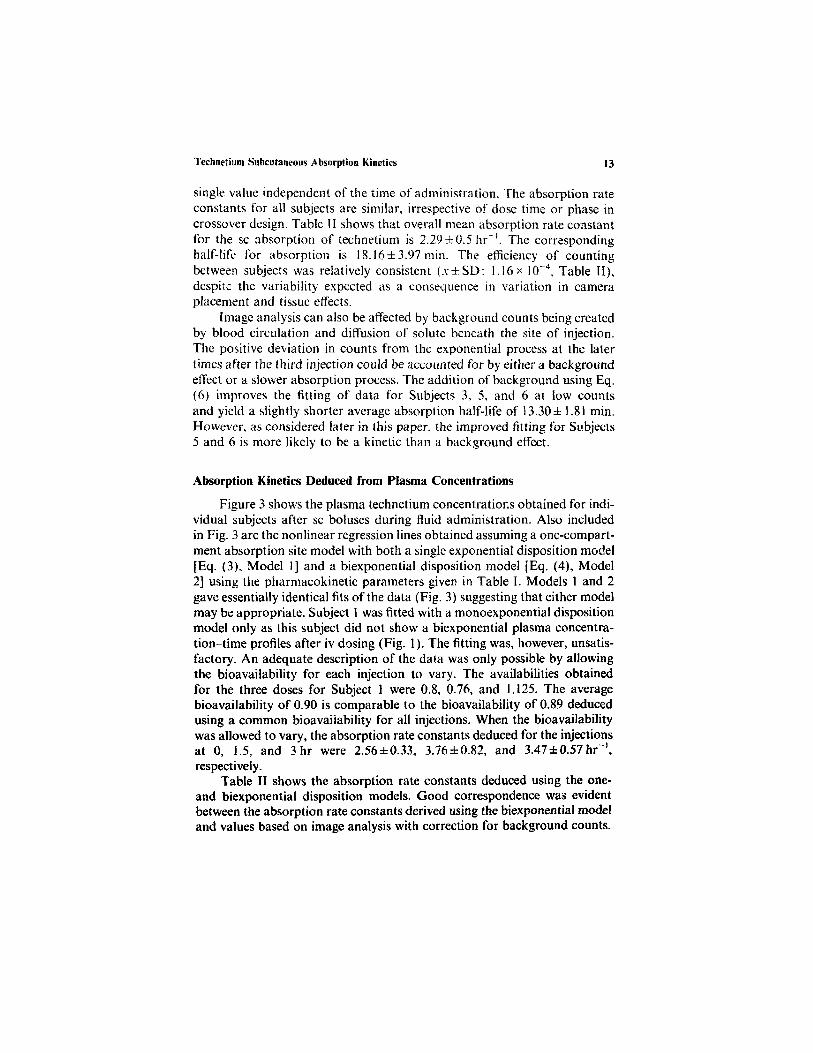
Figure 3 shows the plasma technetium concentrations obtained for indi-vidual subjects after sc boluses during fluid administration. Also includedin Fig. 3 are the nonlinear regression lines obtained assuming a one-compart-ment absorption site model with both a single exponential disposition model[Eq. (3), Model 1] and a biexponential disposition model [Eq. (4), Model2] using the pharmacokinetic parameters given in Table I. Models 1 and 2gave essentially identical fits of the data (Fig. 3) suggesting that either modelmay be appropriate. Subject 1 was fitted with a monoexponential dispositionmodel only as this subject did not show a biexponential plasma concentra-tion-time profiles after iv dosing (Fig. 1). The fitting was, however, unsatis-factory. An adequate description of the data was only possible by allowingthe bioavailability for each injection to vary. The availabilities obtainedfor the three doses for Subject 1 were 0.8, 0.76, and 1.125. The averagebioavailability of 0.90 is comparable to the bioavailability of 0.89 deducedusing a common bioavailability for all injections. When the bioavailabilitywas allowed to vary, the absorption rate constants deduced for the injectionsat 0, 1.5, and 3 hr were 2.56±0.33, 3.76±0.82, and 3.47±0.57hr-1,respectively.
Table II shows the absorption rate constants deduced using the one-and biexponential disposition models. Good correspondence was evidentbetween the absorption rate constants derived using the biexponential modeland values based on image analysis with correction for background counts.
Technetium Subcutaneous Absorption Kinetics 13
14 Roberts et al.
Fig. 3. Plasma technetium pertechnetate concentration (•) time profiles after subcutaneousbolus of 30 mBq at 0, 1.5, and 3 hr. The dotted line (. . .) is the predicted time course from anonlinear regression using Model 1 (single-exponential disposition model) in all subjects. Thesolid line ( ) shewn in subjects 2, 3, 5, and 6 is obtained using Model 2 (biexponentialdisposition). The solid line shown in Fig. 3(1) was obtained by allowing F and ka to vary foreach administration time.
As expected, the mean absorption rate constant obtained with the one-exponential mode! is greater than estimates from the biexponential modeland image analysis.
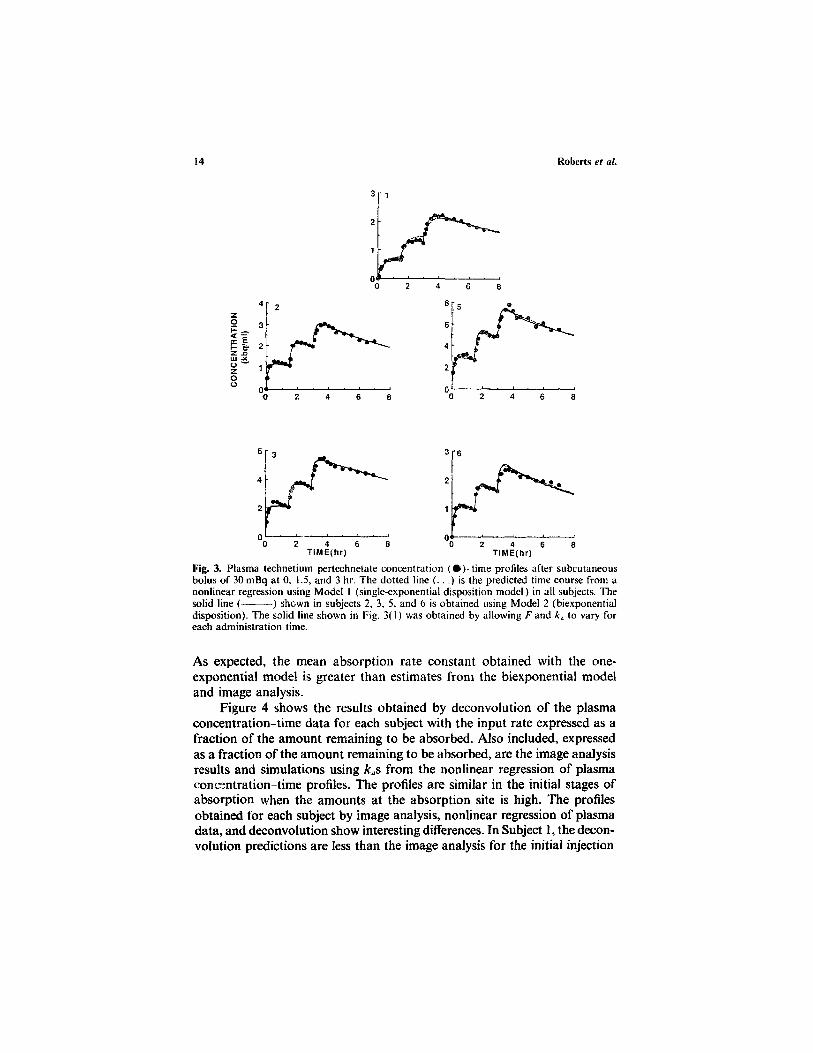
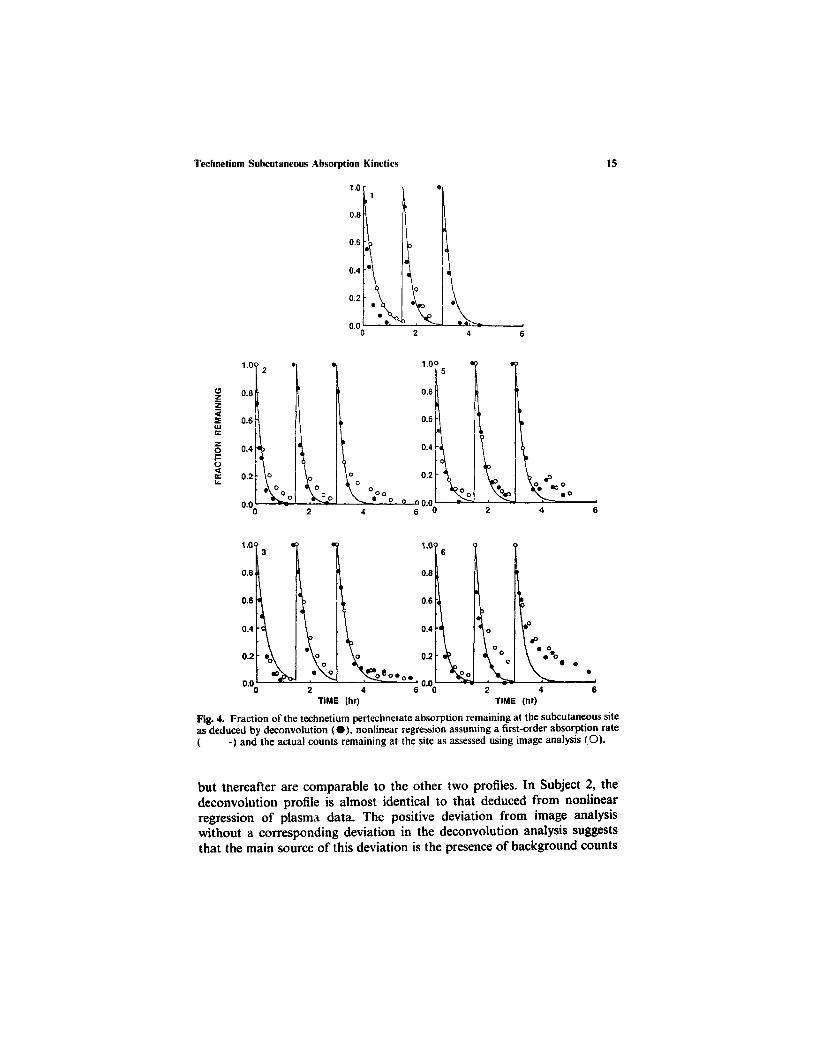
Figure 4 shows the results obtained by deconvolution of the plasmaconcentration-time data for each subject with the input rate expressed as afraction of the amount remaining to be absorbed. Also included, expressedas a fraction of the amount remaining to be absorbed, are the image analysisresults and simulations using kas from the nonlinear regression of plasmaconcentration-time profiles. The profiles are similar in the initial stages ofabsorption when the amounts at the absorption site is high. The profilesobtained for each subject by image analysis, nonlinear regression of plasmadata, and deconvolution show interesting differences. In Subject 1, the decon-volution predictions are less than the image analysis for the initial injection
Technetium Subcutaneous Absorption Kinetics 15
Fig. 4. Fraction of the technetium pertechnetate absorption remaining at the subcutaneous siteas deduced by deconvolution (•), nonlinear regression assuming a first-order absorption rate( ) and the actual counts remaining at the site as assessed using image analysis (O).
but thereafter are comparable to the other two profiles. In Subject 2, thedeconvolution profile is almost identical to that deduced from nonlinearregression of plasma data. The positive deviation from image analysiswithout a corresponding deviation in the deconvolution analysis suggeststhat the main source of this deviation is the presence of background counts
from the recirculation of blood. The deconvolution analysis and image ana-lysis show similar profiles to data deduced by nonlinear regression of plasmadata at early times and during the boluses at 0 and 1.5 hr. However, at latertimes after administration of the final bolus in Subjects 3, 5, and 6, both thedeconvolution and image analysis show corresponding positive deviations.The comparable deviations from a constant first-order absorption profilefor the two methods is suggestive that a slowing of absorption toward theend of the infusion in these subjects is the mechanism responsible.
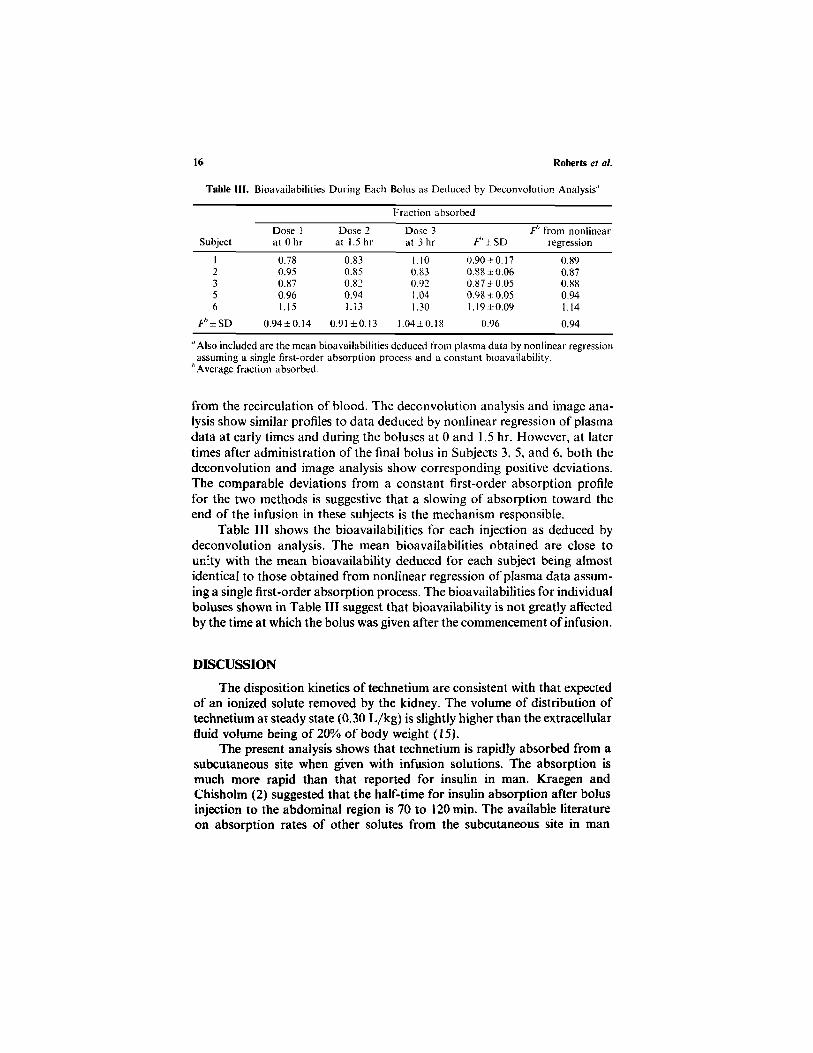
Table III shows the bioavailabilities for each injection as deduced bydeconvolution analysis. The mean bioavailabilities obtained are close tounity with the mean bioavailability deduced for each subject being almostidentical to those obtained from nonlinear regression of plasma data assum-ing a single first-order absorption process. The bioavailabilities for individualboluses shown in Table III suggest that bioavailability is not greatly affectedby the time at which the bolus was given after the commencement of infusion.
DISCUSSION
The disposition kinetics of technetium are consistent with that expectedof an ionized solute removed by the kidney. The volume of distribution oftechnetium at steady state (0.30 L/kg) is slightly higher than the extracellularfluid volume being of 20% of body weight (15).
The present analysis shows that technetium is rapidly absorbed from asubcutaneous site when given with infusion solutions. The absorption ismuch more rapid than that reported for insulin in man. Kraegen andChisholm (2) suggested that the half-time for insulin absorption after bolusinjection to the abdominal region is 70 to 120min. The available literatureon absorption rates of other solutes from the subcutaneous site in man
16 Roberts el al.
Table III. Bioavailabilities During Each Bolus as Deduced by Deconvolution Analysis"
Fraction absorbed
Subject
12356
Fb±SD
Dose 1at 0hr
0.780.950.870.961.15
0.94 ±0.14
Dose 2at 1.5hr
0.830.850.820.941.13
0.91 ±0.13
Dose 3at 3 hr
1.100.830.921.041.30
1.04±0.18
F b ± S D
0.90+0.170.88 ±0.060.87±0.050.98 ±0.051.I9±0.09
0.96
Fb from nonlinearregression
0.890.870.880.941.14
0.94
"Also included are the mean bioavailabilities deduced from plasma data by nonlinear regressionassuming a single first-order absorption process and a constant bioavailability.
bAverage fraction absorbed.
Technetium Subcutaneous Absorption Kinetics 17
appears to be limited. A small number of studies have been conducted inanimals using either subcutaneous injections or absorption cells. Each ofthese studies report a relatively slow absorption of solutes from this site.Shah el al. (7) reported a cyclosporin absorption half-life of 33 days inrabbits. The absorption half-life of benzyl alcohol in subcutaneous diffusioncells applied to the rat was 1.6hr (8). Similar absorption half-lives havebeen reported for lignocaine and its derivatives (6) and lignocaine and sal-icylate (16) in the rat using a similar system. Cross and Roberts (16) showedthat the subcutaneous absorption of interferon 7 (MW ca. 17 Kda) wasslower than lignocaine (MW 234 da) and salicylate (MW 138 da) which werein turn slower than water (MW 18 da). Whereas, lignocaine, salicylate, andwater are absorbed predominantly by the bloodstream, interferon isabsorbed via the lymphatics (16).
The rate of absorption (dM s c /d t ) of a solute from a subcutaneoussite depends not only on the permeability coefficient (P) of the solute intosubcutaneous tissue but also on the solution volume (Ksc) to surface area(S) ratio as defined in
where Msc is the amount of solute at the site of absorption, Csc is theconcentration of solute at the absorption site and ka is the absorption rateconstant of the solute. The absorption half life t( a is
The long absorption half-life obtained from diffusion cell studies in animalsrelative to this study is most likely to reflect the high relative vehicle volumeVsc to surface area S of tissue contact ratio used in animal studies. Thus, avolume of 1.5 ml, an area of 2.32 cm2, and an absorption half-life of 1.6 hrfor benzyl alcohol in a diffusion cell in a rat corresponds to a permeabilitycoefficient P of 0.007 cm/min. A comparable permeability coefficient of0.004 cm/min has been deduced for the capillaries in the hindlimb (17). Bycontrast to the volume to surface area ratio of 0.64 cm observed in animalstudies using a diffusion cell (8), a solution volume to surface area ratio of0.09 cm is deduced at the absorption site of the infusion system when thepermeability coefficient of technetium is assumed to be 0.0055 cm/min andthe absorption half-life is 11.6 min. However, hyaluronidase was includedin the infusion solution. We have shown previously that hyaluronidaseincreases the rate of absorption of tritiated water during subcutaneous inf-usion (10). It is likely that the permeability coefficient of technetium in our
subjects is higher than the assumed value of 0.0055 cm/min and the volumeto surface area ratio smaller than 0.09 cm.
In addition to removal by the blood capillaries, the rate of absorptionduring the subcutaneous infusion is also likely to be governed by the spreadof infusate solution at the site of application. In our preliminary communica-tion, we reported a visual representation of the spread of activity at the sitewith time (10). The activity is not confined to a fixed volume as is impliedby the subcutaneous models used in this work. The area of activity appearsto increase after injection to reach a maximum at 15 min (10). The relativelyconstant absorption half-life for each of the three boluses suggest that asteady state solution volume-to-surface area ratio at the subcutaneous siteis very quickly reached and maintained as defined by Eq. (13). In practice,as defined by Eq. (12), the simple first absorption models described in thiswork remain appropriate, irrespective of how the volume of solution at thesubcutaneous site is changing, providing the solution volume-to-surface arearatio at the subcutaneous site remains constant. This constant ratio appearsto be consistent with the likely physical reality of fluid moving two-dimen-sionally in a radial direction between the layers of tissues, relative to theskin surface, between tissues as determined by the hydrostatic pressure withabsorption occurring in an axial direction into the plane of the tissues. Thesimple one-compartment model proposed in this work contrasts with otherstudies in which a two-compartment subcutaneous site model was used todescribe the absorption of insulin (2,5), local anesthetics (6), and cyclosporin(18).
The apparent slower absorption relative to first-order absorption kinet-ics for Subjects 3, 5, and 6 at later times after the final bolus also correspondswith the cessation of infusion. One explanation would be that the reducedhydrostatic pressure on cessation of infusion may lead to an overall reduc-tion in the clearance of fluid from the site and a lower permeability constantfor technetium.
Ronfeld and Benet (19) examined the interpretation of plasma concen-tration-time curves after oral dosing and observed errors in estimates ofabsorption rate constants when an incorrect disposition model was assumed.An adequate fit of data by a one-compartment disposition model wasobserved when the elimination rate constants in the peripheral compartmentof a two-compartment disposition model were of a similar magnitude as theabsorption rate constant. In the present work, the mean microconstant forelimination from the peripheral compartment (k21) of a two-compartmentmodel deduced from A, B a, and B in Table I, k21 = (AB + Ba)/(A + B), is2.91 hr-1. This value is similar to the absorption rate constant ka deducedfrom both image (2.29^ 0.50 hr - 1) and plasma (3.59 ± 0.23 hr - 1) data.Ronfeld and Benet (19) suggested that the estimated absorption rate derived
18 Roberts et al.
by assuming a one-compartment model when k21 approximates ka would beequal to the distribution rate constant (a) describing distribution in a two-compartment model. The mean value for a obtained for intravenous technet-ium disposition was 5.42 ± 2.75 hr-1 and is of the same magnitude as the ka
deduced using a single-compartment absorption model 6.37±2.36hr-1.The deconvolution and image data show comparable fractions remain-
ing at the site at various times (Fig. 4) and that the analysis of plasma databy nonlinear regression assuming a constant first-order absorption processis appropriate for most times. We had initially ascribed the deviation in thecounts imaged at the site from the first-order absorption profiles at the endof the third bolus to radioactivity at the site from systemic reabsorption.Undertaking deconvolulion analysis allowed us to reach an alternative con-clusion. Deconvolution analysis, which views absorption from what appearsin the plasma, and image analysis, which measures what is remaining at thesite, were similar in their positive deviation from a constant first-order pro-cess for Subjects 3, 5, and 6 towards the end of the third bolus administration(Fig. 4). The most likely explanation for this deviation is a slowing of absorp-tion at the absorption site associated with the end of the infusion. Thediscrepancy between the image analysis and deconvolution results for Sub-ject 2 probably arises from the recirculation effect. Singh and Roberts (20)have shown that at later times after topical application, recirculation effectsare the major determinants of the observed deeper tissue levels. Whereas thepresence of technetium at the absorption site and in the recirculating bloodand in adjacent tissues is observed using image analysis, only the technetiumat the infusion site should be estimated by deconvolution analysis of plasmadata.
In theory, deconvolution analysis, being based on the appearance ofsolute in the plasma, should be most sensitive in defining the first phase ofthe absorption process. Unfortunately, the amount of data available at thesetimes are limited and there is a spreading of radioactivity over the first15 min (10). In contrast, image analysis, based on the observed amountremaining at the absorption site should be more sensitive in defining whathappens when low amounts of solutes remain at the absorption site. Thisanalysis be, however, limited by possible recirculation effects (20). Cross etal. (21) have approached this problem using in situ animal models andstudying dermal absorption using a single-pass perfusion. In practice, theuse of deconvolution, image analysis, or an assumption of a constant first-order process and nonlinear regression of plasma data yield effectively ident-ical profiles, suggesting that the absorption process can be accuratelydescribed as a constant first-order process. The real benefit of comparingprofiles from deconvolution analysis, image analysis, and assumption of aconstant first-order absorption process is to be able to ascertain deviations
Technetium Subcutaneous Absorption Kinetics 19
from first-order absorption profiles and provide some insight into the pos-sible mechanisms for the deviations.
In principle, the most accurate estimate of the absorption rate constantshould be obtained by analyzing image and plasma data simultaneously.Our attempts at obtaining a reliable estimate by this method was hamperedby defining appropriate weighting not only for a given data set but alsobetween data sets. A variance of l/yobs based on the use of radioactivematerials as used elsewhere (14,22) was felt to be appropriate to a givendata set but not between data sets where counts differ by more than anorder of magnitude.
CONCLUSIONS
This work has shown that the kinetics of uptake of technetium duringsubcutaneous infusions is relatively independent of the duration of infusionand is defined by a simple first-order uptake process. The interpretation ofthe uptake rate using plasma concentration time data can be model depen-dent. An understanding of the underlying disposition pharmacokinetics ofthe solute in the body (after iv administration) is required to properly esti-mate the absorption rate and to obtain values consistent with those estimatedby image analysis. A comparison of the results of deconvolution analysis,image analysis, and an assumed first-order absorption process allowed themechanisms for the deviations in absorption profiles from first-order absorp-tion kinetics during subcutaneous infusion to be examined.
REFERENCESI. R. J. Schen and M. Singer-Edelstein. Subc +aneous infusions in the elderly. J. Am. Geriat.
Soc. 29:583 585(1981).2. E. W. Kraegen and D. J. Chisholm. Pharmacokinetics of insulin: Implications for continu-
ous subcutaneous insulin infusion therapy. Clin. Pharmacokin. 10:303-314 (1985).3. D. J. Chisholm, E. W. Kraegen, M. J. Hewett and S. Furler. Low subcutaneous degradation
and slow absorption of insulin in insulin-dependent diabetic patients during continuoussubcutaneous insulin infusion at basal rate. Diabetologia 27:238-241 (1984).
4. E. Mosekilde, K. S. Jensen, C. Binder. S. Pramming and B. Thorsteinsson. Modelingabsorption kinetics of subcutaneous injected soluble insulin. J. Pharmacokin. Biopharm.17:67-897(1989).
5. C. Binder. Absorption of injected insulin. Ada Pharmacol. Toxicol. 27(Suppl. 2):1-84(1969).
6. R. H. Levy, and M. Rowland. Absorption kinetics of a series of local anesthetics from ratsubcutaneous tissue. I. J. Pharmacokin. Biopharm. 2:313-335 (1974).
7. A. K. Shah, R. J. Sawchuk, A. Gratwohl, H. Balomero and B. Speck. Subcutaneousabsorption of cyclosporine in rabbits. Transplant. Proc. 20(Suppl. 2):710-714 (1988).
8. B. E. Ballard and E. Menczel. Subcutaneous absorption kinetics of benzyl alcohol. J.Pharm. Sci. 56:1476 1485 (1967).
9. R. Hori, F. Komada and K. Okumura. Pharmaceutical approach to subcutaneous dosageforms of insulin. J. Pharm. Sci. 72:435 439 (1983).
20 Roberts et al.
10. S. Lipschitz. A. J. Campbell, M. S. Roberts, S. Wanwimolruk, E. G. McQueen, M.McQueen and L. A. Firth. Subcutaneous fluid administration in elderly subjects: validationof an under-used technique J. Am. Geriat. Soc. 39:6 9 (1991).
11. J. C. Doig and S. D. Slater. The misuse of intravenous cannulae. Scot. Med. J. 33:325-326(1988).
12. M. Gibaldi and D. Perrier. Pharmacokinetics, 2nd ed.. Marcel Dekker, New York, 1982.13. A. Deslandes, J. F. Westphal. J. H. Trouvin and R. Farinotti. Adaptive computer program
for determination of absorption profiles by numerical deconvolution: application to amoxi-cillin absorption. J. Pharm. Sci. 81:802 807 (1992).
14. R. H. Rasiah, R. D. Purves and M. S. Roberts. An investigation of weighting appropriateto multiple indicator dilution radioactive samples by Monte Carlo simulations. Proc. Aust.Soc. Clin. Exp. Pharmacol Toxicol. 1:102 (1994).
15. M. Rowland and T. Tozer. Clinical Pharmacokinetics, Lea & Febiger, Philadelphia, 1980.16. S. E. Cross and M. S. Roberts. Subcutaneous absorption kinetics of interferon and other
solutes. J. Pharm. Pharmacol. 45:606 609 (1993).17. C. Crone. The permeability of capillaries in various organs as determined by use of the
indicator diffusion method." Ada Physiol. Scand. 58:292 305 (1963).18. A. K. Shah, R. C. Brundage, A. Gratwohl and R. J. Sawchuk. Pharmacokinetic model
for subcutaneous absorption of cyclosporin in the rabbit during chronic treatment. J.Pharm. Sci. 81:491 495 (1992).
19. R. A. Ronfeld and L. Z. Benet. Interpretation of plasma concentration time curves afteroral dosing. J. Pharm. Sci. 66:178 180 (1977).
20. P. Singh and M. S. Roberts. Dermal and underlying tissue pharmacokinetics of lignocaineafter topical application. J. Pharm. Sci. 83:774 782 (1994).
21. S. E. Cross, Z. Y. Wu and M. S. Roberts. The effect of protein binding on the deep tissuepenetration and efflux of dermally applied salicylic acid, lidocaine and diazepam in theperfused rat hindlimb. J. Pharmacol. Exp. Ther. 277:366-374 (1996).
22. M. J. Potchoiba, T. G. Tensfeldt, M. R. Nocerini and B. M. Silber. A novel quantitativemethod for determining the biodistribution of radiolabelled xenobiotics using whole-bodycrysectioning and autoradioluminography. J. Pharmacol. Exp. Ther. 272:953-962 (1995).
Technetium Subcutaneous Absorption Kinetics 21
Copyright © 2022 FDOKUMEN