Protein Array Reveals Differentially Expressed Proteins in Subcutaneous Adipose Tissue in Obesity
11
Cellular and Molecular Protein Array Reveals Differentially Expressed Proteins in Subcutaneous Adipose Tissue in Obesity Martina S ˇ kopkova ´,* Adela Penesova ´,* Henrike Sell,† Z ˇ ofia Ra ´dikova ´,* Miroslav Vlc ˇek,* Richard Imrich,* Juraj Kos ˇka,* Jozef Ukropec,* Ju ¨rgen Eckel,† Iwar Klimes ˇ,* and Daniela Gas ˇperı ´kova ´* Abstract S ˇ KOPKOVA ´ , MARTINA, ADELA PENESOVA ´ , HENRIKE SELL, Z ˇ OFIA RA ´ DIKOVA ´ , MIROSLAV VLC ˇ EK, RICHARD IMRICH, JURAJ KOS ˇ KA, JOZEF UKROPEC, JU ¨ RGEN ECKEL, IWAR KLIMES ˇ , AND DANIELA GAS ˇ PERI ´ KOVA ´ . Protein array reveals differentially expressed proteins in subcutaneous adipose tissue in obesity. Obesity. 2007;15:2396 –2406. Objective: Many adipokines, inflammatory cytokines, and other proteins produced by adipose tissue have been shown to be involved in the development of obesity-related insulin resistance. Nevertheless, new factors that play an important role in these processes are still emerging. Therefore, we screened the level of 120 different proteins in biopsies of subcutaneous adipose tissue (ScAT) of lean and obese sub- jects. Research Methods and Procedures: All studied volunteers (12 obese with BMI 30 and 6 lean with BMI 25 kg/m 2 ) were young, clinically healthy, and drug-naive males with normal glucose tolerance. The ScAT was obtained by a needle biopsy from the umbilical region. Protein levels were assessed in adipose tissue lysates using protein arrays; mRNA levels were determined with the aid of real-time reverse transcription-polymerase chain reaction (RT-PCR). Results: The obese subjects had higher fasting plasma glu- cose (although within the normal range) and insulin levels, increased high sensitivity C-reactive protein (hsCRP) in circulation, and decreased in vivo insulin action. Using the protein array technique, it was shown that of 120 proteins measured, 27 showed higher levels (leptin, HGF, EGF-R, FGF-6, IGF-1sR, Fas/Apo-1, ENA-78, PARC, lymphotac- tin, HCC-4, IL-10, IL-1a, IL-1R1, IL-1R4, IL-12p70, an- giopoietin-2, Axl, Dtk, MIF, MIP-1a, 1b, 3b, MSP-a, osteoprotegerin, TECK, TIMP-1, -2) and only one (RAN- TES) showed a lower level in ScAT of obese subjects when compared with the lean controls (p 0.05). The real-time RT-PCR confirmed the results of protein arrays for leptin, MIF, MIP-1a, TIMP-2, adiponectin, IL-6, and TNF- but not for RANTES. Discussion: To our knowledge, this is the first protein array data on a very early dysregulation of ScAT protein levels in insulin-resistant obese, but apparently healthy, subjects with normal glucose tolerance. Key words: cytokines, inflammation, insulin resistance, protein Introduction Obesity is one of the main contributing factors to the development of type 2 diabetes mellitus. However, detailed mechanisms by which obesity contributes to insulin resis- tance are not yet fully understood. New information from the last couple of years shows that obesity is associated with subclinical inflammation, as manifested by increased levels of high sensitivity C-reactive protein (hsCRP) 1 and var- ious cytokines in circulation and by enhanced macro- phage infiltration into adipose tissue (1–3). Many studies have already shown that stimulation of inflammatory pathways directly and/or indirectly inhibits insulin sig- Received for review October 9, 2006. Accepted in final form February 20, 2007. The costs of publication of this article were defrayed, in part, by the payment of page charges. This article must, therefore, be hereby marked “advertisement” in accordance with 18 U.S.C. Section 1734 solely to indicate this fact. *Institute of Experimental Endocrinology Slovak Academy of Sciences, Bratislava, Slova- kia; and †German Diabetes Center, Institute of Clinical Biochemistry and Pathobiochemis- try, Du ¨sseldorf, Germany. Address correspondence to Daniela Gas ˇperı ´kova ´, Institute of Experimental Endocrinology, EU Centre of Excellence, Slovak Academy of Sciences, Vla ´rska 3, SK-83306 Bratislava, Slovak Republic. E-mail: [email protected] Copyright © 2007 NAASO 1 Nonstandard abbreviations: hsCRP, high sensitivity C-reactive protein; TNF-, tumor necrosis factor-alpha; IL-6, interleukin-6; PCR, polymerase chain reaction; OGTT, oral glucose tolerance test; EHC, euglycemic hyperinsulinemic clamp; HOMA, homeostasis model assessment; RT-PCR, reverse transcription-PCR; O, obese group; C, control group. 2396 OBESITY Vol. 15 No. 10 October 2007
-
Upload
independent -
Category
Documents
-
view
6 -
download
0
Transcript of Protein Array Reveals Differentially Expressed Proteins in Subcutaneous Adipose Tissue in Obesity
Cellular and Molecular
Protein Array Reveals Differentially ExpressedProteins in Subcutaneous Adipose Tissue inObesityMartina Skopkova,* Adela Penesova,* Henrike Sell,† Zofia Radikova,* Miroslav Vlcek,* Richard Imrich,*Juraj Koska,* Jozef Ukropec,* Jurgen Eckel,† Iwar Klimes,* and Daniela Gasperıkova*
AbstractSKOPKOVA, MARTINA, ADELA PENESOVA,HENRIKE SELL, ZOFIA RADIKOVA, MIROSLAVVLCEK, RICHARD IMRICH, JURAJ KOSKA, JOZEFUKROPEC, JURGEN ECKEL, IWAR KLIMES, ANDDANIELA GASPERIKOVA. Protein array revealsdifferentially expressed proteins in subcutaneous adiposetissue in obesity. Obesity. 2007;15:2396–2406.Objective: Many adipokines, inflammatory cytokines, andother proteins produced by adipose tissue have been shownto be involved in the development of obesity-related insulinresistance. Nevertheless, new factors that play an importantrole in these processes are still emerging. Therefore, wescreened the level of 120 different proteins in biopsies ofsubcutaneous adipose tissue (ScAT) of lean and obese sub-jects.Research Methods and Procedures: All studied volunteers(12 obese with BMI �30 and 6 lean with BMI �25kg/m2) were young, clinically healthy, and drug-naivemales with normal glucose tolerance. The ScAT wasobtained by a needle biopsy from the umbilical region.Protein levels were assessed in adipose tissue lysatesusing protein arrays; mRNA levels were determined withthe aid of real-time reverse transcription-polymerasechain reaction (RT-PCR).Results: The obese subjects had higher fasting plasma glu-cose (although within the normal range) and insulin levels,
increased high sensitivity C-reactive protein (hsCRP) incirculation, and decreased in vivo insulin action. Using theprotein array technique, it was shown that of 120 proteinsmeasured, 27 showed higher levels (leptin, HGF, EGF-R,FGF-6, IGF-1sR, Fas/Apo-1, ENA-78, PARC, lymphotac-tin, HCC-4, IL-10, IL-1a, IL-1R1, IL-1R4, IL-12p70, an-giopoietin-2, Axl, Dtk, MIF, MIP-1a, �1b, �3b, MSP-a,osteoprotegerin, TECK, TIMP-1, -2) and only one (RAN-TES) showed a lower level in ScAT of obese subjects whencompared with the lean controls (p � 0.05). The real-timeRT-PCR confirmed the results of protein arrays for leptin,MIF, MIP-1a, TIMP-2, adiponectin, IL-6, and TNF-� butnot for RANTES.Discussion: To our knowledge, this is the first protein arraydata on a very early dysregulation of ScAT protein levels ininsulin-resistant obese, but apparently healthy, subjects withnormal glucose tolerance.
Key words: cytokines, inflammation, insulin resistance,protein
IntroductionObesity is one of the main contributing factors to the
development of type 2 diabetes mellitus. However, detailedmechanisms by which obesity contributes to insulin resis-tance are not yet fully understood. New information fromthe last couple of years shows that obesity is associated withsubclinical inflammation, as manifested by increased levelsof high sensitivity C-reactive protein (hsCRP)1 and var-ious cytokines in circulation and by enhanced macro-phage infiltration into adipose tissue (1–3). Many studieshave already shown that stimulation of inflammatorypathways directly and/or indirectly inhibits insulin sig-
Received for review October 9, 2006.Accepted in final form February 20, 2007.The costs of publication of this article were defrayed, in part, by the payment of pagecharges. This article must, therefore, be hereby marked “advertisement” in accordance with18 U.S.C. Section 1734 solely to indicate this fact.*Institute of Experimental Endocrinology Slovak Academy of Sciences, Bratislava, Slova-kia; and †German Diabetes Center, Institute of Clinical Biochemistry and Pathobiochemis-try, Dusseldorf, Germany.Address correspondence to Daniela Gasperıkova, Institute of Experimental Endocrinology,EU Centre of Excellence, Slovak Academy of Sciences, Vlarska 3, SK-83306 Bratislava,Slovak Republic.E-mail: [email protected] © 2007 NAASO
1 Nonstandard abbreviations: hsCRP, high sensitivity C-reactive protein; TNF-�, tumornecrosis factor-alpha; IL-6, interleukin-6; PCR, polymerase chain reaction; OGTT, oralglucose tolerance test; EHC, euglycemic hyperinsulinemic clamp; HOMA, homeostasismodel assessment; RT-PCR, reverse transcription-PCR; O, obese group; C, control group.
2396 OBESITY Vol. 15 No. 10 October 2007
naling (4). Thus, it is now recognized that subclinicalinflammation is involved in the development of insulinresistance in the obese state (5).
There are several cytokines and adipokines produced byadipose tissue that have been extensively studied in relationto inflammation in obesity [e.g., adiponectin, leptin, resistin,tumor necrosis factor-alpha (TNF-�), interleukin-6 (IL-6)](6–8). Adipose tissue produces, however, an additionallarge number of biologically active molecules, includingseveral cytokines that might potentially play a role in thedevelopment of obesity-related insulin resistance. There-fore, we used a pre-designed high-throughput protein array,which permits simultaneous quantification of 120 cytokinesand related proteins, to screen their levels in subcutaneousadipose tissue of lean and obese subjects. In addition, wemeasured expression of genes for selected cytokines in thistissue to confirm the results obtained by the protein array.The volunteer recruitment criteria were set to identifyyoung, healthy, obese men without diabetes or pre-diabetes,who were compared with a group of young, healthy, leanindividuals. Thus, the primary aim of this study was toprovide new information about very early abnormalities inthe adipose tissue proteomic profile and to link obesity toinflammation and early signs of insulin resistance in obese,though yet clinically healthy, subjects.
Research Methods and ProceduresSubjects and Study Design
The nature and potential risks of the study were explainedto all subjects before obtaining their written informed con-sent. The study was approved by the Ethics Committee ofthe Derer’s Faculty Hospital in Bratislava and conforms tothe ethical guidelines of the Declaration of Helsinki asrevised in 2000 (9).
White males were recruited using the following inclusioncriteria: 1) age 20 to 45 years, 2) BMI either 19 to 25 kg/m2
(lean group) or 30 to 40 kg/m2 (obese group), 3) normalfasting glucose (� 5.6 mM) and normal glucose tolerance(� 7.8 mM 2 hours after oral glucose administration), 4) nodietary restrictions, 5) no treatment with drugs that mayalter glucose tolerance, lipid metabolism, or blood pressure,and 6) no known acute or chronic disease other than obesitybased on history and physical examination. Thus, 18 appar-ently healthy men, 6 lean and 12 obese without any treat-ment, were included in the study. Their clinical character-istics are shown in Table 1. An extended set of volunteers(31 subjects: 15 lean and 16 obese) were analyzed withreal-time polymerase chain reaction (PCR), and their clini-cal characteristics did not differ from the subset used for theprotein array.
To identify obese subjects with normal glucose tolerance,each individual underwent a standard oral glucose tolerance
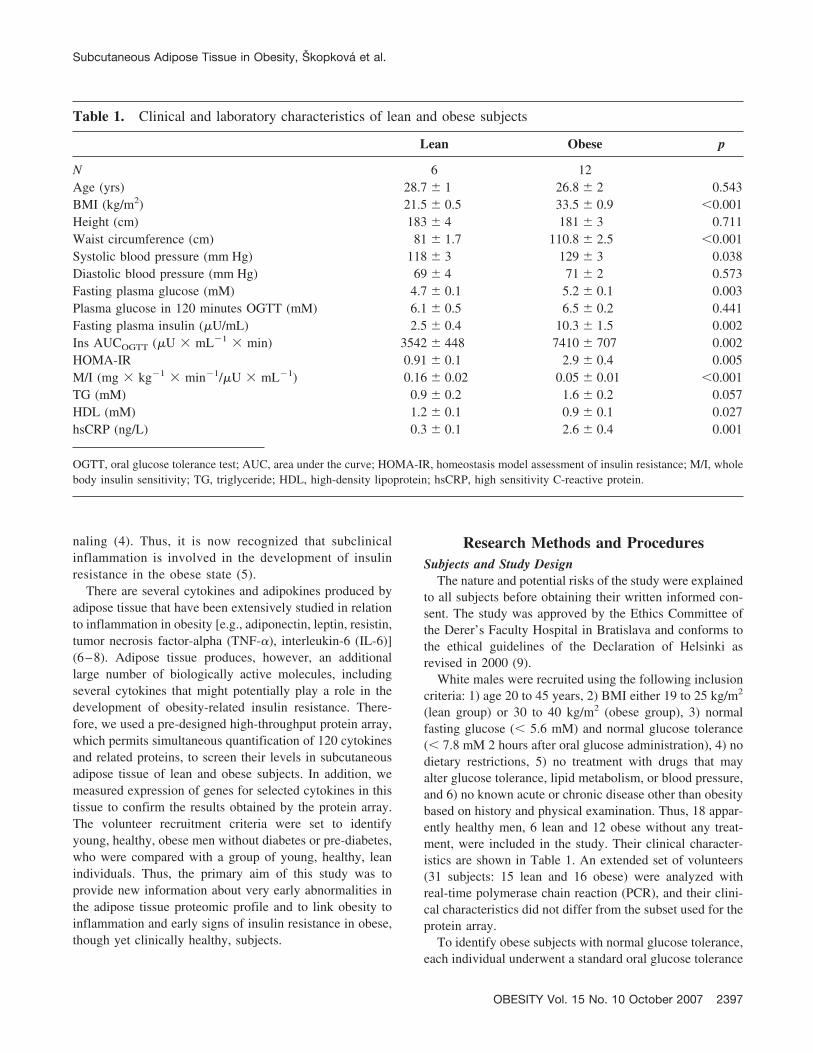
Table 1. Clinical and laboratory characteristics of lean and obese subjects
Lean Obese p
N 6 12Age (yrs) 28.7 � 1 26.8 � 2 0.543BMI (kg/m2) 21.5 � 0.5 33.5 � 0.9 �0.001Height (cm) 183 � 4 181 � 3 0.711Waist circumference (cm) 81 � 1.7 110.8 � 2.5 �0.001Systolic blood pressure (mm Hg) 118 � 3 129 � 3 0.038Diastolic blood pressure (mm Hg) 69 � 4 71 � 2 0.573Fasting plasma glucose (mM) 4.7 � 0.1 5.2 � 0.1 0.003Plasma glucose in 120 minutes OGTT (mM) 6.1 � 0.5 6.5 � 0.2 0.441Fasting plasma insulin (�U/mL) 2.5 � 0.4 10.3 � 1.5 0.002Ins AUCOGTT (�U � mL�1 � min) 3542 � 448 7410 � 707 0.002HOMA-IR 0.91 � 0.1 2.9 � 0.4 0.005M/I (mg � kg�1 � min�1/�U � mL�1) 0.16 � 0.02 0.05 � 0.01 �0.001TG (mM) 0.9 � 0.2 1.6 � 0.2 0.057HDL (mM) 1.2 � 0.1 0.9 � 0.1 0.027hsCRP (ng/L) 0.3 � 0.1 2.6 � 0.4 0.001
OGTT, oral glucose tolerance test; AUC, area under the curve; HOMA-IR, homeostasis model assessment of insulin resistance; M/I, wholebody insulin sensitivity; TG, triglyceride; HDL, high-density lipoprotein; hsCRP, high sensitivity C-reactive protein.
Subcutaneous Adipose Tissue in Obesity, Skopkova et al.
OBESITY Vol. 15 No. 10 October 2007 2397
test (OGTT). Whole-body insulin sensitivity was also mea-sured in each subject, using the euglycemic hyperinsuline-mic clamp (EHC) technique. The two investigations, OGTTand EHC, were carried out at least 2 days apart to eliminatepotential effects of these interventions on metabolic vari-ables. A needle biopsy of subcutaneous adipose tissue wastaken before the OGTT.
OGTTAfter an overnight fast, an indwelling catheter (Surflo-W
Terumo, Belgium) was placed into an antecubital vein forblood sampling. Blood samples were drawn before (0 min-utes) and after (30, 60, 90, and 120 minutes) ingestion of75 g glucose for determination of plasma glucose and insu-lin levels. In addition, an estimate of insulin sensitivity wasobtained by the homeostasis model assessment (HOMA)score as calculated using the formula of Matthews et al.(10): fasting plasma insulin (�U/mL) � glucose (mM)/22.5.
Whole-Body Insulin SensitivityMeasurements of whole-body insulin sensitivity were
carried out with aid of the EHC technique after an overnightfast (11). Two indwelling catheters (Surflo-W Terumo)were inserted in antecubital veins, one for infusion of insu-lin and glucose and the other to obtain venous blood formeasurement of glucose concentrations. Regular humaninsulin (Actrapid; Novo Nordisk, Denmark) was infused ina primed-continuous fashion. The rate of the continuousinsulin infusion was 1 mU per kg body weight per min for3 hours. Euglycemia was maintained by adjusting the rate ofa 20% glucose infusion based on plasma glucose measure-ments from venous blood every 5 minutes. Whole bodyinsulin sensitivity (M/I) was determined from the glucoseinfusion rate (M) required to maintain euglycemia between30 and 180 minutes and the steady state insulin levels (I)during this period.
Analytical ProceduresPlasma glucose concentrations were measured with the
glucose oxidase method (Hitachi 911, Hitachinaka, Japan).Plasma insulin concentrations were measured by the IRMAmethod (Immunotech, Marseille, France). Serum high-den-sity lipoprotein cholesterol and triglyceride concentrationswere measured with enzymatic kits from Roche Diagnosticsusing an autoanalyzer (Roche Diagnostics Hitachi 911; Hi-tachi, Tokyo, Japan). Serum CRP concentrations were mea-sured by an immunoturbidimetric method using a highsensitivity test (Randox, U.K.).
Adipose Tissue BiopsyAbdominal subcutaneous adipose tissue was taken from
the umbilicus region by aspiration with a bioptic needle(Medin, Nove Mesto n. Morave, Czech Republic) underlocal subcutaneous anesthesia (1% Mesokain; Leciva, Pra-
gue, Czech Republic) after an overnight fast before theOGTT. The sample was quickly washed in saline to elimi-nate blood and connective tissue, immediately snap frozenin liquid nitrogen, and stored at �80 °C until analysis.
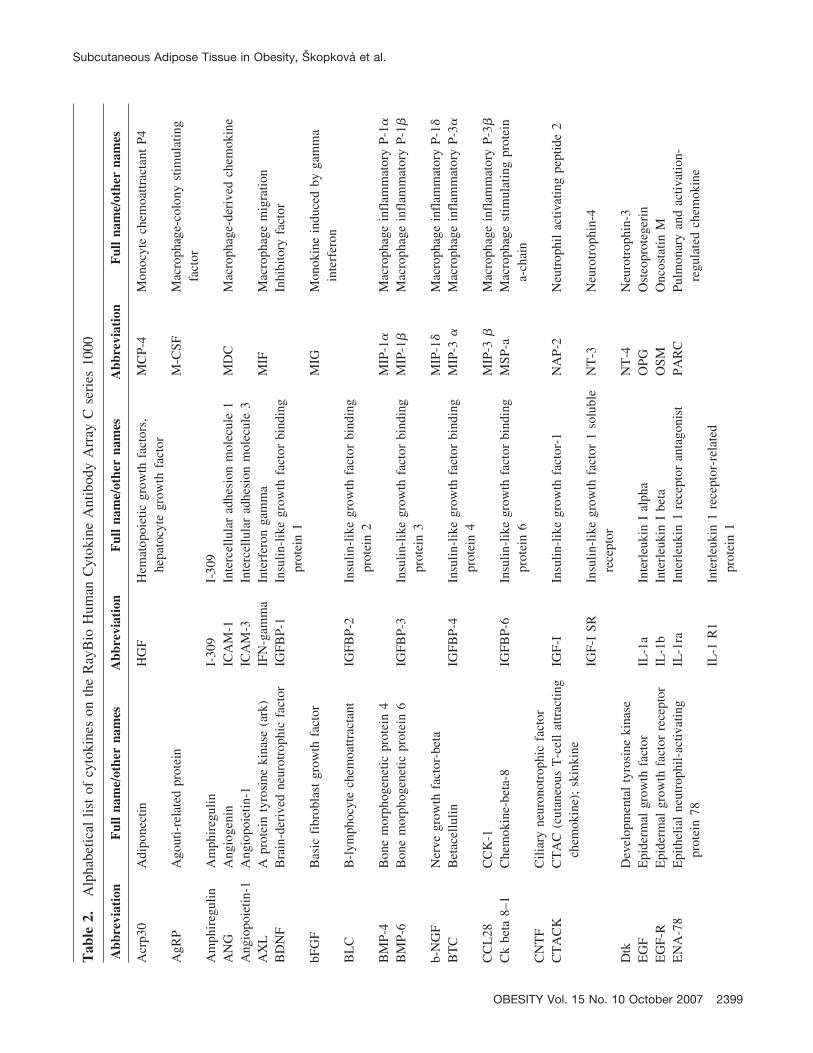
Protein ArrayProtein levels in subcutaneous adipose tissue were mea-
sured using the RayBioHuman Cytokine Antibody Arrays Cseries 1000.1 (RayBiotech) in 18 subjects (6 lean and 12obese) using one array per tissue sample (total of 18 arrays).The full list of measured proteins is shown in Table 2 andcan also be found online at http://www.raybiotech.com/map/C_Series_1000.pdf. Tissue lysates were prepared from70 to 150 mg of powdered subcutaneous adipose tissueusing cell lysis buffer (RayBiotech) with addition of theprotease inhibitor cocktail Complete (Roche, Switzerland).After 2 hours of lysis at 4 °C and centrifugation (10,000g,15 minutes, 4 °C), the protein content in the supernatant wasmeasured using the BioRad Protein Assay (BioRad); 200�g of proteins was used for analysis. The protein arrayswere processed as recommended by the producer. The arraysensitivity data are available at http://www.raybiotech.com/human_array_sensitivity.pdf.
The intensities of signals were quantified by densitometrywith the aid of the LumiImager device (Roche, Switzerland)using the LumiAnalyst software (Roche, Switzerland). Theresults were normalized to an internal positive control pro-vided on each membrane. The relative expression levels(target gene signal/positive control signal) were used tocompare the subjects. Proteins of interest were alwayspresent in duplicates, and positive controls (n � 8) were intwo different locations of the array. Due to the obviouslimitations of the protein array technology, the most prom-inent results were confirmed by real-time PCR.
Total RNA PreparationPowdered frozen tissue samples (200 mg) were homog-
enized using Ultra-Turax T8 homogenizator (IKA,Labortechnik, Germany) in 4 mL QIAzol Lysis Reagent(Qiagen, Hilden, Germany). Total RNA was isolated usingan RNeasy lipid tissue mini kit (Qiagen) according to themanufacturer’s instructions, including a DNase treatmentstep (RNase-free DNase Set, Qiagen). RNA concentrationand purity were measured spectrophotometrically, and RNAsample integrity was verified on agarose gels (2%) stainedwith ethidium bromide. Isolated RNA was stored at �80 °Cuntil quantification of target mRNAs.
Quantification of Relative mRNA ConcentrationsGene expression was measured by real-time reverse tran-
scription (RT)-PCR. First, 1 �g of total RNA was used forreverse transcription to synthesize the first-strand cDNAusing the GeneAmp RNA PCR kit (Applied Biosystems)containing MuLV reverse transcriptase and random hexam-
Subcutaneous Adipose Tissue in Obesity, Skopkova et al.
2398 OBESITY Vol. 15 No. 10 October 2007
Tab
le2.
Alp
habe
tical
list
ofcy
toki
nes
onth
eR
ayB
ioH
uman
Cyt
okin
eA
ntib
ody
Arr
ayC
seri
es10
00
Abb
revi
atio
nF
ull
nam
e/ot
her
nam
esA
bbre
viat
ion
Ful
lna
me/
othe
rna
mes
Abb
revi
atio
nF
ull
nam
e/ot
her
nam
es
Acr
p30
Adi
pone
ctin
HG
FH
emat
opoi
etic
grow
thfa
ctor
s,he
pato
cyte
grow
thfa
ctor
MC
P-4
Mon
ocyt
ech
emoa
ttrac
tant
P4
AgR
PA
gout
i-re
late
dpr
otei
nM
-CSF
Mac
roph
age-
colo
nyst
imul
atin
gfa
ctor
Am
phir
egul
inA
mph
ireg
ulin
I-30
9I-
309
AN
GA
ngio
geni
nIC
AM
-1In
terc
ellu
lar
adhe
sion
mol
ecul
e1
MD
CM
acro
phag
e-de
rive
dch
emok
ine
Ang
iopo
ietin
-1A
ngio
poie
tin-1
ICA
M-3
Inte
rcel
lula
rad
hesi
onm
olec
ule
3A
XL
Apr
otei
nty
rosi
neki
nase
(ark
)IF
N-g
amm
aIn
terf
eron
gam
ma
MIF
Mac
roph
age
mig
ratio
nB
DN
FB
rain
-der
ived
neur
otro
phic
fact
orIG
FBP-
1In
sulin
-lik
egr
owth
fact
orbi
ndin
gpr
otei
n1
Inhi
bito
ryfa
ctor
bFG
FB
asic
fibr
obla
stgr
owth
fact
orM
IGM
onok
ine
indu
ced
byga
mm
ain
terf
eron
BL
CB
-lym
phoc
yte
chem
oattr
acta
ntIG
FBP-
2In
sulin
-lik
egr
owth
fact
orbi
ndin
gpr
otei
n2
BM
P-4
Bon
em
orph
ogen
etic
prot
ein
4M
IP-1
�M
acro
phag
ein
flam
mat
ory
P-1�
BM
P-6
Bon
em
orph
ogen
etic
prot
ein
6IG
FBP-
3In
sulin
-lik
egr
owth
fact
orbi
ndin
gpr
otei
n3
MIP
-1�
Mac
roph
age
infl
amm
ator
yP-
1�
b-N
GF
Ner
vegr
owth
fact
or-b
eta
MIP
-1�
Mac
roph
age
infl
amm
ator
yP-
1�B
TC
Bet
acel
lulin
IGFB
P-4
Insu
lin-l
ike
grow
thfa
ctor
bind
ing
prot
ein
4M
IP-3
�M
acro
phag
ein
flam
mat
ory
P-3�
CC
L28
CC
K-1
MIP
-3�
Mac
roph
age
infl
amm
ator
yP-
3�C
kbe
ta8–
1C
hem
okin
e-be
ta-8
IGFB
P-6
Insu
lin-l
ike
grow
thfa
ctor
bind
ing
prot
ein
6M
SP-a
Mac
roph
age
stim
ulat
ing
prot
ein
a-ch
ain
CN
TF
Cili
ary
neur
onot
roph
icfa
ctor
CT
AC
KC
TA
C(c
utan
eous
T-c
ell
attr
actin
gch
emok
ine)
;sk
inki
neIG
F-I
Insu
lin-l
ike
grow
thfa
ctor
-1N
AP-
2N
eutr
ophi
lac
tivat
ing
pept
ide
2
IGF-
ISR
Insu
lin-l
ike
grow
thfa
ctor
1so
lubl
ere
cept
orN
T-3
Neu
rotr
ophi
n-4
Dtk
Dev
elop
men
tal
tyro
sine
kina
seN
T-4
Neu
rotr
ophi
n-3
EG
FE
pide
rmal
grow
thfa
ctor
IL-1
aIn
terl
euki
nI
alph
aO
PGO
steo
prot
eger
inE
GF-
RE
pide
rmal
grow
thfa
ctor
rece
ptor
IL-1
bIn
terl
euki
nI
beta
OSM
Onc
osta
tinM
EN
A-7
8E
pith
elia
lne
utro
phil-
activ
atin
gpr
otei
n78
IL-1
raIn
terl
euki
n1
rece
ptor
anta
goni
stPA
RC
Pulm
onar
yan
dac
tivat
ion-
regu
late
dch
emok
ine
IL-1
R1
Inte
rleu
kin
1re
cept
or-r
elat
edpr
otei
n1
Subcutaneous Adipose Tissue in Obesity, Skopkova et al.
OBESITY Vol. 15 No. 10 October 2007 2399

Tab
le2.
Con
tinue
d
Abb
revi
atio
nF
ull
nam
e/ot
her
nam
esA
bbre
viat
ion
Ful
lna
me/
othe
rna
mes
Abb
revi
atio
nF
ull
nam
e/ot
her
nam
es
Eot
axin
Eot
axin
IL-1
R4/
ST2
Inte
rleu
kin
1re
cept
or4,
ST2
PDG
F-B
BPl
atel
et-d
eriv
edgr
owth
fact
orE
otax
in-2
MPI
F-2
(mye
loid
prog
enito
rin
hibi
tory
fact
or-2
)IL
-2In
terl
euki
n2
PlG
FPl
acen
tagr
owth
fact
or
IL-2
R�
Inte
rleu
kin
2so
lubl
ere
cept
or�
RA
NT
ES
Reg
ulat
edup
onac
tivat
ion,
norm
alT
-cel
lex
pres
sed
Eot
axin
-3M
IP-4
-alp
ha(m
acro
phag
ein
flam
mat
ory
prot
ein-
4-al
pha)
IL-3
Inte
rleu
kin
3
IL-4
Inte
rleu
kin
4SC
FSt
emce
llfa
ctor
Fas
Fas/
TN
FRSF
6/A
po-1
/CD
95IL
-5In
terl
euki
n5
SDF-
1St
rom
alce
ll-de
rive
dfa
ctor
FGF-
4Fi
brob
last
grow
thfa
ctor
-4IL
-6In
terl
euki
n6
sgp1
30So
lubl
egl
ycop
rote
in13
0FG
F-6
Fibr
obla
stgr
owth
fact
or-6
IL-6
RIn
terl
euki
n6
rece
ptor
sTN
FR
ISo
lubl
eT
NF
rece
ptor
IFG
F-7
Fibr
obla
stgr
owth
fact
or-7
IL-7
Inte
rleu
kin
7sT
NF
RII
Solu
ble
TN
Fre
cept
orII
FGF-
9Fi
brob
last
grow
thfa
ctor
-9IL
-8In
terl
euki
n8
TA
RC
Thy
mus
and
activ
atio
n-re
gula
ted
chem
okin
eFl
t-3
Lig
and
fms-
like
tyro
sine
kina
se-3
Lig
and
(ST
K-1
ligan
d)IL
-10
Inte
rleu
kin
10
IL-1
1In
terl
euki
n11
TE
CK
Thy
mus
-exp
ress
edch
emok
ine
Frac
talk
ine
FKN
orFK
IL-1
2p4
0In
terl
euki
n12
p40
GC
P-2
Gra
nulo
cyte
chem
otac
ticpr
otei
n2
IL-1
2p70
Inte
rleu
kin
12p7
0T
GF-
beta
1T
umor
necr
osis
fact
orbe
ta1
IL-1
3In
terl
euki
n13
TG
F-be
ta3
Tum
orne
cros
isfa
ctor
beta
3G
CSF
Gra
nulo
cyte
-col
ony
stim
ulat
ing
fact
orIL
-15
Inte
rleu
kin
15T
IMP-
1T
issu
ein
hibi
tor
ofm
etal
lopr
otei
nase
1IL
-16
Inte
rleu
kin
16T
IMP-
2T
issu
ein
hibi
tor
ofm
etal
lopr
otei
nase
2G
DN
FG
lial-
deri
ved
neur
otro
phic
fact
orIL
-17
Inte
rleu
kin
17T
NF-
aT
umor
necr
osis
fact
or-a
lpha
I-T
AC
Inte
rfer
on-i
nduc
ible
Tce
llT
NF-
bT
umor
necr
osis
fact
or-b
eta
GIT
RG
luco
cort
icoi
din
duce
dtu
mor
necr
osis
fact
orre
cept
orA
lpha
chem
oattr
acta
ntT
POT
hrom
bopo
ietin
Lep
tinL
eptin
TR
AIL
R3
TN
F-re
late
dap
opto
sis-
indu
cing
ligan
dre
cept
or3
GIT
R-L
igan
dG
luco
cort
icoi
din
duce
dtu
mor
necr
osis
fact
orre
cept
orL
IGH
TL
IGH
T
Lym
phot
actin
Lym
phot
actin
TR
AIL
R4
TN
F-re
late
dap
opto
sis-
indu
cing
ligan
dre
cept
or4
Subcutaneous Adipose Tissue in Obesity, Skopkova et al.
2400 OBESITY Vol. 15 No. 10 October 2007
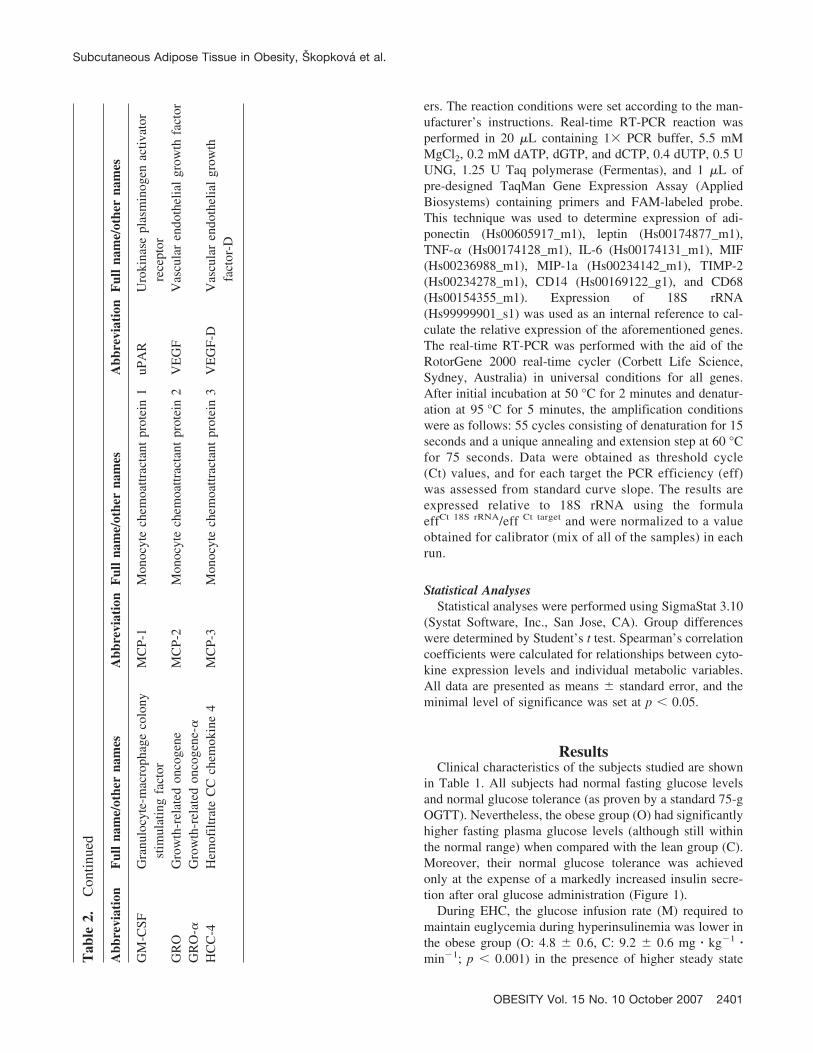
ers. The reaction conditions were set according to the man-ufacturer’s instructions. Real-time RT-PCR reaction wasperformed in 20 �L containing 1� PCR buffer, 5.5 mMMgCl2, 0.2 mM dATP, dGTP, and dCTP, 0.4 dUTP, 0.5 UUNG, 1.25 U Taq polymerase (Fermentas), and 1 �L ofpre-designed TaqMan Gene Expression Assay (AppliedBiosystems) containing primers and FAM-labeled probe.This technique was used to determine expression of adi-ponectin (Hs00605917_m1), leptin (Hs00174877_m1),TNF-� (Hs00174128_m1), IL-6 (Hs00174131_m1), MIF(Hs00236988_m1), MIP-1a (Hs00234142_m1), TIMP-2(Hs00234278_m1), CD14 (Hs00169122_g1), and CD68(Hs00154355_m1). Expression of 18S rRNA(Hs99999901_s1) was used as an internal reference to cal-culate the relative expression of the aforementioned genes.The real-time RT-PCR was performed with the aid of theRotorGene 2000 real-time cycler (Corbett Life Science,Sydney, Australia) in universal conditions for all genes.After initial incubation at 50 °C for 2 minutes and denatur-ation at 95 °C for 5 minutes, the amplification conditionswere as follows: 55 cycles consisting of denaturation for 15seconds and a unique annealing and extension step at 60 °Cfor 75 seconds. Data were obtained as threshold cycle(Ct) values, and for each target the PCR efficiency (eff)was assessed from standard curve slope. The results areexpressed relative to 18S rRNA using the formulaeffCt 18S rRNA/eff Ct target and were normalized to a valueobtained for calibrator (mix of all of the samples) in eachrun.
Statistical AnalysesStatistical analyses were performed using SigmaStat 3.10
(Systat Software, Inc., San Jose, CA). Group differenceswere determined by Student’s t test. Spearman’s correlationcoefficients were calculated for relationships between cyto-kine expression levels and individual metabolic variables.All data are presented as means � standard error, and theminimal level of significance was set at p � 0.05.
ResultsClinical characteristics of the subjects studied are shown
in Table 1. All subjects had normal fasting glucose levelsand normal glucose tolerance (as proven by a standard 75-gOGTT). Nevertheless, the obese group (O) had significantlyhigher fasting plasma glucose levels (although still withinthe normal range) when compared with the lean group (C).Moreover, their normal glucose tolerance was achievedonly at the expense of a markedly increased insulin secre-tion after oral glucose administration (Figure 1).
During EHC, the glucose infusion rate (M) required tomaintain euglycemia during hyperinsulinemia was lower inthe obese group (O: 4.8 � 0.6, C: 9.2 � 0.6 mg � kg�1 �min�1; p � 0.001) in the presence of higher steady stateT
able
2.C
ontin
ued
Abb
revi
atio
nF
ull
nam
e/ot
her
nam
esA
bbre
viat
ion
Ful
lna
me/
othe
rna
mes
Abb
revi
atio
nF
ull
nam
e/ot
her
nam
es
GM
-CSF
Gra
nulo
cyte
-mac
roph
age
colo
nyst
imul
atin
gfa
ctor
MC
P-1
Mon
ocyt
ech
emoa
ttrac
tant
prot
ein
1uP
AR
Uro
kina
sepl
asm
inog
enac
tivat
orre
cept
orG
RO
Gro
wth
-rel
ated
onco
gene
MC
P-2
Mon
ocyt
ech
emoa
ttrac
tant
prot
ein
2V
EG
FV
ascu
lar
endo
thel
ial
grow
thfa
ctor
GR
O- �
Gro
wth
-rel
ated
onco
gene
-�H
CC
-4H
emof
iltra
teC
Cch
emok
ine
4M
CP-
3M
onoc
yte
chem
oattr
acta
ntpr
otei
n3
VE
GF-
DV
ascu
lar
endo
thel
ial
grow
thfa
ctor
-D
Subcutaneous Adipose Tissue in Obesity, Skopkova et al.
OBESITY Vol. 15 No. 10 October 2007 2401
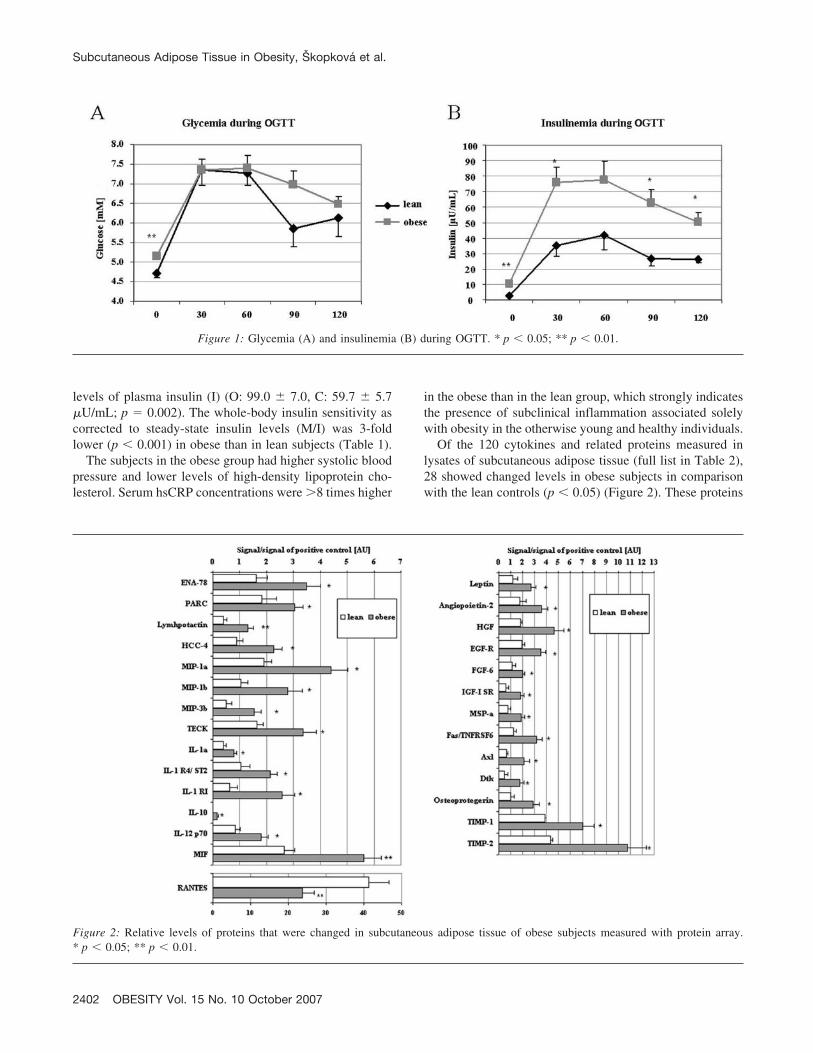
levels of plasma insulin (I) (O: 99.0 � 7.0, C: 59.7 � 5.7�U/mL; p � 0.002). The whole-body insulin sensitivity ascorrected to steady-state insulin levels (M/I) was 3-foldlower (p � 0.001) in obese than in lean subjects (Table 1).
The subjects in the obese group had higher systolic bloodpressure and lower levels of high-density lipoprotein cho-lesterol. Serum hsCRP concentrations were �8 times higher
in the obese than in the lean group, which strongly indicatesthe presence of subclinical inflammation associated solelywith obesity in the otherwise young and healthy individuals.
Of the 120 cytokines and related proteins measured inlysates of subcutaneous adipose tissue (full list in Table 2),28 showed changed levels in obese subjects in comparisonwith the lean controls (p � 0.05) (Figure 2). These proteins
Figure 1: Glycemia (A) and insulinemia (B) during OGTT. * p � 0.05; ** p � 0.01.
Figure 2: Relative levels of proteins that were changed in subcutaneous adipose tissue of obese subjects measured with protein array.* p � 0.05; ** p � 0.01.
Subcutaneous Adipose Tissue in Obesity, Skopkova et al.
2402 OBESITY Vol. 15 No. 10 October 2007
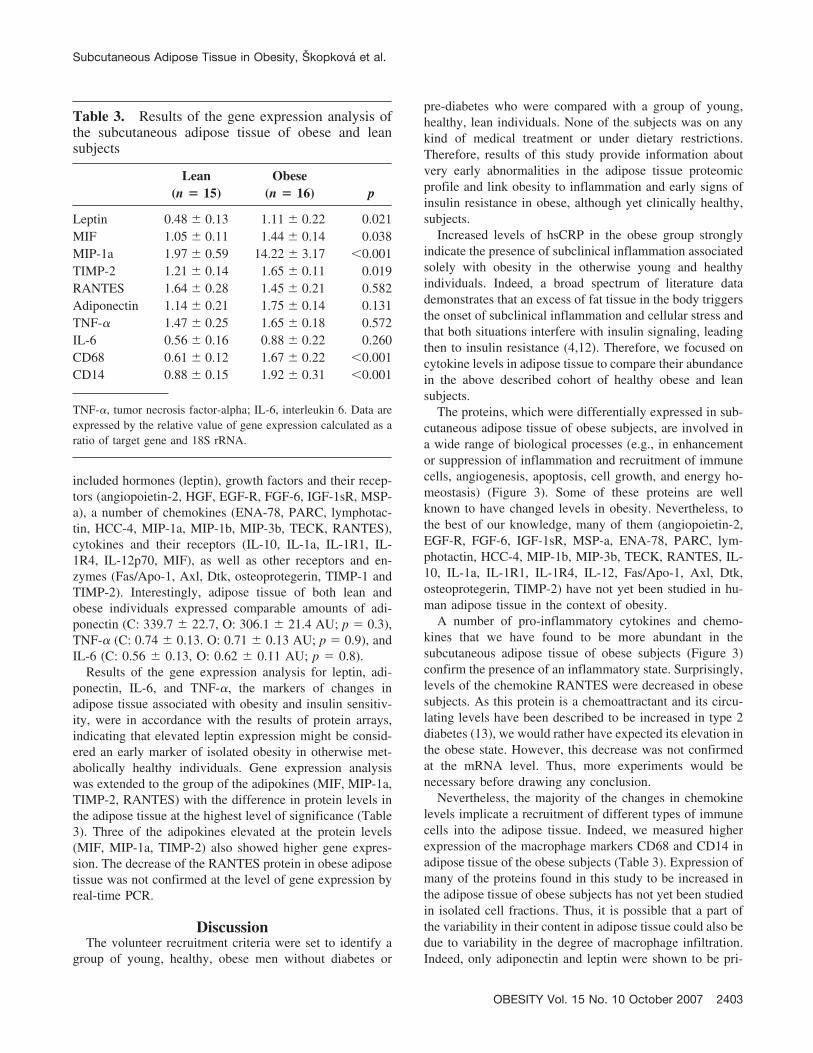
included hormones (leptin), growth factors and their recep-tors (angiopoietin-2, HGF, EGF-R, FGF-6, IGF-1sR, MSP-a), a number of chemokines (ENA-78, PARC, lymphotac-tin, HCC-4, MIP-1a, MIP-1b, MIP-3b, TECK, RANTES),cytokines and their receptors (IL-10, IL-1a, IL-1R1, IL-1R4, IL-12p70, MIF), as well as other receptors and en-zymes (Fas/Apo-1, Axl, Dtk, osteoprotegerin, TIMP-1 andTIMP-2). Interestingly, adipose tissue of both lean andobese individuals expressed comparable amounts of adi-ponectin (C: 339.7 � 22.7, O: 306.1 � 21.4 AU; p � 0.3),TNF-� (C: 0.74 � 0.13. O: 0.71 � 0.13 AU; p � 0.9), andIL-6 (C: 0.56 � 0.13, O: 0.62 � 0.11 AU; p � 0.8).
Results of the gene expression analysis for leptin, adi-ponectin, IL-6, and TNF-�, the markers of changes inadipose tissue associated with obesity and insulin sensitiv-ity, were in accordance with the results of protein arrays,indicating that elevated leptin expression might be consid-ered an early marker of isolated obesity in otherwise met-abolically healthy individuals. Gene expression analysiswas extended to the group of the adipokines (MIF, MIP-1a,TIMP-2, RANTES) with the difference in protein levels inthe adipose tissue at the highest level of significance (Table3). Three of the adipokines elevated at the protein levels(MIF, MIP-1a, TIMP-2) also showed higher gene expres-sion. The decrease of the RANTES protein in obese adiposetissue was not confirmed at the level of gene expression byreal-time PCR.
DiscussionThe volunteer recruitment criteria were set to identify a
group of young, healthy, obese men without diabetes or
pre-diabetes who were compared with a group of young,healthy, lean individuals. None of the subjects was on anykind of medical treatment or under dietary restrictions.Therefore, results of this study provide information aboutvery early abnormalities in the adipose tissue proteomicprofile and link obesity to inflammation and early signs ofinsulin resistance in obese, although yet clinically healthy,subjects.
Increased levels of hsCRP in the obese group stronglyindicate the presence of subclinical inflammation associatedsolely with obesity in the otherwise young and healthyindividuals. Indeed, a broad spectrum of literature datademonstrates that an excess of fat tissue in the body triggersthe onset of subclinical inflammation and cellular stress andthat both situations interfere with insulin signaling, leadingthen to insulin resistance (4,12). Therefore, we focused oncytokine levels in adipose tissue to compare their abundancein the above described cohort of healthy obese and leansubjects.
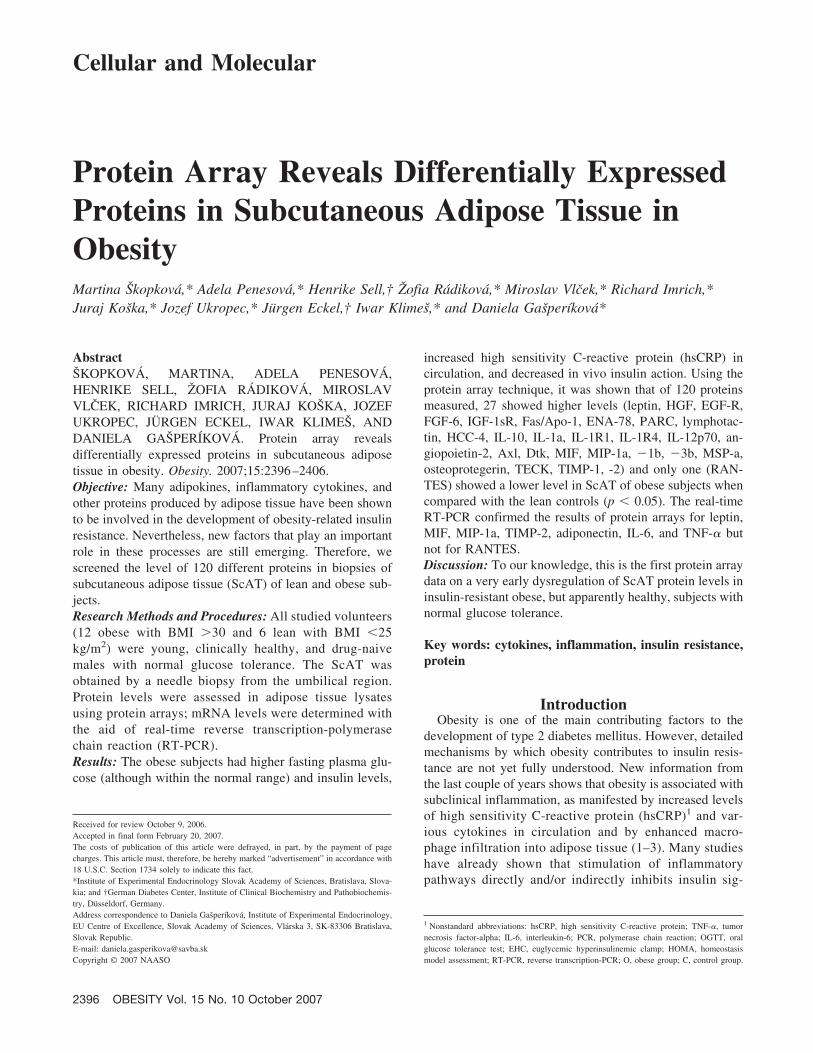
The proteins, which were differentially expressed in sub-cutaneous adipose tissue of obese subjects, are involved ina wide range of biological processes (e.g., in enhancementor suppression of inflammation and recruitment of immunecells, angiogenesis, apoptosis, cell growth, and energy ho-meostasis) (Figure 3). Some of these proteins are wellknown to have changed levels in obesity. Nevertheless, tothe best of our knowledge, many of them (angiopoietin-2,EGF-R, FGF-6, IGF-1sR, MSP-a, ENA-78, PARC, lym-photactin, HCC-4, MIP-1b, MIP-3b, TECK, RANTES, IL-10, IL-1a, IL-1R1, IL-1R4, IL-12, Fas/Apo-1, Axl, Dtk,osteoprotegerin, TIMP-2) have not yet been studied in hu-man adipose tissue in the context of obesity.
A number of pro-inflammatory cytokines and chemo-kines that we have found to be more abundant in thesubcutaneous adipose tissue of obese subjects (Figure 3)confirm the presence of an inflammatory state. Surprisingly,levels of the chemokine RANTES were decreased in obesesubjects. As this protein is a chemoattractant and its circu-lating levels have been described to be increased in type 2diabetes (13), we would rather have expected its elevation inthe obese state. However, this decrease was not confirmedat the mRNA level. Thus, more experiments would benecessary before drawing any conclusion.
Nevertheless, the majority of the changes in chemokinelevels implicate a recruitment of different types of immunecells into the adipose tissue. Indeed, we measured higherexpression of the macrophage markers CD68 and CD14 inadipose tissue of the obese subjects (Table 3). Expression ofmany of the proteins found in this study to be increased inthe adipose tissue of obese subjects has not yet been studiedin isolated cell fractions. Thus, it is possible that a part ofthe variability in their content in adipose tissue could also bedue to variability in the degree of macrophage infiltration.Indeed, only adiponectin and leptin were shown to be pri-
Table 3. Results of the gene expression analysis ofthe subcutaneous adipose tissue of obese and leansubjects
Lean(n � 15)
Obese(n � 16) p
Leptin 0.48 � 0.13 1.11 � 0.22 0.021MIF 1.05 � 0.11 1.44 � 0.14 0.038MIP-1a 1.97 � 0.59 14.22 � 3.17 �0.001TIMP-2 1.21 � 0.14 1.65 � 0.11 0.019RANTES 1.64 � 0.28 1.45 � 0.21 0.582Adiponectin 1.14 � 0.21 1.75 � 0.14 0.131TNF-� 1.47 � 0.25 1.65 � 0.18 0.572IL-6 0.56 � 0.16 0.88 � 0.22 0.260CD68 0.61 � 0.12 1.67 � 0.22 �0.001CD14 0.88 � 0.15 1.92 � 0.31 �0.001
TNF-�, tumor necrosis factor-alpha; IL-6, interleukin 6. Data areexpressed by the relative value of gene expression calculated as aratio of target gene and 18S rRNA.
Subcutaneous Adipose Tissue in Obesity, Skopkova et al.
OBESITY Vol. 15 No. 10 October 2007 2403
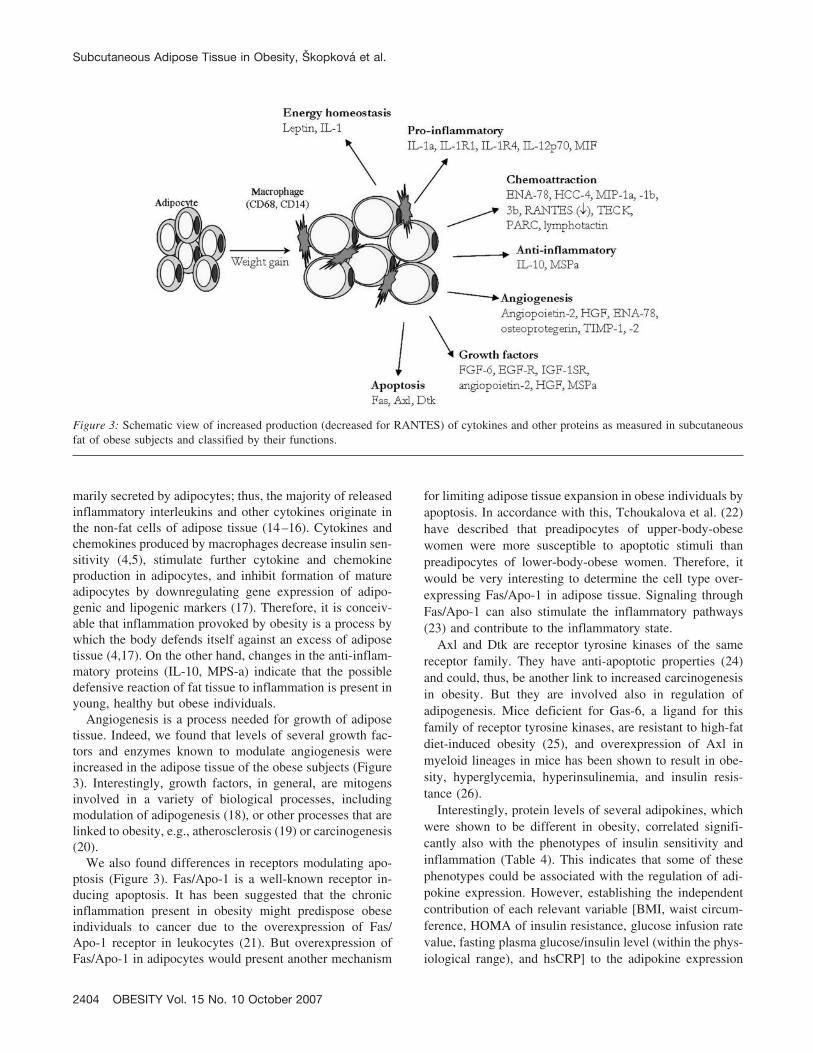
marily secreted by adipocytes; thus, the majority of releasedinflammatory interleukins and other cytokines originate inthe non-fat cells of adipose tissue (14–16). Cytokines andchemokines produced by macrophages decrease insulin sen-sitivity (4,5), stimulate further cytokine and chemokineproduction in adipocytes, and inhibit formation of matureadipocytes by downregulating gene expression of adipo-genic and lipogenic markers (17). Therefore, it is conceiv-able that inflammation provoked by obesity is a process bywhich the body defends itself against an excess of adiposetissue (4,17). On the other hand, changes in the anti-inflam-matory proteins (IL-10, MPS-a) indicate that the possibledefensive reaction of fat tissue to inflammation is present inyoung, healthy but obese individuals.
Angiogenesis is a process needed for growth of adiposetissue. Indeed, we found that levels of several growth fac-tors and enzymes known to modulate angiogenesis wereincreased in the adipose tissue of the obese subjects (Figure3). Interestingly, growth factors, in general, are mitogensinvolved in a variety of biological processes, includingmodulation of adipogenesis (18), or other processes that arelinked to obesity, e.g., atherosclerosis (19) or carcinogenesis(20).
We also found differences in receptors modulating apo-ptosis (Figure 3). Fas/Apo-1 is a well-known receptor in-ducing apoptosis. It has been suggested that the chronicinflammation present in obesity might predispose obeseindividuals to cancer due to the overexpression of Fas/Apo-1 receptor in leukocytes (21). But overexpression ofFas/Apo-1 in adipocytes would present another mechanism
for limiting adipose tissue expansion in obese individuals byapoptosis. In accordance with this, Tchoukalova et al. (22)have described that preadipocytes of upper-body-obesewomen were more susceptible to apoptotic stimuli thanpreadipocytes of lower-body-obese women. Therefore, itwould be very interesting to determine the cell type over-expressing Fas/Apo-1 in adipose tissue. Signaling throughFas/Apo-1 can also stimulate the inflammatory pathways(23) and contribute to the inflammatory state.
Axl and Dtk are receptor tyrosine kinases of the samereceptor family. They have anti-apoptotic properties (24)and could, thus, be another link to increased carcinogenesisin obesity. But they are involved also in regulation ofadipogenesis. Mice deficient for Gas-6, a ligand for thisfamily of receptor tyrosine kinases, are resistant to high-fatdiet-induced obesity (25), and overexpression of Axl inmyeloid lineages in mice has been shown to result in obe-sity, hyperglycemia, hyperinsulinemia, and insulin resis-tance (26).
Interestingly, protein levels of several adipokines, whichwere shown to be different in obesity, correlated signifi-cantly also with the phenotypes of insulin sensitivity andinflammation (Table 4). This indicates that some of thesephenotypes could be associated with the regulation of adi-pokine expression. However, establishing the independentcontribution of each relevant variable [BMI, waist circum-ference, HOMA of insulin resistance, glucose infusion ratevalue, fasting plasma glucose/insulin level (within the phys-iological range), and hsCRP] to the adipokine expression
Figure 3: Schematic view of increased production (decreased for RANTES) of cytokines and other proteins as measured in subcutaneousfat of obese subjects and classified by their functions.
Subcutaneous Adipose Tissue in Obesity, Skopkova et al.
2404 OBESITY Vol. 15 No. 10 October 2007
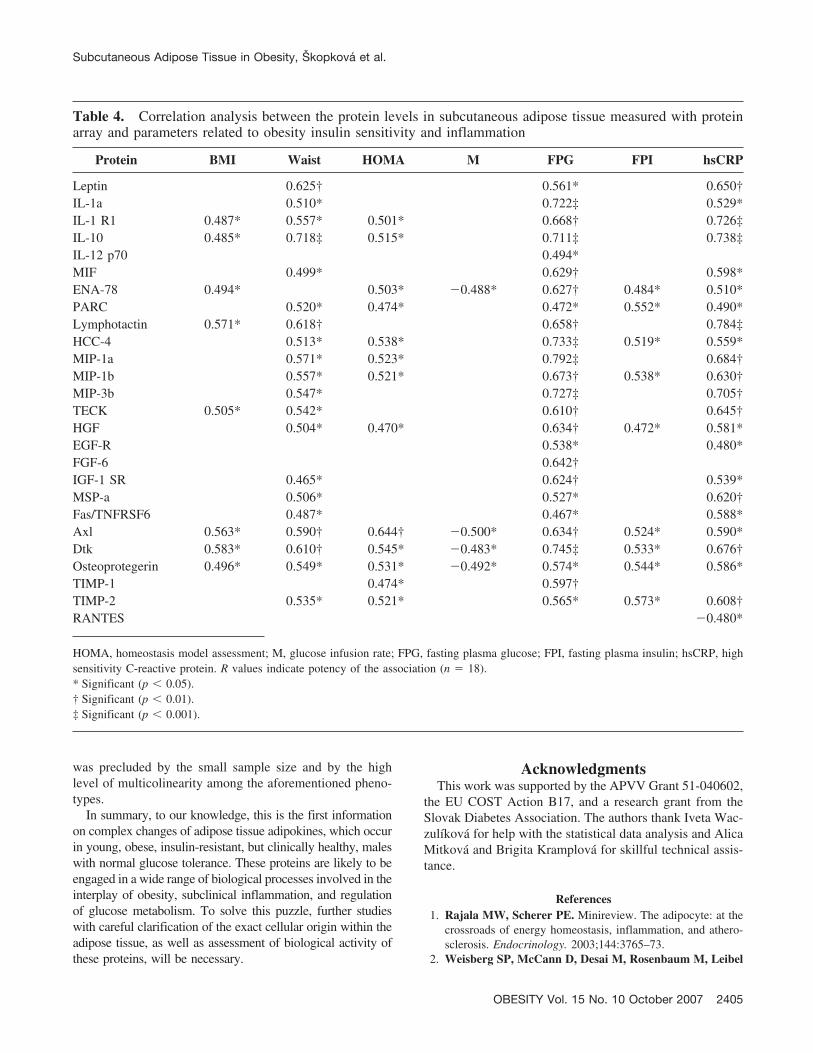
was precluded by the small sample size and by the highlevel of multicolinearity among the aforementioned pheno-types.
In summary, to our knowledge, this is the first informationon complex changes of adipose tissue adipokines, which occurin young, obese, insulin-resistant, but clinically healthy, maleswith normal glucose tolerance. These proteins are likely to beengaged in a wide range of biological processes involved in theinterplay of obesity, subclinical inflammation, and regulationof glucose metabolism. To solve this puzzle, further studieswith careful clarification of the exact cellular origin within theadipose tissue, as well as assessment of biological activity ofthese proteins, will be necessary.
AcknowledgmentsThis work was supported by the APVV Grant 51-040602,
the EU COST Action B17, and a research grant from theSlovak Diabetes Association. The authors thank Iveta Wac-zulıkova for help with the statistical data analysis and AlicaMitkova and Brigita Kramplova for skillful technical assis-tance.
References1. Rajala MW, Scherer PE. Minireview. The adipocyte: at the
crossroads of energy homeostasis, inflammation, and athero-sclerosis. Endocrinology. 2003;144:3765–73.
2. Weisberg SP, McCann D, Desai M, Rosenbaum M, Leibel
Table 4. Correlation analysis between the protein levels in subcutaneous adipose tissue measured with proteinarray and parameters related to obesity insulin sensitivity and inflammation
Protein BMI Waist HOMA M FPG FPI hsCRP
Leptin 0.625† 0.561* 0.650†IL-1a 0.510* 0.722‡ 0.529*IL-1 R1 0.487* 0.557* 0.501* 0.668† 0.726‡IL-10 0.485* 0.718‡ 0.515* 0.711‡ 0.738‡IL-12 p70 0.494*MIF 0.499* 0.629† 0.598*ENA-78 0.494* 0.503* �0.488* 0.627† 0.484* 0.510*PARC 0.520* 0.474* 0.472* 0.552* 0.490*Lymphotactin 0.571* 0.618† 0.658† 0.784‡HCC-4 0.513* 0.538* 0.733‡ 0.519* 0.559*MIP-1a 0.571* 0.523* 0.792‡ 0.684†MIP-1b 0.557* 0.521* 0.673† 0.538* 0.630†MIP-3b 0.547* 0.727‡ 0.705†TECK 0.505* 0.542* 0.610† 0.645†HGF 0.504* 0.470* 0.634† 0.472* 0.581*EGF-R 0.538* 0.480*FGF-6 0.642†IGF-1 SR 0.465* 0.624† 0.539*MSP-a 0.506* 0.527* 0.620†Fas/TNFRSF6 0.487* 0.467* 0.588*Axl 0.563* 0.590† 0.644† �0.500* 0.634† 0.524* 0.590*Dtk 0.583* 0.610† 0.545* �0.483* 0.745‡ 0.533* 0.676†Osteoprotegerin 0.496* 0.549* 0.531* �0.492* 0.574* 0.544* 0.586*TIMP-1 0.474* 0.597†TIMP-2 0.535* 0.521* 0.565* 0.573* 0.608†RANTES �0.480*
HOMA, homeostasis model assessment; M, glucose infusion rate; FPG, fasting plasma glucose; FPI, fasting plasma insulin; hsCRP, highsensitivity C-reactive protein. R values indicate potency of the association (n � 18).* Significant (p � 0.05).† Significant (p � 0.01).‡ Significant (p � 0.001).
Subcutaneous Adipose Tissue in Obesity, Skopkova et al.
OBESITY Vol. 15 No. 10 October 2007 2405
RL, Ferrante AW Jr. Obesity is associated with macrophageaccumulation in adipose tissue. J Clin Invest. 2003;112:1796–808.
3. Xu H, Barnes GT, Yang Q, et al. Chronic inflammation infat plays a crucial role in the development of obesity-relatedinsulin resistance. J Clin Invest. 2003;112:1821–30.
4. Wellen KE, Hotamisligil GS. Inflammation, stress, and dia-betes. J Clin Invest. 2005;115:1111–9.
5. Kolb H, Mandrup-Poulsen T. An immune origin of type 2diabetes? Diabetologia. 2005;48:1038–50.
6. Kershaw EE, Flier JS. Adipose tissue as an endocrine organ.J Clin Endocrinol Metab. 2004;89:2548–56.
7. Scherer PE. Adipose tissue: from lipid storage compartmentto endocrine organ. Diabetes. 2006;55:1537–45.
8. Guerre-Millo M. Adipose tissue and adipokines: for better orworse. Diabetes Metab. 2004;30:13–9.
9. No authors listed. World Medical Association Declaration ofHelsinki: ethical principles for medical research involvinghuman subjects. JAMA. 2000;284:3043–5.
10. Matthews DR, Hosker JP, Rudenski AS, Naylor BA,Treacher DF, Turner RC. Homeostasis model assessment:insulin resistance and beta-cell function from fasting plasmaglucose and insulin concentrations in man. Diabetologia.1985;28:412–9.
11. DeFronzo RA, Tobin JD, Andres R. Glucose clamptechnique: a method for quantifying insulin secretion andresistance. Am J Physiol. 1979;237:E214–23.
12. Wellen KE, Hotamisligil GS. Obesity-induced inflammatorychanges in adipose tissue. J Clin Invest. 2003;112:1785–8.
13. Herder C, Haastert B, Muller-Scholze S, et al. Associationof systemic chemokine concentrations with impaired glucosetolerance and type 2 diabetes: results from the CooperativeHealth Research in the Region of Augsburg Survey S4(KORA S4). Diabetes. 2005;54(Suppl 2):11–7.
14. Curat CA, Wegner V, Sengenes C, et al. Macrophages inhuman visceral adipose tissue: increased accumulation in obe-sity and a source of resistin and visfatin. Diabetologia. 2006;49:744–7.
15. Fain JN, Madan AK, Hiler ML, Cheema P, Bahouth SW.Comparison of the release of adipokines by adipose tissue,
adipose tissue matrix, and adipocytes from visceral and sub-cutaneous abdominal adipose tissues of obese humans. Endo-crinology. 2004;145:2273–82.
16. Fain JN. Release of interleukins and other inflammatory cyto-kines by human adipose tissue is enhanced in obesity and pri-marily due to the nonfat cells. Vitam Horm. 2006;74:443–77.
17. Lacasa D, Taleb S, Keophiphath M, Miranville A, ClementK. Macrophage-secreted factors impair human adipogenesis:involvement of proinflammatory state in preadipocytes. En-docrinology. 2006;148:868–77.
18. Adachi H, Kurachi H, Homma H, et al. Epidermal growthfactor promotes adipogenesis of 3T3–L1 cell in vitro. Endo-crinology. 1994;135:1824–30.
19. Lamb DJ, Modjtahedi H, Plant NJ, Ferns GA. EGF medi-ates monocyte chemotaxis and macrophage proliferation andEGF receptor is expressed in atherosclerotic plaques. Athero-sclerosis. 2004;176:21–6.
20. Renehan AG, Frystyk J, Flyvbjerg A. Obesity and cancerrisk: the role of the insulin-IGF axis. Trends EndocrinolMetab. 2006;17:328–36.
21. Cottam DR, Schaefer PA, Shaftan GW, Angus LD. Dysfunc-tional immune-privilege in morbid obesity: implications and ef-fect of gastric bypass surgery. Obes Surg. 2003;13:49–57.
22. Tchoukalova Y, Koutsari C, Jensen M. Committed subcu-taneous preadipocytes are reduced in human obesity. Diabe-tologia. 2006;50:151–7.
23. Wajant H, Pfizenmaier K, Scheurich P. Non-apoptotic Fassignaling. Cytokine Growth Factor Rev. 2003;14:53–66.
24. Hafizi S, Dahlback B. Signalling and functional diversitywithin the Axl subfamily of receptor tyrosine kinases. Cyto-kine Growth Factor Rev. 2006;17:295–304.
25. Maquoi E, Voros G, Carmeliet P, Collen D, Lijnen HR.Role of Gas-6 in adipogenesis and nutritionally induced adi-pose tissue development in mice. Arterioscler Thromb VascBiol. 2005;25:1002–7.
26. Augustine KA, Rossi RM, Van G, et al. Noninsulin-dependent diabetes mellitus occurs in mice ectopically ex-pressing the human Axl tyrosine kinase receptor. J CellPhysiol. 1999;181:433–47.
Subcutaneous Adipose Tissue in Obesity, Skopkova et al.
2406 OBESITY Vol. 15 No. 10 October 2007