The importance of study design for detecting differentially ...
Upload
khangminh22Category
view
3download
0
E-Mail [email protected]
Research Article
J Innate Immun 2017;9:464–474 DOI: 10.1159/000475665
Monocyte Subsets Are Differentially Lost from the Circulation during Acute Inflammation Induced by Human Experimental Endotoxemia
Tamar Tak a Roger van Groenendael b Peter Pickkers b Leo Koenderman a
a Department of Respiratory Medicine and Laboratory of Translational Immunology, University MedicalCenter Utrecht, Utrecht , and b Department of Intensive Care Medicine, Radboud University Medical Center, Nijmegen , The Netherlands
and CD38 expression). Plasma levels of CCL2, CCL4 andCX 3 CL1 closely resembled the cell numbers of CM, IM and NCM, respectively. Our study provides critical insights into the earliest stages of acute inflammation and emphasizes the necessity to stain for different monocyte subsets when studying the role of monocytes in disease, as neither func-tion nor kinetics of the subsets overlap.
© 2017 S. Karger AG, Basel
Introduction
Monocytes perform several roles in acute inflamma-tion: they are capable of antigen presentation and phago-cytosis of pathogens and can produce large amounts of pro- and anti-inflammatory cytokines [1] . At least 3 monocyte subsets have been identified: CD14 ++ /CD16 – classical monocytes (CM), CD14 ++ /CD16 + intermediate monocytes (IM) and CD14 + /CD16 ++ non-classical mono-cytes (NCM) [2] . The subsets have different functionality, with CM displaying superior phagocytic capacity, IM dis-playing superior cytokine production and NCM display-ing patrolling behaviour on blood vessel walls [3] . The 3 subsets display differential expression of chemokine re-ceptors [4] , with CM expressing high levels of chemokine
Keywords
Lipopolysaccharide · Systemic inflammatory response syndrome · Sepsis · Monocyte · Endotoxemia · Acute inflammation
Abstract
Three human monocyte subsets are recognized with differ-ent functions in the immune system: CD14 ++ /CD16 – classical monocytes (CM), CD14 ++ /CD16 + intermediate monocytes (IM) and CD14 + /CD16 ++ non-classical monocytes (NCM). In-creased IM and NCM percentages have been reported under inflammatory conditions, yet little is known about monocyte subsets at the onset of inflammation. The human endotox-emia model is uniquely capable of studying the first phases of acute inflammation induced by intravenous injection of2 ng/kg bodyweight lipopolysaccharide (LPS) into healthy volunteers. After that, monocyte subset counts, activation/differentiation status and chemokine levels were studied over 24 h. The numbers of all subsets were decreased by >95% after LPS injection. CM numbers recovered first (3–6 h), followed by IM (6–8 h) and NCM numbers (8–24 h). Sim-ilarly, increased monocyte counts were observed first in CM (8 h), followed by IM and NCM (24 h). Monocytes did not dis-play a clear activated phenotype (minor increase in CD11b
Received: January 13, 2017 Accepted after revision: April 11, 2017 Published online: June 23, 2017
Journal of InnateImmunity
Prof. Leo Koenderman Department of Respiratory Medicine and Laboratory of Translational ImmunologyUniversity Medical Center Utrecht HP. E 03.511, Heidelberglaan 100, NL–3584 CX Utrecht (The Netherlands) E-Mail l.koenderman @ umcutrecht.nl
© 2017 S. Karger AG, Basel
www.karger.com/jin
Monocyte Kinetics in Experimental Endotoxemia
J Innate Immun 2017;9:464–474 DOI: 10.1159/000475665
465
C-C motif receptor 2 (CCR2), IM expressing high levels of CCR5 and NCM expressing high levels of chemokine C-X3-C motif receptor 1 (CX 3 CR1). Thus, they respond differently to the ligands of these receptors, being chemo-kine C-C motif ligand 2 (CCL2; also known as MCP1), CCL3/CCL4 (also known as MIP-1α/β) and chemokine C-X3-C motif ligand 1 (CX 3 CL1; also known as fractal-kine), respectively [5] .
Under homeostatic conditions, most monocytes in the peripheral blood belong to the CM subset, followed by NCM and with IM being the subset with the lowest fre-quency. During inflammatory conditions, such as sepsis [6, 7] , bacterial [8] or viral [9–11] infections and a wide range of inflammatory diseases (reviewed by [1] ), the fre-quency of IM or both IM and NCM is increased. How-ever, as patients with inflammation cannot be identified before displaying clinical symptoms, little is known about the monocyte subsets during the earliest stages of inflam-mation.
The human endotoxemia model allows studying of the mechanisms operational in vivo at the initiation of acute inflammation. In this model, healthy volunteers are in-jected with a low dose of 2 ng/kg bodyweight lipopolysac-charide (LPS), leading to a rapid induction of systemic inflammatory symptoms [12] . Using this model, we have previously shown that large numbers of monocytes are transiently lost from the circulation after LPS injection [13] . In addition, the number of all 3 subsets has been shown to be reduced 2 h after LPS injection, whereas the number of IM was increased 24 h after LPS injection [14] . However, a more detailed analysis is required to reveal differences in kinetics of the 3 monocyte subsets and their associated chemokines early in inflammation.
Therefore, we determined (1) the kinetics of the 3 hu-man monocyte subsets after LPS injection, (2) subset-spe-cific chemokine plasma concentrations and (3) differenc-es in monocyte activation by single- and multidimension-al flow cytometry.
Materials and Methods
Subjects and Ethics Samples were obtained from healthy volunteers participating
in a human endotoxemia trial (ClinicalTrials.gov identifier NCT02629874) as published previously [13] . The study was ap-proved by the ethics review board of the Radboud University Med-ical Center in Nijmegen, The Netherlands. It was in compliance with the Declaration of Helsinki (adapted by the World Medical Association General Assembly, Fortaleza, Brazil, 2013), the Dutch rulings on Medical Research Involving Human Subjects Act (WMO) and ICH Good Clinical Practice Guidelines. Written in-
formed consent was obtained from all study participants. Male subjects 19–24 years of age were healthy as determined by physical examination, electrocardiography and haematological laboratory values. Subjects with febrile illness in the 2 weeks before the study and subjects taking prescription drugs were excluded from the study. Subjects were asked to refrain from caffeine and alcohol use in the 24 h prior to the experiment and refrain from food intake12 h prior to the experiment.
Experimental Endotoxemia Model LPS challenge was performed as published previously [15] . In
short, subjects were admitted to the research medium care unit of the Radboud Medical Center in the Netherlands. From t = –1 h to t = 0, subjects were infused with hydration fluid (2.5% glucose/0.45% saline at a continuous rate of 1.5 L/h) through a cannula placed in an antecubital vein. At t = 0, a single dose of 2 ng/kg bodyweight LPS (US standard reference Escherichia coli O:113, NIH Pharmaceutical Development Section, Bethesda, MD, USA) was administered. After LPS injection, subjects were infused with hydration fluid at a constant rate of 150 mL/h. Heart rate and blood pressure were constantly monitored from t = –1 h until discharge at t = 8 h, as well as the course of LPS-induced symptoms [16] .
Sample Preparation Blood from 6 subjects was collected in sodium heparin tubes 5
min before LPS injection and at 1.5, 3, 4, 6 and 24 h after LPS injec-tion and from 5 additional subjects at –5, 15, 30, 60 and 90 min after LPS injection ( Fig. 1 ). Absolute differential counts were deter-mined using a Cell-DYN Emerald Hematology Analyzer (Abbott Diagnostics, Abbott Park, IL, USA). Erythrocytes were lysed in ice-cold isotonic erythrocyte lysis buffer (150 m M NH 4 Cl, 10 m M KHCO 3 and 0.1 m M Na 2 EDTA), after which resulting leukocyte preparations were washed and resuspended in FACS staining buf-fer (PBS supplemented with 0.32% trisodium citrate and 10% hu-man pasteurized plasma solution, both from Sanquin, Amsterdam, The Netherlands) at a concentration of 1 × 10 5 cells/μL. Antibodies used were anti-CD64-Pacific Blue, CD3-Brilliant Violet (BV) 510, CD19-BV510, CD56-BV510, CD86-BV605, CD62L-BV650, CD16-BV785, CX 3 CR1-FITC, CD303-PerCP-Cy5.5, CD1c-APC-Cy7 (all from BioLegend, San Diego, CA, USA), CD80-V450, human leu-kocyte antigen – antigen D related (HLA-DR)-BV605, CD163-Alex647, CD69-PC7 (BD Biosciences, San José, CA, USA), CCR2-PE (R&D Systems, Minneapolis, MN, USA), CD38-PC7 (Thermo Fisher Scientific, Waltham, MA, USA), and CD14-ECD (Beckman Coulter, Pasadena, CA, USA). After staining, samples were washed in FACS staining buffer and fixed for 20 min in a 1% formaldehyde solution in PBS. Samples were analysed using a BD LSRFortessa flow cytometer (BD Biosciences).
Flow Cytometric Analysis Monocytes were identified by the following gating strategy:
cells were gated on forward scatter (FSC) high /sideward scatter (SSC) low . Next, T cells, B cells and NK cells were excluded based on CD3, CD19 and CD56 expression. Monocyte subsets were identi-fied as CD14 ++ /CD16 – (CM), CD14 ++ /CD16 + (IM) and CD14 + /CD16 ++ (NCM) ( Fig. 2 c). Absolute monocyte subset numbers were calculated using the absolute granulocyte counts as deter-mined on a Cell-DYN Emerald Hematology Analyzer and the ra-tio of SSC high /CD16 ++ neutrophil numbers compared to mono-cyte subset numbers. On average, more than 3 × 10 5 events were

Tak/van Groenendael/Pickkers/Koenderman
J Innate Immun 2017;9:464–474 DOI: 10.1159/000475665
466
a
b
d
e
c
Withdrawal for cell countsonly (n = 5)
LPS injection
0 1 2 3 4 5 6 7 8 24
Time, h
10
5
15
0
Cells
, 106
/mL
Differential count
6420 8 24Time after LPS, h
WBCGranulocytesLymphocytes
********
80
60
40
20
100
0
Mon
ocyt
es, %
CM, %
6420 8 24Time after LPS, h
*****
**
20
15
10
5
25
0
Mon
ocyt
es, %
IM, %
6420 8 24Time after LPS, h
** 80
60
40
20
0
Mon
ocyt
es, %
NCM
6420 8 24Time after LPS, h
**** *
**
****
800
600
400
200
0
Cells
, 103
/mL
CM, n
6420 8 24Time after LPS, h
******
*
05
1015205075
100125
Cells
, 103
/mL
IM, n
6420 8 24Time after LPS, h
**** **
**
***
80
60
40
20
0
Cells
, 103
/mL
NCM, n
6420 8 24Time after LPS, h
***** ****
**************
0.6
0.4
0.2
0.8
0
Cells
, 106
/mL
Total monocyte counts
6420 8 24Time after LPS, h
*****
**
Withdrawal for all FACSmeasurements (n = 6)
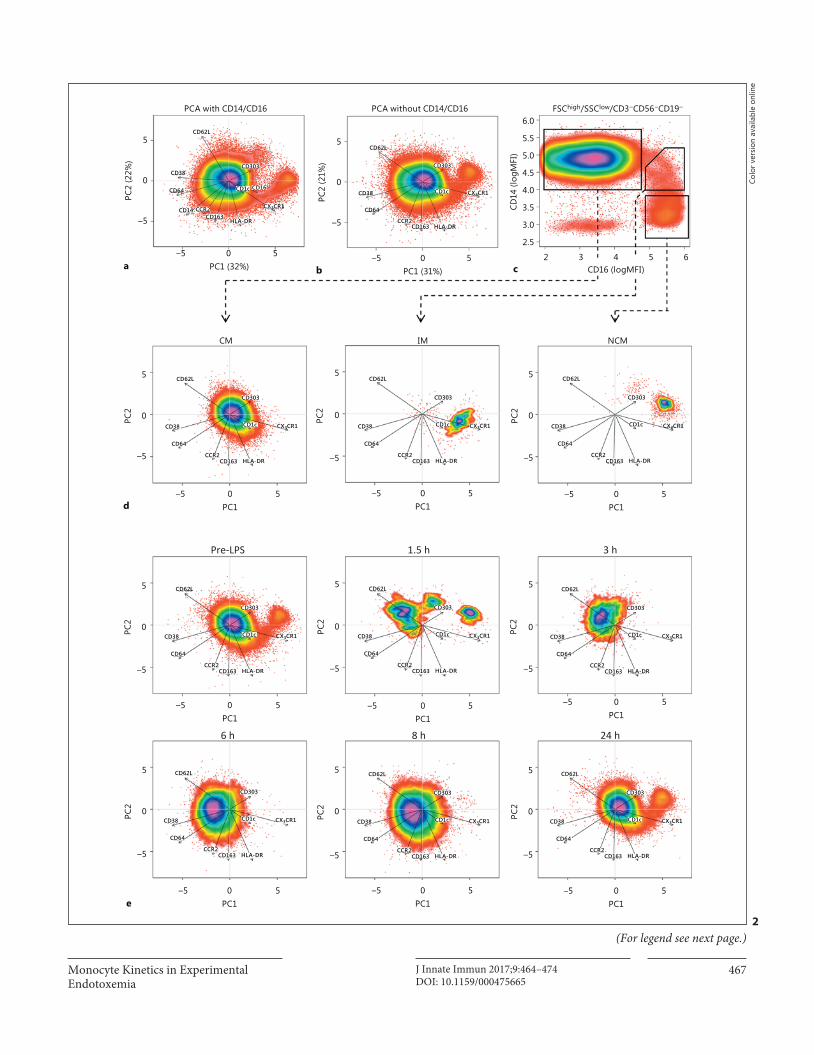
Fig. 1. Study outline and differential counts after lipopolysaccha-ride (LPS) injection. Study design ( a ) shows the moment of blood withdrawal after injection of LPS. White symbols indicate blood withdrawal only for analysis of cell counts; grey symbols indicate blood withdrawal for full flow cytometric analysis. Whole white blood cell (WBC) counts ( b ) and granulocyte counts are increased at 3–8 h after LPS injection, whereas lymphocyte numbers remain similar throughout the experiment. Total monocyte counts ( c ) are decreased at 1–1.5 h after LPS injection, and cell count increases at 6–8 h after LPS injection. Monocyte subset percentages ( d ) show
that classical monocytes (CM) comprise 80–90% of all monocytes during most of the experiment. CM counts ( e ) follow those of total monocytes. Intermediate monocyte (IM) and non-classical mono-cyte (NCM) numbers are decreased 1–8 h after LPS injection with a trend towards higher IM counts and percentage at 24 h after LPS injection. * , * * , * * * and * * * * indicate p < 0.05, p < 0.01, p < 0.001 and p < 0.0001 compared to t = 0, respectively. Data indicate me-dians ± interquartile ranges. n = 11 for t = 0 and t = 1.5 h; n = 5 for t = 0.25–1 h; n = 6 for t = 3–24 h.
Monocyte Kinetics in Experimental Endotoxemia
J Innate Immun 2017;9:464–474 DOI: 10.1159/000475665
467
Pre-LPS 1.5 h 3 h
6 h 8 h 24 h
0
5 5.5
5.0
4.5
4.0
3.5
3.0
6.0
2.5
–5
CD16 (logMFI)
CD14
(log
MFI
)
–5 0 5PC1 (32%)
–5 0 5PC1
–5 0 5PC1
–5 0 5PC1
–5 0 5PC1
–5 0 5PC1
–5 0 5PC1
–5 0 5PC1
–5 0 5PC1
–5 0 5PC1
–5 0 2 3 4 5 65
PC1 (31%)
PC2
(22%
)
0
5
–5
PC2 0
5
–5
PC2
0
5
–5
PC2
0
5
–5
PC2 0
5
–5
PC2
0
5
–5
PC2
0
5
–5
PC2 0
5
–5
PC2 0
5
–5
PC2
0
5
–5
PC2
(21%
)
NCMIMCM
PCA without CD14/CD16 FSChigh/SSClow/CD3–CD56–CD19–
CD163
CD1cCD64
HLA-DR
CD62L
CD16
CCR2CD14
CD38
CX3CR1
CD303
CX3CR1
CD303
CD163
CD1c
CD64
HLA-DR
CD62L
CCR2
CD38
CX3CR1
CD303
CD163
CD1c
CD64
HLA-DR
CD62L
CCR2
CD38 CX3CR1
CD303
CD163
CD1c
CD64
HLA-DR
CD62L
CCR2
CD38 CX3CR1
CD303
CD163
CD1c
CD64
HLA-DR
CD62L
CCR2
CD38
CX3CR1
CD303
CD163
CD1c
CD64
HLA-DR
CD62L
CCR2
CD38
CD303
CD163
CD1c
CD64
HLA-DR
CD62L
CCR2
CD38 CX3CR1 CX3CR1
CD303
CD163
CD1c
CD64
HLA-DR
CD62L
CCR2
CD38
CCR2
CD38 CX3CR1
CD303
CD163
CD1c
CD64
HLA-DR
CD62L
CX3CR1
CD303
CD163
CD1c
CD64
HLA-DR
CD62L
CCR2
CD38 CX3CR1
CD303
CD163
CD1c
CD64
HLA-DR
CD62L
CCR2
CD38
e
a
d
cb
Colo
r ver
sion
ava
ilabl
e on
line
(For legend see next page.)2
Tak/van Groenendael/Pickkers/Koenderman
J Innate Immun 2017;9:464–474 DOI: 10.1159/000475665
468
recorded in the monocyte gate. Samples with very low monocyte counts (1 volunteer at t = 90 min, 1 at t = 180 min and 1 at t = 360 min) were compared to other samples at the same time point but did not show aberrant median fluorescence intensities (MFIs).
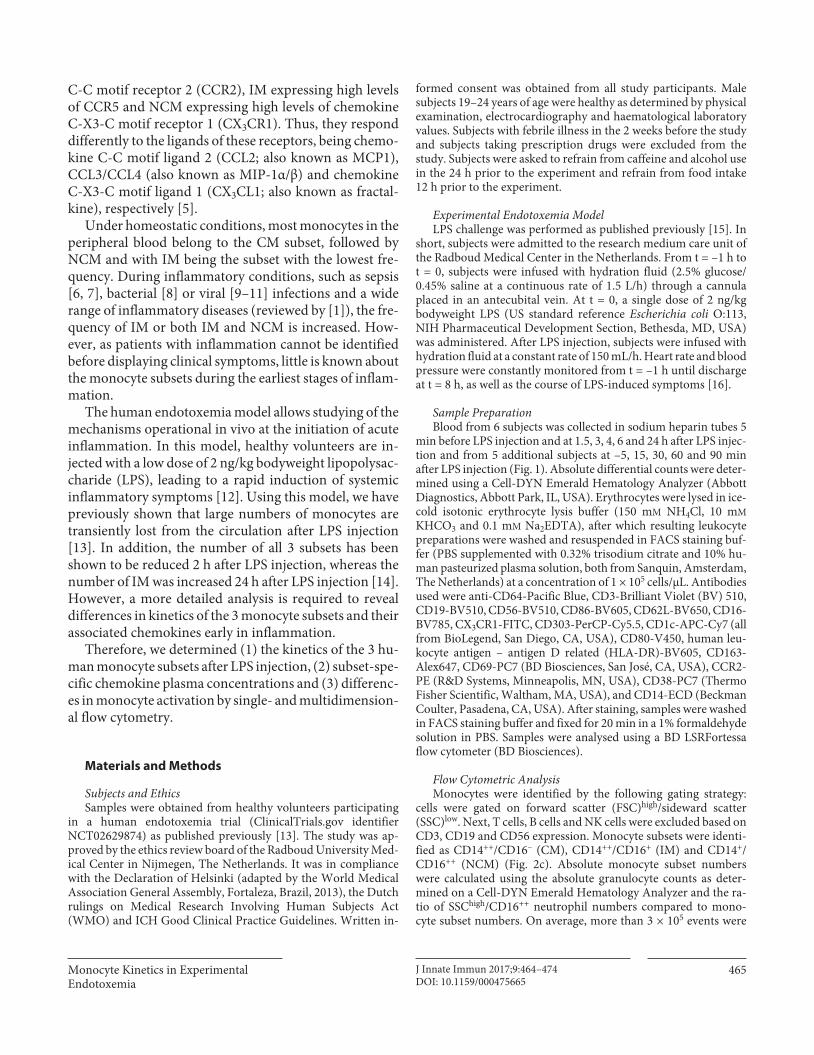
Multidimensional single-cell analysis was performed by princi-pal component analysis (PCA) on log-normalized MFIs of CD3/CD19/CD56-negative cells in the monocyte FSC/SSC gate as de-scribed by Jansen et al. [17] with a few modifications. In short, sin-gle-cell fluorescence intensities were extracted from fcs files using FCS Express V5 (De Novo Software, Glendale, CA, USA). For each volunteer, data from all time points were combined and log nor-malized. Subsequently, PCA was performed using the prcomp func-tion of R version 3.1.1, with results centred at 0 and variables scaled to have unit variance. This results in a so-called object score for each cell in each of the 2 PCs, which were plotted using the smooth-Scatter function. Since for each cell the computed object scores, the original MFIs and the time point are known, traditional gating on CD14/16 ( Fig. 2 d) could be used to determine where cells from a certain cell type end up in the PCA ( Fig. 2 e). Plotting each time point separately allowed for visualization of the monocyte expres-sion patterns over time. Contributions of each surface marker and correlations between surface marker expression patterns were vi-sualized by plotting the loadings of each marker as arrows in the scatterplots. As loadings cannot exceed the value of 1, they were multiplied by 10 for easier visualization in the scatter plots.
Plasma Chemokine Concentrations EDTA-anticoagulated blood was centrifuged immediately at
2,000 g for 15 min at 4 ° C, and plasma was stored at –80 ° C until analysis. CCL2, CCL3 and CCL4 plasma levels were determined using a Luminex assay according to the manufacturer’s instruc-tions (MILLIPLEX; Merck Millipore, Billerica, MA, USA).CX 3 CL1 plasma levels were determined by ELISA according to the manufacturer’s instructions (R&D Systems).
Software and Statistics Flow cytometry data were analysed using FCS Express V5 and
R version 3.1.2. Statistical analysis was performed using Prism 6.07 (GraphPad Software, La Jolla, CA, USA). Statistical significance of MFIs and HLA-DR percentages were assessed using repeated-measures 2-way ANOVA with Dunnett’s correction for multiplic-ity, and statistical significance of plasma cytokine levels was deter-mined using Friedman’s test with Dunn’s correction for multiplic-ity. Statistical significance of cell numbers was assessed by multiple Mann-Whitney tests with Bonferroni correction for multiplicity as not all time points were measured in all volunteers, precluding the use of repeated-measures tests.
Results
Monocyte Subset Numbers during Experimental Endotoxemia Volunteers injected with LPS showed clinical symp-
toms as described previously (data not shown) [13, 15] . In short, an increase in symptom scores (headache, nau-sea, and muscle/back ache) occurs at 1.5–2 h after LPS injection. At the same time, the body core temperature was elevated until 8 h after LPS injection. After objective symptoms had decreased at 2.5 h, the heart rate became elevated and the mean arterial pressure decreased, which lasted until at least 7–8 h after LPS injection. Cell num-bers in the peripheral blood of most cell types and subsets are changed after LPS injection. Neutrophilia was ob-served within 3 h after injection, leading to an increase in total white blood cell counts ( Fig. 1 ). Neutrophil and total white blood cell counts returned to normal values at 24 h after LPS injection.
Total blood monocyte counts were reduced at 1–1.5 h after LPS injection and showed a trend towards increased numbers at 6–8 h after LPS injection. The kinetics of CM after LPS injection reflected those of the total monocyte population with only 2% of CM remaining in circulation at 90 min after challenge. This similarity in kinetics was not surprising since 80–90% of all monocytes are CM un-der homeostatic conditions.
IM and NCM showed a different picture. For IM, 97–99% were lost from circulation between 1 and 1.5 h after LPS injection, and the first IM returned into the periph-eral blood 6–8 h after LPS injection. IM numbers showed a marked increase 24 h after LPS injection compared to homeostatic numbers. NCM numbers also decreased 1–8 h after LPS injection. However, during the first 2 h, the decrease in NCM numbers was not as large as for the oth-er 2 subsets, which was reflected by the finding that at1.5 h after LPS injection 30–50% of all monocytes were NCM. At 24 h after LPS injection, NCM numbers had returned to normal levels.
Fig. 2. Multidimensional single-cell analysis. Principal component analysis (PCA) was performed on fluorescence intensities of for-ward scatter (FSC) high /sideward scatter (SSC) low -gated CD3/CD19/CD56 neg mononuclear cells. PCA was performed with ( a ) and without ( b ) taking CD14 and CD16 into account. Arrows in-dicate loadings, i.e., the arrow for CX 3 CR1 points to the right, in-dicating that this marker is highly expressed on cells with a high object score in PC1 (which, thus, are on the right side of the figure). The length of the arrow indicates how much its parameter contrib-utes to the PCA. Percentages on the x and y axes indicate the per-
centage of variance in the dataset explained by each PC. To assess where each subset is localized in the PCA, cells were gated on a traditional CD14/CD16 plot ( c ) and plotted in the PCA without CD14/CD16 ( d ), showing a separation between classical mono-cytes (CM), intermediate monocytes (IM) and non-classical monocytes (NCM). When plotting individual time points in the PCA ( e ) without CD14/CD16, the loss of CM at t = 1.5 h and the loss of IM and NCM from 1.5/3–8 h after lipopolysaccharide injec-tion can clearly be observed. Data are from 1 individual represen-tative for a total of 6 donors. MFI, median fluorescence intensity.
Monocyte Kinetics in Experimental Endotoxemia
J Innate Immun 2017;9:464–474 DOI: 10.1159/000475665
469
Loss of Monocyte Subsets Is Independent of CD14 and CD16 Expression NCM have been shown to lose CD16 expression after
stimulation with LPS in vitro [18] . Therefore, we identi-fied the 3 monocyte subsets without the use of the classi-cal markers CD14 and CD16. This was done by using multidimensional single-cell analysis after the cells were stained with multiple markers that can identify monocyte subsets and monocyte activation status: CCR2, CX 3 CR1, CD38, HLA-DR, CD62L, CD163, CD64 and the DC markers CD1c and CD303. PCA reduces the number of dimensions in a dataset by finding correlations between marker expressions and replacing the markers by a small-er number of imaginary markers called PCs. In this case, it reduced the number of dimensions required for visual-ization from 11 or 9 (1 for each measured antibody) to 2 dimensions (PC1 and PC2). Resulting values for PCA1 and PCA2 (called object scores) were adequate to dis-criminate between the 3 subsets ( Fig. 2 a, b), either with or without the use of CD14 and CD16. Arrows indicate the loadings for each marker, meaning that when an arrow points right, such as CX 3 CR1, all cells on the right of the plot (positive value in PCA1) have a relatively highCX 3 CR1 expression, whereas cells on the left of the plot (negative value for PCA1) have a relatively low CX 3 CR1 expression. The length of the arrow indicates how impor-tant a marker is for the PCA and shows that dendritic cell markers CD1c and CD303 are least important for ex-plaining differences in expression between monocytes, as would be expected. Plotting of CD14/CD16-gated CM, IM and NCM from t = 0 in the PCA space performed without CD14 and CD16 showed where the subsets end up in the PCA ( Fig. 2 d). The different cell populations matched the known expression profiles for each subset. For example, NCM have the highest CX 3 CR1 expression, IM have the highest HLA-DR expression and CM have the highest CD62L expression.
When plotting all time points separately, multidimen-sional analysis without the use of CD14 and CD16 showed similar kinetics to those in Figure 1 ( Fig. 2 e). Thus, mul-tidimensional analysis demonstrated that the observed loss of IM and NCM at t = 3–8 h cannot be attributed to (LPS-induced) activation-induced loss of CD16 expres-sion.
Of interest is that the multidimensional plots showed that the CM population present at t = 3–8 h after LPS in-jection was shifted to the left compared to t = 0. This sug-gests a change in expression for some of the markers, such as an increased expression of markers with a negative loading for PCA1 (i.e., the arrow pointing left, like
CD62L, CD38 and CD64) or a decreased expressionof markers with a positive loading for PCA1 (such asCX 3 CR1 and, to a lesser extent, HLA-DR).
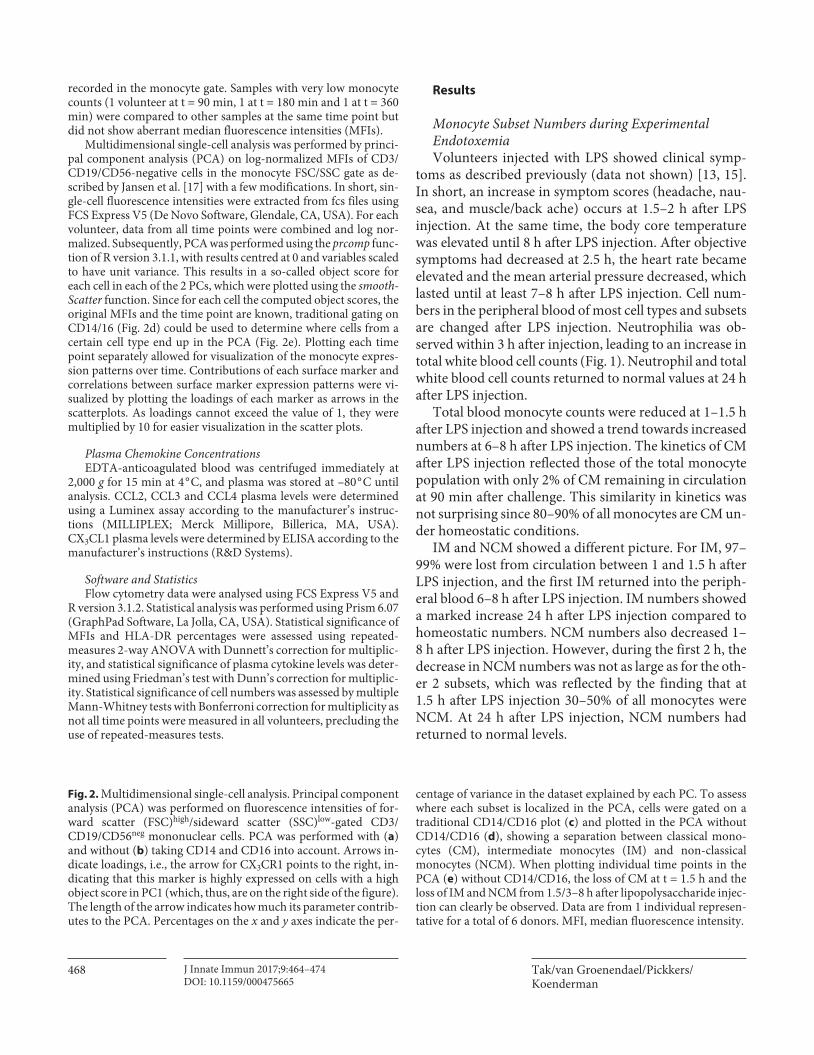
Differential Monocyte Surface Marker Expression after LPS Injection Since multidimensional analysis of monocyte subsets
indicated changes in monocyte surface marker expres-sion, expression levels of several activation and differen-tiation markers were compared over time for each subset ( Fig. 3 ). This analysis showed reduced expression of che-mokine receptor CX 3 CR1 on all subsets during the first8 h after challenge. Adhesion molecules Mac-1 (CD11b) and L -selectin (CD62L) showed increased expression, the former on CM and IM and the latter on IM and NCM. Monocyte activation/differentiation markers showed ei-ther upregulation (CD11b on CM and IM), downregula-tion (CD86 on IM and NCM) or no significant changes (CD80). CD163 expression was increased at 24 h after LPS injection on all 3 subsets. HLA-DR expression and the percentage of HLA-DR-positive cells was decreased only on IM and NCM and not on CM.
Plasma Chemokine Concentrations Plasma chemokine concentrations were determined at
several time points after injection of LPS ( Fig. 4 ). Chemo-kine levels in plasma were significantly increased from1 h (CCL3 and CCL4) and 2 h (CCL2, CX 3 CL1) after LPS injection. CX 3 CL1 plasma levels were the highest of the 4 measured cytokines and increased more slowly than those of the other chemokines. CX 3 CL1 levels reached their highest levels at 6 h after LPS injection, a time point at which plasma CCL2 and CCL3 levels had already re-turned to normal levels. Plasma CCL4 levels also reached their maximum very rapidly but remained elevated until at least 6 h after LPS injection.
Discussion
Differential Loss of Monocyte Subsets from Circulation after Systemic LPS Challenge The changes in monocyte subset counts are in agree-
ment with those published previously on the whole mono-cyte population [13] and on the 3 subsets [14] . However, the larger number of measurements in our study allowed for a better overview of the loss of cells during the first hours after LPS injection and of the increased CM num-bers 8 h after LPS injection. Furthermore, the multidi-mensional FACS analysis allowed us to demonstrate that

Tak/van Groenendael/Pickkers/Koenderman
J Innate Immun 2017;9:464–474 DOI: 10.1159/000475665
470
our findings are unlikely to be due to the loss of CD14 or CD16 expression, as was described in vitro [18] .
Our measurements at the time point 24 h after LPS in-jection show similarities to those observed in disease, as recent studies described increased percentages of IM [6]
or both IM and NCM [7, 8] in sepsis [6, 7] , tuberculosis infection [8] and a large number of other infectious and inflammatory diseases (reviewed in [1] ).
Increases in cell numbers might reflect the mobiliza-tion of marginated cells or a compensatory release of cells
****** *
****
****
********
*********
**** ** *
**** ***
*
102
0 2 4 6
HLA-DR
8 24
103
104
105
MFI
102
0 2 4 6
CD69
8 24
103
104
105
MFI
102
0 2 4 6
CD38
8 24
103
104
105
MFI
102
0 2 4 6
CX3CR1
8 24
103
104
105
MFI
****
************
**********
****
*** ****
102
0 2 4 6
CD86
8 24
103
104
105
MFI
102
0 2 4 6
CD64
8 24
103
104
105
MFI
102
0 2 4 6
CD163
8 24
103
104
105
MFI
102
0 2 4 6Time after LPS, h Time after LPS, h Time after LPS, h
Time after LPS, hTime after LPS, hTime after LPS, h
Time after LPS, h Time after LPS, h Time after LPS, h
Time after LPS, hTime after LPS, hTime after LPS, h
CCR2
8 24
103
104
105
MFI ***
*****
******
*
*
**** ****
***
0
20
40
60
80
0 2 4 6
HLA-DR+ cells
8 24
100
Cells
, %102
0 2 4 6
CD80
8 24
103
104
105
MFI
102
0 2 4 6
CD62L
8 24
103
104
105
MFI
102
0 2 4 6
CD11b CMIMNCM
8 24
103
104
105
MFI
Colo
r ver
sion
ava
ilabl
e on
line
Fig. 3. Surface marker expression patterns after lipopolysaccharide (LPS) injection. Surface marker expressions were determined on classical monocytes (CM), intermediate monocytes (IM) and non-classical monocytes (NCM) separately. For HLA-DR, the percent-age of HLA-DR + cells was examined as well. Data points are
nudged ±0.2 days for better representation of error bars and indi-cate means ± SEM. * , * * , * * * and * * * * indicate p < 0.05, p < 0.01, p < 0.001 and p < 0.0001 compared to t = 0, respectively. n = 6 per time point. MFI, median fluorescence intensity.

Monocyte Kinetics in Experimental Endotoxemia
J Innate Immun 2017;9:464–474 DOI: 10.1159/000475665
471
from the bone marrow, where large numbers of mono-cytes reside. This bone marrow monocyte pool is en-riched by IM-like cells [19] , which might explain a much larger fold increase in IM numbers than in CM numbers after LPS injection. Alternatively, the increase in cell numbers might reflect de novo production of monocytes in the bone marrow. A labelling study in simian macaques [20] has shown that, under homeostatic conditions, CM are the first cells to be released from bone marrow, fol-lowed by IM and lastly by NCM. In humans, CM are the first cells to repopulate the bloodstream after hematopoi-etic stem cell transplantation [21] , making it likely that human monocytes follow a similar pattern. This would fit with our observations that CM numbers are elevated first, followed by IM. NCM numbers were not significantly el-evated, which might be attributed to the longer NCM
maturation time [20, 21] . However, if the increased cell numbers observed in our study were caused by de novo production, monocyte maturation would have to be rap-idly increased, as monocyte maturation appears to take 2 days (CM), 4 days (IM) or 7 days (NCM) under homeo-static conditions [20] .
In contrast to later time points, we observed a dramat-ic loss of monocytes from the circulation during the early phases of inflammation. This decrease in monocyte num-bers might reflect an increase in monocytes residing in the marginated pool [22] or rolling on the vessel walls [23] , a process described under inflammatory conditions [3, 24] . For NCM, the decreased numbers could also re-flect a larger fraction of monocytes displaying patrolling behaviour as described during inflammation [3] . Alterna-tively, at least part of the monocytes might exit the blood-
103
Plas
ma
CX3C
L1, p
g/m
L104
105
106
0 2 4 6d
8 24
**
********
****
100
101
102
103
0 2 4 6b
8 24
*** ***
*
********
101
Plas
ma
CCL4
, pg/
mL
102
103
104
0 2 4 6c
8 24
***
*
**** ****
****
101
Plas
ma
CCL2
, pg/
mL
Plas
ma
CCL3
, pg/
mL
102
103
104
0 2 4 6Time after LPS, h Time after LPS, h
Time after LPS, hTime after LPS, h
a8 24
*** *******
**
Fig. 4. Plasma chemokine concentrations. Plasma CCL2 ( a ), CCL3 ( b ), CCL4 ( c ) and CX 3 CL1 ( d ) after lipopoly-saccharide (LPS) injection. Data represent means ± 95% CI with n = 11. Dotted lines indicate detection limits; detection limits for CCL4 and CX 3 CL1 were below the x axis. * , * * and * * * * represent p < 0.05, p < 0.01 and p < 0.0001 compared to t = 0, respectively.

Tak/van Groenendael/Pickkers/Koenderman
J Innate Immun 2017;9:464–474 DOI: 10.1159/000475665
472
stream and differentiate into dendritic cells or macro-phages as described for murine CM during homeostasis [25] .
Diurnal rhythms should also be taken into account when comparing cell numbers at different time points, as circulating CM and IM numbers have been shown to vary by 20 and 40% during the day, respectively [26] . Our time point 0 (09: 00 a.m.) is close to the diurnal minimum of both CM and NCM. At time points reported to have a higher monocyte count due to diurnal variation, mono-cyte numbers after LPS injection were either decreased (IM, t = 8 h) or not analysed (t = 14 h). Thus, diurnal variations do not account for the differences in monocyte counts observed after LPS injection.
Plasma Chemokine Levels Parallel Differential Loss of Monocyte Subsets from the Circulation Activation of chemokine receptors CCR2, CCR5 and
CX 3 CR1 by their ligands (CCL2, CCL3/CCL4 andCX 3 CL1, respectively) can induce monocyte extravasa-tion [27, 28] . In addition, CX 3 CL1 is reported to increase NCM patrolling [29] in mice, which would also lead to an observed loss of NCM flowing freely in the blood. The kinetics of plasma CCL2 levels were inversely proportion-al to the presence of CM in the blood, the subset with the highest CCR2 expression. Similar to this, plasma concen-trations of CCR5 ligand CCL4 correlated with the de-crease in IM numbers, which have the highest CCR5 ex-pression. CX 3 CL1 levels, in turn, follow the loss of NCM, which have the highest CX 3 CR1 expression. In contrast, concentrations of CCR5 ligand CCL3 were the lowest of all measured cytokines and appear to return to normal levels more rapidly than IM numbers, indicating that this chemokine is not providing the primary signal for IM to exit from the circulation. Taken together, these data sug-gest that CCL2, CCL4 and CX 3 CL1 but not CCL3 were involved in the loss of monocytes from the circulation during LPS-induced acute inflammation. However, proof of this hypothesis would require a study utilizing chemo-kine-blocking antibodies in the context of experimental endotoxemia.
Monocyte Activation and Differentiation Markers Circulating monocytes did not show a clear activated
phenotype after LPS challenge. CD11b expression was in-creased in CM and IM, as published previously [14] , but CD86 and CD62L showed significant changes, pointing towards a lower activation status. A decreased activation state might be due to activated cells homing to the tissues leaving behind less activated cells. A similar situation in
which only cells with a low activation state remain in the circulation has been proposed for both neutrophils [30] and eosinophils [31] . This notion is further supported by the finding that the chemokine receptor CX 3 CR1 had a lower expression in the NCM remaining in the circula-tion after induction of acute inflammation. Alternatively, however, the decrease in CX 3 CR1 expression could be due to receptor endocytosis after ligand binding or re-populating of monocytes with differential receptor ex-pression from a bone marrow pool, although this latter option would require an extreme increase in monocyte maturation rates, as NCM maturation under homeostasis is in the order of several days, not hours [20] .
HLA-DR is a marker of special interest, as a decreased monocyte HLA-DR expression has been shown to corre-late with the development of sepsis after severe acute in-flammation [32, 33] . However, HLA-DR expression on CM remained stable during our whole experiment. This finding illustrates the need to perform measurements on gated monocyte subsets instead of on the whole mono-cyte population, as loss of HLA-DR during experimental endotoxemia is caused, first, by a loss of all monocytes from the circulation and, later, by both a loss of HLA-DR high cells and a lower expression of HLA-DR on the remaining HLA-DR high cells.
Conclusions
The experimental endotoxemia model uniquely al-lowed the analysis of the earliest stages of acute inflam-mation and provided critical new insights into the behav-iour of circulatory monocytes at time points at which pa-tients normally cannot be sampled. Monocyte kinetics during these early stages of LPS-induced acute inflamma-tion differ greatly from later phases of the inflammatory response. More than 95% of cells from all 3 monocyte subsets were lost from the circulation at 1–2 h after LPS injection, during which the cells remaining in the blood-stream did not display a clear activated phenotype. This decrease was followed by an increase in monocyte counts and, finally, by a return to baseline levels, but with differ-ences in timing for the 3 monocyte subsets. Taken togeth-er, our experiments revealed marked differences in the behaviour of the 3 monocyte subsets during the earliest phases of the acute inflammatory response.
Monocyte Kinetics in Experimental Endotoxemia
J Innate Immun 2017;9:464–474 DOI: 10.1159/000475665
473
References
1 Wong KL, Yeap WH, Tai JJ, Ong SM, Dang TM, Wong SC: The three human monocyte subsets: implications for health and disease. Immunol Res 2012; 53: 41–57.
2 Ziegler-Heitbrock L, Ancuta P, Crowe S, Dalod M, Grau V, Hart DN, Leenen PJ, Liu YJ, MacPherson G, Randolph GJ, Scherberich J, Schmitz J, Shortman K, Sozzani S, Strobl H, Zembala M, Austyn JM, Lutz MB: Nomencla-ture of monocytes and dendritic cells in blood. Blood 2010; 116:e74–e80.
3 Cros J, Cagnard N, Woollard K, Patey N, Zhang SY, Senechal B, Puel A, Biswas SK, Mo-shous D, Picard C, Jais JP, D’Cruz D, Casa-nova JL, Trouillet C, Geissmann F: Human CD14dim monocytes patrol and sense nucle-ic acids and viruses via TLR7 and TLR8 recep-tors. Immunity 2010; 33: 375–386.
4 Weber C, Belge KU, von Hundelshausen P, Draude G, Steppich B, Mack M, Frankenberg-er M, Weber KS, Ziegler-Heitbrock HW: Dif-ferential chemokine receptor expression and function in human monocyte subpopula-tions. J Leukoc Biol 2000; 67: 699–704.
5 Tacke F, Alvarez D, Kaplan TJ, Jakubzick C, Spanbroek R, Llodra J, Garin A, Liu J, Mack M, van Rooijen N, Lira SA, Habenicht AJ, Randolph GJ: Monocyte subsets differentially employ CCR2, CCR5, and CX3CR1 to accu-mulate within atherosclerotic plaques. J Clin Invest 2007; 117: 185–194.
6 Poehlmann H, Schefold JC, Zuckermann-Becker H, Volk HD, Meisel C: Phenotype changes and impaired function of dendritic cell subsets in patients with sepsis: a prospec-tive observational analysis. Crit Care 2009; 13:R119.
7 Skrzeczynska J, Kobylarz K, Hartwich Z, Zembala M, Pryjma J: CD14 + CD16 + mono-cytes in the course of sepsis in neonates and small children: monitoring and functional studies. Scand J Immunol 2002; 55: 629–638.
8 Castano D, Garcia LF, Rojas M: Increased fre-quency and cell death of CD16 + monocytes with Mycobacterium tuberculosis infection. Tuberculosis (Edinb) 2011; 91: 348–360.
9 Rodriguez-Munoz Y, Martin-Vilchez S, Lo-pez-Rodriguez R, Hernandez-Bartolome A, Trapero-Marugan M, Borque MJ, Moreno-Otero R, Sanz-Cameno P: Peripheral blood monocyte subsets predict antiviral response in chronic hepatitis C. Aliment Pharmacol Ther 2011; 34: 960–971.
10 Zhang JY, Zou ZS, Huang A, Zhang Z, Fu JL, Xu XS, Chen LM, Li BS, Wang FS: Hyper-ac-tivated pro-inflammatory CD16 monocytes correlate with the severity of liver injury and fibrosis in patients with chronic hepatitis B. PLoS One 2011; 6:e17484.
11 Han J, Wang B, Han N, Zhao Y, Song C, Feng X, Mao Y, Zhang F, Zhao H, Zeng H: CD-14 high CD16 + rather than CD14 low CD16 + monocytes correlate with disease progression in chronic HIV-infected patients. J Acquir Immune Defic Syndr 2009; 52: 553–559.
12 Andreasen AS, Krabbe KS, Krogh-Madsen R, Taudorf S, Pedersen BK, Moller K: Human endotoxemia as a model of systemic inflam-mation. Curr Med Chem 2008; 15: 1697–1705.
13 Kamp VM, Leentjens J, Pillay J, Langereis JD, de Kleijn S, Kox M, Netea MG, Pickkers P, Koenderman L: Modulation of granulocyte kinetics by GM-CSF/IFN-γ in a human LPS rechallenge model. J Leukoc Biol 2013; 94: 513–520.
14 Thaler B, Hohensinner PJ, Krychtiuk KA, Matzneller P, Koller L, Brekalo M, Maurer G, Huber K, Zeitlinger M, Jilma B, Wojta J, Speidl WS: Differential in vivo activation of monocyte subsets during low-grade inflam-mation through experimental endotoxemia in humans. Sci Rep 2016; 6: 30162.
15 Leentjens J, Kox M, Koch RM, Preijers F, Joosten LA, van der Hoeven JG, Netea MG, Pickkers P: Reversal of immunoparalysis in humans in vivo: a double-blind, placebo-con-trolled, randomized pilot study. Am J Respir Crit Care Med 2012; 186: 838–845.
16 Kox M, van Eijk LT, Zwaag J, van den Wilden-berg J, Sweep FC, van der Hoeven JG, Pick-kers P: Voluntary activation of the sympathet-ic nervous system and attenuation of the in-nate immune response in humans. Proc Natl Acad Sci USA 2014; 111: 7379–7384.
17 Jansen JJ, Hilvering B, van den Doel A, Pick-kers P, Koenderman L, Buydens LMC, van den Brink OF: FLOOD: FLow cytometric Or-thogonal Orientation for Diagnosis. Che-mometr Intell Lab Syst 2016; 151: 126–135.
18 Picozza M, Battistini L, Borsellino G: Mono-nuclear phagocytes and marker modulation: when CD16 disappears, CD38 takes the stage. Blood 2013; 122: 456–457.
19 Mandl M, Schmitz S, Weber C, Hristov M: Characterization of the CD14 ++ CD16 + mono-cyte population in human bone marrow. PLoS One 2014; 9:e112140.
20 Sugimoto C, Hasegawa A, Saito Y, Fukuyo Y, Chiu KB, Cai Y, Breed MW, Mori K, Roy CJ, Lackner AA, Kim WK, Didier ES, Kuroda MJ: Differentiation kinetics of blood monocytes and dendritic cells in macaques: insights to understanding human myeloid cell develop-ment. J Immunol 2015; 195: 1774–1781.
21 McGovern N, Schlitzer A, Gunawan M, Jar-dine L, Shin A, Poyner E, Green K, Dickinson R, Wang XN, Low D, Best K, Covins S, Milne P, Pagan S, Aljefri K, Windebank M, Miran-da-Saavedra D, Larbi A, Wasan PS, Duan K, Poidinger M, Bigley V, Ginhoux F, Collin M, Haniffa M: Human dermal CD14 + cells are a transient population of monocyte-derived macrophages. Immunity 2014; 41: 465–477.
22 van Furth R, Sluiter W: Distribution of blood monocytes between a marginating and a cir-culating pool. J Exp Med 1986; 163: 474–479.
23 Ramos CL, Huo Y, Jung U, Ghosh S, Manka DR, Sarembock IJ, Ley K: Direct demonstra-tion of P-selectin- and VCAM-1-dependent mononuclear cell rolling in early atheroscle-rotic lesions of apolipoprotein E-deficient mice. Circ Res 1999; 84: 1237–1244.
24 Xu H, Manivannan A, Crane I, Dawson R, Li-versidge J: Critical but divergent roles for CD62L and CD44 in directing blood mono-cyte trafficking in vivo during inflammation. Blood 2008; 112: 1166–1174.
25 Varol C, Landsman L, Fogg DK, Greenshtein L, Gildor B, Margalit R, Kalchenko V, Geiss-mann F, Jung S: Monocytes give rise to muco-sal, but not splenic, conventional dendritic cells. J Exp Med 2007; 204: 171–180.
Acknowledgements
Our gratitude goes to the research nurses of the Radboud Med-ical Center for taking excellent care of our volunteers and to Deon Kanters for his help with chemokine measurements. This work was supported by the Dutch Lung Foundation (grant 3.2.10.052).
Disclosure Statement
The authors declare no conflicts of interest.
Author Contributions
R.G. took care of all clinical aspects of the trial, including re-cruitment and screening of volunteers and the endotoxemia chal-lenge itself, under supervision of P.P. T.T. performed all labora-tory and statistical analyses under supervision of L.K. and wrote the first draft of the paper. All authors read and approved the final manuscript.

Tak/van Groenendael/Pickkers/Koenderman
J Innate Immun 2017;9:464–474 DOI: 10.1159/000475665
474
26 Shantsila E, Tapp LD, Wrigley BJ, Montoro-Garcia S, Ghattas A, Jaipersad A, Lip GY: The effects of exercise and diurnal variation on monocyte subsets and monocyte-platelet aggregates. Eur J Clin Invest 2012; 42: 832–839.
27 Kuziel WA, Morgan SJ, Dawson TC, Griffin S, Smithies O, Ley K, Maeda N: Severe reduc-tion in leukocyte adhesion and monocyte ex-travasation in mice deficient in CC chemo-kine receptor 2. Proc Natl Acad Sci USA 1997; 94: 12053–12058.
28 Auffray C, Fogg DK, Narni-Mancinelli E, Senechal B, Trouillet C, Saederup N, Leemput J, Bigot K, Campisi L, Abitbol M, Molina T, Charo I, Hume DA, Cumano A, Lauvau G, Geissmann F: CX3CR1 + CD115 + CD135 + common macrophage/DC precursors and the role of CX3CR1 in their response to inflam-mation. J Exp Med 2009; 206: 595–606.
29 Auffray C, Fogg D, Garfa M, Elain G, Join-Lambert O, Kayal S, Sarnacki S, Cumano A, Lauvau G, Geissmann F: Monitoring of blood vessels and tissues by a population of mono-cytes with patrolling behavior. Science 2007; 317: 666–670.
30 Hietbrink F, Koenderman L, Althuizen M, Leenen LP: Modulation of the innate immune response after trauma visualised by a change in functional PMN phenotype. Injury 2009; 40: 851–855.
31 Johansson MW, Han ST, Gunderson KA, Busse WW, Jarjour NN, Mosher DF: Platelet activation, P-selectin, and eosinophil β1-integrin activation in asthma. Am J Respir Crit Care Med 2012; 185: 498–507.
32 Hershman MJ, Cheadle WG, Wellhausen SR, Davidson PF, Polk HC Jr: Monocyte HLA-DR antigen expression characterizes clinical out-come in the trauma patient. Br J Surg 1990; 77: 204–207.
33 Hershman MJ, Cheadle WG, Kuftinec D, Polk HC Jr, George CD: An outcome predictive score for sepsis and death following injury. Injury 1988; 19: 263–266.
Copyright © 2022 FDOKUMEN