
Phenotypic Characterization of Five Dendritic Cell Subsets in Human Tonsils
Upload
independentCategory
view
2download
0
Leukemia (2002) 16, 186–195 2002 Nature Publishing Group All rights reserved 0887-6924/02 $25.00
www.nature.com/leu
Quantitative HOX expression in chromosomally defined subsets of acutemyelogenous leukemiaHA Drabkin1, C Parsy2, K Ferguson1, F Guilhot4, L Lacotte4, L Roy4, C Zeng2, A Baron2, SP Hunger5,7, M Varella-Garcia1,R Gemmill1, F Brizard6, A Brizard6 and J Roche3
1Division of Medical Oncology, University of Colorado Health Sciences and Cancer Centers, Denver, CO, USA; 2Department of Biostatistics,University of Colorado Health Sciences and Cancer Centers, Denver, CO, USA; 3IBMIG, CNRS FRE 2224, Universite de Poitiers, Poitiers,France; 4Departement d’Hematologie et Oncologie Medicale, CHU de Poitiers, Poitiers, France; 5The Children’s Hospital and University ofColorado Cancer Center, Denver, CO, USA; and 6Laboratoire d’Hematologie, CHU de Poitiers, CNRS FRE 2224, Poitiers, France
We used a degenerate RT-PCR screen and subsequent real-time quantitative RT-PCR assays to examine the expression ofHOX and TALE-family genes in 34 cases of chromosomallydefined AML for which outcome data were available. AMLs withfavorable cytogenetic features were associated with low overallHOX gene expression whereas poor prognostic cases had highlevels. Characteristically, multiple HOXA family membersincluding HOXA3–HOXA10 were jointly overexpressed in con-junction with HOXB3, HOXB6, MEIS1 and PBX3. Higher levelsof expression were also observed in the FAB subtype, AML-M1. Spearmann correlation coefficients indicated that theexpression levels for many of these genes were highly inter-related. While we did not detect any significant correlationsbetween HOX expression and complete response rates or agein this limited set of patients, there was a significant correlationbetween event-free survival and HOXA7 with a trend towardsignificance for HoxA9, HoxA4 and HoxA5. While patients withelevated HOX expression did worse, there were notable excep-tions. Thus, although HOX overexpression and clinical resist-ance to chemotherapy often coincide, they are not inextricablylinked. Our results indicate that quantitative HOX analysis hasthe potential to add new information to the management ofpatients with AML, especially where characteristic chromo-somal alterations are lacking.Leukemia (2002) 16, 186–195. DOI: 10.1038/sj/leu/2402354Keywords: homeodomain; TALE; MLL; chromosome translo-cation; AML
Introduction
Homeodomain containing genes encode a set of master tran-scription factors that act during development to control pat-tern formation, differentiation and proliferation. Mammalspossess at least 39 class I HOX genes grouped into four majorclusters (HOXA–D) on four different chromosomes. Thehomeodomain, a highly conserved 61-amino acid helix–turn–helix DNA binding motif, is the common element defining thisgene family.1 During development, HOX expression occurstemporally in accordance with both the position of a genewithin its cluster and in a rostral–caudal manner.2 This samepattern can be recapitulated during retinoic acid-induced dif-ferentiation of embryonal carcinoma cell lines.3 HOX genesin equivalent positions of different clusters (paralogs) are moreclosely related than adjacent genes in the same cluster. More-over, evidence from chimeric gene experiments indicates that,at least in some cases, paralogous HOX genes are functionally
Correspondence: HA Drabkin, Division of Medical Oncology, Box B-171 University of Colorado Health Sciences Center, 4200 E 9th Ave,Denver, CO 80262, USA; Fax: 303–315–88257Present address: University of Florida, Department of PediatricHematology/Oncology, Gainesville, FL 32610–0296, USAReceived 26 June 2001; accepted 25 September 2001
equivalent and that it is the expression level of the paralogousgroup as a whole which is critical for correct development.4
In cancer, deregulation of HOX gene expression and HOXalterations have been most convincingly demonstrated in leu-kemia. For example, various AML translocations fuse thenucleoporin domain of NUP98 to the homeobox of a majoror divergent HOX protein.5–7 Similarly, the T cell ALL t(10;14)chromosomal translocation results in overexpression of thehomeodomain containing gene, HOX11,8 and the t(1;19)translocation fuses E2A with the homeodomain and otherregions of PBX1.9,10 In an experimental setting, a high pro-portion of mice transplanted with bone marrow cells overex-pressing either Hoxa9, a10, b3 or b8 develop AML.11–14 Inhumans, the Trithorax or MLL/ALL-1 gene, which normallyfunctions to maintain Hox gene expression, is a frequent targetof chromosomal rearrangements. Joh et al15 demonstrated thata chimeric MLL-LTG9 protein led to the inhibition of Hoxa7,Hoxb7 and Hoxc9 expression in mouse 32Dcl3 myeloid cells.Recently, Rozovskaia et al16 found that the t(4;11) translo-cation was associated with increased expression of HOXA9and MEIS1. Importantly, HOXA9 has been identified in a geneexpression array-based screen as the single gene whoseexpression most correlated with treatment failure in AML.17
Recently, we examined HOX gene expression in humanlung cancer.18 Interestingly, in both cell lines and directtumors, the HOXA9 and B9 paralogs and HOXA10 were fre-quently overexpressed. In contrast, HOXA1 was often down-regulated in concert with WNT7a. Moreover, both in ourinitial report and from more recent studies, we observed thatHOX gene expression in lung tumors tends to fall into twogroups; one subset expressing multiple HOX genes at high lev-els and the other with overall low HOX gene expression. Wewere intrigued by the potential parallels involving HOXexpression patterns in two seemingly diverse types of cancerand by the opportunity to correlate HOX expression withchromosomal alterations. In patients with AML, the presenceof a t(8;21), t(15;17) or inv(16) is widely recognized as a favor-able cytogenetic subset.19 In contrast, patients with deletionsof chromosome 5 or 7, abnormalities involving 3q, and com-plex karyotypes define a poor prognostic group.19 Similarly,alterations of the MLL gene are often associated with a poorprognosis although it appears that t(9;11) translocations maydo better than other MLL rearrangements.20,21 However, fora substantial number of patients, characteristic chromosomalabnormalities are lacking. These patients and their physiciansare left with considerable uncertainty regarding the need foradditional therapy.In this report, we demonstrate that favorable and unfavor-
able cytogenetic abnormalities are closely associated with dis-tinct HOX expression patterns. When extended to a group ofpatients with either normal cytogenetics or those withchromosomal alterations of intermediate or unclear signifi-

HOX expression in AMLHA Drabkin et al
187cance, the HOX expression patterns were similarly welldemarcated and appear to be predictive of outcome,especially for the subset of patients with low levels ofexpression. Also, the levels of gene expression were clearlynot random as there were highly significant correlationsamong various clustered HOX genes, PBX and MEIS familymembers.
Materials and methods
Homeobox amplification using degenerate primers
Two blocks of completely conserved amino acids, ELEKEF andKIWFQN, within the homeodomain were chosen for degener-ate primers. These were ELEKEF: 5�-GCT CTA GA(A/G)(C/T)T(A/C/G/T) GA(A/G) AA(A/G) GA(A/G) TT and KIWFQN:5�-GGA ATT C(A/G)T T(C/T)T G(A/G)A ACC A(A/G/T)AT(C/T)T T. PCR conditions consisted of 32–35 cycles of ampli-fication (94°C, 1 min; 40°C, 1 min; 72°C, 1 min) with 4.5 mM
MgCl2 and 2 �M primers. A band of �120 bp was gel isolatedand cloned into a T vector. Individual clones were sequencedand analyzed using BLAST.
Real-time quantitative RT-PCR
Quantitative RT-PCR assays were performed using the ABI5700 real-time system with SYBR-green fluorescence as pre-viously described including the use of normalization toG3PDH.18 Briefly, RNAs were prepared from approximately1–5 × 10⁶ frozen bone marrow cells and extensively treatedwith DNase using RNeasy columns and protocols rec-ommended by the manufacturer (Qiagen, Valencia, CA, USA).First-strand cDNA was prepared using 1–2 �g of total RNA,SuperScript II (Invitrogen Life Technologies, Carlsbad, CA,USA) and conditions recommended by the manufacturer. Forthe quantitative RT-PCR, 20 �l reactions were utilized whichincluded 0.5 �l cDNA, 1.6 mM Mg++, 200 �M dNTPs, 0.1�M primers and 0.1 �l AmpliTaq Gold (Applied Biosystems,Wellesley, MA, USA). A ‘master mix’ containing all compo-nents, except the cDNA template, was aliquoted to each reac-tion tube. The cDNA template was then added utilizing asmall volume pipet to increase accuracy. Following an initial95°C × 10 min to activate the DNA polymerase, 35 cycles ofa two-stage PCR were used consisting of 95°C × 15 s and 60°C× 1 min. With this system, we initially began by performingthe reactions in triplicate. However, the reproducibility is suchthat duplicate reactions are entirely sufficient. In the unusualcase that duplicates differ by one PCR cycle, reactions arerepeated. The PCR products were verified by gel analysis,were shown to consist of only a single band and in most caseswere confirmed by DNA sequencing. The absence of con-tamination was verified by ‘no template’ controls and ‘noreverse-transcriptase’ controls were used to confirm theabsence of DNA contamination.The PCR primers were designed to work under a standard
set of conditions and to produce products less than 200 bp.Primers were designed using PrimerExpress 1.0 (AppliedBiosystems). The actual human gene sequences were obtainedfrom GenBank. Primer sequences were as follows : HOXA1for5�-ACC CCT CGG ACC ATA GGA TTA C; HOXA1rev 5�-AAGGCG CAC TGA AGT TCT GTG; HOXA3for 5�-TGC TTT GTGTTT TGT CGA GAC TC; HOXA3rev 5�-CAA CCC TAC CCCTGC CAA C; HOXA4for 5�-GCT CTG TTT GTC TGA GCG
Leukemia
CC; HOXA4 rev 5�-AAT TGG AGG ATC GCA TCT TGG;HOXA5 for 5�-AGA TCT ACC CCT GGA TGC GC; HOXA5rev5�-CCT TCT CCA GCT CCA GGG TC; HOXA7for 5�-ATC ACTCTA CCT CGT AAA ACC GAC AC; HOXA7rev 5�-ACA TAATAC GAA GAA CTC ATA ATT TTG ACC; HOXA9 for 5�-GAGTGG AGC GCG CAT GAA G; HOXA9rev 5�-GGT GAC TGTCCC ACG CTT GAC; HOXA10for 5�-GAG AGC AGC AAAGCC TCG C; HoxA10rev 5�-CCA GTG TCT GGT GCT TCGTG; HOXB3 for 5�-CCG TGT AGA GAT GGC CAA CC; HOX-B3rev 5�-CAA TCC CTT GGC CTT CTG G; HOXB6for 5�-AGGACA AGA GCG TGT TCG GC; HOXB6rev 5�-GGC CCA AAGGAG GAA CTG TTG; HOXB7for 5�-CCA GCC TCA AGT TCGGTT TTC; HOXB7rev 5�-CCC GAA CCC GCT CCA TAG;HOXB9for 5�-AAA AAG CGC TGT CCC TAC ACC; HoxB9rev5�-ACA CCA AAT ACC AGA CGC TGG; HOXC8for 5�-CAGAAC TCG TCT CCC AGC CTC; HoxC8rev 5�-GAC TTC AATCCG GCG CTT TC; HOXC9for 5�-GCC TGC TGC CTC AGCACA G; HOXC9rev 5�-GAA CCC TCC CAA ATC GCA AG;MEIS1for 5�-ATG TGA CAA TTT CTG CCA CCG; Meis1rev5�-CCT GAA CGA GTA GAT GCC GTG; MEIS2for 5�-GATGAA AGA GAC GGC AGC TCC; Meis2rev 5�-GGG TTG AGGTTG CAT CAT CG; PBX1for 5�-CCC ATC TCA GCA ACC CTTACC; PBX1rev 5�-CCA TGG GCT GAC ACA TTG G; PBX2for5�-CGA ACA CTC GGA CTA TCG CAG; PBX2rev 5�-GCTCCC TCA GCA GGT TCA TG; PBX3for 5�-GAG CTG GCCAAG AAA TGC AG; PBX3rev 5�-GGG CGA ATT GGT CTGGTT G; PRHfor 5�-CTC CAA CGA CCA GAC CAT CG;PRHrev 5�-CCT GTC TCT CGC TGA GCT GC.
Cytogenetic and fluorescent in situ hybridizationanalyses
Chromosome analysis was performed at diagnosis using invitro blood and bone marrow cell cultures (24 and 48 h). R-banding techniques were employed and the karyotype wasassigned according to ISCN (1995).44 FISH studies using aMLL-specific DNA probe (Appligene Oncor, Ventana MedicalSystems, Tucson, AZ, USA) were performed in three caseswith 11q23 rearrangement. In every case, FISH revealed atranslocation of the MLL gene.
Results
Degenerate RT-PCR screening
We began our analysis of expressed HOX genes usingdegenerate RT-PCR amplifications in a subset of patientsamples and cell lines. This was done primarily to identifyHOX genes expressed at high levels relative to other HOXgenes and genes which appeared to vary substantially amongsamples in order to ensure that these loci were included insubsequent real-time quantitative assays. Low-stringencydegenerate RT-PCR amplifications, followed by subcloningand DNA sequence analysis, were successfully performedwith 10 patient samples and four cell lines. These results areshown in Table 1 for HOXA and HOXB loci as well as theproline-rich homeodomain gene, PRH. We found that mostpatient samples expressed high relative levels of HOXA9 andHOXA10, although some cases predominantly expressedHOXA5 (patient 17) or HOXB3 (patient 14). Conversely, noHOXA1 or HOXB1 clones were identified suggesting thatthese genes were underexpressed. The degenerate RT-PCRamplifications used primers corresponding to two blocks of

HOX expression in AMLHA Drabkin et al
188
Leukemia
Table 1 Degenerate RT-PCR: HOX loci as percent of total clones isolated
No. A1 A2 A3 A4 A5 A6 A7 A9 A10 B1 B3 B4 B5 B6 B7 B8 B9 PRH
Patient01 33 3 21 3 6 6 27 18 1508 28 11 7 14 7 11 43 709 34 3 3 6 3 15 24 15 3 24 3 310 38 8 5 34 13 37 313 24 4 8 4 29 5414 29 21 3 17 48 3 716 27 11 4 4 4 4 26 15 26 4 417 29 7 10 62 10 319 38 13 35 10 1 25 1320 28 3 29 35 10 19 3
Cell linesHEL 28 36 4 4 50LAMA84 44 11 7 2 77RS4;11 29 3 3 72 21MV4;11 31 81 10 3
Genomic 153 11 2 3 7 3 1 5 8 5 12 1 1 1 5 2 1 5 0DNA
Expressed HOX loci were amplified using degenerate primers and analyzed as described in Materials and methods. The total number ofclones analyzed from each patient sample or cell line is indicated. For each of the HOX loci, the numbers refer to the percent of totalclones derived from that locus. Spaces without numbers indicate that no corresponding clones were identified. Genomic DNA was usedas a control for the ability of the degenerate primers to amplify particular loci. Only the relevant control HOX loci are shown here; thecomplete set of clones has been previously described.18
highly conserved amino acids, ELEKEF and KIWFQN, withinthe homeodomain. Since this region in the clustered HOX lociis uninterrupted by an intron, amplification of genomic DNAcan be used as a control to assess amplification bias. We pre-viously found that over 30 loci could be amplified from gen-omic DNA using these primers and conditions.18 Values forselected loci are shown in Table 1. Thus, the over-represen-tation and under-representation of the HOX genes notedabove is not due to PCR amplification biases.Interestingly, each of the 10 patient samples that generated
sufficient degenerate RT-PCR products for subcloning andsequence analysis was associated with poor prognostic cytog-enetic features or was subsequently found to have high overalllevels of HOX gene expression (see below). Identical experi-ments using samples from AMLs having favorable cytogeneticsresulted in absent PCR products or weak products that had ahigh background of non-HOX loci after DNA sequencing (notshown). These included samples with the t(8;21) and t(15;17)translocations as well as the inversion 16. The same phenom-enon occurred in cell lines. For example, degenerate RT-PCRproducts were readily obtained from leukemic cell lines suchas HEL (erythroid/multipotent AML), LAMA84 (CML blast-crisis) and RS4;11 or MV4;11 (ALL/bi-phenotypic) and sub-clone isolates from these cell lines showed a predominanceof HOXA9 or HOXB9 (Table 1). In contrast, weak or nodegenerate RT-PCR products were obtained from the AML celllines Kasumi-1 and NB4 which contain the t(8;21) andt(15;17) translocations, respectively (not shown). These resultssuggested that genes from the HOXA group, particularlyHOXA3–HOXA10, as well as HOXB3, HOXB6 and, less fre-quently, HOXB9 are among the most abundantly expressedHOX genes in poor prognostic leukemias. These results alsoindicated that AMLs with favorable cytogenetic features areassociated with lower levels of overall HOX gene expression.
Quantitative real-time RT-PCR assays
Initially, we utilized samples from 17 AML patients for whichcomplete cytogenetic analyses were available (Table 2A, non-consecutive patient numbers 1–21). Subsequently, to verifyand expand our findings we analyzed an additional 17patients (non-consecutive numbers 23–39). The cytogeneticfeatures, age, initial WBC counts/blast percentages and out-come are shown in Table 2A along with the quantitative HOXresults (discussed below).Quantitative real-time RT-PCR assays were established for
19 homeodomain containing genes which included 13 clus-tered HOX loci, five PBX and MEIS family members andPRH/HEX, a proline-rich homeotic gene which correlatesinversely with differentiation in hematopoietic cells.22–24 Theraw data were obtained in terms of Ct values which refers tothe PCR cycle number during exponential amplification atwhich the product (measured in real-time by SYBR greenfluorescence) crosses an arbitrary threshold. To adjust for vari-ations in the amount of RNA, the Ct values for each gene werenormalized against the Ct values for the housekeeping gene,G3PDH (ie �Ct = Ctspecific gene − CtG3PDH). While the resulting�Ct values are experimentally convenient, they are not readilyintuitive (ie they reflect exponential amplification and higher�Cts represent lower expression). Instead, the results for a sub-set of the most informative HOX loci are shown in Table 2Ain terms of their relative expression compared to G3PDH, ieexpression = (1/2�Ct) × 1000. In this format, a value of 100 isequivalent to 10% of the G3PDH expression level. If morethan 34 PCR cycles were required to identify a product, thevalues are listed as ND (not detected). One technical noteis that the identification of late-appearing RT-PCR productsresulting from low-abundance transcripts is affected by theamount of input RNA/cDNA. Thus, some products listed as

HOX expression in AMLHA Drabkin et al
189
Table2A
Relativeexpression
ofselected
HOXloci(×1000)vs
G3PDH
Pt.
Ag
eFA
BW
BC
/bla
sts
Chr
omos
ome
feat
ure
Ct
A3
A4
A5
A7
A9
A10
B3
B6
B9
ME
IS1
ME
IS2
PB
X2
PB
X3
Out
com
eN
o.G
3PD
H
AM
L–
favo
rab
lecy
tog
enet
ics
0550
M3
40K
/95%
t(15
;17)
16.6
0.2
0.2
0.1
0.1
ND
0.02
0.3
ND
0.2
ND
0.01
70.
04C
R40
mo.
2119
M2
9K/7
5%t(
8;21
)17
.23
0.2
ND
0.00
4N
D0.
90.
90.
012
ND
632
0.02
CR
18m
o.18
70M
486
K/8
1%in
v(16
)17
.70.
050.
20.
10.
10.
66
30.
1N
D5
15
0.4
CR
18m
o.,
rela
pse
d
AM
L–
unfa
vora
ble
cyto
gen
etic
s01
62M
578
K/8
0%t(
4;11
)(q
21;q
23)[
30]
MLL
+20
.90.
910
0.6
0.7
26
40.
3N
D0.
7N
D0.
70.
5C
R6
mo.
,re
lap
sed
1915
M1
22K
/t(
10;1
9;11
)M
LL+
18.7
930
2520
1637
ND
0.03
ND
0.9
10.
6N
DC
R,
BM
T,C
Rat
2yr
.10
36M
083
K/5
0%in
v(1)
(p21
;q24
),−7
16.3
34
72
48
154
0.1
0.3
0.3
10.
1C
R,
BM
T,d
ied
12m
o.16
62M
148
K/9
2%i(7
)p10
19.1
418
122
724
217
ND
0.6
ND
20.
5C
R7
mo.
3262
M1
48K
/92%
46,X
X[5
]/46
,XX
,i(7)
(p10
)[31
]15
.232
1736
0.2
377
211
0.01
20.
0335
4d
ied
8m
o.24
75M
153
K/6
2%46
,XX
[23]
/45,
XX
,−7[
7]15
.20.
90.
60.
80.
0212
21
0.4
0.1
310.
125
7N
R36
65M
116
0K/9
0%46
,XX
[28]
/46,
XX
,del
(7)
15.8
3015
981
107
639
4094
301
1726
die
d1
mo.
(q21
q31
)[7]
2561
M2
18K
/82%
del
(5)(
q13
q33
),d
el(9
)15
.73
23
0.1
439
1617
0.1
270.
138
4N
R(q
13q
31)
0670
M4
23K
/55%
inv(
3)(p
22;q
26)
21.2
ND
2N
D0.
13
155
ND
0.4
ND
ND
ND
ND
NR
,d
ied
1560
M5
128
K/2
%co
mp
lex
kary
otyp
e17
.60.
020.
10.
030.
010.
010.
20.
2N
DN
D0.
012
1.0
0.1
CR
,B
MT,
CR
15m
o.31
62M
546
K/4
%co
mp
lex
kary
otyp
e14
.30.
12
0.2
0.00
10.
20.
10.
60.
010.
001
0.03
525
2C
R15
mo.
3778
M5
n.a.
com
ple
xka
ryot
ype
15.1
0.1
0.2
0.04
0.00
21
0.8
0.2
0.02
0.00
40.
124
181
DO
A
Leukemia

HOX expression in AMLHA Drabkin et al
190
Leukemia
Table2A
Continued
Pt.
Ag
eFA
BW
BC
/bla
sts
Chr
omos
ome
feat
ure
Ct
A3
A4
A5
A7
A9
A10
B3
B6
B9
ME
IS1
ME
IS2
PB
X2
PB
X3
Out
com
eN
o.G
3PD
H
AM
L–
othe
rch
rom
osom
alfe
atur
es:
HO
Xg
ene
over
exp
ress
ion
0720
M1
210K
/99%
del
(11)
(q24
)22
.318
913
418
012
448
102
290.
212
9N
D3
25C
R,
BM
T,d
ied
4m
o.08
40M
5a2K
/2%
t(9;
11)+
8M
LL+
18.6
5839
265
1930
ND
0.05
ND
340.
17
13C
R,
BM
T,d
ied
16m
o.09
60M
5b11
4K/6
9%46
,XX
17.3
176
73
540
1732
22
16
0.6
die
d,
1m
o.13
69M
413
1K/
46,X
Y16
.419
714
610
370.
20.
10.
10.
40.
035
2d
ied
,1
mo.
1477
M1
263K
/90%
46,X
X17
.531
5078
827
4311
740
128
450.
123
21no
ttr
eate
d17
74M
130
6K/9
8%46
,XX
17.2
6333
5520
1736
ND
0.01
ND
310.
517
9no
ttr
eate
d20
52M
416
0K/8
7%46
,XX
17.6
1435
254
1850
3320
0.1
10N
D2
4C
R24
mo.
2351
M5
72K
/6%
46,X
X15
.654
4477
180
932
4625
400.
0217
25C
R15
mo.
2654
M1
3K/3
3%an
alys
isfa
iled
15.6
6731
108
0.6
134
1631
1012
7698
2820
Cr
46m
o.28
69M
416
2/19
%46
,XY
[32]
15.2
8078
652
199
220.
20.
20.
221
0.2
2529
die
d1
mo.
2965
M4
47K
/45%
46,X
Y[3
2]15
.529
2238
0.4
537
7540
1459
340
36d
ied
5m
o.30
77M
126
3K/9
0%46
,XY
[32]
14.9
7493
201
111
313
167
7218
451
0.1
4747
DO
A33
35M
458
K/5
1%46
,XY
[26]
15.0
0.03
0.3
0.01
0.01
41
41
0.00
28
0.3
432
CR
25m
o.34
74M
130
6K/9
8%46
,XX
[35]
17.9
10.
90.
90.
022
0.3
10.
20.
026
0.04
424
pal
liativ
eR
x,d
ied
6m
o.35
72M
511
K/9
8%46
,XX
[15]
/46,
XX
,ad
d(7
)15
.80.
050.
10.
10.
0146
150.
020.
10.
0167
17
0.6
CR
4m
o.(p
22)[
17]
3872
M2
9K/1
0%46
,XY
[30]
15.6
3018
260.
763
313
3444
40.
320
17C
R7
mo.
3964
M1
94K
/98%
46,X
X[1
9]15
.670
4111
63
219
168
105
200
841
2644
CR
13m
o.H
OX
gen
eun
der
exp
ress
ion
0331
M2
126K
/46
,XY
[79]
18.3
0.7
0.3
0.1
0.3
ND
0.1
0.4
ND
0.4
0.1
0.8
200.
05C
R12
mo.
2773
M1
21K
/84%
46,X
X[2
9]/4
7,X
Y,+
8(1)
15.9
0.3
0.2
0.2
0.01
0.9
0.2
10.
30.
0444
0.2
682
CR
8m
o.
Del
taC
tva
lues
wer
eco
nver
ted
to‘re
lativ
eex
pre
ssio
n’as
des
crib
edin
the
text
.A
valu
eof
1000
iseq
ualt
oth
eex
pre
ssio
nof
G3P
DH
and
ava
lue
of10
0is
equi
vale
ntto
10%
ofth
eG
3PD
Hle
vel,
etc.
The
Ct
valu
esfo
rG
3PD
Har
esh
own
asan
ind
icat
ion
ofth
eam
ount
ofte
mp
late
(RN
A/c
DN
A)
used
.P
atie
ntch
arac
teris
tics
are
ind
icat
edin
clud
ing
age,
FAB
clas
sific
atio
n,W
BC
coun
tat
pre
sent
atio
nan
dth
ep
erce
ntof
bla
sts.
Onl
yth
em
ost
salie
ntka
ryot
ypic
feat
ures
are
show
n.N
D,
not
det
ecte
daf
ter
34cy
cles
;D
OA
,d
ied
onad
mis
sion
;C
R,
com
ple
tere
spon
se;
NR
,no
resp
onse
;B
MT,
bon
em
arro
wtr
ansp
lant
.

HOX expression in AMLHA Drabkin et al
191Table 2B Cut-off values based on ROC curves (see text)
A3 A4 A5 A7 A9 A10 B3 B6 B9 Meis1 Meis2 PBX2 PBX3
0.8 0.44 0.42 0.02 1.69 1.33 1.19 0.037 0.24 0.65 0.29 31.8 3
‘ND’ might have been detectable with the use of more tem-plate. Therefore, the Ct values for G3PDH reflecting templateinput are indicated in Table 2A. Other loci which were testedbut not shown include HOXA1, HOXB7, HOXC8, HOXC9and PBX1 which were either absent or expressed at low levelsin most samples. In contrast, PRH was abundantly expressed(not shown) but did not appear to correlate with outcome(not shown).We first compared the HOX expression patterns for patient
samples having favorable and unfavorable chromosomal alter-ations (Table 2A). There were three patients with favorablecytogenetics (patients 5, 18 and 21). These included the acutepromyelocytic leukemia t(15;17) translocation, as well as thet(8;21) and inv(16) rearrangements affecting the core bindingfactor alpha and beta components, respectively. Twelvepatients had poor prognostic cytogenetic features which con-sisted of MLL gene rearrangements excluding the t(9;11) trans-location, deletions of chromosome 5 or 7, rearrangementsinvolving 3q and complex karyotypes defined as four or moreabnormalities. As can be seen, patients with favorable cyto-genetics have considerably lower levels of HOX expressionthan do patients with unfavorable cytogenetic features basedon chromosomal deletions or rearrangements. This wasespecially evident for the HOXA loci, HOXA3–A10. However,several samples with unfavorable cytogenetics also had sub-stantially higher levels of HOXB3, HOXB6 and the TALE(three amino acid loop extension) family members, MEIS1,PBX2 and PBX3. In contrast, each of the three patients with acomplex karyotype had low HOX expression.There were 19 additional patients with either normal cyto-
genetics (n = 14) or alterations of unclear significance. Theseincluded additional 7p material (patient 35), trisomy 8 in asingle metaphase (patient 27), a deletion of 11q24 (patient 07)and one patient (No. 08) with a t(9;11) translocation whichhas been reported to convey a less adverse prognosis thanother MLL gene rearrangements.21 In addition, one patient(No. 26) had no cytogenetic results. Of these 19 patients, two(Nos 03 and 27) had low overall levels of HOX expression.Two other patients (Nos 33 and 34) had low overall HOXlevels except for HOXA9 and PBX2.In our initial studies, we observed that HOXB9 was overex-
pressed in three of five leukemic cell lines which also gener-ally overexpressed other HOX genes (eg HEL, LAMA84 andK562). However, far fewer patient samples had elevated levelsof HOXB9. Interestingly, the four highest levels of HOXB9were all obtained from samples having an AML-M1 FAB sub-type (patients 39, 30, 14 and 36) although, conversely, not allAML-M1 phenotypes had elevated HOXB9 expression. Thesesame cases also tended to have the highest levels ofexpression for several other of the HOXA and HOXB genesas well as for MEIS1 (Table 2A). Using the Wilcoxon sum-ranktest, we compared the quantitative HOX expression results inFAB subtype M1 vs non-M1 subtypes in all 34 patients.Indeed, statistically significant higher levels of expressionwere observed for HoxA3 (P = 0.0168), HoxA4 (P = 0.0391),HoxA5 (P = 0.0041), MEIS1 (P = 0.0105) and PBX3 (P =0.0376) in AML-M1. However, the correlation between
Leukemia
HOXB9 and the M1 phenotype was not statistically significantas several of the patients with AML-M1 lacked elevatedexpression. We also noted that several patient samples withnormal cytogenetics had higher levels of multiple HOX genesthan cases with poor prognostic cytogenetics. We have notexamined this in more detail but these findings were observedfrom two sets of samples (non-consecutive numbers 1–21 and23–39) prepared and studied at different times indicating thatthis is a reproducible observation.Finally, there was good correlation between the degenerate
RT-PCR data and the specific quantitative analyses. Forexample, the majority of degenerate RT-PCR products frompatient 1 were derived from HOXA4, A9, A10 and B3. Highexpression of these genes was confirmed by specific RT-PCRassays. Similarly, by degenerate RT-PCR, HOXB3 transcriptscomprised 48% of the total clones isolated from patient 14.By real-time quantitative RT-PCR, this same sample was foundto express HOXB3 at levels which were approximately 11.7%of G3PDH expression. Conversely, no HOXA1 subcloneswere identified by degenerate RT-PCR and the subsequentquantitative assays confirmed it was generally expressed atlow levels (not shown). Although specific PCR primers canaccurately assess the relative expression of individual HOXloci among samples, individual primer pairs may amplify theirtargets with different efficiencies making a direct comparisonbetween genes less precise. These degenerate RT-PCR ampli-fications provided a useful complementary approach and adegree of confirmation for the real-time assays.
Analysis of patient outcome
Our study utilized patient samples that had been cytogenet-ically characterized for the purpose of analyzing quantitativeHOX expression in different types of AML. While we wereable to obtain some degree of clinical follow-up, the numberof samples and the degree of follow-up were too limited foran optimal analysis of response and survival correlations. Ofthe 34 patient samples, 26 were evaluable for outcome and25 of these were available for initial response to therapy.Patients were excluded if they died within 1 month of admis-sion (patients 9, 13, 28, 30, 36, 37), were not treated (patients14, 17), or treated only with palliative intent (patient 34) asindicated in Table 2A. For each of the genes, we determinedcut-off values using ROC curves25,26 to optimize sensitivityand specificity. These cut-off values are indicated in Table 2B.With this data set and Fisher’s exact test, no statistically sig-
nificant differences were observed in the complete response(CR) rate for high vs low expression of HOXA9 or any of theother HOX genes. However, the overall CR rate was high inthis group of patients. While 7/7 patients with low HOXA9expression (�1.69, Table 2B) achieved a CR, so did 15/18patients with higher levels of expression. Next, we used theSpearman correlation coefficients to examine the relationshipbetween age and gene expression. None of the genes was sig-nificantly correlated with age. In addition, the Wilcoxon sum-rank test was applied to compare the gene expression values
HOX expression in AMLHA Drabkin et al
192
Leukemia
between patients below and above 60 years of age. No sig-nificant correlations were identified. Finally, we used the Coxregression model and log-rank test to look at event-free sur-vival with an event defined as either no response to inductionchemotherapy, relapse or death after 1 month. We found thatHOXA7 values less than 0.02 were significantly correlatedwith an improved event-free survival (P = 0.0474). Similarly,low expression of other HOX genes was marginally significantfor improved event-free survival, ie HoxA9 (P = 0.0795),HoxA4 (P = 0.0744) and HoxA5 (P = 0.0925) reflecting thelimited number of patients studied.
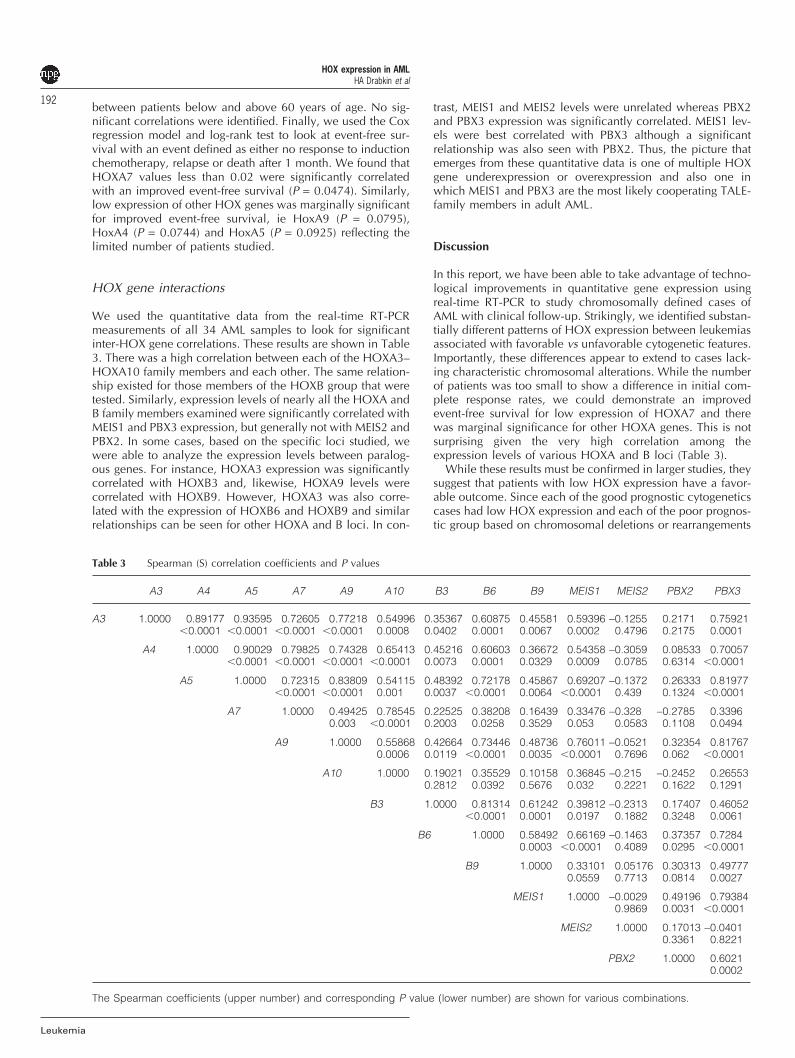
HOX gene interactions
We used the quantitative data from the real-time RT-PCRmeasurements of all 34 AML samples to look for significantinter-HOX gene correlations. These results are shown in Table3. There was a high correlation between each of the HOXA3–HOXA10 family members and each other. The same relation-ship existed for those members of the HOXB group that weretested. Similarly, expression levels of nearly all the HOXA andB family members examined were significantly correlated withMEIS1 and PBX3 expression, but generally not with MEIS2 andPBX2. In some cases, based on the specific loci studied, wewere able to analyze the expression levels between paralog-ous genes. For instance, HOXA3 expression was significantlycorrelated with HOXB3 and, likewise, HOXA9 levels werecorrelated with HOXB9. However, HOXA3 was also corre-lated with the expression of HOXB6 and HOXB9 and similarrelationships can be seen for other HOXA and B loci. In con-
Table 3 Spearman (S) correlation coefficients and P values
A3 A4 A5 A7 A9 A10 B3 B6 B9 MEIS1 MEIS2 PBX2 PBX3
A3 1.0000 0.89177 0.93595 0.72605 0.77218 0.54996 0.35367 0.60875 0.45581 0.59396 −0.1255 0.2171 0.75921�0.0001 �0.0001 �0.0001 �0.0001 0.0008 0.0402 0.0001 0.0067 0.0002 0.4796 0.2175 0.0001
A4 1.0000 0.90029 0.79825 0.74328 0.65413 0.45216 0.60603 0.36672 0.54358 −0.3059 0.08533 0.70057�0.0001 �0.0001 �0.0001 �0.0001 0.0073 0.0001 0.0329 0.0009 0.0785 0.6314 �0.0001
A5 1.0000 0.72315 0.83809 0.54115 0.48392 0.72178 0.45867 0.69207 −0.1372 0.26333 0.81977�0.0001 �0.0001 0.001 0.0037 �0.0001 0.0064 �0.0001 0.439 0.1324 �0.0001
A7 1.0000 0.49425 0.78545 0.22525 0.38208 0.16439 0.33476 −0.328 −0.2785 0.33960.003 �0.0001 0.2003 0.0258 0.3529 0.053 0.0583 0.1108 0.0494
A9 1.0000 0.55868 0.42664 0.73446 0.48736 0.76011 −0.0521 0.32354 0.817670.0006 0.0119 �0.0001 0.0035 �0.0001 0.7696 0.062 �0.0001
A10 1.0000 0.19021 0.35529 0.10158 0.36845 −0.215 −0.2452 0.265530.2812 0.0392 0.5676 0.032 0.2221 0.1622 0.1291
B3 1.0000 0.81314 0.61242 0.39812 −0.2313 0.17407 0.46052�0.0001 0.0001 0.0197 0.1882 0.3248 0.0061
B6 1.0000 0.58492 0.66169 −0.1463 0.37357 0.72840.0003 �0.0001 0.4089 0.0295 �0.0001
B9 1.0000 0.33101 0.05176 0.30313 0.497770.0559 0.7713 0.0814 0.0027
MEIS1 1.0000 −0.0029 0.49196 0.793840.9869 0.0031 �0.0001
MEIS2 1.0000 0.17013 −0.04010.3361 0.8221
PBX2 1.0000 0.60210.0002
The Spearman coefficients (upper number) and corresponding P value (lower number) are shown for various combinations.
trast, MEIS1 and MEIS2 levels were unrelated whereas PBX2and PBX3 expression was significantly correlated. MEIS1 lev-els were best correlated with PBX3 although a significantrelationship was also seen with PBX2. Thus, the picture thatemerges from these quantitative data is one of multiple HOXgene underexpression or overexpression and also one inwhich MEIS1 and PBX3 are the most likely cooperating TALE-family members in adult AML.
Discussion
In this report, we have been able to take advantage of techno-logical improvements in quantitative gene expression usingreal-time RT-PCR to study chromosomally defined cases ofAML with clinical follow-up. Strikingly, we identified substan-tially different patterns of HOX expression between leukemiasassociated with favorable vs unfavorable cytogenetic features.Importantly, these differences appear to extend to cases lack-ing characteristic chromosomal alterations. While the numberof patients was too small to show a difference in initial com-plete response rates, we could demonstrate an improvedevent-free survival for low expression of HOXA7 and therewas marginal significance for other HOXA genes. This is notsurprising given the very high correlation among theexpression levels of various HOXA and B loci (Table 3).While these results must be confirmed in larger studies, they
suggest that patients with low HOX expression have a favor-able outcome. Since each of the good prognostic cytogeneticscases had low HOX expression and each of the poor prognos-tic group based on chromosomal deletions or rearrangements

HOX expression in AMLHA Drabkin et al
193had high expression (Table 2), we anticipate that quantitativeHOX analysis may be most useful prognostically for patientswith normal karyotypes, complex karyotypes and otherrearrangements of intermediate or unclear significance. Whilespeculative, our initial results suggest that low HOXexpression may be similar to good prognostic cytogenetics. Incontrast, while patients with high HOX expression do less welloverall, there are clear exceptions (eg patients 20 and 26).Our results are consistent with the report of Golub et al17
using gene expression microarrays, who noted that HOXA9was the single best predictor of outcome in patients with AML.Our findings extend those observations and demonstrate thatmultiple genes of the HOXA and B class, especially HOXA3to HOXA10, are jointly overexpressed in poor prognosticAMLs along with certain TALE family members. Previously,Magli et al27 reported that blocks of HOX genes werecoordinately expressed in AML cell lines, which supports ourfindings in direct patient samples. We also found that over-expression of several HOX genes was significantly more fre-quent in the FAB-M1 subtype although our series lacked caseswith FAB-M6 and M7 subtypes.A more basic question concerns the mechanism of HOX
gene overexpression. Using normal CD34+ subsets anddegenerative RT-PCR, Sauvageau et al28 found that approxi-mately 90% of isolated subclones were from the HOXA clus-ter and most were derived from HOXA4 to HOXA9 tran-scripts. Kawagoe et al,29 as well as Lawrence et al,30 foundthat HOX expression was normally downregulated in bonemarrow cells as they progressed from CD34+ to CD34− andthat this downregulation was lost in AMLs. Therefore itappears, at least in part, that the spectrum of HOX geneexpression we observed in AML may not be qualitatively dif-ferent from corresponding normal cells. Rather the differencemight be either quantitative in nature or involve deregulationsuch that HOX expression is constitutive. For instance in themouse, constitutive expression of HOX genes includingHoxa7, a9, a10, b3 and b8 results in acute leukemia.11–14
Similarly, recurrent chromosomal translocations in humansinvolving HOXA9,7 PBX110 and the homeodomain containinggene, HOX11,8 result in deregulated expression and leukemia.Our results demonstrate that there are major differencesbetween good and poor prognostic AMLs in terms of quanti-tative HOX gene expression. These quantitative alterationsmay be extremely important. For example, Greer et al4 dem-onstrated that paralogous HOX genes can be functionallyequivalent and that it is the expression level of the paralogousgroup as a whole that is critical for correct development.One genetic mechanism associated with HOX gene over-
expression involves rearrangements of MLL. Each of ourpatient samples which included t(4;11), t(9;11) andt(10;19;11) translocations, as well as two ALL/biphenotypiccell lines with t(4;11) translocations, had HOX gene over-expression. Rozovskaia et al16 recently reported that HOXA9and MEIS1 were upregulated in ALL with the 4;11 translo-cation. In AML, Lawrence et al31 reported that both HOXA9and MEIS1 were frequently co-expressed, which our resultsconfirm. However, in our AML patient samples, only one ofthe three MLL rearrangements was associated with MEIS1overexpression, whereas most of the patients with normalcytogenetics or other chromosomal features had MEIS1 over-expression (Table 2). While MLL rearrangements have beendescribed in the absence of chromosomal rearrangements bystandard metaphase analysis,32 the reported frequency (11%)is far too low to account for our observations. Interestingly,we identified the same dichotomy of high and low HOX
Leukemia
expression in lung cancer18 where MLL rearrangements havenot been reported. Thus, it is possible that deregulation ofother components in a common pathway leads to similarHOX expression phenotypes in different malignant diseases.Most of the clustered HOX genes that have been directly
implicated by retroviral activation in murine leukemia (egHOXA7, A9, A10, B3 and B8) were identified as overex-pressed in our degenerate RT-PCR survey and subsequentlyconfirmed by real-time quantitative assays. An exception wasHOXB8 which we did not observe. The effects of constitut-ively expressing these genes in mouse hematopoietic cells areprofound. For example, HOXA9 infected bone marrow cellsdevelop a typical appearing AML with a high percentage ofimmature cells and blasts.33 HOXA9 also immortalizes andconfers a proliferative advantage to primary murine myeloidcells.34 Similarly, HOXA10 overexpression causes leukemia inmice12 and, in human cord blood CD34+ progenitors, leadsto increased myeloid proliferation and the appearance ofblasts.35 Expression of HOXB3 in mice results in a markedproliferation of myeloid cells with tissue infiltration andsplenomegaly, although the cells retain some capacity to dif-ferentiate.33 In addition to the above genes, we found thatHOXA4 and HOXA5 were overexpressed. A paralogous genein mouse, HOXB4, causes a 50-fold increase in transplantablemurine stem cells36 and overexpression of human HOXA5causes a shift in the differentiation of CD34+ cells fromerythroid to myeloid especially when more primitive CD34+
subsets were infected.37
Similar results have been obtained with deregulation ofTALE homeodomain genes which were initially found to beactivated in murine leukemias via retroviral integrations.38,39
We observed that MEIS1 and PBX3 were frequently overex-pressed, especially in conjunction with other HOX loci. PBXand HOX proteins form hetero-dimers which together recog-nize longer and more specific DNA target sequences,40 andat least part of the HOXA9 effects on myeloid cells require itsPbx interaction domain.34 Recently, PBX1 has been shown tobind transcriptional repressor elements (N-CoR) and co-pre-cipitate the SIN3a repressor complex.40 Thus, transcriptionalrepression by HOX-PBX heterodimers is likely to be animportant mechanism in human leukemogenesis. In thisregard, Ferrara et al41 demonstrated that 100% of AML blastsunderwent in vitro differentiation in response to combinedtreatment with retinoic acid and trichostatin A, an inhibitor ofhistone deacetylase proteins which are contained in repressorcomplexes. MEIS proteins regulate the nuclear accumulationof PBX and together form a trimeric complex with HOX pro-teins.42,43 Thus, mechanistically the overexpression of HOX,PBX and MEIS family members very likely leads to a greatereffects on HOX target genes.In conclusion, the quantitative analysis of HOX gene
expression has the potential to add new information to theclinical management of patients especially where character-istic chromosomal alterations are lacking. Moreover, it seemslikely that the overexpression of multiple HOX genes contrib-utes to the pathogenesis of poor prognostic AML. While thereare many remaining scientific questions to be answered, themechanism(s) of HOX overexpression and its molecularconsequences are particularly relevant.
Acknowledgements
We gratefully acknowledge the generous support from theLulu Frankel Foundation. DNA sequencing support was pro-

HOX expression in AMLHA Drabkin et al
194
Leukemia
vided by the University of Colorado Cancer Center DNASequencing Core. We also wish to acknowledge the generoussupport from L’Association pour la Recherche sur le Cancer(JR, AB, FB) and La Ligue Nationale Contre le Cancer, Comitede la Vienne et de Charente-Maritime (JR, AB, FB).
References
1 Scott MP, Tamkun JW, Hartzell GW III. The structure and functionof the homeodomain. Biochim Biophys Acta 1989; 989: 25–48.
2 Graham A, Papalopulu N, Krumlauf R. The murine and Drosophilahomeobox gene complexes have common features of organizationand expression. Cell 1989; 57: 367–378.
3 Flagiello D, Gibaud A, Dutrillaux B, Poupon MF, Malfoy B. Dis-tinct patterns of all-trans retinoic acid dependent expression ofHOXB and HOXC homeogenes in human embryonal and small-cell lung carcinoma cell lines. FEBS Lett 1997; 415: 263–267.
4 Greer JM, Puetz J, Thomas KR, Capecchi MR. Maintenance offunctional equivalence during paralogous Hox gene evolution.Nature 2000; 403: 661–665.
5 Raza-Egilmez SZ, Jani-Sait SN, Grossi M, Higgins MJ, Shows TB,Aplan PD. NUP98-HOXD13 gene fusion in therapy-related acutemyelogenous leukemia. Cancer Res 1998; 58: 4269–4273.
6 Nakamura T, Yamazaki Y, Hatano Y, Miura I. NUP98 is fused toPMX1 homeobox gene in human acute myelogenous leukemiawith chromosome translocation t(1;11)(q23;p15). Blood 1999; 94:741–747.
7 Borrow J, Shearman AM, Stanton VP Jr, Becher R, Collins T, Willi-ams AJ, Dube I, Katz F, Kwong YL, Morris C, Ohyashiki K, ToyamaK, Rowley J, Housman DE. The t(7;11)(p15;p15) translocation inacute myeloid leukaemia fuses the genes for nucleoporin NUP98and class I homeoprotein HOXA9. Nat Genet 1996; 12: 159–167.
8 Hatano M, Roberts CW, Minden M, Crist WM, Korsmeyer SJ.Deregulation of a homeobox gene, HOX11, by the t(10;14) in Tcell leukemia. Science 1991; 253: 79–82.
9 Nourse J, Mellentin JD, Galili N, Wilkinson J, Stanbridge E, SmithSD, Cleary ML. Chromosomal translocation t(1;19) results in syn-thesis of a homeobox fusion mRNA that codes for a potentialchimeric transcription factor. Cell 1990; 60: 535–545.
10 Kamps MP, Murre C, Sun XH, Baltimore D. A new homeoboxgene contributes the DNA binding domain of the t(1;19) translo-cation protein in pre-B ALL. Cell 1990; 60: 547–555.
11 Sauvageau G, Thorsteinsdottir U, Hough MR, Hugo P, LawrenceHJ, Largman C, Humphries RK. Overexpression of HOXB3 inhematopoietic cells causes defective lymphoid development andprogressive myeloproliferation. Immunity 1997; 6: 13–22.
12 Thorsteinsdottir U, Sauvageau G, Hough MR, Dragowska W,Lansdorp PM, Lawrence HJ, Largman C, Humphries RK. Over-expression of HOXA10 in murine hematopoietic cells perturbsboth myeloid and lymphoid differentiation and leads to acutemyeloid leukemia. Mol Cell Biol 1997; 17: 495–505.
13 Kroon, E, Krosl J, Thorsteinsdottir U, Baban S, Buchberg AM, Sau-vageau G. Hoxa9 transforms primary bone marrow cells throughspecific collaboration with Meis1a but not Pbx1b. EMBO J 1998;17: 3714–3725.
14 Perkins A, Kongsuwan K, Visvader J, Adams JM, Cory S.Homeobox gene expression plus autocrine growth factor pro-duction elicits myeloid leukemia. Proc Natl Acad Sci USA 1990;87: 8398–8402.
15 Joh T, Hosokawa Y, Suzuki R, Takahashi T, Seto M. Establishmentof an inducible expression system of chimeric MLL-LTG9 proteinand inhibition of Hox a7, Hox b7 and Hox c9 expression by MLL-LTG9 in 32Dcl3 cells. Oncogene 1999; 18: 1125–1130.
16 Rozovskaia T, Feinstein O, Foa R, Blechman J, Nakamura T, CroceCM, Cimino G, Canaani E. Upregulation of Meis1 and HoxA9 inacute lymphocytic leukemias with the t(4:11) abnormality. Onco-gene 2001; 20: 874–878.
17 Golub TR, Slonim DK, Tamayo P, Huard C, Gaasenbeek M, Mesi-rov JP, Coller H, Loh ML, Downing JR, Caligiuri MA, BloomfieldCD, Lander ES. Molecular classification of cancer: class discoveryand class prediction by gene expression monitoring. Science1999; 286: 531–537.
18 Calvo R, West J, Franklin W, Erickson P, Bemis L, Li E, Helfrich
B, Bunn P, Roche J, Brambilla E, Rosell R, Gemmill R M, DrabkinHA. Altered HOX and WNT7A expression in human lung cancer.Proc Natl Acad Sci USA 2000; 97: 12776–12781.
19 Wheatley K, Burnett AK, Goldstone AH, Gray RG, Hann IM,Harrison CJ, Rees JK, Stevens RF, Walker H. A simple, robust, vali-dated and highly predictive index for the determination of risk-directed therapy in acute myeloid leukaemia derived from theMRC AML 10 trial. United Kingdom Medical Research Council’sAdult and Childhood Leukaemia Working Parties. Br J Haematol1999; 107: 69–79.
20 Thirman MJ, Gill HJ, Burnett RC, Mbangkollo D, McCabe NR,Kobayashi H, Ziemin-van der Poel S, Kaneko Y, Morgan R, Sand-berg AA, Rowley JD. Rearrangement of the MLL gene in acutelymphoblastic and acute myeloid leukemias with 11q23 chromo-somal translocations. N Engl J Med 1993; 329: 909–914.
21 Baer MR, Stewart CC, Lawrence D, Arthur DC, Mrozek K, StroutMP, Davey FR, Schiffer CA, Bloomfield CD. Acute myeloid leuke-mia with 11q23 translocations: myelomonocytic immunopheno-type by multiparameter flow cytometry. Leukemia 1998; 12:317–325.
22 Bedford FK, Ashworth A, Enver T, Wiedemann LM. HEX: a novelhomeobox gene expressed during haematopoiesis and conservedbetween mouse and human. Nucleic Acids Res 1993; 21:1245–1249.
23 Jayaraman PS, Frampton J, Goodwin G. The homeodomain pro-tein PRH influences the differentiation of haematopoietic cells.Leuk Res 2000; 24: 1023–1031.
24 Manfioletti G, Gattei V, Buratti E, Rustighi A, De Iuliis A, AldinucciD, Goodwin GH, Pinto A. Differential expression of a novel pro-line-rich homeobox gene (Prh) in human hematolymphopoieticcells. Blood 1995; 85: 1237–1245.
25 Murphy JM, Berwick DM, Weinstein MC, Borus JF, Budman SH,Klerman GL. Performance of screening and diagnostic tests. Appli-cation of receiver operating characteristic analysis. Arch Gen Psy-chiatry 1987; 44: 550–555.
26 Hanley JA, McNeil BJ. A method of comparing the areas underreceiver operating characteristic curves derived from the samecases. Radiology 1983; 148: 839–843.
27 Magli MC, Barba P, Celetti A, De Vita G, Cillo C, Boncinelli E.Coordinate regulation of HOX genes in human hematopoieticcells. Proc Natl Acad Sci USA 1991; 88: 6348–6352.
28 Sauvageau G, Lansdorp PM, Eaves CJ, Hogge DE, Dragowska WH,Reid DS, Largman C, Lawrence HJ, Humphries RK. Differentialexpression of homeobox genes in functionally distinct CD34+ sub-populations of human bone marrow cells. Proc Natl Acad Sci USA1994; 91: 12223–12227.
29 Kawagoe H, Humphries RK, Blair A, Sutherland HJ, Hogge DE.Expression of HOX genes, HOX cofactors, and MLL in pheno-typically and functionally defined subpopulations of leukemic andnormal human hematopoietic cells. Leukemia 1999; 13: 687–698.
30 Lawrence HJ, Sauvageau G, Ahmadi N, Lopez AR, LeBeau MM,Link M, Humphries K, Largman C. Stage- and lineage-specificexpression of the HOXA10 homeobox gene in normal and leu-kemic hematopoietic cells. Exp Hematol 1995; 23: 1160–1166.
31 Lawrence HJ, Rozenfeld S, Cruz C, Matsukuma K, Kwong A,Komuves L, Buchberg AM, Largman C. Frequent co-expression ofthe HOXA9 and MEIS1 homeobox genes in human myeloid leuke-mias. Leukemia 1999; 13: 1993–1999.
32 Caligiuri MA, Strout MP, Lawrence D, Arthur DC, Baer MR, YuF, Knuutila S, Mrozek K, Oberkircher AR, Marcucci G, de la Chap-elle A, Elonen E, Block AW, Rao PN, Herzig GP, Powell BL, RuutuT, Schiffer CA, Bloomfield CD. Rearrangement of ALL1 (MLL) inacute myeloid leukemia with normal cytogenetics. Cancer Res1998; 58: 55–59.
33 Thorsteinsdottir U, Kroon E, Jerome L, Blasi F, Sauvageau G.Defining roles for HOX and MEIS1 genes in induction of acutemyeloid leukemia. Mol Cell Biol 2001; 21: 224–234.
34 Schnabel CA, Jacobs Y, Cleary ML. HoxA9-mediated immortaliz-ation of myeloid progenitors requires functional interactions withTALE cofactors Pbx and Meis. Oncogene 2000; 19: 608–616.
35 Buske C, Feuring-Buske M, Antonchuk J, Rosten P, Hogge DE,Eaves CJ, Humphries RK. Overexpression of HOXA10 perturbshuman lymphomyelopoiesis in vitro and in vivo. Blood 2001; 97:2286–2292.
36 Sauvageau G, Thorsteinsdottir U, Eaves CJ, Lawrence HJ, Largman

HOX expression in AMLHA Drabkin et al
195C, Lansdorp PM, Humphries RK. Overexpression of HOXB4 inhematopoietic cells causes the selective expansion of more primi-tive populations in vitro and in vivo. Genes Dev 1995; 9:1753–1765.
37 Crooks, GM, Fuller J, Petersen D, Izadi P, Malik P, Pattengale PK,Kohn DB, Gasson JC. Constitutive HOXA5 expression inhibitserythropoiesis and increases myelopoiesis from human hematopo-ietic progenitors. Blood 1999; 94: 519–528.
38 Nakamura T, Largaespada DA, Shaughnessy JD Jr, Jenkins NA,Copeland NG. Cooperative activation of Hoxa and Pbx1-relatedgenes in murine myeloid leukaemias. Nat Genet 1996; 12:149–153.
39 Moskow JJ, Bullrich F, Huebner K, Daar IO, Buchberg AM. Meis1,a PBX1-related homeobox gene involved in myeloid leukemia inBXH-2 mice. Mol Cell Biol 1995; 15: 5434–5443.
40 Saleh M, Rambaldi I, Yang XJ, Featherstone MS. Cell signalingswitches HOX-PBX complexes from repressors to activators of
Leukemia
transcription mediated by histone deacetylases and histone acetyl-transferases. Mol Cell Biol 2000; 20: 8623–8633.
41 Ferrara FF, Fazi F, Bianchini A, Padula F, Gelmetti V, Minucci S,Mancini M, Pelicci PG, Lo Coco F, Nervi C. Histone deacetylase-targeted treatment restores retinoic acid signaling and differen-tiation in acute myeloid leukemia. Cancer Res 2001; 61: 2–7.
42 Shen WF, Rozenfeld S, Kwong A, Kom ves LG, Lawrence HJ, Larg-man C. HOXA9 forms triple complexes with PBX2 and MEIS1 inmyeloid cells. Mol Cell Biol 1999; 19: 3051–3061.
43 Shanmugam K, Green NC, Rambaldi I, Saragovi HU, FeatherstoneMS. PBX and MEIS as non-DNA-binding partners in trimeric com-plexes with HOX proteins. Mol Cell Biol 1999; 19: 7577–7588.
Reference added in proof
44 Mitelman F (ed.). ISCN (1995): An International System for HumanCytogenetic Nomenclature. S Karger: Basel, 1995.
Copyright © 2022 FDOKUMEN