Antibody blockade of the Cripto CFC domain suppresses tumor cell growth in vivo
Upload
independentCategory
view
1download
0
www.elsevier.com/locate/ybcmd
Blood Cells, Molecules, and Diseases 32 (2004) 262–269
Interferon-alpha suppresses proliferation of chronic myelogenous
leukemia cells K562 by extending cell cycle S-phase without
inducing apoptosis
Dana Grebenova,a Katerina Kuzelova,a Ota Fuchs,a Petr Halada,b Vladimır Havlıcek,b
Iuri Marinov,a and Zbynek Hrkala,*
aDepartment of Cellular Biochemistry, Institute of Hematology and Blood Transfusion, 128 20, Prague-2, Czech Republicb Institute of Microbiology AS CR, Prague-2, Czech Republic
Submitted 17 September 2003; revised 23 October 2003
(Communicated by M. Lichtman, M.D., 30 October 2003)
Abstract
We examined the effects of interferon-alpha (IFN-a) treatment on the growth, cell cycle, proliferation, and apoptotic parameters as well as
adhesive properties and proteome of chronic myelogenous leukemia (CML)-derived K562 cells. IFN-a treatment (200 to 600 U/ml, 24 to
72 h) suppressed growth and caused accumulation of K562 cells in the S-phase of cell cycle (increase in S-phase cells by up to 52% in
comparison with the untreated controls) at the expenses of cells in G1-phase. No transition of cells to G0-phase occurred as followed from
Ki-67 protein determination. Although the level of chimeric gene product, BCR-ABL mRNA coding for BCR-ABL protein with anti-
apoptotic properties, decreased by 30%, apoptosis was not triggered as judged from Annexin-V, APO2.7, and TUNEL assays. Adhesion of
K562 cells to fibronectin-coated surfaces increased by up to 52% as determined by calcein assay. The proteomic analysis (2-D electrophoresis
in combination with mass spectrometry, MALDI-MS) revealed a single protein, ubiquitine cross-reactive protein (UBCR), whose level
markedly increased due to IFN-a treatment. The ubiquitination-like directed degradation processes may thus play a role in the mechanism of
IFN-a antiproliferative effects.
D 2003 Elsevier Inc. All rights reserved.
Keywords: K562; IFN-a; Cell cycle; Apoptosis; Adhesion; Proteomic analysis
Introduction with IFN-a therapy are its toxicity at the optimal therapeutic
IFN-a belongs to a family of proteins secreted by
eukaryotic cells following challenge by viruses and other
infectious agents [1]. In addition to the antiviral effects [2],
interferon-alpha (IFN-a) exerts pleiotropic cellular effects
including inhibition of cell proliferation [3], induction of
apoptosis [4,5], and modulation of the immune system [6].
IFN-a is able to induce a state of tumor dormancy and to
control the chronic phase of CML. IFN-a causes complete
genetic remission in 10% to 20% patients with chronic
phase CML [7], in some patients (approximately 7%) even
without further therapy [8]. The main problems encountered
1079-9796/$ - see front matter D 2003 Elsevier Inc. All rights reserved.
doi:10.1016/j.bcmd.2003.10.008
* Corresponding author. Department of Cellular Biochemistry, Institute
of Hematology and Blood Transfusion, U Nemocnice 1, 128 20 Prague-2,
Czech Republic. Fax: +420-224918390.
E-mail address: [email protected] (Z. Hrkal).
doses and low efficiency in blast phase of CML. Although
the therapeutic efficacy of IFN-a for the treatment of
chronic phase CML is well established, the mechanism by
which IFN-a exerts the direct antitumor action on CML
cells is an open question. It has been reported that IFN-a
binding to type I IFN receptor activates JAK/STAT pathway
leading to the formation of interferon-stimulated gene factor
3 (ISGF3) complex, which activates the interferon-stimulat-
ed responsive element (ISRE) sequences on the related
genes [9]. Induction of cell cycle inhibitors is the commonly
accepted mechanism of IFN-a antiproliferative effects [10].
Frequently IFN-a treatment leads to G1 or G0 arrest in IFN-
a responsive cells or induces apoptosis [5,10].
The chronic myelogenous leukemia (CML)-derived
K562 cells [11] bear an abnormal Ph chromosome charac-
terized by the abnormal fusion gene BCR-ABL of the b3a2
type [12]. This gene expresses mRNA, which is translated to

D. Grebenova et al. / Blood Cells, Molecul
the chimeric 210-kDa fusion protein BCR-ABL whose
constitutively elevated Abl kinase activity is responsible
for the known resistance of K562 cells to anticancer drug-
induced apoptosis [13]. In addition to abnormal gene BCR-
ABL, K562 cells also have mutated gene for the p53 protein
[14] whose proapoptotic or cell cycle regulatory function is
thus annulled. These combined mutations make of K562
cells a suitable model for the ‘in vitro’ studies of CML blast
phase treatment. In our recent paper, we deal with the
mechanism of cytotoxic effects imposed on K562 cells by
the photodynamic treatment showing that an early apoptotic
process, which is triggered by this procedure, does not
proceed to the terminal phase and is followed by the cell
necrosis [15]. In this communication, we report on the
growth inhibitory effect imposed on wild-type K562 cells
by IFN-a treatment and its mechanism.
Materials and methods
Chemicals
Human recombinant interferon-aA/D, propidium iodide,
RPMI-1640, mouse monoclonal antibodies to cyclin A, h-actin, and p21WAF1/Cip1, rabbit antibodies to cyclins D1 and
E, were purchased from Sigma (Prague, Czech Republic)
and rabbit antibody to retinoblastoma protein (pT821) was
purchased from BioSource Europe, S.A., Belgium. The
APO 2.7 kit was purchased from Coulter/Immunotech
A.S., Prague, Czech Republic; FITC-conjugated mouse
anti-human Ki-67 antibody set was purchased from BD
Biosciences; Annexin-V-FLUOS staining kit and In situ cell
death detection kit, fluorescein, were purchased from Roche
Applied Science (Mannheim, Germany); Vybrant (TM) cell
adhesion kit was purchased from Molecular Probes Europe,
BV (Leiden, The Netherlands); and FIX and PERM cell
permeabilization kit was purchased from An Der Grub,
Kaumberg, Austria.
Cell culture
K562 cells were purchased from the European Collection
of Animal Cell Cultures (Salisbury, UK) and cultured in
RPMI 1640 medium supplemented with 10% fetal calf
serum (FCS), 100 units/ml penicillin, 50 Ag/ml streptomy-
cin, and 2 mM L-glutamine at 37jC in 5% CO2 humidified
atmosphere. Cells were diluted to a density of 2 � 105 cells
per ml three times a week.
Cell viability
The effect of IFN-a treatment on the cell viability was
assessed by flow cytometry of propidium iodide (PI)-stained
cells using Coulter Epics XL flow cytometer as previously
described for photodynamic therapy experiments [16] and
by visual cell counting (trypan blue exclusion test).
3H-Thymidine proliferation assay
Four sample replicates of IFN-a-treated cells as well as of
the appropriate controls (without IFN-a) were pulsed with
24 kBq (6-3H)-thymidine (Institute for Research, Develop-
ment and Application of Radioisotopes, Prague, Czech
Republic, specific activity 980 Gbq/mmol) for 4 h and the
cells were collected using Scatron cell harvester. The incor-
porated radioactivity into the newly synthesized DNA was
measured with the beta scintillation counter. The mean
values of the quadruplicates expressed in counts per minute
were calculated, and the suppression of DNA synthesis
caused by IFN-a was given as the percentage of control
values [17].
Cell cycle analysis
The cells (1 � 106) were collected by centrifugation,
suspended in 70% ethanol, and incubated for 30 min at room
temperature in 1 ml of the modified Vindelovs propidium
iodide buffer (10 mM Tris, pH 8, 1 mM NaCl, 0.1% Triton
X-100, 20 Ag/ml PI, and 10 Kunitz units of ribonuclease A).
The red fluorescence excited at 488 nm was then measured
using Coulter Epics XL flow cytometer. The histograms
were analyzed using the G1/G2M Only Fit method.
Detection of cell cycle antigen Ki-67
Ki-67 protein expression was analyzed using the direct
immunofluorescence method. After the treatment with IFN-
a for defined periods (0 to 72 h), 1 � 106 cells were
harvested and stained following the protocol for Intracellu-
lar Staining With FIX and PERM (BIOZOL Diagnostica
Vertrieb GmbH, Eching, Germany) using FITC-conjugated
anti-Ki-67 antibody. The fraction of Ki-67 antigen express-
ing cells was determined by flow cytometry.
Exposition of mitochondrial membrane antigen 7A6
Expression of mitochondrial membrane neoantigen 7A6
appearing in apoptotic cells was measured in IFN-a-treated
cells as well in appropriate controls by flow cytometry
employing antibody APO 2.7 [18].
Assessment of apoptosis by TUNEL assay
The TUNEL assay was performed employing the In situ
cell death detection kit, fluorescein (Roche Applied Sci-
ence), following the standard manufacturer’s protocol. The
extent of DNA labeling with fluorescein-dUTP was deter-
mined by flow cytometry.
Annexin-V apoptosis assay
The analysis of phosphatidylserine exposition on the
outer side of plasma membrane of IFN-a-treated cells as
es, and Diseases 32 (2004) 262–269 263
D. Grebenova et al. / Blood Cells, Molecules, and Diseases 32 (2004) 262–269264
well as of controls was performed using Annexin-V-FLUOS
staining kit (Roche Applied Science), employing flow
cytometry. The kit consists of Annexin-V-fluorescein and
propidium iodide for the differentiation of apoptotic and
necrotic cells. The recommended manufacturer’s protocol
was obeyed.
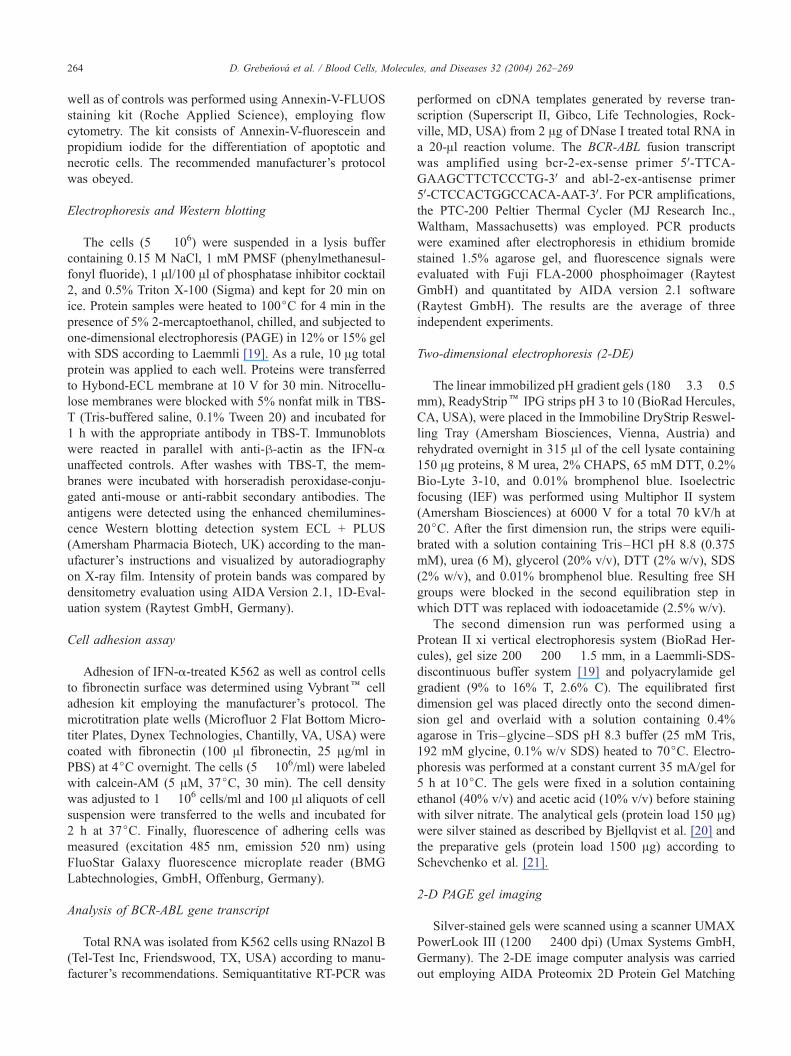
Electrophoresis and Western blotting
The cells (5 � 106) were suspended in a lysis buffer
containing 0.15 M NaCl, 1 mM PMSF (phenylmethanesul-
fonyl fluoride), 1 Al/100 Al of phosphatase inhibitor cocktail2, and 0.5% Triton X-100 (Sigma) and kept for 20 min on
ice. Protein samples were heated to 100jC for 4 min in the
presence of 5% 2-mercaptoethanol, chilled, and subjected to
one-dimensional electrophoresis (PAGE) in 12% or 15% gel
with SDS according to Laemmli [19]. As a rule, 10 Ag total
protein was applied to each well. Proteins were transferred
to Hybond-ECL membrane at 10 V for 30 min. Nitrocellu-
lose membranes were blocked with 5% nonfat milk in TBS-
T (Tris-buffered saline, 0.1% Tween 20) and incubated for
1 h with the appropriate antibody in TBS-T. Immunoblots
were reacted in parallel with anti-h-actin as the IFN-a
unaffected controls. After washes with TBS-T, the mem-
branes were incubated with horseradish peroxidase-conju-
gated anti-mouse or anti-rabbit secondary antibodies. The
antigens were detected using the enhanced chemilumines-
cence Western blotting detection system ECL + PLUS
(Amersham Pharmacia Biotech, UK) according to the man-
ufacturer’s instructions and visualized by autoradiography
on X-ray film. Intensity of protein bands was compared by
densitometry evaluation using AIDAVersion 2.1, 1D-Eval-
uation system (Raytest GmbH, Germany).
Cell adhesion assay
Adhesion of IFN-a-treated K562 as well as control cells
to fibronectin surface was determined using Vybrantk cell
adhesion kit employing the manufacturer’s protocol. The
microtitration plate wells (Microfluor 2 Flat Bottom Micro-
titer Plates, Dynex Technologies, Chantilly, VA, USA) were
coated with fibronectin (100 Al fibronectin, 25 Ag/ml in
PBS) at 4jC overnight. The cells (5 � 106/ml) were labeled
with calcein-AM (5 AM, 37jC, 30 min). The cell density
was adjusted to 1 � 106 cells/ml and 100 Al aliquots of cellsuspension were transferred to the wells and incubated for
2 h at 37jC. Finally, fluorescence of adhering cells was
measured (excitation 485 nm, emission 520 nm) using
FluoStar Galaxy fluorescence microplate reader (BMG
Labtechnologies, GmbH, Offenburg, Germany).
Analysis of BCR-ABL gene transcript
Total RNAwas isolated from K562 cells using RNazol B
(Tel-Test Inc, Friendswood, TX, USA) according to manu-
facturer’s recommendations. Semiquantitative RT-PCR was
performed on cDNA templates generated by reverse tran-
scription (Superscript II, Gibco, Life Technologies, Rock-
ville, MD, USA) from 2 Ag of DNase I treated total RNA in
a 20-Al reaction volume. The BCR-ABL fusion transcript
was amplified using bcr-2-ex-sense primer 5V-TTCA-GAAGCTTCTCCCTG-3V and abl-2-ex-antisense primer
5V-CTCCACTGGCCACA-AAT-3V. For PCR amplifications,
the PTC-200 Peltier Thermal Cycler (MJ Research Inc.,
Waltham, Massachusetts) was employed. PCR products
were examined after electrophoresis in ethidium bromide
stained 1.5% agarose gel, and fluorescence signals were
evaluated with Fuji FLA-2000 phosphoimager (Raytest
GmbH) and quantitated by AIDA version 2.1 software
(Raytest GmbH). The results are the average of three
independent experiments.
Two-dimensional electrophoresis (2-DE)
The linear immobilized pH gradient gels (180� 3.3� 0.5
mm), ReadyStripk IPG strips pH 3 to 10 (BioRad Hercules,
CA, USA), were placed in the Immobiline DryStrip Reswel-
ling Tray (Amersham Biosciences, Vienna, Austria) and
rehydrated overnight in 315 Al of the cell lysate containing
150 Ag proteins, 8 M urea, 2% CHAPS, 65 mM DTT, 0.2%
Bio-Lyte 3-10, and 0.01% bromphenol blue. Isoelectric
focusing (IEF) was performed using Multiphor II system
(Amersham Biosciences) at 6000 V for a total 70 kV/h at
20jC. After the first dimension run, the strips were equili-
brated with a solution containing Tris–HCl pH 8.8 (0.375
mM), urea (6 M), glycerol (20% v/v), DTT (2% w/v), SDS
(2% w/v), and 0.01% bromphenol blue. Resulting free SH
groups were blocked in the second equilibration step in
which DTT was replaced with iodoacetamide (2.5% w/v).
The second dimension run was performed using a
Protean II xi vertical electrophoresis system (BioRad Her-
cules), gel size 200 � 200 � 1.5 mm, in a Laemmli-SDS-
discontinuous buffer system [19] and polyacrylamide gel
gradient (9% to 16% T, 2.6% C). The equilibrated first
dimension gel was placed directly onto the second dimen-
sion gel and overlaid with a solution containing 0.4%
agarose in Tris–glycine–SDS pH 8.3 buffer (25 mM Tris,
192 mM glycine, 0.1% w/v SDS) heated to 70jC. Electro-phoresis was performed at a constant current 35 mA/gel for
5 h at 10jC. The gels were fixed in a solution containing
ethanol (40% v/v) and acetic acid (10% v/v) before staining
with silver nitrate. The analytical gels (protein load 150 Ag)were silver stained as described by Bjellqvist et al. [20] and
the preparative gels (protein load 1500 Ag) according to
Schevchenko et al. [21].
2-D PAGE gel imaging
Silver-stained gels were scanned using a scanner UMAX
PowerLook III (1200 � 2400 dpi) (Umax Systems GmbH,
Germany). The 2-DE image computer analysis was carried
out employing AIDA Proteomix 2D Protein Gel Matching

Fig. 1. Effect of IFN-a on the growth of K562 cells. The cells were cultured
in the absence and presence of 200 to 800 U/ml IFN-a for 72 h and
regularly counted.
D. Grebenova et al. / Blood Cells, Molecules, and Diseases 32 (2004) 262–269 265
Version 6.00 software (Raytest GmbH). Individual gels of
IFN-a-treated cells were compared with the gels of untreat-
ed cells and vice versa. The differences in spot volumes
greater than 50% (integrated optical density over spot area)
were considered significant. The findings are based on the
evaluation of at least ten 2-D PAGE experiments. The
isoelectric points and molecular weights of individual pro-
teins were approximated using polypeptide 2-D SDS PAGE
Standards (BioRad, Richmond, USA).
MALDI mass spectrometry and protein identification
Silver-stained protein spots were excised from the gel
and the gel pieces reconstituted in a cleavage buffer con-
taining 2-sulfanylethan-1-ol, 50 mM 4-ethylmorpholine
Fig. 2. Effect of IFN-a on the proliferation of K562 cells assayed by 3H-thymidine
to 72 h, and the cell aliquots in quadruplicates were incubated with 3H-thymidine
measured in counts/min. The data are normalized to the untreated controls (100%
acetate, 1 mM CaCl2, 10% acetonitrile (MeCN), and se-
quencing grade trypsin (50 ng/Al; Promega, Madison, WI,
USA). The digestion was carried out overnight and resulting
peptides were extracted with 30% MeCN/0.5% trifluoro-
acetic acid [22]. One microliter aliquot of each peptide
mixture was deposited on the target, and 1 Al of a matrix
solution (saturated a-cyano-4-hydroxycinnamic acid in 30%
MeCN/0.2% trifluoroacetic acid) was added. Positive ion
mass spectra were measured on an MALDI reflectron time-
of-flight mass spectrometer BIFLEX (Bruker-Franzen, Bre-
men, Germany) equipped with a nitrogen laser (337 nm) and
gridless delayed extraction ion source. Protein spots were
identified by searches of peptide mass maps in a nonredun-
dant database NCBI using the search program ProFound
(http://prowl.rockefeller.edu/cgi-bin/ProFound) [22].
Results
We examined the effects of IFN-a treatment on the
growth of wild-type K562 cells. In Fig. 1, the time depen-
dence of cell density is shown for several IFN-a doses. It
follows that doses of 200 U/ml and higher suppressed
progressively the cell growth. The decrease in cell growth
was not due to the IFN-a cytotoxicity since fractions of
propidium iodide-positive cells (around 5%) as well as
number of Trypan blue-positive cells (3% to 4%) found in
untreated controls did not increase during 48 h incubation
with IFN-a at concentrations 200 to 800 U/ml.
To examine the effect of IFN-a on the proliferation of
K562 cells, we used 3H-thymidine incorporation into the
cell DNA. The extent of 3H-thymidine incorporation was
reduced by 40% to 50% following 48 h and by approxi-
incorporation. The cells were incubated with 200 to 800 U/ml IFN-a for up
for 4 h. The cells were harvested and the 3H-thymidine radioactivity was
).

D. Grebenova et al. / Blood Cells, Molecules, and Diseases 32 (2004) 262–269266
mately 75% following 72 h incubation with 200 to 800 U/ml
IFN-a in comparison with the untreated controls (Fig. 2).
As apoptosis is considered a possible mechanism by
which IFN-a executes its anticancer effects, we determined
several apoptotic parameters of K562 cells during their
treatment with IFN-a. The amount of TUNEL-positive cells
Fig. 3. DNA content analysis of the controls (panels 1 to 4) and IFN-a-treated K5
up to 72 h, and in time intervals the flow cytometry histograms were obtained
RNAse). The control cells were treated equally with the exception of IFN-a add
(see enclosures).
was approximately 1% in the control and their number did
not increase during 72 h cultivation in the presence of 200
and 400 U/ml IFN-a. Similarly, the subG1 peak was not
observed on cell cycle histograms (see Fig. 3). Further,
almost no AnnexinV-positive cells have been detected by
flow cytometry (fractions of AnnexinV-positive cells were
62 cells (panels 5 to 7). The cells were incubated with 200 U/ml IFN-a for
of permeabilized cells stained with propidium iodide solution (containing
ition. The cell cycle analysis was performed by G1/G2M Only Fit method

Fig. 5. Effect of IFN-a on the adhesive properties of K562 cells. The cells
were treated with IFN-a (200 and 400 U/ml) for 72 h. In time intervals, the
relative numbers of cells adhering to microtitration plate wells previously
coated with fibronectin were determined by fluorescence measurement of
calcein-AM-stained cells (Vybrant cell adhesion assay). The data were
normalized to the adherent fractions of untreated K562 cells (100%).
D. Grebenova et al. / Blood Cells, Molecules, and Diseases 32 (2004) 262–269 267
about 1%), and the fraction of APO2.7-positive cells (cells
exhibiting the mitochondrial apoptosis-related antigen 7A6)
was only 3% to 5% in both cases after 48 h incubation with
200 to 800 U/ml IFN-a. We conclude that apoptosis is not a
mechanism responsible for the suppressed growth of wild-
type K562 cells caused by IFN-a treatment.
Another possible mechanism by which cell growth can
be limited is the transition of cells from G1 to G0 phase. We
therefore determined the fraction of cells in the overall
active phases of cell cycle (G1, S, G2, and M) by flow
cytometry using the antibody against the proliferation-relat-
ed protein Ki-67 (MKI-67 protein). It followed that the
active phases of cell cycle were not affected by IFN-a
treatment as the fraction of Ki-67-positive cells represented
91% and 96% both in the control and IFN-a-treated cells
(200 U/ml, 48 and 72 h). Thus, no transition of cells from
G1 to G0 phase occurred. Subsequently, we examined the
effect of IFN-a treatment on the cell cycle distribution of
K562 cells. In Fig. 3, a series of flow cytometry histograms
are presented showing changes in DNA distribution during
K562 treatment with 200 U/ml IFN-a. Analysis of DNA
distribution by G1/G0-G2/M Only Fit method showed
pronounced changes that occurred during IFN-a treatment.
The fractions of cells in G1 as well as G2/M phase
decreased while the fraction in S phase increased (see
enclosures). Since we assumed that suppressed proliferation
of K562 cells may be due to the perturbation of certain cell
cycle regulatory proteins, we determined by Western blot-
ting the effects of IFN-a treatment on the expression of
cyclins D1, E, and A, the cell cycle inhibitor, protein p21,
and on the phosphorylation state of Rb protein (Fig. 4). We
found no increased expression of cyclins D1 and E and the
cell cycle inhibitor p21. On the other hand, an increase by
30% in the level of cyclin A as well as in the phosphory-
lation state of Rb protein has been observed.
Fig. 4. Effect of IFN-a on the expression of cell cycle proteins and inhibitors dete
72 h, they were lysed, subjected to SDS electrophoresis, and blotted to nitrocellu
developed with peroxidase-conjugated secondary antibody, and detected by ECL
The clinically relevant question, whether IFN-a can
affect expression of BCR-ABL gene in blast phase CML
cells, has been addressed by determining BCR-ABL mRNA
level following bcr-abl gene amplification by PCR. The
amounts of BCR-ABL mRNA decreased by 30.4% F 4.4%
following K562 cells IFN-a treatment (200 U/ml, 48 h). We
further investigated the effect of IFN-a treatment on the
adhesive properties of K562 cells. The fraction of cells
adhering to fibronectin surface increased by up to 53% due
to IFN-a treatment in dependence of IFN-a concentration
and incubation time (Fig. 5). Finally we attempted by 2-D
electrophoresis to uncover proteins that were differentially
expressed in K562 cells due to the IFN-a treatment. Fig. 6
shows the section of 2-D electrophoretic polypeptide map of
rmined by Western blotting. The cells were incubated with IFN-a for up to
lose membrane. The blots were incubated with specific primary antibodies,
.

Fig. 6. Proteomic analysis of IFN-a-treated K562 cells. Two-dimensional
electrophoresis (a section) of the lysate of K562 cells untreated (panel A)
and treated with IFN-a (panel B; 200 U/ml, 48 h) stained with silver. The
protein spot newly appearing on the electrophoreogram of IFN-a-treated
cells is depicted by an arrow.
D. Grebenova et al. / Blood Cells, Molecules, and Diseases 32 (2004) 262–269268
K562 cells that reveals a newly appearing protein spot after
treatment with 200 U/ml IFN-a for 48 h. This protein was
identified by mass spectrometry (MALDI-MS) as the ubiq-
uitine cross-reactive protein (UCRP).
Discussion
We employed the K562 cell line as the model of CML
blast phase, as this cell line not only bears the Philadelphia
chromosome and expresses BCR-ABL gene, but it also
possesses an additional mutation in gene p53 resulting in
the expression of nonfunctional protein p53. This protein
normally functions as the anti-oncogenic compound induc-
ing G1/S cell cycle arrest following DNA damage. IFN-a
treatment suppressed growth of K562 cells; however, nei-
ther apoptosis was triggered nor necrosis occurred. In the
recent paper dealing with IFN-a pro-apoptotic effects on
K562 cells [23], the authors have shown pronounced
apoptosis in these cells due to IFN-a treatment and even
in the untreated controls. In contrast to these results, we did
not find any increase of apoptosis above the (low) level
found in untreated controls. The explanation we offer is that
cell lines behavior is much dependent on the particular
strand employed; our cells obtained from European Collec-
tion of Animal Cell Cultures, UK, are probably closer to the
original type established by Lozzio and Lozzio [11].
Possible transition of cells from G1 to G0 phase has been
excluded by the measurements of proliferation-related pro-
tein Ki-67, which is present in all active phases of the cell
cycle. The fraction of cells expressing this protein
approached completion and was not affected by IFN-a
treatment, suggesting that no transition of cells to G0 phase
occurred. The suppressive effect must therefore rely in a
perturbation of the cell cycle. The decrease in the G1 phase
as well as G2/M phase cells due to IFN-a treatment was
compensated by an increase of S-phase cells. Since the cell
density as well as overall DNA replication rate decreased,
the possible explanation is that the cells were either arrested
in S-phase or the DNA replication was slowed down. We
tried to uncover the molecular mechanism, which is behind
the antiproliferative effects of IFN-a. However, neither
cyclins D1 and E, which drive cells through G1/S phase
restriction point, nor the cell cycle inhibitor protein p21
were up-regulated. Thus, the IFN-a antiproliferative mech-
anism does not involve the G1 phase of the cell cycle. To the
contrary, an increase of S-phase cells supports the idea on
slowing down the DNA replication leading to accumulation
of cells in S-phase. In accordance with this theory, we
observed an increased level of cyclin A and increased
phosphorylation of retinoblastoma protein due to IFN-a
treatment. The decrease of G2/M phase cells (Fig. 3)
resulting from the delay of cells in S phase leads to the
lower number of replicating cells and therefore to the
suppressed proliferation.
Cell adhesion to extracellular matrix is mediated by the
transmembrane proteins, the integrins. Following interaction
with extracellular ligands h1-integrin associates with severalcytoskeletal proteins including a-actinin, talin, vinculin, and
tensin to form multimolecular ‘focal adhesions’ complex.
Abnormal circulation and unregulated proliferation of CML
progenitors is related, at least in part, to BCR-ABL protein-
induced abnormalities in h1 integrin-mediated adhesion and
signaling [24]. CML progenitors were shown to adhere
significantly less to a4h1 and a5h1 binding regions of
fibronectin, indicating that h1 integrin receptor function is
abnormal in CML. The BCR-ABL protein exhibits en-
hanced binding to F-actin, which may alter the integrin–
cytoskeletal interactions [25]. The decreased level of BCR-
ABL kinase in K562 cells due to IFN-a treatment leads
presumably to partial restoration of h1 integrin–cytoskeletalinteractions, which contribute to their increased adhesion to
fibronectin surfaces.
Employing two-dimensional electrophoresis, we revealed
the single distinct protein spot in K562 cell lysate, which
was markedly enhanced on IFN-a treatment. Using mass
spectrometry (MALDI-MS), this protein was identified as
the ubiquitine cross-reacting protein (UCRP/ISG15). Induc-

D. Grebenova et al. / Blood Cells, Molecules, and Diseases 32 (2004) 262–269 269
tion of this 17 kDa ubiquitine-like protein and its subsequent
conjugation to the cellular targets is the earliest response of
cells to the type I interferons [26]. Proteins conjugated to
UCRP are either modulated or targeted for processing
through the proteasome [27]. It was reported that conjugates
of UCRP distribute in a cytoskeletal pattern in both unin-
duced and interferon-treated A549 lung carcinoma cells,
while significant increase in the sequestration of UCRP
conjugates on intermediate filaments accompanied interfer-
on induction [28]. It can be speculated that increased
expression of UCRP in K562 cells following IFN-a treat-
ment may be related to IFN-a antiproliferative activity
mediated by a specific degradation of intermediate filaments
protein compounds.
Acknowledgments
The authors wish to thank Mrs. J. Sedlmaierova for the
expert technical assistance. The work was supported by
grants of the Grant Agency of the Czech Republic No 303/
01/1445 and Internal Grant Agency of the Ministry of
Health, Czech Republic No NL-7681-3.
References
[1] D. Grander, O. Sangfelt, S. Erickson, How does interferon exert its
cell growth inhibitory effect? Eur. J. Haematol. 59 (1997) 129–135.
[2] C.E. Samuel, Antiviral actions of interferons, Clin. Microbiol. Rev. 14
(2001) 778–809.
[3] O. Sangfelt, S. Erickson, D. Grander, Mechanisms of interferon-in-
duced cell cycle arrest, Front. Biosci. 5 (2000) 479–487.
[4] L. Thyrell, S. Erickson, B. Zhivotovsky, K. Pokrovskaja, O. Sangfelt,
J. Castro, S. Einhorn, D. Grander, Mechanisms of interferon-alpha
induced apoptosis inmalignant cells, Oncogene 21 (2002) 1251–1262.
[5] O. Sangfelt, H. Strander, Apoptosis and cell growth inhibition as anti-
tumor effector functions of interferons, Med. Oncol. 18 (2001) 3–14.
[6] S. Erickson, O. Sangfelt, J. Castro, M. Heyman, S. Einhorn, D.
Grander, Interferon-a inhibits proliferation of human T lymphocytes
by abrogation of interleukin 2-induced changes in cell cycle-regula-
tory proteins, Cell Growth Differ. 10 (1999) 575–582.
[7] B.N. Jahagirdar, J.S. Miller, A. Shet, C.M. Vertaillie, Novel thera-
pies for chronic myelogenous leukemia, Exp. Hematol. 29 (2001)
543–556.
[8] M. Talpaz, Interferon-alpha-based treatment of chronic myeloid leu-
kemia and implications of signal transduction inhibition, Semin.
Hematol. 38 (Suppl. 18) (2001) 22–27.
[9] L.C. Platanias, E.N. Fish, Signaling pathways activated by interfer-
ons, Exp. Hematol. 27 (1999) 1583–1592.
[10] O. Sangfelt, S. Erickson, J. Castro, T. Heiden, A. Gustafsson, S.
Einhorn, D. Grander, Molecular mechanisms underlying interferon-
alpha-induced G0/G1 arrest: CKI-mediated regulation of G1 Cdk-
complexes and activation of pocket proteins, Oncogene 18 (1999)
2798–2810.
[11] C.B. Lozzio, B.B. Lozzio, Human chronic myelogenous leukemia
cell line with positive Philadelphia chromosome, Blood 45 (1975)
321–334.
[12] H.G. Drexler, The leukemia-lymphoma cell line, FactsBook, Aca-
demic Press, London, 2001, pp. 632–633.
[13] A. McGahon, R. Bissonnette, M. Schmitt, K.M. Cotter, D.R. Green,
T.G. Cotter, BCR-ABL maintains resistance of chronic myelogenous
leukemia cells to apoptotic cell death, Blood 83 (1994) 1179–1187.
[14] J.C. Law, M.K. Ritke, J.C. Yalowich, G.H. Leder, R.E. Ferrell, Muta-
tional inactivation of the p53 gene in the human erythroid leukemia
K562 cell line, Leuk. Res. 17 (1993) 1045–1050.
[15] K. Kuzelova, D. Grebenova, M. Pluskalova, I. Marinov, Z. Hrkal,
Early apoptotic features of K562 cell death induced by 5-aminolae-
vulinic acid-based photodynamic therapy, J. Photochem. Photobiol.,
B Biol. (in press).
[16] D. Grebenova, H. Cajthamlova, J. Bartosova, J. Marinov, H. Klamova,
O. Fuchs, Z. Hrkal, Selective destruction of leukaemic cells by
photo-activation of 5-aminolaevulinic acid-induced protoporphyrin
IX, J. Photochem. Photobiol., B Biol. 47 (1998) 74–81.
[17] J. Soucek, P. Pouckova, J. Matousek, P. Stockbauer, J. Dostal, M.
Zadinova, Antitumor action of bovine seminal ribonuclease, Neoplas-
ma 43 (1996) 335–340.
[18] Z. Zhang, Z. Ao, A. Seth, S.F. Schlossman, A mitochondrial mem-
brane protein defined by a novel monoclonal antibody is preferen-
tially detected in apoptotic cells, J. Immunol. 157 (1996) 3980–3987.
[19] U.K. Laemmli, Cleavage of structural proteins during the assembly of
the head of bacteriophage T4, Nature 227 (1970) 680–685.
[20] B. Bjellqvist, Ch. Pasquali, F. Ravier, J.Ch. Sanchez, D.F. Hoch-
strasser, A nonlinear wide-range immobilized pH gradient for two-
dimensional electrophoresis and its definition in a relevant pH scale,
Electrophoresis 14 (1993) 1357–1365.
[21] A. Schevchenko, M. Wilm, O. Vorm, M. Mann, Mass spectrometric
sequencing of proteins from silver-stained polyacrylamide gels, Anal.
Chem. 68 (1996) 850–858.
[22] P. Halada, P. Man, D. Grebenova, Z. Hrkal, V. Havlıcek, Identification
of HL60 proteins affected by 5-aminolevulinic acid-based photody-
namic therapy using mass spectrometric approach, Collect. Czecho-
slov. Chem. Commun. 66 (2001) 1720–1728.
[23] G. Saydam, H.H. Aydin, F. Sahin, N. Selvi, G. Oktem, E. Terzioglu,
F. Buyukkececi, S.B. Omay, Involvement of protein phosphatase 2A
in interferon-a-2b-induced apoptosis in K562 human chronic myelog-
enous leukaemia cells, Leuk. Res. 27 (2003) 709–717.
[24] R. Bhatia, C.M. Verfaillie, Inhibition of BCR-ABL expression with
antisense oligonucleotides restores h1 integrin-mediated adhesion and
proliferation inhibition in chronic myelogenous leukemia hemato-
poietic progenitors, Blood 91 (1998) 3414–3422.
[25] R. Bhatia, H.A. Munthe, C.M. Verfaillie, Role of abnormal integrin-
cytoskeletal interactions in impaired h1 integrin function in chronic
myelogenous leukemia hematopoietic progenitors, Exp. Hematol. 27
(1999) 1384–1396.
[26] N. Reich, B. Evans, D. Levy, D. Fahey, R. Knight Jr., J.E. Darnell
Jr., Interferon-induced transcription of a gene encoding a 15 kDa
protein depends on an upstream enhancer element, Proc. Natl. Acad.
Sci. U. S. A. 84 (1987) 6394–6398.
[27] J. Narasimhan, J.L. Potter, A.L. Haas, Conjugation of the 15-kDa
interferon-induced ubiquitin homolog is distinct from that of ubiqui-
tin, J. Biol. Chem. 271 (1996) 324–330.
[28] K.R. Loeb, A.L. Haas, Conjugates of ubiquitin cross-reactive pro-
tein distribute in a cytoskeletal pattern, Mol. Cell. Biol. 14 (1994)
8408–8419.
Copyright © 2022 FDOKUMEN