
Finding minimum gene subsets with heuristic breadth-first ...
26
RESEARCH ARTICLE Open Access Finding minimum gene subsets with heuristic breadth-first search algorithm for robust tumor classification Shu-Lin Wang 1,2,3 , Xue-Ling Li 2 and Jianwen Fang 3* Abstract Background: Previous studies on tumor classification based on gene expression profiles suggest that gene selection plays a key role in improving the classification performance. Moreover, finding important tumor-related genes with the highest accuracy is a very important task because these genes might serve as tumor biomarkers, which is of great benefit to not only tumor molecular diagnosis but also drug development. Results: This paper proposes a novel gene selection method with rich biomedical meaning based on Heuristic Breadth-first Search Algorithm (HBSA) to find as many optimal gene subsets as possible. Due to the curse of dimensionality, this type of method could suffer from over-fitting and selection bias problems. To address these potential problems, a HBSA-based ensemble classifier is constructed using majority voting strategy from individual classifiers constructed by the selected gene subsets, and a novel HBSA-based gene ranking method is designed to find important tumor-related genes by measuring the significance of genes using their occurrence frequencies in the selected gene subsets. The experimental results on nine tumor datasets including three pairs of cross-platform datasets indicate that the proposed method can not only obtain better generalization performance but also find many important tumor-related genes. Conclusions: It is found that the frequencies of the selected genes follow a power-law distribution, indicating that only a few top-ranked genes can be used as potential diagnosis biomarkers. Moreover, the top-ranked genes leading to very high prediction accuracy are closely related to specific tumor subtype and even hub genes. Compared with other related methods, the proposed method can achieve higher prediction accuracy with fewer genes. Moreover, they are further justified by analyzing the top-ranked genes in the context of individual gene function, biological pathway, and protein-protein interaction network. Keywords: Gene expression profiles, Gene selection, Tumor classification, Heuristic breadth-first search, Power-law distribution Background Tumor involves many pathways, distinct genes and ex- ogenous factors, and is considered as systems biology diseases [1]. Despite tremendous efforts in research, the mechanism of tumor genesis and development has not been thoroughly known yet. Treatment of later stage cancers is often not therapeutically effective, and medical experts agree that early diagnosis of tumor is of great benefit to successful therapies. However, early tumor detection is extremely difficult using traditional tumor mass detection techniques such as X-ray imaging. Fur- thermore, different subtypes of tumor show very different responses to therapy, indicating that they are molecularly distinct entities. Thus, accurate classification of tumor samples based on molecular signatures is essential for ef- ficient cancer treatment. Since the first paper on the clas- sification of leukemia subtype based on Gene Expression Profiles (GEP) was published [2], this research field has been studied extensively and become a research hotspot [3-8]. Many datasets on different tumors have been pub- lished such as colon tumor [9], Small Round Blue Cell Tumor (SRBCT) [10], Diffuse Large B-Cell Lymphomas * Correspondence: [email protected] 3 Applied Bioinformatics Laboratory, the University of Kansas, 2034 Becker Drive, Lawrence, KS 66047, USA Full list of author information is available at the end of the article © 2012 Wang et al.; licensee BioMed Central Ltd. This is an Open Access article distributed under the terms of the Creative Commons Attribution License (http://creativecommons.org/licenses/by/2.0), which permits unrestricted use, distribution, and reproduction in any medium, provided the original work is properly cited. Wang et al. BMC Bioinformatics 2012, 13:178 http://www.biomedcentral.com/1471-2105/13/178
-
Upload
khangminh22 -
Category
Documents
-
view
0 -
download
0
Transcript of Finding minimum gene subsets with heuristic breadth-first ...
Wang et al. BMC Bioinformatics 2012, 13:178http://www.biomedcentral.com/1471-2105/13/178
RESEARCH ARTICLE Open Access
Finding minimum gene subsets with heuristicbreadth-first search algorithm for robusttumor classificationShu-Lin Wang1,2,3, Xue-Ling Li2 and Jianwen Fang3*
Abstract
Background: Previous studies on tumor classification based on gene expression profiles suggest that geneselection plays a key role in improving the classification performance. Moreover, finding important tumor-relatedgenes with the highest accuracy is a very important task because these genes might serve as tumor biomarkers,which is of great benefit to not only tumor molecular diagnosis but also drug development.
Results: This paper proposes a novel gene selection method with rich biomedical meaning based on HeuristicBreadth-first Search Algorithm (HBSA) to find as many optimal gene subsets as possible. Due to the curse ofdimensionality, this type of method could suffer from over-fitting and selection bias problems. To address thesepotential problems, a HBSA-based ensemble classifier is constructed using majority voting strategy from individualclassifiers constructed by the selected gene subsets, and a novel HBSA-based gene ranking method is designed tofind important tumor-related genes by measuring the significance of genes using their occurrence frequencies inthe selected gene subsets. The experimental results on nine tumor datasets including three pairs of cross-platformdatasets indicate that the proposed method can not only obtain better generalization performance but also findmany important tumor-related genes.
Conclusions: It is found that the frequencies of the selected genes follow a power-law distribution, indicating thatonly a few top-ranked genes can be used as potential diagnosis biomarkers. Moreover, the top-ranked genesleading to very high prediction accuracy are closely related to specific tumor subtype and even hub genes.Compared with other related methods, the proposed method can achieve higher prediction accuracy with fewergenes. Moreover, they are further justified by analyzing the top-ranked genes in the context of individual genefunction, biological pathway, and protein-protein interaction network.
Keywords: Gene expression profiles, Gene selection, Tumor classification, Heuristic breadth-first search, Power-lawdistribution
BackgroundTumor involves many pathways, distinct genes and ex-ogenous factors, and is considered as systems biologydiseases [1]. Despite tremendous efforts in research, themechanism of tumor genesis and development has notbeen thoroughly known yet. Treatment of later stagecancers is often not therapeutically effective, and medicalexperts agree that early diagnosis of tumor is of greatbenefit to successful therapies. However, early tumor
* Correspondence: [email protected] Bioinformatics Laboratory, the University of Kansas, 2034 BeckerDrive, Lawrence, KS 66047, USAFull list of author information is available at the end of the article
© 2012 Wang et al.; licensee BioMed Central LCommons Attribution License (http://creativecreproduction in any medium, provided the or
detection is extremely difficult using traditional tumormass detection techniques such as X-ray imaging. Fur-thermore, different subtypes of tumor show very differentresponses to therapy, indicating that they are molecularlydistinct entities. Thus, accurate classification of tumorsamples based on molecular signatures is essential for ef-ficient cancer treatment. Since the first paper on the clas-sification of leukemia subtype based on Gene ExpressionProfiles (GEP) was published [2], this research field hasbeen studied extensively and become a research hotspot[3-8]. Many datasets on different tumors have been pub-lished such as colon tumor [9], Small Round Blue CellTumor (SRBCT) [10], Diffuse Large B-Cell Lymphomas
td. This is an Open Access article distributed under the terms of the Creativeommons.org/licenses/by/2.0), which permits unrestricted use, distribution, andiginal work is properly cited.
Wang et al. BMC Bioinformatics 2012, 13:178 Page 2 of 26http://www.biomedcentral.com/1471-2105/13/178
(DLBCL) [11], and prostate tumor [12], etc.. All of thepublished tumor datasets have very high dimensionalityand small sample size mainly due to limited resourcesand the time required for collecting and genotyping spe-cimens [13]. Many supervised classification methods inpattern recognition, such as Support Vector Machines(SVM) [14,15], Artificial Neural Networks (ANN) [16-20],k-Nearest Neighbor (KNN) [12,21], and nearest shrunkencentroids [22], have been successfully applied to GEP-based tumor classification over the last decade. All thesestudies have shown that GEP-based tumor classificationmethods hold great promises for early diagnosis and clin-ical prognosis of tumor. However, due to the challengesfrom the curse of dimensionality that the number ofgenes far exceeds the size of sample set, dimensionalityreduction including feature extraction such as totalprincipal component regression [23] and gene selection[2] should be performed before constructing classifica-tion model [24]. Compared to feature extraction, geneselection do not alter the original representation ofgenes, so it can not only improve the performance oftumor classification by removing redundant and irrelevantgenes but also select informative gene subsets that mayserve as cancer biomarkers and potential drug targets.More importantly, it may provide insight into the under-lying molecular mechanism of tumor development. There-fore gene selection plays a very important role in tumorclassification [25].Generally, gene selection can be classified into two cat-
egories: Filters and Wrappers [26]. Filters are independ-ent from the following classification stage. They evaluatethe discriminability of genes by using only the intrinsicinformation of data themselves and subclass information,such as relative entropy [27], information gain and t-test[28], as well as Minimum Redundancy-Maximum Rele-vance (mRMR) [29]. Because gene selection is not asso-ciated to any specific classifiers, the gene subsets selectedby Filters can avoid over-fitting phenomena. The advan-tage of Filters is that they can be easily catered to veryhigh-dimensional datasets, and are computationally sim-ple and fast [25]. On the contrary, Wrappers evaluate thediscriminability of each gene subset using the evaluationfunction of learning algorithm, such as Genetic Algo-rithm (GA)/SVM method [30] and GA/KNN method[21]. Wrappers often deliver better performance than Fil-ters in gene selection [26] because they utilize the feed-back information of classification accuracy. However,their computational cost must be seriously taken into ac-count [31] due to the fact that hunting for the smallestfeature sets in a high-dimensional space is an NP-complete problem [32,33]. Practically for all Wrappers agood solution is to adopt heuristic method in a con-densed search space to approximately find out the smal-lest feature sets. One example is to adopt GA to find the
most informative gene subsets [21,34]. Another exampleis to combine gene ranking with clustering analysis to se-lect a small set of informative genes [35].Three general modes are commonly adopted in gene
selection strategies: Increasing Mode, Decreasing Mode,and Hybrid Mode, which are respectively introduced asfollows. 1) Increasing Mode selects a gene subset startingfrom empty set until a gene subset with the highest classi-fication accuracy is selected through appending potentialgenes into the gene subset, such as Sequential ForwardSearch (SFS) [36]. 2) Decreasing Mode starts from thewhole gene set to remove irrelevant and redundantgenes, and keeps the least gene subset among the sub-sets with the same classification accuracy, such as thewell-known Support Vector Machine-Recursive FeatureElimination (SVM-RFE) [14] that selects informativegenes in a sequential backward elimination manner bystarting with the whole gene set and eliminating one orseveral redundant gene in each iteration, and the exten-sion of SVM-RFE(MSVM-RFE) [37] that solves themulti-class gene selection problem by simultaneouslyconsidering all subclasses during the gene selectionprocess. 3) Hybrid Mode, such as Sequential ForwardFloating Search (SFFS) algorithm [36] and Markovblanket-embedded genetic based gene selection algo-rithm [34], combines Increasing Mode with DecreasingMode by starting from an arbitrary gene set. However,Reunanen [38] proved that intensive search strategiessuch as SFFS do not necessarily outperform a simplerand faster method like SFS, provided that the compari-son is done properly.In fact, due to the characteristics of GEP, more complex
methods are not obviously superior to the simpler onesand the loss of biomedical meaning derived from theover-complex methods may be not sufficiently compen-sated by the little improvement of predictive performance[39]. Therefore, designing biologically interpretable meth-ods that obtains minimum gene subsets with the highestor nearly highest classification accuracy is very importantfor robust tumor classification. Furthermore, identifyingminimum gene subsets means discarding most noise andredundancy in dataset to the utmost extent, which maynot only improve classification accuracy but also decreasethe tumor diagnosis cost by suggesting the fewest bio-markers in clinical application as suggested by [35,40,41].However, the curse of dimensionality from GEP implicatestwo problems in selecting a small gene subset with thehighest or nearly highest accuracy from thousands ofgenes: over-fitting and selection bias, because it may bejust by chance to find a small gene subset with perfectclassification performance from such tremendous genespace even in random dataset [42-44]. So the over-fittingand selection bias problems must be avoided in order toobtain robust classification performance.
Wang et al. BMC Bioinformatics 2012, 13:178 Page 3 of 26http://www.biomedcentral.com/1471-2105/13/178
Ambroise et al. [45] found that overoptimistic resultsincurred by selection bias could happen if test set is notthoroughly excluded from gene selection process. There-fore, test set must be independent of the training processof classifier. Wang L.P. et al. [46] further pointed outthat many previous studies, such as [47] and [10], hadgained overoptimistic performance according to this cri-terion, and they proposed a simple method with result-ant accurate tumor classification by using a very fewgenes. This method combines gene ranking with ex-haustive search method to find minimum gene subsetsso as to achieve the unbiased accuracy. Although theirmethods achieve good and unbiased classificationresults, the high computational cost makes it infeasiblewhen the number of initially selected genes is very large(e.g., more than 300). Our previous work [48] designed agene selection approach that was used to find the mini-mum gene subsets with the highest classification accur-acy, but seriously upward bias occurred because thatinitially selecting differentially expressed genes on wholedataset and over-fitting is performed in gene selectionstage. In this study, based on the Heuristic Breadth-firstSearch Algorithm (HBSA), we further construct aHBSA-based ensemble classifier and design a HBSA-based gene ranking method by counting its occurrencefrequency on the basis of gene subsets selected only ontraining set so as to avoid over-fitting case and selectionbias. Our novel method manages to simultaneouslyachieve the two conflict goals [49]: 1) Design a simpleclassifier to achieve nearly highest and unbiased predic-tion accuracy; and 2) Mine as many important tumor-related genes as possible, which may provide insight intothe mechanism of tumor genesis and help find diagnosisbiomarkers and new therapeutic targets [50].In this following section, we firstly describe the classi-
fication problem and introduce the search strategy ofHBSA. The implementation of HBSA is given, and itsbiomedical interpreter is also illustrated. Then twomethods including HBSA-based ensemble classificationand HBSA-based gene ranking are designed to obtainunbiased prediction accuracy and find important tumor-related genes. The results obtained on nine actual tumordatasets including three pairs of cross-platform datasetsdemonstrate the feasibility and effectiveness of ourmethod. Comparison with other related methods also in-dicate the superiority of our method. The biomedicalanalysis of the selected genes in the context of individualgene function, pathway analysis and Protein-ProteinInteraction (PPI) network further justify our methods.
MethodsProblem descriptionLet G= {g1, �, gn} be a set of genes and S= {s1, �, sm} be aset of samples. |G| = n denotes the number of genes, and
|S| =m denotes the number of samples. The correspond-ing GEP can be represented as matrix X= (xi,j)mn, 1≤ i≤m, 1 ≤ j ≤ n, where xi,j is the expression level of gene gj insample si, and usually n≫m. Each vector si in the geneexpression matrix can be regarded as a point in n-dimensional space. And each of the m rows consists ofan n-element expression vector for a single sample. LetL= {c1, �, ck} denote the label set and |L| = k denote thenumber of subclasses. Usually, the subclass of each sam-ple is known, so S× L= {(si, li)|si 2 Rn, li 2 Rn, li 2 L, i= 1,2, �, m} denotes the labeled sample space.Selecting an informative gene subset T with the high-
est classification accuracy from gene space P(G) (thepower set of G) is a crucial problem, but it is an NP-complete problem [33]. Moreover, which and how manygenes are relevant to a specific tumor subtype are notclear for biomedical scientists so far. We therefore as-sume that the gene subsets with powerful classificationability are relevant to a specific tumor subtype. Let Acc(T) denote the classification ability of a gene subset Ton sample set, which is usually measured by the accur-acy of a classifier. We hope that the selected informativegene subset T simultaneously satisfies the following twogoals:
minimizeT2P Gð ÞðjT jÞ ð1ÞmiximizeT2P Gð Þ Acc Tð Þð Þ ð2Þ
where |T| denotes the cardinal number of gene subsetT. The gene subset simultaneously satisfying (1) and (2)is called an optimal gene subset T*. Note that usuallymore than one optimal gene subset T* may exist in thatthe genes belonging to the same pathway in a cell usu-ally have similar expression pattern and function. Opti-mal subsets A* comprise all of the optimal gene subsetsT*, i.e., A* = {T*|T* ⊂G, T* simultaneously satisfies (1)and (2)}. Although finding only one gene subset T* issufficient for tumor classification, finding as many opti-mal gene subsets as possible is very useful to gain aninsight into tumor dataset structure and discover moreimportant tumor-related genes.Due to a large |G| = n (e.g., one sample usually
includes 2 000~ 30 000 genes), it is impractical to applyan exhaustive search method to find out A* in the spaceof 2n gene subsets. A good solution is to adopt a heuris-tic method in a condensed search space to approxi-mately find out A*. However, different gene subsets withdifferent cardinal numbers may be selected by using dif-ferent methods, so it is difficult to determine the mini-mum number of optimal gene subset for a specifictumor dataset by only designing methods. Thus we mustbalance the minimum number and the classification ac-curacy. Jain et al. [51] suggested a criterion (3) that thenumber of training samples per subclass is at least five
Wang et al. BMC Bioinformatics 2012, 13:178 Page 4 of 26http://www.biomedcentral.com/1471-2105/13/178
times the number of features in designing a classifier toavoid the curse of dimensionality, i.e.
mt=kð Þ=ns > 5 ð3Þwhere k is the number of subclasses, mt is the numberof training samples, and ns denotes the number of theselected genes, and for more complex classifier the ratioof sample size to dimensionality should be larger. Forexample, we should consider at most eight informativegenes for two-subclass tumor dataset with only 80 train-ing samples to design a classifier with acceptablegeneralization performance [52]. Considering that veryhigh accuracy can always be obtained by selecting suffi-cient genes in a small size of sample set, we aim to findminimal gene subsets with nearly maximal accuracy ra-ther than to obtain maximal accuracy with much moregenes. Therefore, those gene subsets approximately sat-isfying (1) and (2) are also included into our optimalgene subsets A*. Based on these optimal gene subsets,how to obtain more reliable accuracy and find more im-portant tumor-related genes are two key problems.
Gene pre-selectionIt is widely accepted that tumor-related genes are differ-entially expressed ones, so the Filters-based gene rankingtechniques are usually used to pre-select the differentiallyexpressed genes from the original gene space eventhough those differentially expressed genes are not alwaystumor-related ones due to the noises in dataset. Its mainidea is to assign each gene a single score that denotes thesignificance of each gene according to a certain scoringcriterion. Many single variable methods such as t-testand Bhattacharyya distance are extensively used as dis-crimination criterions. However, these methods requirethe dataset to follow Gaussian distribution. Otherwise,these methods may not achieve optimal experimentalperformance. Deng et al. [53] reported that usually tumordatasets do not follow Gaussian distribution and showedthat Wilcoxon rank sum test (WRST) is superior to t-testmethod in gene selection on three binary tumor datasets.
10N
...
11N N
12N
2
3
pN −
...
...
21N
{g
}{ pg
}{ pg
}{ 1g
}{ 2g
}{ 2g
3{ }g { }pg... ... {1
3N
φ
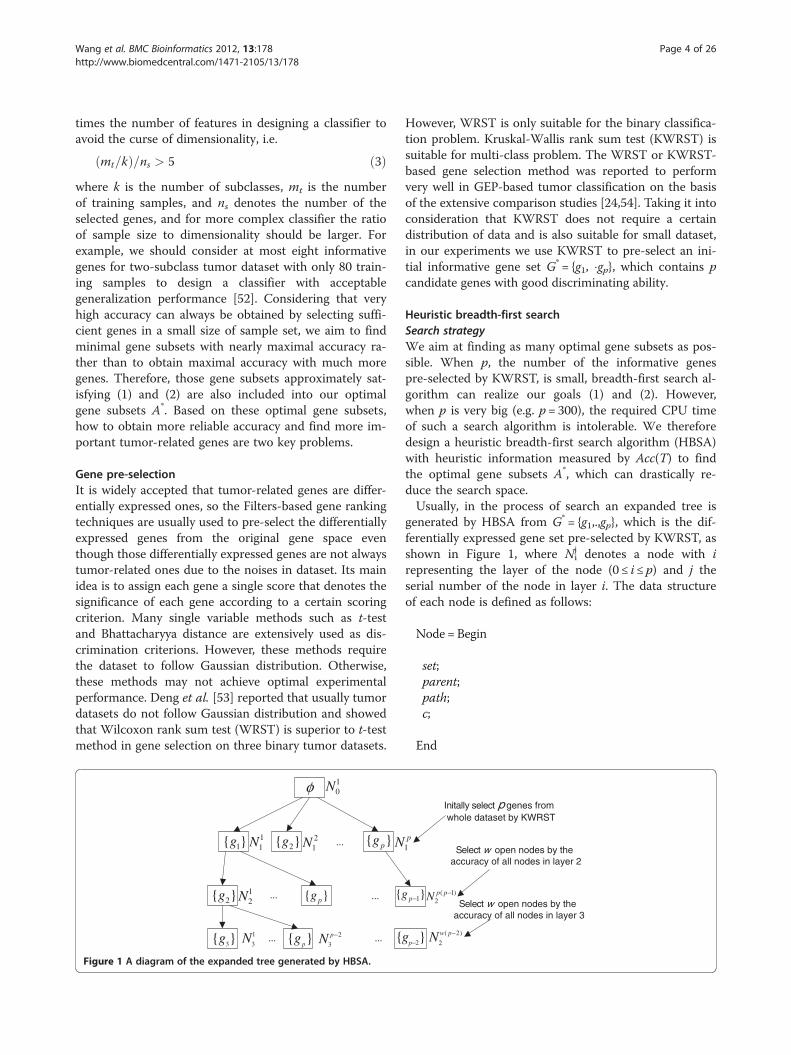
Figure 1 A diagram of the expanded tree generated by HBSA..
However, WRST is only suitable for the binary classifica-tion problem. Kruskal-Wallis rank sum test (KWRST) issuitable for multi-class problem. The WRST or KWRST-based gene selection method was reported to performvery well in GEP-based tumor classification on the basisof the extensive comparison studies [24,54]. Taking it intoconsideration that KWRST does not require a certaindistribution of data and is also suitable for small dataset,in our experiments we use KWRST to pre-select an ini-tial informative gene set G* = {g1, �gp}, which contains pcandidate genes with good discriminating ability.
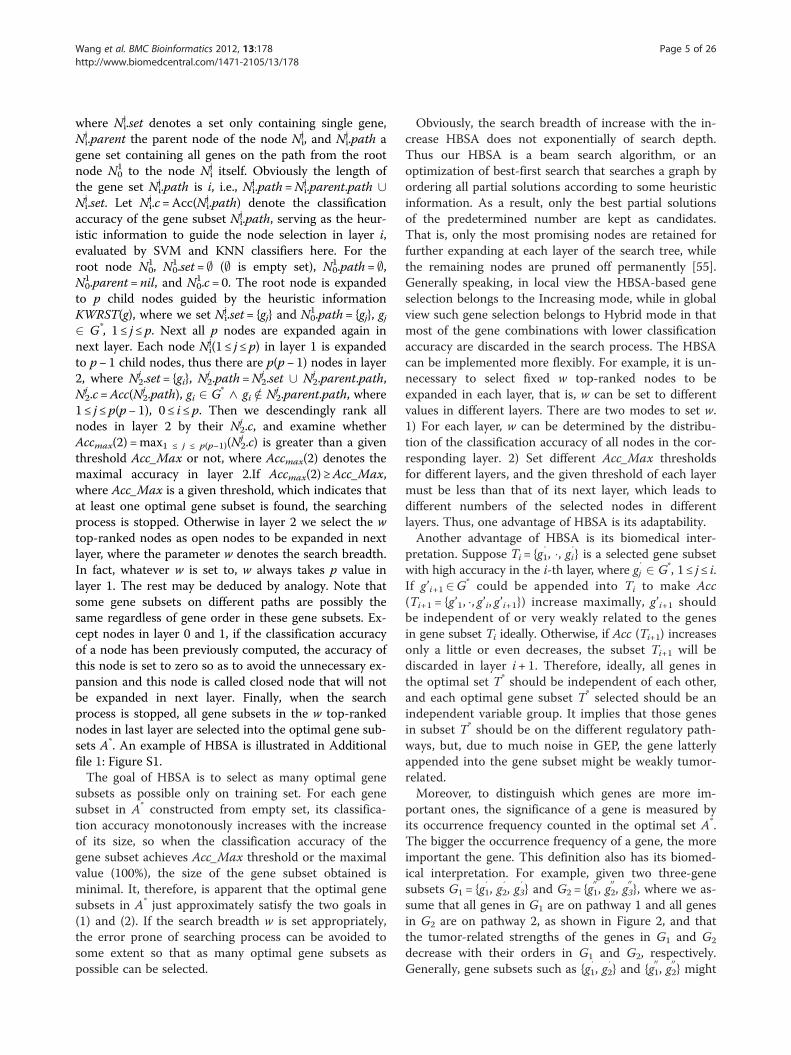
Heuristic breadth-first searchSearch strategyWe aim at finding as many optimal gene subsets as pos-sible. When p, the number of the informative genespre-selected by KWRST, is small, breadth-first search al-gorithm can realize our goals (1) and (2). However,when p is very big (e.g. p= 300), the required CPU timeof such a search algorithm is intolerable. We thereforedesign a heuristic breadth-first search algorithm (HBSA)with heuristic information measured by Acc(T) to findthe optimal gene subsets A*, which can drastically re-duce the search space.Usually, in the process of search an expanded tree is
generated by HBSA from G* = {g1,.,gp}, which is the dif-ferentially expressed gene set pre-selected by KWRST, asshown in Figure 1, where Ni
j denotes a node with irepresenting the layer of the node (0 ≤ i ≤ p) and j theserial number of the node in layer i. The data structureof each node is defined as follows:
Node =Begin
set;parent;path;c;
End
p1
)1(2
−ppN}1−p
2}pg −( 2)
2
w pN −
Initally select p genes from whole dataset by KWRST
Select w open nodes by the accuracy of all nodes in layer 2
Select w open nodes by the accuracy of all nodes in layer 3
Wang et al. BMC Bioinformatics 2012, 13:178 Page 5 of 26http://www.biomedcentral.com/1471-2105/13/178
where Nij.set denotes a set only containing single gene,
Nij.parent the parent node of the node Ni
j, and Nij.path a
gene set containing all genes on the path from the rootnode N0
1 to the node Nij itself. Obviously the length of
the gene set Nij.path is i, i.e., Ni
j.path=Nij.parent.path [
Nij.set. Let Ni
j.c=Acc(Nij.path) denote the classification
accuracy of the gene subset Nij.path, serving as the heur-
istic information to guide the node selection in layer i,evaluated by SVM and KNN classifiers here. For theroot node N0
1, N01.set = ; (; is empty set), N0
1.path= ;,N01.parent = nil, and N0
1.c= 0. The root node is expandedto p child nodes guided by the heuristic informationKWRST(g), where we set Ni
j.set= {gj} and N01.path= {gj}, gj
2 G*, 1≤ j ≤ p. Next all p nodes are expanded again innext layer. Each node Ni
j(1 ≤ j ≤ p) in layer 1 is expandedto p− 1 child nodes, thus there are p(p− 1) nodes in layer2, where N2
j .set= {gi}, N2j .path=N2
j .set [ N2j .parent.path,
N2j .c=Acc(N2
j .path), gi 2 G* ∧ gi =2 N2j .parent.path, where
1≤ j ≤ p(p− 1), 0 ≤ i ≤ p. Then we descendingly rank allnodes in layer 2 by their N2
j .c, and examine whetherAccmax(2) =max1 ≤ j ≤ p(p−1)(N2
j .c) is greater than a giventhreshold Acc_Max or not, where Accmax(2) denotes themaximal accuracy in layer 2.If Accmax(2) ≥Acc_Max,where Acc_Max is a given threshold, which indicates thatat least one optimal gene subset is found, the searchingprocess is stopped. Otherwise in layer 2 we select the wtop-ranked nodes as open nodes to be expanded in nextlayer, where the parameter w denotes the search breadth.In fact, whatever w is set to, w always takes p value inlayer 1. The rest may be deduced by analogy. Note thatsome gene subsets on different paths are possibly thesame regardless of gene order in these gene subsets. Ex-cept nodes in layer 0 and 1, if the classification accuracyof a node has been previously computed, the accuracy ofthis node is set to zero so as to avoid the unnecessary ex-pansion and this node is called closed node that will notbe expanded in next layer. Finally, when the searchprocess is stopped, all gene subsets in the w top-rankednodes in last layer are selected into the optimal gene sub-sets A*. An example of HBSA is illustrated in Additionalfile 1: Figure S1.The goal of HBSA is to select as many optimal gene
subsets as possible only on training set. For each genesubset in A* constructed from empty set, its classifica-tion accuracy monotonously increases with the increaseof its size, so when the classification accuracy of thegene subset achieves Acc_Max threshold or the maximalvalue (100%), the size of the gene subset obtained isminimal. It, therefore, is apparent that the optimal genesubsets in A* just approximately satisfy the two goals in(1) and (2). If the search breadth w is set appropriately,the error prone of searching process can be avoided tosome extent so that as many optimal gene subsets aspossible can be selected.
Obviously, the search breadth of increase with the in-crease HBSA does not exponentially of search depth.Thus our HBSA is a beam search algorithm, or anoptimization of best-first search that searches a graph byordering all partial solutions according to some heuristicinformation. As a result, only the best partial solutionsof the predetermined number are kept as candidates.That is, only the most promising nodes are retained forfurther expanding at each layer of the search tree, whilethe remaining nodes are pruned off permanently [55].Generally speaking, in local view the HBSA-based geneselection belongs to the Increasing mode, while in globalview such gene selection belongs to Hybrid mode in thatmost of the gene combinations with lower classificationaccuracy are discarded in the search process. The HBSAcan be implemented more flexibly. For example, it is un-necessary to select fixed w top-ranked nodes to beexpanded in each layer, that is, w can be set to differentvalues in different layers. There are two modes to set w.1) For each layer, w can be determined by the distribu-tion of the classification accuracy of all nodes in the cor-responding layer. 2) Set different Acc_Max thresholdsfor different layers, and the given threshold of each layermust be less than that of its next layer, which leads todifferent numbers of the selected nodes in differentlayers. Thus, one advantage of HBSA is its adaptability.Another advantage of HBSA is its biomedical inter-
pretation. Suppose Ti= {g1′ , �, gi′} is a selected gene subset
with high accuracy in the i-th layer, where gj′ 2 G*, 1≤ j≤ i.
If g’i+12G* could be appended into Ti to make Acc(Ti+1 = {g’1, �, g’i, g’i+1}) increase maximally, g’i+1 shouldbe independent of or very weakly related to the genesin gene subset Ti ideally. Otherwise, if Acc (Ti+1) increasesonly a little or even decreases, the subset Ti+1 will bediscarded in layer i + 1. Therefore, ideally, all genes inthe optimal set T* should be independent of each other,and each optimal gene subset T* selected should be anindependent variable group. It implies that those genesin subset T* should be on the different regulatory path-ways, but, due to much noise in GEP, the gene latterlyappended into the gene subset might be weakly tumor-related.Moreover, to distinguish which genes are more im-
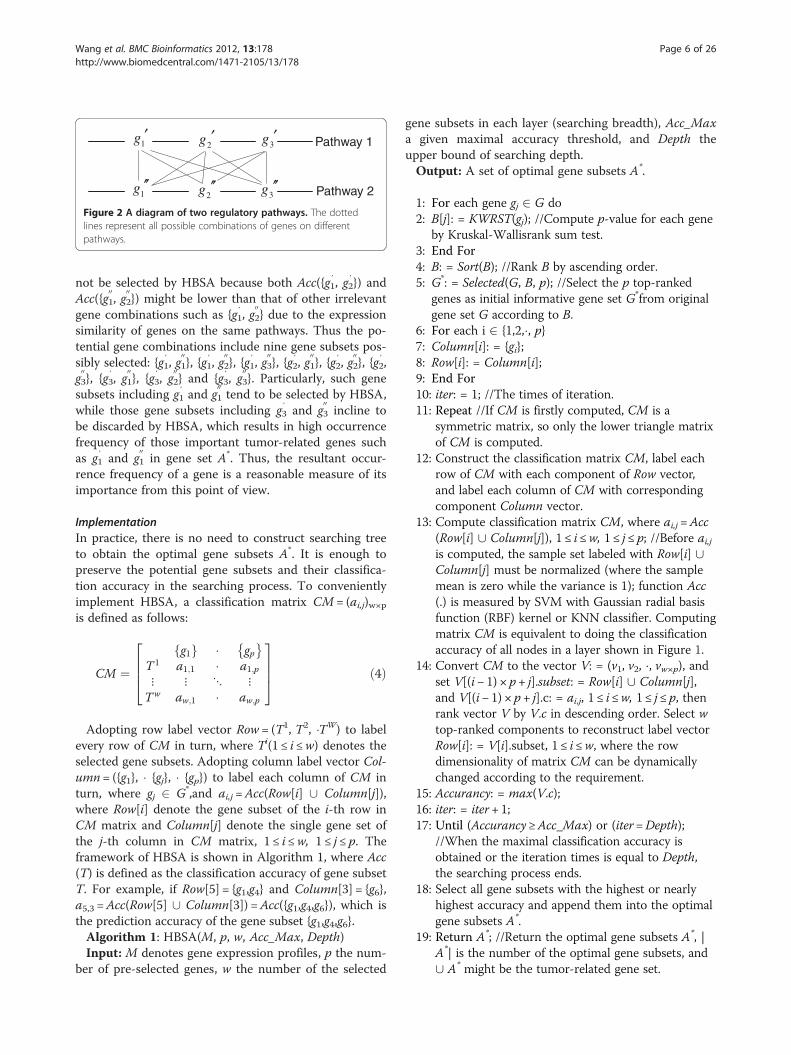
portant ones, the significance of a gene is measured byits occurrence frequency counted in the optimal set A*.The bigger the occurrence frequency of a gene, the moreimportant the gene. This definition also has its biomed-ical interpretation. For example, given two three-genesubsets G1 = {g1
′ , g2′ , g3
′} and G2 = {g100, g2
00, g3
00}, where we as-
sume that all genes in G1 are on pathway 1 and all genesin G2 are on pathway 2, as shown in Figure 2, and thatthe tumor-related strengths of the genes in G1 and G2
decrease with their orders in G1 and G2, respectively.Generally, gene subsets such as {g1
′ , g2′} and {g1
00, g2
00} might
1g ′2g ′
3g ′
1g ′′2g ′′
3g ′′ Pathway 2
Pathway 1
Figure 2 A diagram of two regulatory pathways. The dottedlines represent all possible combinations of genes on differentpathways.
Wang et al. BMC Bioinformatics 2012, 13:178 Page 6 of 26http://www.biomedcentral.com/1471-2105/13/178
not be selected by HBSA because both Acc({g1′ , g2
′}) andAcc({g1
00, g2
00}) might be lower than that of other irrelevant
gene combinations such as {g1′ , g2
00} due to the expression
similarity of genes on the same pathways. Thus the po-tential gene combinations include nine gene subsets pos-sibly selected: {g1
′ , g100}, {g1
′ , g200}, {g1
′ , g300}, {g2
′ , g100}, {g2
′ , g200}, {g2
′ ,g300}, {g3
′ , g100}, {g3
′ , g200} and {g3
′ , g300}. Particularly, such gene
subsets including g1′ and g1
00tend to be selected by HBSA,
while those gene subsets including g3′ and g3
00incline to
be discarded by HBSA, which results in high occurrencefrequency of those important tumor-related genes suchas g1
′ and g100in gene set A*. Thus, the resultant occur-
rence frequency of a gene is a reasonable measure of itsimportance from this point of view.
ImplementationIn practice, there is no need to construct searching treeto obtain the optimal gene subsets A*. It is enough topreserve the potential gene subsets and their classifica-tion accuracy in the searching process. To convenientlyimplement HBSA, a classification matrix CM= (ai,j)w×pis defined as follows:
CM ¼g1f g � gp
� �T1 a1;1 � a1;p⋮ ⋮ ⋱ ⋮Tw aw;1 � aw;p
2664
3775 ð4Þ
Adopting row label vector Row= (T1, T2, �TW) to labelevery row of CM in turn, where Ti(1 ≤ i ≤w) denotes theselected gene subsets. Adopting column label vector Col-umn= ({g1}, � {gj}, � {gp}) to label each column of CM inturn, where gj 2 G*,and ai,j=Acc(Row[i] [ Column[j]),where Row[i] denote the gene subset of the i-th row inCM matrix and Column[j] denote the single gene set ofthe j-th column in CM matrix, 1≤ i≤w, 1 ≤ j ≤ p. Theframework of HBSA is shown in Algorithm 1, where Acc(T) is defined as the classification accuracy of gene subsetT. For example, if Row[5] = {g1,g4} and Column[3] = {g6},a5,3 =Acc(Row[5] [ Column[3]) =Acc({g1,g4,g6}), which isthe prediction accuracy of the gene subset {g1,g4,g6}.Algorithm 1: HBSA(M, p, w, Acc_Max, Depth)Input: M denotes gene expression profiles, p the num-
ber of pre-selected genes, w the number of the selected
gene subsets in each layer (searching breadth), Acc_Maxa given maximal accuracy threshold, and Depth theupper bound of searching depth.Output: A set of optimal gene subsets A*.
1: For each gene gj 2 G do2: B[j]: = KWRST(gj); //Compute p-value for each gene
by Kruskal-Wallisrank sum test.3: End For4: B: = Sort(B); //Rank B by ascending order.5: G*: = Selected(G, B, p); //Select the p top-ranked
genes as initial informative gene set G*from originalgene set G according to B.
6: For each i 2 {1,2,�, p}7: Column[i]: = {gi};8: Row[i]: = Column[i];9: End For10: iter: = 1; //The times of iteration.11: Repeat //If CM is firstly computed, CM is a
symmetric matrix, so only the lower triangle matrixof CM is computed.
12: Construct the classification matrix CM, label eachrow of CM with each component of Row vector,and label each column of CM with correspondingcomponent Column vector.
13: Compute classification matrix CM, where ai,j=Acc(Row[i] [ Column[j]), 1 ≤ i ≤w, 1 ≤ j ≤ p; //Before ai,jis computed, the sample set labeled with Row[i] [Column[j] must be normalized (where the samplemean is zero while the variance is 1); function Acc(.) is measured by SVM with Gaussian radial basisfunction (RBF) kernel or KNN classifier. Computingmatrix CM is equivalent to doing the classificationaccuracy of all nodes in a layer shown in Figure 1.
14: Convert CM to the vector V: = (v1, v2, �, vw×p), andset V[(i− 1) × p+ j].subset: = Row[i] [ Column[j],and V[(i− 1) × p+ j].c: = ai,j, 1 ≤ i ≤w, 1≤ j ≤ p, thenrank vector V by V.c in descending order. Select wtop-ranked components to reconstruct label vectorRow[i]: = V[i].subset, 1 ≤ i ≤w, where the rowdimensionality of matrix CM can be dynamicallychanged according to the requirement.
15: Accurancy: = max(V.c);16: iter: = iter+ 1;17: Until (Accurancy ≥Acc_Max) or (iter=Depth);
//When the maximal classification accuracy isobtained or the iteration times is equal to Depth,the searching process ends.
18: Select all gene subsets with the highest or nearlyhighest accuracy and append them into the optimalgene subsets A*.
19: Return A*; //Return the optimal gene subsets A*, |A*| is the number of the optimal gene subsets, and[ A* might be the tumor-related gene set.
Wang et al. BMC Bioinformatics 2012, 13:178 Page 7 of 26http://www.biomedcentral.com/1471-2105/13/178
Algorithm endThree stopping criterions are predefined in HBSA:
1) When a gene subset whose accuracy on overalltraining set is no less than Acc_Max threshold isfound, the algorithm ends.
2) If no gene subset with Acc_Max accuracy is found,the HBSA ends with the maximum iteration timesDepth, which can guarantee the end of thisalgorithm. Usually, we do not know how to select anappropriate Depth. If Depth is set inappropriately,the selected gene subsets might not be optimal.
3) An alternative criterion is that the HBSA ends withthe criterion |Accuracyiter+1−Accuracyiter| < δ, whereδ is set to a very small positive real number andAccuracyiter denotes the maximum classificationaccuracy in the iter-th iteration.
The most time-consuming operation in the HBSA isto compute Acc(T). If we assume that computing Acc(T)only costs one unit time, the time complexity of com-puting the classification matrix CM is O(w× p), and thetime complexity for the whole algorithm is O(Depth ×w× p). Although HBSA is an algorithm of polynomialtime complexity, it is still very time-consuming. How-ever, since the task of finding optimal gene subset ismainly performed in laboratory phase and the clinicaltumor diagnosis phase only uses the selected gene sub-sets, which takes only a little CPU time (e.g., within atmost several seconds on general PC computer). Thus,our HBSA-based gene selection method is feasible.
Evaluation criterionWe adopt two machine learning methods, KNN andSVM, to measure the classification accuracy, Acc(T), of agene subset T in HBSA, respectively. KNN is a commonnon-parametric method. To classify an unknown samplex, KNN extracts the k closest vectors from training setby using similarity measures such as Euclidean distance,and decides the label of the unknown sample x by usingthe majority subclass label of the k nearest neighbors. kis set to an odd number to avoid tied votes. In ourexperiments Euclidean distance and five nearest neigh-bors are adopted to measure the similarity of samplesand make decisions. The HBSA with KNN is calledHBSA-KNN.SVM [56] with Gaussian Radial Basis Function (RBF)
K(x,y) = exp(−γ||x− y ||2) (SVM-RBF) is also adopted toevaluate the classification performance of the selectedgene subsets. LIBSVM [57] is used in the study, wherethe combinations of penalized parameter C and Gauss-ian kernel parameter γ need to be optimized when train-ing SVM classifier. Parameter C is the penalty factor ofthe samples classified mistakenly, while parameter γ
dominates the sensitivity to the change of input data. Be-cause of the large search space, the general grid-searchmethod (for example, C=2−5, 2−4, �, 215, γ=2−15, 2−14, �, 23)[58,59] is time-consuming in finding the optimal parametercombinations (C, γ). Furthermore, we find that normalizedtumor datasets are not sensitive to parameter C, and thatsearch space can be reduced with parameter γ being setwithin the range of [10-5,10] and C being set to 200 and400 or even fixed to 200. Specifically, if γ takes the valuein O(10-1), γ may take 0.1, 0.2, �, 0.9, respectively; if γtakes the value in O(10-2), γ may take 0.01, 0.02, �, 0.09,respectively. And the others are set similarly. The HBSAwith SVM is called HBSA-SVM.The k-fold Cross-Validation (k-fold CV) is commonly
used to evaluate classification model. Here it is appliedonly on training set to measure Acc(T). If k is set to Trn(the size of training set), the k-fold CV is called Leave-One-Out Cross-Validation (LOOCV). If k is set to 2, thek-fold CV is known as the holdout method. When k isset too low, the accuracy of k-fold CV tends to have highbias and low variance. On the contrary, when k is set toohigh (e.g., k =Trn), the accuracy of k-fold CV will havelow bias but high variance [51,60]. Breiman et al. [61]found that 10-fold CV method outperforms the LOOCVmethod to some extent. Ambroise et al. [45] and Asyaliet al. [52] also recommended 10-fold CV methods intumor classification, but whether 10-fold CV methodoutperforms LOOCV method depends on datasets. Tobalance the bias and variance, here we design a newmethod to evaluate the experimental results. Let CV(k)denote the accuracyof k-fold CV classification, where2≤ k ≤m and m is the total number of samples in train-ing set. Then the mean of the accuracy is defined as:
mean ¼ 1m� 1
Xm
k¼2CV kð Þ
� �ð5Þ
The standard deviation is defined as:
std ¼ffiffiffiffiffiffiffiffiffiffiffiffiffiffiffiffiffiffiffiffiffiffiffiffiffiffiffiffiffiffiffiffiffiffiffiffiffiffiffiffiffiffiffiffiffiffiffiffiffiffiffiffiffiffiffiffiffiffiffiffiffiffiffiffiffiffiffiffiXm
k¼2CV kð Þ �meanð Þ2= m� 2ð Þ
qð6Þ
This method is called Full-fold CV method. The meanof the accuracy evaluated by this method is called Full-fold CV accuracy. Since the computational cost of HBSAwould greatly increase by using Full-fold CV to computeAcc(T), 10-fold CV is still used to evaluate Acc(T) as theheuristic information of HBSA. While Full-fold CVmethod is only used to evaluate the resultant gene sub-sets in A* with the highest or nearly highest 10-fold CVaccuracy.The implementation of HBSA-KNN is similar, but dif-
ferent in some ways, to that of HBSA-SVM. For HBSA-KNN, we randomly divide training set into 10 partswhen using 10-fold CV method, but different divisionscan slightly affect the experimental results. To eliminate
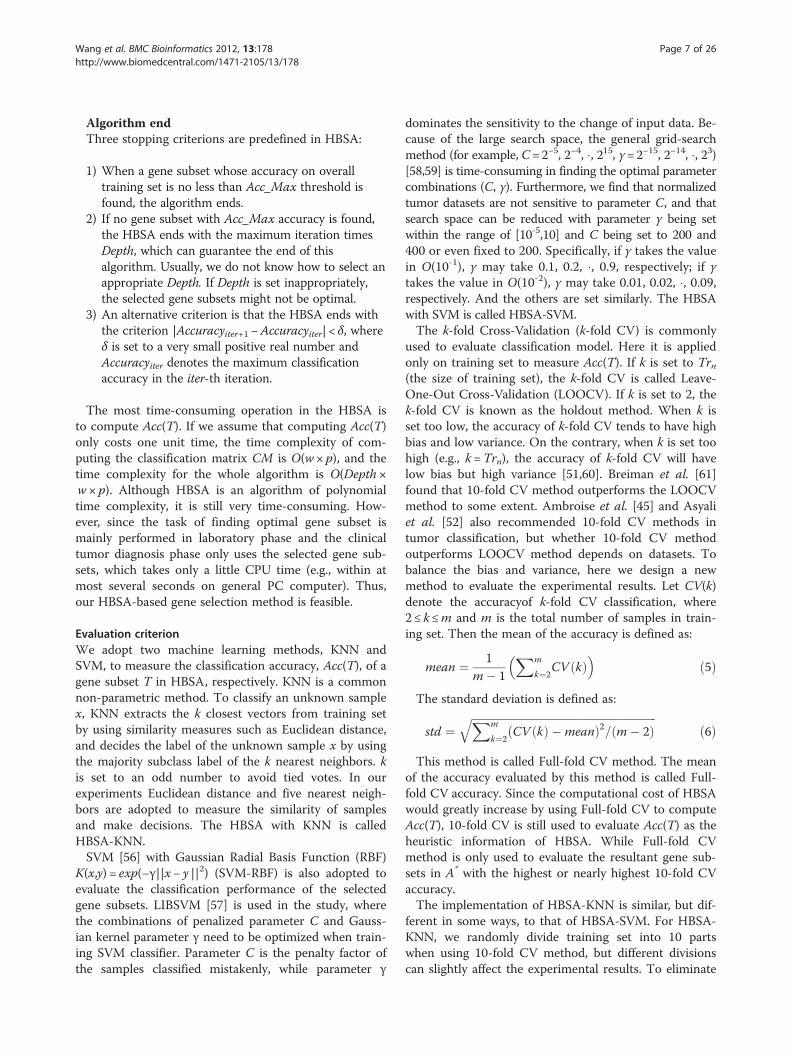
If the experiments are performed on single tumor dataset, then divide the whole dataset into the training set Tr and the test set Te; if the experiments are performed on a pair of cross-platform tumor datasets, then one dataset is used as the training set Tr and another dataset as the test set Te.
Apply KWRST to the training set Tr to rank all genes and select p top-ranked genes as initially selected gene set G*.
Apply the HBSA algorithm with 10-fold CV method to the training set Tr with the selected gene set G* to further select the optimal set A* including all optimal gene subsets selected.
Construct ensemble classifier by incorporating all individual classifiers generated by using the selected optimal gene subsets in A*.
Use the ensemble classifier to predict the test set Te. The final decision is made by simple majority voting strategy.
Count the occurrence frequency of each gene in A* and sorting all genes by their occurrence frequency with descending order.
Those top-ranked genes are thought of as the key tumor-related genes.
Figure 3 The flowchart of our analysis method..
Wang et al. BMC Bioinformatics 2012, 13:178 Page 8 of 26http://www.biomedcentral.com/1471-2105/13/178
the effects of different divisions, HBSA-KNN is per-formed five times with different divisions of training set,thus we could obtain five optimal sets A*. Then the oc-currence frequency of each gene is counted from theobtained five optimal sets A*. However, for HBSA-SVM,the division of training set for 10-fold CV method, pro-vided by LIBSVM, is definite in each run. It is sufficientto perform HBSA-SVM only once.Usually, for HBSA-SVM, final prediction accuracy is
evaluated on independent test set by SVM-RBF classifierconstructed by optimizing parameter pair only on train-ing set, which is called HBSA-SVM (Unbiased). How-ever, more than one parameter pairs can make theconstructed classifiers obtain the highest 10-fold CV ac-curacy on training set, while the classifiers constructedwith these different parameter pairs obtain different pre-diction accuracy on independent test set. So, in contrastwith HBSA-SVM (Unbiased), a biased HBSA-SVM,selecting the parameter pair that makes the constructedclassifier obtain the highest prediction accuracy on testset, is also used to evaluate the performance of theselected gene subsets, which is called HBSA-SVM(Biased).Receiver Operator Characteristics (ROC) analysis is a
visual method for evaluating the performance of binaryclassification model [62].Usually, a few performancemeasures can be derived from the number of true posi-tives (TP), true negatives (TN), false positives (FP) andfalse negatives (FN) in test set to measure the perform-ance of classification model, i.e., the true-positive rate orsensitivity (TPR), the false-positive rate(FPR), positivepredictive value(PPV), and negative predictive value(NPV). Here ROC curve that is a TPR (on the y_axis)versus FPR (on the x_axis) plot is used, and the AreaUnder ROC Curve (AUC) is used to measure the per-formance of classification model.
Acc ¼ accurancy¼ TP þ TNð Þ= TP þ TN þ FP þ FNð Þ ð7Þ
SP ¼ specificity ¼ TN= FP þ TNð Þ ð8ÞTPR ¼ sensitivity ¼ TP= TP þ FNð Þ ð9ÞFPR ¼ 1� specificityð Þ ¼ FP= FP þ TNð Þ ð10ÞPPV ¼ TP= TP þ FPð Þ ð11ÞNPV ¼ TN= TN þ FNð Þ ð12Þ
Analysis frameworkFlowchart of analysisAfter HBSA is applied to gene selection from the differ-entially expressed genes initially selected by KWRST ontraining set, numerous optimal gene subsets are
obtained. However, finding optimal gene subsets in suchtremendous gene space tends to over-fit training set.Some tumor-unrelated genes are very likely to beselected mistakenly into optimal gene subsets, whichmight introduce serious bias in the gene selection. Thegeneralization performance of these gene subsets con-taining tumor-unrelated genes is possibly very poor inpredicting unknown tumor samples. To address thisproblem, we design a HBSA-based ensemble classifierand a HBSA-based gene ranking method to obtain un-biased prediction accuracy and find as many importanttumor-related genes as possible. The flowchart of ouranalysis method is shown in Figure 3.
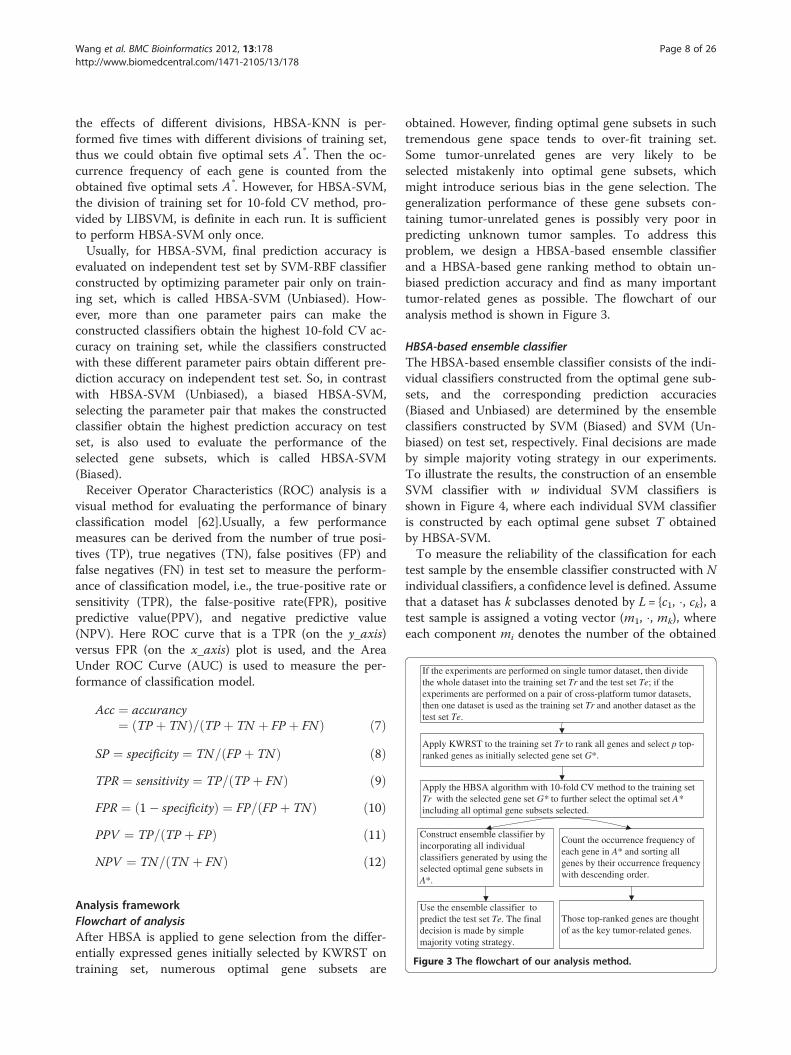
HBSA-based ensemble classifierThe HBSA-based ensemble classifier consists of the indi-vidual classifiers constructed from the optimal gene sub-sets, and the corresponding prediction accuracies(Biased and Unbiased) are determined by the ensembleclassifiers constructed by SVM (Biased) and SVM (Un-biased) on test set, respectively. Final decisions are madeby simple majority voting strategy in our experiments.To illustrate the results, the construction of an ensembleSVM classifier with w individual SVM classifiers isshown in Figure 4, where each individual SVM classifieris constructed by each optimal gene subset T obtainedby HBSA-SVM.To measure the reliability of the classification for each
test sample by the ensemble classifier constructed with Nindividual classifiers, a confidence level is defined. Assumethat a dataset has k subclasses denoted by L= {c1, �, ck}, atest sample is assigned a voting vector (m1, �, mk), whereeach component mi denotes the number of the obtained
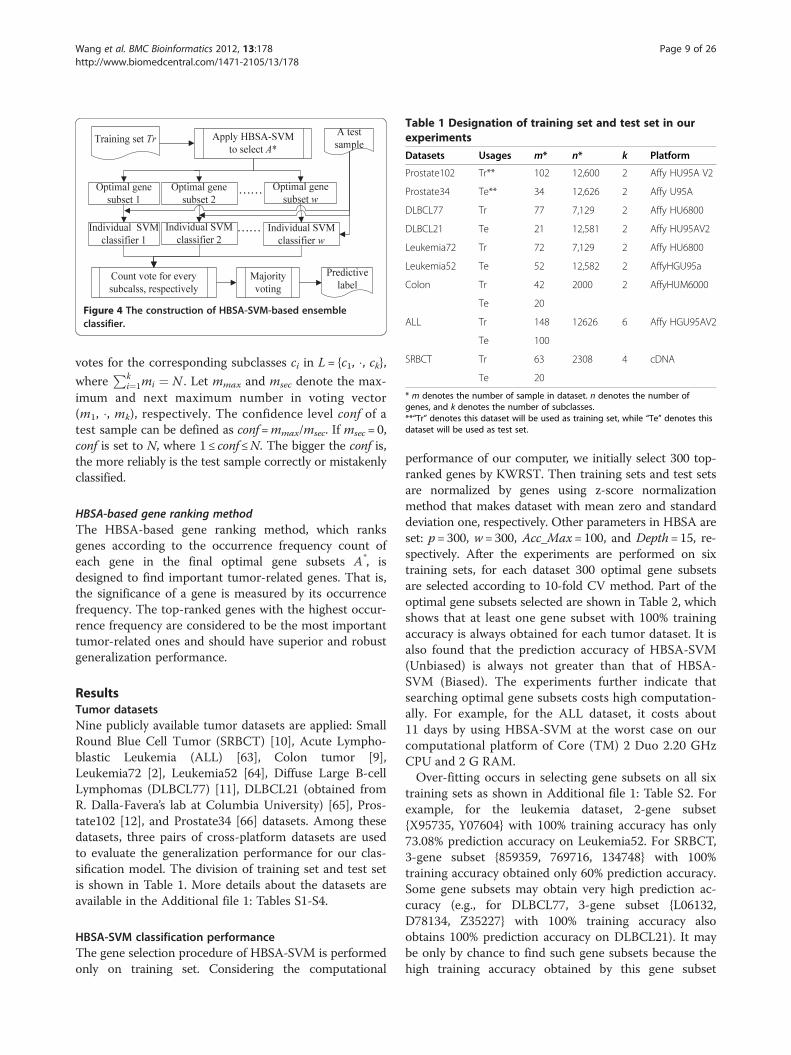
Figure 4 The construction of HBSA-SVM-based ensembleclassifier..
Table 1 Designation of training set and test set in ourexperiments
Datasets Usages m* n* k Platform
Prostate102 Tr** 102 12,600 2 Affy HU95A V2
Prostate34 Te** 34 12,626 2 Affy U95A
DLBCL77 Tr 77 7,129 2 Affy HU6800
DLBCL21 Te 21 12,581 2 Affy HU95AV2
Leukemia72 Tr 72 7,129 2 Affy HU6800
Leukemia52 Te 52 12,582 2 AffyHGU95a
Colon Tr 42 2000 2 AffyHUM6000
Te 20
ALL Tr 148 12626 6 Affy HGU95AV2
Te 100
SRBCT Tr 63 2308 4 cDNA
Te 20
* m denotes the number of sample in dataset. n denotes the number ofgenes, and k denotes the number of subclasses.**“Tr” denotes this dataset will be used as training set, while “Te” denotes thisdataset will be used as test set.
Wang et al. BMC Bioinformatics 2012, 13:178 Page 9 of 26http://www.biomedcentral.com/1471-2105/13/178
votes for the corresponding subclasses ci in L= {c1, �, ck},where
Pki¼1mi ¼ N . Let mmax and msec denote the max-
imum and next maximum number in voting vector(m1, �, mk), respectively. The confidence level conf of atest sample can be defined as conf=mmax/msec. If msec=0,conf is set to N, where 1≤ conf≤N. The bigger the conf is,the more reliably is the test sample correctly or mistakenlyclassified.
HBSA-based gene ranking methodThe HBSA-based gene ranking method, which ranksgenes according to the occurrence frequency count ofeach gene in the final optimal gene subsets A*, isdesigned to find important tumor-related genes. That is,the significance of a gene is measured by its occurrencefrequency. The top-ranked genes with the highest occur-rence frequency are considered to be the most importanttumor-related ones and should have superior and robustgeneralization performance.
ResultsTumor datasetsNine publicly available tumor datasets are applied: SmallRound Blue Cell Tumor (SRBCT) [10], Acute Lympho-blastic Leukemia (ALL) [63], Colon tumor [9],Leukemia72 [2], Leukemia52 [64], Diffuse Large B-cellLymphomas (DLBCL77) [11], DLBCL21 (obtained fromR. Dalla-Favera’s lab at Columbia University) [65], Pros-tate102 [12], and Prostate34 [66] datasets. Among thesedatasets, three pairs of cross-platform datasets are usedto evaluate the generalization performance for our clas-sification model. The division of training set and test setis shown in Table 1. More details about the datasets areavailable in the Additional file 1: Tables S1-S4.
HBSA-SVM classification performanceThe gene selection procedure of HBSA-SVM is performedonly on training set. Considering the computational
performance of our computer, we initially select 300 top-ranked genes by KWRST. Then training sets and test setsare normalized by genes using z-score normalizationmethod that makes dataset with mean zero and standarddeviation one, respectively. Other parameters in HBSA areset: p=300, w=300, Acc_Max= 100, and Depth=15, re-spectively. After the experiments are performed on sixtraining sets, for each dataset 300 optimal gene subsetsare selected according to 10-fold CV method. Part of theoptimal gene subsets selected are shown in Table 2, whichshows that at least one gene subset with 100% trainingaccuracy is always obtained for each tumor dataset. It isalso found that the prediction accuracy of HBSA-SVM(Unbiased) is always not greater than that of HBSA-SVM (Biased). The experiments further indicate thatsearching optimal gene subsets costs high computation-ally. For example, for the ALL dataset, it costs about11 days by using HBSA-SVM at the worst case on ourcomputational platform of Core (TM) 2 Duo 2.20 GHzCPU and 2 G RAM.Over-fitting occurs in selecting gene subsets on all six
training sets as shown in Additional file 1: Table S2. Forexample, for the leukemia dataset, 2-gene subset{X95735, Y07604} with 100% training accuracy has only73.08% prediction accuracy on Leukemia52. For SRBCT,3-gene subset {859359, 769716, 134748} with 100%training accuracy obtained only 60% prediction accuracy.Some gene subsets may obtain very high prediction ac-curacy (e.g., for DLBCL77, 3-gene subset {L06132,D78134, Z35227} with 100% training accuracy alsoobtains 100% prediction accuracy on DLBCL21). It maybe only by chance to find such gene subsets because thehigh training accuracy obtained by this gene subset
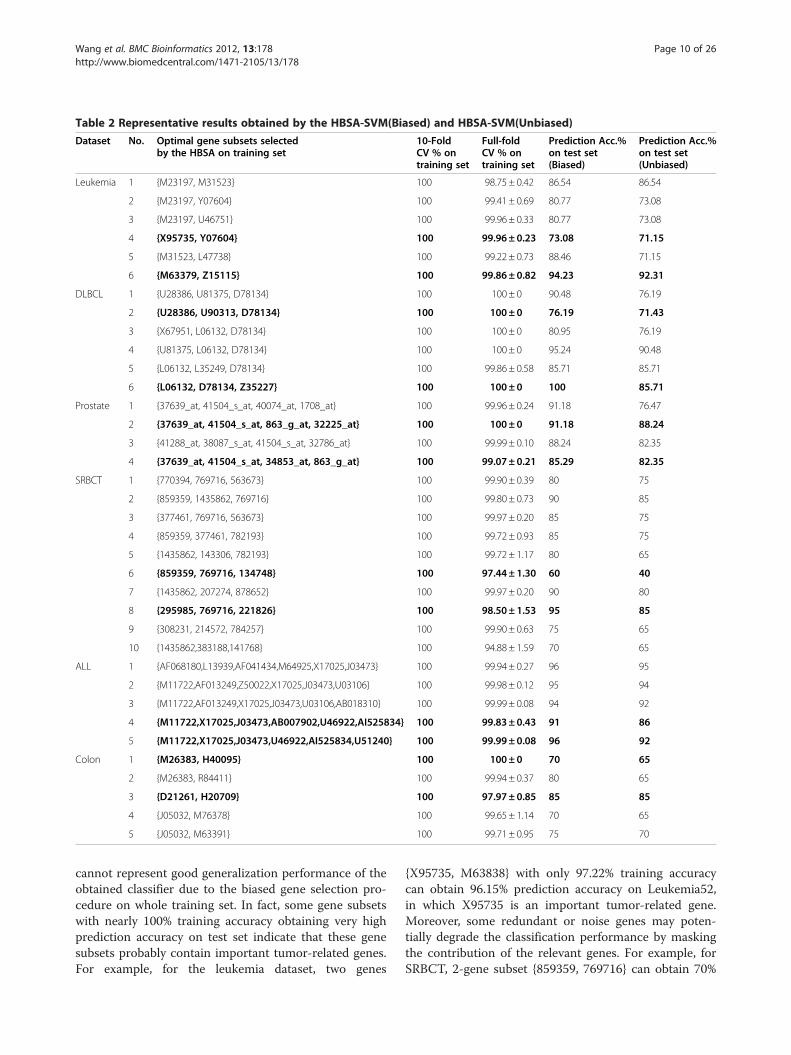
Table 2 Representative results obtained by the HBSA-SVM(Biased) and HBSA-SVM(Unbiased)
Dataset No. Optimal gene subsets selectedby the HBSA on training set
10-FoldCV % ontraining set
Full-foldCV % ontraining set
Prediction Acc.%on test set(Biased)
Prediction Acc.%on test set(Unbiased)
Leukemia 1 {M23197, M31523} 100 98.75 ± 0.42 86.54 86.54
2 {M23197, Y07604} 100 99.41 ± 0.69 80.77 73.08
3 {M23197, U46751} 100 99.96 ± 0.33 80.77 73.08
4 {X95735, Y07604} 100 99.96± 0.23 73.08 71.15
5 {M31523, L47738} 100 99.22 ± 0.73 88.46 71.15
6 {M63379, Z15115} 100 99.86± 0.82 94.23 92.31
DLBCL 1 {U28386, U81375, D78134} 100 100± 0 90.48 76.19
2 {U28386, U90313, D78134} 100 100± 0 76.19 71.43
3 {X67951, L06132, D78134} 100 100± 0 80.95 76.19
4 {U81375, L06132, D78134} 100 100± 0 95.24 90.48
5 {L06132, L35249, D78134} 100 99.86 ± 0.58 85.71 85.71
6 {L06132, D78134, Z35227} 100 100± 0 100 85.71
Prostate 1 {37639_at, 41504_s_at, 40074_at, 1708_at} 100 99.96 ± 0.24 91.18 76.47
2 {37639_at, 41504_s_at, 863_g_at, 32225_at} 100 100± 0 91.18 88.24
3 {41288_at, 38087_s_at, 41504_s_at, 32786_at} 100 99.99 ± 0.10 88.24 82.35
4 {37639_at, 41504_s_at, 34853_at, 863_g_at} 100 99.07± 0.21 85.29 82.35
SRBCT 1 {770394, 769716, 563673} 100 99.90 ± 0.39 80 75
2 {859359, 1435862, 769716} 100 99.80 ± 0.73 90 85
3 {377461, 769716, 563673} 100 99.97 ± 0.20 85 75
4 {859359, 377461, 782193} 100 99.72 ± 0.93 85 75
5 {1435862, 143306, 782193} 100 99.72 ± 1.17 80 65
6 {859359, 769716, 134748} 100 97.44± 1.30 60 40
7 {1435862, 207274, 878652} 100 99.97 ± 0.20 90 80
8 {295985, 769716, 221826} 100 98.50± 1.53 95 85
9 {308231, 214572, 784257} 100 99.90 ± 0.63 75 65
10 {1435862,383188,141768} 100 94.88 ± 1.59 70 65
ALL 1 {AF068180,L13939,AF041434,M64925,X17025,J03473} 100 99.94 ± 0.27 96 95
2 {M11722,AF013249,Z50022,X17025,J03473,U03106} 100 99.98 ± 0.12 95 94
3 {M11722,AF013249,X17025,J03473,U03106,AB018310} 100 99.99 ± 0.08 94 92
4 {M11722,X17025,J03473,AB007902,U46922,AI525834} 100 99.83± 0.43 91 86
5 {M11722,X17025,J03473,U46922,AI525834,U51240} 100 99.99± 0.08 96 92
Colon 1 {M26383, H40095} 100 100± 0 70 65
2 {M26383, R84411} 100 99.94 ± 0.37 80 65
3 {D21261, H20709} 100 97.97± 0.85 85 85
4 {J05032, M76378} 100 99.65 ± 1.14 70 65
5 {J05032, M63391} 100 99.71 ± 0.95 75 70
Wang et al. BMC Bioinformatics 2012, 13:178 Page 10 of 26http://www.biomedcentral.com/1471-2105/13/178
cannot represent good generalization performance of theobtained classifier due to the biased gene selection pro-cedure on whole training set. In fact, some gene subsetswith nearly 100% training accuracy obtaining very highprediction accuracy on test set indicate that these genesubsets probably contain important tumor-related genes.For example, for the leukemia dataset, two genes
{X95735, M63838} with only 97.22% training accuracycan obtain 96.15% prediction accuracy on Leukemia52,in which X95735 is an important tumor-related gene.Moreover, some redundant or noise genes may poten-tially degrade the classification performance by maskingthe contribution of the relevant genes. For example, forSRBCT, 2-gene subset {859359, 769716} can obtain 70%
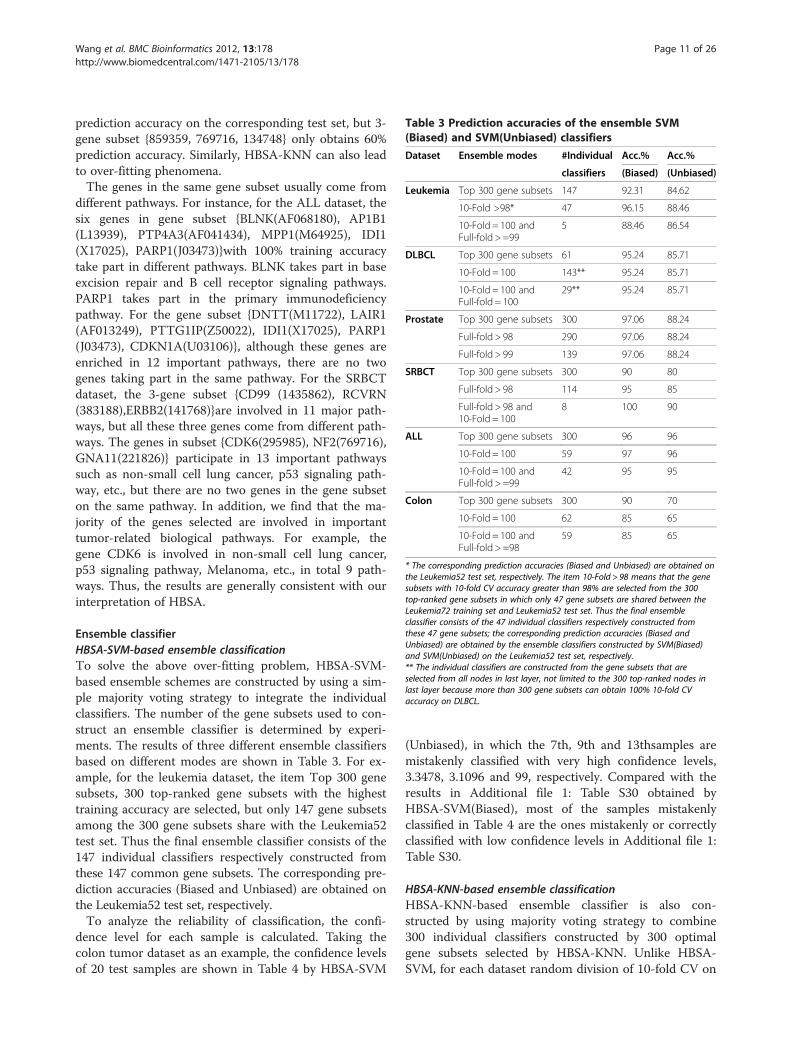
Table 3 Prediction accuracies of the ensemble SVM(Biased) and SVM(Unbiased) classifiers
Dataset Ensemble modes #Individual Acc.% Acc.%
classifiers (Biased) (Unbiased)
Leukemia Top 300 gene subsets 147 92.31 84.62
10-Fold >98* 47 96.15 88.46
10-Fold = 100 andFull-fold > =99
5 88.46 86.54
DLBCL Top 300 gene subsets 61 95.24 85.71
10-Fold = 100 143** 95.24 85.71
10-Fold = 100 andFull-fold = 100
29** 95.24 85.71
Prostate Top 300 gene subsets 300 97.06 88.24
Full-fold > 98 290 97.06 88.24
Full-fold > 99 139 97.06 88.24
SRBCT Top 300 gene subsets 300 90 80
Full-fold > 98 114 95 85
Full-fold > 98 and10-Fold = 100
8 100 90
ALL Top 300 gene subsets 300 96 96
10-Fold = 100 59 97 96
10-Fold = 100 andFull-fold > =99
42 95 95
Colon Top 300 gene subsets 300 90 70
10-Fold = 100 62 85 65
10-Fold = 100 andFull-fold > =98
59 85 65
* The corresponding prediction accuracies (Biased and Unbiased) are obtained onthe Leukemia52 test set, respectively. The item 10-Fold > 98 means that the genesubsets with 10-fold CV accuracy greater than 98% are selected from the 300top-ranked gene subsets in which only 47 gene subsets are shared between theLeukemia72 training set and Leukemia52 test set. Thus the final ensembleclassifier consists of the 47 individual classifiers respectively constructed fromthese 47 gene subsets; the corresponding prediction accuracies (Biased andUnbiased) are obtained by the ensemble classifiers constructed by SVM(Biased)and SVM(Unbiased) on the Leukemia52 test set, respectively.** The individual classifiers are constructed from the gene subsets that areselected from all nodes in last layer, not limited to the 300 top-ranked nodes inlast layer because more than 300 gene subsets can obtain 100% 10-fold CVaccuracy on DLBCL.
Wang et al. BMC Bioinformatics 2012, 13:178 Page 11 of 26http://www.biomedcentral.com/1471-2105/13/178
prediction accuracy on the corresponding test set, but 3-gene subset {859359, 769716, 134748} only obtains 60%prediction accuracy. Similarly, HBSA-KNN can also leadto over-fitting phenomena.The genes in the same gene subset usually come from
different pathways. For instance, for the ALL dataset, thesix genes in gene subset {BLNK(AF068180), AP1B1(L13939), PTP4A3(AF041434), MPP1(M64925), IDI1(X17025), PARP1(J03473)}with 100% training accuracytake part in different pathways. BLNK takes part in baseexcision repair and B cell receptor signaling pathways.PARP1 takes part in the primary immunodeficiencypathway. For the gene subset {DNTT(M11722), LAIR1(AF013249), PTTG1IP(Z50022), IDI1(X17025), PARP1(J03473), CDKN1A(U03106)}, although these genes areenriched in 12 important pathways, there are no twogenes taking part in the same pathway. For the SRBCTdataset, the 3-gene subset {CD99 (1435862), RCVRN(383188),ERBB2(141768)}are involved in 11 major path-ways, but all these three genes come from different path-ways. The genes in subset {CDK6(295985), NF2(769716),GNA11(221826)} participate in 13 important pathwayssuch as non-small cell lung cancer, p53 signaling path-way, etc., but there are no two genes in the gene subseton the same pathway. In addition, we find that the ma-jority of the genes selected are involved in importanttumor-related biological pathways. For example, thegene CDK6 is involved in non-small cell lung cancer,p53 signaling pathway, Melanoma, etc., in total 9 path-ways. Thus, the results are generally consistent with ourinterpretation of HBSA.
Ensemble classifierHBSA-SVM-based ensemble classificationTo solve the above over-fitting problem, HBSA-SVM-based ensemble schemes are constructed by using a sim-ple majority voting strategy to integrate the individualclassifiers. The number of the gene subsets used to con-struct an ensemble classifier is determined by experi-ments. The results of three different ensemble classifiersbased on different modes are shown in Table 3. For ex-ample, for the leukemia dataset, the item Top 300 genesubsets, 300 top-ranked gene subsets with the highesttraining accuracy are selected, but only 147 gene subsetsamong the 300 gene subsets share with the Leukemia52test set. Thus the final ensemble classifier consists of the147 individual classifiers respectively constructed fromthese 147 common gene subsets. The corresponding pre-diction accuracies (Biased and Unbiased) are obtained onthe Leukemia52 test set, respectively.To analyze the reliability of classification, the confi-
dence level for each sample is calculated. Taking thecolon tumor dataset as an example, the confidence levelsof 20 test samples are shown in Table 4 by HBSA-SVM
(Unbiased), in which the 7th, 9th and 13thsamples aremistakenly classified with very high confidence levels,3.3478, 3.1096 and 99, respectively. Compared with theresults in Additional file 1: Table S30 obtained byHBSA-SVM(Biased), most of the samples mistakenlyclassified in Table 4 are the ones mistakenly or correctlyclassified with low confidence levels in Additional file 1:Table S30.
HBSA-KNN-based ensemble classificationHBSA-KNN-based ensemble classifier is also con-structed by using majority voting strategy to combine300 individual classifiers constructed by 300 optimalgene subsets selected by HBSA-KNN. Unlike HBSA-SVM, for each dataset random division of 10-fold CV on
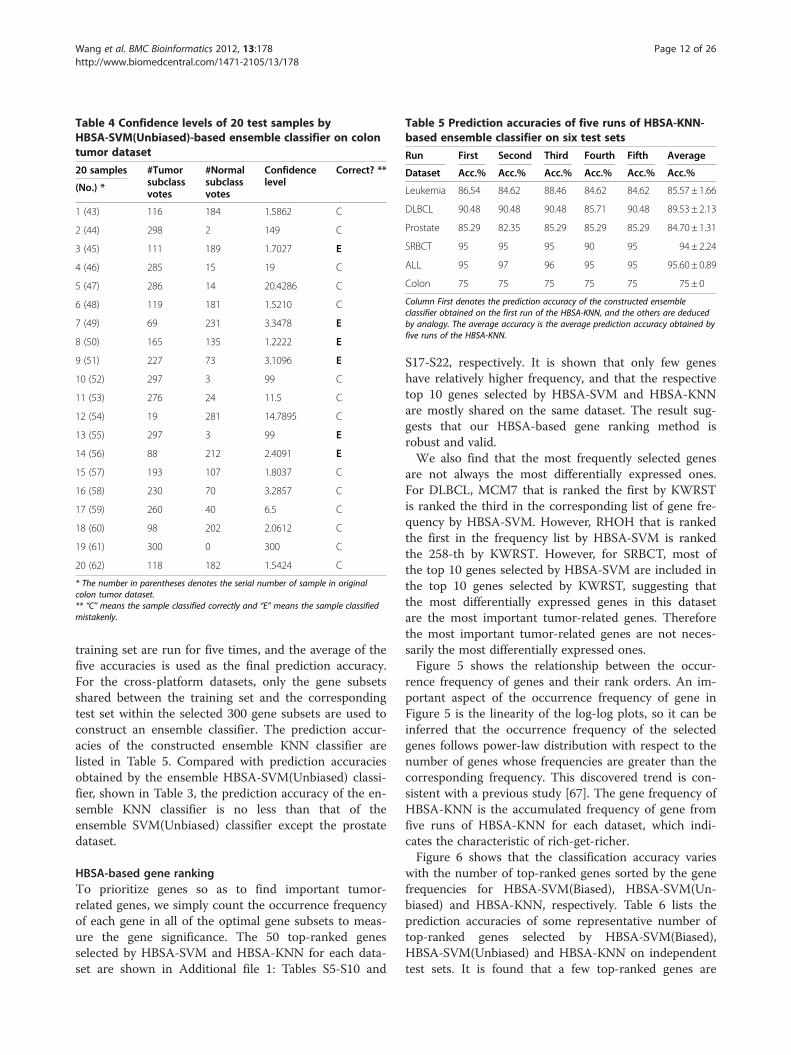
Table 4 Confidence levels of 20 test samples byHBSA-SVM(Unbiased)-based ensemble classifier on colontumor dataset
20 samples #Tumorsubclassvotes
#Normalsubclassvotes
Confidencelevel
Correct? **
(No.) *
1 (43) 116 184 1.5862 C
2 (44) 298 2 149 C
3 (45) 111 189 1.7027 E
4 (46) 285 15 19 C
5 (47) 286 14 20.4286 C
6 (48) 119 181 1.5210 C
7 (49) 69 231 3.3478 E
8 (50) 165 135 1.2222 E
9 (51) 227 73 3.1096 E
10 (52) 297 3 99 C
11 (53) 276 24 11.5 C
12 (54) 19 281 14.7895 C
13 (55) 297 3 99 E
14 (56) 88 212 2.4091 E
15 (57) 193 107 1.8037 C
16 (58) 230 70 3.2857 C
17 (59) 260 40 6.5 C
18 (60) 98 202 2.0612 C
19 (61) 300 0 300 C
20 (62) 118 182 1.5424 C
* The number in parentheses denotes the serial number of sample in originalcolon tumor dataset.** “C” means the sample classified correctly and “E” means the sample classifiedmistakenly.
Table 5 Prediction accuracies of five runs of HBSA-KNN-based ensemble classifier on six test sets
Run First Second Third Fourth Fifth Average
Dataset Acc.% Acc.% Acc.% Acc.% Acc.% Acc.%
Leukemia 86.54 84.62 88.46 84.62 84.62 85.57 ± 1.66
DLBCL 90.48 90.48 90.48 85.71 90.48 89.53 ± 2.13
Prostate 85.29 82.35 85.29 85.29 85.29 84.70 ± 1.31
SRBCT 95 95 95 90 95 94 ± 2.24
ALL 95 97 96 95 95 95.60 ± 0.89
Colon 75 75 75 75 75 75 ± 0
Column First denotes the prediction accuracy of the constructed ensembleclassifier obtained on the first run of the HBSA-KNN, and the others are deducedby analogy. The average accuracy is the average prediction accuracy obtained byfive runs of the HBSA-KNN.
Wang et al. BMC Bioinformatics 2012, 13:178 Page 12 of 26http://www.biomedcentral.com/1471-2105/13/178
training set are run for five times, and the average of thefive accuracies is used as the final prediction accuracy.For the cross-platform datasets, only the gene subsetsshared between the training set and the correspondingtest set within the selected 300 gene subsets are used toconstruct an ensemble classifier. The prediction accur-acies of the constructed ensemble KNN classifier arelisted in Table 5. Compared with prediction accuraciesobtained by the ensemble HBSA-SVM(Unbiased) classi-fier, shown in Table 3, the prediction accuracy of the en-semble KNN classifier is no less than that of theensemble SVM(Unbiased) classifier except the prostatedataset.
HBSA-based gene rankingTo prioritize genes so as to find important tumor-related genes, we simply count the occurrence frequencyof each gene in all of the optimal gene subsets to meas-ure the gene significance. The 50 top-ranked genesselected by HBSA-SVM and HBSA-KNN for each data-set are shown in Additional file 1: Tables S5-S10 and
S17-S22, respectively. It is shown that only few geneshave relatively higher frequency, and that the respectivetop 10 genes selected by HBSA-SVM and HBSA-KNNare mostly shared on the same dataset. The result sug-gests that our HBSA-based gene ranking method isrobust and valid.We also find that the most frequently selected genes
are not always the most differentially expressed ones.For DLBCL, MCM7 that is ranked the first by KWRSTis ranked the third in the corresponding list of gene fre-quency by HBSA-SVM. However, RHOH that is rankedthe first in the frequency list by HBSA-SVM is rankedthe 258-th by KWRST. However, for SRBCT, most ofthe top 10 genes selected by HBSA-SVM are included inthe top 10 genes selected by KWRST, suggesting thatthe most differentially expressed genes in this datasetare the most important tumor-related genes. Thereforethe most important tumor-related genes are not neces-sarily the most differentially expressed ones.Figure 5 shows the relationship between the occur-
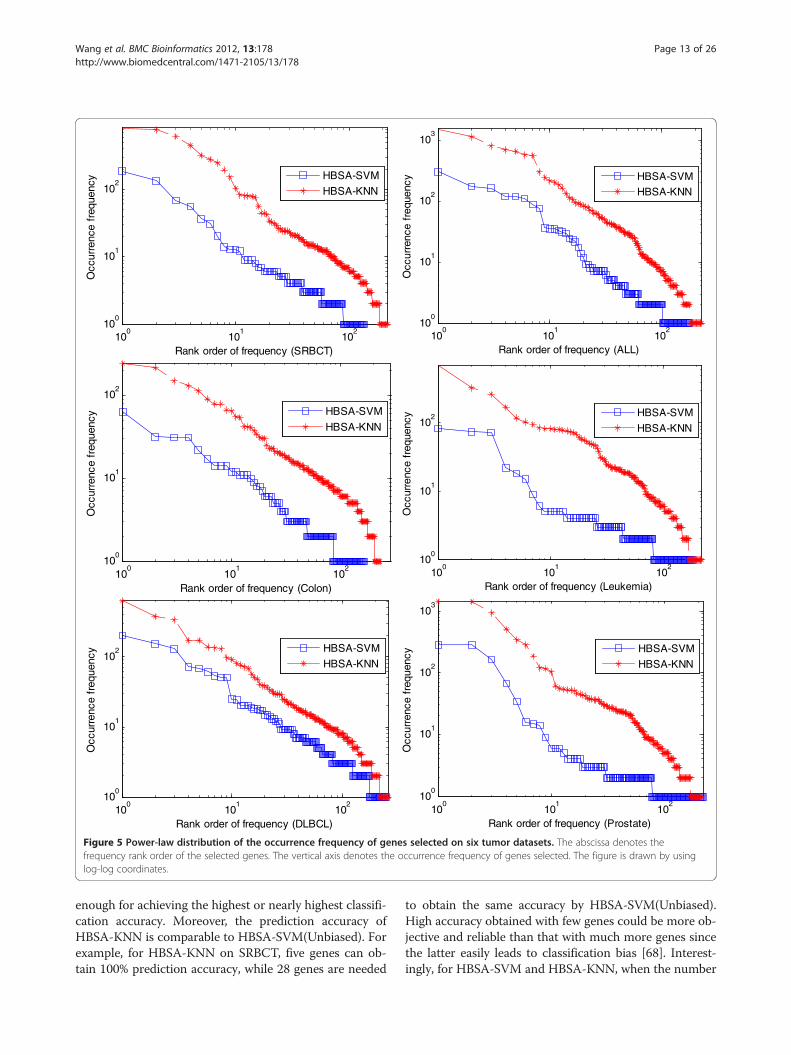
rence frequency of genes and their rank orders. An im-portant aspect of the occurrence frequency of gene inFigure 5 is the linearity of the log-log plots, so it can beinferred that the occurrence frequency of the selectedgenes follows power-law distribution with respect to thenumber of genes whose frequencies are greater than thecorresponding frequency. This discovered trend is con-sistent with a previous study [67]. The gene frequency ofHBSA-KNN is the accumulated frequency of gene fromfive runs of HBSA-KNN for each dataset, which indi-cates the characteristic of rich-get-richer.Figure 6 shows that the classification accuracy varies
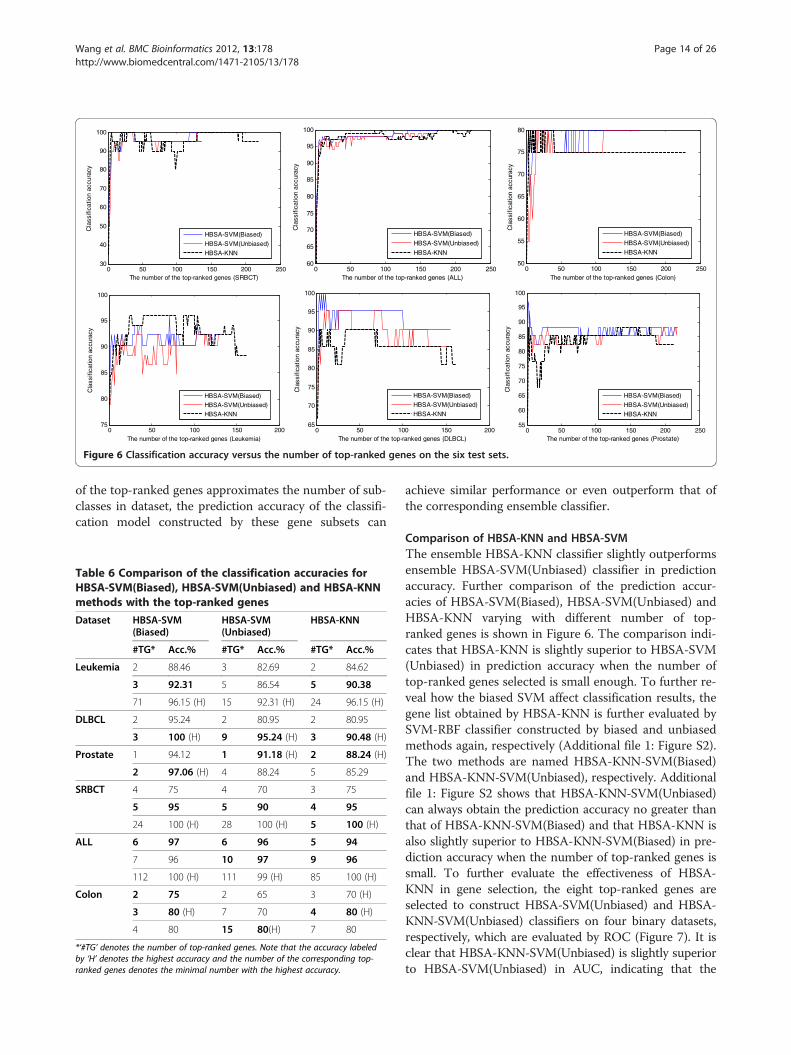
with the number of top-ranked genes sorted by the genefrequencies for HBSA-SVM(Biased), HBSA-SVM(Un-biased) and HBSA-KNN, respectively. Table 6 lists theprediction accuracies of some representative number oftop-ranked genes selected by HBSA-SVM(Biased),HBSA-SVM(Unbiased) and HBSA-KNN on independenttest sets. It is found that a few top-ranked genes are
100
101
102
100
101
102
Rank order of frequency (SRBCT)
Occ
urre
nce
freq
uenc
y HBSA-SVM
HBSA-KNN
100
101
102
100
101
102
103
Rank order of frequency (ALL)
Occ
urre
nce
freq
uenc
y HBSA-SVM
HBSA-KNN
100
101
102
100
101
102
Rank order of frequency (Colon)
Occ
urre
nce
freq
uenc
y HBSA-SVM
HBSA-KNN
100
101
102
100
101
102
Rank order of frequency (Leukemia)
Occ
urre
nce
freq
uenc
y HBSA-SVM
HBSA-KNN
100
101
102
100
101
102
Rank order of frequency (DLBCL)
Occ
urre
nce
freq
uenc
y HBSA-SVM
HBSA-KNN
100
101
102
100
101
102
103
Rank order of frequency (Prostate)
Occ
urre
nce
freq
uenc
y HBSA-SVM
HBSA-KNN
Figure 5 Power-law distribution of the occurrence frequency of genes selected on six tumor datasets. The abscissa denotes thefrequency rank order of the selected genes. The vertical axis denotes the occurrence frequency of genes selected. The figure is drawn by usinglog-log coordinates.
Wang et al. BMC Bioinformatics 2012, 13:178 Page 13 of 26http://www.biomedcentral.com/1471-2105/13/178
enough for achieving the highest or nearly highest classifi-cation accuracy. Moreover, the prediction accuracy ofHBSA-KNN is comparable to HBSA-SVM(Unbiased). Forexample, for HBSA-KNN on SRBCT, five genes can ob-tain 100% prediction accuracy, while 28 genes are needed
to obtain the same accuracy by HBSA-SVM(Unbiased).High accuracy obtained with few genes could be more ob-jective and reliable than that with much more genes sincethe latter easily leads to classification bias [68]. Interest-ingly, for HBSA-SVM and HBSA-KNN, when the number
0 50 100 150 200 25030
40
50
60
70
80
90
100
The number of the top-ranked genes (SRBCT)
Cla
ssifi
catio
n ac
cura
cy
HBSA-SVM(Biased)
HBSA-SVM(Unbiased)
HBSA-KNN
0 50 100 150 200 25060
65
70
75
80
85
90
95
100
The number of the top-ranked genes (ALL)
Cla
ssifi
catio
n ac
cura
cy
HBSA-SVM(Biased)
HBSA-SVM(Unbiased)
HBSA-KNN
0 50 100 150 200 25050
55
60
65
70
75
80
The number of the top-ranked genes (Colon)
Cla
ssifi
catio
n ac
cura
cy
HBSA-SVM(Biased)
HBSA-SVM(Unbiased)
HBSA-KNN
0 50 100 150 20075
80
85
90
95
100
The number of the top-ranked genes (Leukemia)
Cla
ssifi
catio
n ac
cura
cy
HBSA-SVM(Biased)
HBSA-SVM(Unbiased)
HBSA-KNN
0 50 100 150 20065
70
75
80
85
90
95
100
The number of the top-ranked genes (DLBCL)
Cla
ssifi
catio
n ac
cura
cy
HBSA-SVM(Biased)
HBSA-SVM(Unbiased)
HBSA-KNN
0 50 100 150 200 25055
60
65
70
75
80
85
90
95
100
The number of the top-ranked genes (Prostate)
Cla
ssifi
catio
n ac
cura
cy
HBSA-SVM(Biased)
HBSA-SVM(Unbiased)
HBSA-KNN
Figure 6 Classification accuracy versus the number of top-ranked genes on the six test sets..
Wang et al. BMC Bioinformatics 2012, 13:178 Page 14 of 26http://www.biomedcentral.com/1471-2105/13/178
of the top-ranked genes approximates the number of sub-classes in dataset, the prediction accuracy of the classifi-cation model constructed by these gene subsets can
Table 6 Comparison of the classification accuracies forHBSA-SVM(Biased), HBSA-SVM(Unbiased) and HBSA-KNNmethods with the top-ranked genes
Dataset HBSA-SVM(Biased)
HBSA-SVM(Unbiased)
HBSA-KNN
#TG* Acc.% #TG* Acc.% #TG* Acc.%
Leukemia 2 88.46 3 82.69 2 84.62
3 92.31 5 86.54 5 90.38
71 96.15 (H) 15 92.31 (H) 24 96.15 (H)
DLBCL 2 95.24 2 80.95 2 80.95
3 100 (H) 9 95.24 (H) 3 90.48 (H)
Prostate 1 94.12 1 91.18 (H) 2 88.24 (H)
2 97.06 (H) 4 88.24 5 85.29
SRBCT 4 75 4 70 3 75
5 95 5 90 4 95
24 100 (H) 28 100 (H) 5 100 (H)
ALL 6 97 6 96 5 94
7 96 10 97 9 96
112 100 (H) 111 99 (H) 85 100 (H)
Colon 2 75 2 65 3 70 (H)
3 80 (H) 7 70 4 80 (H)
4 80 15 80(H) 7 80
*‘#TG’ denotes the number of top-ranked genes. Note that the accuracy labeledby ‘H’ denotes the highest accuracy and the number of the corresponding top-ranked genes denotes the minimal number with the highest accuracy.
achieve similar performance or even outperform that ofthe corresponding ensemble classifier.
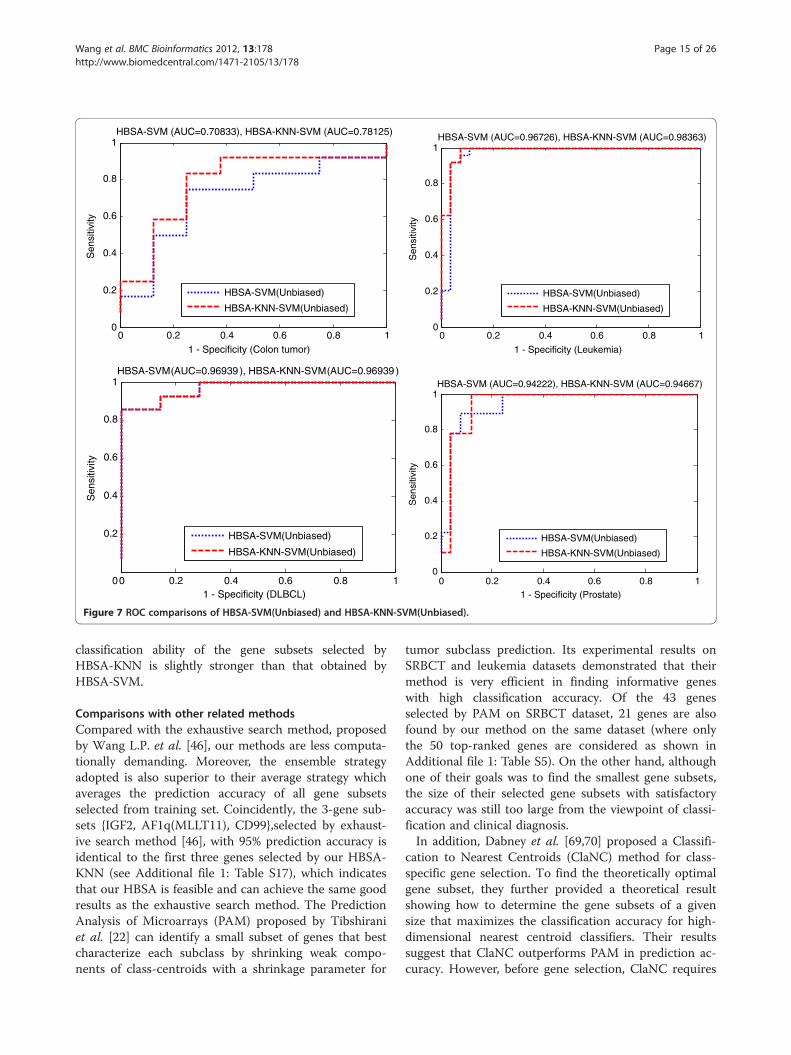
Comparison of HBSA-KNN and HBSA-SVMThe ensemble HBSA-KNN classifier slightly outperformsensemble HBSA-SVM(Unbiased) classifier in predictionaccuracy. Further comparison of the prediction accur-acies of HBSA-SVM(Biased), HBSA-SVM(Unbiased) andHBSA-KNN varying with different number of top-ranked genes is shown in Figure 6. The comparison indi-cates that HBSA-KNN is slightly superior to HBSA-SVM(Unbiased) in prediction accuracy when the number oftop-ranked genes selected is small enough. To further re-veal how the biased SVM affect classification results, thegene list obtained by HBSA-KNN is further evaluated bySVM-RBF classifier constructed by biased and unbiasedmethods again, respectively (Additional file 1: Figure S2).The two methods are named HBSA-KNN-SVM(Biased)and HBSA-KNN-SVM(Unbiased), respectively. Additionalfile 1: Figure S2 shows that HBSA-KNN-SVM(Unbiased)can always obtain the prediction accuracy no greater thanthat of HBSA-KNN-SVM(Biased) and that HBSA-KNN isalso slightly superior to HBSA-KNN-SVM(Biased) in pre-diction accuracy when the number of top-ranked genes issmall. To further evaluate the effectiveness of HBSA-KNN in gene selection, the eight top-ranked genes areselected to construct HBSA-SVM(Unbiased) and HBSA-KNN-SVM(Unbiased) classifiers on four binary datasets,respectively, which are evaluated by ROC (Figure 7). It isclear that HBSA-KNN-SVM(Unbiased) is slightly superiorto HBSA-SVM(Unbiased) in AUC, indicating that the
0 0.2 0.4 0.6 0.8 10
0.2
0.4
0.6
0.8
1HBSA-SVM (AUC=0.70833), HBSA-KNN-SVM (AUC=0.78125)
1 - Specificity (Colon tumor)
Sen
sitiv
ity
HBSA-SVM(Unbiased)
HBSA-KNN-SVM(Unbiased)
0 0.2 0.4 0.6 0.8 10
0.2
0.4
0.6
0.8
1HBSA-SVM (AUC=0.96726), HBSA-KNN-SVM (AUC=0.98363)
1 - Specificity (Leukemia)
Sen
sitiv
ity
HBSA-SVM(Unbiased)
HBSA-KNN-SVM(Unbiased)
0 0.2 0.4 0.6 0.8 10
0.2
0.4
0.6
0.8
1HBSA-SVM (AUC=0.96939 ), HBSA-KNN-SVM (AUC=0.96939 )
1 - Specificity (DLBCL)
Sen
sitiv
ity
HBSA-SVM(Unbiased)
HBSA-KNN-SVM(Unbiased)
0 0.2 0.4 0.6 0.8 10
0.2
0.4
0.6
0.8
1HBSA-SVM (AUC=0.94222), HBSA-KNN-SVM (AUC=0.94667)
1 - Specificity (Prostate)
Sen
sitiv
ity
HBSA-SVM(Unbiased)
HBSA-KNN-SVM(Unbiased)
Figure 7 ROC comparisons of HBSA-SVM(Unbiased) and HBSA-KNN-SVM(Unbiased)..
Wang et al. BMC Bioinformatics 2012, 13:178 Page 15 of 26http://www.biomedcentral.com/1471-2105/13/178
classification ability of the gene subsets selected byHBSA-KNN is slightly stronger than that obtained byHBSA-SVM.
Comparisons with other related methodsCompared with the exhaustive search method, proposedby Wang L.P. et al. [46], our methods are less computa-tionally demanding. Moreover, the ensemble strategyadopted is also superior to their average strategy whichaverages the prediction accuracy of all gene subsetsselected from training set. Coincidently, the 3-gene sub-sets {IGF2, AF1q(MLLT11), CD99},selected by exhaust-ive search method [46], with 95% prediction accuracy isidentical to the first three genes selected by our HBSA-KNN (see Additional file 1: Table S17), which indicatesthat our HBSA is feasible and can achieve the same goodresults as the exhaustive search method. The PredictionAnalysis of Microarrays (PAM) proposed by Tibshiraniet al. [22] can identify a small subset of genes that bestcharacterize each subclass by shrinking weak compo-nents of class-centroids with a shrinkage parameter for
tumor subclass prediction. Its experimental results onSRBCT and leukemia datasets demonstrated that theirmethod is very efficient in finding informative geneswith high classification accuracy. Of the 43 genesselected by PAM on SRBCT dataset, 21 genes are alsofound by our method on the same dataset (where onlythe 50 top-ranked genes are considered as shown inAdditional file 1: Table S5). On the other hand, althoughone of their goals was to find the smallest gene subsets,the size of their selected gene subsets with satisfactoryaccuracy was still too large from the viewpoint of classi-fication and clinical diagnosis.In addition, Dabney et al. [69,70] proposed a Classifi-
cation to Nearest Centroids (ClaNC) method for class-specific gene selection. To find the theoretically optimalgene subset, they further provided a theoretical resultshowing how to determine the gene subsets of a givensize that maximizes the classification accuracy for high-dimensional nearest centroid classifiers. Their resultssuggest that ClaNC outperforms PAM in prediction ac-curacy. However, before gene selection, ClaNC requires
Wang et al. BMC Bioinformatics 2012, 13:178 Page 16 of 26http://www.biomedcentral.com/1471-2105/13/178
a given number of genes, which is difficult to determinehow many genes are appropriate.Our method is similar to PAM and ClaNC methods in
three aspects. 1) Find minimum gene subsets with max-imum accuracy. 2) Consider the discriminative power ofmultiple genes when searching for gene subsets. 3) Seekthe simplest method with biomedical interpretability.To achieve more objective comparison, the classifica-
tion performance of PAM, ClaNC and our method areobtained on the two cross-platform datasets (leukemiaand DLBCL) that are realigned by those shared genesbetween the training set and the corresponding test set,respectively. For the leukemia dataset, 4606 genes areshared between Leukemia72 and Leukemia52. ForDLBCL, 4072 genes are shared between DLBCL77 andDLBCL21.Since HBSA-KNN is slightly superior to HBSA-SVM
(Unbiased) in gene selection, we just compare HBSA-KNN with PAM and ClaNC methods in prediction ac-curacy. The conclusion from the comparisons of theclassification accuracy, shown in Table 7, is that al-though ClaNC outperforms PAM in accuracy, the accur-acy obtained by ClaNC is lower than ours on all sixindependent test sets when the number of the top-ranked genes selected is small enough, i.e., when the sizeof the selected gene subset approximately satisfies (4) asshown in Table 7. For example, for ALL (six subclasses),when the number of the top-ranked genes selected byHBSA-KNN is five, 94% prediction accuracy can beobtained, while ClaNC obtains only 86% accuracy withsix genes (one gene selected per subclass). For SRBCT(four subclasses), our method obtain 100% prediction ac-curacy with only five genes, while eight genes (two genesselected per subclass) are needed to obtain 95%predic-tion accuracy by ClaNC. For the prostate dataset (twosubclasses), our method obtains 88.24% accuracy withtwo genes, while only 74% accuracy is obtained by ClaNCwith the same number of genes. Obviously, our methodcan achieve higher accuracy with the same or fewer top-ranked genes. From Table 7 we can see that the PAMmethod does not performs well in the classification ofsome cross-platform datasets because the same accuracyis obtained when different number of genes for theDLBCL and Prostate cross-platform datasets are used,which are possibly caused by the fact that the cross-platform training set and test set are not on the samemeasurement scale.Note that the prediction accuracy may be affected by
different data normalization methods. The results inTable 7 are obtained with the z-score normalizationmethod on the tumor datasets. If we use another 0–1normalization method that scales all data into the rangeof [0, 1] with the formula (x−min(x))/(max (x)−min(x)),where x is a vector that denotes a set of expression values
of a gene in different samples, the results may vary withthe same gene subset as shown in Table 7 and Additionalfile 1: Table S29. For example, for the leukemia dataset,the first three genes obtain 94.23% prediction accuracyon the Leukemia52 test set with the former z-scoremethod, but the same three genes can obtain 98.08% pre-diction accuracy with the latter 0–1 normalization. Theprediction accuracies of PAM and ClaNC methods areobviously improved on the cross-platform prostate data-set normalized with 0–1 normalization method, but theprediction accuracy becomes worse on the leukemiadataset similarly normalized. The results with 0–1normalization also indicate that our method is still super-ior to PAM and ClaNC in prediction accuracy when thenumber of top-ranked genes is small enough.We further compare HBSA-KNN-based gene ranking
method with the other two well-known gene rankingmethods: Kruskal-Wallis rank sum test (KWRST) andRelief-F [71]. The results in Figure 8 show that ourmethod consistently outperforms KWRST and Relief-Fin prediction accuracy when the number of top-rankedgenes is small enough. Although for the prostate datasetonly top two genes obtain high prediction accuracy(88.24%) that is obviously greater than that of KWRSTand Relief-F with the same number of genes, ourmethod is still effective because this case still conformsto our goal that the most important tumor-related geneis ranked first. However, our method aims at finding asmany more important tumor-related genes as possible,even though the important genes might include redun-dant ones from the viewpoint of classification. Thus theprediction accuracy might be worse as the number oftop-ranked genes increases. For example, the predictionaccuracy curves of leukemia and prostate in Figure 8 ap-pear the situation.Moreover, better results can be achieved with more
pre-selected genes by KWRST and with an acceptablesearch breadth increased in HBSA. For example, on thecross platform leukemia dataset, with the top 400 genespre-selected by KWRST and the search breadth w of450, the top eight genes selected by HBSA-KNN are{L09209, M23197, M11722, X95735, HG1612-HT1612,X62654, U77948, M31523} in which three genes L09209,HG1612-HT1612 and X62654 are not in the Leukemia52 test set. Among these shared genes, the set of the topthree genes {M23197, M11722, X95735} obtains 94.23%prediction accuracy on the independent test set, and thetop five genes {M23197, M11722, X95735, U77948,M31523} and the top 84 genes can result in 96.15% and98.08% prediction accuracies, respectively. More import-antly, these important genes selected with this searchbreadth are shared with those genes shown in Additionalfile 1: Table S21. For the ALL dataset, the top eightgenes selected by HBSA-KNN are {36985_at, 38242_at,
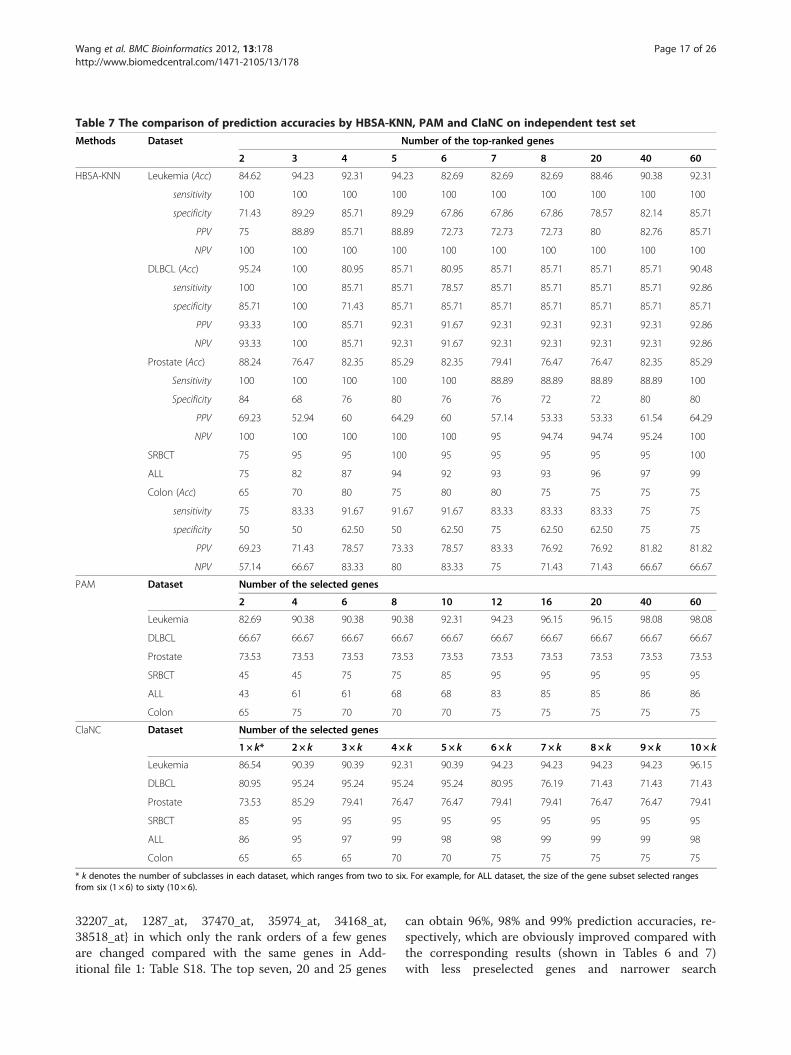
Table 7 The comparison of prediction accuracies by HBSA-KNN, PAM and ClaNC on independent test set
Methods Dataset Number of the top-ranked genes
2 3 4 5 6 7 8 20 40 60
HBSA-KNN Leukemia (Acc) 84.62 94.23 92.31 94.23 82.69 82.69 82.69 88.46 90.38 92.31
sensitivity 100 100 100 100 100 100 100 100 100 100
specificity 71.43 89.29 85.71 89.29 67.86 67.86 67.86 78.57 82.14 85.71
PPV 75 88.89 85.71 88.89 72.73 72.73 72.73 80 82.76 85.71
NPV 100 100 100 100 100 100 100 100 100 100
DLBCL (Acc) 95.24 100 80.95 85.71 80.95 85.71 85.71 85.71 85.71 90.48
sensitivity 100 100 85.71 85.71 78.57 85.71 85.71 85.71 85.71 92.86
specificity 85.71 100 71.43 85.71 85.71 85.71 85.71 85.71 85.71 85.71
PPV 93.33 100 85.71 92.31 91.67 92.31 92.31 92.31 92.31 92.86
NPV 93.33 100 85.71 92.31 91.67 92.31 92.31 92.31 92.31 92.86
Prostate (Acc) 88.24 76.47 82.35 85.29 82.35 79.41 76.47 76.47 82.35 85.29
Sensitivity 100 100 100 100 100 88.89 88.89 88.89 88.89 100
Specificity 84 68 76 80 76 76 72 72 80 80
PPV 69.23 52.94 60 64.29 60 57.14 53.33 53.33 61.54 64.29
NPV 100 100 100 100 100 95 94.74 94.74 95.24 100
SRBCT 75 95 95 100 95 95 95 95 95 100
ALL 75 82 87 94 92 93 93 96 97 99
Colon (Acc) 65 70 80 75 80 80 75 75 75 75
sensitivity 75 83.33 91.67 91.67 91.67 83.33 83.33 83.33 75 75
specificity 50 50 62.50 50 62.50 75 62.50 62.50 75 75
PPV 69.23 71.43 78.57 73.33 78.57 83.33 76.92 76.92 81.82 81.82
NPV 57.14 66.67 83.33 80 83.33 75 71.43 71.43 66.67 66.67
PAM Dataset Number of the selected genes
2 4 6 8 10 12 16 20 40 60
Leukemia 82.69 90.38 90.38 90.38 92.31 94.23 96.15 96.15 98.08 98.08
DLBCL 66.67 66.67 66.67 66.67 66.67 66.67 66.67 66.67 66.67 66.67
Prostate 73.53 73.53 73.53 73.53 73.53 73.53 73.53 73.53 73.53 73.53
SRBCT 45 45 75 75 85 95 95 95 95 95
ALL 43 61 61 68 68 83 85 85 86 86
Colon 65 75 70 70 70 75 75 75 75 75
ClaNC Dataset Number of the selected genes
1× k* 2 × k 3× k 4× k 5 × k 6× k 7× k 8× k 9× k 10× k
Leukemia 86.54 90.39 90.39 92.31 90.39 94.23 94.23 94.23 94.23 96.15
DLBCL 80.95 95.24 95.24 95.24 95.24 80.95 76.19 71.43 71.43 71.43
Prostate 73.53 85.29 79.41 76.47 76.47 79.41 79.41 76.47 76.47 79.41
SRBCT 85 95 95 95 95 95 95 95 95 95
ALL 86 95 97 99 98 98 99 99 99 98
Colon 65 65 65 70 70 75 75 75 75 75
* k denotes the number of subclasses in each dataset, which ranges from two to six. For example, for ALL dataset, the size of the gene subset selected rangesfrom six (1 × 6) to sixty (10 × 6).
Wang et al. BMC Bioinformatics 2012, 13:178 Page 17 of 26http://www.biomedcentral.com/1471-2105/13/178
32207_at, 1287_at, 37470_at, 35974_at, 34168_at,38518_at} in which only the rank orders of a few genesare changed compared with the same genes in Add-itional file 1: Table S18. The top seven, 20 and 25 genes
can obtain 96%, 98% and 99% prediction accuracies, re-spectively, which are obviously improved compared withthe corresponding results (shown in Tables 6 and 7)with less preselected genes and narrower search
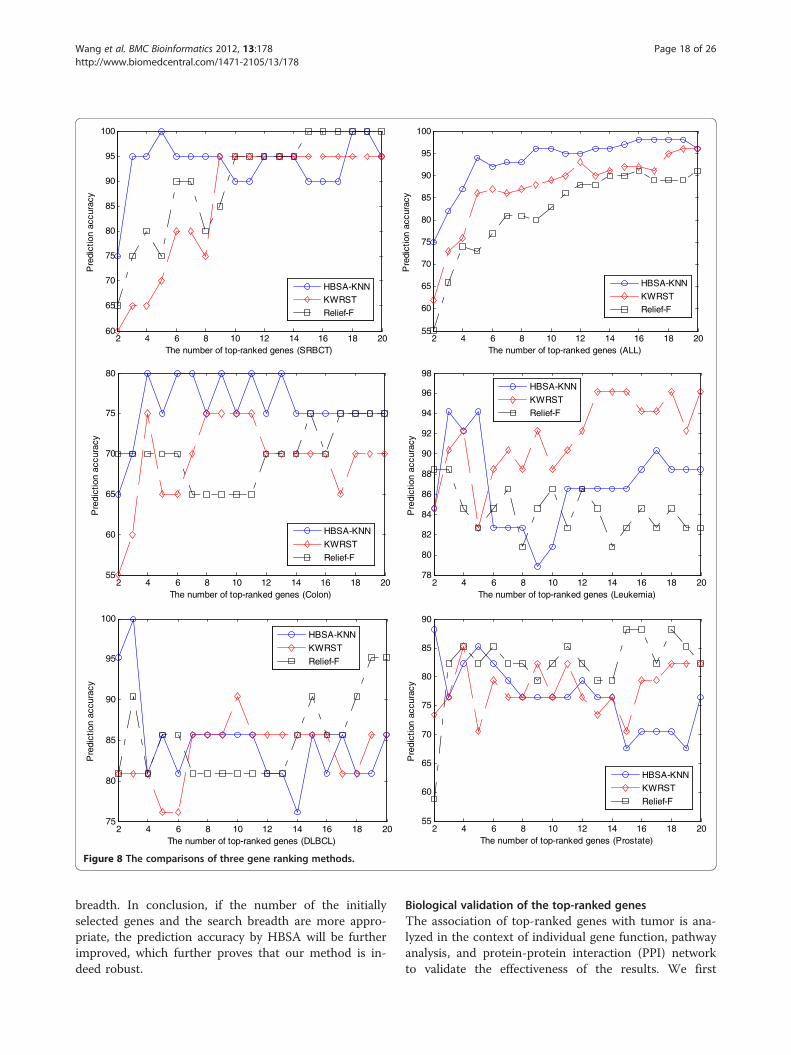
2 4 6 8 10 12 14 16 18 2060
65
70
75
80
85
90
95
100
The number of top-ranked genes (SRBCT)
Pre
dict
ion
accu
racy
HBSA-KNN
KWRST
Relief-F
2 4 6 8 10 12 14 16 18 2055
60
65
70
75
80
85
90
95
100
The number of top-ranked genes (ALL)
Pre
dict
ion
accu
racy
HBSA-KNN
KWRST
Relief-F
2 4 6 8 10 12 14 16 18 2055
60
65
70
75
80
The number of top-ranked genes (Colon)
Pre
dict
ion
accu
racy
HBSA-KNN
KWRST
Relief-F
2 4 6 8 10 12 14 16 18 2078
80
82
84
86
88
90
92
94
96
98
The number of top-ranked genes (Leukemia)
Pre
dict
ion
accu
racy
HBSA-KNN
KWRST
Relief-F
2 4 6 8 10 12 14 16 18 2075
80
85
90
95
100
The number of top-ranked genes (DLBCL)
Pre
dict
ion
accu
racy
HBSA-KNN
KWRST
Relief-F
2 4 6 8 10 12 14 16 18 2055
60
65
70
75
80
85
90
The number of top-ranked genes (Prostate)
Pre
dict
ion
accu
racy
HBSA-KNN
KWRST
Relief-F
Figure 8 The comparisons of three gene ranking methods..
Wang et al. BMC Bioinformatics 2012, 13:178 Page 18 of 26http://www.biomedcentral.com/1471-2105/13/178
breadth. In conclusion, if the number of the initiallyselected genes and the search breadth are more appro-priate, the prediction accuracy by HBSA will be furtherimproved, which further proves that our method is in-deed robust.
Biological validation of the top-ranked genesThe association of top-ranked genes with tumor is ana-lyzed in the context of individual gene function, pathwayanalysis, and protein-protein interaction (PPI) networkto validate the effectiveness of the results. We first
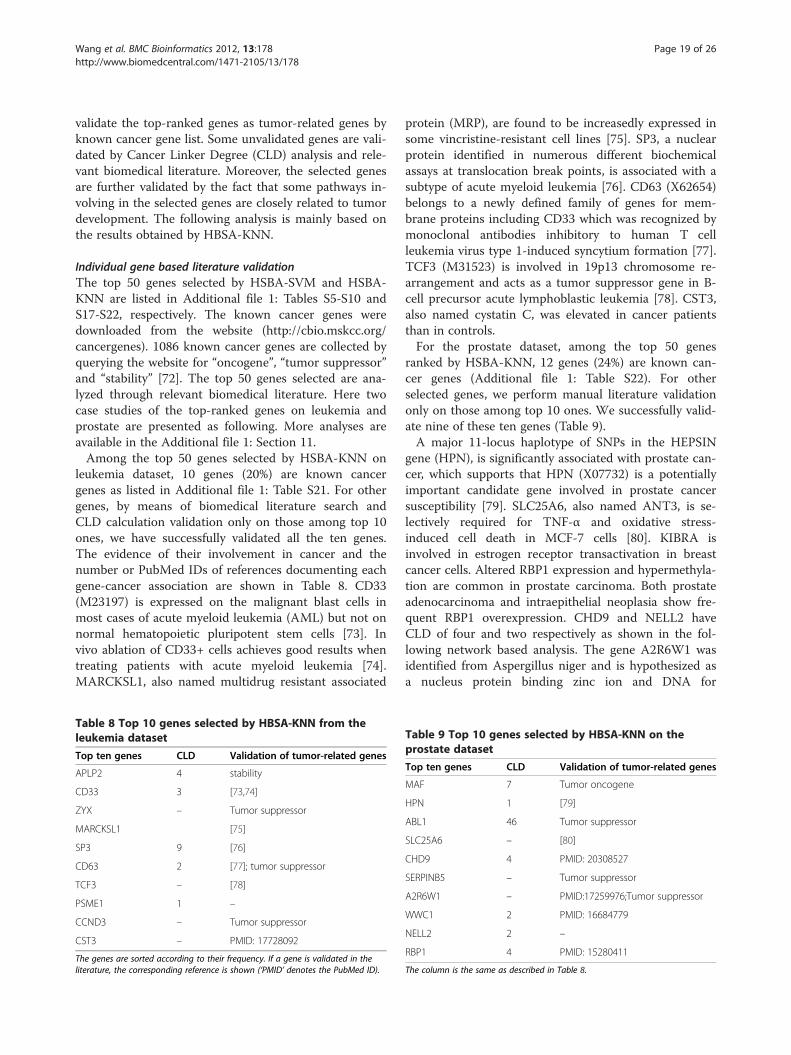
Wang et al. BMC Bioinformatics 2012, 13:178 Page 19 of 26http://www.biomedcentral.com/1471-2105/13/178
validate the top-ranked genes as tumor-related genes byknown cancer gene list. Some unvalidated genes are vali-dated by Cancer Linker Degree (CLD) analysis and rele-vant biomedical literature. Moreover, the selected genesare further validated by the fact that some pathways in-volving in the selected genes are closely related to tumordevelopment. The following analysis is mainly based onthe results obtained by HBSA-KNN.
Individual gene based literature validationThe top 50 genes selected by HSBA-SVM and HSBA-KNN are listed in Additional file 1: Tables S5-S10 andS17-S22, respectively. The known cancer genes weredownloaded from the website (http://cbio.mskcc.org/cancergenes). 1086 known cancer genes are collected byquerying the website for “oncogene”, “tumor suppressor”and “stability” [72]. The top 50 genes selected are ana-lyzed through relevant biomedical literature. Here twocase studies of the top-ranked genes on leukemia andprostate are presented as following. More analyses areavailable in the Additional file 1: Section 11.Among the top 50 genes selected by HSBA-KNN on
leukemia dataset, 10 genes (20%) are known cancergenes as listed in Additional file 1: Table S21. For othergenes, by means of biomedical literature search andCLD calculation validation only on those among top 10ones, we have successfully validated all the ten genes.The evidence of their involvement in cancer and thenumber or PubMed IDs of references documenting eachgene-cancer association are shown in Table 8. CD33(M23197) is expressed on the malignant blast cells inmost cases of acute myeloid leukemia (AML) but not onnormal hematopoietic pluripotent stem cells [73]. Invivo ablation of CD33+ cells achieves good results whentreating patients with acute myeloid leukemia [74].MARCKSL1, also named multidrug resistant associated
Table 8 Top 10 genes selected by HBSA-KNN from theleukemia dataset
Top ten genes CLD Validation of tumor-related genes
APLP2 4 stability
CD33 3 [73,74]
ZYX – Tumor suppressor
MARCKSL1 [75]
SP3 9 [76]
CD63 2 [77]; tumor suppressor
TCF3 – [78]
PSME1 1 –
CCND3 – Tumor suppressor
CST3 – PMID: 17728092
The genes are sorted according to their frequency. If a gene is validated in theliterature, the corresponding reference is shown (‘PMID’ denotes the PubMed ID).
protein (MRP), are found to be increasedly expressed insome vincristine-resistant cell lines [75]. SP3, a nuclearprotein identified in numerous different biochemicalassays at translocation break points, is associated with asubtype of acute myeloid leukemia [76]. CD63 (X62654)belongs to a newly defined family of genes for mem-brane proteins including CD33 which was recognized bymonoclonal antibodies inhibitory to human T cellleukemia virus type 1-induced syncytium formation [77].TCF3 (M31523) is involved in 19p13 chromosome re-arrangement and acts as a tumor suppressor gene in B-cell precursor acute lymphoblastic leukemia [78]. CST3,also named cystatin C, was elevated in cancer patientsthan in controls.For the prostate dataset, among the top 50 genes
ranked by HSBA-KNN, 12 genes (24%) are known can-cer genes (Additional file 1: Table S22). For otherselected genes, we perform manual literature validationonly on those among top 10 ones. We successfully valid-ate nine of these ten genes (Table 9).A major 11-locus haplotype of SNPs in the HEPSIN
gene (HPN), is significantly associated with prostate can-cer, which supports that HPN (X07732) is a potentiallyimportant candidate gene involved in prostate cancersusceptibility [79]. SLC25A6, also named ANT3, is se-lectively required for TNF-α and oxidative stress-induced cell death in MCF-7 cells [80]. KIBRA isinvolved in estrogen receptor transactivation in breastcancer cells. Altered RBP1 expression and hypermethyla-tion are common in prostate carcinoma. Both prostateadenocarcinoma and intraepithelial neoplasia show fre-quent RBP1 overexpression. CHD9 and NELL2 haveCLD of four and two respectively as shown in the fol-lowing network based analysis. The gene A2R6W1 wasidentified from Aspergillus niger and is hypothesized asa nucleus protein binding zinc ion and DNA for
Table 9 Top 10 genes selected by HBSA-KNN on theprostate dataset
Top ten genes CLD Validation of tumor-related genes
MAF 7 Tumor oncogene
HPN 1 [79]
ABL1 46 Tumor suppressor
SLC25A6 – [80]
CHD9 4 PMID: 20308527
SERPINB5 – Tumor suppressor
A2R6W1 – PMID:17259976;Tumor suppressor
WWC1 2 PMID: 16684779
NELL2 2 –
RBP1 4 PMID: 15280411
The column is the same as described in Table 8.
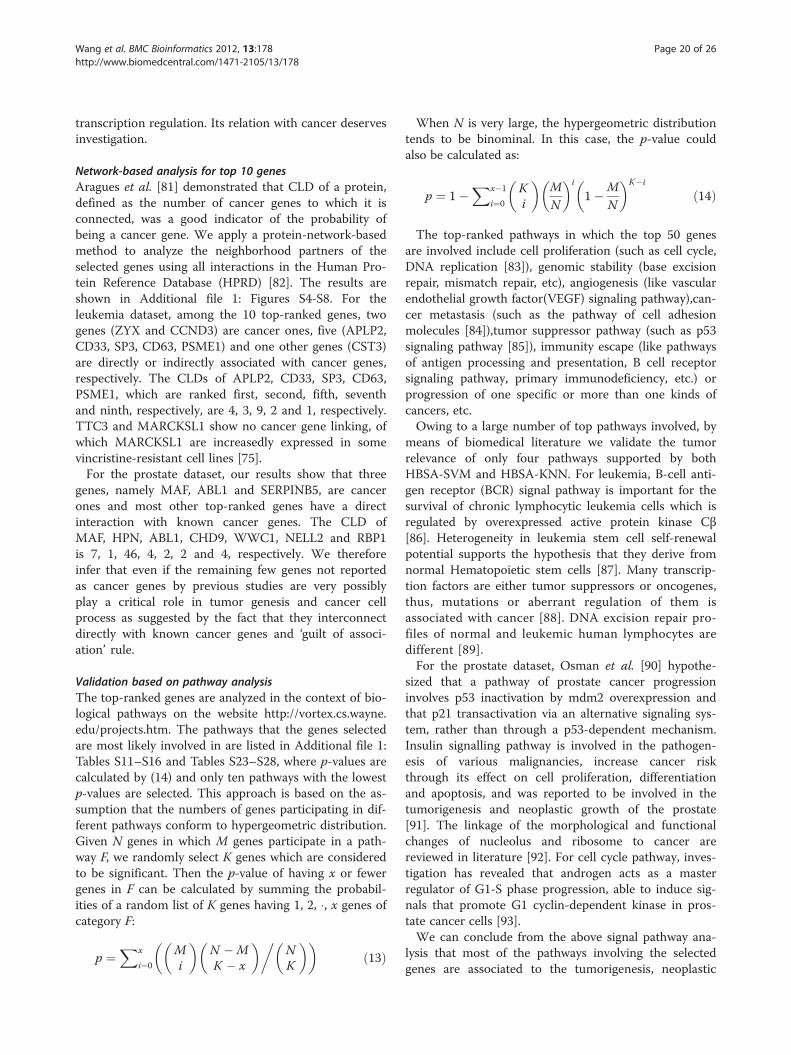
Wang et al. BMC Bioinformatics 2012, 13:178 Page 20 of 26http://www.biomedcentral.com/1471-2105/13/178
transcription regulation. Its relation with cancer deservesinvestigation.
Network-based analysis for top 10 genesAragues et al. [81] demonstrated that CLD of a protein,defined as the number of cancer genes to which it isconnected, was a good indicator of the probability ofbeing a cancer gene. We apply a protein-network-basedmethod to analyze the neighborhood partners of theselected genes using all interactions in the Human Pro-tein Reference Database (HPRD) [82]. The results areshown in Additional file 1: Figures S4-S8. For theleukemia dataset, among the 10 top-ranked genes, twogenes (ZYX and CCND3) are cancer ones, five (APLP2,CD33, SP3, CD63, PSME1) and one other genes (CST3)are directly or indirectly associated with cancer genes,respectively. The CLDs of APLP2, CD33, SP3, CD63,PSME1, which are ranked first, second, fifth, seventhand ninth, respectively, are 4, 3, 9, 2 and 1, respectively.TTC3 and MARCKSL1 show no cancer gene linking, ofwhich MARCKSL1 are increasedly expressed in somevincristine-resistant cell lines [75].For the prostate dataset, our results show that three
genes, namely MAF, ABL1 and SERPINB5, are cancerones and most other top-ranked genes have a directinteraction with known cancer genes. The CLD ofMAF, HPN, ABL1, CHD9, WWC1, NELL2 and RBP1is 7, 1, 46, 4, 2, 2 and 4, respectively. We thereforeinfer that even if the remaining few genes not reportedas cancer genes by previous studies are very possiblyplay a critical role in tumor genesis and cancer cellprocess as suggested by the fact that they interconnectdirectly with known cancer genes and ‘guilt of associ-ation’ rule.
Validation based on pathway analysisThe top-ranked genes are analyzed in the context of bio-logical pathways on the website http://vortex.cs.wayne.edu/projects.htm. The pathways that the genes selectedare most likely involved in are listed in Additional file 1:Tables S11–S16 and Tables S23–S28, where p-values arecalculated by (14) and only ten pathways with the lowestp-values are selected. This approach is based on the as-sumption that the numbers of genes participating in dif-ferent pathways conform to hypergeometric distribution.Given N genes in which M genes participate in a path-way F, we randomly select K genes which are consideredto be significant. Then the p-value of having x or fewergenes in F can be calculated by summing the probabil-ities of a random list of K genes having 1, 2, �, x genes ofcategory F:
p ¼Xx
i¼0
Mi
� �N �MK � x
� �NK
� �� �ð13Þ
When N is very large, the hypergeometric distributiontends to be binominal. In this case, the p-value couldalso be calculated as:
p ¼ 1�Xx�1
i¼0
Ki
� �MN
� �i
1�MN
� �K�i
ð14Þ
The top-ranked pathways in which the top 50 genesare involved include cell proliferation (such as cell cycle,DNA replication [83]), genomic stability (base excisionrepair, mismatch repair, etc), angiogenesis (like vascularendothelial growth factor(VEGF) signaling pathway),can-cer metastasis (such as the pathway of cell adhesionmolecules [84]),tumor suppressor pathway (such as p53signaling pathway [85]), immunity escape (like pathwaysof antigen processing and presentation, B cell receptorsignaling pathway, primary immunodeficiency, etc.) orprogression of one specific or more than one kinds ofcancers, etc.Owing to a large number of top pathways involved, by
means of biomedical literature we validate the tumorrelevance of only four pathways supported by bothHBSA-SVM and HBSA-KNN. For leukemia, B-cell anti-gen receptor (BCR) signal pathway is important for thesurvival of chronic lymphocytic leukemia cells which isregulated by overexpressed active protein kinase Cβ[86]. Heterogeneity in leukemia stem cell self-renewalpotential supports the hypothesis that they derive fromnormal Hematopoietic stem cells [87]. Many transcrip-tion factors are either tumor suppressors or oncogenes,thus, mutations or aberrant regulation of them isassociated with cancer [88]. DNA excision repair pro-files of normal and leukemic human lymphocytes aredifferent [89].For the prostate dataset, Osman et al. [90] hypothe-
sized that a pathway of prostate cancer progressioninvolves p53 inactivation by mdm2 overexpression andthat p21 transactivation via an alternative signaling sys-tem, rather than through a p53-dependent mechanism.Insulin signalling pathway is involved in the pathogen-esis of various malignancies, increase cancer riskthrough its effect on cell proliferation, differentiationand apoptosis, and was reported to be involved in thetumorigenesis and neoplastic growth of the prostate[91]. The linkage of the morphological and functionalchanges of nucleolus and ribosome to cancer arereviewed in literature [92]. For cell cycle pathway, inves-tigation has revealed that androgen acts as a masterregulator of G1-S phase progression, able to induce sig-nals that promote G1 cyclin-dependent kinase in pros-tate cancer cells [93].We can conclude from the above signal pathway ana-
lysis that most of the pathways involving the selectedgenes are associated to the tumorigenesis, neoplastic
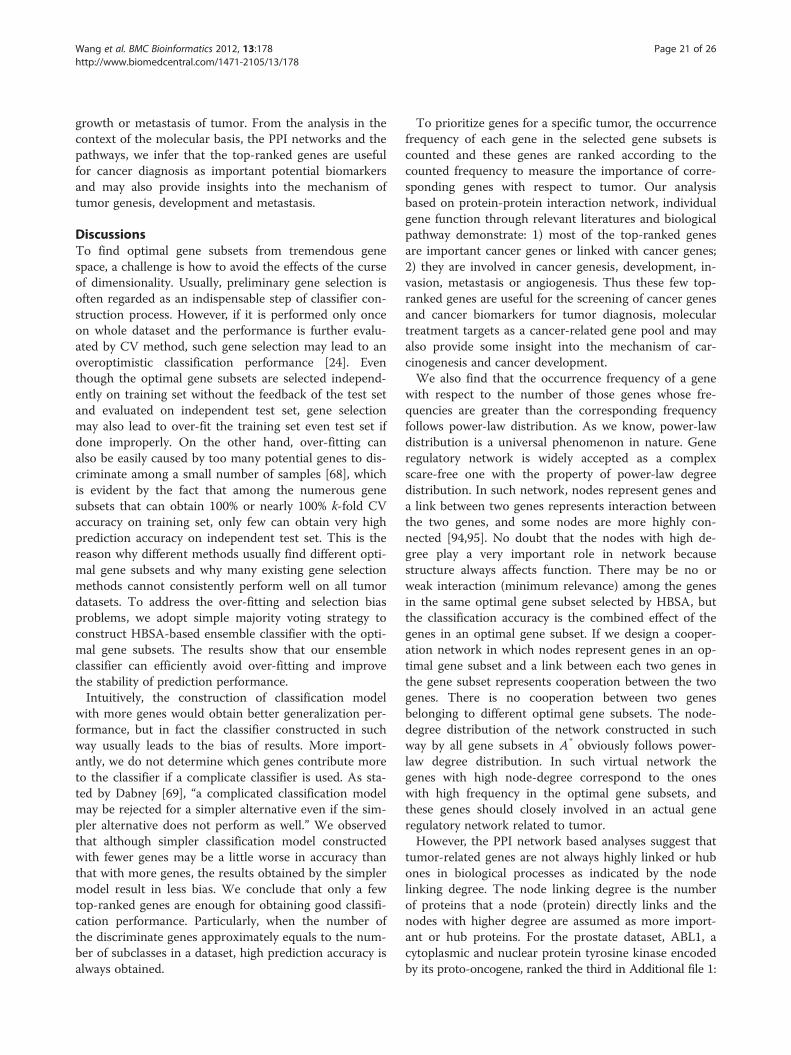
Wang et al. BMC Bioinformatics 2012, 13:178 Page 21 of 26http://www.biomedcentral.com/1471-2105/13/178
growth or metastasis of tumor. From the analysis in thecontext of the molecular basis, the PPI networks and thepathways, we infer that the top-ranked genes are usefulfor cancer diagnosis as important potential biomarkersand may also provide insights into the mechanism oftumor genesis, development and metastasis.
DiscussionsTo find optimal gene subsets from tremendous genespace, a challenge is how to avoid the effects of the curseof dimensionality. Usually, preliminary gene selection isoften regarded as an indispensable step of classifier con-struction process. However, if it is performed only onceon whole dataset and the performance is further evalu-ated by CV method, such gene selection may lead to anoveroptimistic classification performance [24]. Eventhough the optimal gene subsets are selected independ-ently on training set without the feedback of the test setand evaluated on independent test set, gene selectionmay also lead to over-fit the training set even test set ifdone improperly. On the other hand, over-fitting canalso be easily caused by too many potential genes to dis-criminate among a small number of samples [68], whichis evident by the fact that among the numerous genesubsets that can obtain 100% or nearly 100% k-fold CVaccuracy on training set, only few can obtain very highprediction accuracy on independent test set. This is thereason why different methods usually find different opti-mal gene subsets and why many existing gene selectionmethods cannot consistently perform well on all tumordatasets. To address the over-fitting and selection biasproblems, we adopt simple majority voting strategy toconstruct HBSA-based ensemble classifier with the opti-mal gene subsets. The results show that our ensembleclassifier can efficiently avoid over-fitting and improvethe stability of prediction performance.Intuitively, the construction of classification model
with more genes would obtain better generalization per-formance, but in fact the classifier constructed in suchway usually leads to the bias of results. More import-antly, we do not determine which genes contribute moreto the classifier if a complicate classifier is used. As sta-ted by Dabney [69], “a complicated classification modelmay be rejected for a simpler alternative even if the sim-pler alternative does not perform as well.” We observedthat although simpler classification model constructedwith fewer genes may be a little worse in accuracy thanthat with more genes, the results obtained by the simplermodel result in less bias. We conclude that only a fewtop-ranked genes are enough for obtaining good classifi-cation performance. Particularly, when the number ofthe discriminate genes approximately equals to the num-ber of subclasses in a dataset, high prediction accuracy isalways obtained.
To prioritize genes for a specific tumor, the occurrencefrequency of each gene in the selected gene subsets iscounted and these genes are ranked according to thecounted frequency to measure the importance of corre-sponding genes with respect to tumor. Our analysisbased on protein-protein interaction network, individualgene function through relevant literatures and biologicalpathway demonstrate: 1) most of the top-ranked genesare important cancer genes or linked with cancer genes;2) they are involved in cancer genesis, development, in-vasion, metastasis or angiogenesis. Thus these few top-ranked genes are useful for the screening of cancer genesand cancer biomarkers for tumor diagnosis, moleculartreatment targets as a cancer-related gene pool and mayalso provide some insight into the mechanism of car-cinogenesis and cancer development.We also find that the occurrence frequency of a gene
with respect to the number of those genes whose fre-quencies are greater than the corresponding frequencyfollows power-law distribution. As we know, power-lawdistribution is a universal phenomenon in nature. Generegulatory network is widely accepted as a complexscare-free one with the property of power-law degreedistribution. In such network, nodes represent genes anda link between two genes represents interaction betweenthe two genes, and some nodes are more highly con-nected [94,95]. No doubt that the nodes with high de-gree play a very important role in network becausestructure always affects function. There may be no orweak interaction (minimum relevance) among the genesin the same optimal gene subset selected by HBSA, butthe classification accuracy is the combined effect of thegenes in an optimal gene subset. If we design a cooper-ation network in which nodes represent genes in an op-timal gene subset and a link between each two genes inthe gene subset represents cooperation between the twogenes. There is no cooperation between two genesbelonging to different optimal gene subsets. The node-degree distribution of the network constructed in suchway by all gene subsets in A* obviously follows power-law degree distribution. In such virtual network thegenes with high node-degree correspond to the oneswith high frequency in the optimal gene subsets, andthese genes should closely involved in an actual generegulatory network related to tumor.However, the PPI network based analyses suggest that
tumor-related genes are not always highly linked or hubones in biological processes as indicated by the nodelinking degree. The node linking degree is the numberof proteins that a node (protein) directly links and thenodes with higher degree are assumed as more import-ant or hub proteins. For the prostate dataset, ABL1, acytoplasmic and nuclear protein tyrosine kinase encodedby its proto-oncogene, ranked the third in Additional file 1:
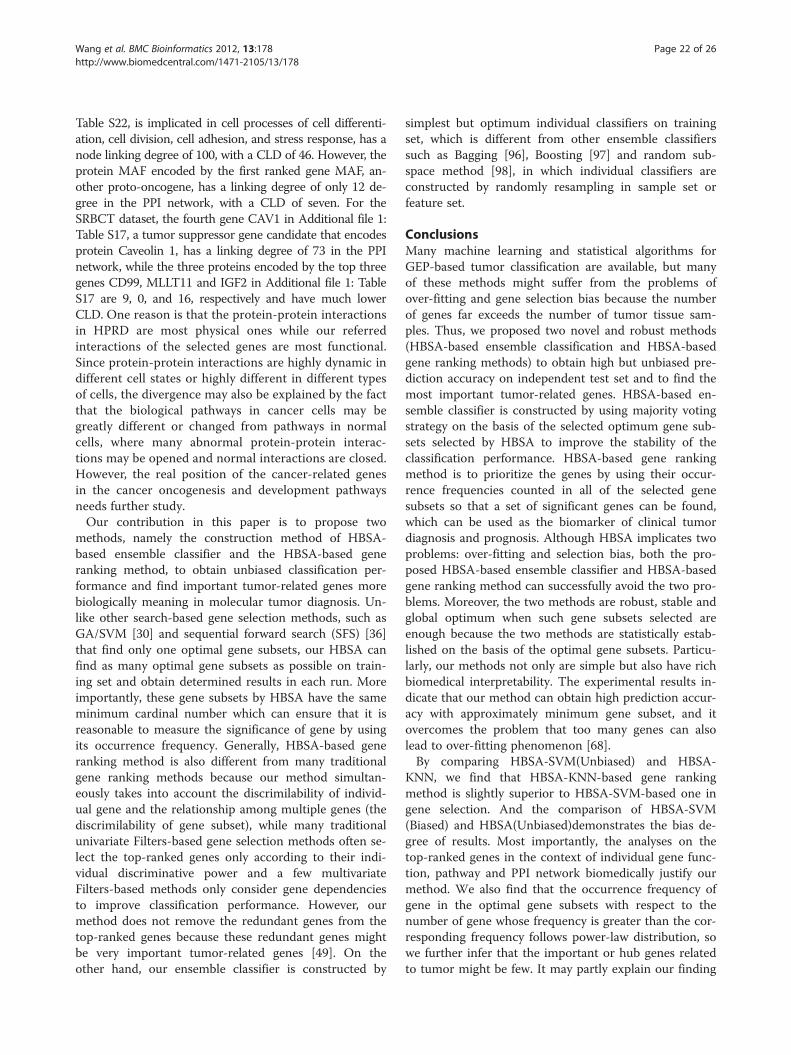
Wang et al. BMC Bioinformatics 2012, 13:178 Page 22 of 26http://www.biomedcentral.com/1471-2105/13/178
Table S22, is implicated in cell processes of cell differenti-ation, cell division, cell adhesion, and stress response, has anode linking degree of 100, with a CLD of 46. However, theprotein MAF encoded by the first ranked gene MAF, an-other proto-oncogene, has a linking degree of only 12 de-gree in the PPI network, with a CLD of seven. For theSRBCT dataset, the fourth gene CAV1 in Additional file 1:Table S17, a tumor suppressor gene candidate that encodesprotein Caveolin 1, has a linking degree of 73 in the PPInetwork, while the three proteins encoded by the top threegenes CD99, MLLT11 and IGF2 in Additional file 1: TableS17 are 9, 0, and 16, respectively and have much lowerCLD. One reason is that the protein-protein interactionsin HPRD are most physical ones while our referredinteractions of the selected genes are most functional.Since protein-protein interactions are highly dynamic indifferent cell states or highly different in different typesof cells, the divergence may also be explained by the factthat the biological pathways in cancer cells may begreatly different or changed from pathways in normalcells, where many abnormal protein-protein interac-tions may be opened and normal interactions are closed.However, the real position of the cancer-related genesin the cancer oncogenesis and development pathwaysneeds further study.Our contribution in this paper is to propose two
methods, namely the construction method of HBSA-based ensemble classifier and the HBSA-based generanking method, to obtain unbiased classification per-formance and find important tumor-related genes morebiologically meaning in molecular tumor diagnosis. Un-like other search-based gene selection methods, such asGA/SVM [30] and sequential forward search (SFS) [36]that find only one optimal gene subsets, our HBSA canfind as many optimal gene subsets as possible on train-ing set and obtain determined results in each run. Moreimportantly, these gene subsets by HBSA have the sameminimum cardinal number which can ensure that it isreasonable to measure the significance of gene by usingits occurrence frequency. Generally, HBSA-based generanking method is also different from many traditionalgene ranking methods because our method simultan-eously takes into account the discrimilability of individ-ual gene and the relationship among multiple genes (thediscrimilability of gene subset), while many traditionalunivariate Filters-based gene selection methods often se-lect the top-ranked genes only according to their indi-vidual discriminative power and a few multivariateFilters-based methods only consider gene dependenciesto improve classification performance. However, ourmethod does not remove the redundant genes from thetop-ranked genes because these redundant genes mightbe very important tumor-related genes [49]. On theother hand, our ensemble classifier is constructed by
simplest but optimum individual classifiers on trainingset, which is different from other ensemble classifierssuch as Bagging [96], Boosting [97] and random sub-space method [98], in which individual classifiers areconstructed by randomly resampling in sample set orfeature set.
ConclusionsMany machine learning and statistical algorithms forGEP-based tumor classification are available, but manyof these methods might suffer from the problems ofover-fitting and gene selection bias because the numberof genes far exceeds the number of tumor tissue sam-ples. Thus, we proposed two novel and robust methods(HBSA-based ensemble classification and HBSA-basedgene ranking methods) to obtain high but unbiased pre-diction accuracy on independent test set and to find themost important tumor-related genes. HBSA-based en-semble classifier is constructed by using majority votingstrategy on the basis of the selected optimum gene sub-sets selected by HBSA to improve the stability of theclassification performance. HBSA-based gene rankingmethod is to prioritize the genes by using their occur-rence frequencies counted in all of the selected genesubsets so that a set of significant genes can be found,which can be used as the biomarker of clinical tumordiagnosis and prognosis. Although HBSA implicates twoproblems: over-fitting and selection bias, both the pro-posed HBSA-based ensemble classifier and HBSA-basedgene ranking method can successfully avoid the two pro-blems. Moreover, the two methods are robust, stable andglobal optimum when such gene subsets selected areenough because the two methods are statistically estab-lished on the basis of the optimal gene subsets. Particu-larly, our methods not only are simple but also have richbiomedical interpretability. The experimental results in-dicate that our method can obtain high prediction accur-acy with approximately minimum gene subset, and itovercomes the problem that too many genes can alsolead to over-fitting phenomenon [68].By comparing HBSA-SVM(Unbiased) and HBSA-
KNN, we find that HBSA-KNN-based gene rankingmethod is slightly superior to HBSA-SVM-based one ingene selection. And the comparison of HBSA-SVM(Biased) and HBSA(Unbiased)demonstrates the bias de-gree of results. Most importantly, the analyses on thetop-ranked genes in the context of individual gene func-tion, pathway and PPI network biomedically justify ourmethod. We also find that the occurrence frequency ofgene in the optimal gene subsets with respect to thenumber of gene whose frequency is greater than the cor-responding frequency follows power-law distribution, sowe further infer that the important or hub genes relatedto tumor might be few. It may partly explain our finding

Wang et al. BMC Bioinformatics 2012, 13:178 Page 23 of 26http://www.biomedcentral.com/1471-2105/13/178
that the number of informative genes that approximatelyequals to the number of subclasses in dataset is enoughfor obtaining good generalization performance. Lastly,we find that the genes with maximum differential ex-pression among subclasses are not always the most im-portant tumor-related genes, and some most importanttumor-related genes are possibly those less differentiallyexpressed ones.Our future work will be mainly focused on utilizing
the prior biomedical knowledge and exploring new heur-istic search algorithms to reduce the time complexity ofour current method. We are currently designing a noveltime-saving method based on neighborhood rough setmodel to implement the same idea as this paper.
Additional file
Additional file 1: Supplementary Tables and Figures [2,9-12,63-66,73,74,77-79,83-86,99-145]
Competing interestsThe authors declare that they have no competing interests.
Authors’ contributionsShu-Lin Wang designed the HBSA algorithm and developed the computerprograms in Matlab, performed the experiments, and drafted the manuscript.Xue-Ling Li and Jianwen Fang helped Shu-Lin Wang to analyze thenumerical results with relevant biomedical literatures and revised themanuscript. All authors read and approved the final manuscript.
AcknowledgmentsWe sincerely thank Gustavo A. Stolovitzky (IBM Computational BiologyCenter) for providing us the DLBCL21 dataset. And we also cordially thankProf. Ji Wang (School of Computer Science, National University of DefenseTechnology, China) for his inspiring suggestion. We also thank Chungui Xu,Junfeng Xia and Meiling Hou for their contribution to the analysis of part ofgenes. This work was supported by the National Science Foundation ofChina (grant nos. 60973153, 61133010, 31071168, 60873012), the ChinaPostdoctoral Science Foundation (grant no. 20090450825), and AnhuiProvincial Natural Science Foundation (grant no. 1208085MF96).
Author details1College of Information Science and Engineering, Hunan University,Changsha, Hunan 410082, China. 2Intelligent Computing Laboratory, HefeiInstitute of Intelligent Machines, Chinese Academy of Sciences, Hefei, Anhui230031, China. 3Applied Bioinformatics Laboratory, the University of Kansas,2034 Becker Drive, Lawrence, KS 66047, USA.
Received: 22 December 2011 Accepted: 18 May 2012Published: 25 July 2012
References1. Hornberg JJ, Bruggeman FJ, Westerhoff HV, Lankelmaa J: Cancer: A systems
biology disease. Biosystems 2006, 83(2–3):81–90.2. Golub TR, Slonim DK, Tamayo P, Huard C, Gaasenbeek M, Mesirov JP,
Coller H, Loh ML, Downing JR, Caligiuri MA, et al: Molecular classificationof cancer: Class discovery and class prediction by gene expressionmonitoring. Science 1999, 286(5439):531–537.
3. Huang DS, Zheng CH: Independent component analysis-based penalizeddiscriminant method for tumor classification using gene expressiondata. Bioinformatics 2006, 22(15):1855–1862.
4. Zheng CH, Huang DS, Zhang L, Kong XZ: Tumor clustering usingnonnegative matrix factorization with gene selection. IEEE Trans InfTechnol Biomed 2009, 13(4):599–607.
5. Zheng CH, Zhang L, Ng VT, Shiu SC, Huang DS: Molecular patterndiscovery based on penalized matrix decomposition. IEEE/ACM TransComput Biol Bioinform 2011, 8(6):1592–1603.
6. Zheng CH, Zhang L, Ng TY, Shiu SC, Huang DS: Metasample-based sparserepresentation for tumor classification. IEEE/ACM Trans Comput BiolBioinform 2011, 8(5):1273–1282.
7. Wang SL, Zhu YH, Jia W, Huang DS: Robust classification method of tumorsubtype by using correlation filters. IEEE/ACM Trans Comput Biol Bioinform2012, 9(2):580–591.
8. Wang SL, Li XL, Zhang SW, Gui J, Huang DS: Tumor classification bycombining PNN classifier ensemble with neighborhood rough set basedgene reduction. Comput Biol Med 2010, 40(2):179–189.
9. Alon U, Barkai N, Notterman DA, Gish K, Ybarra S, Mack D, Levine AJ: Broadpatterns of gene expression revealed by clustering analysis of tumorand normal colon tissues probed by oligonucleotide arrays. Proc NatlAcad Sci U S A 1999, 96(12):6745–6750.
10. Khan J, Wei JS, Ringner M, Saal LH, Ladanyi M, Westermann F, Berthold F,Schwab M, Antonescu CR, Peterson C, et al: Classification and diagnosticprediction of cancers using gene expression profiling and artificialneural networks. Nat Med 2001, 7(6):673–679.
11. Shipp MA, Ross KN, Tamayo P, Weng AP, Kutok JL, Aguiar RCT,Gaasenbeek M, Angelo M, Reich M, Pinkus GS, et al: Diffuse large B-celllymphoma outcome prediction by gene-expression profiling andsupervised machine learning. Nat Med 2002, 8(1):68–74.
12. Singh D, Febbo PG, Ross K, Jackson DG, Manola J, Ladd C, Tamayo P,Renshaw AA, D’Amico AV, Richie JP, et al: Gene expression correlates ofclinical prostate cancer behavior. Cancer Cell 2002, 1(2):203–209.
13. Yeang CH, Ramaswamy S, Tamayo P, Mukherjee S, Rifkin RM, Angelo M,Reich M, Lander E, Mesirov J, Golub T: Molecular classification of multipletumor types. Bioinformatics 2001, 17(Suppl 1):S316–S322.
14. Guyon I, Weston J, Vapnik V: Gene selection for cancer classification usingsupport vector machine. Mach Learn 2002, 46(1–3):389–422.
15. Furey TS, Cristianini N, Duffy N, Bednarski DW, Schummer M, Haussler D:Support vector machine classification and validation of cancer tissuesamples using microarray expression data. Bioinformatics 2000,16(10):906–914.
16. Xu Y, Selaru FM, Yin J, Zou TT, Shustova V, Mori Y, Sato F, Liu TC, Olaru A,Wang S, et al: Artificial neural networks and gene filtering distinguishbetween global gene expression profiles of Barrett’s esophagus andesophageal cancer. Cancer Res 2002, 62(12):3493–3497.
17. Ringner M, Peterson C: Microarray-based cancer diagnosis with artificialneural networks. Biotechniques 2003, 34:S30–S35.
18. Sun GM, Dong XY, Xu GD: Tumor tissue identification based on geneexpression data using DWT feature extraction and PNN classifier.Neurocomputing 2006, 69(4–6):387–402.
19. Huang DS, Ip HHS, Law KCK, Chi Z: Zeroing polynomials using modifiedconstrained neural network approach. Ieee T Neural Networ 2005, 16(3):721–732.
20. Huang DS: A constructive approach for finding arbitrary roots ofpolynomials by neural networks. Ieee T Neural Networ 2004, 15(2):477–491.
21. Li LP, Darden TA, Weinberg CR, Levine AJ, Pedersen LG: Gene assessmentand sample classification for gene expression data using a geneticalgorithm/k-nearest neighbor method. Comb Chem High ThroughputScreen 2001, 4(8):727–739.
22. Tibshirani R, Hastie T, Narasimhan B, Chu G: Diagnosis of multiple cancertypes by shrunken centroids of gene expression. Proc Natl Acad Sci U S A2002, 99(10):6567–6572.
23. Tan YX, Shi LM, Tong WD, Wang C: Multi-class cancer classification bytotal principal component regression (TPCR) using microarray geneexpression data. Nucleic Acids Res 2005, 33(1):56–65.
24. Boulesteix AL: WilcoxCV: an R package for fast variable selection incross-validation. Bioinformatics 2007, 23(13):1702–1704.
25. Saeys Y, Inza I, Larranaga P: A review of feature selection techniques inbioinformatics. Bioinformatics 2007, 23(19):2507–2517.
26. Kohavi R, John GH: Wrappers for feature subset selection. Artif Intell 1997,97(1–2):273–324.
27. Yan XT, Deng MH, Fung WK, Qian MP: Detecting differentially expressedgenes by relative entropy. J Theor Biol 2005, 234(3):395–402.
28. Li T, Zhang CL, Ogihara M: A comparative study of feature selection andmulticlass classification methods for tissue classification based on geneexpression. Bioinformatics 2004, 20(15):2429–2437.

Wang et al. BMC Bioinformatics 2012, 13:178 Page 24 of 26http://www.biomedcentral.com/1471-2105/13/178
29. Peng HC, Ding C, Long FH: Minimum redundancy - Maximum relevancefeature selection. IEEE Intell Syst 2005, 20(6):70–71.
30. Liu JJ, Cutler G, Li WX, Pan Z, Peng SH, Hoey T, Chen LB, Ling XFB:Multiclass cancer classification and biomarker discovery using GA-basedalgorithms. Bioinformatics 2005, 21(11):2691–2697.
31. Inza I, Larranaga P, Blanco R, Cerrolaza AJ: Filter versus wrapper geneselection approaches in DNA microarray domains. Artif Intell Med 2004,31(2):91–103.
32. Davies S, Russell S: NP-completeness of searches for smallest possiblefeature sets. In Proceedings of the 1994 AAAI Fall Symposium on Relevance.New Orleans, LA, USA: AAAI Press; 1994:37–39.
33. Burke HB: Discovering patterns in microarray data. Mol Diagn 2000,5(4):349–357.
34. Zhu ZX, Ong YS, Dash M: Markov blanket-embedded genetic algorithmfor gene selection. Pattern Recognition 2007, 40(11):3236–3248.
35. Wang YH, Makedon FS, Ford JC, Pearlman J: HykGene: a hybrid approachfor selecting marker genes for phenotype classification using microarraygene expression data. Bioinformatics 2005, 21(8):1530–1537.
36. Xiong MM, Fang XZ, Zhao JY: Biomarker identification by featurewrappers. Genome Res 2001, 11(11):1878–1887.
37. Zhou X, Tuck DP: MSVM-RFE: extensions of SVM-RFE for multiclass geneselection on DNA microarray data. Bioinformatics 2007, 23(9):1106–1114.
38. Reunanen J: Overfitting in making comparisons between variableselection methods. J Mach Learn Res 2003, 3(7–8):1371–1382.
39. Haibe-Kains B, Desmedt C, Sotiriou C, Bontempi G: A comparative study ofsurvival models for breast cancer prognostication based on microarraydata: does a single gene beat them all? Bioinformatics 2008,24(19):2200–2208.
40. Roth FP: Bringing out the best features of expression data. Genome Res2001, 11(11):1801–1802.
41. Huang HL, Lee CC, Ho SY: Selecting a minimal number of relevant genesfrom microarray data to design accurate tissue classifiers. Biosystems2007, 90(1):78–86.
42. Ransohoff DF: Opinion - Rules of evidence for cancer molecular-markerdiscovery and validation. Nat Rev Cancer 2004, 4(4):309–314.
43. Huang DS: Radial basis probabilistic neural networks: Model andapplication. International Journal of Pattern Recognition and ArtificialIntelligence 1999, 13(7):1083–1101.
44. Huang DS, Du JX: A Constructive Hybrid Structure OptimizationMethodology for Radial Basis Probabilistic Neural Networks. Ieee T NeuralNetwor 2008, 19(12):2099–2115.
45. Ambroise C, McLachlan GJ: Selection bias in gene extraction on the basisof microarray gene-expression data. Proc Natl Acad Sci U S A 2002,99(10):6562–6566.
46. Wang LP, Chu F, Xie W: Accurate cancer classification using expressionsof very few genes. IEEE/ACM Trans Comput Biol Bioinform 2007, 4(1):40–53.
47. Dudoit S, Fridlyand J, Speed TP: Comparison of discrimination methodsfor the classification of tumors using gene expression data. J Am StatAssoc 2002, 97(457):77–87.
48. Wang SL, Wang J, Chen HW, Li ST, Zhang BY: Heuristic breadth-first searchalgorithm for informative gene selection based on gene expressionprofiles. Chinese Journal of Computers 2008, 31(4):636–649.
49. Li X, Rao SQ, Wang YD, Gong BS: Gene mining: a novel and powerfulensemble decision approach to hunting for disease genes usingmicroarray expression profiling. Nucleic Acids Res 2004, 32(9):2685–2694.
50. Sotiriou C, Neo SY, McShane LM, Korn EL, Long PM, Jazaeri A, Martiat P,Fox SB, Harris AL, Liu ET: Breast cancer classification and prognosis basedon gene expression profiles from a population-based study. Proc NatlAcad Sci U S A 2003, 100(18):10393–10398.
51. Jain AK, Duin RPW, Mao JC: Statistical pattern recognition: A review. IEEETrans Pattern Anal Mach Intell 2000, 22(1):4–37.
52. Asyali MH, Colak D, Demirkaya O, Inan MS: Gene expression profileclassification: A review. Curr Bioinforma 2006, 1(1):55–73.
53. Deng L, Ma JW, Pei J: Rank sum method for related gene selection andits application to tumor diagnosis. Chin Sci Bull 2004, 49(15):1652–1657.
54. Lee JW, Lee JB, Park M, Song SH: An extensive comparison of recentclassification tools applied to microarray data. Computational Statistics &Data Analysis 2005, 48(4):869–885.
55. Valente JMS, Alves R: Beam search algorithms for the early/tardyscheduling problem with release dates. J Manuf Syst 2005, 24(1):35–46.
56. Vapnik VN: Statistical learning theory. New York: Wiley Interscience; 1998.
57. Chang CC, Lin CJ: LIBSVM: a library for support vector machines. Softwareavailable at http://wwwcsientuedutw/~cjlin/libsvm 2001.
58. Keerthi SS, Lin CJ: Asymptotic behaviors of support vector machines withGaussian kernel. Neural Comput 2003, 15(7):1667–1689.
59. Hsu CW, Chang CC, Lin CJ: A practical guide to support vectorclassification. Technical report, Department of Computer Science, NationalTaiwan University (http://wwwcsientuedutw/~cjlin/papershtml) 2003.
60. Evgeniou T, Pontil M, Elisseeff A: Leave-one-out-error, stability, andgeneralization of voting combination of classifiers. Mach Learn 2004,55:71–97.
61. Breiman L, Spector P: Submodel selection and evaluation regression - theX-random case. Int Stat Rev 1992, 60(3):291–319.
62. Sonego P, Kocsor A, Pongor S: ROC analysis: applications to theclassification of biological sequences and 3D structures. Brief Bioinform2008, 9(3):198–209.
63. Yeoh EJ, Ross ME, Shurtleff SA, Williams WK, Patel D, Mahfouz R, Behm FG,Raimondi SC, Relling MV, Patel A, et al: Classification, subtype discovery,and prediction of outcome in pediatric acute lymphoblastic leukemia bygene expression profiling. Cancer Cell 2002, 1(2):133–143.
64. Armstrong SA, Staunton JE, Silverman LB, Pieters R, de Boer ML,Minden MD, Sallan SE, Lander ES, Golub TR, Korsmeyer SJ: MLLtranslocations specify a distinct gene expression profile thatdistinguishes a unique leukemia. Nat Genet 2002, 30(1):41–47.
65. Stolovitzky GA: Gene selection strategies in microarray expression data:applications to case–control studies. Complex Systems Science inBiomedicine 2006, 4:679–699.
66. Welsh JB, Sapinoso LM, Su AI, Kern SG, Wang-Rodriguez J, Moskaluk CA,Frierson HF, Hampton GM: Analysis of gene expression identifiescandidate markers and pharmacological targets in prostate cancer.Cancer Res 2001, 61(16):5974–5978.
67. Liu CC, Chen WSE, Lin CC, Liu HC, Chen HY, Yang PC, Chang PC, Chen JJW:Topology-based cancer classification and related pathway mining usingmicroarray data. Nucleic Acids Res 2006, 34(14):4069–4080.
68. Ransohoff DF: Rules of evidence for cancer molecular-marker discoveryand validation. Nat Rev Cancer 2004, 4(4):309–314.
69. Dabney AR: Classification of microarrays to nearest centroids.Bioinformatics 2005, 21(22):4148–4154.
70. Dabney AR, Storey JD: Optimality driven nearest centroid classificationfrom genomic data. PLoS One 2007, 2(10):e1002.
71. Kononenko I: Estimating attributes: Analysis and extensions of Relief. InEuropean Conference on Machine Learning. Edited by. Catana, Italy: Springer;1994:171–182.
72. Higgins ME, Claremont M, Major JE, Sander C, Lash AE: CancerGenes: agene selection resource for cancer genome projects. Nucleic Acids Res2007, 35:D721–D726.
73. Linenberger ML: CD33-directed therapy with gemtuzumab ozogamicinin acute myeloid leukemia: progress in understanding cytotoxicityand potential mechanisms of drug resistance. Leukemia 2005,19(2):176–182.
74. Bernstein ID: CD33 as a target for selective ablation of acute myeloidleukemia. Clin Lymphoma 2002, 2:S9–S11.
75. Hirose M: The Process Behind the Expression of mdr-1/P-gp andmrp/MRP in Human Leukemia/Lymphoma. Anticancer Res 2009,29(4):1073–1077.
76. Wen CH, Levitan D, Li XJ, Greenwald I: spr-2, a suppressor of theegg-laying defect caused by loss of sel-12 presenilin in Caenorhabditiselegans, is a member of the SET protein subfamily. Proc Natl AcadSci U S A 2000, 97(26):14524–14529.
77. Imai T, Fukudome K, Takagi S, Nagira M, Furuse M, Fukuhara N,Nishimura M, Hinuma Y, Yoshie O: C33 antigen recognized by monoclonalantibodies inhibitory to human T cell leukemia virus type 1-inducedsyncytium formation is a member of a new family of transmembraneproteins including CD9, CD37, CD53, and CD63. J Immunol 1992,149(9):2879–2886.
78. Barber KE, Harrison CJ, Broadfield ZJ, Stewart ARM, Wright SL, Martineau M,Strefford JC, Moorman AV: Molecular cytogenetic characterization of TCF3(E2A)/19p 13.3 rearrangements in B-cell precursor acute lymphoblasticleukemia. Genes Chromosomes Cancer 2007, 46(5):478–486.
79. Pal P, Xi H, Kaushal R, Sun G, Jin CH, Jin L, Suarez BK, Catalona WJ, Deka R:Variants in the HEPSIN gene are associated with prostate cancer in menof European origin. Hum Genet 2006, 120(2):187–192.
Wang et al. BMC Bioinformatics 2012, 13:178 Page 25 of 26http://www.biomedcentral.com/1471-2105/13/178
80. Yang ZQ, Cheng W, Hong LX, Chen WZ, Wang YH, Lin SC, Han JH,Zhou HM, Gu J: Adenine nucleotide (ADP/ATP) translocase 3 participatesin the tumor necrosis factor-induced apoptosis of MCF-7 cells. Mol BiolCell 2007, 18:4681–4689.
81. Aragues R, Sander C, Oliva B: Predicting cancer involvement of genesfrom heterogeneous data. BMC Bioinformatics 2008, 9:172–189.
82. Peri S, Navarro JD, Kristiansen TZ, Amanchy R, Surendranath V,Muthusamy B, Gandhi TKB, Chandrika KN, Deshpande N, Suresh S, et al:Human protein reference database as a discovery resource forproteomics. Nucleic Acids Res 2004, 32:D497–D501.
83. Leibeling D, Laspe P, Emmert S: Nucleotide excision repair and cancer.J Mol Histol 2006, 37(5–7):225–238.
84. Behrens J: The role of cell adhesion molecules in cancer invasion andmetastasis. Breast Cancer Res Treat 1993, 24:175–184.
85. Sherr CJ, McCormick F: The RB and p53 pathways in cancer. Cancer Cell2002, 2(2):103–112.
86. Abrams ST, Lakum T, Lin K, Jones GM, Treweeke AT, Farahani M, Hughes M,Zuzel M, Slupsky JR: B-cell receptor signaling in chronic lymphocyticleukemia cells is regulated by overexpressed active protein kinase Cbeta II. Blood 2007, 109(3):1193–1201.
87. Hope KJ, Jin LQ, Dick JE: Acute myeloid leukemia originates from ahierarchy of leukemic stem cell classes that differ in self-renewalcapacity. Nat Immunol 2004, 5(7):738–743.
88. Libermann TA, Zerbini LF: Targeting transcription factors for cancer genetherapy. Curr Gene Ther 2006, 6(1):17–33.
89. Buschfort C, Muller MR, Seeber S, Rajewsky MF, Thomale J: DNAexcision repair profiles of normal and leukemic human lymphocytes:Functional analysis at the single-cell level. Cancer Res 1997,57(4):651–658.
90. Osman I, Drobnjak M, Fazzari M, Ferrara J, Scher HI, Cordon-Cardo C:Inactivation of the p53 pathway in prostate cancer: Impact on tumorprogression. Clin Cancer Res 1999, 5(8):2082–2088.
91. Nandeesha H: Insulin: a novel agent in the pathogenesis of prostatecancer. Int Urol Nephrol 2009, 41(2):267–272.
92. Montanaro L, Trere D, Derenzini M: Nucleolus, ribosomes, and cancer. AmJ Pathol 2008, 173(2):301–310.
93. Balk SP, Knudsen KE: AR, the cell cycle, and prostate cancer. Nucl ReceptSignal 2008, 6:e001.
94. Strogatz SH: Exploring complex networks. Nature 2001, 410(6825):268–276.95. Wang B, Chen P, Huang DS, Li JJ, Lok TM, Lyu MR: Predicting protein
interaction sites from residue spatial sequence profile and evolutionrate. FEBS Lett 2006, 580(2):380–384.
96. Breiman L: Bagging predictors. Mach Learn 1996, 24(2):123–140.97. Quinlan JR: Bagging, boosting, and C4.5. Proceedings of the Thirteenth
National Conference on Artificial Intelligence and the Eighth InnovativeApplications of Artificial Intelligence Conference, Vols 1 and 2 1996:725–730.
98. Ho TK: The random subspace method for constructing decision forests.IEEE Trans Pattern Anal Mach Intell 1998, 20(8):832–844.
99. Housa D, Housova J, Vernerova Z, Haluzik M: Adipocytokines and cancer.Physiol Res 2006, 55(3):233–244.
100. Wadman I, Li JX, Bash RO, Forster A, Osada H, Rabbitts TH, Baer R: Specificin-vivo association between the bHLH and LIM proteins implicated inhuman T cell Leukemia. EMBO J 1994, 13(20):4831–4839.
101. Macalma T, Otte J, Hensler ME, Bockholt SM, Louis HA, KalffSuske M,Grzeschik KH, vonder Ahe D, Beckerle MC: Molecular characterization ofhuman zyxin. J Biol Chem 1996, 271(49):31470–31478.
102. Shi J, Kahle A, Hershey JWB, Honchak BM, Warneke JA, Leong SPL,Nelson MA: Decreased expression of eukaryotic initiation factor 3fderegulates translation and apoptosis in tumor cells. Oncogene 2006,25(35):4923–4936.
103. Rassenti LZ, Huynh L, Toy TL, Chen L, Keating MJ, Gribben JG, Neuberg DS,Flinn IW, Rai KR, Byrd JC, et al: ZAP-70 compared with immunoglobulinheavy-chain gene mutation status as a predictor of diseaseprogression in chronic lymphocytic leukemia. N Engl J Med 2004,351(9):893–901.
104. Vinante F, Rigo A, Vincenzi C, Ricetti MM, Marrocchella R, Chilosi M,Cassatella MA, Bonazzi L, Pizzolo G: IL-8 messenger-RNA expression andIL-8 production by acute myeloid-leukemia cells. Leukemia 1993,7(10):1552–1556.
105. Amin S, Parker A, Mann J: ZAP70 in chronic lymphocytic leukemia. Int JBiochem Cell Biol 2008, 40(9):1654–1658.
106. Lepont P, Stickney JT, Foster LA, Meng JJ, Hennigan RF, Ip W: Pointmutation in the NF2 gene of HEI-193 human schwannoma cells resultsin the expression of a merlin isoform with attenuated growthsuppressive activity. Mutat Res Fundam Mol Mech Mutagen 2008,637(1–2):142–151.
107. Hulit J, Bash T, Fu MF, Galbiati F, Albanese C, Sage DR, Schlegel A,Zhurinsky J, Shtutman M: Ben-Ze’ev A et al: The cyclin D1 gene istranscriptionally repressed by caveolin-1. J Biol Chem 2000,275(28):21203–21209.
108. Tirado OM, Mateo-Lozano S, Villar J, Dettin LE, Llort A, Gallego S, Ban J,Kovar H, Notario V: Caveolin-1 (CAV1) is a target of EWS/FLI-1 and a keydeterminant of the oncogenic phenotype and tumorigenicity of Ewing’ssarcoma cells. Cancer Res 2006, 66(20):9937–9947.
109. Meyer A, van Golen CM, Boyanapalli M, Kim B, Soules ME, Feldman EL:Integrin-linked kinase complexes with caveolin-1 in humanneuroblastoma cells. Biochemistry 2005, 44(3):932–938.
110. Ramani P, Rampling D, Link M: Immunocytochemical study of 12E7 insmall round-cell tumors of childhood - an assessment of its sensitivityand specificity. Histopathology 1993, 23(6):557–561.
111. Lin HJ, Shaffer KM, Sun ZR, Jay G, He WW, Ma W: AF1q, a differentiallyexpressed gene during neuronal differentiation, transforms HEK cellsinto neuron-like cells. Mol Brain Res 2004, 131(1–2):126–130.
112. Weir ML, Muschler J: Dystroglycan: Emerging roles in mammary glandfunction. J Mammary Gland Biol Neoplasia 2003, 8(4):409–419.
113. Poggi A, Catellani S, Bruzzone A, Caligaris-Cappio F, Gobbi M, Zocchi MR:Lack of the leukocyte-associated Ig-like receptor-1 expression inhigh-risk chronic lymphocytic leukaemia results in the absence of anegative signal regulating kinase activation and cell division. Leukemia2008, 22(5):980–988.
114. Harnacke K, Kruhoffer M, Orntoft TF, Hass R: Down-modulation of poly(ADP-ribose) polymerase-1 (PARP-1) in human TUR leukemia cellsrestores transcriptional responsiveness for differentiation and cell cyclearrest. Eur J Cell Biol 2005, 84(11):885–896.
115. Kees UR, Ford J, Watson M, Murch A, Ringner M, Walker RL, Meltzer P: Geneexpression profiles in a panel of childhood leukemia cell lines mirrorcritical features of the disease. Mol Cancer Ther 2003, 2(7):671–677.
116. Pottier N, Cheok MH, Yang W, Assem M, Tracey L, Obenauer JC, Panetta JC,Relling MV, Evans WE: Expression of SMARCB1 modulates steroidsensitivity in human lymphoblastoid cells: identification of a promotersnp that alters PARP1 binding and SMARCB1 expression. Hum Mol Genet2007, 16:2261–2271.
117. Nakayama J, Yamamoto M, Hayashi K, Satoh H, Bundo K, Kubo M,Goitsuka R, Farrar MA, Kitamura D: BLNK suppresses pre-B-cellleukemogenesis through inhibition of JAK3. Blood 2009,113(7):1483–1492.
118. Mizukami Y, Jo WS, Duerr EM, Gala M, Li JN, Zhang XB, Zimmer MA,Iliopoulos O, Zukerberg LR, Kohgo Y, et al: Induction of interleukin-8preserves the angiogenic response in HIF-1 alpha-deficient colon cancercells. Nat Med 2005, 11(9):992–997.
119. Cacev T, Radosevic S, Krizanac S, Kapitanovic S: Influence of interleukin-8and interleukin-10 on sporadic colon cancer development andprogression. Carcinogenesis 2008, 29(8):1572–1580.
120. Barshishat M, Ariel A, Cahalon L, Chowers Y, Lider O, Schwartz B: TNF alphaand IL-8 regulate the expression and function of CD44 variant proteinsin human colon carcinoma cells. Clin Exp Metastasis 2002, 19(4):327–337.
121. Hellmuth M, Wetzler C, Nold M, Chang JH, Frank S, Pfeilschifter J, Muhl H:Expression of interleukin-8, heme oxygenase-1 and vascular endothelialgrowth factor in DLD-1 colon carcinoma cells exposed to pyrrolidinedithiocarbamate. Carcinogenesis 2002, 23(8):1273–1279.
122. Vavricka SR, Musch MW, Chang JE, Nakagawa Y, Phanvijhitsiri K, Waypa TS,Merlin D, Schneewind O, Chang EB: hPepT1 transports muramyldipeptide, activating NF-kappa B and stimulating IL-8 secretion inhuman colonic Caco2/bbe cells. Gastroenterology 2004, 127(5):1401–1409.
123. delaCadena M, Fernandez J, deCarlos A, MartinezZorzano V, GilMartin E,RodriguezBerrocal FJ: Low levels of alpha-L-fucosidase activity incolorectal cancer are due to decreased amounts of the enzymaticprotein and are related with Dukes' stage. Int J Oncol 1996,9(4):747–754.
124. Kishino H, Waddell PJ: Correspondence analysis of genes and tissue typesand finding genetic links from microarray data. Genome Inform SerWorkshop Genome Inform 2000, 11:83–95.
Wang et al. BMC Bioinformatics 2012, 13:178 Page 26 of 26http://www.biomedcentral.com/1471-2105/13/178
125. Hill O, Cetin Y, Cieslak A, Magert HJ, Forssmann WG: A new humanguanylate cyclase-activating peptide (GCAP-II, uroguanylin): precursorcDNA and colonic expression. Biochimica Et Biophysica Acta-ProteinStructure and Molecular Enzymology 1995, 1253(2):146–149.
126. Li MH, Lin YM, Hasegawa S, Shimokawa T, Murata K, Kameyama M,Ishikawa O, Katagiri T, Tsunoda T, Nakamura Y, et al: Genes associated withliver metastasis of colon cancer, identified by genome-wide cDNAmicroarray. Int J Oncol 2004, 24(2):305–312.
127. Reubi JC: In-vitro identification of vasoactive-intestinal-peptide receptorsin human tumors: implications for tumor imaging. J Nucl Med 1995,36(10):1846–1853.
128. Giroux V, Iovanna J, Dagorn JC: Probing the human kinome for kinasesinvolved in pancreatic cancer cell survival and gemcitabine resistance.FASEB J 2006, 20(12):1982–1991.
129. Zhou CZ, Qiu GQ, Wang XL, Fan JW, Tang HM, Sun YH, Wang Q, Huang F,Yan DW, Li DW, et al: Screening of tumor suppressor genes on1q31.1–32.1 in Chinese patients with sporadic colorectal cancer. ChinMed J 2008, 121(24):2479–2486.
130. Hiraga J, Katsumi A, Iwasaki T, Abe A, Kiyoi H, Matsushita T, Kinoshita T,Naoe T: Prognostic analysis of aberrant somatic hypermutation ofRhoH gene in diffuse large B cell lymphoma. Leukemia 2007,21(8):1846–1847.
131. Lin KR, Lee SF, Hung CM, Li CL, Yang-Yen HF, Yen JJY: Survival factorwithdrawal-induced apoptosis of TF-1 cells involves a TRB2-Mcl-1axis-dependent pathway. J Biol Chem 2007, 282(30):21962–21972.
132. Monti S, Savage KJ, Kutok JL, Feuerhake F, Kurtin P, Mihm M, Wu BY,Pasqualucci L, Neuberg D, Aguiar RCT, et al: Molecular profiling of diffuselarge B-cell lymphoma identifies robust subtypes including onecharacterized by host inflammatory response. Blood 2005,105(5):1851–1861.
133. Gez S, Crossett B, Christopherson RI: Differentially expressed cytosolicproteins in human leukemia and lymphoma cell lines correlate withlineages and functions. Biochimica Et Biophysica Acta-Proteins andProteomics 2007, 1774:1173–1183.
134. Lacayo NJ, Meshinchi S, Kinnunen P, Yu R, Wang Y, Stuber CM, Douglas L,Wahab R, Becton DL, Weinstein H, et al: Gene expression profiles atdiagnosis in de novo childhood AML patients identify FLT3 mutationswith good clinical outcomes. Blood 2004, 104(9):2646–2654.
135. Furusato B, Gao CL, Ravindranath L, Chen YM, Cullen J, McLeod DG, Dobi A,Srivastava S, Petrovics G, Sesterhenn IA: Mapping of TMPRSS2-ERG fusionsin the context of multi-focal prostate cancer. Mod Pathol 2008,21(2):67–75.
136. Chen L, Li XY, Wang GI, Wang Y, Zhu YY, Zhu JW: Clinicopathologicalsignificance of overexpression of TSPAN1, K167 and CD34 in gastriccarcinoma. Tumori 2008, 94(4):531–538.
137. Saleem M, Kweon MH, Johnson JJ, Adhami VM, Elcheva I, Khan N: BinHafeez B, Bhat KMR, Sarfaraz S, Reagan-Shaw S et al: S100A4 acceleratestumorigenesis and invasion of human prostate cancer through thetranscriptional regulation of matrix metalloproteinase 9. Proc Natl AcadSci U S A 2006, 103(40):14825–14830.
138. Ross ME, Zhou X, Song G, Shurtleff SA, Girtman K, Williams WK, Liu HC,Mahfouz R, Raimondi SC, Lenny N, Patel A, Downing JR: Classification ofpediatric acute lymphoblastic leukemia by gene expression profiling.Blood 2003, 102(8):2951–2959.
139. Yazawa S, Nakamura J-, Asao T, Nagamachi Y, Sagi M, Malta KL,Achikawa TT, Akamatsu M: Aberrant α1! 2 fucosyltransferases found inhuman colorectal carcinoma involved in the accumulation of Leb and YAntigens in Colorectal Tumors. Cancer Sci 1993, 84(9):989–995.
140. Schulz TJ, Thierbach R, Voigt A, Drewes G, Mietzner B, Steinberg P,Pfeiffer AFH, Ristow M: Induction of oxidative metabolism bymitochondrial frataxin inhibits cancer growth - Otto Warburg revisited.J Biol Chem 2006, 281(2):977–981.
141. Lan LX, Han HB, Zuo HJ, Chen ZG, Du YT, Zhao W, Gu J, Zhang ZQ:Upregulation of myosin Va by Snail is involved in cancer cell migrationand metastasis. Int J Cancer 2010, 126(1):53–64.
142. van Spriel AB, Puls KL, Sofi M, Pouniotis D, Hochrein H, Orinska Z,Knobeloch KP, Plebanski M, Wright MD: A regulatory role for CD37 in Tcell proliferation. J Immunol 2004, 172(5):2953–2961.
143. Lutsiak MEC, Tagaya Y, Adams AJ, Schlom J, Sabzevari H: Tumor-InducedImpairment of TCR Signaling Results in Compromised Functionality ofTumor-Infiltrating Regulatory T Cells. J Immunol 2008, 180(9):5871–5881.
144. Polson AG, Calemine-Fenaux J, Chan P, Chang W, Christensen E, Clark S,de Sauvage FJ, Eaton D, Elkins K, Elliott JM, et al: Antibody-DrugConjugates for the Treatment of Non-Hodgkin’s Lymphoma: Target andLinker-Drug Selection. Cancer Res 2009, 69(6):2358–2364.
145. Sakane-Ishikawa E, Nakatsuka S-, Tomita Y, Fujita S, Nakamichi I, Takakuwa T,Sugiyama H, Fukuhara S, Hino M, Kanamaru A, et al: PrognosticSignificance of BACH2 Expression in Diffuse Large B-Cell Lymphoma: AStudy of the Osaka Lymphoma Study Group. J Clin Oncol 2005,23(31):8012–8017.
doi:10.1186/1471-2105-13-178Cite this article as: Wang et al.: Finding minimum gene subsets withheuristic breadth-first search algorithm for robust tumor classification.BMC Bioinformatics 2012 13:178.
Submit your next manuscript to BioMed Centraland take full advantage of:
• Convenient online submission
• Thorough peer review
• No space constraints or color figure charges
• Immediate publication on acceptance
• Inclusion in PubMed, CAS, Scopus and Google Scholar
• Research which is freely available for redistribution
Submit your manuscript at www.biomedcentral.com/submit