systemic iron regulation and adipose tissue inflammation in
186
SYSTEMIC IRON REGULATION AND ADIPOSE TISSUE INFLAMMATION IN HEALTH AND DISEASE by Xiaoya Ma A dissertation submitted in partial fulfillment of the requirements for the degree of Doctor of Philosophy (Kinesiology) in the University of Michigan 2015 Doctoral Committee: Clinical Assistant Professor Peter F. Bodary, Co-Chair Professor Jeffrey F. Horowitz, Co-chair Professor Gregory D. Cartee Clinical Lecturer Rami N. Khoriaty Associate Professor Yatrik M. Shah
-
Upload
khangminh22 -
Category
Documents
-
view
1 -
download
0
Transcript of systemic iron regulation and adipose tissue inflammation in

SYSTEMIC IRON REGULATION AND ADIPOSE TISSUE INFLAMMATION IN
HEALTH AND DISEASE
by
Xiaoya Ma
A dissertation submitted in partial fulfillment of the requirements for the degree of
Doctor of Philosophy (Kinesiology)
in the University of Michigan 2015
Doctoral Committee:
Clinical Assistant Professor Peter F. Bodary, Co-Chair Professor Jeffrey F. Horowitz, Co-chair Professor Gregory D. Cartee Clinical Lecturer Rami N. Khoriaty Associate Professor Yatrik M. Shah

© Xiaoya Ma 2015

Acknowledgements
I would like to thank my thesis committee, namely Drs. Pete Bodary, Jeff Horowitz, Gregory
Cartee, Yatrik Shah, and Rami Khoriaty, for their contribution to the development and critical
analysis of this project. I could not have reached this point without the help of my committee
members as well as fellow students, Kinesiology staff, willing participants, friends and family. But
most importantly this opportunity was made possible by my advisor Dr. Pete Bodary.
I would like to express my deepest gratitude to my advisor Dr. Pete Bodary, whose excellent
guidance, caring, patience, and providing me with support, encouragement and all the resources
with which this dissertation was brought to fruition. Dr. Bodary you have been an invaluable
mentor. Your passion for science, your attitude towards teaching and learning, your enduring
encouragement, and your practical advice has been an inestimable source of support for me during
this process. Thank you very much for encourage my research and for allowing me to grow as a
graduate student. Your advice on both research and life is priceless.
I would also like to thank my committee for their continued support and encouragement. Dr.
Horowitz, I can’t thank you enough for your encouragement and guidance. From the very
beginning of my study, you were always patient with my questions and prompt with feedback on
my scientific writing. You also provided me with the opportunity to join your lab’s journal club,
which improved my presentation skills and helped me develop critical thinking. Dr. Cartee, you
are my role model for my research life, your dedication to research and diligence towards muscle
ii

biology always encouraged me to do better with my own research. Dr. Shah, thank you for being
so helpful and generous. I couldn’t have finished my data collection without the assays you
provided. Thanks for taking your time and helping me with my dissertation projects. Dr. Khoriaty,
thank you for giving me feedback from a clinical standpoint and helping me with other projects in
addition to my dissertation.
My completion of this dissertation could not have been accomplished without the support of VBL
(Vascular Biology Laboratory) members present and past. I have learned so many laboratory skills
from working with Chester Kao, Danielle Trakimas, Monica Humby and Justin Kang. I appreciate
the patience you showed me and the knowledge you shared. The work presented in this dissertation
would not have been possible without the helping hands of our recent lab members including:
Katlyn Patterson, Kayla Gieschen, Vinh Pham, Maria Ward, Lydia Proctor and Kayla Hanses.
Thank you for your help with serum preparation, monocyte isolation and assistant with data
collection with the participants. It was all of you that made my transition from my undergraduate
in China to graduate life in U.S. much easier. Last, but by no means least, I want to thank my lab
mate Justin, who has been a great colleague. Your help with a lot of tissue collection and
preparation of our qualifying exam means a lot to me.
To the faculty and staff members in the School of Kinesiology, thanks for making my graduate
life more productive and smooth. Thank you to Charlene Ruloff, you are always supportive and
helpful for each step of my doctoral process. Thank you and Dr. Ketra Armstrong for organizing
the get-togethers for all of the graduate students in Kinesiology. Thank you to Leona Cranford for
helping with all the assays ordering and dealing with packages.
iii

I would like to thank Dr. Carey Lumeng and his lab, where they generously taught me flow
cytometery and helped me with data analysis. It was a productive term when I was in their lab. I
also want to express my gratitude to Dr. Peter Mancuso, who was on my prelim committee and
taught me so much in his class.
I would not be at this point without the help and mentorship of my Bachelor’s Degree advisor, Dr.
Yang Hu. The skills and the knowledge I gained from Dr. Hu’s lab at Beijing Sport University
built a strong base for my development as a doctoral student here in Michigan.
To my best friend Ramses, thank you for taking care of me, supporting me to get through bad times
and celebrating good times with me. To my caring, loving, and supportive parents, they are the
best for both my brother and I. I am so fortunate to be raised by them as they always instilled a
strong belief in education and supported me through my entire professional career. To my dearest
brother, I couldn’t say thank you enough. Your encouragement gave me the motivation and
confidence to seek for greater opportunities. Whenever I go through difficult times, you are always
there to listen to me and provide me with your wisdom.
iv

Table of Contents
Acknowledgements ....................................................................................................................... ii
List of Figures ............................................................................................................................. viii
List of Tables ................................................................................................................................ ix
List of Appendices ......................................................................................................................... x
Abstract ......................................................................................................................................... xi
CHAPTER
1. Statement of Problems .............................................................................................................. 1
2. Review of Literature ............................................................................................................... 10
Epidemiology of iron deficiency and iron overload ............................................................. 10
Iron recycling is a highly regulated process.......................................................................... 12
Different types and causes of iron deficiency ....................................................................... 17
Mechanisms of exercise-related iron deficiency anemia ...................................................... 20
Does exercise induce iron deficiency via increasing hepcidin? ............................................ 22
Cellular hepcidin regulation and iron homeostasis ............................................................... 23
The association between iron regulation and T2DM risks ................................................... 27
The influence of exercise on T2DM and adipose tissue inflammation................................. 30
Mouse model, KK/HIJ polygenic obese mice ...................................................................... 32
Summary of review of literature ........................................................................................... 34
v

3. Serum hepcidin levels are not chronically elevated in collegiate female distance runners
....................................................................................................................................................... 49
Abstract ................................................................................................................................. 49
Introduction ........................................................................................................................... 51
Methods ................................................................................................................................. 53
Results ................................................................................................................................... 56
Discussion ............................................................................................................................. 58
4. Tissue-specific Iron Elevation and Adipose Tissue Remodeling in a Polygenic Obese
Mouse Model ............................................................................................................................... 75
Abstract ................................................................................................................................. 75
Introduction ........................................................................................................................... 77
Methods ................................................................................................................................. 80
Results ................................................................................................................................... 82
Discussion ............................................................................................................................. 84
5. Effects of 5-week voluntary wheel running on adipose tissue inflammation in a female
mouse model of polygenic obesity ............................................................................................ 103
Abstract ............................................................................................................................... 103
Introduction ......................................................................................................................... 105
Methods ............................................................................................................................... 107
Results ................................................................................................................................. 110
Discussion ........................................................................................................................... 113
6. Overall discussion ................................................................................................................. 139
vi

APPENDICES ........................................................................................................................... 150
vii

List of Figures
Figure 2-1. Iron recyclng in human body. ................................................................................... 14
Figure 2-2. The role of hepcidin in systemic iron homeostasis. .................................................. 16
Figure 2-3. The changes of erythroid iron and storage iron (hepatocyte and reticuloendothelial
macrophage) in the presence of decreased body iron content. ..................................................... 19
Figure 2-4. Schematic representation of the regulation of hepcidin expression. ......................... 26
Figure 3-1. Serum hepcidin .......................................................................................................... 68
Figure 3-2. Correlation between serum hepcidin and training levels, recent training, and history
of iron deficiency anemia in RUN (n=20) .................................................................................... 69
Figure 4-1. Iron deposition is tissue specific. .............................................................................. 94
Figure 4-2. A robust tissue remodeling in the HI mice epididymal fat pads ............................... 95
Figure 4-3. Epididymal adipose tissue gene expression ............................................................. 96
Figure 4-4. Comparison of hematologic measures between NI and HI………………………...97
Figure 5-1. Female KK/HIJ mice are more prone to fat accumulation than males. .................. 124
Figure 5-2. Voluntary exercise induced weight loss in KK/HIJ mice ....................................... 125
Figure 5-3. Voluntary exercise improves glucose tolerance and insulin sensitivity in KK/HIJ
female mice. ................................................................................................................................ 126
Figure 6-1. The role of hepcidin in exercise and obesity/type 2 diabetes. ................................. 143
Figure A1-1. Gating strategy for adipose tissue macrophages and macrophage subsets .......... 156
viii

List of Tables
Table 3-1. Subject information..................................................................................................... 64
Table 3-2. Primer sequences for monocyte gene expression. ...................................................... 65
Table 3-3. Iron- and inflammation- related monocyte gene expression ...................................... 66
Table 3-4. Complete blood cell count and hematologic results for CON and RUN. ................... 67
Table 4-1. Primers sequences for gene expression ...................................................................... 92
Table 4-2. Mouse tissue weights .................................................................................................. 93
Table 5-1. Primer sequences for adipose tissue gene expression. .............................................. 121
Table 5-2. Adipose tissue gene expression ................................................................................ 122
Table 5-3. Hematologic Measures in CON and EX group after 5weeks voluntary exercise
intervention. ................................................................................................................................ 123
Table A1-1. Quantification of FACS analysis ........................................................................... 155
ix

List of Appendices
Appendix 1. Additional Analysis for PROJECT#3 (Chapter 5) ....................................... 151
Appendix 2. Iron Regulation in Exercise Questionnaire-For Control Subjects ................ 158
Appendix 3. Iron Regulation in Exercise Questionnaire-For Exercise subjects ................ 162
Appendix 4. Pre-Screening Survey - Exercise and Iron Regulation .................................. 166
Appendix 5. Monocytes isolation protocol ........................................................................ 168
Appendix 6. Tissue iron analysis ....................................................................................... 170
x

Abstract
Iron dysregulation can lead to serious health concerns resulting from either too much or too little
iron storage and availability. For example, iron deficiency anemia results in a reduced exercise
tolerance, while chronic conditions such as obesity and type 2 diabetes may predispose individuals
to tissue iron overload. The relatively recent discovery of hepcidin, the major iron-regulating
hormone, has led to new hypotheses regarding conditions of iron dysregulation, including
exercise-induced iron deficiency. A series of recent studies have suggested that exercise-induced
iron deficiency might result from a transient increase in circulating hepcidin following acute
exercise. However, it is unclear whether there is a cumulative effect of multiple acute excursions
of hepcidin in response to everyday training. On the opposite end of the iron dysregulation
spectrum, excess iron deposition is a potential contributor to the pathology of obesity-related
metabolic complications. However, the underlying mechanisms are still unclear. The major
findings from my dissertation studies include: in STUDY#1, the iron-regulating hormone,
hepcidin, is not chronically elevated with sustained training in competitive collegiate runners, who
have a high risk of iron deficiency (p>0.05); In STUDY#2, a high level of iron in the epididymal
adipose tissue was accompanied by a robust adipose tissue remodeling, characterized by increased
macrophages, fibrosis, cell death and elevated inflammation; In Study#3, five weeks voluntary
exercise reduced weight, improved glucose intolerance and altered adipose tissue inflammatory
gene expression in female polygenic obese KK mice. Contrary to our hypothesis, in STUDY#3,
exercise did not improve the serum iron levels in KK mice and in STUDY#2 we observed no
relationship between adipose tissue iron deposition and
xi

glucose homeostasis. Together the three projects enhanced our understanding of the underlying
cause of exercise-induced iron deficiency anemia in female athletes as well as the relationship
among the risks of diabetes, iron overload and exercise.
xii

Chapter 1
Statement of Problems
Iron is vital for oxygen transport, enzymatic activity and other metabolic reactions within the body.
It plays an essential role as a cofactor for fuel oxidation and electron transport, but it also has the
potential to cause oxidative damage if not carefully regulated [1]. Iron dysregulation can lead to
serious health concerns, for example, insufficiency leads to anemia and excess iron leads to organ
damage (e.g. heart, liver and pancreas). In order to further understand iron regulation in health and
disease, my dissertation focused on: 1) investigating the abundance of iron-regulating hormone,
hepcidin, in highly trained female distance runners; 2) analyzing polygenic obese mouse model
with iron overload in adipose tissue; and 3) examining the influence of exercise on iron
homeostasis and adipose tissue inflammation in a polygenic obese female mouse model.
Iron deficiency can directly affect health and well-being, and even modest iron deficiency (ID) can
decrease athletic performance. Nutritional iron deficiency is the most frequent cause of anemia.
The diagnosis of anemia includes iron-related indicators such as low hemoglobin, decreased serum
ferritin (an iron storage protein), reduced mean corpuscular volume (mean red blood cell size) [2],
and low transferrin saturation (an indicator of iron binding capacity) [3, 4]. Female endurance
athletes are highly susceptible to the development of ID [5, 6] and iron deficiency anemia (IDA)
[7, 8]. This has typically been attributed to one or more of the following mechanism: excessive
1

menstrual bleeding[6], hemolysis[9, 10], hematuria[11-13], gastrointestinal bleeding [14-16],
sweating [13, 14, 17, 18], increased red blood cell turnover [19, 20], and exercise-related iron
absorption disorders [19]. A recently discovered protein, hepcidin, is critical to iron regulation and
may be important in exercise-related iron deficiency [21-23]. Hepcidin is a hormone expressed
primarily in the liver and released into circulation [24, 25]. It degrades and internalizes the iron
exporter, ferroportin, from the cell surface of important iron-regulating cells including the
macrophage of the reticuloendothelial system and epithelial cells of the intestine. An elevation in
hepcidin thereby results in increased iron retention in cells and decreased iron absorption from the
intestine [26, 27]. This combination ultimately reduces the circulating iron level and thereby
suppresses iron availability for erythropoiesis [28, 29]. In light of the increased prevalence of iron
deficiency in athletes, the discovery of this important iron regulatory hormone led to the hypothesis
that exercise might directly promote iron deficiency through increasing hepcidin. In support of this,
several studies have demonstrated a transient increase in urinary/serum hepcidin after acute
exercise and led to the hypothesis that this change contributes to the high prevalence of IDA in
athletes [9, 30-33]. Although a transient hepcidin increase was observed after acute exercise, it is
still unclear whether there is an additive or cumulative effect of multiple acute excursions of
hepcidin in response to everyday training. As such, in this dissertation, the main objective of my
first project was to investigate whether hepcidin is chronically up-regulated at rest in highly
trained female distance runners.
In addition to the issues resulting from iron deficiency, iron accumulation can also lead to serious
consequences. My second project focused on the investigation of excessive iron accumulation
and the related metabolic outcomes. In particular, iron has been suggested to be a possible
2

contributor to the pathology of obesity and insulin resistance in Type 2 Diabetes Mellitus (T2DM)
[34-37]. Excessive iron has been shown to increase T2DM risks, while lowering iron level can
improve insulin sensitivity in obese individuals [37-39]. To better understand the mechanism of
how iron increases T2DM risks, my second project was to study iron in a polygenic obese mouse
model, the inbred KK/HIJ (KK) mouse. This mouse strain has often been used for studying
metabolic syndrome because of the presence of impaired glucose homeostasis [40]. Their elevated
serum iron concentration also provides an intriguing model for evaluating the influence of iron in
the setting of obesity and insulin resistance. We have recently observed a >100-fold increase of
iron levels in the epididymal fat pad of KK males mice. In my dissertation, the second project
investigated the localization of iron deposition, examined the association between adipose tissue
iron overload and adipose tissue inflammation as well as the metabolic dysfunction in this
polygenic obese male mouse model.
My third project focused on the influence of exercise on iron homeostasis and adipose tissue
inflammation in a polygenic obese female mouse model. Recently, adipose tissue iron
metabolism has received attention because iron dysregulation has been recognized as a potential
contributor to the pathology of obesity-related metabolic complications, such as type 2 diabetes
mellitus (T2DM). Some studies have demonstrated elevated iron stores to precede insulin
resistance [41, 42], while lowering serum iron was demonstrated to increase insulin sensitivity [43,
44]. Although exercise has been observed to contribute to weight loss and improvements in insulin
resistance [45], the influence of exercise on adipose tissue inflammation is still being explored.
Several recently published studies suggested a decrease of adipose tissue inflammation after short-
term exercise intervention in high fat diet-induced obese male mice or rats [46-48]. However, there
3

is a paucity of data regarding the role of exercise on adipose tissue inflammation in obese females,
primarily because effective models for such studies have not been developed; the importance of
studying female models is becoming recognized as a vital effort due to important clinical
differences between female and male physiology and pathophysiology [49]. Therefore, the aim of
my third project was to evaluate the influence of exercise on metabolic function, iron
homeostasis and adipose tissue inflammation in a mouse strain with inherently obese females.
The outline of my dissertation is as follows:
A. Iron regulation project with human subjects
• Determination of resting serum hepcidin in highly trained female distance runners
[PROJECT 1].
B. Iron regulation projects with animal model
• The association between adipose tissue iron overload and adipose tissue inflammation
and metabolic dysfunction in a polygenic obese male mouse model [PROJECT 2].
• The influence of exercise on adipose tissue inflammation and iron homeostasis in a
polygenic obese female mouse model [PROJECT 3].
Overall, the significance of my first project was to broaden our knowledge of iron deficiency in
female athletes, which may ultimately help to reduce the prevalence and improve the treatment of
this condition. The second and third projects, related to iron regulation in a polygenic obese mouse
model, which facilitate our understanding of the role of iron homeostasis and adipose tissue
inflammation in the setting of metabolic dysfunction. Together, these studies advance our
understanding about iron regulation in health and disease by expanding our knowledge in
4

the areas of 1) hepcidin in iron homeostasis in female athletes; 2) adipose tissue iron
deposition; and 3) the effect of exercise on iron homeostasis and adipose tissue inflammation.
5

References:
1. Datz, C., et al., Iron homeostasis in the metabolic syndrome. Eur J Clin Invest, 2013.
43(2): p. 215-24.
2. De Domenico, I., D. McVey Ward, and J. Kaplan, Regulation of iron acquisition and storage: consequences for iron-linked disorders. Nat Rev Mol Cell Biol, 2008. 9(1): p. 72-81.
3. Cook, J.D., Clinical evaluation of iron deficiency. Semin Hematol, 1982. 19(1): p. 6-18.
4. Killip, S., J.M. Bennett, and M.D. Chambers, Iron deficiency anemia. Am Fam Physician, 2007. 75(5): p. 671-8.
5. Lehmberg, K., et al., Administration of recombinant erythropoietin alone does not improve the phenotype in iron refractory iron deficiency anemia patients. Ann Hematol, 2013. 92(3): p. 387-94.
6. Risser, W.L., et al., Iron deficiency in female athletes: its prevalence and impact on performance. Medcine and Science in Sports and Exercise, 1988. 20(2): p. 116-21.
7. McClung, J.P., Iron status and the female athlete. J Trace Elem Med Biol, 2012. 26(2-3): p. 124-6.
8. Sandstrom, G., M. Borjesson, and S. Rodjer, Iron deficiency in adolescent female athletes - is iron status affected by regular sporting activity? Clin J Sport Med, 2012. 22(6): p. 495-500.
9. Peeling, P., et al., Cumulative effects of consecutive running sessions on hemolysis, inflammation and hepcidin activity. Eur J Appl Physiol, 2009. 106(1): p. 51-9.
10. Yusof, A., et al., Exercise-induced hemolysis is caused by protein modification and most evident during the early phase of an ultraendurance race. J Appl Physiol (1985), 2007. 102(2): p. 582-6.
11. Abarbanel, J., et al., Sports hematuria. J Urol, 1990. 143(5): p. 887-90.
12. Blacklock, N.J., Bladder trauma in the long-distance runner: "10,000 metres haematuria". Br J Urol, 1977. 49(2): p. 129-32.
13. McInnis, M.D., et al., The effect of exercise intensity on hematuria in healthy male runners. Eur J Appl Physiol Occup Physiol, 1998. 79(1): p. 99-105.
14. Babic, Z., et al., Occult gastrointestinal bleeding in rugby player. J Sports Med Phys Fitness, 2001. 41(3): p. 399-402.
6

15. Otte, J.A., et al., Exercise induces gastric ischemia in healthy volunteers: a tonometry study. J Appl Physiol (1985), 2001. 91(2): p. 866-71.
16. Stewart, J.G., et al., Gastrointestinal blood loss and anemia in runners. Ann Intern Med, 1984. 100(6): p. 843-5.
17. DeRuisseau, K.C., et al., Sweat iron and zinc losses during prolonged exercise. Int J Sport Nutr Exerc Metab, 2002. 12(4): p. 428-37.
18. Zoller, H. and W. Vogel, Iron supplementation in athletes--first do no harm. Nutrition, 2004. 20(7-8): p. 615-9.
19. Shaskey, D.J. and G.A. Green, Sports haematology. Sports Med, 2000. 29(1): p. 27-38.
20. Weight, L.M., M.J. Byrne, and P. Jacobs, Haemolytic effects of exercise. Clin Sci (Lond), 1991. 81(2): p. 147-52.
21. Kong, W.N., G. Gao, and Y.Z. Chang, Hepcidin and sports anemia. Cell Biosci, 2014. 4: p. 19.
22. Peeling, P., Exercise as a mediator of hepcidin activity in athletes. Eur J Appl Physiol, 2010. 110(5): p. 877-83.
23. Peeling, P., et al., Athletic induced iron deficiency: new insights into the role of inflammation, cytokines and hormones. Eur J Appl Physiol, 2008. 103(4): p. 381-91.
24. Park, C.H., et al., Hepcidin, a urinary antimicrobial peptide synthesized in the liver. J Biol Chem, 2001. 276(11): p. 7806-10.
25. Ganz, T., Hepcidin, a key regulator of iron metabolism and mediator of anemia of inflammation. Blood, 2003. 102(3): p. 783-8.
26. Nemeth, E., et al., Hepcidin regulates cellular iron efflux by binding to ferroportin and inducing its internalization. Science, 2004. 306(5704): p. 2090-3.
27. Singh, B., et al., Hepcidin: a novel peptide hormone regulating iron metabolism. Clin Chim Acta, 2011. 412(11-12): p. 823-30.
28. Kautz, L. and E. Nemeth, Molecular liaisons between erythropoiesis and iron metabolism. Blood, 2014.
29. Koury, M.J. and P. Ponka, New insights into erythropoiesis: the roles of folate, vitamin B12, and iron. Annu Rev Nutr, 2004. 24: p. 105-31.
30. Newlin, M.K., et al., The effects of acute exercise bouts on hepcidin in women. Int J Sport Nutr Exerc Metab, 2012. 22(2): p. 79-88.
31. Peeling, P., et al., Effects of exercise on hepcidin response and iron metabolism during recovery. Int J Sport Nutr Exerc Metab, 2009. 19(6): p. 583-97.
7

32. Roecker, L., et al., Iron-regulatory protein hepcidin is increased in female athletes after a marathon. Eur J Appl Physiol, 2005. 95(5-6): p. 569-71.
33. Peeling, P., et al., Training surface and intensity: inflammation, hemolysis, and hepcidin expression. Med Sci Sports Exerc, 2009. 41(5): p. 1138-45.
34. Fernandez-Real, J.M., A. Lopez-Bermejo, and W. Ricart, Cross-talk between iron metabolism and diabetes. Diabetes, 2002. 51(8): p. 2348-54.
35. Montonen, J., et al., Body iron stores and risk of type 2 diabetes: results from the European Prospective Investigation into Cancer and Nutrition (EPIC)-Potsdam study. Diabetologia, 2012. 55(10): p. 2613-21.
36. Rajpathak, S.N., et al., The role of iron in type 2 diabetes in humans. Biochim Biophys Acta, 2009. 1790(7): p. 671-81.
37. Simcox, J.A. and D.A. McClain, Iron and diabetes risk. Cell Metab, 2013. 17(3): p. 329-41.
38. Cooksey, R.C., et al., Dietary iron restriction or iron chelation protects from diabetes and loss of beta-cell function in the obese (ob/ob lep-/-) mouse. Am J Physiol Endocrinol Metab, 2010. 298(6): p. E1236-43.
39. Gabrielsen, J.S., et al., Adipocyte iron regulates adiponectin and insulin sensitivity. J Clin Invest, 2012. 122(10): p. 3529-40.
40. Herberg, L. and D.L. Coleman, Laboratory animals exhibiting obesity and diabetes syndromes. Metabolism, 1977. 26(1): p. 59-99.
41. Forouhi, N.G., et al., Elevated serum ferritin levels predict new-onset type 2 diabetes: results from the EPIC-Norfolk prospective study. Diabetologia, 2007. 50(5): p. 949-56.
42. Jiang, R., et al., Body iron stores in relation to risk of type 2 diabetes in apparently healthy women. Jama, 2004. 291(6): p. 711-7.
43. Facchini, F.S., Effect of phlebotomy on plasma glucose and insulin concentrations. Diabetes Care, 1998. 21(12): p. 2190.
44. Fernandez-Real, J.M., et al., Blood letting in high-ferritin type 2 diabetes: effects on insulin sensitivity and beta-cell function. Diabetes, 2002. 51(4): p. 1000-4.
45. Bradley, R.L., et al., Voluntary exercise improves insulin sensitivity and adipose tissue inflammation in diet-induced obese mice. Am J Physiol Endocrinol Metab, 2008. 295(3): p. E586-94.
46. Baynard, T., et al., Exercise training effects on inflammatory gene expression in white adipose tissue of young mice. Mediators Inflamm, 2012. 2012: p. 767953.
8

47. Kawanishi, N., et al., Exercise attenuates M1 macrophages and CD8+ T cells in the adipose tissue of obese mice. Med Sci Sports Exerc, 2013. 45(9): p. 1684-93.
48. Oliveira, A.G., et al., Acute exercise induces a phenotypic switch in adipose tissue macrophage polarization in diet-induced obese rats. Obesity (Silver Spring), 2013. 21(12): p. 2545-56.
49. Pollitzer, E., Biology: Cell sex matters. Nature, 2013. 500(7460): p. 23-4.
9

Chapter 2
Review of Literature
Epidemiology of iron deficiency and iron overload Iron deficiency (ID) affects almost 50% of the population in developing and ~10% in developed
countries, making it the most common nutritional deficiency [1, 2]. Iron deficiency anemia (IDA)
is the end state of iron deficiency and IDA is the most common form of anemia. To date, this
fundamental health issue continues to affect the health and quality of life in billions of people all
over the world. The World Health Organization (WHO) estimates that anemia affects nearly two
billion people worldwide, which is nearly one third of the rapidly growing world population of
approximately seven billion people [3]. These figures indicate that anemia constitutes a big health
problem in many countries. In addition, there is a clear gender difference, with iron deficiency
being more prevalent among women [4, 5].
The female athletic population is at a heightened risk for IDA [6]. Iron is essential to produce
adequate hemoglobin for red blood cell production (erythropoiesis) and IDA results in profound
decrements in endurance performance [7-9]. The classic criteria used to diagnose IDA in females
is ferritin levels below 12 μg/L accompanied by hemoglobin concentrations below 12 g/dL.
Additional indicators include small red blood cell size (microcytic) and pale red blood cell color
10

(hypochromic), low hematocrit (the red blood cell volume to the total blood volume), low mean
corpuscular volume [10], and high soluble transferrin receptor concentration [11]. Maintaining
adequate iron stores is a high priority to athletes and coaches; however, iron deficiency continues
to be prevalent in this population.
In addition to the issues resulting from iron deficiency, iron accumulation can also lead to serious
consequences. In particular, iron has been suggested to be a possible contributor to the pathology
of obesity and insulin resistance in T2DM. This is of great importance as obesity is a common and
increasing worldwide health problem with two-thirds of the U.S. population classified as
overweight or obese [12]. Along with this alarming prevalence of obesity, there is also a very high
incidence of obesity-related diseases, such as Type 2 Diabetes Mellitus (T2DM) [13, 14]. Over
twenty-five million people in the United States have T2DM, and there are nearly two million new
cases reported each year [15]. Approximately 35% of U.S. adults have impaired fasting glucose
and are at heightened risk of developing T2DM (Centers for Disease Control and Prevention).
These health consequences also contribute to the growing financial burden of society and
individuals. For example, according to American Diabetes Association, the estimated costs of
diagnosed diabetes care in the United States was $245 billion in 2012 and average medical
expenditures exceeded $13,000 per year for people with diabetes (American Diabetes Association)
[16]. So far, the studied mechanisms include an abnormality in insulin signaling (reviewed in [17]),
beta cell failure[18], activation of stress pathways [19, 20], mitochondrial dysfunction [21],
alteration of hepatic fuel homeostasis [22], central nervous system dysregulation [23] and adipose
tissue inflammation [24, 25]. However, the direct cause(s) of type 2 diabetes and underlying
mechanisms remain largely unknown. Since obesity is a well-known contributor to this disorder,
11

close attention has also been paid to the contribution of nutrients and nutrient-sensing pathways in
situations of chronic caloric excess. Most of the interest in the role of nutrients in diabetes is
centered on macronutrients, but a micronutrient, iron, is also associated with diabetes risk.
Understanding the mechanisms by which increased iron deposition might increase diabetes risk is
critical to optimize the prevention and treatment of the disease.
Iron recycling is a highly regulated process
Iron plays an important role in energy production, oxygen utilization, and cellular proliferation. It
can act as an electron donor as well as an electron acceptor because of the flexibility of
interconverting between ferric (Fe3+) and ferrous (Fe2+) oxidation states. This makes iron an
irreplaceable component of oxygen transport (hemoglobin) and storage (myoglobin),
cytochromes, and enzymes (containing heme and/or nonheme, reviewed in [26]). However, the
ease with which iron changes its oxidation state also allows iron to form the reactive oxygen
species, including oxygen ions and peroxides, which can damage DNA, lipids, and protein
enzymes. Subsequently these alterations can result in cellular dysfunction, apoptosis, and necrosis
[27] (also reviewed in book [28]). In other words, if too little iron is available (iron deficiency),
limitations on the synthesis of physiologically active iron-containing compounds can have harmful
consequences. Alternatively, if too much iron accumulates (iron overload) and exceeds the body's
capacity for safe transport and storage, iron toxicity may produce widespread organ damage and
death. Collectively, both total body iron and cellular iron concentrations need to be carefully
regulated to ensure adequate iron availability without leading to excess iron toxicity.
12

The iron cycle is a highly regulated process. Iron is absorbed into the duodenal enterocytes and
can be stored or transported out of the basolateral surface of the enterocyte. If it enters the
circulation, it is bound to transferrin, a protein that subsequently transports iron to target cells.
Most iron is stored in bone marrow and is used for the production of red blood cells. After about
120 days, this iron is typically recycled as senescent red blood cells are engulfed by macrophages.
The iron is then stored as ferritin in hepatocytes and macrophages as part of the reticuloendothelial
system (Figure 2-1).
13

Figure 2-1. Iron recyclng in human body.
This figure depicts the flow of iron in mammals: from iron absorption (in the duodenum), to iron-transferrin (Fe-Tf) formation, to major iron utilization (the erythroid bone marrow), to circulating erythrocytes (red blood cells), to tissue macrophages that phagocytose senescent erythrocytes and recycle iron in the spleen (step not shown), to storage in liver hepatocytes, and back to Fe-Tf. Hepcidin is expressed and secreted mainly from liver via factors such as HFE, TfR and HJV. Elevated iron concentration in hepatocytes and inflammation both promote hepcidin production, whereas erythroid demands and hypoxia decrease its production. Hepcidin controls plasma iron concentration by both inhibiting iron absorption from the diet and sequestering iron in cells. Abbreviations: HFE: gene encoding human hemochromatosis protein; TfR: transferrin receptor; HJV, gene encoding hemojuvelin protein. Adapted from [29] and [28].
14

As shown in Figure 2-1, iron homeostasis is mainly regulated by hepcidin, a small peptide hormone
[30]. At times of iron overload, hepcidin, produced mainly from liver due to various stimuli, can
prevent cellular iron export [31]. Hepcidin regulates the exclusive cellular iron exporter,
ferroportin [32, 33]. This iron regulator inhibits iron export from macrophages and enteric cells by
binding to and inducing degradation of ferroportin, causing sequestration of iron in these cells
(Figure 2-2). This reduces both intestinal iron absorption and iron release from macrophages into
the circulation [34]. Hepcidin is encoded by the HAMP gene which results in the production of the
80 amino acid pre-pro-hormone [35]. Numerous pro-protein convertases can then cleave pre-pro-
hepcidin to the 25 amino acid active peptide [36]. HAMP expression is induced by iron overload
and inflammation as the body’s main pathway avoiding excessive iron. Hepcidin levels can also
increase during states of inflammation as a protective mechanism to reduce free iron in the
presence of possible bacterial infection [32, 37, 38]. This response is mediated by the action of
various cytokines including the pro-inflammatory cytokine interleukin-6 (IL-6), which induces
HAMP expression [39]. In addition to liver-derived hepcidin, the monocyte and macrophage have
been demonstrated to produce and secrete hepcidin and attenuate iron release through autocrine
and paracrine mechanisms [40, 41]. Thus, monocyte hepcidin has the potential to sequester iron
and thereby reduce the amount of iron available for erythropoiesis. In addition, iron sequestration
in macrophage may lead to an increased pro-inflammatory state in the cell [42].
15

Figure 2-2. The role of hepcidin in systemic iron homeostasis.
In the duodenal lumen, dietary iron is presented to the enterocyte as heme or nonheme iron. Heme iron is taken up by heme carrier protein (HCP-1) and heme-oxygenase 1(HO-1) is required for releasing iron from heme. Nonheme iron is predominantly ferric (Fe3+), which must first be converted to ferrous (Fe2+) by ferrireductase, such as duodenal cytochrome B (DcytB), before absorption. Ferrous iron is then transported across the apical membrane by the divalent metal transporter 1 (DMT1) in to the cell. Once inside the enterocyte, the absorbed iron enters into a common cytosolic iron pool. If the iron is not required for hemoglobin production, it is stored in ferritin protein in the cell. Iron required by the body is transported across the basolateral membrane by ferroportin (FPN), and the exported iron requires ferroxidase hephaesin (HEPH). In addition, hepcidin, expressed primarily in liver, inhibits iron absorption from the diet and the release from macrophages and hepatocytes. Abbreviations: HCP-1, heme carrier protein; HO-1, heme oxygenase 1; DcytB, duodenum cytochrome B; DMT1, divalent metal transporter 1; FPN, ferroportin; HEPH, hephaesin; TfR, transferrin receptor. Adapted from [26] and [43].
16

Different types and causes of iron deficiency
Iron deficiency occurs when the amount of body iron decreases due to insufficient iron supply.
Three consecutive stages of decreased iron have been described [29] (Figure 2-3). The first stage
is iron depletion, which begins when iron losses continually exceed iron absorption and recycling.
This results in an isolated decrease in plasma/serum ferritin levels and a decrease in iron storage
without a decline in functional iron level. The second stage is iron-deficiency erythropoiesis. After
the exhaustion of iron stores, the production of hemoglobin and other iron-dependent metabolically
active compounds become limited. In response, plasma/serum ferritin levels are low, transferrin
saturation is decreased (<15%) and the total iron binding capacity is increased (>390 μg/dL). At
the third stage, a further decrease in body iron leads to frank iron-deficiency anemia, where the
levels of hemoglobin (<12g/dL), iron (<40 μg/dL), and transferrin saturation (<10%) are decreased
and total iron binding capacity (>410 μg/dL) is increased (Figure 2-3).
There are various types and causes of iron deficiency. The ability to differentially diagnose the
type and/or cause of the iron deficiency is critical for identifying optimal treatment strategies.
Parameters including hemoglobin, mean corpuscular volume (MCV), plasma/serum iron,
plasma/serum ferritin and total iron binding capacity (TIBC) are commonly used in the
determination of iron deficiency. However, in order to differentiate between IDA, iron refractory
iron deficiency anemia (IRIDA), anemia of chronic disease (ACD; also referred to as anemia of
inflammatory response, Figure 2-3) and exercise-induced anemia, more tests are necessary. An
elevation of circulating (plasma or serum) hepcidin concentration has very recently been used to
characterize cases of IRIDA [44-46]. This measure has been used to separate IRIDA from IDA
because IDA patients have low plasma/serum hepcidin levels. This discrepancy between the two
17

conditions relates to the important role of TMPRSS6 (which is mutated in IRIDA) to suppress
HAMP expression when iron stores are low [47, 48]. In addition, the circulating concentration of
soluble transferrin receptor (TfR) is also a useful indicator for iron deficiency [49-53]. TfR
promotes iron uptake by binding diferric transferrin and transporting iron into the cytosol of iron
requiring cells (e.g. erythroblasts). Cells deficient in iron upregulate TfR expression to compete
for the circulating transferrin-bound iron [54, 55]. The soluble form of TfR (sTfR) is typically
measured in plasma or serum and is used diagnostically because it is proportional to cellular TfR
[56]. Consistent with this, concentrations of sTfR are increased in IDA and IRIDA patients but are
within the normal range in ACD patients [57], which provide additional diagnostic measures to
differentiate between the different types of anemia. Unfortunately, testing to conclusively
differentiate exercise-related iron deficiency anemia from other forms of anemia will still require
a more complete understanding of the specific mechanisms that cause exercise-related anemia(s).
18

Figure 2-3. The changes of erythroid iron and storage iron (hepatocyte and reticuloendothelial macrophage) in the presence of decreased body iron content.
Different indicators of iron status are shown in the development of anemia from normal to iron deficiency anemia (including the 3 stages of iron deficiency anemia development). Plasma hepcidin, ferritin, iron, transferrin saturation and MCV decrease, whereas TIBC and plasma TfR increase with increased iron deficiency. Iron refractory iron deficiency anemia (IRIDA) is similar to iron deficiency anemia with the exception of hepcidin concentration, which is significantly higher in IRIDA. In anemia of chronic disease, plasma TfR is normal. Abbreviations: TIBC, total iron binding capacity; MCV, mean corpuscular volume; TfR, transferrin receptor; N, normal. , high; , low. Adapted from [29] and [28].
19

Mechanisms of exercise-related iron deficiency anemia
It is important to note that the treatment for iron deficiency in athletes should be carefully
governed. Endurance trained athletes, especially female athletes, often have low blood hemoglobin
levels. It is so common for female endurance athletes to have reduced hemoglobin that it has given
rise to the concept of “sports anemia” [58, 59]. However, this concept is controversial because: 1)
not all highly trained athletes acquire an iron deficient state; and 2) it does not consider
hemodilution and other parameters, such as transferrin saturation, total iron binding capacity,
serum ferritin or mean corpuscular volume to determine if iron levels are sufficient. Therefore,
some scientists in the field have considered “sports anemia” as nothing more than “dilutional
pseudo-anemia” suggesting that it is not truly an anemic state but simply the dilution of the
hemoglobin due to an enhancement in plasma volume. Studies have demonstrated that many
highly trained athletes, who have relatively low hemoglobin concentration, maintain a high red
blood cell mass and normal body iron stores [60-64]. In addition to the increase in plasma volume,
training also can induce an increase in erythropoiesis [60]. However, these two responses are
independent and the result of different stimuli. The increase in plasma volume is regulated by
changes in osmotic pressure, which depends on hormonal and protein responses to short and long-
term exercise [60]. On the other hand, erythropoiesis depends on the production and release of
erythropoietin, which is regulated by oxygen content of the blood perfusing the kidneys [60].
Therefore, “sports anemia” is not a true iron deficiency anemia.
Because of the possibility for athletes to have pseudoanemia and therefore to maintain adequate
iron stores, the practice of continuous iron supplementation is not prudent for athletes without
demonstrated evidence of iron deficiency. Henegauer et. al and Tsalis et. al. showed that iron
20

intake did not affect serum ferritin, serum iron, transferrin saturation, final hemoglobin, or
hematocrit with high intensity exercise training. Thus, it seems that neither dietary iron availability
nor iron supplementation appears to have an influence on the phenomenon of "sports anemia"[65,
66]. As such, the treatment for “sports anemia” (or “pseudo-anemia”) should be carefully
examined. Self-medication should not be encouraged because of potential iron intolerance, the risk
of overdose, and potential interaction with other medications.
Despite the possibility that some athletes will maintain adequate iron stores, the evidence for
female endurance athletes is that many experience a continuous struggle to avoid iron deficiency.
This has been the focus of many research studies and several mechanisms of iron loss have been
attributed to exercise training. The following list outlines the most commonly touted potential
mechanisms:
1) Gastrointestinal blood loss [67]: during exercise, blood flow to the gastrointestinal tract
is compromised due to the increased blood requirement to muscles and skin [68, 69]. A 56% blood
flow reduction can occur during exercise due to increased sympathetic nervous system activity
driven by a high exercise intensity [70, 71]. As a result, the gastrointestinal tract may be deprived
of oxygen and metabolic substrates, leading to necrosis and mucosal bleeding [69].
2) Hematuria [72], which is the presence of blood in the urine due to intense exercise.
Increased bladder movement during exercise, especially running, may cause bleeding of the
interior wall [73].
3) Hemolysis, the destruction of red blood cells during exercise. This implicates a
mechanism of iron loss, since the destruction of the red blood cell membrane allows the
hemoglobin and associated iron within the cell to be released to the plasma [74].
21

4) Iron-loss from sweating during exercise. This is another mechanism by which the body
may lose iron. One study outlined that sweat can lead to about 0.14mg/L of iron loss, and the iron
loss from prolonged time and multiple training sessions may impact on body iron status [75].
5) Excessive menstruation in female athletes [8, 76]. Rowland et al. showed an inverse
correlation between the amount of menstrual flow and serum ferritin level [76].
6) Elevation of the iron-regulatory hormone, hepcidin. Several studies have suggested that
increased hepcidin, associated with exercise-induced inflammation, may represent an important
mechanism for exercise-induced iron deficiency anemia [77-80].
The following section will introduce detailed information about exercise and hepcidin.
Does exercise induce iron deficiency via increasing hepcidin?
Studies have shown that exercise can transiently elevate hepcidin. The scientists in this field have
speculated that these transient elevations result from acute exercise-induced inflammation and that
long-term training could promote an iron-depleted state over time [77, 78, 80-82]. Iron is absorbed
by enterocytes in the duodenum and proximal jejunum; however, only about 5% (non-heme
sources) to 25% (heme sources) of the iron in the diet is typically absorbed [83, 84]. The majority
of the body’s iron stores are recycled from senescent red blood cells by splenic and hepatic tissue
macrophages [85]. Circulating monocytes also play an important role in iron recycling by clearing
hemoglobin-haptoglobin complexes that result from intravascular hemolysis. As described in the
previous section, the iron recycled by monocytes/macrophages after phagocytosis of senescent red
blood cells represents the main iron supply for erythropoiesis in the bone marrow [10]. Hormonal
control, exerted primarily through hepcidin, contributes to iron homeostasis through influencing
22

iron export from the macrophage and enterocyte (Figure 2-2) [86]. Considering the high
prevalence of iron deficiency anemia in the highly-trained population, hepcidin might be a
mechanistic connection between exercise and iron deficiency anemia in athletes.
A significant elevation in hepcidin has been observed in specific groups with anemia associated
with inflammation and/or chronic diseases (for example, anemia of chronic disease (ACD)) [35,
39, 42, 87-90]. In these conditions, anemia is secondary to an up-regulation of hepcidin induced
by chronic inflammation [90]. Exercise training-induced inflammation, possibly through
activation of the acute phase response and/or elevation in circulating IL-6, may promote a similar
set of symptoms including elevated hepcidin [91-93]. Recent studies have described a transient
elevation in serum hepcidin levels approximately three hours after exercise [93-95]. However,
other studies demonstrated that hepcidin is decreased in IDA and low iron stores directly suppress
hepcidin concentration [48, 96]. In addition, many of the published studies have focused on urinary
hepcidin and/or the response to a single exercise stimulus [93, 97-101]. Despite the growing body
of evidence on the topic, the clinical significance of the hepcidin response to exercise and its
relevance to IDA has yet to be established.
Cellular hepcidin regulation and iron homeostasis
As discussed above, iron homeostasis is maintained by the hormone, hepcidin, through effects
mediated by the iron export protein, ferroportin. Ferroportin, which is expressed on the surface of
iron-releasing cells, is triggered for degradation by hepcidin binding [35, 96]. Hence, hepcidin
binding to cellular ferroportin leads to iron sequestration and reduces plasma iron levels. As
described above, it regulates intestinal iron absorption, macrophage-mediated iron recycling from
23

senescent erythrocytes, and iron mobilization from hepatic stores [102]. On the other hand,
hepcidin expression is influenced by systemic stimuli such as iron stores, systemic iron
availability, the rate of erythropoiesis, inflammation, hypoxia and oxidative stress. These stimuli
control hepcidin levels by acting through hepatocyte cell surface proteins including human
hemochromatosis protein (HFE), transferrin receptor 2 (TfR2), hemojuvelin (HJV), TMPRSS6
and the interleukin 6 receptor (IL-6R) [103].
Iron availability for erythropoiesis and cellular functions is determined by the amount of iron
bound transferrin that circulates in the plasma. In the duodenum, in order to be absorbed and pass
iron transporters, ferric iron (Fe3+) is first reduced to ferrous iron (Fe2+) by ferrireductase
duodenal cytochrome b (DCTB). Ferrous ions then enter the enterocyte through the divalent metal
ion transporter1 (DMT1 or SLC11A2). Iron is next transported to the basolateral side of the cell
and exits the enterocyte through ferroportin (FPN or SLC40A1), which is the only known iron
export channel [104]. The iron is oxidized to Fe3+ by ferroxidase hephaestin (HEPH), whereupon
it is bound to transferrin Fe(III)-Tf and can be readily taken up by all cell types via the ubiquitously
expressed transferrin receptors (TfRs), TfR1 and TfR2 [50, 105]. In addition, transferrin saturation
is the ratio of serum iron to the total iron-binding capacity. Its measure in serum is a sensitive
indicator of functional iron deficiency [50]. Transferrin-bound iron also interacts with the
hepatocyte TfR2 and the protein HFE on the surface of hepatocytes [106]. A signaling pathway
including hemojuvelin (HJV), bone morphogenic protein 6 (BMP6) [107, 108], and SMAD
(Human homolog of Drosophila mad) [109] stimulates the production of hepcidin (Figure 2-4).
Therefore, the membrane proteins HFE, TfR2 and HJV contribute to hepcidin regulation.
Furthermore, HJV is a glycophosphatidylinositol (GPI)-anchored protein that acts as a bone-
24

morphogenetic protein (BMP) co-receptor, driving hepcidin transcription via the BMP/SMAD
signaling cascade [110]. Disease-associated dysregulation in HJV causes a severe phenotype of
iron overload, indicating that the HJV/BMP pathway plays a critical role in maintaining basal
hepcidin levels [108, 111].
25

Figure 2-4. Schematic representation of the regulation of hepcidin expression.
Matriptase-2 is encoded by TMPRSS6 gene. TMPRSS6 gene mutation suppresses the interaction of MT-2 and hemojuvelin (HJV) (indicated by the red lighting bolt), which prevents the fragmentation of HJV. The reaction of BMP-BMPR and BMP co-receptor HJV activates the signaling cascade. BMP receptors (BMPR) at the plasma membrane induce phosphorylation of receptor-activated SMAD (R-SMAD) proteins. The subsequent formation of active transcriptional complexes involves the co-SMAD factor SMAD4. The complexes activate hepcidin transcription via bone morphogenetic protein (BMP)/SMAD signaling. Abbreviations: MT-2, Matriptase-2; HJV, hemojuvelin; BMP, bone morphogenetic protein; BMPR, BMP receptor; SMAD, Smad protein; HMAP, gene encodes hepcidin. Adapted from [44].
26

The association between iron regulation and T2DM risks
Interestingly, iron stores are also associated with T2DM. The Third National Health and Nutrition
Examination Survey (NHANES III) studied ~ 9,500 participants and demonstrated that increased
serum ferritin, a marker of body iron stores, was strongly associated with newly diagnosed diabetes
[112]. Furthermore, elevated serum hepcidin levels have been observed in prediabetic patients with
impaired fasting glucose [113]. Finally, insulin resistance has also been observed in beta
thalassemia major patients with iron overload [114, 115]. However, all of these associations do
not provide evidence for iron playing a causative role in glucose dysregulation. Nevertheless,
many studies have demonstrated elevated iron stores to precede insulin resistance and/or T2DM.
For example, Jiang et al. used a prospective cohort study design to demonstrate that an elevation
of baseline serum ferritin was associated with an increased risk of T2DM during a 10 year follow-
up of ~33,000 participants in the Nurses Health Study [116]. Additionally, without age, BMI,
gender, family history, physical inactivity, smoking and diet factors, Forrouhi et al. showed that
serum ferritin can predict the development of diabetes in the EPIC-Norfolk study [117].
Furthermore, recent studies have demonstrated that lowering serum iron decreased T2D risks. For
example, in subjects with diabetes and high ferritin levels [118], as well as in healthy subjects with
normal serum ferritin levels [119], a phlebotomy intervention reduced body iron stores and
increased their insulin sensitivity This growing body of evidence further suggests that iron may
directly contribute to T2DM risks.
Dysregulation of iron homeostatic pathways may be especially prominent in the setting of chronic
inflammation. It has been well accepted that obesity, an important risk factor to T2DM, is
27

associated with chronic low-grade inflammation. White adipose tissue (WAT) is not only a major
site for fat storage, it is also a major endocrine and secretory organ, which releases a wide range
of protein signals and factors such as adipokines. A number of adipokines, including leptin,
adiponectin, tumor necrosis factor α (TNFα), IL-1β (interleukin 1β), interleukin-6 (IL-6),
monocyte chemotactic protein-1, macrophage migration inhibitory factor, vascular endothelial
growth factor, and plasminogen activator inhibitor 1, are linked to inflammation and the
inflammatory response [120]. Obesity alters adipose tissue metabolic and endocrine function and
leads to an increased release of fatty acids and pro-inflammatory molecules that contribute to
obesity-associated complications [120]. In 1995, Spiegelman and colleagues first characterized the
link between inflammation, obesity and insulin resistance via tumor necrosis factor-alpha (TNFa),
which is a pro-inflammatory cytokine that was found to impair insulin signaling via serine site
phosphorylation on insulin receptor substrate 1 (IRS1) [121].
Macrophages in WAT can also play an active role in obesity, and macrophage-related
inflammatory activities may contribute to the pathogenesis of obesity-induced insulin resistance
[122]. The metabolic disorders in the setting of obesity may partially result from increased
macrophage infiltration in the adipose tissue and elevated levels of circulating inflammation
markers such as interleukin-6 (IL-6), tumor necrosis factor (TNFα), C-reactive protein (CRP), and
macrophage chemoattractant protein (MCP-1) [123]. In 2003, Ferrante et. al characterized the
macrophage changes that occur in the adipose tissue with increasing adiposity. Adipose tissue
macrophages are responsible for the secretion of many cytokines, including TNF-α, iNOS and IL6
[124]. This indicates that adipose tissue macrophage numbers increase in obesity and participate
in inflammatory pathways that are activated in adipose tissues of obese individuals [124]. It is
28

important to recognize that subsets of macrophages play differing roles in inflammation. Two
subsets are most commonly described: M1 macrophages are thought to promote a chronic low-
grade inflammation in adipose tissue, while M2 macrophages are thought to provide an anti-
inflammatory influence [125]. In addition to the difference in their numbers, adipose tissue
macrophages in lean and obese animals exhibit distinct cellular localizations and inflammatory
potentials [126]. Using a special dye (PKH26) technique, Oh et al. demonstrated that high fat diet
induces an increase of macrophage infiltration to the adipose tissue [127]. In addition, this study
also demonstrated that monocytes are not pre-programmed to become inflammatory ATMs, but
rather become pro-inflammatory in response to the tissue signals present in the obese condition
[127]. One possible iron signal that promotes inflammation in the setting of obesity is iron. For
example, the increased oxidative stress via elevated iron has been demonstrated to promote
inflammation [128, 129]. Tajima et al. studied an obese and diabetic mouse model (KK/Ay) and
demonstrated that a reduced iron diet resulted in an amelioration of adipocyte hypertrophy by
suppressing oxidative stress, inflammatory cytokines (such as TNF-α, IL-6, IL-1β, and MCP-1),
and macrophage infiltration, thereby breaking a vicious cycle in obesity [130]. Adiponectin, an
adipokine secreted from adipose tissue, is inversely associated with adipose tissue mass and
causally linked to insulin sensitivity. Studies in mice, human and cell culture have demonstrated
that iron lowers adiponectin production and increases diabetes risk [131]. To this end, iron has
been demonstrated to play an important role in metabolic syndrome including detrimental effects
on adipocyte function and modulation of metabolism through inflammation and oxidative stress.
However, it should be noted that the pathology of diabetes and iron overload is controversial. Thus,
a better understanding of the influence of iron on obesity and insulin sensitivity is needed.
29

Adipose tissue iron metabolism has recently received considerable attention. Adipocytes express
not only common iron homeostasis regulators such as ferritin and iron-regulatory proteins [132],
but also iron-related proteins with restricted tissue expression (TfR2, HFE, and hepcidin) [133,
134]. Iron overload has been demonstrated to promote adipocyte insulin resistance [131, 135],
whereas strategies to reduce iron concentration (e.g., low iron diet, chelation therapy, and
phlebotomy) have led to improvements in insulin sensitivity in obese animal models [130, 136,
137] and humans [118, 131, 138, 139]. Regarding the effect of insulin metabolism on iron
regulation, insulin treatment promotes iron uptake by increasing cell-surface expression of TfR1
in adipocytes [140, 141]. These studies, combined with the fact that macrophages play the
predominant role in controlling systemic iron recycling [142], raise the possibility that ATM iron
handling contributes to AT homeostasis. Furthermore, animal studies have demonstrated that
obesity induces an increase in M1 polarization [126, 143], which, based on in vitro studies, may
further promote iron deposition [144, 145]. Interestingly, Orr et. al. recently indicated that high
fat diet promotes iron partitioning to adipocytes and also reduces the iron handling capacity in
adipose tissue macrophage [146]. Clearly, more studies are needed to understand adipose tissue
iron deposition and its influence on obesity-related metabolic consequences.
The influence of exercise on T2DM and adipose tissue inflammation
It is importatnt to note that both exercise and weight loss have been shown to improve glucose
tolerance. For example, acute exercise or exercise training without weight loss can increase
skeletal muscle glucose uptake and improve insulin sensitivity [147-149]. In addition, calorie
restriction or bariatric surgery induced weight loss can also improve insulin sensitivity by
decreasing fat mass, changing the adipokines release (reviewed by [150]) and reducing fatty acid
mobilization [151]. Therefore both exercise and weight loss are important and independent factors
30

resulting in improved insulin sensitivity. In this literature review, I will focus on the inflence of
exercise.
Physical inactivity and sedentary behavior also increase the risk of metabolic disorder. An inactive
lifestyle leads to the accumulation of visceral fat, and this is accompanied by adipose tissue
infiltration by pro-inflammatory immune cells, increased release of adipokines and the
development of a low-grade systemic inflammatory state [152]. Again, this low-grade systemic
inflammation has been associated with the development of insulin resistance in T2DM[123].
Exercise, on the other hand, has a beneficial effect on metabolic control. It may reduce the risk of
developing obesity and excessive adiposity by increasing energy expenditure. In addition, regular
exercise can improve the blood lipid profile and therefore promote cardiovascular health, for
example, exercise increases the concentration of protective high-density lipoprotein (HDL)
cholesterol and decrease the concentration of low-density lipoprotein (LDL) and plasma
triglycerides. [153]. These beneficial adjustments in plasma lipids are considered to limit the
development of obesity and T2DM [153]. However, it has been suggested that exercise exerts an
anti-inflammatory influence on adipose tissue [154], which might be another important benefit of
exercise against obesity- related complications. The proposed mechanisms of this anti-
inflammatory effect include: increased levels of cortisol and adrenaline [155, 156]; elevated IL-6
and other myokines from working skeletal muscle [157]; a rising number of circulating T-
regulatory cells [158]; a decrease in the monocyte / macrophage expression of Toll Like Receptors
(TLRs) [154, 157, 159]; and/or a reduced number of circulating pro-inflammatory monocytes [154,
157, 158, 160, 161]. In addition, gene expression studies of adipose tissue RNA have led to
speculation that exercise accelerates the polarization of macrophage toward an anti-inflammatory
(M2) phenotype from a pro-inflammatory (M1) phenotype [162]. However, despite the evidence
31
to data, future studies are needed to delineate the direct role of exercise on changes in adipose
tissue inflammation.
Although exercise has been observed to contribute to weight loss and improvements in insulin
resistance [154], the influence of exercise on adipose tissue inflammation is still being explored.
Several recently published studies suggested a decrease of adipose tissue inflammation after short-
term exercise intervention in high fat diet-induced obese male mice or rats without weight loss
[160, 161, 163]. However, there is a paucity of data regarding the role of exercise on adipose tissue
inflammation in obese females, primarily because effective models for such studies have not been
developed; the importance of studying female models as well as males is becoming recognized as
a vital effort due to important clinical differences between female and male physiology and
pathophysiology [164]. In addition, iron dysregulation is a potential contributor to the pathology
of obesity-related metabolic complications, such as type 2 diabetes mellitus (T2DM). Studies have
demonstrated elevated iron stores to precede insulin resistance [116, 117], while lowering serum
iron can increase insulin sensitivity [118, 134]. Therefore, the aims of the third study were to
evaluate the influence of exercise on metabolic function, adipose tissue inflammation and iron
homeostasis in a mouse strain with inherently obese females.
Mouse model, KK/HIJ polygenic obese mice
The KK/HIJ strain is a model of metabolic dysfunction, displaying severe insulin resistance,
hyperglycemia, and obesity without dietary intervention [165, 166]. This inbred mouse strain was
first published in 1944, from studies resulting from K. Kondo’s breeding of Nishiki-nezumi
Japanese fancy mice in Kasukabe and subsequent inbreeding of the so-called “KK substrains”
[167-169]. These KK substrains have often been used for studying metabolic dysfunction because
of their glucose intolerance and insulin resistance, which result in hyperglycemia [170-172]. This
32

mouse strain also has elevated serum iron level, which makes it a suitable model for studying iron
and metabolic dysfunction in my third project.
33
Summary of review of literature The overall objective of my dissertation projects is to examine iron regulation in both health and
disease. Although recent studies suggest that the transient increase in circulating hepcidin after
acute exercise might promote iron deficiency anemia in athletes [77-79, 82, 173], it is unclear
whether there is an additive or cumulative effect of multiple acute excursions of hepcidin in
response to everyday training. Therefore, the first project was to broaden our knowledge of iron
deficiency anemia with the aim to improve the treatment and reduce the prevalence of anemia. On
the opposite end of the iron dysregulation spectrum, excess iron storage is a potential
contributor to the pathology of obesity-related metabolic complications. Iron overload has
been demonstrated to promote adipocyte insulin resistance [131, 135], whereas strategies to reduce
iron concentration (e.g., low iron diet, chelation therapy, and phlebotomy) have led to
improvements in insulin sensitivity in obese animal models [130, 136, 137] and humans [118, 131,
138, 139]. However, the mechanisms underlying adipose tissue iron deposition and its influence
on obesity-related metabolic consequences are still unclear. Therefore, the second project used a
unique mouse model to facilitate our understanding of the role of adipose tissue iron in metabolic
dysfunction (e.g. glucose homeostasis). Although exercise has been observed to promote
improvements in insulin resistance [154], the influence of exercise on adipose tissue inflammation
and iron regulation in the setting of obesity is still being explored. As a close association has been
observed between iron dysregulation, inflammation and diabetes [130, 174, 175], a better
understanding of iron regulation could greatly improve the prevention and treatment of iron
disorders research and treatment of iron disorders including iron deficiency and iron overload and
their subsequent complications. Together, these studies will call attention to the importance of iron
regulation in health and disease and specifically expand our knowledge in the areas of 1) hepcidin
and exercise; 2) adipose tissue iron deposition and metabolic dysfunction; and 3) the influence of
34

exercise on adipose tissue inflammation and iron homeostasis in a polygenic obese female mouse
model.
35

References:
1. Denic, S. and M.M. Agarwal, Nutritional iron deficiency: an evolutionary perspective. Nutrition, 2007. 23(7-8): p. 603-14.
2. Milman, N., Anemia--still a major health problem in many parts of the world! Ann Hematol, 2011. 90(4): p. 369-77.
3. WHO. Iron Deficiency Anemia: Assessment, Prevention, and Control. A guide for program managers. 2001; Available from: http://whqlibdoc.who.int/hq/2001/WHO_NHD_01.3.pdf.
4. Zimmermann, M.B. and R.F. Hurrell, Nutritional iron deficiency. Lancet, 2007. 370(9586): p. 511-20.
5. Hallberg, L., Perspectives on nutritional iron deficiency. Annu Rev Nutr, 2001. 21: p. 1-21.
6. Beard, J. and B. Tobin, Iron status and exercise. The American journal of clinical nutrition, 2000. 72(2 Suppl): p. 594S-7S.
7. LaManca, J.J. and E.M. Haymes, Effects of iron repletion on VO2max, endurance, and blood lactate in women. Medcine and Science in Sports and Exercise, 1993. 25(12): p. 1386-92.
8. Risser, W.L., et al., Iron deficiency in female athletes: its prevalence and impact on performance. Medcine and Science in Sports and Exercise, 1988. 20(2): p. 116-21.
9. Beard, J. and B. Tobin, Iron status and exercise. Am J Clin Nutr, 2000. 72(2 Suppl): p. 594S-7S.
10. De Domenico, I., D. McVey Ward, and J. Kaplan, Regulation of iron acquisition and storage: consequences for iron-linked disorders. Nature reviews. Molecular cell biology, 2008. 9(1): p. 72-81.
11. Killip, S., J.M. Bennett, and M.D. Chambers, Iron deficiency anemia. American family physician, 2007. 75(5): p. 671-8.
12. Flegal, K.M., et al., Prevalence and trends in obesity among US adults, 1999-2008. Jama, 2010. 303(3): p. 235-41.
13. Gordon-Larsen, P., N.S. The, and L.S. Adair, Longitudinal trends in obesity in the United States from adolescence to the third decade of life. Obesity (Silver Spring), 2010. 18(9): p. 1801-4.
14. Fox, C.S., et al., Trends in the incidence of type 2 diabetes mellitus from the 1970s to the 1990s: the Framingham Heart Study. Circulation, 2006. 113(25): p. 2914-8.
36

15. CDCP. National Diabetes Fact Sheet, 2011. 2011 [cited 2014 February]; Available from: http://www.cdc.gov/diabetes/pubs/factsheet11.htm
16. American Diabetes, A., Economic costs of diabetes in the U.S. in 2012. Diabetes Care, 2013. 36(4): p. 1033-46.
17. Kahn, B.B. and L. Rossetti, Type 2 diabetes--who is conducting the orchestra? Nat Genet, 1998. 20(3): p. 223-5.
18. Halban, P.A., et al., beta-Cell Failure in Type 2 Diabetes: Postulated Mechanisms and Prospects for Prevention and Treatment. Diabetes Care, 2014.
19. Kaneto, H., et al., Oxidative stress, ER stress, and the JNK pathway in type 2 diabetes. J Mol Med (Berl), 2005. 83(6): p. 429-39.
20. Takada, A., et al., Role of ER stress in ventricular contractile dysfunction in type 2 diabetes. PLoS One, 2012. 7(6): p. e39893.
21. Lowell, B.B. and G.I. Shulman, Mitochondrial dysfunction and type 2 diabetes. Science, 2005. 307(5708): p. 384-7.
22. Hegarty, B.D., et al., Insulin resistance and fuel homeostasis: the role of AMP-activated protein kinase. Acta Physiol (Oxf), 2009. 196(1): p. 129-45.
23. Jannetta, P.J., et al., Type 2 diabetes mellitus: A central nervous system etiology. Surg Neurol Int, 2010. 1.
24. Hotamisligil, G.S., Inflammatory pathways and insulin action. Int J Obes Relat Metab Disord, 2003. 27 Suppl 3: p. S53-5.
25. Wellen, K.E. and G.S. Hotamisligil, Obesity-induced inflammatory changes in adipose tissue. J Clin Invest, 2003. 112(12): p. 1785-8.
26. Andrews, N.C., Forging a field: the golden age of iron biology. Blood, 2008. 112(2): p. 219-30.
27. Bothwell, T.H. and R.W. Charlton, Current problems of iron overload. Recent Results Cancer Res, 1979. 69: p. 87-95.
28. Ronald Hoffman, E.J.B., Leslie E. Silberstein, Helen E. Heslop, Jeffrey I. Weitz, and John Anastasi, Hematology: Basic Principles and Practice. 6 ed. 2013, Philadelphia, PA Elsevier Health Sciences.
29. Bothwell, T.H., Iron metabolism in man. 1979, Oxford: Blackwell Scientific. 576.
30. Nemeth, E. and T. Ganz, The role of hepcidin in iron metabolism. Acta haematologica, 2009. 122(2-3): p. 78-86.
37

31. Nemeth, E. and T. Ganz, Regulation of iron metabolism by hepcidin. Annu Rev Nutr, 2006. 26: p. 323-42.
32. Pigeon, C., et al., A new mouse liver-specific gene, encoding a protein homologous to human antimicrobial peptide hepcidin, is overexpressed during iron overload. The Journal of biological chemistry, 2001. 276(11): p. 7811-9.
33. Nemeth, E., et al., Hepcidin, a putative mediator of anemia of inflammation, is a type II acute-phase protein. Blood, 2003. 101(7): p. 2461-3.
34. Ganz, T., Hepcidin--a regulator of intestinal iron absorption and iron recycling by macrophages. Best practice & research. Clinical haematology, 2005. 18(2): p. 171-82.
35. Ganz, T., Hepcidin, a key regulator of iron metabolism and mediator of anemia of inflammation. Blood, 2003. 102(3): p. 783-8.
36. Schranz, M., et al., Activation and inactivation of the iron hormone hepcidin: Biochemical characterization of prohepcidin cleavage and sequential degradation to N-terminally truncated hepcidin isoforms. Blood cells, molecules & diseases, 2009. 43(2): p. 169-79.
37. Park, C.H., et al., Hepcidin, a urinary antimicrobial peptide synthesized in the liver. The Journal of biological chemistry, 2001. 276(11): p. 7806-10.
38. Krause, A., et al., LEAP-1, a novel highly disulfide-bonded human peptide, exhibits antimicrobial activity. FEBS letters, 2000. 480(2-3): p. 147-50.
39. Nemeth, E., et al., IL-6 mediates hypoferremia of inflammation by inducing the synthesis of the iron regulatory hormone hepcidin. The Journal of clinical investigation, 2004. 113(9): p. 1271-6.
40. Peyssonnaux, C., et al., TLR4-dependent hepcidin expression by myeloid cells in response to bacterial pathogens. Blood, 2006. 107(9): p. 3727-32.
41. Theurl, I., et al., Autocrine formation of hepcidin induces iron retention in human monocytes. Blood, 2008. 111(4): p. 2392-9.
42. Ganz, T. and E. Nemeth, Iron sequestration and anemia of inflammation. Seminars in hematology, 2009. 46(4): p. 387-93.
43. Sandra Ribeiro, E.s.C., Luıs Belo, Flavio Reis and Alice Santos- Silva, rhEPO for the Treatment of Erythropoietin Resistant Anemia in Hemodialysis Patients – Risks and Benefits, Hemodialysis, ed. P.H. Suzuki. 2013.
44. Finberg, K.E., Iron-refractory iron deficiency anemia. Semin Hematol, 2009. 46(4): p. 378-86.
38

45. Finberg, K.E., et al., Mutations in TMPRSS6 cause iron-refractory iron deficiency anemia (IRIDA). Nat Genet, 2008. 40(5): p. 569-71.
46. Melis, M.A., et al., A mutation in the TMPRSS6 gene, encoding a transmembrane serine protease that suppresses hepcidin production, in familial iron deficiency anemia refractory to oral iron. Haematologica, 2008. 93(10): p. 1473-9.
47. Choi, H.S., et al., Serum hepcidin levels and iron parameters in children with iron deficiency. Korean J Hematol, 2012. 47(4): p. 286-92.
48. Krijt, J., et al., Effect of iron overload and iron deficiency on liver hemojuvelin protein. PLoS One, 2012. 7(5): p. e37391.
49. Allen, J., et al., Measurement of soluble transferrin receptor in serum of healthy adults. Clin Chem, 1998. 44(1): p. 35-9.
50. Beguin, Y., Soluble transferrin receptor for the evaluation of erythropoiesis and iron status. Clin Chim Acta, 2003. 329(1-2): p. 9-22.
51. Berlin, T., et al., Soluble transferrin receptor as a diagnostic laboratory test for detection of iron deficiency anemia in acute illness of hospitalized patients. Isr Med Assoc J, 2011. 13(2): p. 96-8.
52. Braga, F., et al., Soluble transferrin receptor in complicated anemia. Clin Chim Acta, 2014. 431C: p. 143-147.
53. De Block, C.E., et al., Soluble transferrin receptor level: a new marker of iron deficiency anemia, a common manifestation of gastric autoimmunity in type 1 diabetes. Diabetes Care, 2000. 23(9): p. 1384-8.
54. Nadeem, S., et al., Serum transferrin receptor, serum ferritin and serum transferrin receptor-ferritin index in adults with iron deficiency anaemia. J Ayub Med Coll Abbottabad, 2011. 23(3): p. 44-6.
55. Skikne, B.S., C.H. Flowers, and J.D. Cook, Serum transferrin receptor: a quantitative measure of tissue iron deficiency. Blood, 1990. 75(9): p. 1870-6.
56. Beguin, Y., et al., Transferrin receptors in rat plasma. Proc Natl Acad Sci U S A, 1988. 85(2): p. 637-40.
57. Punnonen, K., K. Irjala, and A. Rajamaki, Serum transferrin receptor and its ratio to serum ferritin in the diagnosis of iron deficiency. Blood, 1997. 89(3): p. 1052-7.
58. Yoshimura, H., Anemia during physical training (sports anemia). Nutr Rev, 1970. 28(10): p. 251-3.
39

59. Yoshimura, H., et al., Anemia during hard physical training (sports anemia) and its causal mechanism with special reference to protein nutrition. World Rev Nutr Diet, 1980. 35: p. 1-86.
60. Convertino, V.A., Blood volume: its adaptation to endurance training. Med Sci Sports Exerc, 1991. 23(12): p. 1338-48.
61. Dressendorfer, R.H., et al., Development of runner's anemia during a 20-day road race: effect of iron supplements. Int J Sports Med, 1991. 12(3): p. 332-6.
62. Schmidt, W., et al., Training induced effects on blood volume, erythrocyte turnover and haemoglobin oxygen binding properties. Eur J Appl Physiol Occup Physiol, 1988. 57(4): p. 490-8.
63. Weight, L.M., 'Sports anaemia'. Does it exist? Sports Med, 1993. 16(1): p. 1-4.
64. Weight, L.M., B.L. Darge, and P. Jacobs, Athletes' pseudoanaemia. Eur J Appl Physiol Occup Physiol, 1991. 62(5): p. 358-62.
65. Hegenauer, J., et al., Transitory hematologic effects of moderate exercise are not influenced by iron supplementation. Eur J Appl Physiol Occup Physiol, 1983. 52(1): p. 57-61.
66. Tsalis, G., M.G. Nikolaidis, and V. Mougios, Effects of iron intake through food or supplement on iron status and performance of healthy adolescent swimmers during a training season. Int J Sports Med, 2004. 25(4): p. 306-13.
67. Stewart, J.G., et al., Gastrointestinal blood loss and anemia in runners. Ann Intern Med, 1984. 100(6): p. 843-5.
68. Otte, J.A., et al., Exercise induces gastric ischemia in healthy volunteers: a tonometry study. J Appl Physiol (1985), 2001. 91(2): p. 866-71.
69. Peters, H.P., et al., Potential benefits and hazards of physical activity and exercise on the gastrointestinal tract. Gut, 2001. 48(3): p. 435-9.
70. Osada, T., et al., Reduced blood flow in abdominal viscera measured by Doppler ultrasound during one-legged knee extension. J Appl Physiol (1985), 1999. 86(2): p. 709-19.
71. Rowell, L.B., Human cardiovascular adjustments to exercise and thermal stress. Physiol Rev, 1974. 54(1): p. 75-159.
72. Abarbanel, J., et al., Sports hematuria. J Urol, 1990. 143(5): p. 887-90.
73. Blacklock, N.J., Bladder trauma in the long-distance runner: "10,000 metres haematuria". Br J Urol, 1977. 49(2): p. 129-32.
40

74. Reeder, B.J. and M.T. Wilson, Hemoglobin and myoglobin associated oxidative stress: from molecular mechanisms to disease States. Curr Med Chem, 2005. 12(23): p. 2741-51.
75. Waller, M.F. and E.M. Haymes, The effects of heat and exercise on sweat iron loss. Med Sci Sports Exerc, 1996. 28(2): p. 197-203.
76. Rowland, T.W. and J.F. Kelleher, Iron deficiency in athletes. Insights from high school swimmers. Am J Dis Child, 1989. 143(2): p. 197-200.
77. Newlin, M.K., et al., The effects of acute exercise bouts on hepcidin in women. Int J Sport Nutr Exerc Metab, 2012. 22(2): p. 79-88.
78. Peeling, P., et al., Effects of exercise on hepcidin response and iron metabolism during recovery. Int J Sport Nutr Exerc Metab, 2009. 19(6): p. 583-97.
79. Peeling, P., et al., Iron status and the acute post-exercise hepcidin response in athletes. PLoS One, 2014. 9(3): p. e93002.
80. Roecker, L., et al., Iron-regulatory protein hepcidin is increased in female athletes after a marathon. Eur J Appl Physiol, 2005. 95(5-6): p. 569-71.
81. Peeling, P., et al., Cumulative effects of consecutive running sessions on hemolysis, inflammation and hepcidin activity. Eur J Appl Physiol, 2009. 106(1): p. 51-9.
82. Peeling, P., et al., Training surface and intensity: inflammation, hemolysis, and hepcidin expression. Med Sci Sports Exerc, 2009. 41(5): p. 1138-45.
83. Aspuru, K., et al., Optimal management of iron deficiency anemia due to poor dietary intake. Int J Gen Med, 2011. 4: p. 741-50.
84. Roughead, Z.K. and J.R. Hunt, Adaptation in iron absorption: iron supplementation reduces nonheme-iron but not heme-iron absorption from food. Am J Clin Nutr, 2000. 72(4): p. 982-9.
85. Ganz, T., Macrophages and Systemic Iron Homeostasis. Journal of innate immunity, 2012.
86. Andrews, N.C. and P.J. Schmidt, Iron homeostasis. Annual review of physiology, 2007. 69: p. 69-85.
87. Nicolas, G., et al., The gene encoding the iron regulatory peptide hepcidin is regulated by anemia, hypoxia, and inflammation. The Journal of clinical investigation, 2002. 110(7): p. 1037-44.
88. Andrews, N.C., Anemia of inflammation: the cytokine-hepcidin link. The Journal of clinical investigation, 2004. 113(9): p. 1251-3.
41

89. Cheng, P.P., et al., Hepcidin expression in anemia of chronic disease and concomitant iron-deficiency anemia. Clinical and experimental medicine, 2011. 11(1): p. 33-42.
90. Theurl, I., et al., Regulation of iron homeostasis in anemia of chronic disease and iron deficiency anemia: diagnostic and therapeutic implications. Blood, 2009. 113(21): p. 5277-86.
91. Peeling, P., et al., Athletic induced iron deficiency: new insights into the role of inflammation, cytokines and hormones. European journal of applied physiology, 2008. 103(4): p. 381-91.
92. Banzet, S., et al., Interleukin-6 contributes to hepcidin mRNA increase in response to exercise. Cytokine, 2012. 58(2): p. 158-61.
93. Newlin, M.K., et al., The effects of acute exercise bouts on hepcidin in women. International journal of sport nutrition and exercise metabolism, 2012. 22(2): p. 79-88.
94. Sim, M., et al., The effects of carbohydrate ingestion during endurance running on post-exercise inflammation and hepcidin levels. European journal of applied physiology, 2012. 112(5): p. 1889-98.
95. Sim, M., et al., Effect of Exercise Modality and Intensity on Post-Exercise Interleukin-6 and Hepcidin Levels. International journal of sport nutrition and exercise metabolism, 2012.
96. Nemeth, E., et al., Hepcidin regulates cellular iron efflux by binding to ferroportin and inducing its internalization. Science, 2004. 306(5704): p. 2090-3.
97. Roecker, L., et al., Iron-regulatory protein hepcidin is increased in female athletes after a marathon. European journal of applied physiology, 2005. 95(5-6): p. 569-71.
98. Peeling, P., et al., Effects of exercise on hepcidin response and iron metabolism during recovery. International journal of sport nutrition and exercise metabolism, 2009. 19(6): p. 583-97.
99. Robson-Ansley, P., I. Walshe, and D. Ward, The effect of carbohydrate ingestion on plasma interleukin-6, hepcidin and iron concentrations following prolonged exercise. Cytokine, 2011. 53(2): p. 196-200.
100. Peeling, P., et al., Cumulative effects of consecutive running sessions on hemolysis, inflammation and hepcidin activity. European journal of applied physiology, 2009. 106(1): p. 51-9.
101. Peeling, P., et al., Training surface and intensity: inflammation, hemolysis, and hepcidin expression. Medicine and science in sports and exercise, 2009. 41(5): p. 1138-45.
42

102. Knutson, M.D., et al., Iron release from macrophages after erythrophagocytosis is up-regulated by ferroportin 1 overexpression and down-regulated by hepcidin. Proc Natl Acad Sci U S A, 2005. 102(5): p. 1324-8.
103. Darshan, D. and G.J. Anderson, Interacting signals in the control of hepcidin expression. Biometals, 2009. 22(1): p. 77-87.
104. Robens, J., Hepcidin: the link to understanding iron regulation. MLO Med Lab Obs, 2010. 42(10): p. 10, 12, 14; quiz 18-9.
105. Skikne, B.S., Serum transferrin receptor. Am J Hematol, 2008. 83(11): p. 872-5.
106. D'Alessio, F., M.W. Hentze, and M.U. Muckenthaler, The hemochromatosis proteins HFE, TfR2, and HJV form a membrane-associated protein complex for hepcidin regulation. J Hepatol, 2012. 57(5): p. 1052-60.
107. Corradini, E., et al., Bone morphogenetic protein signaling is impaired in an HFE knockout mouse model of hemochromatosis. Gastroenterology, 2009. 137(4): p. 1489-97.
108. Meynard, D., et al., Lack of the bone morphogenetic protein BMP6 induces massive iron overload. Nat Genet, 2009. 41(4): p. 478-81.
109. Wang, R.H., et al., A role of SMAD4 in iron metabolism through the positive regulation of hepcidin expression. Cell Metab, 2005. 2(6): p. 399-409.
110. Babitt, J.L., et al., Bone morphogenetic protein signaling by hemojuvelin regulates hepcidin expression. Nat Genet, 2006. 38(5): p. 531-9.
111. Andriopoulos, B., Jr., et al., BMP6 is a key endogenous regulator of hepcidin expression and iron metabolism. Nat Genet, 2009. 41(4): p. 482-7.
112. Ford, E.S. and M.E. Cogswell, Diabetes and serum ferritin concentration among U.S. adults. Diabetes Care, 1999. 22(12): p. 1978-83.
113. Iwasaki, T., et al., Serum ferritin is associated with visceral fat area and subcutaneous fat area. Diabetes Care, 2005. 28(10): p. 2486-91.
114. Dmochowski, K., et al., Factors determining glucose tolerance in patients with thalassemia major. J Clin Endocrinol Metab, 1993. 77(2): p. 478-83.
115. Pappas, S., et al., Glucose intolerance in thalassemia major is related to insulin resistance and hepatic dysfunction. Metabolism, 1996. 45(5): p. 652-7.
116. Jiang, R., et al., Body iron stores in relation to risk of type 2 diabetes in apparently healthy women. Jama, 2004. 291(6): p. 711-7.
43

117. Forouhi, N.G., et al., Elevated serum ferritin levels predict new-onset type 2 diabetes: results from the EPIC-Norfolk prospective study. Diabetologia, 2007. 50(5): p. 949-56.
118. Fernandez-Real, J.M., et al., Blood letting in high-ferritin type 2 diabetes: effects on insulin sensitivity and beta-cell function. Diabetes, 2002. 51(4): p. 1000-4.
119. Facchini, F.S., Effect of phlebotomy on plasma glucose and insulin concentrations. Diabetes Care, 1998. 21(12): p. 2190.
120. Trayhurn, P. and I.S. Wood, Signalling role of adipose tissue: adipokines and inflammation in obesity. Biochem Soc Trans, 2005. 33(Pt 5): p. 1078-81.
121. Hotamisligil, G.S., et al., Increased adipose tissue expression of tumor necrosis factor-alpha in human obesity and insulin resistance. J Clin Invest, 1995. 95(5): p. 2409-15.
122. Xu, H., et al., Chronic inflammation in fat plays a crucial role in the development of obesity-related insulin resistance. J Clin Invest, 2003. 112(12): p. 1821-30.
123. Pradhan, A.D., et al., C-reactive protein, interleukin 6, and risk of developing type 2 diabetes mellitus. Jama, 2001. 286(3): p. 327-34.
124. Weisberg, S.P., et al., Obesity is associated with macrophage accumulation in adipose tissue. J Clin Invest, 2003. 112(12): p. 1796-808.
125. Chinetti-Gbaguidi, G. and B. Staels, Macrophage polarization in metabolic disorders: functions and regulation. Curr Opin Lipidol, 2011. 22(5): p. 365-72.
126. Lumeng, C.N., et al., Phenotypic switching of adipose tissue macrophages with obesity is generated by spatiotemporal differences in macrophage subtypes. Diabetes, 2008. 57(12): p. 3239-46.
127. Oh, D.Y., et al., Increased macrophage migration into adipose tissue in obese mice. Diabetes, 2010. 61(2): p. 346-54.
128. Walter, P.B., et al., Oxidative stress and inflammation in iron-overloaded patients with beta-thalassaemia or sickle cell disease. Br J Haematol, 2006. 135(2): p. 254-63.
129. Cighetti, G., et al., Oxidative status and malondialdehyde in beta-thalassaemia patients. Eur J Clin Invest, 2002. 32 Suppl 1: p. 55-60.
130. Tajima, S., et al., Iron reduction by deferoxamine leads to amelioration of adiposity via the regulation of oxidative stress and inflammation in obese and type 2 diabetes KKAy mice. Am J Physiol Endocrinol Metab, 2012. 302(1): p. E77-86.
131. Gabrielsen, J.S., et al., Adipocyte iron regulates adiponectin and insulin sensitivity. J Clin Invest, 2012. 122(10): p. 3529-40.
44

132. Festa, M., et al., Overexpression of H ferritin and up-regulation of iron regulatory protein genes during differentiation of 3T3-L1 pre-adipocytes. J Biol Chem, 2000. 275(47): p. 36708-12.
133. Bekri, S., et al., Increased adipose tissue expression of hepcidin in severe obesity is independent from diabetes and NASH. Gastroenterology, 2006. 131(3): p. 788-96.
134. Farahani, P., et al., Obesity in BSB mice is correlated with expression of genes for iron homeostasis and leptin. Obes Res, 2004. 12(2): p. 191-204.
135. Green, A., R. Basile, and J.M. Rumberger, Transferrin and iron induce insulin resistance of glucose transport in adipocytes. Metabolism, 2006. 55(8): p. 1042-5.
136. Minamiyama, Y., et al., Iron restriction improves type 2 diabetes mellitus in Otsuka Long-Evans Tokushima fatty rats. Am J Physiol Endocrinol Metab, 2010. 298(6): p. E1140-9.
137. Cooksey, R.C., et al., Dietary iron restriction or iron chelation protects from diabetes and loss of beta-cell function in the obese (ob/ob lep-/-) mouse. Am J Physiol Endocrinol Metab, 2010. 298(6): p. E1236-43.
138. Valenti, L., et al., Venesection for non-alcoholic fatty liver disease unresponsive to lifestyle counselling--a propensity score-adjusted observational study. Qjm, 2011. 104(2): p. 141-9.
139. Valenti, L., et al., Iron depletion by phlebotomy improves insulin resistance in patients with nonalcoholic fatty liver disease and hyperferritinemia: evidence from a case-control study. Am J Gastroenterol, 2007. 102(6): p. 1251-8.
140. Davis, R.J., S. Corvera, and M.P. Czech, Insulin stimulates cellular iron uptake and causes the redistribution of intracellular transferrin receptors to the plasma membrane. J Biol Chem, 1986. 261(19): p. 8708-11.
141. Tanner, L.I. and G.E. Lienhard, Insulin elicits a redistribution of transferrin receptors in 3T3-L1 adipocytes through an increase in the rate constant for receptor externalization. J Biol Chem, 1987. 262(19): p. 8975-80.
142. Ganz, T., Macrophages and systemic iron homeostasis. J Innate Immun, 2012. 4(5-6): p. 446-53.
143. Morris, D.L., K. Singer, and C.N. Lumeng, Adipose tissue macrophages: phenotypic plasticity and diversity in lean and obese states. Curr Opin Clin Nutr Metab Care, 2011. 14(4): p. 341-6.
144. Recalcati, S., et al., Differential regulation of iron homeostasis during human macrophage polarized activation. Eur J Immunol, 2010. 40(3): p. 824-35.
45

145. Corna, G., et al., Polarization dictates iron handling by inflammatory and alternatively activated macrophages. Haematologica, 2010. 95(11): p. 1814-22.
146. Orr, J.S., et al., Obesity Alters Adipose Tissue Macrophage Iron Content and Tissue Iron Distribution. Diabetes, 2013.
147. Duncan, G.E., et al., Exercise training, without weight loss, increases insulin sensitivity and postheparin plasma lipase activity in previously sedentary adults. Diabetes Care, 2003. 26(3): p. 557-62.
148. Goodyear, L.J. and B.B. Kahn, Exercise, glucose transport, and insulin sensitivity. Annu Rev Med, 1998. 49: p. 235-61.
149. Wojtaszewski, J.F., J.N. Nielsen, and E.A. Richter, Invited review: effect of acute exercise on insulin signaling and action in humans. J Appl Physiol (1985), 2002. 93(1): p. 384-92.
150. Gumbs, A.A., I.M. Modlin, and G.H. Ballantyne, Changes in insulin resistance following bariatric surgery: role of caloric restriction and weight loss. Obes Surg, 2005. 15(4): p. 462-73.
151. Schenk, S., et al., Improved insulin sensitivity after weight loss and exercise training is mediated by a reduction in plasma fatty acid mobilization, not enhanced oxidative capacity. J Physiol, 2009. 587(Pt 20): p. 4949-61.
152. Ouchi, N., et al., Adipokines in inflammation and metabolic disease. Nat Rev Immunol, 2011. 11(2): p. 85-97.
153. Kraus, W.E., et al., Effects of the amount and intensity of exercise on plasma lipoproteins. N Engl J Med, 2002. 347(19): p. 1483-92.
154. Bradley, R.L., et al., Voluntary exercise improves insulin sensitivity and adipose tissue inflammation in diet-induced obese mice. Am J Physiol Endocrinol Metab, 2008. 295(3): p. E586-94.
155. Pedersen, B.K. and C.P. Fischer, Beneficial health effects of exercise--the role of IL-6 as a myokine. Trends Pharmacol Sci, 2007. 28(4): p. 152-6.
156. Steensberg, A., et al., IL-6 enhances plasma IL-1ra, IL-10, and cortisol in humans. Am J Physiol Endocrinol Metab, 2003. 285(2): p. E433-7.
157. Mathur, N. and B.K. Pedersen, Exercise as a mean to control low-grade systemic inflammation. Mediators Inflamm, 2008. 2008: p. 109502.
158. Gleeson, M., et al., The anti-inflammatory effects of exercise: mechanisms and implications for the prevention and treatment of disease. Nat Rev Immunol, 2011. 11(9): p. 607-15.
46

159. Flynn, M.G. and B.K. McFarlin, Toll-like receptor 4: link to the anti-inflammatory effects of exercise? Exerc Sport Sci Rev, 2006. 34(4): p. 176-81.
160. Baynard, T., et al., Exercise training effects on inflammatory gene expression in white adipose tissue of young mice. Mediators Inflamm, 2012. 2012: p. 767953.
161. Kawanishi, N., et al., Exercise attenuates M1 macrophages and CD8+ T cells in the adipose tissue of obese mice. Med Sci Sports Exerc, 2013. 45(9): p. 1684-93.
162. Kawanishi, N., et al., Exercise training inhibits inflammation in adipose tissue via both suppression of macrophage infiltration and acceleration of phenotypic switching from M1 to M2 macrophages in high-fat-diet-induced obese mice. Exerc Immunol Rev, 2010. 16: p. 105-18.
163. Oliveira, A.G., et al., Acute exercise induces a phenotypic switch in adipose tissue macrophage polarization in diet-induced obese rats. Obesity (Silver Spring), 2013. 21(12): p. 2545-56.
164. Pollitzer, E., Biology: Cell sex matters. Nature, 2013. 500(7460): p. 23-4.
165. Herberg, L. and D.L. Coleman, Laboratory animals exhibiting obesity and diabetes syndromes. Metabolism, 1977. 26(1): p. 59-99.
166. Suto, J., et al., Genetic analysis of non-insulin-dependent diabetes mellitus in KK and KK-Ay mice. Eur J Endocrinol, 1998. 139(6): p. 654-61.
167. Kondo, K., et al., Inbred strains resulting from Japanese mice. Bull Experimental Animals, 1957(6): p. 107-112.
168. Nakamura, M., A diabetic strain of the mouse. Proceedings of the Japan Academy, 1962(38): p. 348-352.
169. Staats, J., Standardized nomenclature for inbred strains of mice: fifth listing. Cancer Res, 1972. 32(8): p. 1609-46.
170. Fujiwara, T., et al., Suppression of hepatic gluconeogenesis in long-term Troglitazone treated diabetic KK and C57BL/KsJ-db/db mice. Metabolism, 1995. 44(4): p. 486-90.
171. Fujiwara, T., et al., Characterization of new oral antidiabetic agent CS-045. Studies in KK and ob/ob mice and Zucker fatty rats. Diabetes, 1988. 37(11): p. 1549-58.
172. Reddi, A., et al., Biotin supplementation improves glucose and insulin tolerances in genetically diabetic KK mice. Life Sci, 1988. 42(13): p. 1323-30.
173. Sim, M., et al., Effect of exercise modality and intensity on post-exercise interleukin-6 and hepcidin levels. Int J Sport Nutr Exerc Metab, 2013. 23(2): p. 178-86.
47

174. Ashourpour, M., et al., Relationship between serum ferritin and inflammatory biomarkers with insulin resistance in a Persian population with type 2 diabetes and healthy people. Int J Food Sci Nutr, 2010. 61(3): p. 316-23.
175. Cheng, H.L., et al., The relationship between obesity and hypoferraemia in adults: a systematic review. Obes Rev, 2012. 13(2): p. 150-61.
48

Chapter 3
Serum hepcidin levels are not chronically elevated in collegiate female distance runners
Abstract
The prevalence of iron deficiency tends to be higher in athletic populations, especially among
endurance-trained females. Recent studies have provided evidence that the iron-regulating
hormone, hepcidin, is transiently increased with acute exercise and suggest that this may contribute
to iron deficiency anemia in athletes. This is mainly through the suppression of iron exporting
protein, ferroportin, by hepcidin. The purpose of this study was to determine whether resting serum
hepcidin is significantly elevated in highly trained female distance runners compared to a low
exercise control group. Due to the importance of the monocyte in the process of iron recycling,
monocyte expression of hepcidin was also measured. A single fasted blood sample was collected
mid-season from twenty female distance runners (RUN) averaging 81.9 ± 14.2 km of running per
week. Ten age-, gender-, and BMI-matched low exercise control subjects (CON) provided samples
during the same period using identical collection procedures. There was no difference between
RUN and CON for serum hepcidin levels (p=0.159). In addition, monocyte hepcidin gene
expression was not different between the two groups (p=0.635). Furthermore, no relationship
between weekly training volume and serum hepcidin concentration was evident among the trained
runners. The results suggest that hepcidin is not chronically elevated with sustained training in
competitive collegiate runners. This is an important finding because the current clinical conditions
that link hepcidin to anemia include a sustained elevation in serum hepcidin, Nevertheless,
49

additional studies are needed to determine the clinical relevance of the well-
documented, transient rise in hepcidin that follows acute sessions of exercise.
Keywords: Exercise, Iron deficiency, Monocytes
50

Introduction
The female athletic population is at a heightened risk for iron deficiency anemia [1]. Because iron
is essential to produce adequate hemoglobin for erythropoiesis, iron deficiency anemia results in
profound decrements in endurance performance [2-4]. Iron deficiency anemia is often diagnosed
in females with ferritin levels below 12 ug/L accompanied by hemoglobin concentration below 12
g/dL. Low hematocrit, low mean corpuscular volume (MCV), and high transferrin receptor values
are additional indicators of iron deficiency anemia [5]. Maintaining adequate iron stores is a high
priority for endurance performance; however, iron deficiency continues to be prevalent in female
endurance athletes.
Iron recycling is a highly regulated process. Iron depletion occurs when iron losses continually
exceed iron absorption and recycling. Exercise can contribute to iron loss in several ways,
including gastrointestinal blood loss [6], hematuria [7], and increased red cell turnover [8].
Menstruation also contributes to iron loss in females. Iron is absorbed by enterocytes in the
duodenum and proximal jejunum; however, only about 5% (non-heme sources) to 25% (heme
sources) of the iron in the diet is typically absorbed [9,10]. The majority of the body’s iron stores
are recycled from senescent red blood cells by splenic and hepatic tissue macrophages [11]. In
addition, the iron recycled by macrophages after phagocytosis of senescent red blood cells
represents the main iron supply for erythropoiesis in the bone marrow [12]. Hepcidin contributes
to iron homeostasis primarily through the macrophage and enterocyte [13].
Iron homeostasis is mainly regulated by hepcidin, a small peptide hormone produced primarily by
the liver [14]. It is encoded by the HAMP gene, which results in the production of the 80 amino
51

acid pre-pro-hormone [15]. Numerous pro-protein convertases can cleave pre-pro-hepcidin to the
25 amino acid active peptide [16]. HAMP is known to be induced by iron overload and
inflammation, and hepcidin regulates the exclusive cellular iron exporter, ferroportin [17, 18].
Hepcidin inhibits iron export from macrophages and enteric cells by binding to and inducing
degradation of ferroportin causing sequestration of iron in these cells. This reduces both intestinal
iron absorption and iron release from macrophages into the circulation [19]. Moreover, hepcidin
is proposed to be increased in states of inflammation as a protective mechanism to reduce free iron
in the presence of possible bacterial infection [17, 20, 21]. This response is mediated by the action
of various cytokines including the pro-inflammatory cytokine interleukin-6 (IL-6), which has been
shown to induce HAMP expression [22]. In addition to liver-derived hepcidin, the monocyte and
macrophage have been demonstrated to secrete hepcidin and attenuate iron release through an
autocrine mechanism [23] [24]. Thus, monocyte hepcidin has the potential to be detrimental to
health by reducing the amount of iron available for erythropoiesis, increasing the intracellular
macrophage iron content and increasing the pro-inflammatory state of the cell [25].
A significant elevation in hepcidin has been observed in specific groups with anemia associated
with inflammation and/or chronic diseases [15, 22, 25-29]. In these conditions, anemia is
secondary to an upregulation of hepcidin induced by chronic inflammation [29]. Exercise training-
induced inflammation, possibly through activation of the acute phase response and/or elevation in
circulating IL-6, has been speculated to promote a similar set of symptoms including elevated
hepcidin and iron deficiency anemia [30-32]. Several studies have described a transient elevation
in serum hepcidin levels approximately three hours after exercise [32-34]. However, many of the
published studies have focused on urinary hepcidin and/or the response to a single exercise
52

stimulus [32, 35-39]. Despite the growing literature on the topic, the clinical significance of the
hepcidin response to exercise and its relevance to iron deficiency anemia have yet to be established.
The purpose of this study was to determine whether a chronic hepcidin elevation is evident during
periods of high training in female runners. This was investigated through measurement of serum
hepcidin levels and other hematologic indicators in a cohort of collegiate female distance runners
and low exercise control subjects. In addition, isolated monocytes were examined to investigate a
potential influence of endurance exercise training on inflammatory and iron regulatory gene
expression.
Methods
Subjects. A cohort of twenty female runners (RUN) were recruited from a NCAA Division I
Varsity Cross Country team with cross-country 5 kilometer personal best times between 17 and 20
minutes. A control group (CON) was comprised of ten age- and BMI-matched female subjects
with low levels of exercise (Table 3-1). The study was approved by the Institutional Review Board
of the University of Michigan. Subjects were informed of the requirements of the study before
consenting to participation. All subjects were female between 18 and 23 years of age. None of the
subjects were pregnant or lactating, and there was no evidence or history of cardiovascular or
metabolic disease.
A preliminary questionnaire was conducted before the blood collection to gather information
regarding vitamin and iron supplementation, training level, lifestyle trends, and menstrual history.
RUN reported average training distance per week, which was converted to minutes per week.
53

Minutes of weekly training in RUN also included bi-weekly weight lifting sessions (~60 minutes
per week). Each subject’s blood collection date was standardized for menstrual cycle in regularly
cycling subjects, occurring between the 15th and 19th day of the cycle. On the day of blood sample
collection, subjects reported the most recent exercise session, iron supplementation, and recent use
of anti-inflammatory medications. Subject height and weight were measured to calculate BMI. A
20 mL blood sample was collected from the antecubital vein following a 12 hour overnight fast.
Hematologic measures. A 2 mL blood sample was collected into a commercially available Acid
Citrate Dextrose tube (BD vacutainer, Franklin Lakes, NJ); complete blood count was performed
by an Advia 120 Hematology System analyzer according to manufacturer instructions (Bayer
Diagnostics, Tarrytown, NY). Whole blood was collected into a Plus Plastic Serum tube (BD
vacutainer, Franklin Lakes, NJ). The sample was kept at room temperature for 30 minutes and was
then centrifuged at 3000 x g for 10 minutes. Serum was stored in a -80 C freezer until cytokine
assays were performed. Serum iron, transferrin and transferrin saturation were determined using
the Total Iron Binding Capacity (TIBC) assay (Pointe Scientific Inc., Canton, MI). Serum ferritin
concentration was determined using the DRG ferritin immunoassay (DRG International, Inc.,
Mountainside, NJ). Hepcidin was measured by a commercially available enzyme immunoassay
(EIA) kit (Peninsula Laboratories, San Carlos, CA). Serum soluble transferrin receptor
concentration was determined using a commercially available ELISA assay kit (Human sTfR
Quantikine IVD ELISA Kit, R&D Systems, MN).
Isolation of monocytes. Peripheral blood mononuclear cells were freshly isolated from whole
blood by Histopaque-1077 (Sigma-Aldrich; St. Louis, MO) density gradient centrifugation as
54

previously described [40]. Monocytes from 6 ml whole blood were prepared for RNA isolation
and reverse transcription Polymerase Chain Reaction (rtPCR). Monocytes isolated from an
additional 3 ml whole blood were prepared for cell cytokine examination.
Monocyte CD163 determination. Following monocyte isolation, the monocyte cell pellet was
homogenized with 400ul RIPA buffer (Boston Bioproducts, Ashland, MA) to produce a cell lysate.
The total protein of the cell lysate was determined by Bradford assay. CD163 concentration of the
cell lysate was then measured by an immunoassay kit obtained from R&D (Quantikine HS ELISA
kit; Minneapolis, MN) and normalized to total protein.
Determination of human monocyte gene expression. Total RNA was extracted from monocytes
using the RNAqueous kit (Life Technologies, Grand Island, NY) according to the manufacturer's
instructions. Total RNA was quantified by Nanodrop (NanoDrop Technologies, Wilmington, DE),
and equal amounts of RNA (2ug) were reverse transcribed into cDNA with High Capacity cDNA
Reverse Transcription Kit (Applied Bio-systems, CA). Quantitative PCR (qPCR) was used to
amplify the cDNA with gene specific primers using Fast SYBR green method (Applied
Biosystems, Grand Island, NY). Different monocyte gene primers were constructed by the Perl
Primer program [41]. GAPDH was used as a housekeeping gene. Table 3-2 shows the genes and
sequences of primers used in this study. qPCR was carried out by StepOne plus software (Applied
Biosystems, Foster City, CA). Results were analyzed by 2−ΔΔCT method described previously [42,
43] and were expressed relative to CON.
Statistical analysis. Each dependent variable was tested for evidence of a normal distribution by
55

use of a Q-Q plot. For measures that were normally distributed, we used an independent student’s
t-test to compare group means. For serum hepcidin, which had a non-normal distribution, we
performed a log-transformation of the data, and then an independent student’s t-test was applied
to the normally distributed log-hepcidin data. The non-parametric Mann-Whitney U test was used
to test for statistical significance among other variables with a non-normal distribution. The
statistical analysis was carried out using the SPSS statistics package (IBM SPSS statistics 19) and
results are expressed as Mean (±SD). P-values less than 0.05 were considered statistically
significant.
Results
Questionnaire. Forty percent of RUN reported that they had been previously diagnosed with
anemia, and 85% of RUN were regularly taking an iron supplement in the form of ferrous sulfate.
Regular menstrual cycles were reported in 80% of CON and 70% of RUN. Approximately 75% of
subjects across both groups reported two or less servings of red meat per week. Consistent with
our recruitment strategy for CON and RUN, there was a distinct difference in the amount of weekly
exercise between groups (Table 3-1).
Serum Hepcidin and Training Level. Hepcidin levels were within a range of 1.3-41.2 ng/ml in
RUN and 0.9-41.1 ng/ml in CON. These values are reasonably consistent with a recently published
normal reference range for 18-24 year old females (1.95 to 29.28 ng/ml) where a median value of
7.25 ng/mL was observed [44]. As the measurement was not normally distributed, a log-
transformation was performed and independent t-test was used to compare the groups (Figure 3-
1). There was no significant difference for serum hepcidin concentration between CON and RUN
(p=0.159). The average weekly running distance in RUN ranged from 56.3 to 104.6 km and the
56
average distance ran in the 24 hours prior to the blood collection was 10.5 ± 6.4 km and ranged
from 0 to 19.3 km. The training session preceding the blood sampling was a continuous run at a
moderate aerobic effort (corresponding to a running pace of 12.9 to 13.7 km/hour). To examine
whether these factors related to the variation in serum hepcidin concentration, we performed
correlational analyses using the Spearman’s rank-order correlation. However, there was no
relationship evident between serum hepcidin and the weekly training distance or the running
distance in the 24 hours preceding the blood sample (Figure 3-2a and 3-2b). To investigate any
impact of previous anemia, RUN was divided into two groups: 8 with and 12 without a self-
reported history of anemia. However, there was no difference in serum hepcidin based on the
history of anemia (p=0.173) (Figure 3-2c).
Monocyte Gene Expression. Gene expression studies were successfully performed on 27 of the
30 subjects (CON: n=10; RUN: n=17). No differences were observed between RUN and CON in
the primary iron export protein, ferroportin (SLC40A1). Similarly, no differences were evident for
the heme oxygenase gene, HMOX1, the inflammatory related genes, CCL2 and IL-6, or the
hepcidin gene (HAMP) between RUN and CON. However, gene expression of the cell surface
iron scavenger, CD-163, was significantly higher in RUN than CON (P≤0.05) (Table 3-3).
Monocyte CD163 protein. To further investigate the observed increase in monocyte CD163 gene
expression, we used monocyte lysates to determine the monocytic CD163 protein level in RUN
and CON (n=10 per group). However, there was no significant difference between RUN and CON
for monocytic CD163 protein (CON: 20.6±10.4 ng/mg, RUN: 23.8±5.33 ng/mg; p=0.399).
57

Hematology. Complete blood count and iron status measures are shown in Table 3-4. White blood
cell (WBC) count and several WBC sub-populations, such as leukocytes and eosinophils, were
significantly lower in RUN (p≤0.05). This is consistent with previous studies regarding exercise
and immune function [45]. Monocyte count tended to be lower in RUN (p=0.064), but there was
no significant difference between RUN and CON (Table 3-4). However, mean corpuscular volume
(MCV) was significantly higher in RUN versus CON (p=0.015). This may be indicative of
increased hemolysis in the runners [46] and is not consistent with the microcytosis present in iron
deficiency anemia. However, all subjects fell within the normal MCV clinical range of 80-99 fL.
In both groups, the hemoglobin levels were relatively low across all subjects (range: 10.5-13.3
g/dL) compared to a typical normal range of 12.1-15.1g/dL, with no significant difference between
RUN and CON. Mean serum ferritin and soluble transferrin receptor concentration were not
significantly different between groups (Table 3-4).
Discussion
This is the first study using highly trained female collegiate distance runners with sustained high
level training that investigates resting hepcidin levels. Evidence of elevated hepcidin at around 3
hours following moderate to high intensity exercise is well documented. However, the question of
an additive or cumulative effect of multiple acute excursions of hepcidin in response to everyday
training on elevating resting levels is still unclear. The main finding of this study was that highly
trained female athletes did not have significantly higher resting hepcidin levels compared to
control subjects, suggesting that there is no cumulative effect of chronic, daily endurance training
on plasma hepcidin accumulation. A chronic elevation of hepcidin in response to training would
58
represent an important finding due to hepcidin’s critical role in iron homeostasis and the relatively
high prevalence of iron deficiency anemia in female athletes. However, we observed that serum
hepcidin levels in highly trained female runners did not differ significantly from an age- and BMI-
matched low exercise control group in a single resting measure. This result is in agreement with
recently published training studies investigating serum hepcidin concentration where there was no
significant increase in resting hepcidin following weeks of training [47, 48].
Studies have demonstrated that low iron stores directly suppress hepcidin concentration [49, 50].
In the current study, the relatively low serum ferritin levels were evident in both control and
experimental groups compared to population reference standards (female normal range: 12-150
ng/mL). Therefore, the similar levels of serum hepcidin may be attributed to the low iron stores
evident in both RUN and CON. Even an inflammatory stimulus that would normally increase
hepcidin (e.g. exercise-induced IL-6) may be inhibited in the presence of low iron stores [26]. This
concept is not without precedent as previous exercise studies have speculated that the transient rise
in hepcidin in response to a single exercise session is suppressed in athletes with low serum ferritin
[36] or low serum iron [32]. The cause of the low iron stores in the present study is also of interest.
Although extensive dietary records were not collected, both CON and RUN subjects self-reported
low intake of red meat. Red meat represents a source of heme iron which is most readily absorbed
from the gut. A limited consumption of this type of dietary iron may have contributed to the
observed low serum ferritin in both groups.
The monocyte, as a precursor to the macrophage, plays important roles in both inflammation and
iron homeostasis. There is evidence of a two-fold elevation of hepcidin (HAMP) gene expression
59

from the circulating monocytes of anemia of chronic disease (ACD) patients versus non-ACD
controls in the literature [24]. As high intensity endurance exercise has been hypothesized to
promote hepcidin production and induce an inflammatory response similar to ACD, we isolated
monocytes from RUN and CON and determined HAMP gene expression. However, despite the
high training level of RUN (on average more than 80 km per week), we did not observe a
significant increase in HAMP gene expression compared with CON. This result is consistent with
other ACD-related measures in our study where we observed no difference between RUN and
CON including serum levels of iron, ferritin, and hepcidin. Overall, the results from our study do
not suggest an ACD-like phenotype resulting from the rigors of collegiate distance running in
female athletes.
In addition to the measure of HAMP expression from our isolated monocytes, we also determined
several other iron- and inflammation-related genes expressed in monocytes. Consistent with our
lack of difference in HAMP, we did not observe differences in the gene expression of ferroportin
(SLC40A1), IL-6 or CCL2 between RUN and CON. However, we did observe a modest increase
in monocyte gene expression of CD163 in RUN. CD163 is expressed in monocytes and
macrophages and is responsible for scavenging the hemoglobin-haptoglobin complex [27] as well
as free hemoglobin [51]. This is especially interesting since others have established that increased
intravascular hemolysis in runners generates hemoglobin-haptoglobin complexes and free
hemoglobin [39, 52, 53]. In addition, CD163 promotes an anti-inflammatory phenotype in
monocytes and macrophages that promotes iron recycling [54, 55]. Although intriguing, this
potential of an upregulation of CD163 is tenuous in the present study, as the effect was small and
was not confirmed in our measure of monocytic CD163 protein. Nevertheless, we speculate that
60

this may be an interesting iron-regulating response in the monocyte resulting from endurance
exercise training.
Our study design had several limitations. One limitation is that we solicited blood samples from
just one collegiate cross country team at one time-point in the middle of their competitive season.
Therefore, our study had a small sample size and a limited power for detecting differences between
the RUN and CON group. Another limitation was the partial confounding resulting from a high
prevalence of iron supplementation in the athletes. Although the intent was for exercise volume to
be the only variable that differed between RUN and CON, most of RUN (85%) were taking an
oral iron supplement (ferrous sulfate) while none of CON were supplemented. However, the
evidence to date suggests that iron supplementation results in an increase rather than a decrease in
hepcidin concentration [22, 56]. In addition, comparing the hepcidin level between the athletes
that had or did not have iron supplementation did not provide evidence of differences in hepcidin
level due to supplementation. Therefore, the presence of the iron supplementation should increase
the likelihood of detecting higher serum hepcidin in the athletes rather than conceal a difference
between the groups.
Our study was also limited by variable sample collection schedule. Blood sampling was carefully
scheduled to control for menstrual cycle phase and the time of day of collection. However, athletes
were not asked to alter their training plan. As a result, the time between the last training session
and the blood collection was either 16 or 23 hours in subjects training the previous day. There was
variable distance of their most recent run as well as three subjects who did not train on the
day preceding the blood collection. We expect that this was not problematic, as our goal was to
61
determine the cumulative effect of training at a single time point rather than the transient effect of
training, which has been previously established [32, 35, 36, 38]. Additionally, we found no
correlation between hepcidin level and the distance of the most recent training bout or the total
average weekly training volume. Nevertheless, our study design would have benefitted from
additional time points and/or additional control over the training sessions of athletes.
Conclusion and Clinical Relevance:
We have evaluated the resting serum hepcidin concentrations of collegiate female distance runners
and observed no difference compared with a well-matched low exercise control group. Although
hepcidin has been demonstrated to be transiently increased with strenuous exercise, we did not
observe evidence of an elevation of resting hepcidin in highly-trained female athletes. However,
the relatively low iron stores in both CON and RUN may confound the interpretation. In addition,
studies of monocyte gene expression resulted in higher CD163 gene expression in the athletes
compared with controls, suggesting a potential anti-inflammatory response in the monocyte
resulting from endurance training. Further research should be conducted to determine the
importance of the exercise-induced, transient elevation in hepcidin to the incidence of iron
deficiency anemia. Moreover, iron deficiency in female is a widespread and multi-factorial
problem, which will likely benefit from studies beyond the realm of the exercise-induced hepcidin
response.
Acknowledgements
62

The authors would like to thank all of the subjects for their participation in this study. I wish to
acknowledge Kaitlyn Patterson as co-first author, Kayla Gieschen for project management, and
Monica Humby and Justin Kang for technical support.
Funding
The authors acknowledge funding received from the School of Kinesiology at the University of
Michigan.
63

Table 3-1. Subject information
Age (years) BMI
(kg/m2)
Training
level
(min/week)
Percent Iron
supplemented
Percent anti-
inflammatory
medications used
CON (n=10) 19.5 ± 1.35 20.5 ± 2.27 51.5 ± 39.7 0% 45%
RUN (n=20) 19.5 ± 1.07 20.5 ± 1.32 441.8 ± 64.2 85% 20%
64

Table 3-2. Primer sequences for monocyte gene expression. Abbreviations: GAPDH, housekeeping gene; HAMP, hepcidin; Hmox1, Heme-oxygenase 1; SLC40A1, Ferroportin; CCL2, chemokine (C-C motif) ligand 2; IL6, Interleukin 6; CD163, Cluster of Differentiation 163.
Forward (5’3’) Reverse (5’3’)
GAPDH TGCACCACCAACTGCTTAGC GGCATGGACTGTGGTCATGAG
HAMP CTGCAACCCCAGGACAGAG GGAATAAATAAGGAAGGGAGGGG
HMOX1 TCAACATCCAGCTCTTTGAGG TAAGGACCCATCGGAGAAGC
SLC40A1 AATGCTAGACTTAAAGTGGCCC GATATAGCAGGAAGTGAGAACCC
CCL2 GAAGCTGTGATCTTCAAGACC GGAGTTTGGGTTTGCTTGTC
IL6 TGGCTGAAAAAGATTGGATGCT AACTCCAAAAGACCAGTGATGATTT
CD163 ACATAGATCATGCATCTGTCATTTG CATTCTCCTTGGAATCTCACTTCTA
65

Table 3-3. Iron- and inflammation- related monocyte gene expression Abbreviations: HAMP, hepcidin; Hmox1, Heme-oxygenase 1; SLC40A1, Ferroportin; CCL2, chemokine (C-C motif) ligand 2; IL6, Interleukin 6; CD163, Cluster of Differentiation 163.
CON (n=10) RUN (n=17) p-value
HAMP (AU) 1.00 ± 0.39 1.11±0.61 0.635
IL6 (AU) § 1.00 ± 0.68 0.62 ± 0.34 0.083
CD163 (AU) 1.00 ± 0.17 1.18 ± 0.21 * 0.039
CCL2 (AU) § 1.00 ± 0.67 1.01 ± 0.61 0.711
SLC40A1 (AU) 1.00 ± 0.19 0.98 ± 0.25 0.834
Hmox1 (AU) 1.00 ± 0.24 1.02 ± 0.23 0.843
§ Nonparametric Mann-Whitney U test; *P≤0.05
66

Table 3-4. Complete blood cell count and hematologic results for CON and RUN. Abbreviations: WBC, white blood cell; Lymph, lymphocytes; Mono, monocyte, Eos, Eosinophil; RBC, red blood cell; Hgb, hemoglobin; MCV, mean corpuscular volume; UIBC, unsaturated iron-binding capacity; TIBC, total iron-binding capacity; sTfR, soluble transferrin receptor.
CON (n=10) RUN (n=20) P-value
WBC ×103 (cells/ul) 6.3 ± 1.64 5.1 ± 0.82 * 0.009
Lymph ×103(cells/ul) 2.3 ± 0.47 1.8 ± 0.39 * 0.005
Mono ×103(cells/ul) 0.4 ± 0.15 0.3 ± 0.11 0.064
Eos ×103(cells/ul) 0.2 ± 0.10 0.1 ± 0.06 * 0.006
RBC ×106 (cells/ul) 3.9 ± 0.31 3.8 ± 0.24 0.283
Hgb (g/dl) 11.9 ± 0.76 11.8 ± 0.71 0.737
MCV (fL) 90.8 ± 4.43 94.52 ± 3.45* 0.015
Serum Iron (ug/dl) 113.3 ± 30.62 101.8 ± 34.65 0.384
UIBC (ug/dl) 200.2 ± 70.36 213.8 ± 82.70 0.659
TIBC (ug/dl) 313.5 ± 55.66 315.7 ± 72.46 0.933
Transferrin saturation (%) 37.3 ± 12.25 33.4 ± 11.36 0.384
Serum ferritin (ng/ml) § 25.0 ± 29.27 32.5 ± 24.23 0.120
Soluble transferrin receptor 13.8 ± 3.30 15.5 ± 2.94 0.154
§ Non-parametric Mann-Whitney U test; *P≤0.05
67

Figure 3-1. Serum hepcidin
Log-transformed serum hepcidin levels in both CON (n=10) and RUN (n=20). The individual subject values are provided for each group adjacent to the mean value. Subjects without iron supplementation are depicted by gray diamonds while iron supplemented subjects are depicted with black diamonds.
68

Figure 3-2. Correlation between serum hepcidin and training levels, recent training, and history of iron deficiency anemia in RUN (n=20)
A) The relationship between weekly running distance and log-transformed serum hepcidin; B) The relationship between distance run in 24 hours prior to the blood sample collection and log-transformed serum hepcidin; C) Bar graph of log-transformed serum hepcidin in runners with (n=8) and without (n=12) history of iron deficiency anemia. Black diamonds represent iron-supplemented runners (n=17), gray diamonds represent runners without iron supplementation (n=3).
69

References: 1. Beard, J. and B. Tobin, Iron status and exercise. The American journal of clinical
nutrition, 2000. 72(2 Suppl): p. 594S-7S.
2. Beard, J. and B. Tobin, Iron status and exercise. Am J Clin Nutr, 2000. 72(2 Suppl): p. 594S-7S.
3. LaManca, J.J. and E.M. Haymes, Effects of iron repletion on VO2max, endurance, and blood lactate in women. Medcine and Science in Sports and Exercise, 1993. 25(12): p. 1386-92.
4. Risser, W.L., et al., Iron deficiency in female athletes: its prevalence and impact on performance. Medcine and Science in Sports and Exercise, 1988. 20(2): p. 116-21.
5. Killip, S., J.M. Bennett, and M.D. Chambers, Iron deficiency anemia. American family physician, 2007. 75(5): p. 671-8.
6. Stewart, J.G., et al., Gastrointestinal blood loss and anemia in runners. Annals of internal medicine, 1984. 100(6): p. 843-5.
7. Abarbanel, J., et al., Sports hematuria. The Journal of urology, 1990. 143(5): p. 887-90.
8. Shaskey, D.J. and G.A. Green, Sports haematology. Sports medicine, 2000. 29(1): p. 27-38.
9. Aspuru, K., et al., Optimal management of iron deficiency anemia due to poor dietary intake. International journal of general medicine, 2011. 4: p. 741-50.
10. Roughead, Z.K. and J.R. Hunt, Adaptation in iron absorption: iron supplementation reduces nonheme-iron but not heme-iron absorption from food. The American journal of clinical nutrition, 2000. 72(4): p. 982-9.
11. Ganz, T., Macrophages and Systemic Iron Homeostasis. Journal of innate immunity, 2012.
12. De Domenico, I., D. McVey Ward, and J. Kaplan, Regulation of iron acquisition and storage: consequences for iron-linked disorders. Nature reviews. Molecular cell biology, 2008. 9(1): p. 72-81.
13. Andrews, N.C. and P.J. Schmidt, Iron homeostasis. Annual review of physiology, 2007. 69: p. 69-85.
70

14. Nemeth, E. and T. Ganz, The role of hepcidin in iron metabolism. Acta haematologica, 2009. 122(2-3): p. 78-86.
15. Ganz, T., Hepcidin, a key regulator of iron metabolism and mediator of anemia of inflammation. Blood, 2003. 102(3): p. 783-8.
16. Schranz, M., et al., Activation and inactivation of the iron hormone hepcidin: Biochemical characterization of prohepcidin cleavage and sequential degradation to N-terminally truncated hepcidin isoforms. Blood cells, molecules & diseases, 2009. 43(2): p. 169-79.
17. Pigeon, C., et al., A new mouse liver-specific gene, encoding a protein homologous to human antimicrobial peptide hepcidin, is overexpressed during iron overload. The Journal of biological chemistry, 2001. 276(11): p. 7811-9.
18. Nemeth, E., et al., Hepcidin, a putative mediator of anemia of inflammation, is a type II acute-phase protein. Blood, 2003. 101(7): p. 2461-3.
19. Ganz, T., Hepcidin--a regulator of intestinal iron absorption and iron recycling by macrophages. Best practice & research. Clinical haematology, 2005. 18(2): p. 171-82.
20. Park, C.H., et al., Hepcidin, a urinary antimicrobial peptide synthesized in the liver. The Journal of biological chemistry, 2001. 276(11): p. 7806-10.
21. Krause, A., et al., LEAP-1, a novel highly disulfide-bonded human peptide, exhibits antimicrobial activity. FEBS letters, 2000. 480(2-3): p. 147-50.
22. Nemeth, E., et al., IL-6 mediates hypoferremia of inflammation by inducing the synthesis of the iron regulatory hormone hepcidin. The Journal of clinical investigation, 2004. 113(9): p. 1271-6.
23. Peyssonnaux, C., et al., TLR4-dependent hepcidin expression by myeloid cells in response to bacterial pathogens. Blood, 2006. 107(9): p. 3727-32.
24. Theurl, I., et al., Autocrine formation of hepcidin induces iron retention in human monocytes. Blood, 2008. 111(4): p. 2392-9.
25. Ganz, T. and E. Nemeth, Iron sequestration and anemia of inflammation. Seminars in hematology, 2009. 46(4): p. 387-93.
26. Nicolas, G., et al., The gene encoding the iron regulatory peptide hepcidin is regulated by anemia, hypoxia, and inflammation. The Journal of clinical investigation, 2002. 110(7): p. 1037-44.
71

27. Andrews, N.C., Anemia of inflammation: the cytokine-hepcidin link. The Journal of clinical investigation, 2004. 113(9): p. 1251-3.
28. Cheng, P.P., et al., Hepcidin expression in anemia of chronic disease and concomitant iron-deficiency anemia. Clinical and experimental medicine, 2011. 11(1): p. 33-42.
29. Theurl, I., et al., Regulation of iron homeostasis in anemia of chronic disease and iron deficiency anemia: diagnostic and therapeutic implications. Blood, 2009. 113(21): p. 5277-86.
30. Peeling, P., et al., Athletic induced iron deficiency: new insights into the role of inflammation, cytokines and hormones. European journal of applied physiology, 2008. 103(4): p. 381-91.
31. Banzet, S., et al., Interleukin-6 contributes to hepcidin mRNA increase in response to exercise. Cytokine, 2012. 58(2): p. 158-61.
32. Newlin, M.K., et al., The effects of acute exercise bouts on hepcidin in women. International journal of sport nutrition and exercise metabolism, 2012. 22(2): p. 79-88.
33. Sim, M., et al., The effects of carbohydrate ingestion during endurance running on post-exercise inflammation and hepcidin levels. European journal of applied physiology, 2012. 112(5): p. 1889-98.
34. Sim, M., et al., Effect of Exercise Modality and Intensity on Post-Exercise Interleukin-6 and Hepcidin Levels. International journal of sport nutrition and exercise metabolism, 2012.
35. Roecker, L., et al., Iron-regulatory protein hepcidin is increased in female athletes after a marathon. European journal of applied physiology, 2005. 95(5-6): p. 569-71.
36. Peeling, P., et al., Effects of exercise on hepcidin response and iron metabolism during recovery. International journal of sport nutrition and exercise metabolism, 2009. 19(6): p. 583-97.
37. Robson-Ansley, P., I. Walshe, and D. Ward, The effect of carbohydrate ingestion on plasma interleukin-6, hepcidin and iron concentrations following prolonged exercise. Cytokine, 2011. 53(2): p. 196-200.
38. Peeling, P., et al., Cumulative effects of consecutive running sessions on hemolysis, inflammation and hepcidin activity. European journal of applied physiology, 2009. 106(1): p. 51-9.
72

39. Peeling, P., et al., Training surface and intensity: inflammation, hemolysis, and hepcidin expression. Medicine and science in sports and exercise, 2009. 41(5): p. 1138-45.
40. Feldman, D.L. and T.C. Mogelesky, Use of Histopaque for isolating mononuclear cells from rabbit blood. Journal of immunological methods, 1987. 102(2): p. 243-9.
41. Marshall, O.J., PerlPrimer: cross-platform, graphical primer design for standard, bisulphite and real-time PCR. Bioinformatics, 2004. 20(15): p. 2471-2.
42. Livak, K.J. and T.D. Schmittgen, Analysis of relative gene expression data using real-time quantitative PCR and the 2(-Delta Delta C(T)) Method. Methods, 2001. 25(4): p. 402-8.
43. Yang, S.J., et al., Inhibition of the chemokine (C-C motif) ligand 2/chemokine (C-C motif) receptor 2 pathway attenuates hyperglycaemia and inflammation in a mouse model of hepatic steatosis and lipoatrophy. Diabetologia, 2009. 52(5): p. 972-81.
44. Galesloot, T.E., et al., Serum hepcidin: reference ranges and biochemical correlates in the general population. Blood, 2011. 117(25): p. e218-25.
45. Gabriel, H. and W. Kindermann, The acute immune response to exercise: what does it mean? International journal of sports medicine, 1997. 18 Suppl 1: p. S28-45.
46. Eichner, E.R., Runner's macrocytosis: a clue to footstrike hemolysis. Runner's anemia as a benefit versus runner's hemolysis as a detriment. The American journal of medicine, 1985. 78(2): p. 321-5.
47. Karl, J.P., et al., Randomized, double-blind, placebo-controlled trial of an iron-fortified food product in female soldiers during military training: relations between iron status, serum hepcidin, and inflammation. The American journal of clinical nutrition, 2010. 92(1): p. 93-100.
48. Auersperger, I., et al., The effects of 8 weeks of endurance running on hepcidin concentrations, inflammatory parameters, and iron status in female runners. International journal of sport nutrition and exercise metabolism, 2012. 22(1): p. 55-63.
49. Krijt, J., et al., Effect of iron overload and iron deficiency on liver hemojuvelin protein. PLoS One, 2012. 7(5): p. e37391.
50. Nemeth, E., et al., Hepcidin regulates cellular iron efflux by binding to ferroportin and inducing its internalization. Science, 2004. 306(5704): p. 2090-3.
73

51. Schaer, D.J., et al., CD163 is the macrophage scavenger receptor for native and chemically modified hemoglobins in the absence of haptoglobin. Blood, 2006. 107(1): p. 373-80.
52. Magnusson, B., et al., Iron metabolism and "sports anemia". I. A study of several iron parameters in elite runners with differences in iron status. Acta medica Scandinavica, 1984. 216(2): p. 149-55.
53. Davidson, R.J., Exertional Haemoglobinuria: A Report on Three Cases with Studies on the Haemolytic Mechanism. Journal of clinical pathology, 1964. 17: p. 536-40.
54. Ugocsai, P., et al., Regulation of surface CD163 expression and cellular effects of receptor mediated hemoglobin-haptoglobin uptake on human monocytes and macrophages. Cytometry. Part A : the journal of the International Society for Analytical Cytology, 2006. 69(3): p. 203-5.
55. Kowal, K., et al., CD163 and its role in inflammation. Folia histochemica et cytobiologica / Polish Academy of Sciences, Polish Histochemical and Cytochemical Society, 2011. 49(3): p. 365-74.
56. Berglund, S., et al., Effects of iron supplementation on serum hepcidin and serum erythropoietin in low-birth-weight infants. The American journal of clinical nutrition, 2011. 94(6): p. 1553-61.
74

Chapter 4
Tissue-specific Iron Elevation and Adipose Tissue Remodeling in a Polygenic Obese Mouse
Model
Abstract
Iron dysregulation is a potential contributor to the pathology of obesity-related metabolic
complications. KK/HIJ (KK) mice, a polygenic mouse model of obesity and insulin resistance,
have elevated serum iron levels and a propensity for tissue iron deposition. In previous assessments
of older KK males, we observed a subset of mice with a discoloration of epididymal adipose tissue
(eAT) associated with >100-fold (p<0.001) higher iron concentration. To further phenotype and
characterize the adipose tissue iron overload and associated systemic effects, in this study, 27 male
KK mice aged 47-79 wks were evaluated. Fourteen mice had discolored eAT (high iron, HI) and
13 had normal colored eAT (normal iron, NI). Fasting serum was collected and tissues were
harvested for iron content, gene expression, and histology. Robust elevations of iron were
confirmed in the eAT of HI versus NI mice. Surprisingly, iron levels in subcutaneous and brown
adipose depots were not statistically different between groups (p>0.05). However, tissue iron
levels were significantly higher in the liver (27%, p<0.01), pancreas (44%, p<0.01) and heart
(30%, p<0.01) of the HI group. The eAT histology using H&E and F4/80 staining revealed a robust
macrophage clustering, while trichrome and caspase3 staining revealed more fibrosis and cell
death in the HI eAT compared with NI. rtPCR of eAT showed significantly decreased Lep (leptin)
75

and Adipoq (adiponectin), whereas Tnfα (tumor necrosis factorα) and the iron exporter, Slc40a1
(ferroportin), were up regulated in HI compared with NI (p<0.05). No
significant difference of fasting serum glucose, serum insulin and insulin sensitivity index was
observed between groups (p>0.05). Our data suggest that the deposition of iron in adipose tissue
is limited to the epididymal depot in male KK/HIJ mice. The increased macrophages, collagen and
cell death indicate a robust adipose tissue remodeling that is concomitant with the high iron
concentration of the eAT. However, no association was evident between eAT iron deposition and
glucose homeostasis.
Keywords: Tissue Iron, Glucose homeostasis, Adipose tissue macrophages
76

Introduction
Iron dysregulation is a potential contributor to the pathology of obesity-related metabolic
complications, such as type 2 diabetes mellitus (T2DM). Studies have demonstrated elevated iron
stores to precede insulin resistance [1,2], while lowering serum iron can increase insulin sensitivity
[3,4]. This association between iron and diabetes is hypothesized to be linked by inflammation,
and promoted by increased oxidative stress via elevated iron [5, 6]. Tajima et al. studied an obese
and diabetic mouse model (KKay mice) and demonstrated that a reduced iron diet resulted in an
amelioration of adipocyte hypertrophy by suppressing oxidative stress, inflammatory cytokines
(such as TNF-α, interlukin-6 (IL-6), and monocyte chemotactic protein 1 (MCP-1)), and
macrophage infiltration, thereby breaking a vicious cycle in obesity [7]. Adiponectin, an insulin-
sensitizing adipokine secreted from adipocytes, is inversely associated with adipose tissue mass
[8, 9]. Studies in humans, mice and cultured cells have demonstrated that excessive iron lowers
adiponectin production and increases diabetes risk [10]. Both an increase in inflammatory
cytokines and a decrease in adiponectin, can lead to the interruption of insulin signaling pathways
and consequently to a decrease in insulin sensitivity [11-14]. In addition, strategies to reduce iron
concentration (e.g. low iron diet, chelation therapy, and phlebotomy) have led to improvements in
insulin sensitivity in obese animal models [7, 30, 31] and humans [3, 10, 32, 33]. To this end, iron
has been demonstrated to play an important role in metabolic syndrome, including detrimental
effects on the modulation of metabolism through inflammation and oxidative stress. However, it
should be noted that the pathology of diabetes and iron overload is controversial. Thus, a better
understanding of the influence of iron deposition in the setting of obesity is needed.
Adipose tissue iron metabolism has recently received considerable attention. The dual role of
77

adipose tissue macrophages in both inflammation and iron metabolism may link these recent
observations. Adipose tissue inflammation has been considered an important factor contributing
to the increased diabetes risk associated with obesity [12-18]. Obesity is often accompanied by a
phenotypic switch of macrophages from anti-inflammatory “alternatively activated” M2
macrophages that primarily accumulate during healthy metabolic function [19], to the pro-
inflammatory “classically activated” M1 macrophages [20]. The M1 population has been
demonstrated to contribute to insulin resistance because of the production of pro-inflammatory
cytokines such as TNF-α, IL-6, and MCP-1 [20-24]. Since the macrophage is one of the most
important iron storage cells, the role of iron regulation in adipose tissue macrophages may provide
important insights to the connection between iron and metabolic disease.
In addition to tissue macrophages, adipocytes also express common regulators of iron homeostasis
including ferritin and iron-regulatory proteins hepcidin [26], as well as iron-related proteins with
restricted tissue expression (e.g. TfR2-Transferrin Receptor 2, HFE-encoding Human
hemochromatosis protein, and HAMP-hepcidin) [27, 28]. As mentioned, iron has been observed
to be associated with inflammation in the setting of T2DM. More directly, iron overload has been
demonstrated to promote adipocyte insulin resistance [10, 29]. Regarding the effect of insulin
metabolism on iron regulation, insulin treatment promotes iron uptake by increasing cell-surface
expression of TfR1 (Transferrin Receptor 1) in adipocytes [34, 35]. These studies, combined with
the fact that macrophages play the predominant role in controlling systemic iron recycling [36],
raise the possibility that iron handling by adipose tissue macrophage (ATM) contributes to normal
adipose tissue function. Furthermore, animal studies have demonstrated that obesity induces an
increase in M1 polarization [16, 25], which, based on in vitro studies, may further promote iron
78

deposition [37, 38]. Interestingly, Orr et. al. recently identified a population of adipose tissue
macrophage with an iron handling phenotype and indicated that high fat diet promotes iron
partitioning to adipocytes and also reduces the iron handling capacity of adipose tissue macrophage
[39]. However, the direct metabolic consequences of iron deposition are still unclear. In summary,
more studies are needed to understand adipose tissue iron deposition and its influence on obesity-
related metabolic consequences.
KK/HIJ (KK) mice have been used as a polygenic mouse model of obesity and insulin resistance.
Interestingly, the serum iron level is elevated (>2-fold) in this strain compared with other more
commonly used mouse strains such as C57BL/6J or C57BL/10J [40]. The combination of these
factors suggests the KK/HIJ mouse to be a useful model for iron and obesity-related research
studies. In subsets of KK males, we have observed a grossly evident adipose tissue remodeling
characterized by iron deposition within the epididymal adipose depot. In our pilot study, we
observed that approximately 50% of KK males have distinctly discolored epididymal adipose
tissue depots. We determined that this was directly associated with a striking increase in iron
concentration in this adipose depot. Furthermore, we noted that the remainder of the KK males
had normal adipose tissue iron levels (in line with KK females and both genders of the C57BL/6J
strain). This observation motivated us to further characterize this phenomenon in male KK/HIJ
mice. To our knowledge, there has not been any study addressing this increased tissue iron
phenotype.
In this study, we identified two distinct groups of KK males: a normal iron adipose tissue group
(NI) and a high iron adipose tissue group (HI). Our aim was to characterize the iron dysregulation
79

phenotype in the epididymal adipose tissue and evaluate the adipose tissue inflammation and
remodeling in this polygenic obese male mouse model.
Methods
Animals.
Male KK/HIJ mice were obtained through in-house breeding at the University of
Michigan from mice originally purchased from Jackson Laboratories (Strain #002106). Twenty-
seven male KK mice aged 47-79 weeks were euthanized and checked for the presence of
epididymal adipose tissue (eAT) discoloration (and subsequently eAT iron concentration). The
mice with discolored eAT were assigned to “High Iron adipose tissue” group (HI, n=14), mice
with normal colored eAT were assigned to “Normal Iron adipose tissue” group (NI, n=13). Five
female KK mice (~ 34 weeks of age) from the same colony living under the same conditions were
also euthanized for gonadal adipose tissue iron concentration. The animal care and
experimentation were overseen and approved by the University of Michigan Committee on Use
and Care of Animals.
Tissue iron assay.
The liver, spleen, heart, and pancreas as well as epididymal, subcutaneous (inguinal fat depot), and
brown adipose tissue were weighed and harvested from each mouse. Gonadal adipose tissue
samples were also harvested from the five KK female mice. Tissue iron concentration was
determined using a commonly used, non-commercial iron chromogen colorimetric assay (main
compositions including hydrochloric acid and trichloroacetic acid) described previously [41].
80

Histology.
eAT samples were fixed and stored in formalin after being harvested from the animals. Tissues
then were transferred to histology cassettes individually and stored in 70% ethanol. The UM
Histology Core performed paraffin processing, embedding, sectioning, and staining. The staining
included hemotoxylin and eosin (H&E), F4/80, trichrome, and Caspase3 staining.
Serum measurements
Fasting serum insulin, adiponectin and leptin were measured using commercially available ELISA
kits (Crystal Chem, Downers Grove, IL) according to manufacturer’s instructions. Serum iron was
analyzed using the QuantiChrom iron assay kit (Bioassay Systems, Hayward, CA) following the
manufacturer's protocol. Insulin resistance was indicated by the homeostasis model assessment –
estimated insulin resistance (HOMA-IR) index, which was calculated according to the following
equation:
𝐻𝐻𝐻𝐻𝐻𝐻𝐻𝐻 − 𝐼𝐼𝐼𝐼 =Fasting Glucose(mg/dl) × Fasting Insulin (µU/mL)
405
Gene expression qRT-PCR
Total RNA was extracted from eAT and liver using the RNAqueous kit (Life Technologies, Grand
Island, NY) according to the manufacturer’s instructions. cDNA was synthesized using High
Capacity cDNA Reverse Transcription Kit (Applied Bio systems, CA). Real-time PCR was used
to amplify the cDNA with gene specific primers using Taqman gene expression assay (Applied
Biosystems, FosterCity, CA) for TNFα and Leptin gene expression. Fast SYBR green Master Mix
(Applied Biosystems, Grand Island, NY) was used for additional gene expression studies (Table
4-1). Real-time PCR was carried out by using StepOne plus software (Applied Biosystems, Foster
81

City, CA). Results then were analyzed using the 2-ΔΔCT method described previously [42].
Statistics
The primary comparison in this study was between the NI and HI groups, so an independent
student’s t-test was applied to determine significant differences between the groups. To evaluate
the association between eAT iron and adipose tissue inflammation markers, Pearson’s correlation
tests were performed. Results were expressed as Mean (±SEM). The statistical analysis was carried
out using the SPSS statistics package (IBM SPSS statistics 21). P-values less than 0.05 were
considered statistically significant.
Results
Iron deposition is tissue and adipose depot-specific.
Iron concentrations in eAT were 115- fold higher in HI compared NI (NI: 0.0062 ± 0.002; HI: 0.71
± 0.12 µg/mg tissue; p<0.01, Figure 4-1a). The gonadal adipose tissue (gAT) iron concentration
in female KK mice was similar to eAT iron from the male NI group (gAT: 0.0082± 0.001 µg/mg
tissue, p>0.05). In addition, the liver (27%, p<0.01), pancreas (44%, p<0.01) and heart (30%,
p<0.01) had significantly higher iron concentration in HI compared with NI (Figure 4-1b).
However, other adipose tissue depots, such as subcutaneous and brown adipose tissue, did not have
significant differences in iron concentration between the two groups (p>0.05, Figure 4-1b).
Duodenum, as the main dietary iron absorption site, was also not different between NI and HI
(p>0.05, Figure 4-1b). Therefore, in addition to the major iron deposition organs including liver,
pancreas and heart, iron overload in adipose tissue was specific to eAT in the HI group.
82

Iron deposition is associated with adipose tissue remodeling.
Tissue weight indicated that epididymal adipose tissue was smaller in HI compared with NI group
(p<0.05, Table 4-2), while the heart, liver and spleen weights were not different between the two
groups (p>0.05, Table 4-2). Histology data with H&E staining revealed robust adipose tissue
cellularity changes in the HI group. The individual adipocyte size was in a much wider range and
was irregular in HI compared with NI (Figure 4-2). In addition, a high number of non-adipocyte
cells were observed residing between the adipocytes. F4/80 antibody staining revealed
macrophage clustering among the adipocytes (Figure 4-2). By using Masson's trichrome stain for
collagen fibers, we observed a significant amount of collagen fiber staining present among
adipocytes in HI compared with NI (Figure 4-2). In addition, Caspase 3 staining suggested greater
apoptosis in eAT of the HI group (Figure 4-2). Consistent with the robust remodeling of eAT in
the HI group, the gene expression of leptin and adiponectin were markedly reduced compared with
eAT of NI group (p<0.01, Figure 4-3b).
Iron deposition is associated with increased adipose tissue inflammation.
Gene expression studies of eAT were used to examine differences in genes relevant to adipose
tissue inflammation and iron regulation between NI and HI. The pro-inflammatory gene marker
TNFα was nearly 4-fold higher in eAT of HI group compared with NI group (p<0.01, Figure 4-
3a), while the anti-inflammatory gene marker IL10 was not different in HI and NC. Gene
expression of Vegfa (Vascular endothelial growth factor A) was on average 82% lower in the HI
compared to NI, but this difference did not quite reach statistical significance (p=0.058). In
addition, no statistical difference was evident between the groups for the gene expression of
Slc11a2 (encoding DMT1 the cellular iron intake marker) or Hamp (encoding hepcidin, which
83

degrades ferroportin) (p>0.05, Figure 4-3a). However, the gene expression of Slc40a1 (encoding
iron exporter protein, ferroportin) was significantly higher (~3-fold) in the eAT of HI compared
with NI (p<0.05, Figure 4-3a).
The glucose homeostasis was not changed with increased adipose tissue iron accumulation.
The analysis of metabolic markers including serum glucose (NI: 103.48 ±13.69 μg/dL; HI: 90.37
± 24.83 μg/dL, p>0.65), serum insulin (NI: 1.83± 1.16; HI: 2.49 ± 1.13, p>0.05) and HOMA-IR
(p>0.05, Figure 4-4a) were not different between HI and NI groups. Similarly, serum iron was not
different (NI: 43.71 ± 16.32 μg/dL; HI: 47.78 ± 26.44 μg/dL, p>0.05, Figure 4-4b), despite
differences in tissue iron deposition between the groups. Serum adipokines that are associated with
adiposity and insulin sensitivity (e.g. serum adiponectin and serum leptin) were also investigated.
Neither serum adiponectin (HI: 7.21 ± 0.58 μg /mL; NI: 7.42 ± 1.25 μg /mL, p>0.05) nor serum
leptin (NI: 7.91 ± 1.62 ng/ml; HI: 6.48 ± 1.34 ng/ml, p>0.05) were significantly different between
the HI and NI groups (p>0.05, Figure 4-4c-4d). Overall, iron deposition was localized to specific
tissues and was not observed to produce overt differences in glucose homeostasis between NI and
HI mice.
Discussion
In our study, we have characterized a polygenic obese mouse model with a propensity for tissue
iron deposition in the epididymal adipose depot. We found that the adipose tissue deposition of
iron in a subset of male KK/HIJ mice was specific to the eAT depot and not evident in the
subcutaneous or brown adipose tissue depots. Moreover, these same animals had evidence of
greater iron deposition in traditional tissues of iron overload including the liver, heart, and
84

pancreas. The increase in eAT macrophages, collagen and cell death suggests a robust tissue
remodeling in the high iron subgroup. Furthermore, the marked increase in eAT Tnfα expression
intimates that this depot has a marked increase in inflammation. The remarkably decreased levels
of Lep and Adipoq expression suggest a localized adipocyte dysfunction. However, no systemic
alterations were evident in mice with this localized eAT iron deposition including markers of
glucose homeostasis and the serum concentration of the adipocytokines, leptin and adiponectin.
Analysis of the adipose tissue histology revealed a robust remodeling in the eAT of the HI group.
In addition to the significantly increased eAT iron, our histology revealed an increase of
macrophages (F4/80 staining) among the adipocytes as well as an increase of cell death (caspase
3 staining) and fibrosis (trichrome staining). It is not known whether either the observed elevation
in ATMs or the high AT iron concentration are the cause or consequence of the robust adipose
tissue remodeling. However, several published studies have suggested that adipocyte death and
increased fibrosis can promote adipose tissue macrophage infiltration. For example, Cinti et al.
showed that adipocyte necrosis is a significant phagocytic stimulus that regulates ATM infiltration
[43]. Other studies have shown that macrophages can aggregate and form crown-like structures
surrounding necrotic adipocytes [43-46]. In addition, the extracellular matrix (ECM) in adipose
tissue plays an important role in supporting its function. For example, it can provide mechanical
support for a fat pad as well as regulate physiological and pathological events through a variety of
signaling pathways that are active in adipose tissue remodeling [47]. Adipose tissue fibrosis,
however, is associated with reduced plasticity and therefore is a key indication of metabolic
dysfunction [47]. We also observed a significantly lower tissue weight in the eAT of the HI group,
which might be secondary to the adipose tissue remodeling. This finding is consistent with the
85

study from Dongiovanni et al. where high iron diet resulted in reduced epididymal adipose tissue
mass [48]. The robust adipose tissue remodeling in HI mice was also associated with a greater than
80% reduction in adipose tissue Vegfa (vascular endothelial cell growth factor A) gene expression.
This gene codes for VEGF-alpha and promotes pro-angiogenic activity as well as adipogenesis in
adipose tissue through promoting preadipocyte proliferation [49]. Therefore, our results suggest
that the HI group has evidence of localized disruption of normal adipose function and regulation
in the eAT. However, interventional studies are needed to further our understanding of the direct
cause of iron accumulation and adipose tissue remodeling and iron accumulation in the epididymal
adipose tissue.
To further characterize the phenotype of the eAT with increased iron deposition; gene expression
was performed to assess adipose tissue inflammation and iron signaling between the HI and NI
groups. We observed higher expression of the inflammatory marker, Tnfα, in the eAT of the HI
group. This is consistent with our histologic findings, where macrophage accumulation was
strikingly increased in the HI eAT. As macrophages are one of the most important cells for iron
storage, it is tempting to speculate that the macrophage infiltration may have preceded the
elevation of iron. However, the current studies did not provide us the ability to temporally sequence
the events leading to the observed increases in macrophage, inflammation and eAT iron. In
addition, we are not aware of published evidence of macrophage infiltration promoting iron
deposition in adipose tissue. Nevertheless, the remodeling in this depot was profound, as levels of
Lep (leptin) and Adipoq (adiponectin) gene expression in the eAT were greatly reduced consistent
with the observed loss of adipocytes. Of note to the overall phenotype, the gene expression studies
also revealed significantly elevated Slc40a1 (iron exporting protein ferroportin) in the HI eAT.
86

Previous studies have demonstrated that an increase in cytosolic iron promotes ferroportin
transcription and ultimately promotes iron export through ferroportin protein on the cell surface
[50] However, the gene expression of Hamp in our study also tended to be increased in the HI
group (~7-fold), which could negate ferroportin function through autocrine or paracrine effects in
the HI adipose tissues. Similar to our observations, Dongiovanni et al. demonstrated that mice
provided an iron enriched diet had a ~10-fold elevation of iron concentration and a ~175-fold
increase of HAMP gene express in the epididymal adipose tissue compared with normal diet
control mice [48]. Therefore, our increase in both Slc40a1 (~3-fold) and Hamp (~7-fold)
expression is likely secondary to the deposition of iron in the eAT. However, despite iron
deposition in many tissues, there was no evidence of iron sequestration from circulating iron, as
serum iron levels were not different between HI and NI. Overall, we observed several changes in
the HI mice that were consistent with C57BL/6 mice provided an oral iron overload, including
iron deposition in and reduced size of the epididymal adipose tissue, reduced leptin expression and
robust remodeling of the eAT [48]. Nevertheless, we had several findings inconsistent with
Dongiovanni et al. including a decrease in adiponectin gene expression in the HI epididymal
adipose tissue and no difference in serum iron levels associated with the iron deposition of the NI
and HI groups.
Despite the robust local changes in eAT of the HI group, we did not observe an exacerbation of
the metabolic function in KK male mice. Studies have shown that iron is negatively associated
with adiponectin transcription and that loss of the adipocyte iron export channel, ferroportin, can
result in adipocyte iron accumulation, decreased adiponectin, and insulin resistance in mice [10,
51]. Consistent with previous studies [10, 52], our results showed that the eAT iron has a strong
87

negative correlation with adiponectin gene expression in the epididymal adipose tissue (r2=0.78).
However, we did not observe a significant difference in circulating adiponectin between the HI
and NI groups or a strong correlation between eAT iron and circulating (serum) adiponectin.
Furthermore, unlike other studies showing that iron overload impairs glucose homeostasis and iron
depletion improves insulin sensitivity [10, 33, 48], in our study, the analysis of fasting glucose and
the insulin resistance index, HOMA-IR, revealed no difference between the HI and NI groups. We
propose that the iron deposition in the KK adipose tissue is associated with the adipose tissue
macrophages rather than the AT adipocytes, which would explain the considerable difference in
the overall phenotype. Our histology supports this notion as adipocyte density appears
considerably reduced and inflammatory cells are highly prevalent in the remodeled HI eAT.
To our knowledge, this is the first study demonstrating that about 50% of KK male mice are
predisposed to iron accumulation and remodeling specifically in eAT depot. We observed a 115-
fold higher iron in eAT of the HI group compared with NI group which was based initially on the
discoloration of the eAT. Notably, these animals also had a significant elevation of tissue iron in
liver, pancreas and heart (27-44%, p<0.01) compared with the NI group, suggesting that there was
a systemic iron overload in tissues sensitive to iron deposition. However, no elevation of iron
levels was evident in subcutaneous or brown adipose tissue depots indicating that the eAT may
have a unique milieu regarding iron deposition. In addition, female KK mice were also evaluated
for evidence of iron deposition in adipose tissue, but levels were similar to NI eAT iron and
consistently low in gonadal adipose depot. This gender- and tissue-specific iron deposition
represents an interesting phenomenon that may have important clues to our understanding of the
prevalence of iron toxicity and iron deposition in adipose tissue, in particular. This eAT specificity
88

is consistent with other studies, where high iron diet or high fat diet-induced obese C57BL/6J
showed a tissue iron increase in only the epididymal AT depot and not the subcutaneous adipose
tissue depot [48, 53, 54]. In addition, a recent study evaluating only the epididymal adipose tissue
in male C57BL/6 mice also observed an increase of eAT iron with high fat diet [52]. Consistent
with this idea of a highly localized effect, we did not observe a significant difference of circulating
(serum) iron levels between the NI and HI groups. However, we did observe robust differences in
the adipose tissue histology and gene expression of the HI compared to the NI groups. The unique
alterations of this specific adipose tissue depot may relate to variances in sympathetic innervation
or other localized environmental differences. One considerable difference previously documented
between the milieu of the eAT and other adipose depots is the presence of high levels of estrogen
sulfotransferase (EST) in the eAT [55]. This enzyme promotes the sulfoconjugation of estrogen.
High levels of EST in eAT can lead to the rapid inactivation of estrogen locally and may relate to
this gender- and tissue-specific iron deposition in male KK mice. Consistent with this concept,
increased adipose tissue iron has been observed in female mice following ovariectomy [56]. In
addition, several publications have also demonstrated that EST deficiency can increase epididymal
adipose tissue mass and adipocyte size; whereas EST overexpression decreased primary adipocyte
differentiation and induced a similar adipose tissue remodeling (e.g. significantly decreased
adipose tissue mass) as in our current study [55, 57]. Given the remarkable parallels between our
observations and these findings, we speculate that the tissue- and gender-specific iron
accumulation in the KK male mice may result from an elevation of epididymal adipose tissue
estrogen inactivation by estrogen sulfotransferase.
89

Our study has several limitations that restrict the conclusions that we can make from our data. An
important limitation of our study design was that the determination of the groups was based on
post-mortem observation of the epididymal adipose tissue color. This is not ideal as it makes the
phenotype appear qualitative and/or speculative. However, we have observed that the blinded
measurement of eAT iron concentration has revealed a clearly defined quantitative endpoint that
allowed the separation of mice into high iron eAT (HI) and normal iron eAT (NI) groups. In
addition, to our knowledge, there is no published description of an inbred mouse strain with
enhanced iron deposition in adipose tissue, which provided a unique opportunity for greater
understanding of this phenomenon. Another important limitation was that we have a small number
of animals for tissue weight, gene expression and hematologic measurements, and hence a low
statistical power to detect differences between groups. This was the result of the study animals
coming in two separate cohorts and fresh tissue samples for gene expression and hematologic
measures were not available for one cohort. Although this did not prevent us from detecting several
robust differences between the groups, it is a considerable limitation regarding our inability to
detect differences between the groups regarding measures of glucose homeostasis and circulating
adipokines (e.g. adiponectin and leptin). A third limitation of our study is that we were unable to
determine the temporal sequence of the events surrounding the iron deposition and macrophage
infiltration of the epididymal adipose tissue. Further study with iron manipulation (e.g. very low
iron diet intervention) in KK male mice will be necessary to improve our understanding of the
cause and consequences of this condition. However, the main focus of the current study was to
better characterize the impact of the iron deposition on adipose tissue structure and function, as
well as the overall metabolic consequences.
90

In conclusion, our study characterized the adipose tissue change and glucose homeostasis in KK
mice with a grossly evident epididymal adipose tissue iron deposition. As the study of the male
epididymal adipose depot is a commonly evaluated tissue, it is important to note that this depot
may be unique regarding inflammation and iron deposition. We have observed in the KK strain a
propensity for a site-specific iron accumulation in eAT that is associated with robust adipose tissue
inflammation and remodeling. We speculate that the epididymal adipose tissue depot has a special
propensity for iron deposition in the setting of iron overload. However, further studies are needed
to characterize the systemic and local metabolic dysfunction as well as to identify the mechanism
of the site-specific iron overload in the eAT. Overall, we propose that the KK mouse provides a
robust model for examining the role of elevated iron in the setting of polygenic obesity.
Acknowledgements:
This study was supported by Rackham Graduate Research Grant from University of Michigan.
The University of Virginia Center for Research in Reproduction Ligand Assay and Analysis Core
is supported by the Eunice Kennedy Shriver NICHD/NIH (SCCPIR) grant U54-HD28934.
91

Table 4-1. Primers sequences for gene expression.
Abbreviations: Hamp, hepcidin; Slc11a2, DMT1; Slc40a1, ferroportin; Vegf, Vascular endothelial growth factor; Il10, interlukin 10; Adipoq, adiponection.
Gene Forward (5’-->3’) Reverse (5’-->3’)
Gapdh TGAAGCAGGCATCTGAGGG CGAAGGTGGAAGAGTGGGAG
Hamp CCTGAGCAGCACCACCTATCT GCTTTCTTCCCCGTGCAAAGG
Slc11a2 TTGGCAATCATTGGTTCTGA CTTCCGCAAGCCATATTTGT
Slc40a1 ATGGGAACTGTGGCCTTCAC TCCAGGCATGAATACGGAGA
Vegf CCACGTCAGAGAGCAACATCA TCATTCTCTCTATGTGCTGGCTTT
Il10 GCTCTTACTGACTGGCATGAG CGCAGCTCTAGGAGCATGTG
Adipoq GGAGATGCAGGTCTTCTTGG ATGTTGCAGTAGAACTTGCC
92
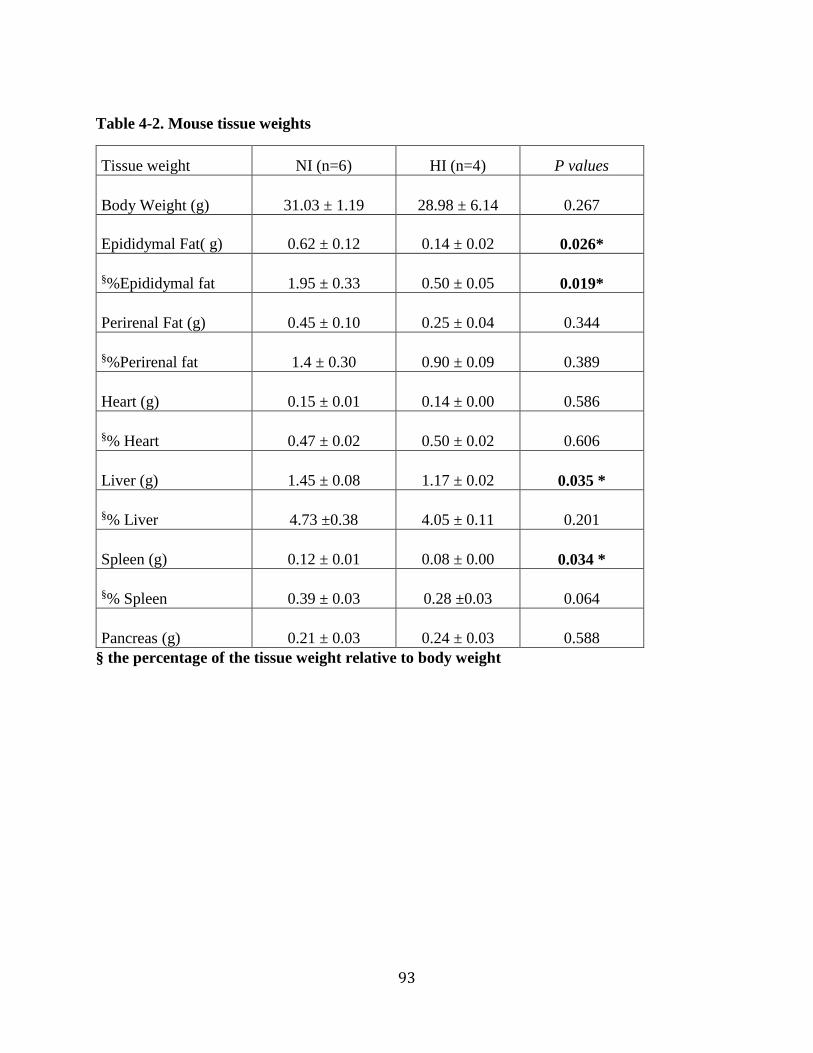
Table 4-2. Mouse tissue weights
Tissue weight NI (n=6) HI (n=4) P values
Body Weight (g) 31.03 ± 1.19 28.98 ± 6.14 0.267
Epididymal Fat( g) 0.62 ± 0.12 0.14 ± 0.02 0.026*
§%Epididymal fat 1.95 ± 0.33 0.50 ± 0.05 0.019*
Perirenal Fat (g) 0.45 ± 0.10 0.25 ± 0.04 0.344
§%Perirenal fat 1.4 ± 0.30 0.90 ± 0.09 0.389
Heart (g) 0.15 ± 0.01 0.14 ± 0.00 0.586
§% Heart 0.47 ± 0.02 0.50 ± 0.02 0.606
Liver (g) 1.45 ± 0.08 1.17 ± 0.02 0.035 *
§% Liver 4.73 ±0.38 4.05 ± 0.11 0.201
Spleen (g) 0.12 ± 0.01 0.08 ± 0.00 0.034 *
§% Spleen 0.39 ± 0.03 0.28 ±0.03 0.064
Pancreas (g) 0.21 ± 0.03 0.24 ± 0.03 0.588 § the percentage of the tissue weight relative to body weight
93

Figure 4-1 Iron deposition is tissue specific.
A), eAT iron was significantly elevated in HI group. B), common iron deposition tissues such as liver, pancreas and heart had elevated iron levels in HI. However, iron deposition in duodenum or other adipose tissue depots (i.e. subcutaneous and brown adipose tissue) was not elevated in HI group. Abbreviations: eAT, epididymal adipose tissue; SubqAT, subcutaneous adipose tissue; BAT, brown adipose tissue; Pan, pancreas; Duo, duodenum. **p<0.01 NI (open bar) vs HI (filled bar)
94

Figure 4-2. A robust tissue remodeling in the HI mice epididymal fat pads
Representitive adipose tissue histology from both NI (Top) and HI (Bottom) groups. Colors: F4/80, brown; Trichrome, blue; Caspase 3, brown.
95

Figure 4-3. Epididymal adipose tissue gene expression
A) eAT gene expression with inflammatory and iron-regulating gene markers. B) eAT gene expression with adipokine gene markers. Abbreviations: Hamp, hepcidin; Slc11a2, DMT1; Slc40a1, ferroportin; Vegfa, Vascular endothelial growth factor A; Tnf α, tumor necrosis factor; Il10, interlukin 10; Adipoq, adiponection; Lep, leptin. NI (open bar, n=6) v.s. HI (filled bar, n=4). *p< 0.05, **p<0.01
96

Figure 4-4. Comparison of hematologic measures between NI and HI.
A) Insulin resistance index HOMA-IR. B) = Serum iron levels between the two group. C&D) Serum adiponectin and leptin in NI (n=6) and HI (n=4) mice.
97

References:
1. Jiang, R., et al., Body iron stores in relation to risk of type 2 diabetes in apparently healthy women. Jama, 2004. 291(6): p. 711-7.
2. Forouhi, N.G., et al., Elevated serum ferritin levels predict new-onset type 2 diabetes: results from the EPIC-Norfolk prospective study. Diabetologia, 2007. 50(5): p. 949-56.
3. Fernandez-Real, J.M., et al., Blood letting in high-ferritin type 2 diabetes: effects on insulin sensitivity and beta-cell function. Diabetes, 2002. 51(4): p. 1000-4.
4. Facchini, F.S., Effect of phlebotomy on plasma glucose and insulin concentrations. Diabetes Care, 1998. 21(12): p. 2190.
5. Cighetti, G., et al., Oxidative status and malondialdehyde in beta-thalassaemia patients. Eur J Clin Invest, 2002. 32 Suppl 1: p. 55-60.
6. Walter, P.B., et al., Oxidative stress and inflammation in iron-overloaded patients with beta-thalassaemia or sickle cell disease. Br J Haematol, 2006. 135(2): p. 254-63.
7. Tajima, S., et al., Iron reduction by deferoxamine leads to amelioration of adiposity via the regulation of oxidative stress and inflammation in obese and type 2 diabetes KKAy mice. Am J Physiol Endocrinol Metab, 2012. 302(1): p. E77-86.
8. Arita, Y., et al., Paradoxical decrease of an adipose-specific protein, adiponectin, in obesity. 1999. Biochem Biophys Res Commun, 2012. 425(3): p. 560-4.
9. Kubota, N., et al., Disruption of adiponectin causes insulin resistance and neointimal formation. J Biol Chem, 2002. 277(29): p. 25863-6.
10. Gabrielsen, J.S., et al., Adipocyte iron regulates adiponectin and insulin sensitivity. J Clin Invest, 2012. 122(10): p. 3529-40.
11. Hotamisligil, G.S., Inflammatory pathways and insulin action. Int J Obes Relat Metab Disord, 2003. 27 Suppl 3: p. S53-5.
12. Hotamisligil, G.S., et al., Increased adipose tissue expression of tumor necrosis factor-alpha in human obesity and insulin resistance. J Clin Invest, 1995. 95(5): p. 2409-15.
13. Weisberg, S.P., et al., Obesity is associated with macrophage accumulation in adipose tissue. J Clin Invest, 2003. 112(12): p. 1796-808.
98

14. Xu, H., et al., Chronic inflammation in fat plays a crucial role in the development of obesity-related insulin resistance. J Clin Invest, 2003. 112(12): p. 1821-30.
15. Hotamisligil, G.S., N.S. Shargill, and B.M. Spiegelman, Adipose expression of tumor necrosis factor-alpha: direct role in obesity-linked insulin resistance. Science, 1993. 259(5091): p. 87-91.
16. Morris, D.L., K. Singer, and C.N. Lumeng, Adipose tissue macrophages: phenotypic plasticity and diversity in lean and obese states. Curr Opin Clin Nutr Metab Care, 2011. 14(4): p. 341-6.
17. Oh, D.Y., et al., Increased macrophage migration into adipose tissue in obese mice. Diabetes, 2010. 61(2): p. 346-54.
18. Wellen, K.E. and G.S. Hotamisligil, Obesity-induced inflammatory changes in adipose tissue. J Clin Invest, 2003. 112(12): p. 1785-8.
19. Kosteli, A., et al., Weight loss and lipolysis promote a dynamic immune response in murine adipose tissue. J Clin Invest, 2010. 120(10): p. 3466-79.
20. Lumeng, C.N., J.L. Bodzin, and A.R. Saltiel, Obesity induces a phenotypic switch in adipose tissue macrophage polarization. J Clin Invest, 2007. 117(1): p. 175-84.
21. Gordon, S., Alternative activation of macrophages. Nat Rev Immunol, 2003. 3(1): p. 23-35.
22. Gordon, S. and P.R. Taylor, Monocyte and macrophage heterogeneity. Nat Rev Immunol, 2005. 5(12): p. 953-64.
23. Mantovani, A., et al., The chemokine system in diverse forms of macrophage activation and polarization. Trends Immunol, 2004. 25(12): p. 677-86.
24. Shoelson, S.E., Banking on ATM as a new target in metabolic syndrome. Cell Metab, 2006. 4(5): p. 337-8.
25. Lumeng, C.N., et al., Phenotypic switching of adipose tissue macrophages with obesity is generated by spatiotemporal differences in macrophage subtypes. Diabetes, 2008. 57(12): p. 3239-46.
26. Festa, M., et al., Overexpression of H ferritin and up-regulation of iron regulatory protein genes during differentiation of 3T3-L1 pre-adipocytes. J Biol Chem, 2000. 275(47): p. 36708-12.
99

27. Bekri, S., et al., Increased adipose tissue expression of hepcidin in severe obesity is independent from diabetes and NASH. Gastroenterology, 2006. 131(3): p. 788-96.
28. Farahani, P., et al., Obesity in BSB mice is correlated with expression of genes for iron homeostasis and leptin. Obes Res, 2004. 12(2): p. 191-204.
29. Green, A., R. Basile, and J.M. Rumberger, Transferrin and iron induce insulin resistance of glucose transport in adipocytes. Metabolism, 2006. 55(8): p. 1042-5.
30. Minamiyama, Y., et al., Iron restriction improves type 2 diabetes mellitus in Otsuka Long-Evans Tokushima fatty rats. Am J Physiol Endocrinol Metab, 2010. 298(6): p. E1140-9.
31. Cooksey, R.C., et al., Dietary iron restriction or iron chelation protects from diabetes and loss of beta-cell function in the obese (ob/ob lep-/-) mouse. Am J Physiol Endocrinol Metab, 2010. 298(6): p. E1236-43.
32. Valenti, L., et al., Venesection for non-alcoholic fatty liver disease unresponsive to lifestyle counselling--a propensity score-adjusted observational study. Qjm, 2011. 104(2): p. 141-9.
33. Valenti, L., et al., Iron depletion by phlebotomy improves insulin resistance in patients with nonalcoholic fatty liver disease and hyperferritinemia: evidence from a case-control study. Am J Gastroenterol, 2007. 102(6): p. 1251-8.
34. Davis, R.J., S. Corvera, and M.P. Czech, Insulin stimulates cellular iron uptake and causes the redistribution of intracellular transferrin receptors to the plasma membrane. J Biol Chem, 1986. 261(19): p. 8708-11.
35. Tanner, L.I. and G.E. Lienhard, Insulin elicits a redistribution of transferrin receptors in 3T3-L1 adipocytes through an increase in the rate constant for receptor externalization. J Biol Chem, 1987. 262(19): p. 8975-80.
36. Ganz, T., Macrophages and systemic iron homeostasis. J Innate Immun, 2012. 4(5-6): p. 446-53.
37. Recalcati, S., et al., Differential regulation of iron homeostasis during human macrophage polarized activation. Eur J Immunol, 2010. 40(3): p. 824-35.
38. Corna, G., et al., Polarization dictates iron handling by inflammatory and alternatively activated macrophages. Haematologica, 2010. 95(11): p. 1814-22.
100

39. Orr, J.S., et al., Obesity Alters Adipose Tissue Macrophage Iron Content and Tissue Iron Distribution. Diabetes, 2013.
40. Yuan R, K.R. Aging study: Blood chemistry for 32 inbred strains of mice. MPD:24468. 2013; Available from: http://phenome.jax.org, Dec, 2013
41. Rebouche, C.J., C.L. Wilcox, and J.A. Widness, Microanalysis of non-heme iron in animal tissues. J Biochem Biophys Methods, 2004. 58(3): p. 239-51.
42. Livak, K.J. and T.D. Schmittgen, Analysis of relative gene expression data using real-time quantitative PCR and the 2(-Delta Delta C(T)) Method. Methods, 2001. 25(4): p. 402-8.
43. Cinti, S., et al., Adipocyte death defines macrophage localization and function in adipose tissue of obese mice and humans. J Lipid Res, 2005. 46(11): p. 2347-55.
44. Nishimura, S., et al., Adipogenesis in obesity requires close interplay between differentiating adipocytes, stromal cells, and blood vessels. Diabetes, 2007. 56(6): p. 1517-26.
45. Nishimura, S., et al., In vivo imaging in mice reveals local cell dynamics and inflammation in obese adipose tissue. J Clin Invest, 2008. 118(2): p. 710-21.
46. Strissel, K.J., et al., Adipocyte death, adipose tissue remodeling, and obesity complications. Diabetes, 2007. 56(12): p. 2910-8.
47. Khan, T., et al., Metabolic dysregulation and adipose tissue fibrosis: role of collagen VI. Mol Cell Biol, 2009. 29(6): p. 1575-91.
48. Dongiovanni, P., et al., Dietary iron overload induces visceral adipose tissue insulin resistance. Am J Pathol, 2013. 182(6): p. 2254-63.
49. Rehman, J., et al., Peripheral blood "endothelial progenitor cells" are derived from monocyte/macrophages and secrete angiogenic growth factors. Circulation, 2003. 107(8): p. 1164-9.
50. Nemeth, E., et al., Hepcidin regulates cellular iron efflux by binding to ferroportin and inducing its internalization. Science, 2004. 306(5704): p. 2090-3.
51. Hazel, M., et al., Activation of the hexosamine signaling pathway in adipose tissue results in decreased serum adiponectin and skeletal muscle insulin resistance. Endocrinology, 2004. 145(5): p. 2118-28.
101

52. Orr, J.S., et al., Obesity Alters Adipose Tissue Macrophage Iron Content and Tissue Iron Distribution. Diabetes, 2014.
53. Gotardo, E.M., et al., Mice that are fed a high-fat diet display increased hepcidin expression in adipose tissue. J Nutr Sci Vitaminol (Tokyo), 2013. 59(5): p. 454-61.
54. Sonnweber, T., et al., High-fat diet causes iron deficiency via hepcidin-independent reduction of duodenal iron absorption. J Nutr Biochem, 2012. 23(12): p. 1600-8.
55. Khor, V.K., et al., Gender-specific expression and mechanism of regulation of estrogen sulfotransferase in adipose tissues of the mouse. Endocrinology, 2008. 149(11): p. 5440-8.
56. Mattace Raso, G., et al., Ovariectomy and estrogen treatment modulate iron metabolism in rat adipose tissue. Biochem Pharmacol, 2009. 78(8): p. 1001-7.
57. Khor, V.K., et al., Estrogen sulfotransferase regulates body fat and glucose homeostasis in female mice. Am J Physiol Endocrinol Metab, 2010. 299(4): p. E657-64.
102

Chapter 5
Effects of 5-week voluntary wheel running on adipose tissue inflammation in a female
mouse model of polygenic obesity
Abstract
Background: Obesity-induced insulin resistance is associated with chronic low-grade
inflammation in adipose tissue. Most studies of exercise and adipose tissue inflammation to date
have examined male mice following a high fat diet. Purpose: In this study, we used female mice
from a polygenic obese strain, the KK/HIJ mouse, to determine the effect of voluntary wheel
running on adipose tissue inflammation, gene expression and whole-body glucose homeostasis.
Methods: Female KK/HIJ mice (n=15) fed normal chow were randomly assigned to a control
(CON) or voluntary exercise (EX) group for 5 weeks. Following the intervention, a complete blood
count (CBC) was performed for blood hematological assessment; fasting serum iron, glucose,
insulin, leptin, and adiponectin were measured and glucose tolerance was evaluated. In addition,
adipose tissue was harvested and RT-PCR was used to evaluate adipose tissue gene expression.
Results: Compared to CON, EX had decreased adiposity and significantly improved glucose
homeostasis as evidenced by lower fasting insulin and increased glucose tolerance after the 5
weeks intervention (p≤0.05). Both serum leptin levels and adipose tissue Lep gene expression were
significantly reduced (p≤0.05) following 5 weeks exercise intervention. Furthermore, adipose
tissue gene expression of the pro-inflammatory marker, Tnfα, was down-regulated (49%, p≤0.05)
103

following the exercise intervention. Surprisingly, the adipose tissue anti-inflammatory gene
markers including Chi3l3 (chitinase 3-like 3), Mgl1 (macrophage galactose N-acetyl-
galactosamine–specific lectins 1) and Mrc2 (mannose receptor, C type 2) were also down-
regulated in EX (p ≤ 0.05). Conclusion: The five week voluntary exercise intervention
significantly lowered adiposity and improved glucose tolerance despite an increase in food intake.
This short-term intervention also changed adipose tissue inflammatory gene expression in this
female polygenic obese mouse model.
Keywords: Voluntary Exercise, Adipose tissue macrophages, Gene expression, KK/HIJ mice
104

Introduction
Obesity is a multi-faceted public health crisis that continues to grow and compromise the health
of millions. It is evidently driven by changes in exposure to environmental factors, for example,
reduced physical activity during work and leisure time, as well as the increased accessibility and
reduced cost of calorie dense food [1]. In addition, an increasing number of studies have shown
that hereditary factors play a significant role in determining human obesity [2]. A common
metabolic perturbation in obese individuals is insulin resistance, which is known as a risk factor
for chronic diseases including type 2 diabetes mellitus (T2DM) and cardiovascular diseases [3, 4].
Therefore, interventions that improve glucose tolerance are important therapeutic strategies for
obese individuals. Exercise has been shown to improve insulin sensitivity [5, 6], assist in weight
loss (or weight maintenance) [7], and exert anti-inflammatory effects [8-10]. However, the
underlying mechanisms of the benefits of exercise are not completely understood, and few
polygenic obese mouse models have been identified to address this issue.
Obesity is often characterized by chronic low-grade inflammation. Research studies suggest an
association between metabolic disorders and a chronic low-grade inflammatory state in both obese
humans [11-13] and mouse models of obesity [14, 15]. For example, the circulating levels of
several inflammatory cytokines including tumor necrosis factor-alpha (TNFα), interleukin-6 (IL-
6), and C-reactive protein (CRP) are elevated in obesity and appear to contribute to metabolic
dysfunction [16]. Studies evaluating TNFα and insulin signaling have demonstrated that TNFα
impairs insulin-stimulated glucose storage [17] and insulin-stimulated glucose uptake [18] via
serine site phosphorylation on insulin receptor substrate 1 [19]. Conversely, obese mice with TNFα
deficiency were protected from insulin resistance [20] and inhibition of TNFα improved insulin
105
sensitivity in an insulin resistant mouse model [21]. In addition, anti-inflammatory cytokines such
as interleukin-10 (IL-10) and the anti-inflammatory adipocytokine, adiponectin, are decreased in
obese compared to normal weight individuals [22]. Furthermore, there is evidence from mouse
models that the infiltration of macrophages into adipose tissue can contribute to the chronic low
grade inflammatory state present in the obese condition [23]. Two macrophage subsets are
commonly described: M1 or "classically activated” macrophages are thought to promote a chronic
low-grade inflammatory state in adipose tissue, while M2 or "alternatively activated" macrophages
are thought to provide an anti-inflammatory influence [24]. Adipose tissue macrophages (ATM)
from lean mice have been observed to express many genes characteristic of M2 macrophages,
including Mgl1 (macrophage galactose N-acetyl-galactosamine–specific lectins 1) and Mrc2
(mannose receptor, C type 2), Chi3l3 (chitinase 3-like 3) and Il10. However, in the setting of diet-
induced obesity, there appears to be a decrease in expression of these genes in ATMs and an
increasing expression of genes such as Tnfα and Il-6, which are characteristic of M1
macrophages [25, 26]. In addition, overexpression of MCP-1 (monocyte chemoattractant protein-
1) in adipose tissue increases ATM recruitment and mildly exacerbates obesity-induced insulin
resistance [27, 28]. Together, these studies support the notion that ATMs contribute to the
development of adipose tissue inflammation and systemic insulin resistance in obesity.
Although exercise has been observed to be capable of contributing to weight loss and
improvements in insulin resistance [6], the influence of exercise on adipose tissue inflammation is
still being explored. Several recently published studies suggested a decrease of adipose tissue
inflammation after short-term exercise intervention in high fat diet-induced obese male mice or
rats [29-31]. For example, in high fat diet-induced obese male C57BL/6 mice, four to 16 weeks of
106

treadmill training at 12-20 m/min for 2.5-6 km/week has been proposed to change the polarization
of macrophage by up-regulating the anti-inflammatory (M2) and down-regulating the pro-
inflammatory (M1) phenotype [32, 33]. However, there is a paucity of data regarding the role of
exercise on adipose tissue inflammation in obese females, primarily because effective models for
such studies have not been developed. The importance of studying female models as well as males
is becoming recognized as a vital effort due to important clinical differences between female and
male physiology and pathophysiology [34]. Therefore, the aim of this study was to evaluate the
influence of exercise on metabolic function and adipose tissue inflammation in a mouse strain with
inherently obese females.
Methods
Animals
KK/HIJ mice were obtained through in-house breeding at the University of Michigan from mice
originally purchased from Jackson Laboratories (Strain #002106). The KK/HIJ strain is a model
of metabolic dysfunction, displaying insulin resistance, hyperglycemia, and obesity without
dietary intervention [35]. All mice were fed a commercially available chow diet (Lab Diet 5053,
Lab Diet, Brentwood, MO), which contains 5.4% total calories from fat. The animal care and
experimentation were overseen and approved by the University of Michigan Committee on Use
and Care of Animals.
The KK/HIJ strain is relatively unique in the propensity of the female mice to accumulate fat on a
standard low-fat diet. To further characterize this difference in adipose depots between genders of
this strain, a total of 31 male and 27 female KK/HIJ mice were euthanized between 5 and 50 weeks
107

of age. Body weight, perirenal and gonadal/epididymal fat pad weights were recorded and the fat
percentage was calculated by using the following equation:
Total Fat % = 100*(Perirenal fat + Gonadal fat)/Body weight
For the voluntary exercise intervention study, female mice at ~28 weeks of age were housed
individually for two days before the start of data collection. The mice were maintained in a
temperature controlled environment under a standard 12 hour light-dark cycle and provided ad
libitum access to food and water throughout the study. Mice were randomly divided into two
groups: control group (CON) (n=8) and exercise group (EX) (n=7).
Exercise Training
Mice in EX were provided a 12.7 cm running wheel (Petco, San Diego, CA). A wired odometer-
Bell F12 Cyclocomputer (Easton-Bell Sports, Van Nuys, CA) was used to record wheel
revolutions and running distance was recorded weekly.
Glucose Tolerance Tests
Intraperitoneal glucose tolerance tests (GTT) were performed 2 weeks before the exercise
intervention began (PRE) and again after mice had undergone 5 wk of voluntary exercise
intervention (POST). In each case, mice were fasted for 5 hrs (0800–1300) (POST GTT with
access to the wheel) and were subsequently injected with glucose (1.5g/kg body wt ip). Tail blood
was collected at 0, 30, 60, 90 and 120 min. Blood glucose concentrations were measured using a
commercially available glucometer (Abbott Laboratories, Abbott Park, IL).
108

Hematologic Measures
Fasting blood samples were obtained PRE and POST exercise intervention after a 5hr food
restriction (9am to 2pm) and were kept at room temperature for 30 min before being centrifuged
at 3000 × g for 10 min. Serum was stored in a -80 °C freezer until cytokine assays were performed.
Serum iron was analyzed using the QuantiChrom iron assay kit (Bioassay Systems, Hayward, CA)
following the manufacturer's protocol. Fasting serum leptin and adiponectin levels were measured
using commercially available ELISA kits (Crystal Chem, Downers Grove, IL) according to
manufacturer’s instructions. Insulin resistance was indicated by the homeostasis model assessment
– estimated insulin resistance (HOMA-IR) index, which was calculated using the following
equation: Fasting Glucose (mg/dL) × Fasting Insulin (μU/mL) / 405. Complete blood count (CBC)
was performed with an Advia 120 Hematology System analyzer according to manufacturer
instructions (Bayer Diagnostics, Tarrytown, NY).
Quantitative Real-Time PCR
Total RNA was extracted from gonadal adipose tissues using the RNAqueous kit (Life
Technologies, Grand Island, NY) according to the manufacturer’s instructions. cDNA was
synthesized using High Capacity cDNA Reverse Transcription Kit (Applied Bio-systems, CA).
Quantitative PCR (qPCR) was used to amplify the cDNA with gene specific primers using Taqman
gene expression assay (Applied Biosystems, Foster City, CA) for TNFα, IL-6 and Leptin gene
expression. Fast SYBR green Master Mix (Applied Biosystems, Grand Island, NY) was used for
additional gene expression studies, and primer sequences are shown in Table 5-1. qPCR was
carried out by StepOne plus software (Applied Biosystems, Foster City, CA). Results were then
analyzed by 2−ΔΔCT method described previously [36, 37].
109

Statistical Analysis
Two-way ANOVA (Factor 1- Intervention: with or without voluntary exercise; Factor 2- Time:
pre and post exercise intervention) was performed to determine whether there was a significant
intervention by time interaction for the fasting serum glucose, insulin, HOMA-IR, GTT and iron
parameters. In order to compare adipose tissue inflammation measures (i.e. gene expression)
between EX and CON after 5 weeks exercise intervention, an independent student’s t-test was
applied. For correlational analyses, the Pearson’s correlation coefficient test was performed. The
statistical analysis was carried out using the SPSS statistics package (IBM SPSS statistics 19).
Values are reported as group mean ± SEM. A p-value ≤ 0.05 was considered statistically
significant.
Results
Female KK/HIJ mice have greater adiposity than males
Body weight of KK/HIJ male and female mice provided standard rodent chow increased with age
between 5wks and 50wks and there was no significant difference between genders. However, the
total fat percentage was markedly increased with age in females, while no change was observed in
males (Figure 5-1). This is consistent with DXA body composition data from The Jackson
Laboratory [38], where the body fat % is significantly higher in adult KK females than males with
normal diet (Age: 14-18wks; Female: 43.5 ± 0.764%; Male: 32.7 ± 1.72%, p<0.01) [38].
5 Weeks of Voluntary Exercise Promotes Weight Loss in KK/HIJ Female Mice
110

Mice provided access to running wheels ran an average of 6.6 ± 0.7 km per day (Figure 5-2d).
This was considerable but less than that previously observed in male [39] and female [40] C57BL/6
mice, documented to average ~10 and ~15 km per day, respectively. Following the 5 week
intervention, the body weight of the mice in EX decreased by over 15% (Figure 5-2a; p<0.01),
whereas mice in CON had no significant change in body weight during the same time period
(Figure 5-2a). The gonadal and perirenal adipose depots were combined to determine the total fat
pad weight from the tissue harvest. This measure of body fatness revealed a 65% lower fat mass
in EX than CON (Figure 5-2b, P≤0.05) despite an increased food intake in EX compared with
CON during the 4th and 5th week of the intervention (Figure 5-2c). Serum leptin concentration
was measured in the animals and, as expected, was tightly associated with the measured total fat
weight (r2 = 0.89,). A subset of both CON and EX groups had similar fasting serum levels of leptin
before the intervention (PRE CON: 9.6 ± 1.3 ng/ml; PRE EX: 10.0 ± 1.6 ng/ml; n=4 per group),
but consistent with the fat loss, the POST EX group had a strikingly lower leptin concentration
following the five week intervention (POST CON: 10.17 ± 1.15 ng/ml, n=8; POST EX: 1.52 ±
0.69 ng/ml, n=7, p≤0.05,). Overall, mice provided the voluntary running wheel were observed to
have a 15% decrease in body weight due primarily to a reduction in adipose tissue and these
changes were evident despite a modest but statistically significant increase in food intake during
the 5-week intervention.
Voluntary Exercise Improves Glucose Tolerance in KK/HIJ Female Mice
Female KK/HIJ mice, in addition to having excess adipose tissue, have been documented to have
considerable elevations in fasting serum insulin [41]. To evaluate the effect of exercise on glucose
homeostasis in KK/HIJ female mice, we measured fasting glucose, fasting insulin, HOMA-IR, and
111
glucose tolerance both before and after intervention in both CON and EX groups. An index of the
overall glucose tolerance was determined by calculating the incremental area under the curve
(AUC) during the 2 hour GTT test. Two-way ANOVA analysis demonstrated that there was not a
significant intervention (CON and EX) by time (PRE and POST) interaction for the measures taken
in the fasted state: fasting glucose, fasting insulin and HOMA-IR (p>0.05). Indeed, fasting glucose
was not different between CON and EX before or after the intervention (p>0.05; Figure 5-3a).
Nevertheless, despite the lack of the intervention by time interaction, the fasting serum insulin was
30% lower in EX compared with CON following the intervention (p<0.01; Figure 5-3b) and
HOMA-IR, was on average 35% lower in EX compared with CON after the intervention (p≤0.05;
Figure 5-3c). Importantly, the glucose tolerance test revealed robust effects of the wheel
intervention compared to the control treatment as evidenced by the significant time by intervention
interaction for the AUC (p<0.001; Figure 5-3d, e).
Effects of Voluntary Exercise on Hematologic Measures in KK/HIJ Female Mice
Complete blood count and iron status measures are shown in Table 5-3. Red blood cell (RBC) and
white blood cell (WBC) count as well as several WBC subpopulations, such as lymphocytes,
monocytes and eosinophils, were not different between CON and EX after 5-week voluntary
exercise intervention (p>0 .05, Table 5-3). Hemoglobin levels, mean corpuscular hemoglobin
(MCH), and hematocrit did not change after exercise intervention (p>0.05, Table 5-3). However,
mean corpuscular hemoglobin concentration (MCHC) was lower while the mean corpuscular
volume (MCV), proportion of marginally sized erythrocytes (%macro) and red blood cell
distribution width (RDW) were significantly higher in EX compared to CON mice (p≤0.05, Table
112

5-3). Regarding circulating iron, the two-way ANOVA revealed that there was no significant time
(PRE and POST) by intervention (CON and EX) interaction for serum iron (p>0.05, Figure 5-3f).
Effects of Voluntary Exercise on Expression of Adipose Tissue Inflammatory Markers
To further characterize the effect of voluntary exercise on adipose tissue inflammation, gene
expression was performed. Tnfα and Il-6 were used as inflammatory cytokine markers, F4/80 as
an adipose tissue macrophage marker and Itgax as an M1 macrophage marker. We observed a
decrease in gene expression of Tnfα in EX compared with CON (P ≤ 0.05). However, gene
expression analyses of F4/80 (p=0.07) and Itgax (p=0.09) were not statistically different between
the groups but tended to be decreased in EX compared with CON. There was no significant
difference in IL-6 expression between groups (p=0.3). Furthermore, voluntary exercise did not
elevate, but rather lowered the M2 specific genes Chi3l3, Mgl1 (macrophage galactose N-acetyl-
galactosamine–specific lectins 1) and Mrc2 (mannose receptor, C type 2) (p<0.05; Table 5-2). IL-
10 also had 63% reduction, but this difference did not reach statistical significance (p=0.06) (Table
5-2). Adipose tissue gene expression of the anti-inflammatory marker, adiponectin, was not
different between CON and EX post intervention. This was found to be consistent with circulating
levels of (serum) adiponectin, which were not different between the groups (POST-CON: 18.45 ±
1.39 µg/mL; POST-EX: 17.52 ± 1.33 µg/mL, p>0.05).
Discussion
To our knowledge, this is the first study focusing on the effects of voluntary exercise on adipose
tissue inflammation in the polygenic obese female KK/HIJ mouse model. In these studies we
observed the following: 1) Female KK mice have a robust age-associated accumulation of adipose
113

tissue; 2) A short term voluntary wheel running intervention decreased body weight and improved
glucose tolerance despite an increase in food consumption; 3) The wheel intervention resulted in
a down-regulation of both inflammatory and anti-inflammatory gene expression from the gonadal
adipose tissue compared to the control group; and 4) though subtle alterations in hematologic
measures were evident (e.g. higher RDW, MCV, %macro and lower MCHC) following the
exercise intervention, no influence on circulating serum iron was observed. In summary, our study
has demonstrated that 5 weeks voluntary exercise is adequate to induce a reduction in adiposity,
decrease in inflammatory markers of gene expression in adipose tissue and an improvement in
glucose tolerance.
In this study we used a rarely studied mouse model of polygenic obesity, the females of the KK/HlJ
strain. Studies examining the importance of exercise on adipose tissue in the obese state have
focused on male mice and rats, and most of the studies have used diet-induced obese animal models
[6, 32, 42, 43]. Although dietary fat plays an important role in obesity, it is not the only factor [44-
47]. This KK mouse strain was originally bred to produce a mouse with insulin resistance [35] and
the males have been used in many studies as a model of hyperglycemia. However, the female
KK/HIJ are remarkable in their predilection for greater fat storage than males of the same strain,
which has been observed in our study as well as previous publication [48], making them notable
for studies of adipose tissue inflammation in the setting of obesity. These mice were very
responsive to the voluntary wheel running intervention and a robust weight loss effect was evident
after 5 weeks of exercise intervention. The amount of weight loss in the mice provided the wheel
was nearly equal to the difference in adipose tissue mass between the CON and EX groups,
indicating that a high proportion of the weight loss was from the adipose depots harvested in this
114

study (i.e. perirenal and gonadal depots). Additionally, the remarkably reduced serum leptin level
in EX was highly associated with the weight loss. This is consistent with human studies, where
massive fat loss was paralleled by a robust decrease in circulating leptin [49-51]. The decreased
leptin might also relate to the greater food intake in EX compared with CON. Furthermore, we
observed approximately 5 grams of weight loss during 5 weeks of voluntary exercise in KK female
mice whereas previous studies (of 6 weeks duration) have observed weight loss of only ~1 gram
and ~3 grams in C57BL/6 mice provided normal and high fat diets, respectively [6, 52]. Therefore,
the voluntary running wheel serves as an especially effective strategy for fat reduction in this
KK/HIJ mouse model and provides a robust model of exercise-induced weight loss and adipose
tissue remodeling.
Iron dysregulation is considered as a potential contributor to the pathology of obesity-related
metabolic complications including T2DM. Studies have demonstrated elevated iron stores to
precede insulin resistance [53, 54], while lowering serum iron has been demonstrated to increase
insulin sensitivity [55, 56]. As the female KK mice have been observed to have greatly elevated
serum iron concentration [57], we sought to examine the influence of exercise on iron metabolism
in the context of their glucose intolerance. In the present study, we did not observe any change of
the serum iron concentration in EX compared with CON. Furthermore, no alterations in
hemoglobin or hematocrit were evident between groups. We did observe several differences in the
complete blood count that suggest subtle alterations in hematopoiesis resulting from the wheel
intervention. First, we observed a higher red blood cell distribution width (RDW) in EX which
describes that there is an increase of the variation of red blood cell volume compared with CON.
This has been used clinically as a marker of several types of anemia and has been described as an
115

early marker of iron deficiency anemia [58]. Secondly, we observed a significantly higher MCV
and lower MCHC in EX compared to CON. Along with the higher RDW, the change of MCV and
MCHC in EX mice is a phenomenon of increased red blood cell size and likely a compensatory
response to increased red blood cell turnover, which has been observed in humans with increased
hemolysis due to exercise [59]. Consistent with this, we observed significantly more macrocytic
red blood cells in EX compared with CON. Nevertheless, despite subtle alterations in these RBC
indices, no major alterations in serum iron or hemoglobin concentration were noted despite the
robust changes in adiposity and glucose tolerance.
Short-term voluntary exercise resulted in a significant improvement in glucose homeostasis. This
was manifest as a highly robust improvement in the AUC of the glucose tolerance test as well as
lower fasting serum insulin between EX and CON following the voluntary wheel running
intervention. However, given the robust difference in fat mass following the study, it is not possible
to separate the direct effects of exercise on the improved glucose homeostasis from the indirect
improvements provided by the reduced fat mass. Both exercise and weight loss have been shown
to improve glucose tolerance. For example, acute exercise or exercise training without weight loss
can increase skeletal muscle glucose uptake and improve insulin sensitivity [60-62] although this
is often not observed when measured a few days after exercise[63]. In addition, calorie restriction
or bariatric surgery induced weight loss can also improve insulin sensitivity by decreasing fat mass,
changing the adipokines release (reviewed by [64]) and reducing fatty acid mobilization [65].
Therefore, our study was limited by the combined factors of the exercise and weight loss with the
wheel intervention. However, given the robust effects demonstrated by this intervention, we
propose that in future studies the voluntary running wheel access could be titrated, for example,
116

by locking the running wheel for a portion of the active period. This would allow a more consistent
exercise dose and/or control of the energy expenditure and weight loss. Alternatively, a non-
exercise control group could be evaluated to separate the effect of weight loss alone from the
effects resulting from weight loss and exercise in the present study. Nevertheless, in these initial
studies of voluntary exercise in the KK/HIJ females, we have demonstrated a robust improvement
in glucose tolerance and adiposity that has not been observed previously in a mouse model of
polygenic obesity.
Adipose tissue inflammation was lower in EX compared with CON mice following the 5-week
voluntary exercise intervention. Low-grade inflammation has been noted in obese individuals with
both insulin resistance and type 2 diabetes [15, 66, 67]. Previous studies have also shown that
obesity-related adipose tissue inflammation is associated with increased adipose tissue
macrophage infiltration [23]. However, there is evidence that insulin sensitivity can be recovered
by inhibition of macrophage infiltration and the suppression of pro-inflammatory cytokines in the
setting of diet-induced obesity [28, 67, 68]. Similarly, exercise has been demonstrated to decrease
adipose tissue inflammation and improve glucose tolerance [6, 9, 52, 69]. However, most of these
studies have focused on males and diet-induced obesity. In the present study, female KK mice
from EX had a 50% lower adipose tissue Tnfα expression compared with CON following the 5
week intervention, suggesting that adipose tissue inflammation was suppressed by the voluntary
wheel running or weight loss. In addition to Tnfα, which has been associated with both adipose
tissue inflammation and insulin resistance [17, 18], F4/80, Itgax (Integrin alpha X, also known as
CD11c) as well as IL-6 are also inflammatory markers or cytokines from ATMs or adipocytes
[16]. However, our gene expression results for the pro-inflammatory genes F4/80 and Itgax
117

(Integrin alpha X, also known as CD11c) were not statistically different between groups, though
they tended to be decreased after exercise intervention in EX compared with CON. This may have
been due to the small sample size and the variability in our samples. In the case of IL-6, its role in
insulin resistance is highly controversial. Human studies have been equivocal, providing evidence
that IL-6 may [70, 71] or may not [72] be associated with insulin resistance. Nevertheless, in our
study, no difference in IL-6 expression in adipose tissue was observed between CON and EX and
therefore the improvement in glucose tolerance appears independent of changes in adipose tissue
IL-6 expression in the female KK/HIJ mouse model. However, due to the evident changes in both
adiposity and adipose tissue inflammatory gene expression, it is not possible for us to delineate the
specific mechanisms for the improved glucose homeostasis.
Recent studies evaluating exercise and adipose tissue inflammation have observed an increase in
anti-inflammatory markers [6, 9, 29-32, 73]. For example, anti-inflammatory markers Interleukin
10 (IL-10) and Cluster of Differentiation 163 (CD163, a marker for M2 macrophages) were
elevated following both acute and chronic exercise in C57/BL6 male mice [31, 32]. However, in
our female KK mice, we observed lower expression of adipose tissue anti-inflammatory genes
including Mgl1 (macrophage galactose N-acetyl-galactosamine specific Lectin 1, which is
encoded by CD301), and Mrc2 (Mannose Receptor C Type2) in the exercise compared with the
control group. We speculate that this might be partially due to the substantial decrease of the
adipose tissue mass in those provided the voluntary wheel. However, as this is the first study of
exercise-induced changes in adipose tissue inflammation in obese females, these differences may
also be linked to sex-specific changes following exercise. Studies with obese women have shown
that exercise training and long-term lifestyle intervention (hypocaloric diet and daily moderate
118

physical activity) with weight loss increased anti-inflammatory adipokine (adiponectin) and
decreased inflammatory gene expression in adipose tissue [74-77]. To date, human studies have
not directly compared men and women regarding the effect of exercise on adipose tissue
macrophage markers. Although Brunn et al. examined both men and women in a small study
(n=23 total) evaluating the effects of a 15-week lifestyle intervention, they did not directly compare
the response of the men and women in the study. They did, however, demonstrate a significant
weight loss (average of 13% of body weight) as well as a decrease in adipose tissue macrophage-
specific markers (e.g. CD68 and CD14) and inflammatory adipokines (e.g. TNFα, IL-6 and MCP-
1) [74]. On the other hand, in our study, since Mgl1 and Mrc2 are both macrophage markers, it is
be important for future studies to isolate macrophages and directly evaluate the adipose tissue
macrophage changes.
It is important to note that the concept of adipose tissue inflammation in the setting of obesity has
implications beyond effects on glucose control and diabetes. For example, long-term up-
regulation of inflammatory pathways in adipose tissue may contribute to increased fibrosis [78],
atherosclerosis [79, 80] and/or CVD complications [81, 82]. We were specifically interested in
the impact of exercise on adipose tissue macrophages and their gene expression within our obese
female mouse model. However, in order to provide definitive answers regarding the role of
exercise on macrophage polarization in the future, it will be necessary to directly determine the
macrophage cell surface markers via flow cytometry or other direct measurement.
Conclusion
119
Five weeks of voluntary exercise intervention decreased body weight and improved glucose
homeostasis despite increased food consumption in polygenic obese female KK/HIJ mice. These
exercise-induced changes are coincident with an overall decrease in adipose tissue mass and the
gene expression of both anti-inflammatory and pro-inflammatory macrophage markers.
Acknowledgement:
The authors acknowledge funding received from the School of Kinesiology, Rackham Graduate
School and the Undergraduate Research Opportunity Program (UROP) at the University of
Michigan.
120

Table 5-1 Primer sequences for adipose tissue gene expression.
Gene Forward(5’-->3’) Reverse(5’-->3’)
Gapdh TGAAGCAGGCATCTGAGGG CGAAGGTGGAAGAGTGGGAG
AdipoQ GGAGATGCAGGTCTTCTTGG ATGTTGCAGTAGAACTTGCC
F4/80 CTTTGGCTATGGGCTTCCAGTC GCAAGGAGGACAGAGTTTATCGTG
Il10 GCTCTTACTGACTGGCATGAG CGCAGCTCTAGGAGCATGTG
Itgax CTGGATAGCCTTTCTTCTGCTG GCACACTGTGTCCGAACTC
Mgl1 TGAGAAAGGCTTTAAGAACTGGG GACCACCTGTAGTGATGTGGG
Mrc2 TACAGCTCCACGCTATGGATT CACTCTCCCAGTTGAGGTACT
Chi3l3 AGAAGGGAGTTTCAAACCTGGT GTCTTGCTCATGTGTGTAAGTGA
121

Table 5-2 Adipose tissue gene expression
Abbreviations: Pro-inflammatory genes F4/80, Itgax, Integrin, Alpha X; IL6, Interleukin 6; and Tnfα, tumor necrosis factor α; Anti-inflammatory genes Mgl1, macrophage galactose N-acetyl-galactosamine–specific lectins 1; Mrc2, mannose receptor, C type 2 Mrc2, IL10, Interleukin10; Adipoq, Adiponectin; and Lep, Leptin gene expression (n=4 per group). * P≤0.05
CON (Mean ± SEM) EX (Mean ± SEM) P values
Inflammatory
Genes
F4/80 1.00 ± 0.33 0.28 ± 0.04 0.067
Itgax 1.00 ± 0.38 0.25 ± 0.06 0.094
Il6 1.00 ± 0.52 0.41 ± 0.19 0.329
Tnfα 1.00 ± 0.20 0.54 ± 0.06 ≤0.05
Anti-
inflammatory
Genes
Chi3l3 1.00 ± 0.10 0.59 ± 0.07 <0.01
Mgl1 1.00± 0.06 0.70 ± 0.06 * 0.004
Mrc2 1.00 ± 0.13 0.28 ± 0.03 * <0.01
Il10 1.00 ± 0.28 0.37 ± 0.07 0.064
Adipokine
Gene
Lep 1.00 ± 0.14 0.28 ± 0.09 * <0.01
AdipoQ 1.00 ± 0.12 0.89 ± 0.14 0.577
122

Table 5-3 Hematologic Measures in CON and EX group after 5weeks voluntary exercise intervention. * CON vs EX p≤0.05.
CON (Mean ±
EX (Mean ± SEM) P values
WBC × 103 (cells/μl) 7.5 ± 0.74 7.1 ± 0.92 0.781
Lymph × 103(cells/μl) 5.0 ± 0.61 4.6 ± 0.66 0.694
Mono × 103(cells/μl) 0.3 ± 0.03 0.2 ± 0.06 0.386
Eos × 103(cells/μl) 0.4 ± 0.03 0.4 ± 0.03 0.689
RBC × 106 (cells/μl) 9.3 ± 0.07 9.0 ± 0.26 0.259
Hgb (g/dl) 12.5 ± 0.19 12.3 ± 0.47 0.666
MCV (fL) 50.0 ± 0.06 51.8 ± 0.14* <0.01
% Macro 0.1 ± 0.04 0.4 ± 0.08
0.006
% Micro 0.4 ± 0.03 0.5 ± 0.04
0.666
RDW% 15.0 ± 0.16 16.0 ± 0.22*
0.003
MCH (pg) 13.5 ± 0.11 13.7 ± 0.12 0.326
MCHC (g/dL) 27.1 ± 0.15 26.4 ± 0.25* 0.046
HCT (%) 46.5 ± 0.33 46.7 ± 1.23 0.861
123

Figure 5-1 Female KK/HIJ mice are more prone to fat accumulation than males.
A) Body weight comparison between females and males of different ages. B) Age-related changes in total fat (gonadal and perirenal fat) percentage of male and female KK/HIJ mice. (Female: n=27; Male: n=31)
124

Figure 5-2 Voluntary exercise induced weight loss in KK/HIJ mice.
A), Body weight change during 5 weeks exercise intervention, B) Total fat weight including gonadal and perirernal fat pads in CON and EX after intervention, C) Food intake during the intervention in CON and EX groups, D) Weekly running distance in exercise group. *CON vs EX P≤0.05
125

A) Fasting serum glucose was not different in PRE and POST CON and EX groups; B) Fasting serum insulin did not change in PRE and POST CON and EX groups; C) HOMA-IR showed significant change in PRE and POST CON and EX groups; D&E) GTT and AUC had significant change in PRE and POST CON and EX groups; F) Serum iron in PRE and POST CON and EX groups was not different; * CON vs EX p≤0.05. (Glucose, time p≤0.05; HOMA-IR, intervention p≤0.05; Insulin, intervention p≤0.05)
Figure 5-3 Voluntary exercise improves glucose tolerance and insulin sensitivity in KK/HIJ female mice.
126

References:
1. Farooqi, I.S. and S. O'Rahilly, Genetic factors in human obesity. Obes Rev, 2007. 8 Suppl 1: p. 37-40.
2. Bouchard, C., Defining the genetic architecture of the predisposition to obesity: a challenging but not insurmountable task. Am J Clin Nutr, 2010. 91(1): p. 5-6.
3. Shoelson, S.E., J. Lee, and A.B. Goldfine, Inflammation and insulin resistance. J Clin Invest, 2006. 116(7): p. 1793-801.
4. Tilg, H. and A.R. Moschen, Adipocytokines: mediators linking adipose tissue, inflammation and immunity. Nat Rev Immunol, 2006. 6(10): p. 772-83.
5. Nassis, G.P., et al., Aerobic exercise training improves insulin sensitivity without changes in body weight, body fat, adiponectin, and inflammatory markers in overweight and obese girls. Metabolism, 2005. 54(11): p. 1472-9.
6. Bradley, R.L., et al., Voluntary exercise improves insulin sensitivity and adipose tissue inflammation in diet-induced obese mice. Am J Physiol Endocrinol Metab, 2008. 295(3): p. E586-94.
7. Ross, R. and A.J. Bradshaw, The future of obesity reduction: beyond weight loss. Nat Rev Endocrinol, 2009. 5(6): p. 319-25.
8. Petersen, A.M. and B.K. Pedersen, The anti-inflammatory effect of exercise. J Appl Physiol, 2005. 98(4): p. 1154-62.
9. Kizaki, T., et al., Voluntary exercise attenuates obesity-associated inflammation through ghrelin expressed in macrophages. Biochem Biophys Res Commun. 413(3): p. 454-9.
10. Mathur, N. and B.K. Pedersen, Exercise as a mean to control low-grade systemic inflammation. Mediators Inflamm, 2008. 2008: p. 109502.
11. Pradhan, A.D., et al., C-reactive protein, interleukin 6, and risk of developing type 2 diabetes mellitus. Jama, 2001. 286(3): p. 327-34.
12. Frohlich, M., et al., Association between C-reactive protein and features of the metabolic syndrome: a population-based study. Diabetes Care, 2000. 23(12): p. 1835-9.
13. Ford, E.S., Body mass index, diabetes, and C-reactive protein among U.S. adults. Diabetes Care, 1999. 22(12): p. 1971-7.
14. Hotamisligil, G.S., N.S. Shargill, and B.M. Spiegelman, Adipose expression of tumor necrosis factor-alpha: direct role in obesity-linked insulin resistance. Science, 1993. 259(5091): p. 87-91.
127

15. Xu, H., et al., Chronic inflammation in fat plays a crucial role in the development of obesity-related insulin resistance. J Clin Invest, 2003. 112(12): p. 1821-30.
16. Park, H.S., J.Y. Park, and R. Yu, Relationship of obesity and visceral adiposity with serum concentrations of CRP, TNF-alpha and IL-6. Diabetes Res Clin Pract, 2005. 69(1): p. 29-35.
17. Halse, R., et al., Effects of tumor necrosis factor-alpha on insulin action in cultured human muscle cells. Diabetes, 2001. 50(5): p. 1102-9.
18. Youd, J.M., S. Rattigan, and M.G. Clark, Acute impairment of insulin-mediated capillary recruitment and glucose uptake in rat skeletal muscle in vivo by TNF-alpha. Diabetes, 2000. 49(11): p. 1904-9.
19. Hotamisligil, G.S., et al., Increased adipose tissue expression of tumor necrosis factor-alpha in human obesity and insulin resistance. J Clin Invest, 1995. 95(5): p. 2409-15.
20. Uysal, K.T., et al., Protection from obesity-induced insulin resistance in mice lacking TNF-alpha function. Nature, 1997. 389(6651): p. 610-4.
21. Borst, S.E. and G.J. Bagby, Neutralization of tumor necrosis factor reverses age-induced impairment of insulin responsiveness in skeletal muscle of Sprague-Dawley rats. Metabolism, 2002. 51(8): p. 1061-4.
22. Trayhurn, P. and I.S. Wood, Signalling role of adipose tissue: adipokines and inflammation in obesity. Biochem Soc Trans, 2005. 33(Pt 5): p. 1078-81.
23. Oh, D.Y., et al., Increased macrophage migration into adipose tissue in obese mice. Diabetes, 2012. 61(2): p. 346-54.
24. Chinetti-Gbaguidi, G. and B. Staels, Macrophage polarization in metabolic disorders: functions and regulation. Curr Opin Lipidol, 2011. 22(5): p. 365-72.
25. Lumeng, C.N., J.L. Bodzin, and A.R. Saltiel, Obesity induces a phenotypic switch in adipose tissue macrophage polarization. J Clin Invest, 2007. 117(1): p. 175-84.
26. Lumeng, C.N., et al., Phenotypic switching of adipose tissue macrophages with obesity is generated by spatiotemporal differences in macrophage subtypes. Diabetes, 2008. 57(12): p. 3239-46.
27. Kamei, N., et al., Overexpression of monocyte chemoattractant protein-1 in adipose tissues causes macrophage recruitment and insulin resistance. J Biol Chem, 2006. 281(36): p. 26602-14.
28. Kanda, H., et al., MCP-1 contributes to macrophage infiltration into adipose tissue, insulin resistance, and hepatic steatosis in obesity. J Clin Invest, 2006. 116(6): p. 1494-505.
128

29. Baynard, T., et al., Exercise training effects on inflammatory gene expression in white adipose tissue of young mice. Mediators Inflamm, 2012. 2012: p. 767953.
30. Kawanishi, N., et al., Exercise attenuates M1 macrophages and CD8+ T cells in the adipose tissue of obese mice. Med Sci Sports Exerc, 2013. 45(9): p. 1684-93.
31. Oliveira, A.G., et al., Acute exercise induces a phenotypic switch in adipose tissue macrophage polarization in diet-induced obese rats. Obesity (Silver Spring), 2013. 21(12): p. 2545-56.
32. Kawanishi, N., et al., Exercise training inhibits inflammation in adipose tissue via both suppression of macrophage infiltration and acceleration of phenotypic switching from M1 to M2 macrophages in high-fat-diet-induced obese mice. Exerc Immunol Rev, 2010. 16: p. 105-18.
33. Linden, M.A., et al., Moderate exercise training provides modest protection against adipose tissue inflammatory gene expression in response to high-fat feeding. Physiol Rep, 2014. 2(7).
34. Pollitzer, E., Biology: Cell sex matters. Nature, 2013. 500(7460): p. 23-4.
35. Suto, J., et al., Genetic analysis of non-insulin-dependent diabetes mellitus in KK and KK-Ay mice. Eur J Endocrinol, 1998. 139(6): p. 654-61.
36. Livak, K.J. and T.D. Schmittgen, Analysis of relative gene expression data using real-time quantitative PCR and the 2(-Delta Delta C(T)) Method. Methods, 2001. 25(4): p. 402-8.
37. Yang, S.J., et al., Inhibition of the chemokine (C-C motif) ligand 2/chemokine (C-C motif) receptor 2 pathway attenuates hyperglycaemia and inflammation in a mouse model of hepatic steatosis and lipoatrophy. Diabetologia, 2009. 52(5): p. 972-81.
38. Tordoff MG, B.A., Diet preference: Survey of calcium and sodium intake, blood pH and calcium level, and bone and body composition data in 40 inbred strains of mice. . 2014.
39. De Bono, J.P., et al., Novel quantitative phenotypes of exercise training in mouse models. Am J Physiol Regul Integr Comp Physiol, 2006. 290(4): p. R926-34.
40. Hoffman-Goetz, L., N. Pervaiz, and J. Guan, Voluntary exercise training in mice increases the expression of antioxidant enzymes and decreases the expression of TNF-alpha in intestinal lymphocytes. Brain Behav Immun, 2009. 23(4): p. 498-506.
41. Svenson, K.L., et al., Multiple trait measurements in 43 inbred mouse strains capture the phenotypic diversity characteristic of human populations. J Appl Physiol, 2007. 102(6): p. 2369-78.
129
42. Kizaki, T., et al., Voluntary exercise attenuates obesity-associated inflammation through ghrelin expressed in macrophages. Biochem Biophys Res Commun, 2011. 413(3): p. 454-9.
43. Kawanishi, N., et al., Exercise training attenuates hepatic inflammation, fibrosis and macrophage infiltration during diet induced-obesity in mice. Brain Behav Immun, 2012. 26(6): p. 931-41.
44. Astrup, A., Dietary fat is a major player in obesity--but not the only one. Obes Rev, 2002. 3(2): p. 57-8.
45. Willett, W.C., Dietary fat plays a major role in obesity: no. Obes Rev, 2002. 3(2): p. 59-68.
46. Willett, W.C. and R.L. Leibel, Dietary fat is not a major determinant of body fat. Am J Med, 2002. 113 Suppl 9B: p. 47S-59S.
47. Willett, W.C., Is dietary fat a major determinant of body fat? Am J Clin Nutr, 1998. 67(3 Suppl): p. 556S-562S.
48. Reed, D.R., A.A. Bachmanov, and M.G. Tordoff, Forty mouse strain survey of body composition. Physiol Behav, 2007. 91(5): p. 593-600.
49. Knuth, N.D., et al., Metabolic adaptation following massive weight loss is related to the degree of energy imbalance and changes in circulating leptin. Obesity (Silver Spring), 2014.
50. Rosenbaum, M., et al., Low-dose leptin reverses skeletal muscle, autonomic, and neuroendocrine adaptations to maintenance of reduced weight. J Clin Invest, 2005. 115(12): p. 3579-86.
51. Rosenbaum, M., et al., Effects of weight change on plasma leptin concentrations and energy expenditure. J Clin Endocrinol Metab, 1997. 82(11): p. 3647-54.
52. Vieira, V.J., et al., Effects of exercise and low-fat diet on adipose tissue inflammation and metabolic complications in obese mice. Am J Physiol Endocrinol Metab, 2009. 296(5): p. E1164-71.
53. Forouhi, N.G., et al., Elevated serum ferritin levels predict new-onset type 2 diabetes: results from the EPIC-Norfolk prospective study. Diabetologia, 2007. 50(5): p. 949-56.
54. Jiang, R., et al., Body iron stores in relation to risk of type 2 diabetes in apparently healthy women. Jama, 2004. 291(6): p. 711-7.
55. Facchini, F.S., Effect of phlebotomy on plasma glucose and insulin concentrations. Diabetes Care, 1998. 21(12): p. 2190.
130

56. Fernandez-Real, J.M., et al., Blood letting in high-ferritin type 2 diabetes: effects on insulin sensitivity and beta-cell function. Diabetes, 2002. 51(4): p. 1000-4.
57. Yuan R, K.R. Aging study: Blood chemistry for 32 inbred strains of mice. . 2014 [cited 2014 Dec. 02]; Available from: http://phenome.jax.org, Dec, 2013
58. McClure, S., E. Custer, and J.D. Bessman, Improved detection of early iron deficiency in nonanemic subjects. JAMA, 1985. 253(7): p. 1021-3.
59. Eichner, E.R., Runner's macrocytosis: a clue to footstrike hemolysis. Runner's anemia as a benefit versus runner's hemolysis as a detriment. Am J Med, 1985. 78(2): p. 321-5.
60. Goodyear, L.J. and B.B. Kahn, Exercise, glucose transport, and insulin sensitivity. Annu Rev Med, 1998. 49: p. 235-61.
61. Wojtaszewski, J.F., J.N. Nielsen, and E.A. Richter, Invited review: effect of acute exercise on insulin signaling and action in humans. J Appl Physiol (1985), 2002. 93(1): p. 384-92.
62. Duncan, G.E., et al., Exercise training, without weight loss, increases insulin sensitivity and postheparin plasma lipase activity in previously sedentary adults. Diabetes Care, 2003. 26(3): p. 557-62.
63. Gordon, B.A., et al., Insulin sensitivity not modulated 24 to 78 h after acute resistance exercise in type 2 diabetes patients. Diabetes Obes Metab, 2013. 15(5): p. 478-80.
64. Gumbs, A.A., I.M. Modlin, and G.H. Ballantyne, Changes in insulin resistance following bariatric surgery: role of caloric restriction and weight loss. Obes Surg, 2005. 15(4): p. 462-73.
65. Schenk, S., et al., Improved insulin sensitivity after weight loss and exercise training is mediated by a reduction in plasma fatty acid mobilization, not enhanced oxidative capacity. J Physiol, 2009. 587(Pt 20): p. 4949-61.
66. van Greevenbroek, M.M., C.G. Schalkwijk, and C.D. Stehouwer, Obesity-associated low-grade inflammation in type 2 diabetes mellitus: causes and consequences. Neth J Med, 2013. 71(4): p. 174-87.
67. Weisberg, S.P., et al., Obesity is associated with macrophage accumulation in adipose tissue. J Clin Invest, 2003. 112(12): p. 1796-808.
68. Ito, A., et al., Role of CC chemokine receptor 2 in bone marrow cells in the recruitment of macrophages into obese adipose tissue. J Biol Chem, 2008. 283(51): p. 35715-23.
69. Kawanishi, N., et al., Exercise training inhibits inflammation in adipose tissue via both suppression of macrophage infiltration and acceleration of phenotypic switching from M1 to M2 macrophages in high-fat-diet-induced obese mice. Exerc Immunol Rev. 16: p. 105-18.
131

70. Bastard, J.P., et al., Adipose tissue IL-6 content correlates with resistance to insulin activation of glucose uptake both in vivo and in vitro. J Clin Endocrinol Metab, 2002. 87(5): p. 2084-9.
71. Pickup, J.C., et al., NIDDM as a disease of the innate immune system: association of acute-phase reactants and interleukin-6 with metabolic syndrome X. Diabetologia, 1997. 40(11): p. 1286-92.
72. Carey, A.L., et al., Interleukin-6 and tumor necrosis factor-alpha are not increased in patients with Type 2 diabetes: evidence that plasma interleukin-6 is related to fat mass and not insulin responsiveness. Diabetologia, 2004. 47(6): p. 1029-37.
73. Gleeson, M., et al., The anti-inflammatory effects of exercise: mechanisms and implications for the prevention and treatment of disease. Nat Rev Immunol, 2011. 11(9): p. 607-15.
74. Bruun, J.M., et al., Diet and exercise reduce low-grade inflammation and macrophage infiltration in adipose tissue but not in skeletal muscle in severely obese subjects. Am J Physiol Endocrinol Metab, 2006. 290(5): p. E961-7.
75. Fisher, G., et al., Effect of diet with and without exercise training on markers of inflammation and fat distribution in overweight women. Obesity (Silver Spring), 2011. 19(6): p. 1131-6.
76. Lakhdar, N., et al., Diet and diet combined with chronic aerobic exercise decreases body fat mass and alters plasma and adipose tissue inflammatory markers in obese women. Inflammation, 2013. 36(6): p. 1239-47.
77. Ryan, A.S. and B.J. Nicklas, Reductions in plasma cytokine levels with weight loss improve insulin sensitivity in overweight and obese postmenopausal women. Diabetes Care, 2004. 27(7): p. 1699-705.
78. Spencer, M., et al., Adipose tissue macrophages in insulin-resistant subjects are associated with collagen VI and fibrosis and demonstrate alternative activation. Am J Physiol Endocrinol Metab. 299(6): p. E1016-27.
79. Ohman, M.K., et al., Visceral adipose tissue and atherosclerosis. Curr Vasc Pharmacol, 2009. 7(2): p. 169-79.
80. Ikeoka, D., J.K. Mader, and T.R. Pieber, Adipose tissue, inflammation and cardiovascular disease. Rev Assoc Med Bras. 56(1): p. 116-21.
81. Gustafson, B., Adipose tissue, inflammation and atherosclerosis. J Atheroscler Thromb. 17(4): p. 332-41.
82. Berg, A.H. and P.E. Scherer, Adipose tissue, inflammation, and cardiovascular disease. Circ Res, 2005. 96(9): p. 939-49.
132

1. Farooqi, I.S. and S. O'Rahilly, Genetic factors in human obesity. Obes Rev, 2007. 8 Suppl 1: p. 37-40.
2. Bouchard, C., Defining the genetic architecture of the predisposition to obesity: a challenging but not insurmountable task. Am J Clin Nutr, 2010. 91(1): p. 5-6.
3. Shoelson, S.E., J. Lee, and A.B. Goldfine, Inflammation and insulin resistance. J Clin Invest, 2006. 116(7): p. 1793-801.
4. Tilg, H. and A.R. Moschen, Adipocytokines: mediators linking adipose tissue, inflammation and immunity. Nat Rev Immunol, 2006. 6(10): p. 772-83.
5. Nassis, G.P., et al., Aerobic exercise training improves insulin sensitivity without changes in body weight, body fat, adiponectin, and inflammatory markers in overweight and obese girls. Metabolism, 2005. 54(11): p. 1472-9.
6. Bradley, R.L., et al., Voluntary exercise improves insulin sensitivity and adipose tissue inflammation in diet-induced obese mice. Am J Physiol Endocrinol Metab, 2008. 295(3): p. E586-94.
7. Ross, R. and A.J. Bradshaw, The future of obesity reduction: beyond weight loss. Nat Rev Endocrinol, 2009. 5(6): p. 319-25.
8. Petersen, A.M. and B.K. Pedersen, The anti-inflammatory effect of exercise. J Appl Physiol, 2005. 98(4): p. 1154-62.
9. Kizaki, T., et al., Voluntary exercise attenuates obesity-associated inflammation through ghrelin expressed in macrophages. Biochem Biophys Res Commun. 413(3): p. 454-9.
10. Mathur, N. and B.K. Pedersen, Exercise as a mean to control low-grade systemic inflammation. Mediators Inflamm, 2008. 2008: p. 109502.
11. Pradhan, A.D., et al., C-reactive protein, interleukin 6, and risk of developing type 2 diabetes mellitus. Jama, 2001. 286(3): p. 327-34.
12. Frohlich, M., et al., Association between C-reactive protein and features of the metabolic syndrome: a population-based study. Diabetes Care, 2000. 23(12): p. 1835-9.
13. Ford, E.S., Body mass index, diabetes, and C-reactive protein among U.S. adults. Diabetes Care, 1999. 22(12): p. 1971-7.
14. Hotamisligil, G.S., N.S. Shargill, and B.M. Spiegelman, Adipose expression of tumor necrosis factor-alpha: direct role in obesity-linked insulin resistance. Science, 1993. 259(5091): p. 87-91.
133
15. Xu, H., et al., Chronic inflammation in fat plays a crucial role in the development of obesity-related insulin resistance. J Clin Invest, 2003. 112(12): p. 1821-30.
16. Park, H.S., J.Y. Park, and R. Yu, Relationship of obesity and visceral adiposity with serum concentrations of CRP, TNF-alpha and IL-6. Diabetes Res Clin Pract, 2005. 69(1): p. 29-35.
17. Halse, R., et al., Effects of tumor necrosis factor-alpha on insulin action in cultured human muscle cells. Diabetes, 2001. 50(5): p. 1102-9.
18. Youd, J.M., S. Rattigan, and M.G. Clark, Acute impairment of insulin-mediated capillary recruitment and glucose uptake in rat skeletal muscle in vivo by TNF-alpha. Diabetes, 2000. 49(11): p. 1904-9.
19. Hotamisligil, G.S., et al., Increased adipose tissue expression of tumor necrosis factor-alpha in human obesity and insulin resistance. J Clin Invest, 1995. 95(5): p. 2409-15.
20. Uysal, K.T., et al., Protection from obesity-induced insulin resistance in mice lacking TNF-alpha function. Nature, 1997. 389(6651): p. 610-4.
21. Borst, S.E. and G.J. Bagby, Neutralization of tumor necrosis factor reverses age-induced impairment of insulin responsiveness in skeletal muscle of Sprague-Dawley rats. Metabolism, 2002. 51(8): p. 1061-4.
22. Trayhurn, P. and I.S. Wood, Signalling role of adipose tissue: adipokines and inflammation in obesity. Biochem Soc Trans, 2005. 33(Pt 5): p. 1078-81.
23. Oh, D.Y., et al., Increased macrophage migration into adipose tissue in obese mice. Diabetes, 2012. 61(2): p. 346-54.
24. Chinetti-Gbaguidi, G. and B. Staels, Macrophage polarization in metabolic disorders: functions and regulation. Curr Opin Lipidol, 2011. 22(5): p. 365-72.
25. Lumeng, C.N., J.L. Bodzin, and A.R. Saltiel, Obesity induces a phenotypic switch in adipose tissue macrophage polarization. J Clin Invest, 2007. 117(1): p. 175-84.
26. Lumeng, C.N., et al., Phenotypic switching of adipose tissue macrophages with obesity is generated by spatiotemporal differences in macrophage subtypes. Diabetes, 2008. 57(12): p. 3239-46.
27. Kamei, N., et al., Overexpression of monocyte chemoattractant protein-1 in adipose tissues causes macrophage recruitment and insulin resistance. J Biol Chem, 2006. 281(36): p. 26602-14.
28. Kanda, H., et al., MCP-1 contributes to macrophage infiltration into adipose tissue, insulin resistance, and hepatic steatosis in obesity. J Clin Invest, 2006. 116(6): p. 1494-505.
134

29. Baynard, T., et al., Exercise training effects on inflammatory gene expression in white adipose tissue of young mice. Mediators Inflamm, 2012. 2012: p. 767953.
30. Kawanishi, N., et al., Exercise attenuates M1 macrophages and CD8+ T cells in the adipose tissue of obese mice. Med Sci Sports Exerc, 2013. 45(9): p. 1684-93.
31. Oliveira, A.G., et al., Acute exercise induces a phenotypic switch in adipose tissue macrophage polarization in diet-induced obese rats. Obesity (Silver Spring), 2013. 21(12): p. 2545-56.
32. Kawanishi, N., et al., Exercise training inhibits inflammation in adipose tissue via both suppression of macrophage infiltration and acceleration of phenotypic switching from M1 to M2 macrophages in high-fat-diet-induced obese mice. Exerc Immunol Rev, 2010. 16: p. 105-18.
33. Linden, M.A., et al., Moderate exercise training provides modest protection against adipose tissue inflammatory gene expression in response to high-fat feeding. Physiol Rep, 2014. 2(7).
34. Pollitzer, E., Biology: Cell sex matters. Nature, 2013. 500(7460): p. 23-4.
35. Suto, J., et al., Genetic analysis of non-insulin-dependent diabetes mellitus in KK and KK-Ay mice. Eur J Endocrinol, 1998. 139(6): p. 654-61.
36. Livak, K.J. and T.D. Schmittgen, Analysis of relative gene expression data using real-time quantitative PCR and the 2(-Delta Delta C(T)) Method. Methods, 2001. 25(4): p. 402-8.
37. Yang, S.J., et al., Inhibition of the chemokine (C-C motif) ligand 2/chemokine (C-C motif) receptor 2 pathway attenuates hyperglycaemia and inflammation in a mouse model of hepatic steatosis and lipoatrophy. Diabetologia, 2009. 52(5): p. 972-81.
38. Tordoff MG, B.A., Diet preference: Survey of calcium and sodium intake, blood pH and calcium level, and bone and body composition data in 40 inbred strains of mice. . 2014.
39. De Bono, J.P., et al., Novel quantitative phenotypes of exercise training in mouse models. Am J Physiol Regul Integr Comp Physiol, 2006. 290(4): p. R926-34.
40. Hoffman-Goetz, L., N. Pervaiz, and J. Guan, Voluntary exercise training in mice increases the expression of antioxidant enzymes and decreases the expression of TNF-alpha in intestinal lymphocytes. Brain Behav Immun, 2009. 23(4): p. 498-506.
41. Svenson, K.L., et al., Multiple trait measurements in 43 inbred mouse strains capture the phenotypic diversity characteristic of human populations. J Appl Physiol, 2007. 102(6): p. 2369-78.
42. Kizaki, T., et al., Voluntary exercise attenuates obesity-associated inflammation through ghrelin expressed in macrophages. Biochem Biophys Res Commun, 2011. 413(3): p. 454-9.
135

43. Kawanishi, N., et al., Exercise training attenuates hepatic inflammation, fibrosis and macrophage infiltration during diet induced-obesity in mice. Brain Behav Immun, 2012. 26(6): p. 931-41.
44. Astrup, A., Dietary fat is a major player in obesity--but not the only one. Obes Rev, 2002. 3(2): p. 57-8.
45. Willett, W.C., Dietary fat plays a major role in obesity: no. Obes Rev, 2002. 3(2): p. 59-68.
46. Willett, W.C. and R.L. Leibel, Dietary fat is not a major determinant of body fat. Am J Med, 2002. 113 Suppl 9B: p. 47S-59S.
47. Willett, W.C., Is dietary fat a major determinant of body fat? Am J Clin Nutr, 1998. 67(3 Suppl): p. 556S-562S.
48. Reed, D.R., A.A. Bachmanov, and M.G. Tordoff, Forty mouse strain survey of body composition. Physiol Behav, 2007. 91(5): p. 593-600.
49. Knuth, N.D., et al., Metabolic adaptation following massive weight loss is related to the degree of energy imbalance and changes in circulating leptin. Obesity (Silver Spring), 2014.
50. Rosenbaum, M., et al., Low-dose leptin reverses skeletal muscle, autonomic, and neuroendocrine adaptations to maintenance of reduced weight. J Clin Invest, 2005. 115(12): p. 3579-86.
51. Rosenbaum, M., et al., Effects of weight change on plasma leptin concentrations and energy expenditure. J Clin Endocrinol Metab, 1997. 82(11): p. 3647-54.
52. Vieira, V.J., et al., Effects of exercise and low-fat diet on adipose tissue inflammation and metabolic complications in obese mice. Am J Physiol Endocrinol Metab, 2009. 296(5): p. E1164-71.
53. Forouhi, N.G., et al., Elevated serum ferritin levels predict new-onset type 2 diabetes: results from the EPIC-Norfolk prospective study. Diabetologia, 2007. 50(5): p. 949-56.
54. Jiang, R., et al., Body iron stores in relation to risk of type 2 diabetes in apparently healthy women. Jama, 2004. 291(6): p. 711-7.
55. Facchini, F.S., Effect of phlebotomy on plasma glucose and insulin concentrations. Diabetes Care, 1998. 21(12): p. 2190.
56. Fernandez-Real, J.M., et al., Blood letting in high-ferritin type 2 diabetes: effects on insulin sensitivity and beta-cell function. Diabetes, 2002. 51(4): p. 1000-4.
57. Yuan R, K.R. Aging study: Blood chemistry for 32 inbred strains of mice. . 2014 [cited 2014 Dec. 02]; Available from: http://phenome.jax.org, Dec, 2013
136

58. McClure, S., E. Custer, and J.D. Bessman, Improved detection of early iron deficiency in nonanemic subjects. JAMA, 1985. 253(7): p. 1021-3.
59. Eichner, E.R., Runner's macrocytosis: a clue to footstrike hemolysis. Runner's anemia as a benefit versus runner's hemolysis as a detriment. Am J Med, 1985. 78(2): p. 321-5.
60. Goodyear, L.J. and B.B. Kahn, Exercise, glucose transport, and insulin sensitivity. Annu Rev Med, 1998. 49: p. 235-61.
61. Wojtaszewski, J.F., J.N. Nielsen, and E.A. Richter, Invited review: effect of acute exercise on insulin signaling and action in humans. J Appl Physiol (1985), 2002. 93(1): p. 384-92.
62. Duncan, G.E., et al., Exercise training, without weight loss, increases insulin sensitivity and postheparin plasma lipase activity in previously sedentary adults. Diabetes Care, 2003. 26(3): p. 557-62.
63. Gumbs, A.A., I.M. Modlin, and G.H. Ballantyne, Changes in insulin resistance following bariatric surgery: role of caloric restriction and weight loss. Obes Surg, 2005. 15(4): p. 462-73.
64. Schenk, S., et al., Improved insulin sensitivity after weight loss and exercise training is mediated by a reduction in plasma fatty acid mobilization, not enhanced oxidative capacity. J Physiol, 2009. 587(Pt 20): p. 4949-61.
65. van Greevenbroek, M.M., C.G. Schalkwijk, and C.D. Stehouwer, Obesity-associated low-grade inflammation in type 2 diabetes mellitus: causes and consequences. Neth J Med, 2013. 71(4): p. 174-87.
66. Weisberg, S.P., et al., Obesity is associated with macrophage accumulation in adipose tissue. J Clin Invest, 2003. 112(12): p. 1796-808.
67. Ito, A., et al., Role of CC chemokine receptor 2 in bone marrow cells in the recruitment of macrophages into obese adipose tissue. J Biol Chem, 2008. 283(51): p. 35715-23.
68. Kawanishi, N., et al., Exercise training inhibits inflammation in adipose tissue via both suppression of macrophage infiltration and acceleration of phenotypic switching from M1 to M2 macrophages in high-fat-diet-induced obese mice. Exerc Immunol Rev. 16: p. 105-18.
69. Bastard, J.P., et al., Adipose tissue IL-6 content correlates with resistance to insulin activation of glucose uptake both in vivo and in vitro. J Clin Endocrinol Metab, 2002. 87(5): p. 2084-9.
70. Pickup, J.C., et al., NIDDM as a disease of the innate immune system: association of acute-phase reactants and interleukin-6 with metabolic syndrome X. Diabetologia, 1997. 40(11): p. 1286-92.
137

71. Carey, A.L., et al., Interleukin-6 and tumor necrosis factor-alpha are not increased in patients with Type 2 diabetes: evidence that plasma interleukin-6 is related to fat mass and not insulin responsiveness. Diabetologia, 2004. 47(6): p. 1029-37.
72. Gleeson, M., et al., The anti-inflammatory effects of exercise: mechanisms and implications for the prevention and treatment of disease. Nat Rev Immunol, 2011. 11(9): p. 607-15.
73. Bruun, J.M., et al., Diet and exercise reduce low-grade inflammation and macrophage infiltration in adipose tissue but not in skeletal muscle in severely obese subjects. Am J Physiol Endocrinol Metab, 2006. 290(5): p. E961-7.
74. Fisher, G., et al., Effect of diet with and without exercise training on markers of inflammation and fat distribution in overweight women. Obesity (Silver Spring), 2011. 19(6): p. 1131-6.
75. Lakhdar, N., et al., Diet and diet combined with chronic aerobic exercise decreases body fat mass and alters plasma and adipose tissue inflammatory markers in obese women. Inflammation, 2013. 36(6): p. 1239-47.
76. Ryan, A.S. and B.J. Nicklas, Reductions in plasma cytokine levels with weight loss improve insulin sensitivity in overweight and obese postmenopausal women. Diabetes Care, 2004. 27(7): p. 1699-705.
77. Timmerman, K.L., et al., Exercise training-induced lowering of inflammatory (CD14+CD16+) monocytes: a role in the anti-inflammatory influence of exercise? J Leukoc Biol, 2008. 84(5): p. 1271-8.
78. Spencer, M., et al., Adipose tissue macrophages in insulin-resistant subjects are associated with collagen VI and fibrosis and demonstrate alternative activation. Am J Physiol Endocrinol Metab. 299(6): p. E1016-27.
79. Ohman, M.K., et al., Visceral adipose tissue and atherosclerosis. Curr Vasc Pharmacol, 2009. 7(2): p. 169-79.
80. Ikeoka, D., J.K. Mader, and T.R. Pieber, Adipose tissue, inflammation and cardiovascular disease. Rev Assoc Med Bras. 56(1): p. 116-21.
81. Gustafson, B., Adipose tissue, inflammation and atherosclerosis. J Atheroscler Thromb. 17(4): p. 332-41.
82. Berg, A.H. and P.E. Scherer, Adipose tissue, inflammation, and cardiovascular disease. Circ Res, 2005. 96(9): p. 939-49.
138

Chapter 6
Overall Discussion
Iron dysregulation can lead to serious health concerns resulting from either too much or too little
iron storage or availability. The iron-regulating hormone, hepcidin, plays a primary role in iron
regulation and alterations in the hepcidin signaling pathway are typically responsible for cases of
iron dysregulation. For example, an absence of hepcidin promotes iron toxicity while elevated
hepcidin promotes iron deficiency anemia. Iron deficiency is prevalent in athletic populations,
especially among endurance-trained female athletes. Although recent studies suggest that a
transient increase in circulating hepcidin following acute exercise might promote iron deficiency
anemia in athletes, it is unclear whether there is an additive or cumulative effect of multiple acute
excursions of hepcidin in response to everyday training. On the opposite end of the iron
dysregulation spectrum, excess iron deposition (e.g. in adipose tissue) is a potential contributor to
the pathology of obesity-related metabolic complications. However, the mechanisms underlying
adipose tissue iron deposition and its influence on obesity-related metabolic consequences are still
unclear. Although exercise has been observed to promote improvements in insulin sensitivity, the
influence of exercise on iron regulation and adipose tissue inflammation in the setting of obesity
is still being explored. As a close association has been observed between iron dysregulation,
inflammation and diabetes, a better understanding of iron regulation could greatly improve the
prevention and treatment of iron disorders including iron deficiency and iron overload as well as
their subsequent complications (e.g. diabetes). Collectively, my dissertation was designed to
emphasize the importance of iron in both athletic performance and the increased diabetes risks, by
139

examining the possible cause of iron deficiency anemia in female athletes, observations of adipose
tissue iron overload in polygenic obese mouse model, and the incorporation of exercise in obese
and diabetic mouse model with high serum iron.
Inflammation, obesity and diabetes may all be influenced by the small peptide hormone hepcidin,
which is a critical factor in iron homeostasis. However, the relationships between these conditions
and hepcidin are still poorly understood. Iron is necessary for proper function of both the innate
and adaptive immune systems. Hence, iron deficiency will lead to a compromised inflammatory
response such as abnormal cell-mediated immunity and an impaired ability of neutrophils to kill
bacteria [1]. Therefore, since immune cells require iron for proper function, hepcidin may also
play an important role in exercise-induced inflammatory responses. PROJECT#1 measured both
circulating and monocyte gene expression of hepcidin in collegiate cross-country runners
undergoing high-intensity training to examine the iron deficiency and possible anemia of chronic
disease symptoms in this population. The roles of macrophage in iron recycling (iron uptake,
metabolism, storage and transport) and inflammation (both pro-inflammatory and anti-
inflammatory function) allowed us to extend my dissertation projects that focus on iron regulation
to obesity-associated adipose tissue inflammation. It is well acknowledged that obesity-associated
inflammation is characterized by increased levels of inflammatory mediators in plasma and in
adipose tissue (e.g. TNFα). Macrophage infiltration and activation in the adipose tissue has
provided a link between adipose tissue and inflammation. PROJECT#2, therefore, was to
investigate the relationship between adipose tissue inflammation, iron deposition and glucose
homeostasis. To further explore the relationship between adipose tissue inflammation and glucose
homeostasis in a high-iron milieu, we evaluated the impact of voluntary running in polygenic obese
140

animals with high serum iron levels. To this end, PROJECT#3 was designed to evaluate the
influence of exercise on iron homeostasis, adipose tissue inflammation, and glucose homeostasis.
Together the three projects of my dissertation enhanced our understanding of iron homeostasis in
the setting of health (ie. exercise training in healthy female athletes) and disease (using animal
models with elevated iron and obesity). Important findings from my dissertation studies include
1) the iron-regulating hormone, hepcidin, is not chronically elevated with sustained moderate to
high intensity endurance exercise training in competitive collegiate runners (PROJECT#1), which
is an important finding because this counters existing evidence which suggests hepcidin may
induce anemia in endurance trained athletes due to a sustained elevation in serum hepcidin after
each exercise session (PROJECT#1). 2) High level of iron in the epididymal adipose tissue is
associated with a robust adipose tissue remodeling, which was evidenced by elevated
inflammatory markers gene expression (e.g. Tnfα) and increased macrophages, collagen and cell
death (PROJECT#2). 3) Five weeks voluntary exercise in obese female mice with high serum iron
levels resulted in weight loss, improved glucose intolerance and significantly altered adipose tissue
inflammatory gene expression (PROJECT#3). 4) However, exercise did not alter the serum iron
level in polygenic obese mice and there was no association between adipose tissue iron deposition
and glucose homeostasis (PROJECT#2&3). In the discussion that follows, I will focus primarily
on the collective and integrative implications of these findings.
The causes of exercise-induced iron-deficiency anemia in athletes are still under debate. Physicians
currently assist athletes with recovery from exercise-induced anemia by providing iron
supplementation and educating athletes about optimizing iron absorption. However, it is essential
141

that we improve our understanding of the mechanisms of exercise-induced anemia in order to
improve our treatment of, and ultimately prevent, this condition. Evidence of elevated hepcidin at
around 3 hours following moderate to high intensity exercise is well documented. The possible
mechanism that has been typically provided is an increase in the inflammatory cytokine IL-6
following the acute exercise. Non-exercise studies have demonstrated that IL-6 (both 1ng/ml and
20ng/ml) stimulation can up-regulate hepcidin production from the hepatic cells via the signal
transducer and activator of transcription 3 (STAT3) signaling pathway (Figure 6-1) [2, 3].
Furthermore, acute exercise studies have demonstrated an increase in circulating IL-6 (from
~0.5pg/ml at resting to ~2pg/ml after exercise), which might be responsible for the transient
hepcidin elevation at around 3-hour post-exercise [4]. However, it is not yet established whether
the increased concentration of IL6 is necessary to induce the hepcidin elevation following exercise.
Most importantly, the question of an additive or cumulative effect of multiple acute excursions of
hepcidin in response to everyday training on elevating resting levels of hepcidin is still unclear.
The main finding of PROJECT#1 was that highly trained female athletes did not have significantly
higher resting hepcidin levels compared with control subjects, suggesting that there is no
cumulative effect of chronic, daily endurance training on plasma hepcidin concentration. Overall,
the results from our study did not suggest an anemia-like phenotype resulting from the rigors of
collegiate distance running in female athletes. Our finding in PROJECT#1 is significant because
we want to provide physicians with the most accurate information regarding exercise-induced
anemia. The main message from our current result is that hepcidin does not appear to be the anemia
cure-all for athletes that the scientific community had hoped.
142

Figure 6-1 The role of hepcidin in exercise and obesity/type 2 diabetes.
143

On the opposite end of the iron dysregulation spectrum, excess iron storage is a potential
contributor to the pathology of obesity-related metabolic complications. The role of major
iron regulating hormone, hepcidin, has been explored beyond the realm of iron homeostasis and
has been expanded to both immunology and diabetes. During chronic inflammation, which is
hypothesized to exist at low levels in obese subjects, hepcidin expression may result in
hypoferremia due to decreased duodenal iron absorption and increased iron sequestration by
macrophages (Figure 6-1). This process with adequate time and intensity can result in anemia of
inflammation [8]. As mentioned, hepcidin can be up-regulated by the inflammatory cytokine, IL-
6, which some studies have suggested is involved in the development of obesity and insulin
resistance [9-12]. IL-6 expression correlates with hepcidin expression in human adipose tissue,
and direct IL-6 incubation of adipose tissue explants induces hepcidin expression [13]. In
PROJECT#2, we found that the deposition of iron in a subset of the male KK/HIJ mice was specific
to the eAT adipose tissue depot and not evident in subcutaneous or brown adipose tissue depots.
This increased iron was associated with the increased HAMP trend in the HI group. A robust
adipose tissue remodeling was also accompanied with the high iron deposition, which was
evidenced by the increased macrophages, collagen, cell death and markedly up-regulated
inflammatory gene expression (e.g. Tnfα). Despite the robust local remodeling in the eAT of the
HI mice, there was no evidence of changes in glucose homeostasis or circulating adipokines. Our
findings provided a new depth of insight into the specifically high iron eipididymal adipose tissue.
KK male mouse model has a great potential in future studies to evaluate the mechanism of iron
accumulation in the epididymal adipose tissue. We hope that our findings provide a starting point
for many researchers to explore and identify novel roles of iron for adipose tissue function that can
expand our knowledge and provide solution to obesity and diabetes. The important role of exercise
144

in health also drives us to examine how exercise influences obesity-related adipose tissue
inflammation. Although exercise has been observed to promote improvements in many obesity-
associated conditions (e.g. dyslipidemia, glucose tolerance, etc.), the influence of exercise on
adipose tissue inflammation and iron regulation in the setting of obesity is still being explored. To
further our knowledge on iron dysregulation, inflammation and diabetes from PROJECT#2,
PROJECT#3 was designed to investigate the effects of voluntary exercise on adipose tissue
inflammation in a polygenic obese female KK/HIJ mouse model with high serum iron
concentration. We observed that a short-term voluntary exercise intervention improved glucose
tolerance and decreased body weight despite increased food consumption in this mouse model.
This result was consistent, though considerably more robust, with the exercise response observed
in several published studies of high fat diet-induced obese male mice [14-16]. Gene expression
data also indicated a decrease of the inflammatory signal in the adipose tissue. Consistent with the
gene expression data, our limited adipose tissue macrophage flow cytometry data showed smaller
ATMs and M1 population in the EX compared with CON (Appendix 1). However, there was no
significant alteration of serum iron or evidence of ineffective erythropoiesis. Overall, the observed
improvement in glucose tolerance was coincident with a decreased expression of adipose tissue
derived inflammatory factors but occurred in the absence of systemic alterations in iron
homeostasis. Although exercise did not alter the serum iron level in polygenic obese mice and
there was no association between adipose tissue iron deposition and glucose homeostasis
(PROJECT#2&3), both projects provided novel insight of iron in adipose tissue inflammation and
glucose homeostasis. We hope this will inspire more researchers to explore this field and further
study the dynamic roles of iron and adipose tissue. In addition, KK mouse model represents an
145

interesting anomaly, which may benefit translational research to understand current human clinical
conditions.
The relationships among exercise, hepcidin and obesity are intriguing. Contrary to what recent
studies have proposed [4, 17, 18], an accumulative effect of hepcidin with long-term, high-
intensity training in female distance runners was not observed. However, the role of hepcidin in
exercise-induced anemia should be further evaluated. What remains to be documented is whether
the observed transient elevations in hepcidin are adequate to induce iron deficiency in athletes.
This is especially controversial because as iron stores fall, even the transient rise in hepcidin
following exercise is suppressed. However, as obesity and diabetes are associated with elevations
in iron stores, the documented exercise-induced rise in hepcidin might provide a therapeutic
reduction in iron bioavailability in this clinical population if it reduces duodenal iron absorption.
Although we did not observe this in our voluntary wheel studies in mice, this is still an important
and testable hypothesis in adults with obesity and iron excess. In addition, as insulin likely plays
an important and direct role in iron regulation, exercise might also influence iron homeostasis
through hepcidin-independent effects mediated by transient improvements in insulin sensitivity
[19]. Moreover, the interactions of insulin sensitivity and iron homeostasis may reveal an
important therapeutic role for exercise in patients where iron excess is promoted by insulin
resistance. Therefore, our results provide a reference for future studies investigating the acute and
chronic effects of exercise on iron regulation and insulin sensitivity.
In summary, my dissertation projects provided steps forward in our understanding of the role of
iron regulation in the setting of a mouse model of disease as well as highly trained elite athletes at
146

high risk of iron deficiency anemia. My dissertation answered, “Whether there is a cumulative or
additive effect of long-term high intensity training on serum hepcidin levels”, which is important
for cooling down the controversy regarding “if hepcidin is the reason why athletes have iron
deficiency anemia”. The study of elevated epididymal adipose tissue iron deposition in KK male
mice, should further our understanding of iron deposition and metabolic alterations. My
dissertation also utilized a unique mouse model to answer “how does short-term exercise
intervention influence glucose tolerance, adipose tissue inflammation and iron regulation.”
Together, these studies were designed to call attention to the importance of iron regulation in health
and disease and expand our knowledge in the areas of 1) hepcidin in athletes at risk for iron
deficiency; 2) adipose tissue iron deposition; and 3) exercise and adipose tissue inflammation in
the setting of high iron availability and obesity.
147

References:
1. Dallman, P.R., Iron deficiency and the immune response. Am J Clin Nutr, 1987. 46(2): p. 329-34.
2. Verga Falzacappa, M.V., et al., STAT3 mediates hepatic hepcidin expression and its inflammatory stimulation. Blood, 2007. 109(1): p. 353-8.
3. Wrighting, D.M. and N.C. Andrews, Interleukin-6 induces hepcidin expression through STAT3. Blood, 2006. 108(9): p. 3204-9.
4. Peeling, P., et al., Effects of exercise on hepcidin response and iron metabolism during recovery. Int J Sport Nutr Exerc Metab, 2009. 19(6): p. 583-97.
5. Karl, J.P., et al., Randomized, double-blind, placebo-controlled trial of an iron-fortified food product in female soldiers during military training: relations between iron status, serum hepcidin, and inflammation. The American journal of clinical nutrition, 2010. 92(1): p. 93-100.
6. Auersperger, I., et al., The effects of 8 weeks of endurance running on hepcidin concentrations, inflammatory parameters, and iron status in female runners. International journal of sport nutrition and exercise metabolism, 2012. 22(1): p. 55-63.
7. Theurl, I., et al., Autocrine formation of hepcidin induces iron retention in human monocytes. Blood, 2008. 111(4): p. 2392-9.
8. Ganz, T., Hepcidin and iron regulation, 10 years later. Blood, 2011. 117(17): p. 4425-33.
9. Lehrke, M., et al., Serum concentrations of cortisol, interleukin 6, leptin and adiponectin predict stress induced insulin resistance in acute inflammatory reactions. Crit Care, 2008. 12(6): p. R157.
10. McLaughlin, T., et al., Insulin resistance is associated with a modest increase in inflammation in subcutaneous adipose tissue of moderately obese women. Diabetologia, 2008. 51(12): p. 2303-8.
11. Ganz, T., Hepcidin, a key regulator of iron metabolism and mediator of anemia of inflammation. Blood, 2003. 102(3): p. 783-8.
12. Nemeth, E., et al., IL-6 mediates hypoferremia of inflammation by inducing the synthesis of the iron regulatory hormone hepcidin. J Clin Invest, 2004. 113(9): p. 1271-6.
13. Bekri, S., et al., Increased adipose tissue expression of hepcidin in severe obesity is independent from diabetes and NASH. Gastroenterology, 2006. 131(3): p. 788-96.
14. Baynard, T., et al., Exercise training effects on inflammatory gene expression in white adipose tissue of young mice. Mediators Inflamm, 2012. 2012: p. 767953.
148

15. Bradley, R.L., et al., Voluntary exercise improves insulin sensitivity and adipose tissue inflammation in diet-induced obese mice. Am J Physiol Endocrinol Metab, 2008. 295(3): p. E586-94.
16. Linden, M.A., et al., Moderate exercise training provides modest protection against adipose tissue inflammatory gene expression in response to high-fat feeding. Physiol Rep, 2014. 2(7).
17. Peeling, P., Exercise as a mediator of hepcidin activity in athletes. Eur J Appl Physiol, 2010. 110(5): p. 877-83.
18. Peeling, P., et al., Training surface and intensity: inflammation, hemolysis, and hepcidin expression. Med Sci Sports Exerc, 2009. 41(5): p. 1138-45.
19. Wojtaszewski, J.F., J.N. Nielsen, and E.A. Richter, Invited review: effect of acute exercise on insulin signaling and action in humans. J Appl Physiol (1985), 2002. 93(1): p. 384-92.
149

APPENDICES
150

APPENDIX 1
Additional Analysis for PROJECT #3 (Chapter 5)
Flow cytometry analysis examining adipose tissue macrophage change in KK female mice
following short-term exercise intervention
In my dissertation proposal, I indicated that I would analyze the adipose tissue inflammation using
flow cytometry in addition to adipose tissue gene expression data. In Chapter 5 of my dissertation,
I have provided the manuscript from this study which we submitted for publication. Since the flow
cytometry data were obtained from only four adipose tissue samples (2 for EX and 2 CON), the
reviewers asked us to take out this part of the data because of the small sample size. Therefore, the
flow cytometry method and data I proposed were not included in Chapter 5 of my dissertation. I
have included this part of the data here.
Methods
Flow Cytometry
Mice were euthanized via exsanguination under sodium pentobarbital anesthesia. Adipose tissue
was promptly perfused with ice cold PBS and harvested. Tissue was then minced and digested by
collagenase (Sigma, St. Louis, MO), stromal vascular cells (SVC) were isolated by using the
method previously described [1, 2]. The SVC was counted and 1x10⁶ cells were used for antibody
staining. The SVCs were labeled with primary fluorophore conjugated antibodies: F4/80-
phycoerythrin (F4/80-PE), CD11b-Allophycocyanin Cy7 (APC/Cy7), CD11c-PE Cy7, and
151

CD301-APC (eBiosciences) following the manufacturer’s instruction. Cells were analyzed on a
FACSCanto II Flow Cytometer (BD Biosciences), data were analyzed using FlowJo 10.0.6
software (Treestar, Ashland, OR).
Results
Effect of Voluntary Exercise on Adipose Tissue Inflammation and Adipose Tissue
Macrophage Subsets
In order to characterize the effect of voluntary exercise on adipose tissue inflammation, flow
cytometry was used to analyze the macrophage subset numbers post exercise intervention in a
subset of the mice (n=2 per group). The adipose tissue macrophages (ATMs) were determined as
F4/80+CD11b+ cells, M1 population as F4/80+CD11b+CD11c+CD301- cells and M2 population as
F4/80+CD11b+CD11c-CD301+ cells (Figure A1-1). The quantitation of ATM (among the total cell
population), M1 (among the total ATMs) and M2 (among the total ATMs) is expressed as the
frequency of each cell population as well as the actual concentrations in gonadal fat (cell numbers
per gram of fat). Although no significant difference was observed between CON and EX in these
parameters, M2% tended to be increased in EX group (Table A1-1). The individual mouse data
are shown in Table A1-1.
Discussion:
An initial goal of this study was to evaluate the change in adipose tissue macrophages (ATM)
between EX and CON at the end of intervention using flow cytometric studies. Although we
digested the adipose and prepared and analyzed samples for all the mice in this cohort, we were
unable to attain successful staining and sorting from the large cohort that we examined. We did
152
manage usable data from our first (small) cohort which included 2 mice each from the EX and
CON groups and we provide that evidence here.
There are a considerable number of studies that have evaluated whole adipose tissue gene
expression changes in response to exercise [3-7], however specific studies of adipose tissue
macrophages have not been performed. For example, Kawanishi et al. proposed that exercise
decreases adipose tissue inflammation by modulating the macrophage subsets. These conclusions
were drawn from adipose tissue gene expression, however data from isolated macrophage were
not included. Indeed, they determined that 16 weeks of exercise training resulted in suppressed
adipose tissue gene expression of traditional pro-inflammatory M1-type markers, such as TNFα,
F4/80 and CD11c, independent of weight loss. In addition, based on their adipose tissue gene
expression studies, the authors speculated that exercise training in the setting of obesity might
induce phenotypic switching from the classically activated M1 macrophage to the alternatively
activated M2 macrophage [3, 5]. However, these studies were performed without analyzing a
single macrophage and therefore cannot provide definitive answers regarding the role of exercise
on macrophage polarization without directly determining the macrophage cell surface markers
via flow cytometry or other direct techniques.
The gene expression data presented in Chapter 5 provided evidence that the pro-inflammatory
markers of ATMs were down-regulated. Consistent with our gene expression data and others’
studies (discussed in chapter 5), the flow cytometry data suggested a smaller total ATMs
population and less M1%. However, the down-regulated anti-inflammatory ATM gene
expression was not consistent with the flow cytometry data, where the M2% was slightly higher
in EX compared with CON after the 5 weeks intervention. A possible explanation for this result
153

is that the lowered total ATMs population might lead to a decrease in the total population of M2
macrophage in the EX adipose tissue, which in turn contributes to the lowered adipose tissue
gene expression. Therefore, the result from the flow cytometry, which is examining the number
of M2 macrophage relative to the total number of macrophage is likely to reveal a different result
than the gene expression data gathered from total RNA of the adipose tissue. Based on limited
histological analyses, it was noted that there were very few crown like structures evident in the
KK gonadal adipose, which further supports that macrophage infiltration may be limited in this
animal model.
We speculate based on our limited flow cytometry data that the number of macrophages in the
KK gonadal fat is limited and that the robust changes in adipose tissue mass and lower adipose
tissue inflammation in the EX mice likely associated with less pro-inflammatory macrophages.
As a result, flow cytometric analyses of isolated macrophage would be predicted to suggest a
higher % of M2 macrophage (if the M1 population drops considerably). This observation has led
to suggestions of macrophage phenotype "switching", but instead may simply relate to the cells
that remain following adipose tissue remodeling following significant fat loss. Exercise studies
designed to track the fate of adipose tissue macrophages will allow a better understanding of the
temporal sequence of changes in macrophage polarization associated with exercise, adipose
tissue remodeling and adipose tissue inflammation.
154

Table A1-1 Quantification of FACS analysis
The data include percentage of ATMs in alive cell, percentage of M1 and M2 in ATMs, and the cell numbers per gram of fat.
ATM
(% of
alive cells)
M1
(%F4/80+
Cd11b+)
M2
(%F4/80+
Cd11b+)
ATM
(x10^5 per
gram of
fat)
M1
(x10^4 per
gram of
fat)
M2
(x10^4 per
gram of
fat)
Total
Gonadal
Fat
Weight
C1 29.7 21.9 28.6 1.92 4.21 5.49 4.13
C2 37.4 31.1 25.9 4.97 15.53 12.89 4.59
E1 22.1 15.7 45.1 2.69 4.23 12.13 1.88
E2 29.2 29.8 34.3 6.32 18.82 21.63 1.68
155

Figure A1-1 Gating strategy for adipose tissue macrophages and macrophage subsetsAdipose tissue macrophages (ATMs) with positive F4/80 and CD11b staining were gated in the left panel for both CON and EX group. Among the ATMs, CD11c+CD301- cells were gated as M1 and CD301+CD11c- cells were gated as M2 macrophages in the right panel.
156

References: 1. Lumeng, C.N., J.L. Bodzin, and A.R. Saltiel, Obesity induces a phenotypic switch in
adipose tissue macrophage polarization. J Clin Invest, 2007. 117(1): p. 175-84.
2. Orr, J.S., A.J. Kennedy, and A.H. Hasty, Isolation of adipose tissue immune cells. J Vis Exp, 2013(75): p. e50707.
3. Kawanishi, N., et al., Exercise training inhibits inflammation in adipose tissue via both suppression of macrophage infiltration and acceleration of phenotypic switching from M1 to M2 macrophages in high-fat-diet-induced obese mice. Exerc Immunol Rev, 2010. 16: p. 105-18.
4. Kizaki, T., et al., Voluntary exercise attenuates obesity-associated inflammation through ghrelin expressed in macrophages. Biochem Biophys Res Commun, 2011. 413(3): p. 454-9.
5. Kawanishi, N., et al., Exercise training attenuates hepatic inflammation, fibrosis and macrophage infiltration during diet induced-obesity in mice. Brain Behav Immun, 2012. 26(6): p. 931-41.
6. Bradley, R.L., et al., Voluntary exercise improves insulin sensitivity and adipose tissue inflammation in diet-induced obese mice. Am J Physiol Endocrinol Metab, 2008. 295(3): p. E586-94.
7. Kizaki, T., et al., Voluntary exercise attenuates obesity-associated inflammation through ghrelin expressed in macrophages. Biochem Biophys Res Commun. 413(3): p. 454-9.
157

APPENDIX 2
Iron Regulation in Exercise Questionnaire-For Control Subjects
The following questionnaire contains questions regarding lifestyle, supplementation, and
exercise. Please answer each to the best of your ability.
Age:
Gender:
Subject ID:
1. Please describe your exercise trends:
Classify intensity as:
-light- heart rate is slightly elevated but you can talk normally
-moderate- you're working hard enough to raise your heart rate and break a sweat, but
you are able to talk in short sentences
-vigorous- your breathing is hard and fast, your heart rate has increased and you can’t say
more than a few words without pausing for a breath
Mode of exercise Minutes per week Intensity
2. Do you take a multivitamin? yes no
158

If yes, how frequently?
What is the name of the vitamin? __________________
Does it contain iron? yes no
3. Have you ever been diagnosed with iron deficiency anemia? yes no
If you answered “No” to the question above, do you believe yes no
that you have ever been iron-deficient?”
4. Have you ever taken iron supplements? yes no
5. Do you currently take iron supplements? yes no
If yes, what form of iron supplement do you take? (circle one below)
regular tablets liquid or drops
coated or extended release tablets and capsules
If yes, what type of iron supplement do you take? (circle one)
ferrous sulfate ferrous fumarate ferrous gluconate
159

If yes, how often do you take the supplements per week?
At what time (or times) of day do you usually take
your iron supplement? (morning, before bed, etc) _________________
6. Do you take calcium supplements? yes no
7. Do you take calcium supplements at the same time yes no
as iron supplements?
8. Do you take oral contraceptives? yes no
How long have you taken oral contraceptives? ____________
What is the brand of the oral contraceptive? ____________
9. Do you have a regular monthly menstrual cycle? yes no
10. What was the date of your last menstrual period? _____________
11. How long is your cycle on average? ______________
160

12. How frequently do you take anti-oxidative supplements or anti-inflammatory
medication? (e.g. Aleve, tylenol, NSAIDs, etc.) -
_____________
13. Please list any other medications you are taking.
14. Approximately how many times per week do you eat red meat? _____________
15. Do you consciously think about including iron rich foods in your diet? yes no
16. Have you ever lived at high altitude for an extended period of time? yes no
If yes, at what elevation and for how long? _______________________
161

APPENDIX 3
Iron Regulation in Exercise Questionnaire-For Exercise subjects
The following questionnaire contains questions regarding lifestyle, supplementation, and
exercise. Please answer each to the best of your ability.
Age:
Gender:
Subject ID:
1. How many miles per week do you run?
2. How many days per week do you run?
3. Do you take a multivitamin? yes no
How frequently?
What is the name of the vitamin? __________________
Does it contain iron? yes no
162

4. Have you ever been diagnosed with iron deficiency anemia? yes no
If you answered “No” to the question above, do you believe yes no
that you have ever been iron-deficient?
5. Have you ever taken iron supplements? yes no
6. Do you currently take iron supplements? yes no
If yes, what form of iron supplement do you take? (circle one below)
Regular tablets liquid or drops
coated or extended release tablets and capsules
If yes, what type of iron supplement do you take? (circle one)
Ferrous sulfate ferrous fumarate ferrous gluconate
How often do you take the supplements per week?
At what time (or times) of day do you usually take your iron supplement? (morning,
before bed, etc) _____________
7. Do you take calcium supplements? yes no
163

8. Do you take calcium supplements at the same time yes no
as iron supplements?
9. Do you take oral contraceptives? yes no
If yes, how long have you taken oral contraceptives? _____________
What is the brand of the oral contraceptive? _____________
10. Do you have a regular monthly menstrual cycle? yes no
11. What was the date of your last menstrual period? _____________
12. How long is your cycle on average? ______________
13. How frequently do you take anti-oxidative supplements or anti-inflammatory
medication? (e.g. Aleve, tylenol, NSAIDs, etc.) ______________
14. Please list any other medications you are taking.
15. Approximately how many times per week do you eat red meat? _____________
16. Do you consciously think about including iron rich foods in your diet? yes no
164

17. Have you ever lived at high altitude for an extended period of time? yes no
If yes, at what elevation and for how long? ________________
165

APPENDIX 4
Pre-Screening Survey - Exercise and Iron Regulation
Subject ID: __________________________ Date: __________ Time:_____ 1. Do you currently have any type of infection?
If so, when was the onset of this infection? 2. What day was your most recent iron supplementation? 3. When was your most recent use of anti-inflammatory medications? 4. When was your most recent use of cold remedies (if applicable)? 5. When was your last bout of exercise?
What was the duration and intensity of this exercise? 6. How would you like your results returned to you?
mail email Email address_________________________ Campus mailing address_______________________________________ For research team only:
166

Height
Weight
BMI
167

APPENDIX 5
Monocytes isolation protocol
Preparation: 6ml human blood; 6ml histopaque; 15-ml conical centrifuge tubes (three for each
sample), isotonic phosphate buffered saline; centrifuge. For each human blood sample, we need
two 15-ml conical centrifuge tubes of 3ml histopaque plus 3ml whole blood.
• Check the centrifuge in CCRB1208 at first, make sure it is available and set the
temperature at 25ºC.
• Set up three 15 ml conical centrifuge tubes and one 2ml microcentrifuge tube
• Add 3.0ml Histopaque-1077(Sigma-Aldrich, St. Louis, MO) in two 15 ml conical
centrifuge tubes. It is important to warm it up to room temperature.
• Then, carefully layer 3.0ml whole blood onto the histopaque.
o Incline the conical centrifuge tube slightly, pipette 1000ml human blood slowly
and allow the blood stay on top of the histopaque, repeat three times. Totally, 3ml
histopaque and 3ml human blood.
• After laying blood, centrifuge at 400×g (set centrifuge in CCRB1208 at1500rpm) for
exactly 30 minutes at room temperature. The reason is that centrifugation at a lower
temperature, such as 4ºC, may result in cell clumping and poor recovery.
• After centrifugation, there would be four layers from top to the bottom of the tube:
plasma, monocytes, histopaque and red blood cells.
168
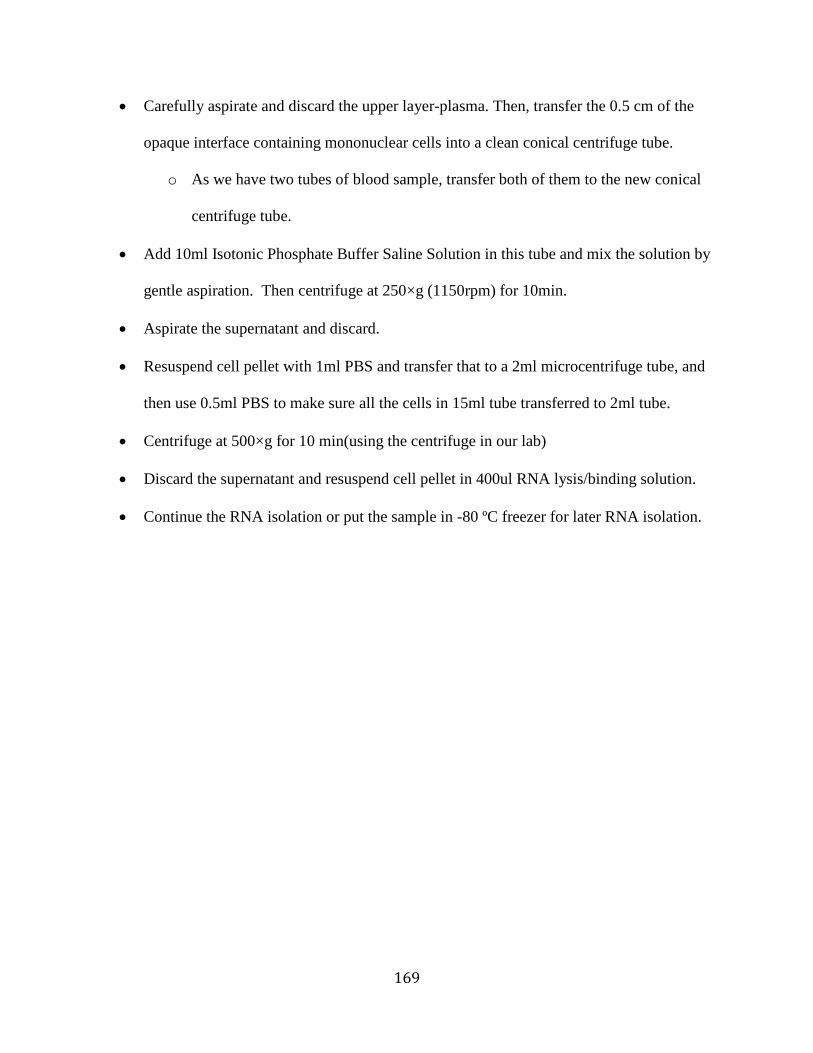
• Carefully aspirate and discard the upper layer-plasma. Then, transfer the 0.5 cm of the
opaque interface containing mononuclear cells into a clean conical centrifuge tube.
o As we have two tubes of blood sample, transfer both of them to the new conical
centrifuge tube.
• Add 10ml Isotonic Phosphate Buffer Saline Solution in this tube and mix the solution by
gentle aspiration. Then centrifuge at 250×g (1150rpm) for 10min.
• Aspirate the supernatant and discard.
• Resuspend cell pellet with 1ml PBS and transfer that to a 2ml microcentrifuge tube, and
then use 0.5ml PBS to make sure all the cells in 15ml tube transferred to 2ml tube.
• Centrifuge at 500×g for 10 min(using the centrifuge in our lab)
• Discard the supernatant and resuspend cell pellet in 400ul RNA lysis/binding solution.
• Continue the RNA isolation or put the sample in -80 ºC freezer for later RNA isolation.
169
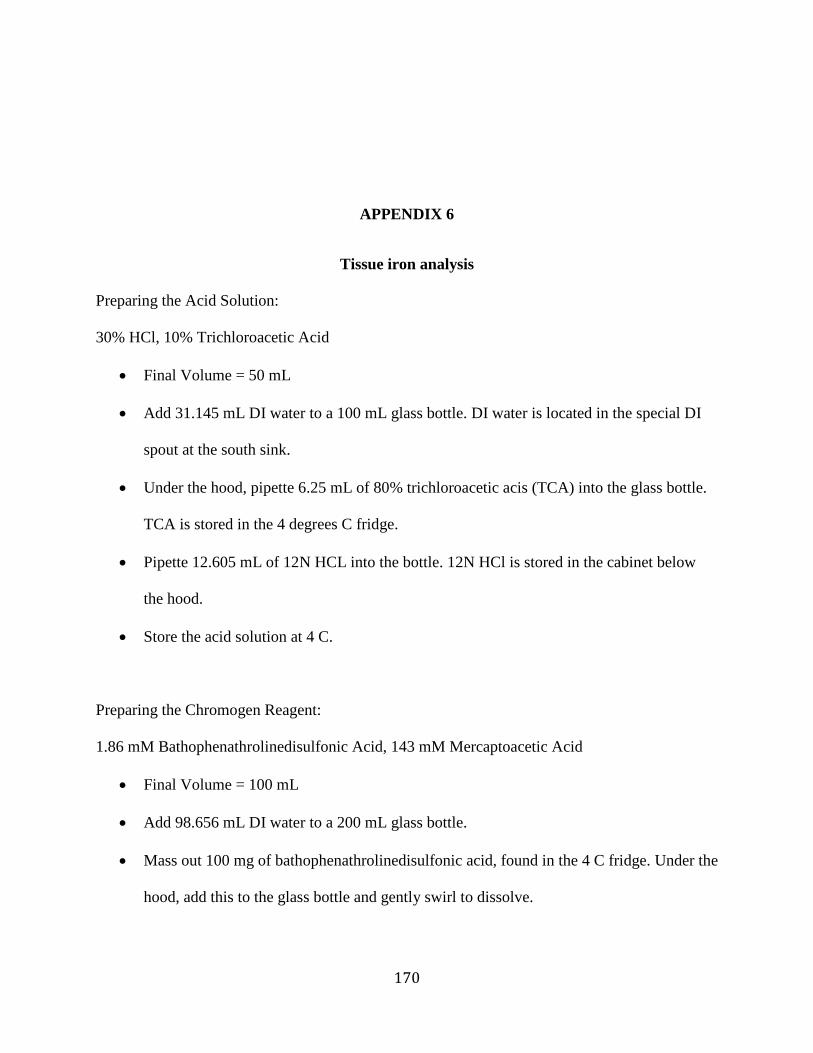
APPENDIX 6
Tissue iron analysis
Preparing the Acid Solution:
30% HCl, 10% Trichloroacetic Acid
• Final Volume = 50 mL
• Add 31.145 mL DI water to a 100 mL glass bottle. DI water is located in the special DI
spout at the south sink.
• Under the hood, pipette 6.25 mL of 80% trichloroacetic acis (TCA) into the glass bottle.
TCA is stored in the 4 degrees C fridge.
• Pipette 12.605 mL of 12N HCL into the bottle. 12N HCl is stored in the cabinet below
the hood.
• Store the acid solution at 4 C.
Preparing the Chromogen Reagent:
1.86 mM Bathophenathrolinedisulfonic Acid, 143 mM Mercaptoacetic Acid
• Final Volume = 100 mL
• Add 98.656 mL DI water to a 200 mL glass bottle.
• Mass out 100 mg of bathophenathrolinedisulfonic acid, found in the 4 C fridge. Under the
hood, add this to the glass bottle and gently swirl to dissolve.
170

• Pipette 1.343 mL of 98% mercaptoacetic acid into the bottle. This reagent is stored in the
fridge.
• Store chromogen reagent at 4 C.
Preparing the Working Chromogen Reagent:
1:5:5 Chromogen Reagent (1): Saturated Sodium Acetate (5): DI Water (5)
• Final Volume = 22 mL (Enough for a 96 well plate)
• Add 10 mL DI water to a 50 mL Falcon Tube.
• Add 10 mL saturated sodium acetate to this tube.
o To prepare 100 mL saturated sodium acetate, add 46.4g sodium acetate to 100 mL
DI water. Sodium Acetate is stored in the glad cabinet to the right of the hood.
Store the sat’d SA solution at 4 °C.
• Pipette 2 mL chromogen reagent into falcon tube.
• Store at 4 °C.
• NOTE: Prepare fresh working chromogen reagent for each assay. Don’t make excess
because it will go to waste
Procedure:
1. Cut a sample of tissue weighing between 25 to 30 mg and transfer to a 1.5 mL
microcentrifuge tube. Make sure to place sample at the very bottom of the tube.
171

2. Add 10x the sample weight in µL of the acid solution to each tube. For example: add 250
µL to a 25 mg sample and 275 µL to a 27.5 mg sample. Make sure the tissue is
completely submerged in liquid.
3. Incubate tubes for ~20 hours, or overnight, at 65 degrees Celsius (this corresponds to
setting “6” on the incubator).
4. Prepare 400 µL of a 1000 µg/dL iron standard by adding 4 µL of iron standard stock
(1000 ppm) to 396 µL DI water. Prepare remaining iron standards by performing 5 serial
dilutions from the 1000 µg/dL iron standard.
5. Pipette 20 µL of each standard and 20 µL DI water into the first column of a 96-well
plate.
6. Add 20 µL of your acid solution to another well in the plate.
7. Pipette 20 µL of the acidic solution from each of your now digested samples into the 96-
well plate. Try to pipette liquid from the middle of the tube and be sure not to disturb the
solid at the bottom of the tube.
8. Add 200 µl of fresh working chromogen reagent to each well. Let sit for 5-10 minutes.
9. Measure the absorbance of the wells prepared in steps 3-6, containing samples and
working chromogen reagent, in a spectrophotometer at a wavelength of 535, or at the
closest wavelength to 535 available. (562 also works well.)
Notes:
• When preparing the standard solutions, be sure to vortex each tube in between dilutions
to be sure they are evenly mixed.
172

• Prepare fresh standards often. All of them, but especially the ones containing the lowest
iron molarities, begin to exhibit lower absorbencies as time goes on, throwing off your
standard curve.
• Be sure to always add the sample into the well first, and THEN add chromogen reagent.
Otherwise they don’t mix right and the color is uneven, throwing off your results.
• You must prepare the HCl standard to be read. It has very visible iron content, and
majorly skews results if not taken into account. To get accurate absorbencies of the
samples, you simply subtract the HCl’s absorbance from the sample’s absorbance.
• Distilled water does not contain iron and therefore makes a suitable 0 standard.
• High standard values, such as 50 or 100, only fit into the standard curve when you use
less than 20 µL in the wells. (To make 50 fit, used 10 µL. For 100, use 5 µL.) This is
only necessary when some of your samples have extraordinarily high iron levels.
• Put the assay kit in the fridge at the end of every day.
• Be sure to record the weights of the samples before you place them into the test tube.
• Mincing the tissue doesn’t do anything or yield better results.
173