Adipose tissue-derived stem cells from obese subjects contribute to inflammation and reduced insulin...
45
Page 1 of 45 Diabetes Adipose tissue-derived stem cells from obese subjects contribute to inflammation and reduced insulin response in adipocytes through differential regulation of the Th1/Th17 balance and monocyte activation. Assia Eljaafari 1,2 , Maud Robert 1,3* , Marwa Chehimi 1*, Stephanie Chanon 1 , Christine Durand 1 , Guillaume Vial 1 , Nadia Bendridi 1 , Emmanuel Disse 1,2 , Martine Laville 1,2 , Jennifer Rieusset 1 , Etienne Lefai 1 , Hubert Vidal 1 and Luciano Pirola 1 1 CarMeN Laboratory, INSERM U1060; Lyon-1 University; INRA U1397; INSA-Lyon, Lyon, France. 2 Clinical Research Department, Hospices Civils de Lyon, Centre Hospitalier Lyon Sud, France. 3 Gastroenterology and Surgery Department, Edouard Herriot Hospital, Lyon, France. * MR and MC equally contributed to this work. Corresponding authors: Assia Eljaafari and Luciano Pirola INSERM Unit 1060, Centre Hospitalier Lyon Sud, Faculté de Médecine, 165 Ch. du Grand Revoyet - BP12, 69921 Oullins, France. Email: [email protected] and [email protected] Word count: Abstract : 208, Main text: 4159 (Introduction, Materials and methods, Results, Discussion) 8 figures, 3 supplementary figures and 2 supplementary tables Diabetes Publish Ahead of Print, published online March 12, 2015
-
Upload
independent -
Category
Documents
-
view
0 -
download
0
Transcript of Adipose tissue-derived stem cells from obese subjects contribute to inflammation and reduced insulin...
Page 1 of 45 Diabetes
Adipose tissue-derived stem cells from obese subjects contribute to inflammation and
reduced insulin response in adipocytes through differential regulation of the Th1/Th17
balance and monocyte activation.
Assia Eljaafari1,2
, Maud Robert1,3*
, Marwa Chehimi1*,
Stephanie Chanon1, Christine Durand
1,
Guillaume Vial1, Nadia Bendridi
1, Emmanuel Disse
1,2, Martine
Laville
1,2, Jennifer Rieusset
1,
Etienne Lefai1, Hubert Vidal
1 and Luciano Pirola
1
1 CarMeN Laboratory, INSERM U1060; Lyon-1 University; INRA U1397; INSA-Lyon,
Lyon, France.
2 Clinical Research Department, Hospices Civils de Lyon, Centre Hospitalier Lyon Sud,
France.
3 Gastroenterology and Surgery Department, Edouard Herriot Hospital, Lyon, France.
* MR and MC equally contributed to this work.
Corresponding authors:
Assia Eljaafari and Luciano Pirola
INSERM Unit 1060, Centre Hospitalier Lyon Sud, Faculté de Médecine,
165 Ch. du Grand Revoyet - BP12, 69921 Oullins, France.
Email: [email protected] and [email protected]
Word count: Abstract : 208,
Main text: 4159 (Introduction, Materials and methods, Results, Discussion)
8 figures, 3 supplementary figures and 2 supplementary tables
Diabetes Publish Ahead of Print, published online March 12, 2015
2
Abstract
Obesity, through low-grade inflammation, can drive insulin-resistance and type 2 diabetes.
While infiltration of adipose tissue (AT) with mononuclear cells (MNC) is well established in
obesity, the functional consequences of these interactions are less understood.
Herein, we co-cultured human adipose-derived-stem cells (ASC) from obese individuals with
MNC and analyzed their reciprocal behavior. Presence of ASC (i) enhanced IL-17A secretion
by Th17 cells, (ii) inhibited IFNγ and TNFα secretion by Th1 cells and (iii) increased
monocyte-mediated IL-1β secretion. IL-17A secretion also occurred in stromal-vascular
fractions issued from obese, but not lean individuals. Th17 polarization mostly depended on
physical contacts between ASC and MNC - with a contribution of ICAM-1 adhesion
molecules - and occurred through activation of the inflammasome and phosphoinositide-3-
kinase pathways. ASC favored STAT3 over STAT5 transcription factor binding on STAT
binding sites within the IL17A/F gene locus. Finally, conditioned media from activated ASC-
MNC co-cultures inhibited adipocyte differentiation mRNA markers, impaired insulin-
mediated Akt phosphorylation and lipolysis inhibition.
In conclusion, we report that obese- but not lean-derived ASC induce Th17 promotion and
monocyte activation. This pro-inflammatory environment, in turn, inhibits adipogenesis and
adipocyte insulin response. The demonstration of an ASC-Th17-monocyte cell axis reveals a
novel pro-inflammatory process taking place in adipose tissue during obesity, and defines
novel putative therapeutic targets.
Page 2 of 45Diabetes

3
Introduction
Obesity is defined as an excessive accumulation of adipose tissue, and its incidence is
increasing worldwide, reaching epidemic proportions. The correlation between obesity, type 2
diabetes and their complications has been clearly established (1). Obesity is associated with
low-grade chronic inflammation of adipose tissue (AT), due to the infiltration of multiple
immune cells, including monocytes, macrophages, natural killer cells and lymphocytes,
resulting in secretion of adipokines and pro-inflammatory cytokines by both adipocytes and
the population of infiltrating immune cells (2; 3). Strikingly, in obesity, immune cells are the
most represented cell types within AT, with macrophages accounting for up to 50% of the
total cells in the AT of obese rodents and humans (4). While monocytes and macrophages
have been clearly shown to contribute to the induction of a pro-inflammatory profile (5),
recent research has also implicated the Th17 cells in obesity-dependent inflammation (6; 7),
and Th17 cell enrichment has been observed in AT of obese subjects and obese type 2
diabetic patients (8; 9). Similarly, peripheral Th17 cells were significantly increased in a
cohort of obese women (10). IL-17A/F are cytokines playing a preponderant role in the
propagation of inflammation, due to the ubiquitous expression of their receptors IL-17RA/RC
(11). IL-17A also increases the secretion of other pro-inflammatory cytokines - including IL-
1β, IL-6 - and chemokines by multiple cell types including macrophages, monocytes, stromal
cells, adipocytes and stem cells. IL-17A may also directly inhibit adipogenesis (12), thus
impairing the lipid storage capacities of AT and therefore contributing to the establishment of
an insulin-resistant state. In spite of these advances, the mechanisms by which Th17 cells
infiltrate and reside within AT remain largely unexplored. Previously, we have demonstrated
that bone-marrow and synovium-derived mesenchymal stem cells (MSC) amplify IL-17A
production by increasing the frequency of Th17 cells, resulting in a vicious circle of pro-
inflammatory cytokine secretion that worsens joint chronic inflammation, such as in
Page 3 of 45 Diabetes

4
rheumatoid arthritis (13). Herein, we postulated that similar mechanisms could occur in
human AT, in which adipose stem cells would favor Th17 cell expansion. Indeed, adipose
stem cells (ASC) resemble MSC in their capacity to (i) differentiate into multiple tissue
lineages, (ii) secrete multiple cytokines, and (iii) display self-renewing capacities (14). To
address this question, we co-cultured ASC with blood mononuclear cells (MNC). We
observed that ASC induced a strong activation of both Th17 cells and monocytes, with
inhibition of Th1 cytokines, through pathways involving phosphoinositide-3-kinase (PI3K),
STAT3 and the inflammasome. Moreover, ASC differentially modulated STAT3 and STAT5
binding on the IL17A/F gene locus. ASC-MNC co-cultures generated pro-inflammatory
conditioned media (CM) that impaired mRNA differentiation markers of adipocytes, and
adipocyte responsiveness to insulin. In addition, IL-17A secretion also occurred in stromal-
vascular fractions (SVF) issued from obese, but not lean individuals. These data suggest that
ASC may contribute to the development of chronic low-grade inflammation in obese patients,
through polarization of infiltrating T cells towards the Th17 lineage, and facilitation of a pro-
inflammatory environment by monocytes, which may in turn prevent adipogenesis, and
decrease the insulin response of adipose cells.
Page 4 of 45Diabetes

5
Materials and methods
ASC isolation and differentiation. Visceral and subcutaneous AT was obtained from
residues of bariatric surgery, with the approval of the Person Protection Committee of the
”Hospices Civils de Lyon”, or from lean patients undergoing surgery, with their informed
consent. ASC were isolated from SVF, following a modified described protocol (15), in
which collagenase type-Ia (Sigma-Aldrich, St-Quentin-Fallavier, France) replaced Liberase.
ASC were selectively expanded in DMEM/Ham’s F12 cell culture medium (50/50 vol/vol)
(Invitrogen) containing 10% FCS, 4 ng/ml human β-FGF (e-Biosciences), 2 mmol/l L-
glutamine, 100 U/ml penicillin–streptomycin. ASC were differentiated using DMEM/Ham’s
F12 containing 10% FCS, 2 mmol/l L-glutamine, 100 U/ml penicillin–streptomycin, 1.8
µmol/l insulin, 0.5 mmol/l isobutylmethylxantine, 500 nmol/l dexamethasone, 1 µmol/l
rosiglitazone, 2 nmol/l triiodothyronine, 10 µg/ml transferrin (all from Sigma-Aldrich).
During differentiation, half of the culture medium was changed every 2-3 days. ASC
differentiation lasted 8-15 days. Differentiation was validated by oil-red-O visualization of
lipid droplets (supplementary figure 1A/C). ASC were identified by immunophenotypic
criteria based on expression of CD73, CD90, CD105; absence of expression of CD45, HLA-
DR and validation of their capacity to also differentiate into osteoblasts, when cultured in
osteoblasts-differentiating medium (StemPro® Osteogenesis Differentiation Kit, Life
technologies). Calcified bone matrix from osteoblasts was visualized by alizarin-red staining
(Supplementary figure 1D).
MNC isolation MNC were prepared by Ficoll-Hypaque (1.077 g/ml) density gradient
centrifugation as described (13). Blood samples were obtained through the Lyon Blood-Bank
Center (France), following institutionally approved guidelines. ASC and MNC were stored in
liquid nitrogen prior to use.
Page 5 of 45 Diabetes
6
Co-culture assays. Co-cultures were initiated by seeding ASC in 96-well plates. MNC were
co-seeded 18-24h later, for 24-48h, in the presence or absence of phytohemagglutinin (PHA,
5 µg/ml, Sigma-Aldrich), or anti-CD3/CD28 monoclonal antibodies (5 µg/ml, ImmunoTools,
Friesoythe, Germany). Neutralizing anti-IL-6-receptor antibodies (Tocilizimab, Chugaï
Pharma, France), anti-IL-1β monoclonal antibodies (R&D Systems, Minneapolis), caspase
inhibitor Z-YVAD-fluoromethylketone (Z-YVAD-fmk, MBL-International, Nanterre,
France), PI3K inhibitor wortmannin (Sigma-Aldrich); STAT3 Inhibitor-VI, S3I-201 (Santa
Cruz Biotechnology, sc-204304); or anti-ICAM-1 monoclonals (Beckman-Coulter, France)
were added to co-cultures as indicated in the figure legends. Caspase-1 activity was measured
using a Caspase-1 colorimetric assay kit (Biovision, Milpitas, CA) following manufacturer’s
instructions.
Flow cytometry procedures. MNC and ASC-MNC co-cultures were treated for the last 4h of
incubation with 3.6 µmol/l brefeldin-A (GolgiPlug™, Becton-Dickinson, Le-Pont-de-Claix,
France) and fixed/permeabilized with a Cytofix/Cytoperm™ Kit (Becton-Dickinson) prior to
incubation with FITC-conjugated anti-IL-17A (e-Biosciences), PE-conjugated anti-IFNγ and
APC-conjugated anti-CCR6 (Becton-Dickinson). 30 min incubation with fluorescently-
labeled antibodies were followed by several washes in PBS/2% FCS. Cells were analyzed on
a LSRII flow cytometer (Becton-Dickinson), image acquisition and data treatment used the
Becton-Dickinson FACSDiva™ Software.
Enzyme-linked immunosorbent assays (ELISA). IL-17A, IL-1β, IL-6, IFNγ and TNFα
concentrations were evaluated ELISA using the corresponding antibodies (e-Bioscience,
Paris, France).
RNA preparation, qPCR and chromatin immunoprecipitation (ChIP). RNA was isolated
with Tri-Isolation-ReagentTM (Roche, Meylan, France). cDNA synthesis was performed
Page 6 of 45Diabetes

7
using the PrimescriptTM
-RT kit (Takara, Dalian, Japan). qPCR was performed on a Rotor-
Gene Real-Time-PCR System, using ABsoluteTM
QPCR SYBRGreen Mix (ABgene, Illkirch,
France). Primer sequences are reported in supplementary table 1.
ChIP was performed on approximately 5-million MNC or MNC-ASC co-cultures as
described (16), with minor modifications. Cells were cross-linked with 1% (w/v)
formaldehyde in PBS for 10 min at room-temperature and quenched with 0.125 mol/l glycine
in PBS. Formaldehyde-fixed cells were harvested, homogenized in 1% SDS cell lysis buffer
and sonicated for 15 min at maximal power on a Diagenode Bioruptor®
bath sonicator (Liege,
Belgium). Prior to immunoprecipitation, DNA shearing was monitored by agarose gel.
Chromatin was immunoprecipitated with the indicated antibodies or processed as input
sample. Immune-complexes were recovered by incubation with Protein-A (for rabbit
antibodies) or G (for mouse antibodies) conjugated magnetic beads (Millipore Temecula,
Billerica, Mass, USA). DNA was recovered from immune-complexes and DNA quantified by
RT-qPCR. Primer sequences ChIP amplification on the IL17A/F genomic locus were
designed to match STAT binding regions previously identified in mice (25) (Supplementary
table 1). ChIP experiments were performed three times. ChIP recoveries are expressed as %
of input samples. Immunoprecipitations with negative control antibodies consistently yielded
negligible amplifications. The following antibodies were used: anti-STAT3, anti-STAT5
(Rabbit Monoclonal Antibodies, Cell Signalling Technology, CST, Beverly, MA). Polyclonal
rabbit anti-mouse immunoglobulins (DakoCytomation, Glostrup, Denmark) were used as
negative control.
Western blotting procedures. Proteins were separated by SDS-PAGE and transferred to
polyvinylidenedifluoride membranes. Primary antibodies were detected with peroxidase-
conjugated secondary antibodies and enhanced chemiluminescence. The following antibodies
Page 7 of 45 Diabetes

8
were used: anti-phospho-STAT3-Ser727 (Antibody #9134), anti-STAT3 (#9139); anti-
Phospho-Akt-Ser473 (#9271) anti-pan-Akt (#4691), all from CST.
Animal models. 4-week-old male C57BL/6JOlaHsd and Ob/Ob mice were from Harlan.
Mice were housed at 22°C on 12h light/dark cycle. Procedures were conducted in accordance
with institutional guidelines for the care of laboratory animals. After acclimatization,
C57BL/6JOlaHsd mice were divided into two groups: one fed a standard chow diet (SD;
Harlan), the other fed a high-fat high-sucrose diet (TD99249; Harlan) for 16 weeks. Ob/Ob
mice were fed a standard chow diet for 8-10 weeks prior to sacrifice. Animals’ body weights
and epididymal fat weights are presented in Supplementary table 2.
Statistical analyses. For pairwise comparisons, we applied the Student’s t-test statistics. For
multiple comparisons, we used one-way ANOVA followed by post-hoc Multiple Comparison
Tests as indicated in the figure legends. Differences were considered statistically significant
when p < 0.05.
Page 8 of 45Diabetes

9
Results
ASC from obese donors polarize T cells towards the Th17 inflammatory subset,
negatively modulate Th1 cell responses, and enhance IL-1ββββ and IL-6 secretion by MNC.
In previous reports, we have shown that stromal stem cells inhibit the Th1 response (17; 18)
while simultaneously promoting Th17 cells (13). We therefore analyzed the behavior of MNC
entering into contact with human ASC derived from visceral fat of obese donors in a co-
culture model. Graded concentrations of ASC were co-cultured with MNC. When MNC were
activated with PHA for 48 hours, an ASC-concentration-dependent increase of IL-17A
secretion was observed, reaching significant statistical differences, starting from the lowest
ASC:MNC ratio (1:100), as compared to PHA-activated MNC (Figure 1A). IL-1β secretion
was also increased in the presence of ASC, with the lowest ASC:MNC ratio eliciting a sub-
maximal response. IL-6 secretion was enhanced in the co-cultures, but independently from T
cell activation. ASC induced a dose-dependent decrease of PHA-mediated TNFα, and IFNγ
production showed a dual response, with high levels in the presence of the lowest
concentrations of ASC, but with an ASC-dose-dependent decrease (Figure 1A). Because this
dual response was presumptive of the presence of two sub-populations of IFNγ-secreting
cells, we next analyzed more in details the phenotype of the ASC-cocultured-T cells. As
shown in figure 1B, a 10-fold increase in Th17 cells expressing CCR6, was observed by flow
cytometry in the presence of PHA and ASC, at an ASC:MNC ratio of 1:5. CCR6 was
expressed by most Th17 cells, as previously reported (19). When IFNγ was analyzed, two
different T-cell subsets were observed, including an IFNγ-producing Th1 population, which
secreted IFNγ in response to PHA treatment (Figure 1C, panel II), which was gradually
repressed in the presence of ASC. The second population secreted both IL-17A and IFNγ,
with an ASC dose-dependent response curve (Figure 1C, panels III to V). These results
Page 9 of 45 Diabetes

10
suggest that ASC from obese individuals negatively modulate IFNγ secretion by Th1 cells,
while increasing IL-17A and IFNγ secretion by Th17 cells.
SVF from obese- but not lean-derived AT secrete IL-17A.
To investigate whether IL-17A secretion also occurs in a more physiologically relevant
setting, we evaluated the effects of PHA treatment on SVF from visceral AT derived from
obese versus lean donors. We observed increased IL-17A secretion in PHA-activated SVF
from obese but not lean AT (Figure 2A). Similarly, PHA-induced IL-17A secretion was
observed in SVF derived from Ob/Ob mice, but not wild type mice; and in AT explants from
high-fat high-sucrose fed, but not chow-fed, mice (Supplementary Figure 2). To define which,
from MNC or ASC lineages, plays a role in inducing IL-17A secretion, lean- versus obese-
derived ASC were co-cultured with MNC from lean donors (Figure 2B). Reciprocally, lean-
versus obese-derived MNC were co-cultured with ASC from lean donors (Figure 2C). IL-17A
secretion was induced by MNC from lean subjects interacting with ASC from obese but not
lean individuals (Figure 2B). However, IL-17A secretion was not induced when MNC from
obese donors were co-cultured with lean-derived ASC (Figure 2C). Thus, MNC polarization
towards the Th17 subset is specifically induced by ASC from obese donors.
Autologous or allogeneic ASC mediate IL-17A production by Th17 cells with similar
efficiency.
Cultured ASC are known to be negative for HLA-class II molecule expression (20), but
positive for HLA-class I. To investigate the possibility that an alloreactive response against
HLA-class I molecules could amplify ASC-mediated Th17 promotion, we co-cultured 3
independent MNC preparations with autologous or allogeneic ASC, and measured PHA-
mediated IL-17A secretion. IL-17A secretion was independent from the origin of ASC,
indicating that ASC induce Th17 promotion irrespective of HLA-class I expression (Figure
Page 10 of 45Diabetes
11
3A).
IL-17A production is triggered by the T cell receptor (TCR), while IL-1ββββ and IL-6
secretion depend on monocytes and ASC, respectively.
Because PHA is a non-specific mitogen, activating T cells and other mononuclear cells, we
next investigated whether specific stimulation of TCR would be sufficient to induce Th17
polarization in the presence of ASC. Incubation with CD3/CD28 activating antibodies was
used to mimic antigen-mediated TCR activation, and resulted in IL-17A secretion to a similar
extent than PHA, in the presence of ASC (Figure 3B). To evaluate the role of monocytes in
this model, we depleted them from MNC preparations, prior to co-culture assays. We
observed that, although not absolutely required, monocytes amplified IL-17A production
(Figure 3C). In contrast, IL-1β production almost completely depended on the presence of
monocytes (Figure 3D). This was not the case for IL-6 secretion, which mostly depended on
ASC (Figure 3E).
ASC-mediated IL-17A production is mostly cell contact-dependent.
ASC have been shown to inhibit Th1 cytokine production through secretion of soluble factors,
but also through cell contact-dependent mechanisms (21). To investigate this issue, we co-
cultured PHA-activated MNC with ASC on a transwell culture system, not allowing for cell-
cell contacts between MNC and ASC. In parallel, conditioned media collected from 48-hour
ASC cultures were added to PHA-activated MNC. ASC-MNC physical interaction played an
important role in IL-17A production, since physical separation of ASC and MNC strongly
inhibited IL-17A production (Figure 4A). However, soluble factors secreted by ASC are also
involved, albeit to a lesser extent, because even in transwells, a small but significant increase
in IL-17A secretion was observed (Figure 4A). Co-incubation with CM collected from ASC
cultures induced a significant increase in IL-17A secretion by PHA-activated MNC (Figure
Page 11 of 45 Diabetes

12
4B), albeit at a much lower level than in ASC-MNC co-cultures, indicating the need for
physical interaction between MNC and ASC for a full response. Accordingly, ICAM-1, an
adhesion molecule, might mediate the communication between mononuclear and stromal
cells, as the presence of inhibitory anti-CD54 (ICAM-1) monoclonal antibodies in co-culture
assays, reduced by 40% IL-17A secretion (Figure 4C).
The inflammasome, and IL-1β, but not IL-6, secretion are involved in ASC-mediated IL-
17A production.
To investigate the molecular mechanisms leading to IL-17A induction by ASC, we then
tested whether IL-1β and IL-6, which were increased in ASC-MNC co-cultures (Figure 1A),
could contribute to this positive regulation. With this aim, co-cultures of PHA-activated MNC
with ASC were performed in the presence of neutralizing antibodies directed against IL-1β or
IL-6 receptor (IL-6R). Results showed that anti-IL1β neutralizing antibodies significantly,
albeit not completely, inhibited IL-17A production, while anti-IL-6R had no significant effect
(Figures 5A and 5B, respectively). Because IL-1β secretion requires activation of the cysteine
protease caspase-1, a component of the inflammasome (22), we then evaluated the effects of
the caspase-1 peptide inhibitor Z-YVAD-fmk and found a drastic inhibition of IL-17A
production (Figure 5C), demonstrating the implication of the inflammasome in ASC-mediated
Th17 cell promotion. In support of these results, caspase-1 enzymatic activity was found to be
significantly increased in PHA-activated ASC-MNC co-cultures, as compared to unstimulated
ASC-MNC co-cultures or PHA-activated MNC (Figure 5D).
PI3K signalling and STAT3 are involved in ASC-mediated IL-17A production.
Phosphoinositide-3-kinases (PI3K) are central regulators of Th17 cell differentiation.
Inhibition of PI3Kδ and/or PI3Kγ – the two isoforms specifically found in immune cells – has
been shown to alleviate inflammatory and autoimmune diseases (23). Thus, we evaluated
Page 12 of 45Diabetes

13
whether PI3K could contribute to ASC-mediated IL-17A secretion. The PI3K inhibitor
wortmannin prevented IL-17A production and Akt-serine-473 phosphorylation in PHA-
activated ASC-MNC co-cultures (Figure 6A,B). As IL-17 gene transcription is dependent on
STAT3 (24), IL-17A secretion was measured after incubation with the STAT3 inhibitor,
STAT3-VI, which induced a dose-dependent inhibition of IL-17A secretion from PHA-
activated ASC-MNC co-cultures (Figure 6C). To define whether PI3K and STAT3 signalling
events are related, we measured Akt- and STAT3-phosphorylation after incubation with either
wortmannin or STAT3 VI. STAT3 inhibition by STAT3-VI did not affect Akt
phosphorylation, but wortmannin decreased STAT3 phosphorylation, indicating that PI3K
acts upstream of STAT3 to promote IL-17A secretion (Figure 6D).
ASC differentially modulate STAT3 and STAT5 binding on the IL17A/F gene locus.
The transcriptional control of IL-17A in T cells is modulated by the reciprocal binding of
STAT3 and STAT5 on multiple common binding sites of the IL-17 gene locus (25).
According to this model, STAT3 promotes IL-17A transcription, while STAT5 acts as a
negative modulator by competing on the same transcription factor binding sites than STAT3.
We thus performed ChIP experiments with antibodies directed to STAT3 and STAT5 and
analyzed three different IL-17A/F gene loci (p1, p3, p4, Figure 7A) known to be involved in
transcription factor binding. Figure 7B shows that STAT3 binding to IL-17A/F p1 and p4
regions increased in PHA stimulated cells, regardless of ASC presence. However, STAT5
binding to the same IL-17A/F loci did not increase in the presence of ASC (Figure 7B),
leading thus to an enhancement of the STAT3/STAT5 IL-17A gene binding ratio from 1.06 in
PHA-activated MNC to 1.75 in PHA-activated ASC-MNC co-cultures (Figure 7C). Thus, the
presence of ASC appeared to favor the STAT3/STAT5 IL-17A/F binding balance towards
STAT3, and to subsequently activate IL-17A gene transcription.
Page 13 of 45 Diabetes

14
Conditioned media from PHA-activated ASC-MNC co-cultures inhibit both
adipogenesis and adipocyte insulin responses.
Because IL-17A inhibits adipogenesis (12; 26), we analyzed the impact of ASC-MNC co-
culture CM on ASC differentiation into adipocytes. We differentiated ASC from
subcutaneous AT for 5 or 12 days, and cultured them for the last 72h in differentiation
medium containing or not a 50% volume of CM collected from resting or PHA-activated
ASC-MNC co-cultures, or MNC cultures. Differentiation was monitored by gene expression
profiling adipocyte-specific genes FABP4, PPARγ, adiponectin (AdipoQ) and leptin. Figure
8A shows a strong increase of these genes upon differentiation, as compared to
undifferentiated ASC. However, differentiating ASC incubated with CM from PHA-activated
MNC, although appearing morphologically similar to control adipocytes (Supplementary
Figure 1), displayed significant down-regulation of FABP4, PPARγ and adiponectin mRNAs,
at both 8- (Figure 8A) and 15-days of differentiation (data not shown). In contrast, expression
of leptin mRNA did not significantly decrease, as compared with adipocytes not exposed to
CM. Interestingly, only CM collected from PHA-activated ASC-MNC co-cultures inhibited
the insulin response of differentiating ASC, as assessed by reduction of pAkt-Ser473 in
insulin-treated cells (Figure 8B, C). To investigate the effect of CM from PHA-activated
ASC-MNC co-cultures on an insulin-dependent metabolic response, we studied the inhibitory
effect of insulin on isoproterenol-induced lipolysis (Figure 8D). We observed that, whereas
isoproterenol-induced lipolysis was inhibited by insulin in differentiated ASC (Figure 8D,
left), such inhibition was lost in differentiating ASC treated with CM from PHA-activated
ASC-MNC co-cultures (Figure 8D, right), indicating that PHA-activated ASC-MNC CM
affect both insulin signaling and insulin-dependent metabolic responses.
Page 14 of 45Diabetes

15
Discussion
Far from being a mere repository of fat mass, the adipose tissue is perhaps the most plastic
organ of the body, capable of meeting the evolutionarily conserved need of storing
energy/nutrients during periods of plenty, but also of acting as a thermogenic organ (27). Such
plasticity, associated to lifestyle changes in nutrition and physical activity in the population
worldwide has led to the current epidemics of obesity (28). Although differentiated adipocytes
constitute the major part of the AT mass, precursor ASC represent five cells for each
differentiated adipocyte (29). Infiltrating immune cells are also present within AT and
contribute to the inflammatory state observed in obesity (3). Infiltrating macrophages were
initially identified as major immune effectors within hypertrophic AT (4), but a role for T
cells in AT inflammation has also been described (2; 3; 30). However, the extent of
inflammatory phenomena arising from the interaction between MNC – which collectively
include monocytes and T cells – and ASC has not been investigated.
Based on our previous work on MSC-mediated inflammation in rheumatoid arthritis (13), we
postulated that interactions between ASC and MNC contribute to AT inflammation. Here,
using ASC-MNC co-cultures, we observed that obese- but not lean-derived ASC polarize
PHA-activated MNC towards a Th17 phenotype, resulting in increased secretion of IL-17A,
with a parallel decrease in TNFα and IFNγ Th1 cytokine secretion. Supporting these results in
a more physiological level, we observed that AT-derived SVF from obese, but not lean,
donors also secreted TNFα upon activation with PHA, but at much lower levels than IL-17A
(Figure 2A).
IL-17A secretion was triggered by TCR activation, as treatment of MNC with anti-
CD3/CD28-activating antibodies induced similar levels of IL-17A secretion than PHA
(Figure 3B). Furthermore, because IL-17A secretion was promoted by both autologous and
Page 15 of 45 Diabetes

16
allogeneic ASC, this suggests that ASC might present an antigen to MNC, independently on
HLA expression, accordingly with reports showing that (i) human ASC are devoid of HLA-
class II expression (20), and (ii) AT antigens are preferentially presented to T cells in obese
versus lean experimental models (31), with lipid antigens being potential candidates (32).
Supporting that ASC might present an antigen to T cells, we demonstrated that obese, but not
lean-derived ASC are able to induce IL-17A secretion by MNC from either lean or obese
subjects, whereas obese-derived MNC did not secrete IL-17A when interacting with ASC
from lean subjects (Figure 2B). Moreover, ICAM-1 partly mediated MNC-ASC interaction,
as assessed by the inhibitory effect of anti-CD54 antibodies. We observed that pro-
inflammatory IL-1β increased in the presence of ASC, and that the monocyte fraction of
MNC was likely responsible for IL-1β secretion. In contrast, IL-6 secretion depended on
ASC. Taken together, these data suggest that AT inflammation might be governed by the
cellular interplay of three cell lineages: ASC, T cells, and monocytes.
To decipher the molecular events leading to ASC-mediated IL-17A secretion, we added anti-
IL-1β and anti-IL6R neutralizing antibodies to ASC/MNC co-cultures. We observed that IL-
1β, but not IL-6, blockade decreased ASC-mediated IL-17A secretion. Because caspase-1, an
enzyme activated by the inflammasome, controls IL-1β secretion, through pro-IL-1β cleavage
(33; 34), we evaluated the requirement for caspase-1 activation in the induction of ASC-
mediated IL-17A secretion, by blocking the inflammasome with Z-YVAD-fmk, or IL-1β
secretion with neutralizing antibodies, and by measuring caspase-1 catalytic activity, which
we found increased in PHA-activated ASC-MNC co-cultures (Figure 5D). Z-YVAD-fmk
treatment resulted in a more potent inhibition of IL-17A production than IL-1 β neutralizing
antibody, suggesting the involvement other inflammasome-generated pro-inflammatory
cytokines (35).
To better understand the mechanisms by which ASC favor Th17 polarization, we examined
Page 16 of 45Diabetes
17
PI3K and STAT3 activation, which both contribute to the signaling pathways leading to Th17
cell differentiation (36; 37). Wortmannin inhibited both Akt-phosphorylation and IL-17A
secretion in PHA-activated ASC-MNC co-cultures. In addition, as IL-17A secretion was
blocked by STAT3 inhibition, and wortmannin partly inhibited STAT3 phosphorylation
(Figure 6C,D), we suggest that PI3K acts upstream of STAT3 on a signaling pathway leading
to IL-17A secretion. We then demonstrated that the STAT3/STAT5 binding ratio on the IL-
17A/F gene locus increased in the presence of ASC. Because Yang et al. reported that IL-2
inhibits IL-17A secretion by increasing STAT5 binding to the IL-17A/F gene locus over
STAT3 binding (25), we measured IL-2 secretion and observed its inhibition in the presence
of ASC, as expected for a Th1 cytokine (Supplementary figure 3). We therefore suggest that
ASC promote IL-17A secretion by decreasing IL-2 mediated STAT5 binding on IL-17A/F
gene. To determine the impact of ASC/MNC interactions on the adipocyte biology, we next
investigated the impact of cytokine secretion arising from ASC-MNC co-cultures on
adipocyte differentiation. We observed impairment of adipogenesis mRNA markers in the
presence of CM obtained from PHA-activated MNC or ASC-MNC co-cultures. This suggests
that Th1 and Th17 cytokines are involved in this inhibitory effect, in agreement with reports
showing that both TNFα and IL-17A inhibit adipogenesis (12; 38). Interestingly, while
adipocyte differentiation markers FABP4, PPARγ and AdipoQ were inhibited, leptin mRNA
expression was not impaired, in agreement with the fact that AT inflammation is associated
with increased levels of leptin, but reduced levels of adiponectin (39), and the demonstration
of a positive effect of IL-17A on leptin secretion (40). Moreover, only CM from PHA-
activated ASC-MNC co-cultures significantly reduced the insulin response in differentiating
adipocytes (Figure 8B,C), which was supported by absence of insulin-mediated lipolysis
inhibition (Figure 8D). 72h incubation of differentiating ASC with ASC-MNC CM did not
significantly affect adipocyte morphology and lipid droplet accumulation (Supplementary-
Page 17 of 45 Diabetes

18
figure 1). However, we cannot rule out that longer lasting treatments with ASC-MNC CM
would affect adipocyte morphology. Based on our results, and on previous reports showing an
impairment of the insulin response in IL-17A treated 3T3-preadipocytes or human
hepatocytes (9; 26), we suggest that immune cells infiltrating AT may send a signal to ASC,
which then prevents further adipocyte differentiation through promotion of Th17 cells.
Because IL-17A has also been shown to increase in peripheral blood and tissues of obese
patients (9; 10), and to exacerbate inflammation (41), our results suggest that ASC could
contribute to obesity-mediated inflammation through deviation of the Th1 response towards
the Th-17 pathway in AT, and subsequent propagation of inflammation in the periphery. Our
study reinforces the concept that obese-derived ASC induce peripheral inflammation through
Th17 cell promotion (13; 42-44).
In conclusion, we demonstrate that besides their well-known immune-regulatory effect on
Th1 cells (45), ASC derived from obese subjects contribute to AT inflammation by promoting
Th17 and monocyte activation. Further deciphering this novel cell interplay might allow
defining new therapeutic targets to alleviate the inflammatory status of AT in obesity.
Page 18 of 45Diabetes

19
Author contributions
A.E. conceived the project. M.R., E.D., J.R., G.V. provided biopsies and biological material.
M.C., S.C., C.D. and N.B. performed experiments. M.L., E.L. and H.V. directed the project.
L.P. and A.E. directed the project, performed experiments and wrote the manuscript. All
authors reviewed, commented and approved the final version of the manuscript.
Page 19 of 45 Diabetes

20
Acknowledgements
The guarantors of this work are Drs. Assia Eljaafari and Luciano Pirola. None of the authors
has conflicts of interests to disclose. This work has been supported in part by the INSERM
institute, and a research grant from the “Fondation de l’Avenir”. We thank “The Francophone
Society of Diabetes”, and the “European Association for the Study of Diabetes” for having
given us the opportunity to present our work in their 2014 Annual Meetings.
Page 20 of 45Diabetes

21
References
1. Xu XJ, Pories WJ, Dohm LG, Ruderman NB: What distinguishes adi17pose tissue of
severely obese humans who are insulin sensitive and resistant? Curr Opin Lipidol 2013;
24:49-56
2. Kammoun HL, Kraakman MJ, Febbraio MA: Adipose tissue inflammation in glucose
metabolism. Rev Endocr Metab Disord 2014; 15:31-44
3. Donath MY, Shoelson SE: Type 2 diabetes as an inflammatory disease. Nat Rev Immunol
2011; 11:98-107
4. Weisberg SP, McCann D, Desai M, Rosenbaum M, Leibel RL, Ferrante AW, Jr.: Obesity is
associated with macrophage accumulation in adipose tissue. J Clin Invest 2003; 112:1796-
1808
5. Xu H, Barnes GT, Yang Q, Tan G, Yang D, Chou CJ, Sole J, Nichols A, Ross JS, Tartaglia
LA, Chen H: Chronic inflammation in fat plays a crucial role in the development of
obesity-related insulin resistance. J Clin Invest 2003; 112:1821-1830
6. Ahmed M, Gaffen SL: IL-17 in obesity and adipogenesis. Cytokine Growth Factor Rev
2010; 21:449-453
7. Winer S, Paltser G, Chan Y, Tsui H, Engleman E, Winer D, Dosch HM: Obesity
predisposes to Th17 bias. Eur J Immunol 2009; 39:2629-2635
8. Dalmas E, Venteclef N, Caer C, Poitou C, Cremer I, Aron-Winewsky J, Lacroix-Desmazes
S, Bayry J, Kaveri SV, Clement K, Andre S, Guerre-Millo M: T cell-derived IL-22
amplifies IL-1beta-driven inflammation in human adipose tissue: relevance to obesity and
type 2 diabetes. Diabetes 2014; 63:1966-1977
9. Fabbrini E, Cella M, McCartney SA, Fuchs A, Abumrad NA, Pietka TA, Chen Z, Finck
BN, Han DH, Magkos F, Conte C, Bradley D, Fraterrigo G, Eagon JC, Patterson BW,
Colonna M, Klein S: Association between specific adipose tissue CD4+ T-cell populations
and insulin resistance in obese individuals. Gastroenterology 2013; 145:366-374 e361-363
10. Sumarac-Dumanovic M, Stevanovic D, Ljubic A, Jorga J, Simic M, Stamenkovic-
Pejkovic D, Starcevic V, Trajkovic V, Micic D: Increased activity of interleukin-
23/interleukin-17 proinflammatory axis in obese women. Int J Obes (Lond) 2009; 33:151-
156
11. Gaffen SL: Recent advances in the IL-17 cytokine family. Curr Opin Immunol 2011;
23:613-619
Page 21 of 45 Diabetes

22
12. Ahmed M, Gaffen SL: IL-17 inhibits adipogenesis in part via C/EBPalpha, PPARgamma
and Kruppel-like factors. Cytokine 2013; 61:898-905
13. Eljaafari A, Tartelin ML, Aissaoui H, Chevrel G, Osta B, Lavocat F, Miossec P: Bone
marrow-derived and synovium-derived mesenchymal cells promote Th17 cell expansion
and activation through caspase 1 activation: contribution to the chronicity of rheumatoid
arthritis. Arthritis Rheum 2012; 64:2147-2157
14. Hass R, Kasper C, Bohm S, Jacobs R: Different populations and sources of human
mesenchymal stem cells (MSC): A comparison of adult and neonatal tissue-derived MSC.
Cell Commun Signal 2011; 9:12
15. Demozay D, Rocchi S, Mas JC, Grillo S, Pirola L, Chavey C, Van Obberghen E: Fatty
Aldehyde Dehydrogenase: POTENTIAL ROLE IN OXIDATIVE STRESS PROTECTION
AND REGULATION OF ITS GENE EXPRESSION BY INSULIN. J Biol Chem 2004;
279:6261-6270.
16. Zerzaihi O, Chriett S, Vidal H, Pirola L: Insulin-dependent transcriptional control in L6
rat myotubes is associated with modulation of histone acetylation and accumulation of the
histone variant H2A.Z in the proximity of the transcriptional start site. Biochem Cell Biol
2014; 92:61-67
17. Li YP, Paczesny S, Lauret E, Poirault S, Bordigoni P, Mekhloufi F, Hequet O, Bertrand
Y, Ou-Yang JP, Stoltz JF, Miossec P, Eljaafari A: Human mesenchymal stem cells license
adult CD34+ hemopoietic progenitor cells to differentiate into regulatory dendritic cells
through activation of the Notch pathway. J Immunol 2008; 180:1598-1608
18. Madec AM, Mallone R, Afonso G, Abou Mrad E, Mesnier A, Eljaafari A, Thivolet C:
Mesenchymal stem cells protect NOD mice from diabetes by inducing regulatory T cells.
Diabetologia 2009; 52:1391-1399
19. Annunziato F, Cosmi L, Santarlasci V, Maggi L, Liotta F, Mazzinghi B, Parente E, Fili L,
Ferri S, Frosali F, Giudici F, Romagnani P, Parronchi P, Tonelli F, Maggi E, Romagnani
S: Phenotypic and functional features of human Th17 cells. J Exp Med 2007; 204:1849-
1861
20. Schaffler A, Buchler C: Concise review: adipose tissue-derived stromal cells--basic and
clinical implications for novel cell-based therapies. Stem Cells 2007; 25:818-827
21. Bassi EJ, Moraes-Vieira PM, Moreira-Sa CS, Almeida DC, Vieira LM, Cunha CS, Hiyane
MI, Basso AS, Pacheco-Silva A, Camara NO: Immune regulatory properties of allogeneic
Page 22 of 45Diabetes
23
adipose-derived mesenchymal stem cells in the treatment of experimental autoimmune
diabetes. Diabetes 2012; 61:2534-2545
22. Mariathasan S, Monack DM: Inflammasome adaptors and sensors: intracellular regulators
of infection and inflammation. Nat Rev Immunol 2007; 7:31-40
23. Roller A, Perino A, Dapavo P, Soro E, Okkenhaug K, Hirsch E, Ji H: Blockade of
phosphatidylinositol 3-kinase PI3Kdelta or PI3Kgamma reduces IL-17 and ameliorates
imiquimod-induced psoriasis-like dermatitis. J Immunol 2012; 189:4612-4620
24. Wei L, Laurence A, Elias KM, O'Shea JJ: IL-21 is produced by Th17 cells and drives IL-
17 production in a STAT3-dependent manner. J Biol Chem 2007; 282:34605-34610
25. Yang XP, Ghoreschi K, Steward-Tharp SM, Rodriguez-Canales J, Zhu J, Grainger JR,
Hirahara K, Sun HW, Wei L, Vahedi G, Kanno Y, O'Shea JJ, Laurence A: Opposing
regulation of the locus encoding IL-17 through direct, reciprocal actions of STAT3 and
STAT5. Nat Immunol 2011; 12:247-254
26. Zuniga LA, Shen WJ, Joyce-Shaikh B, Pyatnova EA, Richards AG, Thom C, Andrade
SM, Cua DJ, Kraemer FB, Butcher EC: IL-17 regulates adipogenesis, glucose
homeostasis, and obesity. J Immunol 2010; 185:6947-6959
27. Giordano A, Smorlesi A, Frontini A, Barbatelli G, Cinti S: White, brown and pink
adipocytes: the extraordinary plasticity of the adipose organ. Eur J Endocrinol 2014;
170:R159-171
28. Malik VS, Willett WC, Hu FB: Global obesity: trends, risk factors and policy
implications. Nat Rev Endocrinol 2013; 9:13-27
29. Ahrends R, Ota A, Kovary KM, Kudo T, Park BO, Teruel MN: Controlling low rates of
cell differentiation through noise and ultrahigh feedback. Science 2014; 344:1384-1389
30. Johnson AR, Milner JJ, Makowski L: The inflammation highway: metabolism accelerates
inflammatory traffic in obesity. Immunol Rev 2012; 249:218-238
31. Winer S, Chan Y, Paltser G, Truong D, Tsui H, Bahrami J, Dorfman R, Wang Y,
Zielenski J, Mastronardi F, Maezawa Y, Drucker DJ, Engleman E, Winer D, Dosch HM:
Normalization of obesity-associated insulin resistance through immunotherapy. Nat Med
2009; 15:921-929
32. Lepore M, de Lalla C, Gundimeda SR, Gsellinger H, Consonni M, Garavaglia C, Sansano
S, Piccolo F, Scelfo A, Haussinger D, Montagna D, Locatelli F, Bonini C, Bondanza A,
Forcina A, Li Z, Ni G, Ciceri F, Jeno P, Xia C, Mori L, Dellabona P, Casorati G, De
Page 23 of 45 Diabetes

24
Libero G: A novel self-lipid antigen targets human T cells against CD1c(+) leukemias. J
Exp Med 2014; 211:1363-1377
33. Stienstra R, Tack CJ, Kanneganti TD, Joosten LA, Netea MG: The inflammasome puts
obesity in the danger zone. Cell Metab 2012; 15:10-18
34. Martinon F, Gaide O, Petrilli V, Mayor A, Tschopp J: NALP inflammasomes: a central
role in innate immunity. Semin Immunopathol 2007; 29:213-229
35. Esposito K, Pontillo A, Ciotola M, Di Palo C, Grella E, Nicoletti G, Giugliano D: Weight
loss reduces interleukin-18 levels in obese women. J Clin Endocrinol Metab 2002;
87:3864-3866
36. Bergamini G, Bell K, Shimamura S, Werner T, Cansfield A, Muller K, Perrin J, Rau C,
Ellard K, Hopf C, Doce C, Leggate D, Mangano R, Mathieson T, O'Mahony A, Plavec I,
Rharbaoui F, Reinhard F, Savitski MM, Ramsden N, Hirsch E, Drewes G, Rausch O,
Bantscheff M, Neubauer G: A selective inhibitor reveals PI3Kgamma dependence of
T(H)17 cell differentiation. Nat Chem Biol 2012; 8:576-582
37. Yang XO, Panopoulos AD, Nurieva R, Chang SH, Wang D, Watowich SS, Dong C:
STAT3 regulates cytokine-mediated generation of inflammatory helper T cells. J Biol
Chem 2007; 282:9358-9363
38. Jin D, Sun J, Huang J, He Y, Yu A, Yu X, Yang Z: TNF-alpha reduces g0s2 expression
and stimulates lipolysis through PPAR-gamma inhibition in 3T3-L1 adipocytes. Cytokine
2014; 69:196-205
39. Ouchi N, Parker JL, Lugus JJ, Walsh K: Adipokines in inflammation and metabolic
disease. Nat Rev Immunol 2011; 11:85-97
40. Noh M: Interleukin-17A increases leptin production in human bone marrow mesenchymal
stem cells. Biochem Pharmacol 2012; 83:661-670
41. Grieco FA, Moore F, Vigneron F, Santin I, Villate O, Marselli L, Rondas D, Korf H,
Overbergh L, Dotta F, Marchetti P, Mathieu C, Eizirik DL: IL-17A increases the
expression of proinflammatory chemokines in human pancreatic islets. Diabetologia 2014;
57:502-511
42. Guo Z, Zheng C, Chen Z, Gu D, Du W, Ge J, Han Z, Yang R: Fetal BM-derived
mesenchymal stem cells promote the expansion of human Th17 cells, but inhibit the
production of Th1 cells. Eur J Immunol 2009; 39:2840-2849
43. van Hamburg JP, Asmawidjaja PS, Davelaar N, Mus AM, Colin EM, Hazes JM, Dolhain
RJ, Lubberts E: Th17 cells, but not Th1 cells, from patients with early rheumatoid arthritis
Page 24 of 45Diabetes

25
are potent inducers of matrix metalloproteinases and proinflammatory cytokines upon
synovial fibroblast interaction, including autocrine interleukin-17A production. Arthritis
Rheum 2011; 63:73-83
44. Wu L, Ong S, Talor MV, Barin JG, Baldeviano GC, Kass DA, Bedja D, Zhang H, Sheikh
A, Margolick JB, Iwakura Y, Rose NR, Cihakova D: Cardiac fibroblasts mediate IL-17A-
driven inflammatory dilated cardiomyopathy. J Exp Med 2014; 211:1449-1464
45. Hoogduijn MJ, Crop MJ, Peeters AM, Van Osch GJ, Balk AH, Ijzermans JN, Weimar W,
Baan CC: Human heart, spleen, and perirenal fat-derived mesenchymal stem cells have
immunomodulatory capacities. Stem Cells Dev 2007; 16:597-604
Page 25 of 45 Diabetes

26
Figure legends
Figure 1. Human ASC from obese subjects polarize T cells towards the Th17
inflammatory subset, negatively modulate Th1 cell responses, and enhance IL-1ββββ and
IL-6 secretion by MNC. A. Cell culture supernatants from MNC co-cultured or not with
graded concentrations of ASC, and activated by PHA or not, were analyzed by ELISA for the
secretion of IL-17A, IL-1β, IL-6, TNFα and IFNγ. ASC-MNC co-cultures in the absence of
PHA are in a 1:5 ratio. Error bars represent standard deviations from n≥ 3 independent
experiments. * p<0.05, *** p<0.001 by one-way ANOVA followed by a Bonferroni’s
Multiple Comparison Test for pairwise comparisons. n.s.; not significant. B. Representative
flow cytometry plots of MNC stained for CCR6+ (y-axis) and intra-cellular IL-17A
+ (x-axis).
ASC:MNC ratio is 1:5. The percentage of CCR6+/IL-17A
+ double-positive cells is indicated
in the top-right quadrant. C. Representative flow cytometry plots of MNC stained for intra-
cellular IFNγ+ (y-axis) and IL-17A
+ (x-axis) under the same experimental conditions as in B,
but with varying ASC:MNC ratios (1:100 to 1:5) as indicated in panels III-V. The percentage
of double-positive cells is indicated in the top-right quadrant. The percentage of IFNγ+/IL-
17A- cells is indicated in the top-left quadrant.
Figure 2: Only SVF and ASC derived from obese donors mediate PHA-induced IL-17A
secretion. A. SVF were derived from explanted visceral adipose tissue from lean or obese
subjects. SVF were left untreated or stimulated with PHA (5 µg/ml, 48h). Supernatants were
analyzed by ELISA for the secretion of IL-17A (white bars) and TNFα (black bars). Values
represent the mean from 3 independent experiments using SVF from 3 independent donors.
Error bars represent SD. * p<0.05; ** p<0.01; as tested by unpaired Student’s t-Test. B. MNC
Page 26 of 45Diabetes
27
derived from lean donors were co-cultured in the presence of ASC derived from obese
subjects (white bars) or lean subjects (black bars). C. MNC derived from obese (white bars)
or lean (black bars) donors were co-cultured in the presence of ASC derived from lean
subjects. Co-cultures were stimulated or not with PHA as indicated, and co-culture
supernatants at 48h were analyzed by ELISA for the secretion of IL-17A. (B,C) Error bars
represent the SEM of ≥ 3 independent experiments. n.s., not significant; * p<0.05, as tested by
student t test.
Figure 3. IL-17A production is equally enhanced by autologous or allogeneic ASC, PHA
or CD3/CD28 co-stimulation, and is potentiated by monocyte-secreted IL-1ββββ. A. PHA-
activated MNC were co-cultured with autologous (grey bar) or allogeneic (black bar) ASC,
and IL-17A secretion was measured. B. MNC (white bars) and MNC co-incubated with ASC
(black bars) were left untreated (-), activated with PHA, or activated by incubation with anti-
CD3 and anti-CD28 antibodies. C, D, E. IL-17Α (C), IL-1β (D), and IL-6 (E) secretion were
measured on MNC (white bars) or CD14- MNC (i.e. MNC devoid of the monocyte fraction)
co-cultured or not with ASC and /or PHA as indicated. IL-17A, IL-1β and IL-6 levels were
determined by ELISA on cell culture supernatants. n≥3, error bars represent SD. * p<0.05; **
p<0.01; *** p<0.001; n.s., not significant, as tested by one-way ANOVA followed by
Tukey’s Multiple Comparison Test.
Figure 4. ASC-mediated IL-17A production is mostly cell contact-dependent and partly
requires ICAM-1. A. MNC were activated or not with PHA as indicated and left untreated
(white bars), co-incubated with ASC (black bars) or co-incubated with ASC in transwells to
keep the two cell types separated (grey bars). IL-17A levels were determined by ELISA on
cell culture supernatants. B. MNC activated or not with PHA as indicated were co-incubated
Page 27 of 45 Diabetes

28
with conditioned medium (CM) obtained from independently incubated ASC (black bars) or
co-incubated with ASC (grey bars). C. ASC-MNC co-cultures were left untreated of co-
incubated with a CD54 (ICAM-1) neutralizing antibody (10 µg/ml). n=3, error bars represent
SD. * p<0.05; ** p<0.01; as tested by paired Student’s t-Test.
Figure 5. The inflammasome, and IL-1β, but not IL-6 secretion are involved in ASC-
mediated IL-17A production. MNC were co-incubated with ASC or PHA, or with both
ASC and PHA as indicated. PHA-activated MNC-ASC co-cultures were left untreated (white
bars) or incubated (black bars) with: A. neutralizing antibodies directed to IL-1β (IL-1β Ab);
and B. neutralizing antibodies directed to the IL-6 receptor (IL-6R Ab) and C. the caspase-1
inhibitor inhibitor Z-YVAD-fmk (10 µmol/l). IL-17A levels were determined by ELISA on
cell culture supernatants. D. Measurement of caspase-1 activity in ASC-MNC co-cultures left
untreated of stimulated with PHA. A.U., arbitrary units. n≥3, error bars represent SD. *
p<0.05; *** p<0.001; as tested by unpaired Student’s t-Test.
Figure 6. The PI3K transduction pathway and STAT3 are involved ASC-mediated IL-
17A production. A. MNC were co-incubated with ASC or PHA, or with both ASC and PHA
as indicated. PHA-activated MNC-ASC co-cultures were left untreated (white bars) or
incubated with 100 nmol/l wortmannin during the co-culture (black bars). IL-17A levels were
determined by ELISA on 48h cell culture supernatants. n=3, error bars represent SD. ***
p<0.001 as tested by unpaired Student’s t-Test. B. Western blot analysis of phosphorylated
Akt on Ser473 (pAktSer473, left blot) and total Akt (right blot) on equally loaded independent
gels. The asterisk represents an unidentified band. Molecular weight (MW) markers are
indicated on the right. The dotted line represents separation between lanes on the same
immunoblotting membrane. C. PHA-treated MNC-ASC co-cultures were incubated with
Page 28 of 45Diabetes
29
increasing concentrations of the STAT3 inhibitor, STAT3 VI. IL-17A secretion was measured
by ELISA on cell culture supernatants. n=3, error bars represent SD. * p<0.05 as tested by
unpaired Student’s t-Test. D. Western blot analysis of pAktSer473 and total Akt (upper
panels); and pSTAT3 and total STAT3 (lower panels) on ASC-MNC co-cultured treated with
PHA and the inhibitors wortmannin (Wort., 100nmol/l) or STAT3 VI (STAT inh., 100
µmol/l) as indicated.
Figure 7. ASC modulate STAT3 and STAT5 binding on the IL17A-IL17F gene locus. A.
Schematic diagram of the IL17A/F gene locus, indicating the three STAT-binding sites p1, p3,
p4 studied by ChIP. B. Evaluation of STAT3 (left graph) and STAT5 (right graph) binding on
the p1-p4 sites. Results are represented as relative binding to the control condition on the
three different (p1-p4) sites. * p<0.05 versus control condition by paired t-test. n=3, error bars
represent S.E.M. C. STAT3/STAT5 binding ratio on the genomic loci p1-p4.
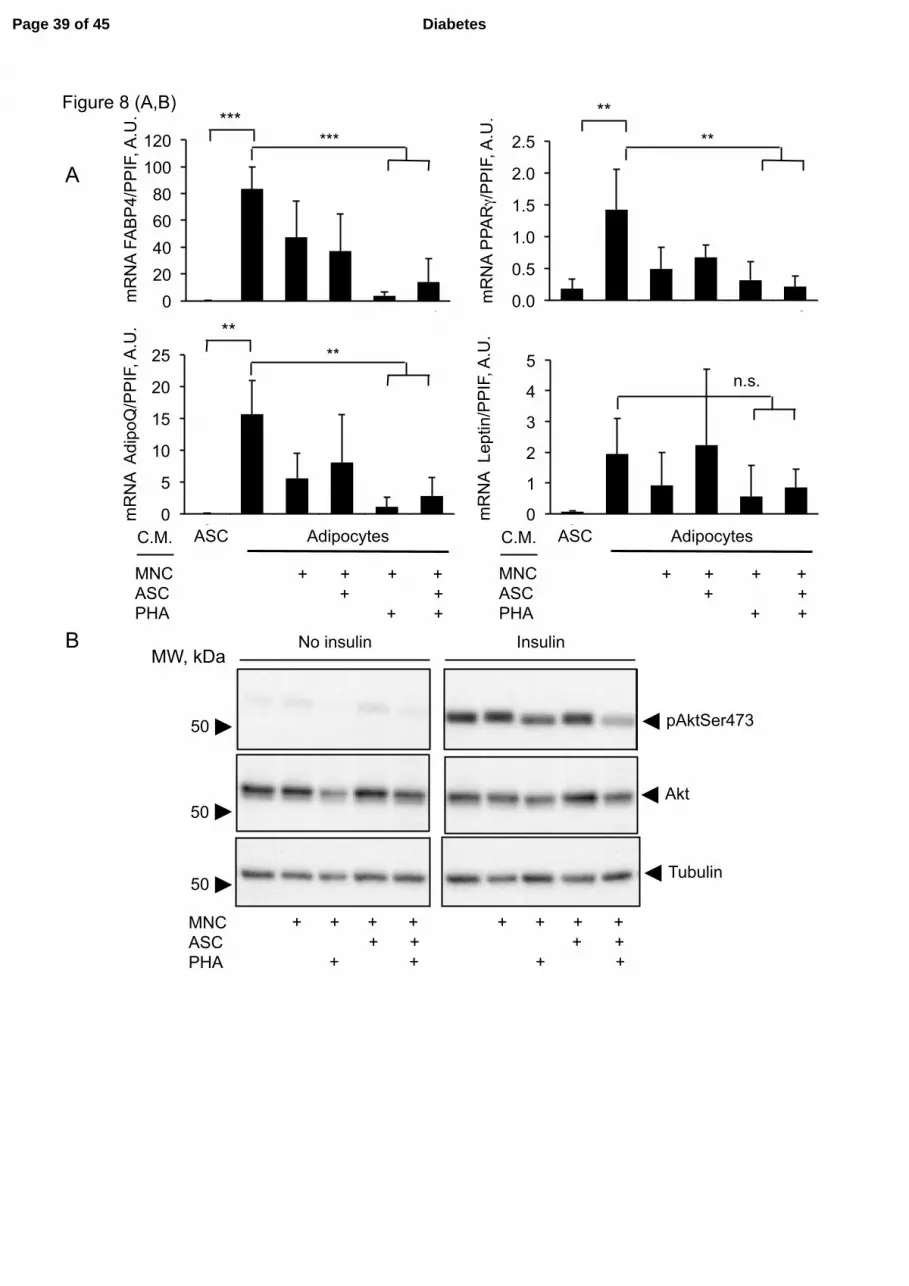
Figure 8. Conditioned media from PHA-activated MNC inhibit ASC terminal
differentiation. ASC differentiation was initiated at cell confluence by switching the cells to
differentiation medium. At day 5 (A,B,C) or 12 (D) from the start of differentiation, cells
were treated for 3 days with conditioned media (C.M.) obtained from MNC co-incubated or
not with ASC and/or PHA as indicated. At the end of the differentiation period, cells were
subjected to RNA extraction for qPCR quantifications (A), starved overnight and
subsequently stimulated with 100 nmol/l insulin for 15 min (B,C), or starved overnight and
subjected to a glycerol release assay (D). A. Quantitative PCR of adipogenic genes FABP4,
PPARγ, AdipoQ and leptin. n≥3, error bars represent SD. ** p<0.01; *** p<0.001, as tested
by one-way ANOVA followed by a Tukey’s Multiple Comparison Test. B. Western blot
analysis of phosphorylated Akt on Ser473 (pAktSer473), total Akt and tubulin on equally
Page 29 of 45 Diabetes

30
loaded independent gels. Molecular weight (MW) markers are indicated on the left. C.
Quantification of phosphorylated Akt on Ser473 normalized on total Akt levels. * p<0.05,
versus control condition by t-test. n=3, error bars represent S.D. (D) Differentiating
adipocytes at day 12 were treated for 72 hours with conditioned media from PHA-activated
ASC-MNC cocultures (black bars) or left untreated (white bars). Glycerol release was
measured after incubation with 100 nmoles/l isoproterenol (IPT) for 2 hours. Insulin-
dependent inhibition of glycerol release was measured by co-incubation with the indicated
concentrations of insulin. A representative experiment of three is shown. Error bars indicate
the S.D. from two independent measurements.
Supplementary Figure 1. Generation of adipocytes and osteoblasts from adipose tissue-
derived ASC. (A,B,C), Oil Red O staining of ASC differentiated to adipocytes by incubation
in differentiation medium for 15 days. From day 12, differentiating ASC were exposed for 72
h to normal differentiation medium (A) or differentiation medium containing a 50% volume
of conditioned media collected from resting (B) or PHA-activated (C) ASC-MNC co-cultures.
No obvious morphological differences are observed. Quantification of lipid content by Oil
Red O staining using spectrophotometric analysis of isopropanol-extracted lipids at 510 nm is
shown for each experimental condition. (D) ASC were differentiated to osteoblast by
incubation in osteoblast differentiation medium for 8 days and stained by alizarin red. The
black bars represent 100 µm.
Supplementary Figure 2. IL-17A secretion from PHA-treated adipose tissue derived
stromal vascular fractions. SVF from visceral fat of Ob/Ob mice and control wild type mice
(Left graph), and explanted adipose tissue from high fat diet (16 weeks, HFD) and chow fed
mice (Right graph) were left untreated or stimulated with PHA (PHA, 5 µg/ml, 24h).
Page 30 of 45Diabetes

31
Supernatants were analyzed by ELISA for the secretion of IL-17A. n=3, error bars represent
SD. * p<0.05, as tested by student t test.
Supplementary Figure 3. ASC inhibit IL-2 secretion by PHA-activated MNC
IL-2 levels from MNC co-cultured or not with ASC, and activated or not by PHA, were
determined by ELISA on cell culture supernatants. n=3, error bars represent SD. * p<0.05, as
tested by student t test.
Page 31 of 45 Diabetes
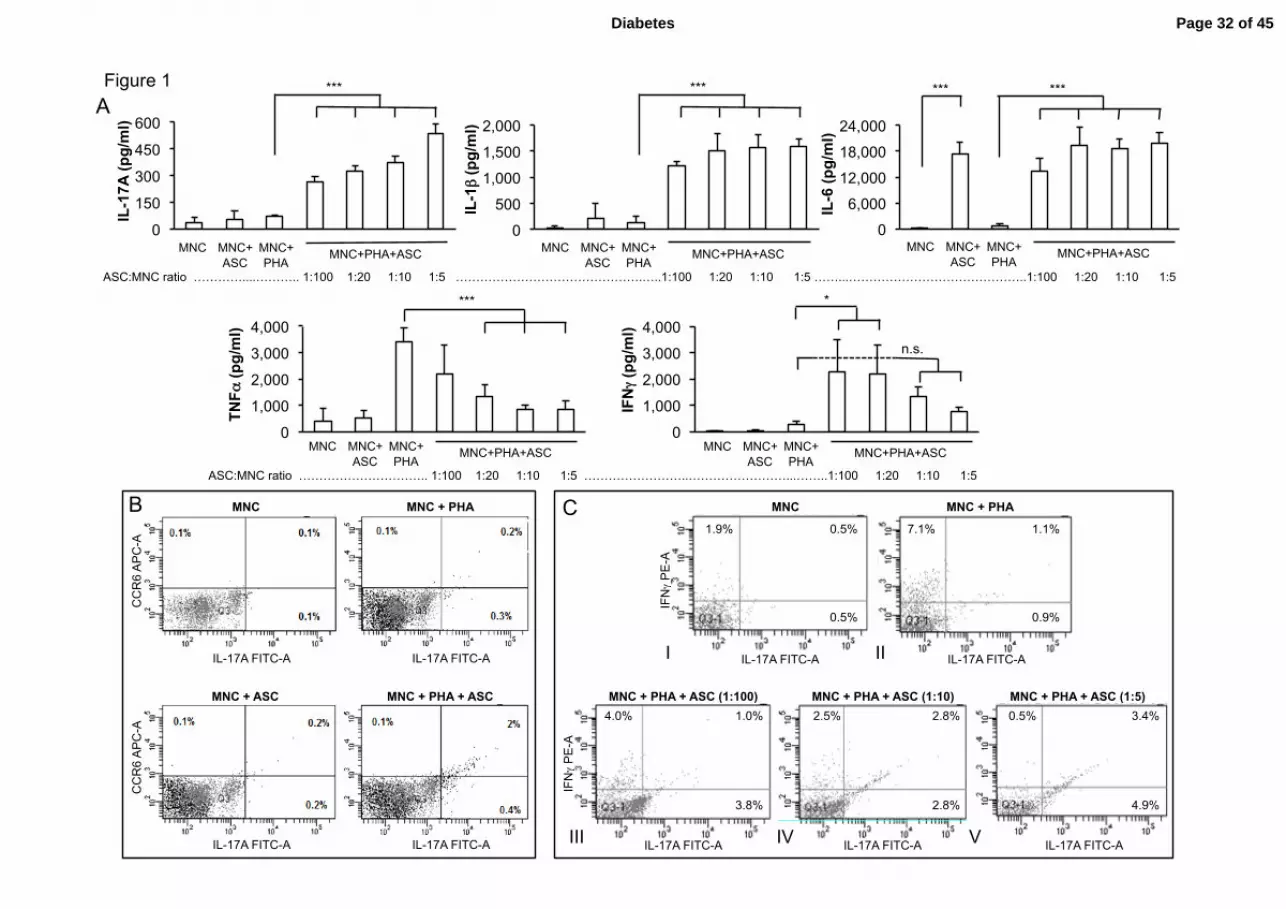
Figure 1
MNC MNC + PHA
MNC + ASC MNC + PHA + ASC
IL-17A FITC-A
CC
R6
AP
C-A
IL-17A FITC-A
IL-17A FITC-A
CC
R6
AP
C-A
IL-17A FITC-A
B MNC C
IL-17A FITC-A IF
Nγ
PE
-A
0.5%
1.9% 0.5%
I
MNC + PHA
IL-17A FITC-A
0.9%
7.1% 1.1%
II
MNC + PHA + ASC (1:100)
IL-17A FITC-A
IFNγ
PE
-A
4.0% 1.0%
3.8%
III
MNC + PHA + ASC (1:10)
IL-17A FITC-A
2.5% 2.8%
2.8%
IV
MNC + PHA + ASC (1:5)
IL-17A FITC-A
0.5% 3.4%
4.9%
V
A
0
150
300
450
600
MNC MNC+ASC MNC+PHA
IL-1
7A (p
g/m
l)
***
0
500
1,000
1,500
2,000
MNC MNC+ASC MNC+PHA
IL-1β
(pg/
ml)
MNC MNC+ ASC
MNC+ PHA
MNC+PHA+ASC
***
0
1,000
2,000
3,000
4,000
MNC MNC+ASC MNC+PHA
TNFα
(pg/
ml)
***
0
1,000
2,000
3,000
4,000
MNC MNC+ASC MNC+PHA
IFNγ
(pg/
ml)
MNC MNC+ ASC
MNC+ PHA
MNC+PHA+ASC
ASC:MNC ratio ………………………….. 1:100 1:20 1:10 1:5 ……………………..……………………...……..1:100 1:20 1:10 1:5
*
n.s.
0
6,000
12,000
18,000
24,000
MNC MNC+ASC MNC+PHA
IL-6
(pg/
ml)
*** ***
MNC MNC+ ASC
MNC+ PHA
MNC+PHA+ASC MNC MNC+ ASC
MNC+ PHA
MNC+PHA+ASC
ASC:MNC ratio …………....……….. 1:100 1:20 1:10 1:5 ……………………………………….…..1:100 1:20 1:10 1:5 ……...……………………………………..1:100 1:20 1:10 1:5
MNC MNC+ ASC
MNC+ PHA
MNC+PHA+ASC
Page 32 of 45Diabetes

Figure 2
SVF from lean donors SVF from obese donors
0
400
800
1200
- PHA 0
400
800
1200
- PHA
Concen
tra*
on (p
g/ml)
*
**
TNFα
IL-‐17A A
0
800
1600
2400
mnc mnc+pha mnc+asc mnc+asc+pha
obese ASC
lean ASC
0
800
1600
2400
mnc mnc+pha mnc+asc mnc+asc+pha
obese MNC
lean MNC
IL-‐17A
pg/ml
IL-‐17A
pg/ml
MNC+ASC MNC+ASC +PHA
MNC MNC+PHA MNC+ASC MNC+ASC +PHA
MNC MNC+PHA
*
n.s.
B C
Concen
tra*
on (p
g/ml)
Page 33 of 45 Diabetes

Figure 3
-
+ Autologous ASC
n.s. *
A B
- PHA anti-CD3/CD28
+ASC
-
0
300
600
900
1200
Effector PHA A/CD3-‐28
IL-1
7A (p
g/m
l)
n.s.
* **
C D E
IL-1
7A (p
g/m
l)
0
250
500
750 * CD14- MNC MNC
ASC MNC MNC+ASC
PHA - + - + - +
***
0
250
500
750 IL
-1β
(pg/
ml)
ASC MNC MNC+ASC
PHA - + - + - +
CD14- MNC MNC
IL-6
(ng/
ml)
0
8
16
24
ASC MNC MNC+ASC
PHA - + - + - +
CD14- MNC MNC
0
100
200
300
MNC+PHA
IL-1
7A (p
g/m
l)
+ Allogeneic ASC
Page 34 of 45Diabetes

Figure 4
MNC MNC+ PHA
-
+ASC
+ASC in transwell
A -
+CM
+ASC
MNC MNC+ PHA
B
0
300
600
900
IL-1
7A (p
g/m
l)
0
300
600
900
MNC MNC+PHA
*
*
*
**
IL-1
7A (p
g/m
l)
0 20 40 60 80
100 120
MNC+ASC+PHA
IL-1
7A, %
of u
ntre
ated
c
o-cu
lture
s
-
+anti-CD54 (ICAM-1)
** C
Page 35 of 45 Diabetes

Figure 5
0
200
400
600
MNC
MNC+ASC
MNC+PHA
MNC+ASC+PHA
IL-1
7A (p
g/m
l)
-
+ IL-1β Ab
*
MNC MNC+PHA
MNC+ASC MNC+PHA +ASC
A
0
200
400
600
MNC MNC+ASC MNC+PHA MNC+ASC+PHA
IL-1
7A (p
g/m
l)
-
+ Z-YVAD-fmk ***
MNC MNC+PHA
MNC+ASC MNC+PHA +ASC
C
0
200
400
600
IL-1
7A (p
g/m
l) -
+ IL-6R Ab
n.s.
MNC MNC+PHA
MNC+ASC MNC+PHA +ASC
B
0
40
80
120
MNC MNC+ASC MNC+PHA MNC+ASC+PHA
D
MNC MNC+PHA
MNC+ASC MNC+PHA +ASC
Cas
pase
act
ivity
, A.U
. *
Page 36 of 45Diabetes

Figure 6
0
600
1200
1800
1 2 3 4
MNC MNC+PHA
MNC+ASC MNC+PHA +ASC
-
+ Wort
*** IL
-17A
(pg/
ml)
A B
75
50
100
150
Akt pAktSer473
MW, kDa
PHA + + + + + + Wort. + +
MNC MNC+ASC MNC MNC+ASC
*
0
200
400
600
800
1 2 3 4
IL-1
7A (p
g/m
l)
C * MNC+ASC
Akt
pAktSer473
pSTAT3
STAT3
PHA + + + Wort. + STAT 3 inh. +
D
STAT3 inh., µM 0 20 50 100
Page 37 of 45 Diabetes

IL17A IL17F
IL17-p1 IL17-p3 IL17-p4
A
B
0!0.5!
1!1.5!
2!2.5!
3!
C 6h PHA 6h ASC 6h PHA + ASC
STAT
3 bi
ndin
g to
p1-
p4!
(Con
trol =
1)!
* p=0.001 vs C
* p=0.036 vs C
0!0.5!
1!1.5!
2!2.5!
3!
C 6h PHA 6h ASC 6h PHA + ASC
STAT
5 bi
ndin
g to
p1-
p4!
(Con
trol =
1)!
* p=0.03 vs C
Figure 7
chr6:52,045,000-52,110,000
0
0.5
1
1.5
2
1 2 3 4 STA
T3/S
TAT5
bin
ding
C 6h PHA 6h ASC 6h PHA +ASC
C
Page 38 of 45Diabetes
0 20 40 60 80
100 120
ASC Adipocyte + MNC-‐CM + [MNC+ ASC]-‐CM + [MNC+PHA]-‐CM + [MNC+ASC+ PHA]-‐CM
0.0
0.5
1.0
1.5
2.0
2.5
ASC Adipocyte + MNC-‐CM + [MNC+ ASC]-‐CM + [MNC+PHA]-‐CM + [MNC+ASC+ PHA]-‐CM
mR
NA
FAB
P4/
PP
IF, A
.U.
mR
NA
PPA
Rγ/
PP
IF, A
.U. ** ***
*** **
0
5
10
15
20
25
ASC Adipocyte + MNC-‐CM + [MNC+ ASC]-‐CM + [MNC+PHA]-‐CM + [MNC+ASC+ PHA]-‐CM
mR
NA
Adi
poQ
/PP
IF, A
.U. **
**
0
1
2
3
4
5
ASC Adipocyte + MNC-‐CM + [MNC+ ASC]-‐CM + [MNC+PHA]-‐CM + [MNC+ASC+ PHA]-‐CM
mR
NA
Lep
tin/P
PIF
, A.U
.
MNC ASC PHA
C.M.
+ + + + + + + +
ASC Adipocytes
MNC ASC PHA
C.M.
+ + + + + + + +
ASC Adipocytes
n.s.
Figure 8 (A,B)
50 pAktSer473
MNC ASC PHA
+ + + + + + + +
+ + + + + + + +
50 Tubulin
Insulin No insulin
50 Akt
A
B MW, kDa
Page 39 of 45 Diabetes

Figure 8 (C,D)
0
0.05
0.1
0.15
0.2
0.25
Adipocyte +MNC-CM + [MNC+CSA]-CM + [MNC+PHA]-CM + [MNC+ASC+PHA]-CM
*
MNC ASC PHA
+ + + + + + + +
pAK
T / T
otal
Akt
, A.U
. C
D
0
5
10
15
ASC ASC + 10 nM ins ASC + iso ASC + iso +ins (1nM) ASC + iso +ins (10nM) 0
5
10
15
ASC ASC + 10 nM ins ASC + iso ASC + iso +ins (1nM) ASC + iso +ins (10nM)
Gly
cero
l rel
ease
, µm
oles
/mg
prot
ein
Insulin, nM 0 10 0 1 10 0 10 0 1 10 IPT - - + + + - - + + +
Page 40 of 45Diabetes

Supernatant: CMN+ASC+PHA. A510 nm=1,401
Supernatant: CMN+PHA. A510 nm=1,317
Supplementary Figure 1
A B
C D
No supernatant. A510 nm=1,203
Alizarin red staining
Page 41 of 45 Diabetes

SVF ob/ob mice
0
75
150
225
300
control control PHA diab (HFD) diab (HFD) PHA
AT of HFD mice
IL-‐17A
(pg
/ml)
Chow HFD
-‐
+ PHA
0
25
50
75
100
WTN WTN + PHA obn obn+pha
IL-‐17A
(pg
/ml)
Wt Ob/Ob
-‐
+ PHA
* *
Supplementary Figure 2
Page 42 of 45Diabetes

*
IL-2
(p
g/m
l)
Supplementary Figure 3
Page 43 of 45 Diabetes
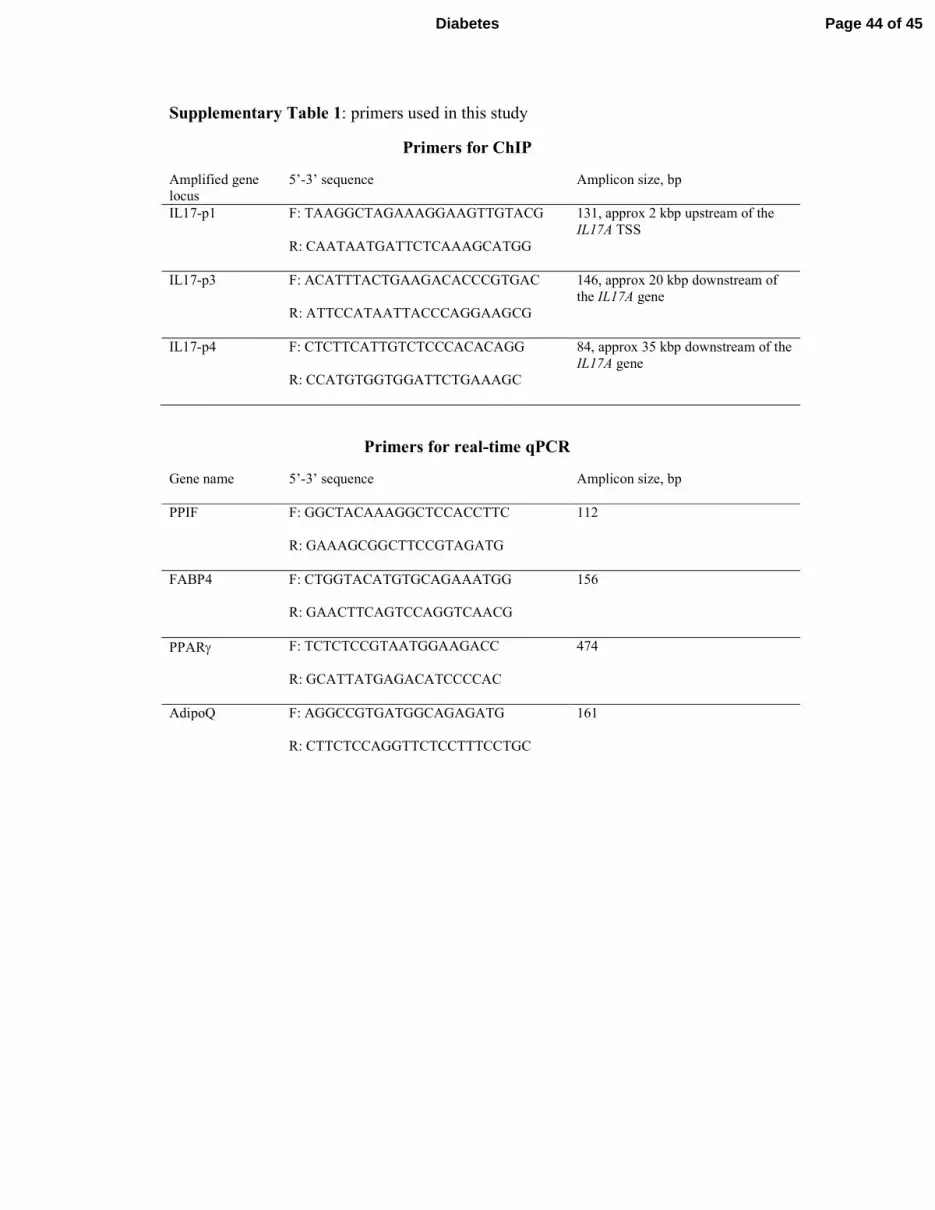
Supplementary Table 1: primers used in this study
Primers for ChIP
Amplified gene
locus
5’-3’ sequence Amplicon size, bp
IL17-p1 F: TAAGGCTAGAAAGGAAGTTGTACG 131, approx 2 kbp upstream of the
IL17A TSS
R: CAATAATGATTCTCAAAGCATGG
IL17-p3 F: ACATTTACTGAAGACACCCGTGAC 146, approx 20 kbp downstream of
the IL17A gene
R: ATTCCATAATTACCCAGGAAGCG
IL17-p4 F: CTCTTCATTGTCTCCCACACAGG 84, approx 35 kbp downstream of the
IL17A gene
R: CCATGTGGTGGATTCTGAAAGC
Primers for real-time qPCR
Gene name 5’-3’ sequence
Amplicon size, bp
PPIF F: GGCTACAAAGGCTCCACCTTC
112
R: GAAAGCGGCTTCCGTAGATG
FABP4 F: CTGGTACATGTGCAGAAATGG
156
R: GAACTTCAGTCCAGGTCAACG
PPARγ F: TCTCTCCGTAATGGAAGACC
474
R: GCATTATGAGACATCCCCAC
AdipoQ F: AGGCCGTGATGGCAGAGATG
161
R: CTTCTCCAGGTTCTCCTTTCCTGC
Page 44 of 45Diabetes
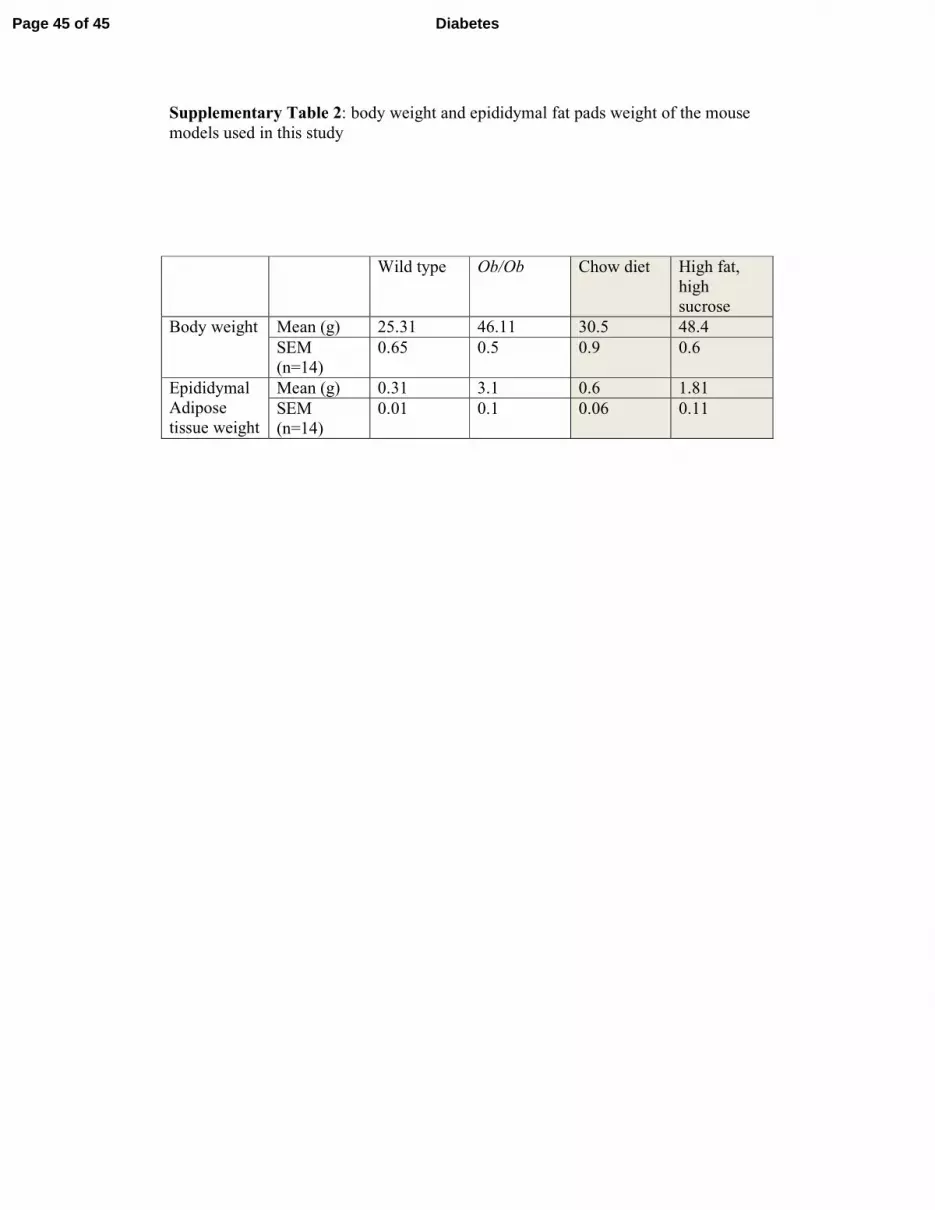
Supplementary Table 2: body weight and epididymal fat pads weight of the mouse
models used in this study
Wild type Ob/Ob Chow diet High fat,
high
sucrose
Body weight Mean (g) 25.31 46.11 30.5 48.4
SEM
(n=14)
0.65 0.5 0.9 0.6
Epididymal
Adipose
tissue weight
Mean (g) 0.31 3.1 0.6 1.81
SEM
(n=14)
0.01 0.1 0.06 0.11
Page 45 of 45 Diabetes