MicroRNA expression profiling reveals the potential function of microRNA-31 in chordomas
Upload
independentCategory
view
3download
0
Ortega et al. Clinical Epigenetics (2015) 7:49 DOI 10.1186/s13148-015-0083-3
RESEARCH Open Access
Inflammation triggers specific microRNA profilesin human adipocytes and macrophages and intheir supernatantsFrancisco José Ortega1,2*, María Moreno1, Josep María Mercader3, José María Moreno-Navarrete1,2,Núria Fuentes-Batllevell1, Mònica Sabater1, Wifredo Ricart1,2 and José Manuel Fernández-Real1,2*
Abstract
Background: The relevance of microRNAs (miRNAs) in adipose tissue is increasingly recognized, being intrinsicallylinked to different pathways, including obesity-related inflammation. In this study, we aimed to characterize thechanges induced by inflammation on the miRNA pattern of human adipocytes and macrophages. Therefore, anextensive profile of 754 common miRNAs was assessed in cells (human primary mature adipocytes, and themacrophage-like cell line THP-1) and in their supernatants (SN) using TaqMan low-density arrays. These profiles wereevaluated at the baseline and after administration of lipopolysaccharide (LPS, 10 ng/ml) and LPS-conditionedmedium from M1 macrophages (MCM, 5%). The miRNAs that experienced the most dramatic changes were studiedin subcutaneous human adipose tissue before and approximately 2 years after bariatric surgery-induced weight loss.
Results: Differentiated adipocytes expressed 169 miRNAs, being 85 detectable in the SN. In M1 macrophages, 183miRNAs were detected, being 106 also present in the SN. Inflammation led to an increased number of miRNAsdetectable in cells and in their SNs in both adipocytes (+8.3% and +24.7%) and M1 macrophages (+1.4% and +5%,respectively). Indeed, under inflammatory conditions, adipocytes and M1 macrophages shared the expression of147 (+9%) miRNAs, and 100 (+41%) common miRNAs were found in their SNs. Twelve of these factors were alsolinked to inflammation in whole adipose tissue from obese subjects. Interestingly, miR-221 (2-fold, P = 0.002), miR-222(2.5-fold, P = 0.04), and miR-155 (5-fold, P = 0.015) were increased in inflamed adipocytes and in their SNs (15-, 6-, and4-fold, respectively, all P < 0.001). Furthermore, their expressions in human adipose tissue concordantly decreased afterweight loss (−51%, P = 0.003, −49%, P = 0.03, and −54.4%, P = 0.005, respectively).
Conclusions: Inflammation induces a specific miRNA pattern in adipocytes and M1 macrophages, with impact on thephysiopathology of obesity-induced inflammation of adipose tissue. The crosstalk between cells should be investigatedfurther.
Keywords: microRNAs, RT-PCR, Profiling, Macrophages, Adipocytes, Adipose tissue, Obesity, Inflammation
BackgroundObese adipose tissue (AT) is a critical player in chroniclow-grade systemic inflammation, with impact on insulinresistance through the secretion of hormones, adipocy-tokines [1], fatty acids [2], and (potentially) microRNAs[3] that modulate different metabolic pathways in AT it-self, liver, skeletal muscle, and in the vasculature [4].
* Correspondence: [email protected]; [email protected] of Diabetes, Endocrinology and Nutrition (UDEN), Institutd’Investigació Biomédica de Girona (IdIBGi), Avinguda de França s/n, 17007Girona, SpainFull list of author information is available at the end of the article
© 2015 Ortega et al.; licensee Biomed Central.Commons Attribution License (http://creativecreproduction in any medium, provided the orDedication waiver (http://creativecommons.orunless otherwise stated.
Differentiated adipocytes release a great amount of in-flammatory cytokines and chemokines (the so-calledadipokines) in response to activated macrophages [5,6].Weight loss is known to result in reduced macrophage in-filtration in parallel to decreased expression of pro-inflammatory genes [7,8]. Many of these factors are ableto maintain sustained subclinical inflammation in obeseAT, and activate other immune cells [9,10].MicroRNAs (miRNAs) are non-coding RNAs that
modulate gene expression through translational repres-sion of specific target genes [11]. Many of these small
This is an Open Access article distributed under the terms of the Creativeommons.org/licenses/by/4.0), which permits unrestricted use, distribution, andiginal work is properly credited. The Creative Commons Public Domaing/publicdomain/zero/1.0/) applies to the data made available in this article,

Ortega et al. Clinical Epigenetics (2015) 7:49 Page 2 of 10
RNAs are found in human AT, being differentiallyexpressed in obese AT [12]. The close association be-tween the miRNA expression profile in tissues andmetabolic diseases such as obesity and type 2 diabetes isbeing increasingly recognized [13]. Several miRNAs areinvolved in adipocyte differentiation [14] and fat cell be-havior [15]. So far, conditional disruption of Dicer, a keymiRNA processing, may lead to impaired adipogenesisand fat mass shrinkage [16], reinforcing the relevance ofmiRNAs in AT development, inflammation, and metab-olism. Not only tissue miRNAs play an important role,since specific circulating miRNA profiles exist in plasmafrom obese subjects [17], suggesting that some of thesefactors may modulate the systemic metabolic response.In this study, we aimed to evaluate the main effects ofinflammation on the miRNA profile of differentiated hu-man adipocytes, the macrophage-like cell line THP-1(M1), and in their supernatants (SNs). Then, the miRNAsthat experienced the most dramatic changes were evalu-ated in human subcutaneous AT before and after bariatricsurgery-induced weight loss and the subsequent metabolicimprovement and decreased inflammation.
Figure 1 MicroRNA profiles and cluster analysis. MicroRNA profiles in cellsanalysis according to the quality of all determinations. Green (controls) forunder normal conditions. Inflamed (Inf) cells are shown in red.
ResultsComprehensive miRNA profiling in macrophages andadipocytesWe measured the expression (cells) and the presenceinto the supernatant (SN) of 754 common mature miR-NAs in differentiated human subcutaneous adipocytesand the macrophage-like THP-1 cell line (M1) at thebaseline and upon inflammation (Figure 1). Differenti-ated adipocytes expressed 169 miRNAs (22.3% of thetested mature miRNAs), and 85 (11.2%) of these factorswere found in the SN (Figure 1 and Additional file 1).Interestingly, changes regarding miRNA expression pat-terns and their concentration in SN clearly identifiedthe inflammatory effects in isolated mature adipocytescultured and differentiated in vitro (Figure 1). Indeed,some miRNAs became undetectable (miR-1274B, miR-572, and miR-766), while others appeared de novo incells (miR-140-5p, miR-222*, miR-376c, miR-411, andmiR-146a) and their SNs (miR-146a, miR-146b, miR-19a, miR-223*, miR-425, and miR-9*) upon MCM-induced inflammation (Figure 2). Overall, treatmentwith MCM increased the number of miRNAs expressed
and their supernatants (SN) after removing Ct values ≥35, and clusterdifferentiated adipocytes (MAs) and M1 macrophages (M1) cultured

Figure 2 Major variations in miRNA profiles. Major variations in miRNA detection in cells and supernatants (SN) upon inflammation (Inf).
Ortega et al. Clinical Epigenetics (2015) 7:49 Page 3 of 10
in adipocytes (+8.3%) and in their SN (+24.7%), concomi-tantly with increased IL-6 (79-fold change, P = 0.004) andTNFα (14-fold change, P < 0.0001) gene expression(Table 1).On the other hand, expression of 183 miRNAs (24%)
and the presence in the SN of 106 (14%) were detectedin M1 macrophages. Inflammatory stimuli with LPS in-creased the number of miRNAs expressed (+1.4% withrespect to basal) and found in the SN (+5%) of differen-tiated M1 macrophages. Among them, miR-628-3p andRNU44 (detectable in SN at the basal level but not aftertreatment with LPS) and miR-1243, miR-193b*, andmiR-597 (detectable in SN upon inflammation, Figure 2)changed their detection levels after stimulation. How-ever, these qualitative changes did not reach significanceenough to discriminate activated cells from controls(Figure 1). Indeed, the inflammatory reaction of LPS-stimulated M1 macrophages, as inferred from changesin the expression of well-recognized pro-inflammatorygenes such as IL-6 and TNFα (17.7-fold change, P =0.002, and 4.9-fold change, P = 0.001, respectively), didnot show such great impact, when compared to thechanges accounted in mature adipocytes upon inflam-mation (Table 1). The lack of major differences in stimu-lated M1 macrophages was more probably due to thetransient basal inflammatory state that the induction ofthe mature type 1 macrophage-like state M1 (by treatingTHP-1 cells with phorbol 12-myristate 13-acetate) pro-motes per se. Nonetheless, under basal conditions adi-pocytes and M1 macrophages shared expression of 135,and 71 common mature miRNAs were found in SNsfrom both cell lines. Upon inflammatory stimuli, dif-ferentiated adipocytes and isolated M1 macrophages
expressed 147 (+9%) common mature miRNA species,and 100 (+41%) of these factors were found in the SN(Additional file 2: Table S1).
Quantitative changes upon inflammationWhen comparing normalized values of quantifiable miR-NAs (Cts <35 in all replicates) either in cells or the SNsof M1 macrophages and isolated adipocytes following ornot treatment (inflammation vs. control), significantchanges in 18 mature miRNAs were identified in ma-ture adipocytes and 24 in M1 macrophages (Table 1).Among them, increased expression of miR-221 (2-fold,P = 0.002), miR-222 (2.5-fold, P = 0.04), and miR-155(5-fold, P = 0.015, Figure 3) was found in inflamed adi-pocytes, as well as in the SN (15-, 6-, and 4-foldchanges, respectively, all with P values under 0.001,Figure 3), when compared to control. Other significantchanges in isolated adipocytes included increased expres-sion of miR-132, miR-17, miR-31, miR-93, and miR-345and decreased miR-422a expression. In the SN, increasedconcentrations of miR-19b, miR-92a, miR-342-3p, miR-223, and miR-20a and decreased miR-199a-3p, miR-214,miR-193b, and miR-152 were also identified (Table 1).On the other hand, increased expressions of miR-155
(2.5-fold, P = 0.001) but decreased miR-221 (0.49-fold,P = 0.034) were found in LPS-stimulated M1 macro-phages (Table 1). Although no significant variationswere identified in miR-222, modulation of miR-19a (0.5-fold, P = 0.032, and 2-fold, P = 0.034) and decreased miR-145 in both cells and SNs (0.2-fold, P = 0.005, and 0.14-fold,P = 0.032) were shown in M1 macrophages reacting to LPS(Table 2). Other relevant changes in macrophages includedincreased miR-146a (5-fold change, P < 0.0001), and the
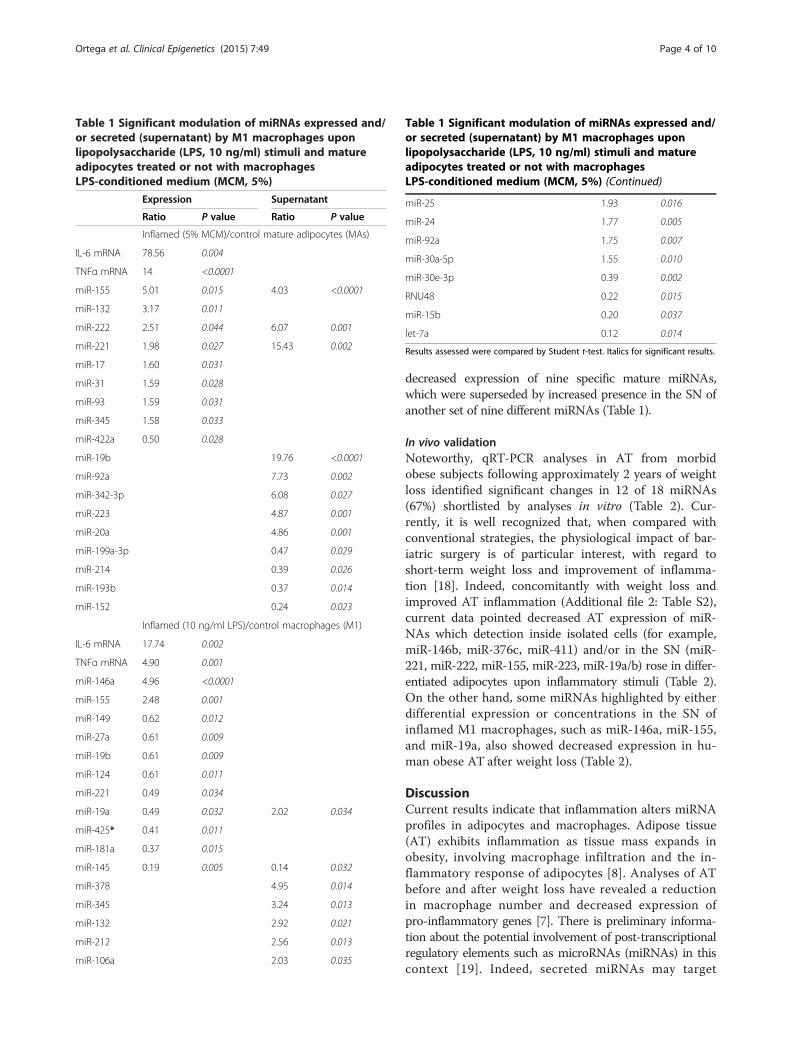
Table 1 Significant modulation of miRNAs expressed and/or secreted (supernatant) by M1 macrophages uponlipopolysaccharide (LPS, 10 ng/ml) stimuli and matureadipocytes treated or not with macrophagesLPS-conditioned medium (MCM, 5%)
Expression Supernatant
Ratio P value Ratio P value
Inflamed (5% MCM)/control mature adipocytes (MAs)
IL-6 mRNA 78.56 0.004
TNFα mRNA 14 <0.0001
miR-155 5.01 0.015 4.03 <0.0001
miR-132 3.17 0.011
miR-222 2.51 0.044 6.07 0.001
miR-221 1.98 0.027 15.43 0.002
miR-17 1.60 0.031
miR-31 1.59 0.028
miR-93 1.59 0.031
miR-345 1.58 0.033
miR-422a 0.50 0.028
miR-19b 19.76 <0.0001
miR-92a 7.73 0.002
miR-342-3p 6.08 0.027
miR-223 4.87 0.001
miR-20a 4.86 0.001
miR-199a-3p 0.47 0.029
miR-214 0.39 0.026
miR-193b 0.37 0.014
miR-152 0.24 0.023
Inflamed (10 ng/ml LPS)/control macrophages (M1)
IL-6 mRNA 17.74 0.002
TNFα mRNA 4.90 0.001
miR-146a 4.96 <0.0001
miR-155 2.48 0.001
miR-149 0.62 0.012
miR-27a 0.61 0.009
miR-19b 0.61 0.009
miR-124 0.61 0.011
miR-221 0.49 0.034
miR-19a 0.49 0.032 2.02 0.034
miR-425* 0.41 0.011
miR-181a 0.37 0.015
miR-145 0.19 0.005 0.14 0.032
miR-378 4.95 0.014
miR-345 3.24 0.013
miR-132 2.92 0.021
miR-212 2.56 0.013
miR-106a 2.03 0.035
Table 1 Significant modulation of miRNAs expressed and/or secreted (supernatant) by M1 macrophages uponlipopolysaccharide (LPS, 10 ng/ml) stimuli and matureadipocytes treated or not with macrophagesLPS-conditioned medium (MCM, 5%) (Continued)
miR-25 1.93 0.016
miR-24 1.77 0.005
miR-92a 1.75 0.007
miR-30a-5p 1.55 0.010
miR-30e-3p 0.39 0.002
RNU48 0.22 0.015
miR-15b 0.20 0.037
let-7a 0.12 0.014
Results assessed were compared by Student t-test. Italics for significant results.
Ortega et al. Clinical Epigenetics (2015) 7:49 Page 4 of 10
decreased expression of nine specific mature miRNAs,which were superseded by increased presence in the SN ofanother set of nine different miRNAs (Table 1).
In vivo validationNoteworthy, qRT-PCR analyses in AT from morbidobese subjects following approximately 2 years of weightloss identified significant changes in 12 of 18 miRNAs(67%) shortlisted by analyses in vitro (Table 2). Cur-rently, it is well recognized that, when compared withconventional strategies, the physiological impact of bar-iatric surgery is of particular interest, with regard toshort-term weight loss and improvement of inflamma-tion [18]. Indeed, concomitantly with weight loss andimproved AT inflammation (Additional file 2: Table S2),current data pointed decreased AT expression of miR-NAs which detection inside isolated cells (for example,miR-146b, miR-376c, miR-411) and/or in the SN (miR-221, miR-222, miR-155, miR-223, miR-19a/b) rose in differ-entiated adipocytes upon inflammatory stimuli (Table 2).On the other hand, some miRNAs highlighted by eitherdifferential expression or concentrations in the SN ofinflamed M1 macrophages, such as miR-146a, miR-155,and miR-19a, also showed decreased expression in hu-man obese AT after weight loss (Table 2).
DiscussionCurrent results indicate that inflammation alters miRNAprofiles in adipocytes and macrophages. Adipose tissue(AT) exhibits inflammation as tissue mass expands inobesity, involving macrophage infiltration and the in-flammatory response of adipocytes [8]. Analyses of ATbefore and after weight loss have revealed a reductionin macrophage number and decreased expression ofpro-inflammatory genes [7]. There is preliminary informa-tion about the potential involvement of post-transcriptionalregulatory elements such as microRNAs (miRNAs) in thiscontext [19]. Indeed, secreted miRNAs may target
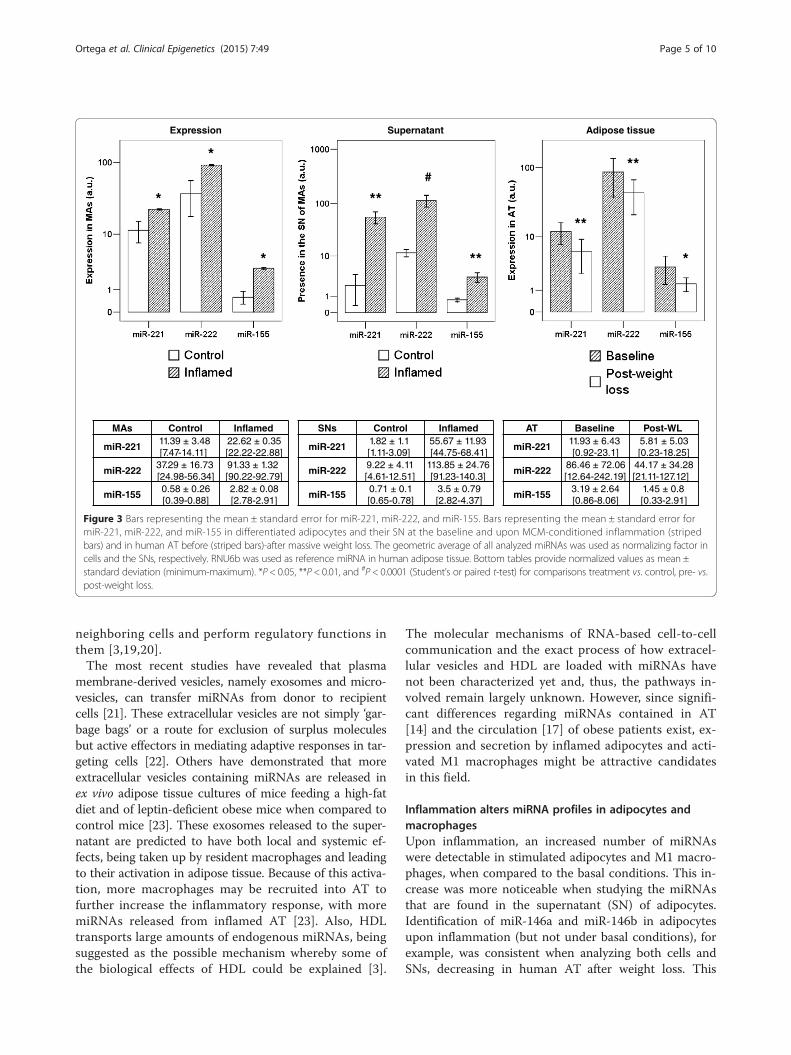
Figure 3 Bars representing the mean ± standard error for miR-221, miR-222, and miR-155. Bars representing the mean ± standard error formiR-221, miR-222, and miR-155 in differentiated adipocytes and their SN at the baseline and upon MCM-conditioned inflammation (stripedbars) and in human AT before (striped bars)-after massive weight loss. The geometric average of all analyzed miRNAs was used as normalizing factor incells and the SNs, respectively. RNU6b was used as reference miRNA in human adipose tissue. Bottom tables provide normalized values as mean ±standard deviation (minimum-maximum). *P < 0.05, **P < 0.01, and #P < 0.0001 (Student’s or paired t-test) for comparisons treatment vs. control, pre- vs.post-weight loss.
Ortega et al. Clinical Epigenetics (2015) 7:49 Page 5 of 10
neighboring cells and perform regulatory functions inthem [3,19,20].The most recent studies have revealed that plasma
membrane-derived vesicles, namely exosomes and micro-vesicles, can transfer miRNAs from donor to recipientcells [21]. These extracellular vesicles are not simply ‘gar-bage bags’ or a route for exclusion of surplus moleculesbut active effectors in mediating adaptive responses in tar-geting cells [22]. Others have demonstrated that moreextracellular vesicles containing miRNAs are released inex vivo adipose tissue cultures of mice feeding a high-fatdiet and of leptin-deficient obese mice when compared tocontrol mice [23]. These exosomes released to the super-natant are predicted to have both local and systemic ef-fects, being taken up by resident macrophages and leadingto their activation in adipose tissue. Because of this activa-tion, more macrophages may be recruited into AT tofurther increase the inflammatory response, with moremiRNAs released from inflamed AT [23]. Also, HDLtransports large amounts of endogenous miRNAs, beingsuggested as the possible mechanism whereby some ofthe biological effects of HDL could be explained [3].
The molecular mechanisms of RNA-based cell-to-cellcommunication and the exact process of how extracel-lular vesicles and HDL are loaded with miRNAs havenot been characterized yet and, thus, the pathways in-volved remain largely unknown. However, since signifi-cant differences regarding miRNAs contained in AT[14] and the circulation [17] of obese patients exist, ex-pression and secretion by inflamed adipocytes and acti-vated M1 macrophages might be attractive candidatesin this field.
Inflammation alters miRNA profiles in adipocytes andmacrophagesUpon inflammation, an increased number of miRNAswere detectable in stimulated adipocytes and M1 macro-phages, when compared to the basal conditions. This in-crease was more noticeable when studying the miRNAsthat are found in the supernatant (SN) of adipocytes.Identification of miR-146a and miR-146b in adipocytesupon inflammation (but not under basal conditions), forexample, was consistent when analyzing both cells andSNs, decreasing in human AT after weight loss. This
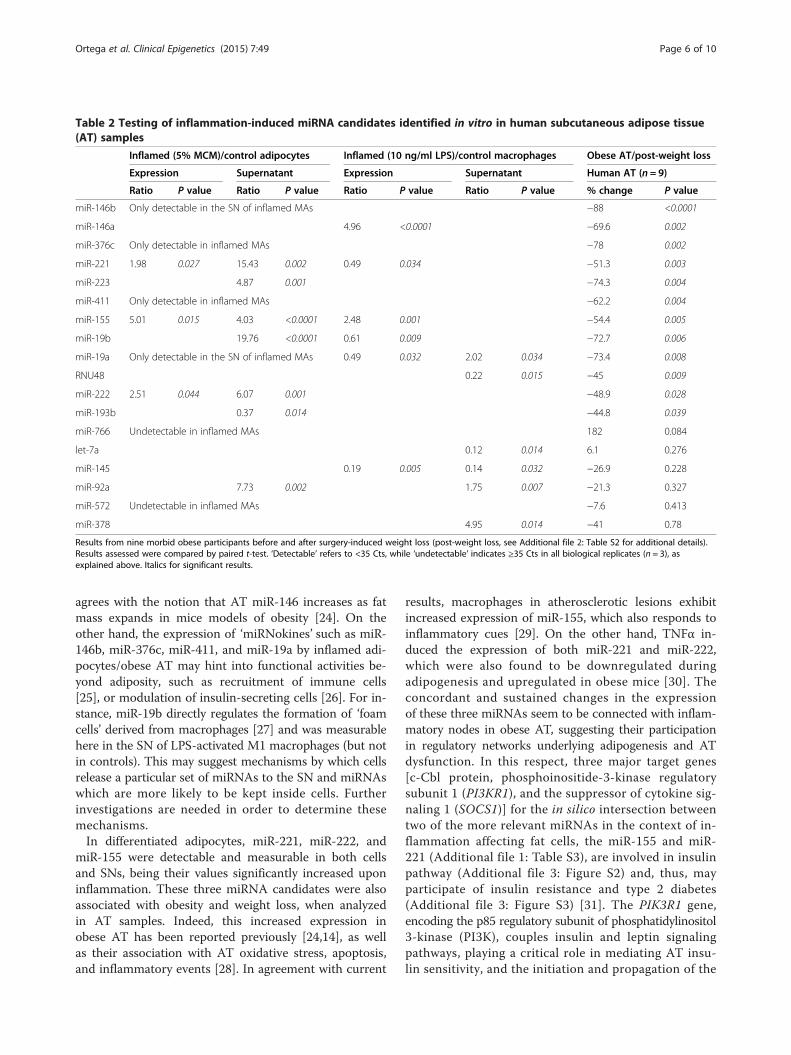
Table 2 Testing of inflammation-induced miRNA candidates identified in vitro in human subcutaneous adipose tissue(AT) samples
Inflamed (5% MCM)/control adipocytes Inflamed (10 ng/ml LPS)/control macrophages Obese AT/post-weight loss
Expression Supernatant Expression Supernatant Human AT (n = 9)
Ratio P value Ratio P value Ratio P value Ratio P value % change P value
miR-146b Only detectable in the SN of inflamed MAs −88 <0.0001
miR-146a 4.96 <0.0001 −69.6 0.002
miR-376c Only detectable in inflamed MAs −78 0.002
miR-221 1.98 0.027 15.43 0.002 0.49 0.034 −51.3 0.003
miR-223 4.87 0.001 −74.3 0.004
miR-411 Only detectable in inflamed MAs −62.2 0.004
miR-155 5.01 0.015 4.03 <0.0001 2.48 0.001 −54.4 0.005
miR-19b 19.76 <0.0001 0.61 0.009 −72.7 0.006
miR-19a Only detectable in the SN of inflamed MAs 0.49 0.032 2.02 0.034 −73.4 0.008
RNU48 0.22 0.015 −45 0.009
miR-222 2.51 0.044 6.07 0.001 −48.9 0.028
miR-193b 0.37 0.014 −44.8 0.039
miR-766 Undetectable in inflamed MAs 182 0.084
let-7a 0.12 0.014 6.1 0.276
miR-145 0.19 0.005 0.14 0.032 −26.9 0.228
miR-92a 7.73 0.002 1.75 0.007 −21.3 0.327
miR-572 Undetectable in inflamed MAs −7.6 0.413
miR-378 4.95 0.014 −41 0.78
Results from nine morbid obese participants before and after surgery-induced weight loss (post-weight loss, see Additional file 2: Table S2 for additional details).Results assessed were compared by paired t-test. ‘Detectable’ refers to <35 Cts, while ‘undetectable’ indicates ≥35 Cts in all biological replicates (n = 3), asexplained above. Italics for significant results.
Ortega et al. Clinical Epigenetics (2015) 7:49 Page 6 of 10
agrees with the notion that AT miR-146 increases as fatmass expands in mice models of obesity [24]. On theother hand, the expression of ‘miRNokines’ such as miR-146b, miR-376c, miR-411, and miR-19a by inflamed adi-pocytes/obese AT may hint into functional activities be-yond adiposity, such as recruitment of immune cells[25], or modulation of insulin-secreting cells [26]. For in-stance, miR-19b directly regulates the formation of ‘foamcells’ derived from macrophages [27] and was measurablehere in the SN of LPS-activated M1 macrophages (but notin controls). This may suggest mechanisms by which cellsrelease a particular set of miRNAs to the SN and miRNAswhich are more likely to be kept inside cells. Furtherinvestigations are needed in order to determine thesemechanisms.In differentiated adipocytes, miR-221, miR-222, and
miR-155 were detectable and measurable in both cellsand SNs, being their values significantly increased uponinflammation. These three miRNA candidates were alsoassociated with obesity and weight loss, when analyzedin AT samples. Indeed, this increased expression inobese AT has been reported previously [24,14], as wellas their association with AT oxidative stress, apoptosis,and inflammatory events [28]. In agreement with current
results, macrophages in atherosclerotic lesions exhibitincreased expression of miR-155, which also responds toinflammatory cues [29]. On the other hand, TNFα in-duced the expression of both miR-221 and miR-222,which were also found to be downregulated duringadipogenesis and upregulated in obese mice [30]. Theconcordant and sustained changes in the expressionof these three miRNAs seem to be connected with inflam-matory nodes in obese AT, suggesting their participationin regulatory networks underlying adipogenesis and ATdysfunction. In this respect, three major target genes[c-Cbl protein, phosphoinositide-3-kinase regulatorysubunit 1 (PI3KR1), and the suppressor of cytokine sig-naling 1 (SOCS1)] for the in silico intersection betweentwo of the more relevant miRNAs in the context of in-flammation affecting fat cells, the miR-155 and miR-221 (Additional file 1: Table S3), are involved in insulinpathway (Additional file 3: Figure S2) and, thus, mayparticipate of insulin resistance and type 2 diabetes(Additional file 3: Figure S3) [31]. The PIK3R1 gene,encoding the p85 regulatory subunit of phosphatidylinositol3-kinase (PI3K), couples insulin and leptin signalingpathways, playing a critical role in mediating AT insu-lin sensitivity, and the initiation and propagation of the
Ortega et al. Clinical Epigenetics (2015) 7:49 Page 7 of 10
inflammatory response [32]. Also, the proto-oncogeneCasitas b-lineage lymphoma (CBL) plays an importantrole in AT hyperplasia and insulin action, independ-ently of the PI3K/Akt pathway [33]. The ability of insu-lin to stimulate glucose uptake relies on a complexsignaling cascade that leads to the translocation of glu-cose receptors to the membrane. Thus, the modulationof expression and secretion of these miRNAs in AT,particularly in adipocytes, may contribute to the im-provement of insulin sensitivity following massive fatmass loss and decreased inflammation. Understandingthe miRNA profiles associated with different pathwaysfor macrophage activation could also provide a newspectrum of biomarkers for identification and a poten-tial therapeutic approach to mitigate entry into tissuesand the onset of inflammatory diseases.
miRNA profiles in macrophages and adipocytes and their SNsType 1 macrophage-like human monocytes and humansubcutaneous differentiated adipocytes share expressionof several miRNAs, being this expression enhanced inthe former. The data agrees with accumulating evidencethat adipocytes and immune cells show common fea-tures, with expression of genes previously considered tobe specific of one lineage [34], and the concept that pro-inflammatory components are not only secreted by thestromal-vascular cell fraction but also by differentiatedadipocytes [35]. Notably, when comparing inflamed adi-pocytes and M1 macrophages, the number of miRNAsthat were only detectable in adipocytes or in macro-phages decreased, especially when analyzing their SNs.Thus, the similitude between mature adipocytes andmacrophages [36] becomes clearer through concomitantchanges in miRNA expression pattern and the miRNAsfound in the SN when inflammation appears.
ConclusionsCurrent results highlight the existence of cell-dependentmiRNA profiles inside and in the SN of isolated adipo-cytes and M1 macrophages. Obesity-related inflamma-tion increases the production of miRNAs and alters theexpression pattern in both cells and SNs. UnderstandingmiRNA profiles associated with different pathways of ad-ipocytes and macrophages activation may provide a newspectrum of biomarkers and therapeutic approaches tomitigate macrophage infiltration in obese AT and the onsetof obesity-associated inflammation. Variations regardingmiR-221/222 and miR-155, for example, may participatein the crosstalk between obesity-related inflammation,insulin resistance, and other obesity-associated morbid-ities. This work paves the way for future clinical and cel-lular studies aimed at determining the impact of thesemolecular adaptations on the development of obesity-related inflammation and such deleterious effects.
MethodsCell cultureThe human monocyte cell line THP-1 (ATCC®) was cul-tured in RPMI 1640 medium containing 10% fetal bovineserum, 5 mM glucose, 2 mM L-glutamine, 50 mg/ml gen-tamicin, and 20 mM HEPES at 37°C in a humidified 5%CO2 and 95°C air atmosphere. The mature type 1macrophage-like state (M1) was induced by treatingTHP-1 cells with 0.162 mM of phorbol 12-myristate13-acetate (PMA) for 24 h. Differentiated, plastic-adherentcells were washed with cold Dulbecco’s phosphate-bufferedsaline (Sigma Chemical Co., St. Louis, MO, USA) and incu-bated with fresh medium without PMA. Differentiated M1macrophages were treated with fresh medium and freshmedium containing 10 ng/ml of lipopolysaccharides (LPS,Sigma Chemical Co.) for an additional 24-h period (threebiological replicates per treatment), as previously described[5]. Then, the medium was collected and centrifuged at400 · g for 5 min, diluted with adipocyte medium (Zen-Bio,Inc., Research Triangle Park, NC, USA), and used asmacrophage LPS-conditioned media (MCM, 5%) to induceinflammation in differentiated human adipocytes (MAs).Human subcutaneous preadipocytes from a non-diabetic
Caucasian male with body mass index (BMI) <30 andage <40 (Zen-Bio, Inc.) were cultured with the Prea-dipocytes Medium (PM, Zen-Bio, Inc.) in a humidified37°C incubator with 5% CO2 and 95°C air atmosphere.Twenty-four hours after plating, cells were checked forconfluence and differentiated using the commerciallyavailable Differentiation Medium (DM, Zen-Bio, Inc.)following manufacturer’s instructions. Two weeks afterinitializing differentiation, cells appeared rounded withlarge lipid droplets in the cytoplasm. Cells were consi-dered mature adipocytes and incubated with fresh adi-pocytes media (control) or fresh media containing 5%MCM, to mimic the inflammatory milieu of obese AT.After 24 h of treatment, the supernatants were centri-fuged at 400 · g for 5 min, and both pellets and supernatantswere removed and stored at −80°C for future analysis. Threebiological replicates per treatment were performed andanalyzed (Additional file 3: Figure S1 - Workflow diagram).
Subject recruitmentExpression and validation of the miRNAs shortlistedin vitro was assessed in subcutaneous abdominal adiposetissue (AT) from nine morbidly obese women before andafter approximately 2 years of surgery-induced weightloss (BMI = 43.4 ± 5 kg/m2, age = 48 ± 10 years [mean ±SD], Additional file 2: Table S2). These volunteers wererecruited at the Department of Diabetes, Endocrinologyand Nutrition and the Department of Surgery of theHospital ‘Dr Josep Trueta’ of Girona (Girona, Spain). Allsubjects provided written informed consent before enter-ing the study, were of Caucasian origin, and reported
Ortega et al. Clinical Epigenetics (2015) 7:49 Page 8 of 10
that their body weight was stable for at least 3 monthsbefore entering the study. No systemic diseases otherthan obesity were reported. All participants were free ofany infections in the previous month before entering thestudy. Liver and thyroid dysfunction were specifically ex-cluded by biochemical work-up. Other exclusion criteriaincluded the following: 1) clinically significant hepatic,neurological, or other major systemic disease, includingmalignancy, 2) history of drug or alcohol abuse or serumtransaminase activity more than twice the upper limit ofnormal, 3) an elevated serum creatinine concentration,4) acute major cardiovascular event in the previous 6months, 5) acute illnesses and current evidence of high-grade chronic inflammatory or infective diseases, and 6)mental illness rendering the subjects unable to understandthe nature, scope, and possible consequences of this study.The study protocol was approved by the Ethics Commit-tee and the Committee for Clinical investigation (CEIC) ofthe Hospital ‘Dr. Josep Trueta’ of Girona, so we certifythat all applicable institutional regulations concerning theethical use of information and samples from human sub-jects were followed during this research.
RNA extractionTotal RNA, including small RNA species such as miR-NAs, was extracted and purified from AT and cells(macrophages and adipocytes) using miRNeasy® MiniKit (QIAGEN, Gaithersburg, MD, USA). AT samples(approximately 150 μg) and cells were homogenized in0.6 mL of QIAzol® Lysis Reagent (QIAGEN), a mono-phasic solution of phenol and guanidine thiocyanatewhich facilitates sample disaggregation and inhibitsRNAses. After addition of chloroform (0.4 volumes),the homogenate is separated into aqueous and organicphases by centrifugation (15 min at 12,000 · g and 4°C).Then, the upper aqueous RNA-rich phase was isolatedand ethanol absolute (1.5 volumes) was added to pro-vide appropriate binding conditions for all RNA mole-cules, including miRNAs. The sample was applied to asilica-membrane RNeasy spin columns, where RNAbinds to the membrane while phenols and other com-pounds are washed away. High-quality RNA was finallyeluted in 30 μL of RNAse-free water. Final RNA con-centrations were assessed with a Nanodrop ND-1000Spectrophotometer (Thermo Fischer Scientific, Wilmington,DE, USA). The integrity was checked with the Nano lab-on-a-chip assay for total eukaryotic RNA using Bioanalyzer2100 (Agilent Technologies, Palo Alto, CA, USA).miRNA profiles were assessed in cell supernatant (SN)
following standard procedures previously optimized forplasma [17]. First, floating cells were removed from themedia by an additional centrifugation of 2,000 · g for 5min at 4°C using a laboratory centrifuge (Beckman J-6MInduction Drive Centrifuge, Palo Alto, CA, USA). RNA
extraction from cell media was performed using themirVana PARIS Isolation Kit (Applied Biosystems,Darmstadt, Germany), as previously described [17].
Retrotranscription to cDNA and pre-amplificationA 2,000 ng of total RNA from AT and cell debris and afixed volume of 3 μL of RNA solution from the 40-μLeluate of RNA isolation performed in SN were used asinput into the reverse transcription (RT), using the TaqManmiRNA Reverse Transcription Kit and TaqMan miRNAMultiplex RT Assays, which are required to run theTaqMan Array microRNA Cards (Applied Biosystems).Pre-amplification was performed in RNA samples fromSN using TaqMan PreAmp Master Mix and Megaplex™PreAmp Primers (human pool set A and B), which pro-vided an optional amplification step prior to real-timeanalysis when the RNA sample is limiting. This step ismandatory to provide reliable results in the SN, as wellas in plasma [17].
miRNA profiling using TLDAsTaqMan low-density arrays (TLDAs) for miRNAs, cover-ing a total amount of 754 miRNA species, were appliedto three biological replicates. Real-time (RT)-PCR wascarried out on an Applied Biosystems 7900HT thermo-cycler. Data were analyzed with SDS Relative Quantifica-tion Software version 2.2.2 (Applied Biosystems), withan assigned minimum threshold above the baseline of allassays showing measurable amplifications above back-ground and threshold thermal cycles (Cts) below 35.The geometric average of all analyzed miRNAs was usedas normalizing factor in cells and the SN. Normalizedrelative log10 ratios were used for posterior statisticaltests, as previously described [37].
Analysis of individual miRNAs using TaqMan hydrolysisprobesCommercially available TaqMan hydrolysis probes (Ap-plied Biosystems) were used to assess the expression ofindividual miRNAs in human AT. After RNA extractionand retrotranscription of 2,000 ng of RNA, the productwas diluted (1:100) previous being combined (5 μL) with0.25 μL of TaqMan miRNA hydrolysis probes (20×) and4.75 μL of the LightCycler 480 Probes master mix (2×)(Roche Diagnostics, Barcelona, Spain) to a final volumeof 10 μL. Gene expression was assessed by real-timePCR using the LightCycler® 480 Real-Time PCR System(Roche Diagnostics, Barcelona, Spain) and TaqMantechnology suitable for relative gene expression quantifica-tion following manufacturer’s protocol. RNU6b (NCBI Ac-cession ID#: NR_002752, assay ID#: 4395470) was used asreference miRNA (or endogenous control) in human AT.

Ortega et al. Clinical Epigenetics (2015) 7:49 Page 9 of 10
Gene expressionThree micrograms of total RNA were reverse transcribedto cDNA using High-Capacity cDNA® Archive Kit (AppliedBiosystems, Darmstadt, Germany) according to manu-facturers’ protocols. Commercially available and pre-validated TaqMan® primer/probe sets were used for geneexpression determinations (Applied Biosystems). Ex-pression was assessed by real-time PCR using the Light-Cycler® 480 Real-Time PCR System (Roche Diagnostics,Barcelona, Spain) and TaqMan® technology suitable forrelative gene expression quantification. The reaction wasperformed following manufacturers’ instructions in a finalvolume of 7 μl. The cycle program consisted of an initialdenaturing of 10 min at 95°C then 45 cycles of 15-s dena-turizing phase at 92°C and 1-min annealing and extensionphase at 60°C. Then, the crossing point (Cp) values wereassessed for each amplification curve by the second de-rivative maximum method. ΔCp value was first calculatedby subtracting the Cp value for corresponding endogenouscontrols in each sample from the Cp value for eachsample and target gene. Fold changes compared with theendogenous control were then determined by calculating2−ΔCp, so gene expression results are expressed as expres-sion ratio relative to preselected and validated endogenouscontrol. The commercially available and pre-validatedTaqMan® primer/probe sets used here for gene expressionwere as follows: interleukin 6 (IL-6, Hs00985639_m1),tumor necrosis factor (TNFα, Hs01113624_g1), and leptin(LEP, Hs00174877_m1). Peptidyl-prolyl cis-trans isomer-ase A (PPIA, Hs99999904_m1, also known as cyclophilinA) expressions were assessed as endogenous control ineach reaction and sample. Replicates and positive andnegative controls were included.
Statistical methodsTables were constructed for qualitative evaluation of thenumber and identity of miRNAs shared among all sam-ples and cells. Tables for each group of treatments indi-cate the number of observed raw RT-PCR values below35 Cts in three biological replicates. The detectability ofmiRNA in cells or SN under different conditions wasestablished on less than 35 Cts for all replicates (n = 3).Regarding quantitative differences, normal distributionand homogeneity of variances were evaluated usingLevene’s test before conducting statistical analysis. Vari-ables were given in a base log10 transformation and ana-lyzed on that log10 scale when necessary. Student’s orpaired t-tests were performed to study differences be-tween groups of samples. Data analyses were performedwith the SPSS statistical software (SPSS v13.0, IBM,Chicago, IL, USA) and the R Statistical Software (http://www.r-project.org/). Potential miRNA target genes andpathways were identified using DIANA-mirPath [31]and TargetScan 6.0 [38].
Additional files
Additional file 1: Supplemental information - raw data.
Additional file 2: Table S1. Most significant differences regardingmiRNA availability in macrophages (M1) and adipocytes (MAs) and intosupernatants (SNs) at the basal level and upon inflammation (Inf).Table S2. Anthropometric and biochemical data and expression resultsin subcutaneous adipose tissue samples from nine participants recruitedfor validation in vivo before (baseline) and after (post-weight loss)bariatric surgery. Table S3. Intersection of in silico identified targetgenes of miR-155 and miR-221. †Their involvement in insulin signaling isrepresented in Additional file 3: Figure S2 and S3.
Additional file 3: Figure S1. Workflow diagram. Figure S2. Insulinsignaling pathway showing the involvement of CBL, SOCS1, and PIK3R1(yellow boxes). Their post-transcriptional regulation may be accomplishedby both miR-221 and miR-155. Figure S3. SOCS1 and PIK3R1 (yellowboxes) in the context of type II diabetes and impaired glucose intake.
Competing interestsThe authors declare that they have no competing interests.
Authors’ contributionsAll authors of this manuscript have directly participated in the execution ofthe study. FJO wrote the manuscript, designed the study, participated in theanalysis of biochemical variables, and performed the statistical analysis. MM,JMM, JMM-N, NF-B, and MS helped with the biochemical analyses. WRprovided important intellectual content. JMF-R carried out the conceptionand coordination of the study, and contributed to writing the manuscript.All authors read and approved the final manuscript.
AcknowledgementsThis study was supported by an EFSD/Lilly Fellowship award (FJ Ortega, 2013), bythe Spanish Ministry of Science and Innovation (FIS 2011–00214, JM Fernández-Real, 2011), Fondo Europeo de Desarrollo Regional (FEDER), and CIBER de laFisiopatología de la Obesidad y la Nutrición (CIBERobn). The CIBERobn is aninitiative from the Instituto de Salud Carlos III (ISCIII). Dr. Josep M Mercader wassupported by a Sara Borrell fellowship, also from the Instituto de Salud Carlos III(ISCIII), and by an EFSD/Lilly Fellowship award. Dr. José M Fernández-Real is theguarantor for this work as a whole, including study design, access to data, andthe decision to submit and publish the manuscript.
The authors have nothing to discloseAll authors of this manuscript have directly participated in the execution andanalysis of the study. All authors are aware of and agree to the content of themanuscript, and all authors have approved the final version submitted and theirbeing listed as an author on the manuscript. The contents of this manuscripthave not been copyrighted or published previously. There are no directlyrelated manuscripts or abstracts, published or unpublished, by one or moreauthors of this manuscript. The contents of this manuscript are not now underconsideration for publication elsewhere. The submitted manuscript nor anysimilar manuscript, in whole or in part, will be neither copyrighted, submitted,or published elsewhere while the journal is under consideration.
Author details1Department of Diabetes, Endocrinology and Nutrition (UDEN), Institutd’Investigació Biomédica de Girona (IdIBGi), Avinguda de França s/n, 17007Girona, Spain. 2CIBER de la Fisiopatología de la Obesidad y la Nutrición(CIBERobn, CB06/03) and Instituto de Salud Carlos III (ISCIII), Sinesio Delgado4, 28029 Madrid, Spain. 3Joint BSC-CRG-IRB program on Computational Biology,Barcelona Supercomputing Center, Baldiri Reixac 10, 08028 Barcelona, Spain.
Received: 27 January 2015 Accepted: 7 April 2015
References1. Tilg H, Moschen AR. Adipocytokines: mediators linking adipose tissue,
inflammation and immunity. Nat Rev Immunol. 2006;6(10):772–83.2. Delarue J, Magnan C. Free fatty acids and insulin resistance. Curr Opin Clin
Nutr Metab Care. 2007;10(2):142–8.

Ortega et al. Clinical Epigenetics (2015) 7:49 Page 10 of 10
3. Vickers KC, Palmisano BT, Shoucri BM, Shamburek RD, Remaley AT.MicroRNAs are transported in plasma and delivered to recipient cells byhigh-density lipoproteins. Nat Cell Biol. 2011;13(4):423–33.
4. Clement K, Viguerie N, Poitou C, Carette C, Pelloux V, Curat CA, et al. Weightloss regulates inflammation-related genes in white adipose tissue of obesesubjects. Faseb J. 2004;18(14):1657–69.
5. Bassols J, Ortega FJ, Moreno-Navarrete JM, Peral B, Ricart W, Fernandez-RealJM. Study of the proinflammatory role of human differentiated omentaladipocytes. J Cell Biochem. 2009;107(6):1107–17.
6. Permana PA, Menge C, Reaven PD. Macrophage-secreted factors induceadipocyte inflammation and insulin resistance. Biochem Biophys ResCommun. 2006;341(2):507–14.
7. Cancello R, Henegar C, Viguerie N, Taleb S, Poitou C, Rouault C, et al.Reduction of macrophage infiltration and chemoattractant gene expressionchanges in white adipose tissue of morbidly obese subjects aftersurgery-induced weight loss. Diabetes. 2005;54(8):2277–86.
8. Weisberg SP, McCann D, Desai M, Rosenbaum M, Leibel RL, Ferrante Jr AW.Obesity is associated with macrophage accumulation in adipose tissue. JClin Invest. 2003;112(12):1796–808.
9. Meijer K, de Vries M, Al-Lahham S, Bruinenberg M, Weening D, Dijkstra M,et al. Human primary adipocytes exhibit immune cell function: adipocytesprime inflammation independent of macrophages. PLoS One.2011;6(3):e17154.
10. Skurk T, Herder C, Kraft I, Muller-Scholze S, Hauner H, Kolb H. Productionand release of macrophage migration inhibitory factor from humanadipocytes. Endocrinology. 2005;146(3):1006–11.
11. Bartel DP. MicroRNAs: target recognition and regulatory functions. Cell.2009;136(2):215–33.
12. Hilton C, Neville MJ, Karpe F. MicroRNAs in adipose tissue: their role inadipogenesis and obesity. Int J Obes (Lond). 2013;37(3):325–32.
13. Rottiers V, Naar AM. MicroRNAs in metabolism and metabolic disorders. NatRev Mol Cell Biol. 2012;13(4):239–50.
14. Ortega FJ, Moreno-Navarrete JM, Pardo G, Sabater M, Hummel M, Ferrer A,et al. MiRNA expression profile of human subcutaneous adipose and duringadipocyte differentiation. PLoS One. 2010;5(2):e9022.
15. Oger F, Gheeraert C, Mogilenko D, Benomar Y, Molendi-Coste O, BouchaertE, et al. Cell-specific dysregulation of microRNA expression in obese whiteadipose tissue. J Clin Endocrinol Metab. 2014;99(8):2821–33.
16. Mudhasani R, Puri V, Hoover K, Czech MP, Imbalzano AN, Jones SN. Dicer isrequired for the formation of white but not brown adipose tissue. J CellPhysiol. 2011;226(5):1399–406.
17. Ortega FJ, Mercader JM, Catalan V, Moreno-Navarrete JM, Pueyo N, SabaterM, et al. Targeting the circulating microRNA signature of obesity. Clin Chem.2013;59(5):781–92.
18. Dankel SN, Fadnes DJ, Stavrum AK, Stansberg C, Holdhus R, Hoang T, et al.Switch from stress response to homeobox transcription factors in adiposetissue after profound fat loss. PLoS One. 2010;5(6):e11033.
19. Ogawa R, Tanaka C, Sato M, Nagasaki H, Sugimura K, Okumura K, et al.Adipocyte-derived microvesicles contain RNA that is transported intomacrophages and might be secreted into blood circulation. BiochemBiophys Res Commun. 2010;398(4):723–9.
20. Mittelbrunn M, Gutierrez-Vazquez C, Villarroya-Beltri C, Gonzalez S, Sanchez-CaboF, Gonzalez MA, et al. Unidirectional transfer of microRNA-loaded exosomes fromT cells to antigen-presenting cells. Nat Commun. 2011;2:282.
21. Valadi H, Ekstrom K, Bossios A, Sjostrand M, Lee JJ, Lotvall JO. Exosome-mediated transfer of mRNAs and microRNAs is a novel mechanism ofgenetic exchange between cells. Nat Cell Biol. 2007;9(6):654–9.
22. Thery C, Ostrowski M, Segura E. Membrane vesicles as conveyors ofimmune responses. NatRevImmunol. 2009;9(8):581–93.
23. Deng ZB, Poliakov A, Hardy RW, Clements R, Liu C, Liu Y, et al. Adiposetissue exosome-like vesicles mediate activation of macrophage-inducedinsulin resistance. Diabetes. 2009;58(11):2498–505.
24. Chartoumpekis DV, Zaravinos A, Ziros PG, Iskrenova RP, Psyrogiannis AI,Kyriazopoulou VE, et al. Differential expression of microRNAs in adiposetissue after long-term high-fat diet-induced obesity in mice. PLoS One.2012;7(4):e34872.
25. Fernandez-Messina L, Gutierrez-Vazquez C, Rivas-Garcia E, Sanchez-Madrid F,de la Fuente H. Immunomodulatory role of microRNAs transferred byextracellular vesicles. Biol Cell. 2015;107(3):61–77.
26. Nesca V, Guay C, Jacovetti C, Menoud V, Peyot ML, Laybutt DR, et al.Identification of particular groups of microRNAs that positively or negativelyimpact on beta cell function in obese models of type 2 diabetes.Diabetologia. 2013;56(10):2203–12.
27. Lv YC, Tang YY, Peng J, Zhao GJ, Yang J, Yao F, et al. MicroRNA-19b promotesmacrophage cholesterol accumulation and aortic atherosclerosis by targetingATP-binding cassette transporter A1. Atherosclerosis. 2014;236(1):215–26.
28. Hulsmans M, De Keyzer D, Holvoet P. MicroRNAs regulating oxidative stressand inflammation in relation to obesity and atherosclerosis. Faseb J.2011;25(8):2515–27.
29. O’Connell RM, Taganov KD, Boldin MP, Cheng G, Baltimore D. MicroRNA-155is induced during the macrophage inflammatory response. Proc Natl AcadSci U S A. 2007;104(5):1604–9.
30. Xie H, Lim B, Lodish HF. MicroRNAs induced during adipogenesis thataccelerate fat cell development are downregulated in obesity. Diabetes.2009;58(5):1050–7.
31. Papadopoulos GL, Alexiou P, Maragkakis M, Reczko M, Hatzigeorgiou AG.DIANA-mirPath: Integrating human and mouse microRNAs in pathways.Bioinformatics. 2009;25(15):1991–3.
32. McCurdy CE, Schenk S, Holliday MJ, Philp A, Houck JA, Patsouris D, et al.Attenuated Pik3r1 expression prevents insulin resistance and adipose tissuemacrophage accumulation in diet-induced obese mice. Diabetes.2012;61(10):2495–505.
33. Prada PO, Pauli JR, Ropelle ER, Zecchin HG, Carvalheira JB, Velloso LA, et al.Selective modulation of the CAP/Cbl pathway in the adipose tissue of highfat diet treated rats. FEBS Lett. 2006;580(20):4889–94.
34. Charriere G, Cousin B, Arnaud E, Andre M, Bacou F, Penicaud L, et al.Preadipocyte conversion to macrophage. Evidence of plasticity. J Biol Chem.2003;278(11):9850–5.
35. Fain JN, Madan AK, Hiler ML, Cheema P, Bahouth SW. Comparison of therelease of adipokines by adipose tissue, adipose tissue matrix, andadipocytes from visceral and subcutaneous abdominal adipose tissues ofobese humans. Endocrinology. 2004;145(5):2273–82.
36. Cousin B, Munoz O, Andre M, Fontanilles AM, Dani C, Cousin JL, et al. A rolefor preadipocytes as macrophage-like cells. Faseb J. 1999;13(2):305–12.
37. Vandesompele J, De Preter K, Pattyn F, Poppe B, Van Roy N, De Paepe A,et al. Accurate normalization of real-time quantitative RT-PCR data bygeometric averaging of multiple internal control genes. Genome Biol.2002;3(7):RESEARCH0034.
38. Vergoulis T, Vlachos IS, Alexiou P, Georgakilas G, Maragkakis M, Reczko M,et al. TarBase 6.0: capturing the exponential growth of miRNA targets withexperimental support. Nucleic Acids Res. 2012;40(Database issue):D222–9.
Submit your next manuscript to BioMed Centraland take full advantage of:
• Convenient online submission
• Thorough peer review
• No space constraints or color figure charges
• Immediate publication on acceptance
• Inclusion in PubMed, CAS, Scopus and Google Scholar
• Research which is freely available for redistribution
Submit your manuscript at www.biomedcentral.com/submit
Copyright © 2022 FDOKUMEN