Differential alterations of the concentrations of endocannabinoids and related lipids in the...
8
Annuzzi et al. Lipids in Health and Disease 2010, 9:43 http://www.lipidworld.com/content/9/1/43 Open Access RESEARCH BioMed Central © 2010 Annuzzi et al; licensee BioMed Central Ltd. This is an Open Access article distributed under the terms of the Creative Commons Attribution License (http://creativecommons.org/licenses/by/2.0), which permits unrestricted use, distribution, and reproduction in any medium, provided the original work is properly cited. Research Differential alterations of the concentrations of endocannabinoids and related lipids in the subcutaneous adipose tissue of obese diabetic patients Giovanni Annuzzi 1 , Fabiana Piscitelli 2 , Lucrezia Di Marino 1 , Lidia Patti 1 , Rosalba Giacco 3 , Giuseppina Costabile 1 , Lutgarda Bozzetto 1 , Gabriele Riccardi 1 , Roberta Verde 2 , Stefania Petrosino 2 , Angela A Rivellese 1 and Vincenzo Di Marzo* 2 Abstract Background: The endocannabinoids, anandamide and 2-AG, are produced by adipocytes, where they stimulate lipogenesis via cannabinoid CB 1 receptors and are under the negative control of leptin and insulin. Endocannabinoid levels are elevated in the blood of obese individuals and nonobese type 2 diabetes patients. To date, no study has evaluated endocannabinoid levels in subcutaneous adipose tissue (SAT) of subjects with both obesity and type 2 diabetes (OBT2D), characterised by similar adiposity and whole body insulin resistance and lower plasma leptin levels as compared to non-diabetic obese subjects (OB). Design and Methods: The levels of anandamide and 2-AG, and of the anandamide-related PPARα ligands, oleoylethanolamide (OEA) and palmitoylethanolamide (PEA), in the SAT obtained by abdominal needle biopsy in 10 OBT2D, 11 OB, and 8 non-diabetic normal-weight (NW) subjects, were measured by liquid chromatography-mass spectrometry. All subjects underwent a hyperinsulinaemic euglycaemic clamp. Results: As compared to NW, anandamide, OEA and PEA levels in the SAT were 2-4.4-fold elevated (p < 0.05), and 2-AG levels 2.3-fold reduced (p < .05), in OBT2D but not in OB subjects. Anandamide, OEA and PEA correlated positively (p < .05) with SAT leptin mRNA and free fatty acid during hyperinsulinaemic clamp, and negatively with SAT LPL activity and plasma HDL-cholesterol, which were all specifically altered in OBT2D subjects. Conclusions: The observed alterations emphasize, for the first time in humans, the potential different role and regulation of adipose tissue anandamide (and its congeners) and 2-AG in obesity and type 2 diabetes. Background The endocannabinoid system (ECS), composed of G-pro- tein-coupled cannabinoid receptors of type 1 and 2 (CB 1 and CB 2 ), of endogenous ligands for such receptors, the endocannabinoids arachidonoylethanolamide (anand- amide, AEA) and 2-arachidonoylglycerol (2-AG), and of enzymes catalysing endocannabinoid biosynthesis and degradation, is a key player in the control of metabolism at both central and peripheral levels [1]. In the hypothala- mus, endocannabinoids acting at CB 1 receptors modulate the circuitries involved in food intake and are under the negative control of leptin [2]. In the white adipose tissue (WAT), the ECS stimulates lipogenesis and inhibits lipol- ysis via several mechanisms, and is under the negative control of either leptin or PPARγ [1,3-5]. PPARγ agonists, such as the glitazones, used for the treatment of type 2 diabetes (T2D), reduce either adipocyte 2-AG concentra- tions or CB 1 receptor expression levels, or both [3-5]. Insulin also acts as a negative modulator of endocannabi- noid levels in both human and murine WAT [3,6,7]. Plasma endocannabinoid levels, which likely reflect to a * Correspondence: [email protected] 2 Endocannabinoid Research Group, Institute of Biomolecular Chemistry, CNR, Pozzuoli Naples, Italy Full list of author information is available at the end of the article
Transcript of Differential alterations of the concentrations of endocannabinoids and related lipids in the...

Annuzzi et al. Lipids in Health and Disease 2010, 9:43http://www.lipidworld.com/content/9/1/43
Open AccessR E S E A R C H
ResearchDifferential alterations of the concentrations of endocannabinoids and related lipids in the subcutaneous adipose tissue of obese diabetic patientsGiovanni Annuzzi1, Fabiana Piscitelli2, Lucrezia Di Marino1, Lidia Patti1, Rosalba Giacco3, Giuseppina Costabile1, Lutgarda Bozzetto1, Gabriele Riccardi1, Roberta Verde2, Stefania Petrosino2, Angela A Rivellese1 and Vincenzo Di Marzo*2
AbstractBackground: The endocannabinoids, anandamide and 2-AG, are produced by adipocytes, where they stimulate lipogenesis via cannabinoid CB1 receptors and are under the negative control of leptin and insulin. Endocannabinoid levels are elevated in the blood of obese individuals and nonobese type 2 diabetes patients. To date, no study has evaluated endocannabinoid levels in subcutaneous adipose tissue (SAT) of subjects with both obesity and type 2 diabetes (OBT2D), characterised by similar adiposity and whole body insulin resistance and lower plasma leptin levels as compared to non-diabetic obese subjects (OB).
Design and Methods: The levels of anandamide and 2-AG, and of the anandamide-related PPARα ligands, oleoylethanolamide (OEA) and palmitoylethanolamide (PEA), in the SAT obtained by abdominal needle biopsy in 10 OBT2D, 11 OB, and 8 non-diabetic normal-weight (NW) subjects, were measured by liquid chromatography-mass spectrometry. All subjects underwent a hyperinsulinaemic euglycaemic clamp.
Results: As compared to NW, anandamide, OEA and PEA levels in the SAT were 2-4.4-fold elevated (p < 0.05), and 2-AG levels 2.3-fold reduced (p < .05), in OBT2D but not in OB subjects. Anandamide, OEA and PEA correlated positively (p < .05) with SAT leptin mRNA and free fatty acid during hyperinsulinaemic clamp, and negatively with SAT LPL activity and plasma HDL-cholesterol, which were all specifically altered in OBT2D subjects.
Conclusions: The observed alterations emphasize, for the first time in humans, the potential different role and regulation of adipose tissue anandamide (and its congeners) and 2-AG in obesity and type 2 diabetes.
BackgroundThe endocannabinoid system (ECS), composed of G-pro-tein-coupled cannabinoid receptors of type 1 and 2 (CB1and CB2), of endogenous ligands for such receptors, theendocannabinoids arachidonoylethanolamide (anand-amide, AEA) and 2-arachidonoylglycerol (2-AG), and ofenzymes catalysing endocannabinoid biosynthesis anddegradation, is a key player in the control of metabolismat both central and peripheral levels [1]. In the hypothala-
mus, endocannabinoids acting at CB1 receptors modulatethe circuitries involved in food intake and are under thenegative control of leptin [2]. In the white adipose tissue(WAT), the ECS stimulates lipogenesis and inhibits lipol-ysis via several mechanisms, and is under the negativecontrol of either leptin or PPARγ [1,3-5]. PPARγ agonists,such as the glitazones, used for the treatment of type 2diabetes (T2D), reduce either adipocyte 2-AG concentra-tions or CB1 receptor expression levels, or both [3-5].Insulin also acts as a negative modulator of endocannabi-noid levels in both human and murine WAT [3,6,7].Plasma endocannabinoid levels, which likely reflect to a
* Correspondence: [email protected] Endocannabinoid Research Group, Institute of Biomolecular Chemistry, CNR, Pozzuoli Naples, ItalyFull list of author information is available at the end of the article
BioMed Central© 2010 Annuzzi et al; licensee BioMed Central Ltd. This is an Open Access article distributed under the terms of the Creative CommonsAttribution License (http://creativecommons.org/licenses/by/2.0), which permits unrestricted use, distribution, and reproduction inany medium, provided the original work is properly cited.

Annuzzi et al. Lipids in Health and Disease 2010, 9:43http://www.lipidworld.com/content/9/1/43
Page 2 of 8
large extent the "spill-over" of these lipid mediators fromperipheral organs, are decreased postprandially or fol-lowing oral glucose load and euglycaemic hyperinsulinae-mic clamp in lean [3,8], but not in insulin resistant obesesubjects [8], who, like T2D patients, show higher levels ofendocannabinoids also when fasting [3-7,9].
In abdominally obese individuals, blood 2-AG, but notAEA, concentrations correlate directly with the amountof visceral adipose tissue (VAT) and blood triacylglycer-ols (TGs), and inversely with HDL-cholesterol levels[10,11], and such correlations are also observed betweenthe changes in blood 2-AG levels and those in TG andHDL-cholesterol levels induced by a lifestyle interventionleading to a strong reduction of waist circumference andVAT [12]. In experimental models of obesity, higher levelsof endocannabinoids are found also in the visceral (e.g.epididymal) vs. subcutaneous adipose depots [3,13,14].This dysregulation of endocannabinoid tone in the WATis probably due, at least in part, to dysfunctional expres-sion of endocannabinoid metabolising enzymes. In fact, alower expression of the fatty acid amide hydrolase(FAAH), which can metabolise both AEA and 2-AG, aswell as other congeners of AEA (see below), or of themonoacylglycerol lipase (MAGL), which is more specificfor 2-AG [15], has been reported in the VAT of obeseindividuals [10,16], possibly accounting for the observedhigher VAT levels of 2-AG [3]. As opposed to obeserodents [13], reduced levels of FAAH expression havebeen reported for obese subjects also in the subcutaneousadipose tissue (SAT) [9,16,17], where, instead, thereseems to be no elevation of endocannabinoid levels [3].However, no such studies have been performed to date inthe WAT of obese patients with type 2 diabetes, who canbe characterised by similar whole body insulin resistance,but lower plasma leptin levels, as compared to matchednon diabetic obese subjects [18,19].
The SAT plays an important role as a buffer againstectopic lipid accumulation and the subsequent increasedinflammatory profile typical of abdominally obesepatients [20]. Therefore, in view of the prolipogenic roleof the ECS in the WAT, a higher endocannabinoid tone inSAT might be regarded as protective towards the meta-bolic consequences of obesity, whereas a reduced tonemight contribute to these consequences. For this reason,and also to acquire some unprecedented information onendocannabinoid tone in the WAT of subjects with T2D,we have compared here the levels of AEA and 2-AG inthe SAT of age- and gender-matched T2D obese(OBT2D), obese only (OB), and normal weight (NW) vol-unteers. Furthermore, since two cannabinoid receptor-inactive and metabolically-related AEA congeners,oleoylethanolamide (OEA) and palmitoylethanolamide(PEA), which are also degraded by FAAH, are emergingas potent endogenous ligands of peroxisome proliferator-
activated receptor α (PPARα), a well established target forthe therapy of dyslipidemia [21], and were recently foundto be dysregulated in obese Zucker rats [22], we have alsomeasured the SAT levels of these two lipid mediators.
Methods and subjectsSubjectsTen patients with type 2 diabetes mellitus and obesity(OBT2D), 11 patients with only obesity (OB), and 8 nor-mal-weight control subjects (NW) participated in thestudy. Their baseline characteristics are shown in Table 1.All subjects had normal fasting plasma concentration ofboth triglyceride (<1.7 mmol/l) and cholesterol (<5.5mmol/l). The subjects had no history or symptoms of anyknown disease, apart from diabetes, nor were they vege-tarians or engaged in intensive physical activity. Theywere not taking any hypolipidaemic drug. Diabeticpatients were in stable glycaemic control on diet alone(HbA1c = 6.5 ± 0.5%). The study protocol was approvedby the Federico II University Ethics Committee andinformed consent by the participants was obtained.
Experimental proceduresIn the morning, after a 12-14 hr fast, following an eveningmeal based on the usual diet, anthropometric measure-ments, according to standardized procedures, and bloodsamples were drawn. Thereafter, a needle biopsy of theabdominal subcutaneous adipose tissue was taken underlocal anaesthesia with lidocaine, and a hyperinsulinaemiceuglycaemic clamp was performed (120 min insulin infu-sion 1.5 mU·kg body weight-1·min-1) [18]. Advice wasgiven to have the meal at the proper time, and to avoidalcohol intake. Compliance was assessed by a 3-day fooddiary filled in by the participants. The subjects were alsorequested to avoid moderate/strenuous physical activityon the 3 days before the experiment.
Extraction and quantification of endocannabinoids and related lipidsFrozen SAT tissue samples were homogenized in chloro-form/methanol/TRIS-HCl 50 mM pH 7.4 (2:1:1, v/v) con-taining 10 pmol of [2H]8-AEA, [2H]4-PEA and [2H]4-OEA, and 50 pmol of [2H]5-2-AG as internal deuteratedstandards (purchased from Cayman Chemicals, AnnArbor, MI). The extract was purified by means of silicagel mini-columns, and the eluted fraction containingAEA and 2-AG analysed by means of liquid chromatogra-phy-atmospheric pressure-mass spectrometry (LC-APCI-MS) conducted as described previously [23]. Anal-yses were carried out in the selected ion-monitoringmode using m/z values of 356 and 348 (molecular ions +1for deuterated and undeuterated AEA), 304 and 300(molecular ions +1 for deuterated and undeuteratedPEA), 330 and 326 (molecular ions +1 for deuterated and

Annuzzi et al. Lipids in Health and Disease 2010, 9:43http://www.lipidworld.com/content/9/1/43
Page 3 of 8
undeuterated OEA), and 384.35 and 379.35 (molecularions +1 for deuterated and undeuterated 2-AG). AEA,OEA, PEA and 2-AG concentrations were calculated byisotope dilution and are expressed as pmol per g of wettissue weight. The concentrations of 2-AG were obtainedby adding up to the amounts of the 2-isomer also those ofthe 1(3)-isomer, which mostly originates from theisomerization of the former during work-up.
Other measurementsPlasma cholesterol and triglyceride concentrations wereassayed by enzymatic colorimetric methods (Roche Diag-nostics, Milan, Italy). Plasma leptin concentrations wereassayed using a competitive ELISA (BioVendor Labora-tory Medicine, Brno, Czech Republic). Plasma insulinconcentrations were measured by ELISA (Technogenet-ics, Milan, Italy).
Table 1: Clinical characteristics and metabolic measurements in plasma and adipose tissue of the subjects participating in the study.
Diabetes + obesity Obesity Control
Males (n) 10 11 8
Age (years) 47 [8] 47 [20] 38 [9]
BMI (kg/m2) 33.4 [2.4] ** 34.5 [2.7] ** 23.8 [1.2]
Waist circumference (cm) 111.4 [7.7] ** 113.1 [6.7] ** 84.9 [4.4]
Plasma cholesterol (mg/dl) 171.8 [25.9] 194.1 [29.9] 166.7 [24.2]
Plasma triglyceride (mg/dl) 111.2 [54.7] 99.8 [34.7] 72.4 [28.2]
LDL cholesterol (mg/dl) 102.1 [19.6] 114.9 [26.4] 96.8 [14.6]
HDL cholesterol (mg/dl) 34.5 [5.8] *§ 44.3 [10.3] 47.7 [10.6]
Plasma glucose (mg/dl) 132.7 [37.2] *§ 87.9 [13.9] 87.2 [9.9]
Plasma insulin (mU/l) 14.3 [6.4] 15.6 [4.2] 6.4 [1.5]
Plasma leptin (ng/ml) 9.4 [4.2]§ 24.9 [9.6]** 5.4 [2.3]
Adipose tissue leptin mRNA (AU)
2.62 [1.90] * 1.73 [1.82] 0.77 [0.38]
Adipose tissue LPL activity(nmol fatty acids/g tissue)
105 [45] *§ 231 [128] 251 [119]
Insulin sensitivity (M-value) (mg/kg/min)
4.55 [1.41] ** 4.63 [1.48] ** 8.13 [2.32]
FFA during hyperinsulinaemic clamp (μmol/l)
84.0 [50.8] * 73.0 [33.7] * 36.2 [7.4]
Data are expressed as M [SD]. ANOVA and LSD (Kruskal-Wallis for plasma triglyceride, LPL activity, and leptin RNA) * p < 0.05, ** p < 0.001 vs Control, §p < 0.05 vs Obesity. AU = arbitrary units, LPL = lipoprotein lipase.
Annuzzi et al. Lipids in Health and Disease 2010, 9:43http://www.lipidworld.com/content/9/1/43
Page 4 of 8
LPL heparin-releasable activity in adipose tissue wasdetermined as previously described [24]. The expressionof leptin mRNA was evaluated by RT-PCR [25]. The spe-cific primers to amplify leptin (Acc.U43653) were sense:5'-ATG CAT TGG GGA ACC CTG TGC GG-3'and anti-sense: 5'-AGG TCC AGC TGC CAC AGC ATG TC-3'(487 bp). Results are expressed as the ratio between theleptin gene and GAPDH in each sample analyzed.
Statistical analysesData are expressed as mean ± standard deviation (M ±SD), unless otherwise stated. Differences between thethree groups (OBT2D, OB and NW) were evaluated byANOVA and by post hoc test between groups (LSD). Therelationship between endocannabinoid levels and meta-bolic measurements was assessed by Pearson correlation.Variables not normally distributed were analyzed by anonparametric test (Kruskal-Wallis ANOVA). Two-tailedtests were used and a p < 0.05 was considered statisticallysignificant. Statistical analysis was performed accordingto standard methods using the Statistical Package forSocial Sciences software (SPSS/PC, SPSS, Inc., Chicago,IL).
ResultsAnthropometrics and metabolic measurementsObese subjects with and without diabetes had similarlyhigh BMI and abdominal circumferences compared withNW controls (Table 1). As expected, blood glucose levelswere significantly higher in OBT2D group compared tothe other two groups. Fasting plasma insulin levels weresignificantly higher in both groups of obese with andwithout diabetes compared to NW.
Insulin sensitivity measured by euglycaemic hyperinsu-linaemic clamp and expressed as M-value was similarlylower in the two obese groups compared to NW controls.Insulin antilipolytic activity, expressed by plasma FFAlevel inhibition during the hyperinsulinaemic clamp, wasimpaired in the OBT2D subjects compared to the othertwo groups.
Fasting plasma leptin levels where highest, intermedi-ate and lowest in OB, OBT2D and NW subjects, respec-tively, while leptin mRNA in adipose tissue tended to behigher in OBT2D than in NW. Heparin-releasable LPLactivity, expressed per gram of adipose tissue, was signifi-cantly lower in the OBT2D subjects compared to theother two groups.
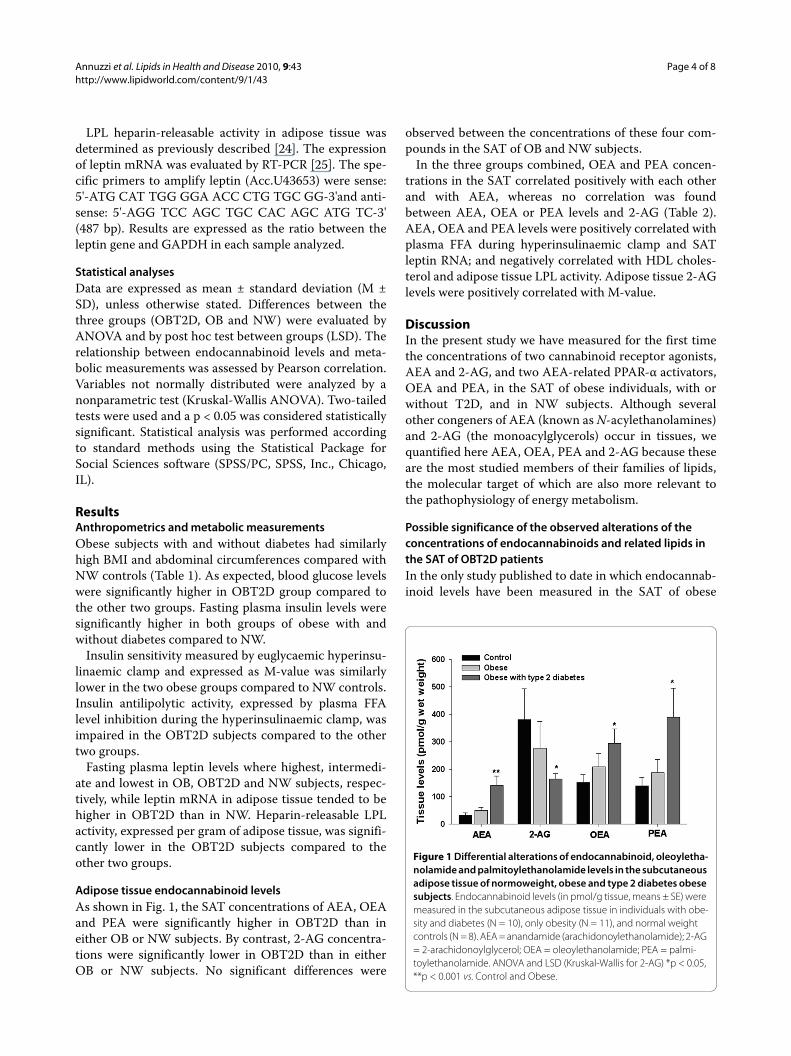
Adipose tissue endocannabinoid levelsAs shown in Fig. 1, the SAT concentrations of AEA, OEAand PEA were significantly higher in OBT2D than ineither OB or NW subjects. By contrast, 2-AG concentra-tions were significantly lower in OBT2D than in eitherOB or NW subjects. No significant differences were
observed between the concentrations of these four com-pounds in the SAT of OB and NW subjects.
In the three groups combined, OEA and PEA concen-trations in the SAT correlated positively with each otherand with AEA, whereas no correlation was foundbetween AEA, OEA or PEA levels and 2-AG (Table 2).AEA, OEA and PEA levels were positively correlated withplasma FFA during hyperinsulinaemic clamp and SATleptin RNA; and negatively correlated with HDL choles-terol and adipose tissue LPL activity. Adipose tissue 2-AGlevels were positively correlated with M-value.
DiscussionIn the present study we have measured for the first timethe concentrations of two cannabinoid receptor agonists,AEA and 2-AG, and two AEA-related PPAR-α activators,OEA and PEA, in the SAT of obese individuals, with orwithout T2D, and in NW subjects. Although severalother congeners of AEA (known as N-acylethanolamines)and 2-AG (the monoacylglycerols) occur in tissues, wequantified here AEA, OEA, PEA and 2-AG because theseare the most studied members of their families of lipids,the molecular target of which are also more relevant tothe pathophysiology of energy metabolism.
Possible significance of the observed alterations of the concentrations of endocannabinoids and related lipids in the SAT of OBT2D patientsIn the only study published to date in which endocannab-inoid levels have been measured in the SAT of obese
Figure 1 Differential alterations of endocannabinoid, oleoyletha-nolamide and palmitoylethanolamide levels in the subcutaneous adipose tissue of normoweight, obese and type 2 diabetes obese subjects. Endocannabinoid levels (in pmol/g tissue, means ± SE) were measured in the subcutaneous adipose tissue in individuals with obe-sity and diabetes (N = 10), only obesity (N = 11), and normal weight controls (N = 8). AEA = anandamide (arachidonoylethanolamide); 2-AG = 2-arachidonoylglycerol; OEA = oleoylethanolamide; PEA = palmi-toylethanolamide. ANOVA and LSD (Kruskal-Wallis for 2-AG) *p < 0.05, **p < 0.001 vs. Control and Obese.

Annuzzi et al. Lipids in Health and Disease 2010, 9:43http://www.lipidworld.com/content/9/1/43
Page 5 of 8
patients [3], no differences were observed with the corre-sponding values in matched NW volunteers, and we haveconfirmed here this finding. However, we have also foundthat, in the presence of T2D, obese patients do exhibitdifferential alterations of the SAT concentrations of thefour measured lipid mediators. In fact, whilst the SATlevels of the endocannabinoid AEA and of the PPARαligands OEA and PEA were significantly higher inOBT2D, those of the other, more abundant, endocannab-inoid, 2-AG, were lower. OEA and PEA activate PPARαreceptors with high and intermediate potency, respec-tively, but are inactive at cannabinoid receptors [26].Therefore, the SAT of OBT2D subjects might be charac-terized by a relatively decreased activity of CB1 receptors,and strongly increased activity of PPARα receptors, ascompared to that of OB and NW subjects. Given the pro-and anti-lipogenic effects of CB1 and PPARα receptoractivation, respectively [3,27], it is tempting to hypothe-size that this alteration in the activity of the two receptorsmight be partly responsible for the decreased subcutane-ous vs. visceral fat observed in OBT2D patients [28].
Possible explanations for the observed differential alterations of endocannabinoid levels in the SAT of OBT2D patientsIt is not unusual that AEA and 2-AG tissue concentra-tions change in different, or even opposing, ways in phys-iological and pathological conditions, and in bothlaboratory animals and humans [29]. This probablyreflects the fact that the two compounds might also playdifferent roles, particularly as AEA is known to interactalso with non-cannabinoid receptors, including transientreceptor potential vanilloid type-1 channels [30] and, athigher concentrations, PPAR-γ [31], whereas 2-AG ismore selective for cannabinoid receptors. Furthermore,AEA, OEA, and PEA share similar biosynthetic and inac-tivation pathways and enzymes (including FAAH) [32],which might explain why the levels of these three com-pounds were found here to be positively correlated witheach other and were altered in the same way in the SAT ofOBT2D subjects. The formation and degradation of 2-AG is, instead, catalysed by other enzymes [32]. Interest-ingly, by acting as competing substrates for FAAH, OEA
Table 2: Relationship between endocannabinoid levels in adipose tissue (expressed as pmol/g tissue) and metabolic measurements in all subjects participating in the study (Pearson correlation coefficients).
AEA 2-AG OEA PEA
AEA -.10 .76*** .87***
2-AG .32 .09
OEA .87***
Plasma triglycerides .27 -.11 .25 .26
HDL cholesterol -.53** .10 -.48** -.47**
Plasma leptin -.19 -.16 -.09 -.12
Leptin mRNA in SAT .44* .18 .70*** .62***
LPL activity in SAT -.53** .30 -.50** -.48**
Insulin sensitivity (M value)
-.32 .50** -.17 -.19
FFA during hyperinsulinaemic clamp
.47* -.05 .55** .57***
* p < 0.05, ** p < 0.01, *** p < 0.001

Annuzzi et al. Lipids in Health and Disease 2010, 9:43http://www.lipidworld.com/content/9/1/43
Page 6 of 8
and PEA might spare AEA and 2-AG from degradationand hence affect endocannabinoid tone. Finally, the dif-ferent availability of precursor fatty acid pools can differ-entially affect the levels of N-acylethanolamines andmonoacylglycerols, including AEA and 2-AG [33], andthis can also explain differential changes in levels of thetwo endocannabinoids in the three populations studied.Indeed, it was previously described that there are altera-tions in arachidonic acid metabolism in obesity [34], andsince arachidonic acid is a precursor to inflammatoryeicosanoids, and inflammation is generally increased inobesity and diabetes, this could also account for analtered availability of arachidonic acid for endocannabi-noid production.
Possible meaning of the observed correlations between SAT levels of endocannabinoids or related lipids and various biochemical parametersPrevious observations show that: 1) in nonobese, but notin obese, individuals, insulin negatively controls AEAmore significantly than 2-AG blood levels [8], possibly bystimulating the expression of FAAH [6], which is morespecific for AEA than 2-AG; and 2) circulating leptin lev-els are negatively associated with blood AEA, but not 2-AG, levels in lean, but not in obese, women with eatingdisorders [35], although leptin reduces both AEA and 2-AG levels in mouse adipocytes [3]. In the present studyOBT2D subjects had lower circulating leptin than OBsubjects. This indicates that the increase in SAT AEA lev-els (and, possibly, also OEA and PEA), observed inOBT2D subjects was more related to the lower leptin lev-els than to the level of whole body insulin resistance,which was instead similar between the two obese groups.Interestingly, however, the concentrations of AEA, OEAand PEA, did not correlate negatively with plasma leptinlevels, nor with M values, but did correlate positively withSAT leptin mRNA levels. This might suggest a possiblenegative feed-back loop of these lipid mediators on theirown levels, exerted by up-regulating the expression andproduction of one of their negative effectors. Indeed,activation of CB1 receptors was shown to stimulate insu-lin release from both rat and human β-cells [3,36], thusindicating that such negative feed-back regulations arenot unusual for the ECS. With regard to 2-AG, here posi-tively correlated with M-values, the reduced whole bodyinsulin sensitivity cannot explain the reduction of its lev-els in the SAT of OBT2D subjects, since these subjectsexhibited M-values similar to those of OB subjects. Thisdoes not exclude other effects of reduced insulin sensitiv-ity at any other level in the SAT of OBT2D subjects.
OBT2D subjects had lower adipose tissue LPL activitythan the matched OB or NW subjects. It has been shownthat LPL in adipocytes is stimulated by the activation ofCB1 receptors [37]. Therefore, since SAT LPL activityhere correlated negatively with SAT AEA (and OEA or
PEA) levels, while 2-AG levels showed an opposite ten-dency, it is possible to hypothesize, again, that increasedAEA might not result in increased SAT CB1 activity,whereas decreased levels of 2-AG in the SAT might bepartly responsible, via the corresponding reduction ofCB1 activity, for the decreased LPL activity observed inthis adipose depot. This hypothesis would be in agree-ment also with the very recent finding of reduced CB1receptor mRNA expression in the SAT of both obese [38]and overweight dysmetabolic subjects [39], and withmounting evidence that CB1 receptor tone is reduced inthe SAT of obese animals [13,14].
The SAT concentrations of AEA, but not 2-AG, corre-lated with decreased HDL cholesterol, which is the oppo-site of what previously reported for the plasma levels of 2-AG, which, unlike plasma AEA levels, are correlated withdecreased HDL cholesterol [10-12]. The SAT concentra-tions of AEA also correlated with a biomarker that is usu-ally linked with increased lipogenesis in the liver, i.e.plasma FFA during hyperinsulinaemic clamp. Therefore,it cannot be excluded that some of the metabolic dys-functions observed in OBT2D subjects, which might becaused by overactivation of CB1 receptors, are also due toelevated AEA concentrations in the SAT. This, in turn,might lead to the release of this endocannabinoid in thecirculation and to its action on other target tissues (e.g.the liver), in which CB1 receptor expression/function isnot reduced. In this study we did not measure the levelsof AEA and 2-AG in other tissues or in the plasma. A pre-vious study carried out in post-menopausal obese womenshowed that increased plasma endocannabinoids levelscorrelate with decreased FAAH mRNA expression in theSAT [9], which, in turn, should result in increased SATendocannabinoid levels. However, in viscerally obesemen, only increased plasma 2-AG levels correlated withdecreased FAAH mRNA expression in the SAT [10]. Fur-thermore, plasma 2-AG, but not AEA, levels are signifi-cantly increased in the plasma of OBT2D vs. OB or T2Dmale subjects (V. Di Marzo and L. Van Gaal, unpublishedobservations). Therefore, in obese subjects such as thoseinvestigated in the present study, little correlation is likelyto exist between circulating and SAT endocannabinoidlevels. In this respect, the decrease in 2-AG concentra-tions found here in the SAT of OBT2D subjects is in con-trast with the increase in circulating 2-AG levels,observed previously in overweight T2D patients [3]. Alsothe aforementioned positive correlation between SAT 2-AG levels and M-values is in contrast with what observedwith plasma 2-AG levels in obese subjects [8,10]. In fact,SAT and plasma 2-AG levels seem to predict in opposingways insulin resistance and T2D. Likewise, although bothSAT (this study) and blood [3] AEA concentrations areelevated in T2D patients, the amounts of FFA during

Annuzzi et al. Lipids in Health and Disease 2010, 9:43http://www.lipidworld.com/content/9/1/43
Page 7 of 8
hyperinsulinaemic clamp correlated positively with SATAEA (this study) and negatively with blood AEA [10].
ConclusionsThe concentrations of endogenous lipid mediators thatexert their biological actions by activating either CB1 orPPARα receptors are altered in the SAT of OBT2D, butnot of simply obese, individuals. Based on our currentknowledge of the role of the ECS in the WAT [1,4,5], suchalterations might contribute to less fat accumulation inthe SAT relative to VAT, and to some metabolic altera-tions that, along with impaired insulin release and sensi-tivity, are typical of obese patients with T2D [40,41].
List of abbreviations2-AG: 2-arachidonoylglycerol; AEA: anandamide; BMI:body mass index; CB1: cannabinoid receptor type 1; EC:endocannabinoid; ECS: endocannabinoid system; FAAH;fatty acid amide hydrolase; FFA: free fatty acid; HbA1c:glycated haemoglobin; HDL: high density lipoprotein;LPL: lipoprotein lipase; MAGL: monoacylglycerol lipase;NW: normoweight; OB: obese; OBT2D: obese with type 2diabetes; OEA: oleoylethanolamide; PEA: palmitoyletha-nolamide; PPAR: peroxisome proliferator-activatedreceptor; SAT: subcutaneous adipose tissue; T2D; type 2diabetes; TG: triacylglycerol; VAT: visceral adipose tissue;WAT: white adipose tissue.
Competing interestsThe authors declare that they have no competing interests.
Authors' contributionsGA, AAR, GR and VD designed the study; FP, LD, LP, RG, GC, LB, RV and SP per-formed the experiments; GA, FP and VD wrote the paper. All authors read andapproved the final manuscript.
AcknowledgementsWe wish to thank C. Santangelo, Centre for Food Quality and Risk Assessment, National Institute of Health, Rome, Italy, for the measurement of leptin mRNA in adipose tissue samples. This work was supported in part by funds from the Italian Ministry of Health and Istituto Superiore di Sanitΰ (Targeted Research Project n. 1AI/F 2001) and in part by funds from the National Institute of Drug Abuse (DA-009789 to VD).
Author Details1Department of Clinical and Experimental Medicine, Federico II University, Naples, Italy, 2Endocannabinoid Research Group, Institute of Biomolecular Chemistry, CNR, Pozzuoli Naples, Italy and 3National Research Council, Avellino, Italy
References1. Di Marzo V: The endocannabinoid system in obesity and type 2
diabetes. Diabetologia 2008, 51:356-1367.2. Di Marzo V, Goparaju SK, Wang L, Liu J, Bátkai S, Járai Z, Fezza F, Miura GI,
Palmiter RD, Sugiura T, Kunos G: Leptin-regulated endocannabinoids are involved in maintaining food intake. Nature 2001, 410:822-825.
3. Matias I, Gonthier MP, Orlando P, Martiadis V, De Petrocellis L, Cervino C, Petrosino S, Hoareau L, Festy F, Pasquali R, Roche R, Maj M, Pagotto U, Monteleone P, Di Marzo V: Regulation, function, and dysregulation of endocannabinoids in models of adipose and beta-pancreatic cells and
in obesity and hyperglycemia. Journal of Clinical Endocrinology and Metabolism 2006, 91:3171-3180.
4. Bellocchio L, Cervino C, Pasquali R, Pagotto U: The endocannabinoid system and energy metabolism. Journal of Neuroendocrinology 2008, 20:850-857.
5. Pagano C, Rossato M, Vettor R: Endocannabinoids, adipose tissue and lipid metabolism. Journal of Neuroendocrinology 2008, 20:124-129.
6. Murdolo G, Kempf K, Hammarstedt A, Herder C, Smith U, Jansson PA: Insulin differentially modulates the peripheral endocannabinoid system in human subcutaneous abdominal adipose tissue from lean and obese individuals. Journal of Endocrinological Investigation 2007, 30:RC17-21.
7. D'Eon TM, Pierce KA, Roix JJ, Tyler A, Chen H, Teixeira SR: The role of adipocyte insulin resistance in the pathogenesis of obesity-related elevations in endocannabinoids. Diabetes 2008, 57:1262-1268.
8. Di Marzo V, Verrijken A, Hakkarainen A, Petrosino S, Mertens I, Lundbom N, Piscitelli F, Westerbacka J, Soro-Paavonen A, Matias I, Van Gaal L, Taskinen MR: Role of insulin as a negative regulator of plasma endocannabinoid levels in obese and nonobese subjects. European Journal of Endocrinology 2009, 161:715-722.
9. Engeli S, Böhnke J, Feldpausch M, Gorzelniak K, Janke J, Bátkai S, Pacher P, Harvey-White J, Luft FC, Sharma AM, Jordan J: Activation of the peripheral endocannabinoid system in human obesity. Diabetes 2005, 54:2838-2843.
10. Blüher M, Engeli S, Klöting N, Berndt J, Fasshauer M, Bátkai S, Pacher P, Schön MR, Jordan J, Stumvoll M: Dysregulation of the peripheral and adipose tissue endocannabinoid system in human abdominal obesity. Diabetes 2006, 55:3053-3060.
11. Côté M, Matias I, Lemieux I, Petrosino S, Alméras N, Després JP, Di Marzo V: Circulating endocannabinoid levels, abdominal adiposity and related cardiometabolic risk factors in obese men. International journal of obesity 2007, 31:692-699.
12. Di Marzo V, Côté M, Matias I, Lemieux I, Arsenault BJ, Cartier A, Piscitelli F, Petrosino S, Alméras N, Després JP: Changes in plasma endocannabinoid levels in viscerally obese men following a 1 year lifestyle modification programme and waist circumference reduction: associations with changes in metabolic risk factors. Diabetologia 2009, 52:213-217.
13. Starowicz KM, Cristino L, Matias I, Capasso R, Racioppi A, Izzo AA, Di Marzo V: Endocannabinoid dysregulation in the pancreas and adipose tissue of mice fed with a high-fat diet. Obesity (Silver Spring) 2008, 16:553-565.
14. Izzo AA, Piscitelli F, Capasso R, Aviello G, Romano B, Borrelli F, Petrosino S, Di Marzo V: Peripheral endocannabinoid dysregulation in two experimental models of obesity: potential relationships with intestinal motility and food deprivation/refeeding-induced energy processing. British Journal of Pharmacology 2009, 158:451-461.
15. Di Marzo V: Endocannabinoids: synthesis and degradation. Reviews of physiology, biochemistry and pharmacology 2008, 160:1-24.
16. Löfgren P, Sjölin E, Wåhlen K, Hoffstedt J: Human adipose tissue cannabinoid receptor 1 gene expression is not related to fat cell function or adiponectin level. Journal of clinical endocrinology and metabolism 2007, 92:1555-1559.
17. Kempf K, Hector J, Strate T: Immune-mediated activation of the endocannabinoid system in visceral adipose tissue in obesity. Hormone and Metablic Research 2007, 39:596-600.
18. Annuzzi G, Giacco R, Patti L, Di Marino L, De Natale C, Costabile G, Marra M, Santangelo C, Masella R, Rivellese AA: Postprandial chylomicrons and adipose tissue lipoprotein lipase are altered in type 2 diabetes independently of obesity and whole-body insulin resistance. Nutrition, metabolism, and cardiovascular diseases 2008, 18:531-538.
19. Annuzzi G, Giacco R, Patti L, Bozzetto L, Viscovo D, Rivellese AA: Low plasma leptin levels in well controlled type 2 diabetes are not related to body fat mass and whole-body insulin resistance. Nutrition, metabolism, and cardiovascular diseases 2008, 18:e35-36.
20. Després JP, Lemieux I: Abdominal obesity and metabolic syndrome. Nature 2006, 444:881-887.
21. Hansen HS, Diep TA: N-acylethanolamines, anandamide and food intake. Biochemical Pharmacology 2009, 78:553-560.
22. Izzo AA, Piscitelli F, Capasso R, Marini P, Cristino L, Petrosino S, Di Marzo V: Basal and Fasting/Refeeding-regulated Tissue Levels of Endogenous PPAR-alpha Ligands in Zucker Rats. Obesity (Silver Spring) 2010, 18:55-62.
23. Marsicano G, Wotjak CT, Azad SC, Bisogno T, Rammes G, Cascio MG, Hermann H, Tang J, Hofmann C, Zieglgänsberger W, Di Marzo V, Lutz B:
Received: 25 March 2010 Accepted: 28 April 2010 Published: 28 April 2010This article is available from: http://www.lipidworld.com/content/9/1/43© 2010 Annuzzi et al; licensee BioMed Central Ltd. This is an Open Access article distributed under the terms of the Creative Commons Attribution License (http://creativecommons.org/licenses/by/2.0), which permits unrestricted use, distribution, and reproduction in any medium, provided the original work is properly cited.Lipids in Health and Disease 2010, 9:43

Annuzzi et al. Lipids in Health and Disease 2010, 9:43http://www.lipidworld.com/content/9/1/43
Page 8 of 8
The endogenous cannabinoid system controls extinction of aversive memories. Nature 2003, 418:530-534.
24. Rivellese AA, Giacco R, Annuzzi G, De Natale C, Patti L, Di Marino L, Minerva V, Costabile G, Santangelo C, Masella R, Riccardi G: Effects of monounsaturated vs. saturated fat on postprandial lipemia and adipose tissue lipases in type 2 diabetes. Clinical Nutrition 2008, 27:133-141.
25. Santangelo C, Matarrese P, Masella R, Di Carlo MC, Di Lillo A, Scazzocchio B, Vecci E, Malorni W, Perfetti R, Anastasi E: Hepatocyte growth factor protects rat RINm5F cell line against free fatty acid-induced apoptosis by counteracting oxidative stress. Journal of molecular endocrinology 2007, 38:147-158.
26. Lo Verme J, Gaetani S, Fu J, Oveisi F, Burton K, Piomelli D: Regulation of food intake by oleoylethanolamide. Cellular and molecular life sciences 2005, 62:708-716.
27. Guzmán M, Lo Verme J, Fu J, Oveisi F, Blázquez C, Piomelli D: Oleoylethanolamide stimulates lipolysis by activating the nuclear receptor peroxisome proliferator-activated receptor alpha (PPAR-alpha). Journal of biological chemistry 2004, 279:27849-27854.
28. Bozzetto L, Annuzzi G, Prinster A, Mancini M, Giacco R, De Natale C, Maurea S, Salvatore M, Riccardi G, Rivellese AA: Liver fat and type 2 diabetes: specific roles of diabetes and overweight. Diabetologia 2008, 51(Suppl 1):S1-S588.
29. Di Marzo V, Maccarrone M: FAAH and anandamide: is 2-AG really the odd one out? Trends in pharmacological sciences 2008, 29:229-233.
30. Zygmunt PM, Petersson J, Andersson DA, Chuang H, Sørgård M, Di Marzo V, Julius D, Högestätt ED: Vanilloid receptors on sensory nerves mediate the vasodilator action of anandamide. Nature 1999, 400:452-457.
31. Bouaboula M, Hilairet S, Marchand J, Fajas L, Le Fur G, Casellas P: Anandamide induced PPARgamma transcriptional activation and 3T3-L1 preadipocyte differentiation. European Journal of Pharmacology 2005, 517:174-181.
32. Petrosino S, Ligresti A, Di Marzo V: Endocannabinoid chemical biology: a tool for the development of novel therapies. Current Opinion in Chemical Biology 2009, 13:309-320.
33. Phinney SD: Arachidonic acid maldistribution in obesity. Lipids 1996, 31(Suppl):S271-S274. Review
34. Berger A, Crozier G, Bisogno T, Cavaliere P, Innis S, Di Marzo V: Anandamide and diet: inclusion of dietary arachidonate and docosahexaenoate leads to increased brain levels of the corresponding N-acylethanolamines in piglets. Proc Natl Acad Sci USA 2001, 98:6402-6406.
35. Monteleone P, Matias I, Martiadis V, De Petrocellis L, Maj M, Di Marzo V: Blood levels of the endocannabinoid anandamide are increased in anorexia nervosa and in binge-eating disorder, but not in bulimia nervosa. Neuropsychopharmacology 2005, 30:1216-1221.
36. Bermúdez-Silva FJ, Suárez J, Baixeras E, Cobo N, Bautista D, Cuesta-Muñoz AL, Fuentes E, Juan-Pico P, Castro MJ, Milman G, Mechoulam R, Nadal A, Rodríguez de Fonseca F: Presence of functional cannabinoid receptors in human endocrine pancreas. Diabetologia 2008, 51:476-487.
37. Cota D, Genghini S, Pasquali R, Pagotto U: Antagonizing the cannabinoid receptor type 1: a dual way to fight obesity. Journal of endocrinological investigation 2003, 26:1041-1044.
38. Bennetzen MF, Nielsen TS, Paulsen SK, Bendix J, Fisker S, Jessen N, Lund S, Richelsen B, Pedersen SB: Reduced cannabinoid receptor 1 protein in subcutaneous adipose tissue of obese. Eur J Clin Invest 2009 in press.
39. Sarzani R, Bordicchia M, Marcucci P, Bedetta S, Santini S, Giovagnoli A, Scappini L, Minardi D, Muzzonigro G, Dessì-Fulgheri P, Rappelli A: Altered pattern of cannabinoid type 1 receptor expression in adipose tissue of dysmetabolic and overweight patients. Metabolism 2009, 58:361-367.
40. Murdolo G, Smith U: The dysregulated adipose tissue: a connecting link between insulin resistance, type 2 diabetes mellitus and atherosclerosis. Nutrition, metabolism, and cardiovascular diseases 2006:S35-38. Review
41. Taskinen MR: Diabetic dyslipidaemia: from basic research to clinical practice. Diabetologia 2003, 46:733-749. Review
doi: 10.1186/1476-511X-9-43Cite this article as: Annuzzi et al., Differential alterations of the concentra-tions of endocannabinoids and related lipids in the subcutaneous adipose tissue of obese diabetic patients Lipids in Health and Disease 2010, 9:43