Cessation of daily wheel running differentially alters fat oxidation capacity in liver, muscle, and...
35
1 Cessation of daily wheel running differentially alters fat oxidation capacity in liver, muscle, and adipose tissue Authors: Matthew J. Laye 3 , R. Scott Rector 5 , Sarah J. Borengasser 4 , Scott P. Naples 4 , Grace M. Uptergrove 5 , Jamal A. Ibdah 1,5,3 Frank W. Booth 2,3 , and John P. Thyfault 1,4,5 Research Service, Harry S. Truman VA Medical Center 1 Departments of Biomedical Sciences 2 , Medical Pharmacology and Physiology 3 , Nutritional Sciences 4 , and Internal Medicine-Division of Gastroenterology and Hepatology 5 , University of Missouri, Columbia, MO 65211 Running Head: Lipid oxidation in the transition to physical inactivity Keywords: physical inactivity, mitochondria, metabolism Corresponding Author John P. Thyfault, PhD Research Service Harry S. Truman Memorial VA Hospital Departments of Nutritional Sciences and Internal Medicine-Gastroenterology University of Missouri Columbia, MO 65211 573-814-6000 x53742 [email protected] Articles in PresS. J Appl Physiol (October 30, 2008). doi:10.1152/japplphysiol.91186.2008 Copyright © 2008 by the American Physiological Society.
-
Upload
independent -
Category
Documents
-
view
5 -
download
0
Transcript of Cessation of daily wheel running differentially alters fat oxidation capacity in liver, muscle, and...
1
Cessation of daily wheel running differentially alters fat oxidation capacity
in liver, muscle, and adipose tissue
Authors: Matthew J. Laye3, R. Scott Rector5, Sarah J. Borengasser4, Scott P. Naples4, Grace M. Uptergrove5, Jamal A. Ibdah1,5,3 Frank W. Booth2,3, and John P. Thyfault1,4,5
Research Service, Harry S. Truman VA Medical Center1
Departments of Biomedical Sciences2, Medical Pharmacology and Physiology3, Nutritional Sciences4, and Internal Medicine-Division of Gastroenterology and Hepatology5, University of Missouri, Columbia, MO 65211 Running Head: Lipid oxidation in the transition to physical inactivity Keywords: physical inactivity, mitochondria, metabolism Corresponding Author John P. Thyfault, PhD Research Service Harry S. Truman Memorial VA Hospital Departments of Nutritional Sciences and Internal Medicine-Gastroenterology University of Missouri Columbia, MO 65211 573-814-6000 x53742 [email protected]
Articles in PresS. J Appl Physiol (October 30, 2008). doi:10.1152/japplphysiol.91186.2008
Copyright © 2008 by the American Physiological Society.

2
Abstract
Physical inactivity is associated with the increased risk of developing chronic metabolic
diseases. To understand early alterations caused by physical inactivity, we utilize an
animal model in which rats are transitioned from daily voluntary wheel running to a
sedentary condition. In the hours and days following this transition, adipose tissue mass
rapidly increases, due in part to increased lipogenesis. However, whether a concurrent
decrease in fatty acid oxidative capacity (FAO) in skeletal muscle, liver, and adipose
tissue occurs during this period is unknown. Following six weeks of access to voluntary
running wheels (average distance of ~6 km a night), rats were rapidly transitioned to a
sedentary state by locking the wheels for 5 hours (WL5) or 173 hours (WL173).
Complete (14C palmitate oxidation to 14CO2) and incomplete (14C palmitate oxidation to
14C labeled acid soluble metabolites) was determined in isolated mitochondrial and whole
homogenate preparations from skeletal muscle and liver and in isolated adipocytes.
Strikingly, the elevated complete FAO in the red gastrocnemius at WL5 fell to that of
rats that never ran (SED) by WL173. In contrast, hepatic FAO was elevated at WL173
above both WL5 and SED groups; while in isolated adipocytes, FAO remained higher in
both running groups (WL5 and WL173) compared to the SED group. The alterations in
muscle and liver fat oxidation were associated with changes in carnitine palmitoyl
transferase-1 activity and inhibition, but not significant changes in other mitochondrial
enzyme activities. In addition, PGC-1α mRNA levels that were higher in both skeletal
muscle and liver at WL5 fell to SED levels at WL173. This study is the first to
demonstrate that the transition from high to low daily physical activity causes rapid,
tissue-specific changes in FAO.
3
Introduction
Alterations in our current environment, including physical inactivity and the
excessive consumption of high calorie/fat foods, are root causes for the rapid rise of
obesity and diabetes in humans (1;6;15;41). Although many investigations have detailed
the role of over-nutrition following changes in substrate utilization and storage, the
effects of a transition from high to low physical activity remain largely understudied and
underappreciated.
Our research group utilizes “the rodent wheel lock model” to study acute
transitions from high to low levels of daily physical activity (26;27;30;34;38). After days
or weeks of daily voluntary wheel running (5-15 km/night), wheels are locked for
progressive periods of time (from 5 to 173 hours) providing an acute window of time to
study the metabolic alterations that ensue. While resulting in only modest increases in
mitochondrial enzymes compared to forced treadmill training (11;28), voluntary wheel
running (5-15 km/night) can increase energy expenditure far greater than treadmill
training (~2 km/60 min treadmill bout). Thus, it is a good model to study the transition
from high to low daily physical activity, but an inappropriate model to study detraining.
In our previous studies, the sudden cessation of daily running caused rapid and robust
increases in the weight of retroperitoneal and omental fat pads after 53 and 173 hours of
wheel lock whose causes are beginning to be explained by intrinsic changes in substrate
partitioning and not simply a positive energy balance due to decreased daily energy
4
expenditure (26;30). For example, rates of key enzymes in adipose tissue de novo
lipogenesis and palmitate incorporation into adipose triglycerides remain significantly
higher in the hours and days immediately following wheel lock (26;27) and after the
cessation of forced treadmill running (9). Although, enhanced de novo lipogenesis could
partially explain the rapid increases in fat pad weight after the cessation of activity, we
also speculated that rapid decreases in fatty acid oxidative capacity (FAO) of skeletal
muscle, liver, and adipose tissue also may play a significant role.
Decreased FAO in metabolic tissues has been strongly associated with chronic
disease(s) (5;13;14;16;20;21;42). Though findings are not universal (12;25), extremely
obese and type 2 diabetic subjects display reduced systemic and skeletal muscle FAO,
which has been linked to increased adiposity, increased intramuscular lipid storage, and
skeletal muscle insulin resistance (5;14;21;44). Decreased hepatic FAO directly causes
or increases susceptibility for fatty liver and steatosis (17;39) and also has been linked to
increased susceptibility to diet-induced obesity (18). In addition to skeletal muscle and
liver FAO in adipocytes has become an important area of study. FAO is decreased in the
adipose tissue of db/db mice (7) and mitochondrial markers are also reduced in the
adipocytes of several animal models of type 2 diabetes and obesity (8;13;16;20;42;46).
However, while it is well known that increased physical activity decreases the risks of
type 2 diabetes and obesity it remains unknown whether physical activity modifies
adipocyte FAO.
The aim of this study was to determine if the cessation of voluntary wheel running
leads to concurrent alterations in tissue fatty acid catabolism, carnitine palmitoyl
transferase-1 (CPT-1) activity and regulation, and mitochondrial enzyme activity. Since
5
the transition from high to low physical activity is likely to cause systemic changes, we
assessed FAO and mitochondrial function in adipose tissue, liver, and mixed skeletal
muscle in hopes of better understanding the integrative response(s) of an organism to
reductions in energy expenditure and rapid gains in adiposity. We hypothesized, that the
transition from high to low physical activity would lead to a coincident reduction in FAO
and mitochondrial enzyme activity in skeletal muscle, liver, and adipocytes.
6
Methods
Animal protocol. The animal protocol was approved by the Institutional Animal
Care and Use Committee at the University of Missouri-Columbia. Thirty-six, male
Fischer 344 x Brown Norway F1 hybrid rats (Harlan) were obtained at 21 days of age.
Animals were randomly separated into those with access to running wheels (WL) and
those without access to the wheels (Sed). Rats assigned to running groups were
immediately housed (at the age of 21 days) in cages equipped with a voluntary running
wheels outfitted with a Sigma Sport BC 800 bicycle computer (Cherry Creek Cyclery,
Foster Falls, VA) for measuring daily running activity. Voluntary running was selected to
approximate the more natural physical activity level of the animal. Rats were maintained
on a 12-h light, 12-h dark cycle that ran from 0600 to 1800. Running activity was
obtained every day of running between 0800 and 1000, and rats in the running group had
access to wheels and food and water ad libitum until ~9 wk of age, at which time (0600)
wheels were locked. Rats were anesthetized [ketamine (80 mg·kg–1), xylazine (10 mg·kg–
1), and acepromazine (4 mg·kg–1)] and killed by exsanguination by removal of the heart
either 5 h (WL5), or 173 h (WL173) after locking of wheels; the sedentary rats (SED)
were sacrificed at the same time. All animals were fasted for 5 hours prior to sacrifice.
Dual-energy X-ray absorptiometry (DEXA). One week prior to and the day of
sacrifice animals were anesthetized with isoflurane (one week prior) or ketamine (80
mg·kg–1), xylazine (10 mg·kg–1), and acepromazine (4 mg·kg–1) (day of sacrifice) and
whole-body composition was measured using a Hologic QDR-1000/w DEXA machine
calibrated for rats.

7
Serum measures. Plasma glucose (Sigma), triglycerides (Sigma), and free fatty
acids (FFAs; Wako Chemicals, Richmond, VA) were measured with commercially
available kits according to the manufacturer's instructions.
Adipocyte isolation. Adipocytes from epididymal fat pads were isolated by a
modification of the Rodbell method (26;40). Fresh triplicate 30 μL aliquots of packed
adipocytes were used for FAO and a single 30 μL aliquot frozen at -80° C for DNA
content, with the remainder lysed in Cell Lytic (Sigma, USA) for enzyme activity assays.
Adipocyte DNA Content. DNA content in isolated adipocytes was determined by
the flurometric assay described by Labarca and Paigen (29). Briefly, packed adipocytes
were lysed in 2M NaCl, 50 mM NaPO4 (pH 7.4) and 20 ul added to 80 μL of working
solution (0.04 μg/mL of Hoeschst #33258, 10 mM Tris-HCl, 1mM EDTA, 200 mM
NaCl, pH 7.4) in a 96-well plate. Samples were excited at 356 nm resulting in an
emission at 458 nm. Calf thymus DNA (Sigma, USA) was used to generate a standard
curve.
Tissue homogenization procedure. Red gastrocnemius and livers were quickly
excised from anesthetized rats and placed in ice-cold isolation buffer (100 mM KCl, 40
mM Tris·HCl, 10 mM Tris-base, 5 mM MgCl2·6H2O, 1 mM EDTA, and 1 mM ATP; pH
7.4). For fresh acid oxidation assays, 50–100 mg of tissue was thoroughly minced with
scissors in 200 µl SET buffer (250 mM sucrose, 1 mM EDTA, 10 mM Tris·HCl, and 2
mM ATP; pH 7.4) and then the buffer volume was brought up to yield a 20-fold (wt/vol)
diluted sample. This was transferred to a 3-ml Potter-Elvehjem glass homogenization
vessel. Tissue suspensions were mechanically homogenized on ice with a Teflon pestle at
8
10 passes over the course of 30 s at 1,200 rpm. Homogenates were kept on ice until
oxidation experiments were performed.
Mitochondrial isolation from red gastrocnemius skeletal muscle and liver.
Mitochondrial suspensions were prepared according to modified methods of Koves et al.
(23;24). A portion of the red gastrocnemius and liver was quickly excised from
unconscious rats and placed in 5 ml of fresh buffer A (100 mM KCl, 50 mM MOPS, 5
mM MgSO4, 1 mM EGTA, 1 mM ATP, pH 7.4). The tissue was then minced and
suspended 7-fold (wt/vol) in buffer A, and homogenized for 15 s. The homogenate was
then centrifuged at 800 g for 10 min at 4°C and the supernatant was filtered through gauze
and set aside. The remaining pellet was resuspended in buffer A, homogenized, and the
homogenate was then centrifuged at 800 g for 10 min at 4°C. The remaining supernatant
was added to the previously set aside supernatant after filtering through gauze. The
pooled supernatants were centrifuged at 9,000 g to pellet the mitochondria. The pellet
was resuspended in buffer B (buffer A, 0.2% BSA, pH 7.4), and centrifuged at 8,000 g
before the pellet was washed and resuspended in buffer C (100 mM KCl, 50 mM MOPS,
0.5 mM EGTA, pH 7.4) and centrifuged for 10 min at 7,000 g. The final pellet was
resuspended in 0.5 ml of sucrose EDTA (SET) buffer and protein content was
determined.
Fatty acid oxidation. FAO was measured with radiolabeled [1-14C]palmitate
(American Radiochemicals) in fresh red gastrocnemius skeletal muscle and liver
homogenates and isolated mitochondria using modified methods of Dohm et al.(10;39).
The reaction buffer used for whole homogenates utilized a cold palmitate concentration
of 200 µM while the reaction buffer used for isolated mitochondria utilized a
9
concentration of 50 µM. For isolated adipocytes, 30 µl of freshly isolated
adipocytes/reaction was added to 120 µl reaction buffer in a trapping device with an
adjacent chamber containing 100 µl of NaOH that captured the 14CO2, representing the
complete oxidation radiolabeled palmitate, when 100 µl of perchloric acid was added to
the reaction following a two-hour incubation at 37º C. The 14C labeled acid soluble
metabolites, representing incomplete FAO were also collected.
Citrate synthase, beta-hydroxyacyl-CoA dehydrogenase (β-HAD), and
cytochrome c oxidase activity. Citrate synthase and β-HAD activities were determined in
red gastrocnemius, liver, and adipocyte homogenates using the methods of Srere et al
(43) and Bass et al (4), respectively, and as previously described by our group (39). β-
HAD activity was undetectable in the adipocyte fraction. Cytochrome c oxidase activity
was determined by a commercially available kit (Sigma, St. Louis, MO, USA) in all three
tissues as previously described by our group (38). All assays were performed at 37˚C.
CPT-1 assay CPT-1 activity and inhibition by malonyl-CoA using modified
methods of Koves et al. (25). 90 µl of reaction buffer (117 mM Tris HCl, 0.28 mM
reduced Glutathione, 4,4 mM ATP, 50 uM Palmitoyl-CoA, 4 mg/ml Rotenone, 0.1%
BSA) containing 0.2 mM [3H]-Carnitine and either 0 or 10 µM malonyl-CoA was added
to 10 µl of isolated mitochondria of red gastrocnemius skeletal muscle and liver
homogenate for 6 min at 37oC. [3H]palmitoyl-carnitine formed was extracted with 350 µl
of water-saturated butanol, quantified by liquid-scintillation counting, and normalized to
protein content.
Statistics. Each outcome measure was examined in 6-8 animals. For each outcome
measure, a one-way analysis of variance was performed (Sigma Stat). However, if
10
normality of the data set failed, a Kruskal-Wallis ANOVA on ranks was performed, with
Dunn’s method comparison (control group = WL5) as the post-hoc test. A significant
main effect (p<0.05) was followed-up with Student-Newman-Kuel post-hoc comparisons.
Values are reported as means ± standard error of the mean (SE), and a P < 0.05 denotes a
statistically significant difference.
11
Results
Body Composition. DEXA measures were taken 7 days prior to, and on the day of
sacrifice to capture any changes leading to sacrifice. In the 173-hour wheel lock period,
the WL173 group increased percent body fat and total body fat mass by 45% and 46%,
respectively, (p < 0.05), essentially returning body fat levels to those measured in the
SED group (Table 1). No changes in percent or total body fat mass occurred in the 7
days prior to sacrifice in the WL5 or SED groups. Intriguingly total lean mass showed a
different pattern than total fat mass (Table 1). Total lean mass increased in WL5 and SED
in the 7 days prior to sacrifice suggesting a positive protein balance (p < 0.05). In
contrast the WL173 group did not show a net increase in lean body mass during the 7
days of wheel lock prior to sacrifice, suggesting different rates of lean mass catabolism
and/or anabolism during the 7 days following the cessation of running. All groups gained
equal body mass in the 7 days prior to sacrifice.
Food Intake and Running Distances. Average daily food intakes during the last
week of life for WL5 and WL173 were 27% and 37%, respectively, higher than SED
(p<0.05) (Table 1). This is consistent with our previous findings that voluntary wheel
running rats have greater food intakes than sedentary counterparts in this strain, age and
gender of rat (26;30). During the 7 days of wheel lock, the WL173 group decreased their
average daily food intake by 12% (p<0.05) as compared to the previous week; at the
same time, food intake by the SED group increased 11% (p<0.05). Therefore, any
differences detected were not due to overeating by the WL173 group since they ate a
similar level to the SED during the 173 hrs of WL.
12
Neither total 6-wk nor average daily running distances (6.12 vs. 5.43 km/day,
p=0.42) differed between WL5 and WL173 groups. The average daily running distance in
the last week of running was 8.87 km and 9.73 km in WL5 and WL173 groups,
respectively (p=0.68).
Fat Pad and Serum Characteristics. Absolute epididymal fat masses did not differ
among groups (p=0.086), but when normalized to total mass, WL5 were lower than
WL173 by 25% (p<0.05). Serum triglycerides (p=0.146), FFAs (p=0.188), and glucose
(p=0.147) did not statistically differ among WL5, WL173, and SED groups (Table 2).
Fatty Acid Oxidation and Mitochondrial Enzyme Activities. Complete [14CO2]
and incomplete [14C labeled acid soluble metabolites (ASM)] capacity for palmitate
oxidation was determined in isolated mitochondria or whole tissue homogenates from red
gastrocnemius muscle and liver. In addition, complete and incomplete FAO was also
measured in isolated adipocytes from epididymal fat pads. For whole red gastrocnemius
homogenate, palmitate oxidation at WL5 was 33% and 50% higher than WL173 and
SED, respectively, (p=0.059; Figure 1A). For isolated mitochondria from the red
gastrocnemius muscle, complete palmitate oxidation to CO2 was 91% higher at WL5
compared with SED (p<0.05, Figure 1B) but did not differ from WL173 (p=0.24).
In a contrast to what was found in the red gastrocnemius skeletal muscle,
complete hepatic FAO increased after the transition to physical inactivity. Whole liver
homogenates from the WL173 group completely oxidized 65% and 46% more palmitate
than WL5 and SED groups respectively (p<0.05; Figure 2A). Total palmitate oxidation
(CO2 + ASMs) in liver did not differ among groups, an effect potentially in part due to
the contribution of extra-mitochondrial peroxisomal activity. In addition, complete
13
oxidation in the isolated liver mitochondria was not statistically different among groups,
but showed a similar trend as the whole homogenate (Figure 2B).
In isolated epididymal adipocytes, complete palmitate oxidation was 81% higher
in the WL5 compared to SED (p<0.05) and 71% higher in the WL173 compared to SED
(p<0.05), but not different between WL5 and WL173 when normalized to the volume of
packed adipocytes (Figure 3A). However, when complete palmitate oxidation was
normalized to DNA content (ng of DNA/30μL of packed adipocytes) WL173 no longer
remained significantly higher than SED group (Figure 3B). Total palmitate oxidation
(CO2 + ASMs) in the adipocytes did not differ among groups.
No statistically significant differences in β-hydroxy-acetyl-CoA dehydrogenase,
citrate synthase, or cytochrome c oxidase activities in red gastrocnemius, liver, or isolated
adipocytes were detected among groups (Table 3).
CPT-1 activity. In isolated mitochondria from red gastrocnemius muscle, the WL5
group had 41% higher baseline CPT-1 activity than the WL173 group (p<0.05) but WL5
did not differ from SED. As expected, the addition of 10 μM malonyl-CoA caused
decreases in CPT-1 activity in all three groups (Figure 4). Unexpectedly, the change in
CPT-1 activity from baseline to 10 μM malonyl-CoA was nearly twice as much (delta) in
the WL5 group compared to the WL173 and SED groups (p<0.05), suggesting a greater
CPT-1 sensitivity to malonyl-CoA in a physically active condition (WL5) that was lost
after 7 days of lowered physical activity (WL173). No differences in the CPT-1 activity
of isolated mitochondria from liver existed among groups for 0 or 10 μM malonyl-CoA
concentrations.
14
PGC-1α mRNA Levels. PGC-1α mRNA levels were significantly higher at WL5
compared with the SED group in both red gastrocnemius and liver (Figure 5A, 5B). The
transition from WL5 to WL173 led to a 35% and 68% decrease in red gastrocnemius (p =
0.05) and liver (p < 0.05) PGC-1α mRNA levels, respectively. Consequently, WL173
and SED groups PGC-1α mRNA did not differ in red gastrocnemius (Figure 5A).
Remarkably in the liver, WL173 PGC-1α mRNA fell to levels significantly less than the
SED group (Figure 5B). In epididymal adipose tissue, PGC-1α mRNA did not differ
among groups (Figure 5C).
15
Discussion
The transition from high to low physical activity in our rat model caused: 1)
dissimilar responses for FAO in skeletal muscle (decreasing from its elevated value in
daily running), liver (increasing from its unchanged value in daily running), and adipose
tissue (maintenance of its increased value in daily running); 2) decreased CPT-1 activity
and increased CPT-1 sensitivity to malonyl-CoA inhibition in muscle; 3) reduced PGC-
1α mRNA in both skeletal muscle and liver; and 4) impaired growth of lean body mass
compared to animals that sustain wheel running or the sedentary condition.
The transition from high to low physical activity likely decreases FAO in skeletal
muscle by decreasing cellular energy requirements and decreasing PGC-1α expression, a
critical transcriptional co-activator that coordinates increases in FAO enzyme,
mitochondrial biogenesis, and a general increase in oxidative capacity. Observing similar
trends in both homogenate and mitochondrial fraction leads us to speculate that the
changes in FAO are not entirely due to a mass action effect, but also in part to an inherent
change in mitochondrial “quality”, which may be related to PGC-1α expression.
PGC-1α, as a co-activator, putatively increases FAO by increasing the promoter
activity and thus expression of pyruvate dehydrogenase kinase-4 and CPT-1 (31;47).
This results in more acetyl CoA being derived from fatty acids and increased fatty acid
entry into the mitochondria (23). Unlike muscle, where energy derived from FAO fuels
muscle contraction, an increase in hepatic PGC-1α mediated FAO provides a key source
of ATP for ketogenesis and gluconeogenesis during fasting conditions (48). A limitation
of the current study is that we did not measure oxidation of substrates, malate or
pyruvate, that are commonly used to assess mitochondrial function.

16
Exercise causes an acute and transient increase in skeletal muscle PGC-1α gene
expression (2;37). Conversely, we show here that the cessation of daily physical activity
reduces skeletal muscle PGC-1α expression in 173 h supporting earlier work in which
more extreme forms of physical inactivity reduced skeletal muscle PGC-1α in humans
(45). We also witnessed that CPT-1 activity, a downstream target of PGC-1α, decreased
in red gastrocnemius skeletal muscle after the cessation of daily running. Reduced PGC-
1α expression in skeletal muscle has been linked to insulin resistance in sedentary
subjects (33;36), leading us to speculate that a physical inactivity induced drop in PGC-
1α is linked to skeletal muscle insulin resistance.
To our knowledge, this is the first report to measure changes in hepatic PGC-1α
expression after chronic voluntary exercise or after a transition to inactivity. We
speculate that daily exercise increases hepatic PGC-1α in a similar manner to fasting as
both stimuli rely on increased hepatic glucose output to restore or sustain plasma glucose
homeostasis. Interestingly, in contrast to what was found in muscle, the reduction in
hepatic PGC-1α expression found after wheel lock was associated with increased
complete hepatic FAO and no change in CPT-1 enzyme activity. Further research is
needed to fully understand hepatic PGC-1α gene expression, its regulation by exercise,
and its role in controlling hepatic FAO.
Intracellular accumulation of malonyl-CoA reduces fat and increases glucose
utilization by the mitochondria (3;32). The current findings show a greater reduction in
CPT-1 activity in the presence of 10 uM malonyl-CoA in the WL5 group suggesting that
skeletal muscle mitochondrial fatty acid entry may be more tightly regulated in wheel
running rats, than SED rats. Potentially, this would allow for skeletal muscle to be more
17
responsive in switching substrate utilization to match current energy demands. In
addition, the CPT-1 responses to 10 uM malonyl CoA were similar between SED and
WL173 skeletal muscle, suggesting that the enhanced exercise-induced regulation of
CPT-1 by malonyl CoA is quickly lost if daily physical activity is not maintained. A lack
of malonyl CoA inhibition is also noted with type 2 diabetes, where isolated skeletal
muscle mitochondria have greater FAO than healthy controls despite having elevated
malonyl CoA levels (3). Collectively, these observations suggest that physical activity
modulates plasticity for malonyl-CoA’s effects on skeletal muscle CPT-1 activity.
We speculate that the observed increase in complete FAO in liver during 7-day
periods of decreased physical activity, in addition to the expansion of adipose tissue, may
help prevent excess lipid storage in lean animals on a low-fat diet. The findings that
complete hepatic FAO is increased after the cessation of wheel running is opposite to our
previous findings in hyperphagic, obese OLETF rats in which the cessation of wheel
running for 7 days reduced hepatic palmitate oxidation to sedentary levels (38). These
differences may be due to the larger body fat stores and /or older age in the OLETF rat.
It is important to emphasize that the witnessed changes were for complete FAO (14C
palmitate to 14CO2) or the complete breakdown of fatty acids through the TCA cycle,
rather than the incomplete oxidation of fatty acids (14C palmitate to 14C labeled acid
soluble metabolites) in which fatty acids are only processed through β-oxidation. The
difference between complete and incomplete FAO is significant for two reasons, 1) only
complete FAO is coupled to significant ATP production, and 2) as suggested by Koves et
al. complete FAO is less likely to produce intermediate metabolites that may negatively
impact metabolic processes (25). In addition, our FAO measurements represent the
18
maximal capacity or potential to oxidize fatty acids, and because they are not in-vivo
measures they should be interpreted cautiously.
Unlike skeletal muscle and liver, adipocyte FAO remained elevated over the SED
group with 7 days of physical inactivity. Mitochondrial DNA number (mtDNA) from
human subcutaneous fat is positively associated with increased lipogenic enzymes (19),
and we previously have demonstrated that cessation of voluntary wheel running increased
protein and enzyme activity for mitochondrial glycerol-3-phosphate acyltransferase, a
rate-limiting lipogenic enzyme, in adipose tissue in rats (27). In addition, although our
unpublished preliminary work has found no significant change in red gastrocnemius or
liver triglyceride content, there is a significant increase in adipocyte triglyceride
deposition after the cessation of wheel running in wild-type rats on a low-fat diet (26;30).
The exercise-induced increase in adipose FAO in adipose tissue with ceased running may
partially supply ATP for free fatty acid reesterfication, an energy costly process, or the
increased ATP may be used to synthesize adipokines like adiponectin, a process shown to
require functional mitochondria (22).
To our knowledge this is the first evidence that the cessation of voluntary running
acutely (for at least 173 h) attenuates lean body mass growth. We have also recently
reported that lean body mass significantly decreases in young healthy men who decrease
their daily walking from 10,501 to 1,344 steps for 2 wks (35). The apparent change in
lean mass in both studies leads us to question if the attenuated growth or loss of muscle
mass in both studies is linked to a repartitioning of glucose and amino acids away from
skeletal muscle (loss of insulin sensitivity) and/or decreased FAO. Because of the
19
importance of lean body mass in metabolic health, future research is needed to study
these interactions.
In conclusion, we show that FAO in skeletal muscle, liver, and adipocytes display
strikingly different responses to a 1-wk transition from high to low daily physical
activity, a period in which fat pad mass increases rapidly. In addition, we found that two
factors associated with metabolic disease, skeletal muscle FAO and PGC-1 α, were both
reduced after the cessation of daily activity. These results support our overall hypothesis
that the cessation of daily physical activity quickly alters metabolic function in a manner
that likely precedes the later development of chronic disease should physical inactivity
continue.
20
Acknowledgements The authors would like to thank Drs. Timothy Koves, Robert Noland, and Michael
Carper for providing protocols and technical advice used in the collection of the data.
MJL was supported by a Life Science Fellowship (University of Missouri), SJB was fully
supported and SPN was partially supported by a NIH T32-AR48523, JPT was supported
by a VA Career Development Grant. Partial research support was provided by the
University of Missouri College of Veterinary Medicine. In addition, the research
presented here is the result of work supported with resources and the use of facilities at
the Harry S. Truman Memorial Veterans Hospital in Columbia, MO.
Disclosures
No financial disclosures.
21
Reference List
1. Astrup A. Healthy lifestyles in Europe: prevention of obesity and type II diabetes by diet and physical activity. Public Health.Nutr 2001 Apr;4(2B):499-515.
2. Baar K, Wende AR, Jones TE, Marison M, Nolte LA, Chen M, Kelly DP, Holloszy JO. Adaptations of skeletal muscle to exercise: rapid increase in the transcriptional coactivator PGC-1. FASEB J. 2002 Dec 1;16(14):1879-86.
3. Bandyopadhyay GK, Yu JG, Ofrecio J, Olefsky JM. Increased Malonyl-CoA Levels in Muscle From Obese and Type 2 Diabetic Subjects Lead to Decreased Fatty Acid Oxidation and Increased Lipogenesis; Thiazolidinedione Treatment Reverses These Defects. Diabetes 2006 Aug 1;55(8):2277-85.
4. Bass A, Brdiczka D, Eyer P, Hofer S, Pette D. Metabolic differentiation of distinct muscle types at the level of enzymatic organization. Eur.J Biochem. 1969 Sep;10(2):198-206.
5. Blaak EE, van Aggel-Leijssen DP, Wagenmakers AJ, Saris WH, van Baak MA. Impaired oxidation of plasma-derived fatty acids in type 2 diabetic subjects during moderate-intensity exercise. Diabetes 2000 Dec 1;49(12):2102-7.
6. Chakravarthy MV, Booth FW. Eating, exercise, and "thrifty" genotypes: connecting the dots toward an evolutionary understanding of modern chronic diseases. J Appl Physiol 2004 Jan;96(1):3-10.
7. Choo HJ, Kim JH, Kwon OB, Lee CS, Mun JY, Han SS, Yoon YS, Yoon G, Choi KM, Ko YG. Mitochondria are impaired in the adipocytes of type 2 diabetic mice. Diabetologia 2006 Apr;49(4):784-91.
8. Dahlman I, Forsgren M, Sjogren A, Nordstrom EA, Kaaman M, Naslund E, Attersand A, Arner P. Downregulation of electron transport chain genes in visceral adipose tissue in type 2 diabetes independent of obesity and possibly involving tumor necrosis factor-alpha. Diabetes 2006 Jun;55(6):1792-9.
9. Dohm GL, Barakat HA, Tapscott EB, Beecher GR. Changes in body fat and lipogenic enzyme activities in rats after termination of exercise training. Proc.Soc.Exp Biol Med 1977 Jun;155(2):157-9.
10. Dohm GL, Huston RL, Askew EW, Weiser PC. Effects of exercise on activity of heart and muscle mitochondria. Am J Physiol 1972 Oct;223(4):783-7.
11. Fitts RH, Booth FW, Winder WW, Holloszy JO. Skeletal muscle respiratory capacity, endurance, and glycogen utilization. Am J Physiol 1975 Apr 1;228(4):1029-33.

22
12. Hancock CR, Han DH, Chen M, Terada S, Yasuda T, Wright DC, HOLLOSZY JO. High-fat diets cause insulin resistance despite an increase in muscle mitochondria. Proceedings of the National Academy of Sciences 2008 Jun 3;105(22):7815-20.
13. Hickner RC, Privette J, McIver K, Barakat H. Fatty acid oxidation in African-American and Caucasian women during physical activity. J Appl Physiol 2001 Jun;90(6):2319-24.
14. Houmard JA. Intramuscular lipid oxidation and obesity. AJP - Regulatory, Integrative and Comparative Physiology 2008 Apr 1;294(4):R1111-R1116.
15. Hu G, Lakka TA, Kilpelainen TO, Tuomilehto J. Epidemiological studies of exercise in diabetes prevention. Appl Physiol Nutr Metab 2007 Jun;32(3):583-95.
16. Hulver MW, Berggren JR, Cortright RN, Dudek RW, Thompson RP, Pories WJ, MacDonald KG, Cline GW, Shulman GI, Dohm GL, et al. Skeletal muscle lipid metabolism with obesity. Am J Physiol Endocrinol Metab 2003 Apr;284(4):E741-E747.
17. Ibdah JA, Perlegas P, Zhao Y, Angdisen J, Borgerink H, Shadoan MK, Wagner JD, Matern D, Rinaldo P, Cline JM. Mice Heterozygous for a Defect in Mitochondrial Trifunctional Protein Develop Hepatic Steatosis and Insulin Resistance. Gastroenterology 2005 May;128(5):1381-90.
18. Ji H, Friedman MI. Reduced hepatocyte fatty acid oxidation in outbred rats prescreened for susceptibility to diet-induced obesity. Int J Obes (Lond) 2008 May 27.
19. Kaaman M, Sparks LM, van H, V, Smith SR, Sjolin E, Dahlman I, Arner P. Strong association between mitochondrial DNA copy number and lipogenesis in human white adipose tissue. Diabetologia 2007 Dec;50(12):2526-33.
20. Kelley DE, Simoneau JA. Impaired free fatty acid utilization by skeletal muscle in non-insulin-dependent diabetes mellitus. J Clin Invest 1994 Dec;94(6):2349-56.
21. Kim JY, Hickner RC, Cortright RL, Dohm GL, Houmard JA. Lipid oxidation is reduced in obese human skeletal muscle. AJP - Endocrinology and Metabolism 2000 Nov 1;279(5):E1039-E1044.
22. Koh EH, Park JY, Park HS, Jeon MJ, Ryu JW, Kim M, Kim SY, Kim MS, Kim SW, Park IS, et al. Essential role of mitochondrial function in adiponectin synthesis in adipocytes. Diabetes 2007 Dec;56(12):2973-81.
23. Koves TR, Li P, An J, Akimoto T, Slentz D, Ilkayeva O, Dohm GL, Yan Z, Newgard CB, Muoio DM. Peroxisome proliferator-activated receptor-gamma co-activator 1alpha-mediated metabolic remodeling of skeletal myocytes mimics exercise training and reverses lipid-induced mitochondrial inefficiency. J Biol Chem. 2005 Sep 30;280(39):33588-98.
23
24. Koves TR, Noland RC, Bates AL, Henes ST, Muoio DM, Cortright RN. Subsarcolemmal and intermyofibrillar mitochondria play distinct roles in regulating skeletal muscle fatty acid metabolism. Am J Physiol Cell Physiol 2005 May;288(5):C1074-C1082.
25. Koves TR, Ussher JR, Noland RC, Slentz D, Mosedale M, Ilkayeva O, Bain J, Stevens R, Dyck JR, Newgard CB, et al. Mitochondrial overload and incomplete fatty acid oxidation contribute to skeletal muscle insulin resistance. Cell Metab 2008 Jan;7(1):45-56.
26. Kump DS, Booth FW. Sustained rise in triacylglycerol synthesis and increased epididymal fat mass when rats cease voluntary wheel running. J Physiol 2005 Jun 15;565(Pt 3):911-25.
27. Kump DS, Laye MJ, Booth FW. Increased mitochondrial glycerol-3-phosphate acyltransferase protein and enzyme activity in rat epididymal fat upon cessation of wheel running. Am J Physiol Endocrinol Metab 2006 Mar;290(3):E480-E489.
28. Kump DS, Booth FW. Alterations in insulin receptor signalling in the rat epitrochlearis muscle upon cessation of voluntary exercise. J Physiol 2005 Feb 1;562(3):829-38.
29. Labarca C, Paigen K. A simple, rapid, and sensitive DNA assay procedure. Anal.Biochem. 1980 Mar 1;102(2):344-52.
30. Laye MJ, Thyfault JP, Stump CS, Booth FW. Inactivity induces increases in abdominal fat. J Appl Physiol 2007 Apr;102(4):1341-7.
31. Louet JF, Hayhurst G, Gonzalez FJ, Girard J, Decaux JF. The Coactivator PGC-1 Is Involved in the Regulation of the Liver Carnitine Palmitoyltransferase I Gene Expression by cAMP in Combination with HNF4alpha and cAMP-response Element-binding Protein (CREB). J.Biol.Chem. 2002 Oct 4;277(41):37991-8000.
32. McGarry JD, Brown NF. The mitochondrial carnitine palmitoyltransferase system. From concept to molecular analysis. Eur.J Biochem. 1997 Feb 15;244(1):1-14.
33. Mootha VK, Lindgren CM, Eriksson KF, Subramanian A, Sihag S, Lehar J, Puigserver P, Carlsson E, Ridderstrale M, Laurila E, et al. PGC-1alpha-responsive genes involved in oxidative phosphorylation are coordinately downregulated in human diabetes. Nat Genet. 2003 Jul;34(3):267-73.
34. Morris RT, Laye MJ, Lees SJ, Rector RS, Thyfault JP, Booth FW. Exercise-induced attenuation of obesity, hyperinsulinemia, and skeletal muscle lipid peroxidation in the OLETF rat. J Appl Physiol 2008 Mar;104(3):708-15.
35. Olsen RH, Krogh-Madsen R, Thomsen C, Booth FW, Pedersen BK. Metabolic responses to reduced daily steps in healthy nonexercising men. JAMA. 2008 Mar 19;299(11):1261-3.

24
36. Patti ME, Butte AJ, Crunkhorn S, Cusi K, Berria R, Kashyap S, Miyazaki Y, Kohane I, Costello M, Saccone R, et al. Coordinated reduction of genes of oxidative metabolism in humans with insulin resistance and diabetes: Potential role of PGC1 and NRF1. Proc.Natl.Acad Sci U.S.A. 2003 Jul 8;100(14):8466-71.
37. Pilegaard H, Saltin B, Neufer PD. Exercise induces transient transcriptional activation of the PGC-1alpha gene in human skeletal muscle. J Physiol 2003 Feb 1;546(3):851-8.
38. Rector RS, Thyfault JP, Laye MJ, Morris RT, Borengasser SJ, Uptergrove GM, Chakravarthy MV, Booth FW, Ibdah JA. Cessation of daily exercise dramatically alters precursors of hepatic steatosis in Otsuka Long-Evans Tokushima Fatty (OLETF) rats. J Physiol 2008 Jul 10.
39. Rector RS, Thyfault JP, Morris RT, Laye MJ, Borengasser SJ, Booth FW, Ibdah JA. Daily exercise increases hepatic fatty acid oxidation and prevents steatosis in Otsuka Long-Evans Tokushima Fatty rats. Am J Physiol Gastrointest.Liver Physiol 2008 Mar;294(3):G619-G626.
40. RODBELL M. Metabolism of Isolated Fat Cells. I. Effects of Hormones on Glucose Metabolism and Lipolysis. J Biol Chem. 1964 Feb;239:375-80.
41. Ryan DH. Diet and exercise in the prevention of diabetes. Int J Clin Pract.Suppl 2003 Mar;(134):28-35.
42. Simoneau JA, Veerkamp JH, Turcotte LP, Kelley DE. Markers of capacity to utilize fatty acids in human skeletal muscle: relation to insulin resistance and obesity and effects of weight loss. FASEB J 1999 Nov;13(14):2051-60.
43. Srere PA. Citrate synthase. Meth Enzymol 1969;13:3-5.
44. Thyfault JP, Kraus RM, Hickner RC, Howell AW, Wolfe RR, Dohm GL. Impaired plasma fatty acid oxidation in extremely obese women. Am J Physiol Endocrinol Metab 2004 Dec;287(6):E1076-E1081.
45. Timmons JA, Norrbom J, Scheele C, Thonberg H, Wahlestedt C, Tesch P. Expression profiling following local muscle inactivity in humans provides new perspective on diabetes-related genes. Genomics. 2006 Jan;87(1):165-72.
46. Valerio A, Cardile A, Cozzi V, Bracale R, Tedesco L, Pisconti A, Palomba L, Cantoni O, Clementi E, Moncada S, et al. TNF-alpha downregulates eNOS expression and mitochondrial biogenesis in fat and muscle of obese rodents. J Clin Invest 2006 Oct;116(10):2791-8.
47. WENDE AR, Huss JM, Schaeffer PJ, Giguere V, KELLY DP. PGC-1{alpha} Coactivates PDK4 Gene Expression via the Orphan Nuclear Receptor ERR{alpha}: a Mechanism for Transcriptional Control of Muscle Glucose Metabolism. Mol.Cell.Biol. 2005 Dec 15;25(24):10684-94.
25
48. Yoon JC, Puigserver P, Chen G, Donovan J, Wu Z, Rhee J, Adelmant G, Stafford J, Kahn CR, Granner DK, et al. Control of hepatic gluconeogenesis through the transcriptional coactivator PGC-1. Nature 2001 Sep 13;413(6852):131-8.

26
Figure Legends
Figure 1 – Complete oxidation of palmitate to CO2 in whole red gastrocnemius
homogenate (Panel A) and isolated mitochondria from red gastrocnemius (Panel B). In
Panel A there is a main effect p-value of 0.059. Values (means± SE; n=6-8/group) with
different letters are significantly different (p<0.05).
Figure 2 - Complete oxidation of palmitate to CO2 in whole liver homogenate (Panel A)
and isolated mitochondria from liver (Panel B). Values (means± SE; n=6-8/group) with
different letters are significantly different (p<0.05).
Figure 3 - Complete oxidation of palmitate to CO2 in isolated adipocytes from the
epididymal fat pad normalized to ng of DNA per 30µL of packed adipocytes (Panel A) or
to volume (µL) of packed adipocytes (Panel B). Values (means± SE; n=6-8/group) with
different letters are significantly different (p<0.05).
Figure 4 - Carnitine palmitoyltransferase-1 (CPT-1) activities in isolated mitochondria
from red gastrocnemius muscle (panel A) and liver (panel B). CPT-1 activity was
measured in the absence (black bars) or presence of an inhibitory amount of malonyl Co-
A (malonyl Co-A 10 µM, light grey bars), and expressed as the difference between the
malonyl Co-A doses (delta, open bars). Data is normalized to 1 in WL5 group and then
expressed relative to WL5. Values (means± SE; n=6-8/group) with different letters are
significantly different (p<0.05).
27
Figure 5 – PGC-1α mRNA in red gastrocnemius (panel A), liver (panel B), and
epididymal adipose tissue (panel C). Data is normalized to 18S expression and expressed
fold difference (means± SE; n=6-8/group). Values with different letters are significantly
different (p<0.05).
28
Table 1
Group DEXA Measurements WL5 WL173 SED
Body Fat % 7 Days Prior to Sac 4.1±0.5A 4.7±0.6A 6.6±0.4B
Day of Sac 4.5±0.4A 6.8±0.4B 6.8±0.7B Δ 0.4±0.4 2.1±0.8# 0.2±0.6
Total Body Fat (g)
7 Days Prior to Sac 9.1±1.0A 10.7±1.7AB 13.8±1.1B Day of Sac 10.6±0.8A 15.6±1.2B 15.6±2.1B
Δ 1.5±0.8 4.9±1.7# 1.8±1.3
Total Lean Mass (g)
7 Days Prior to Sac 214.7±4.6 211.1±8.5 193.4±8.4 Day of Sac 223.6±4.1 212.1±7.4 208.3±7.1
Δ 8.9±2.8# 0.9±3.1 14.9±1.5#
Total Body Mass (g)
7 Days Prior to Sac 223.9±4.4 221.8±9.5 207.2±9.2 Day of Sac 234.1±4.0 227.7±8.0 223.8±8.6
Δ 10.3±2.4# 5.9±2.0# 16.6±1.5#
Ave Daily Food Intake (g)
Week -2 to -1 18.3±0.8A 18.8±0.6A 13.7±0.3B Week -1 to 0 19.3±0.3A 16.6±0.3#B 15.2±0.6#B
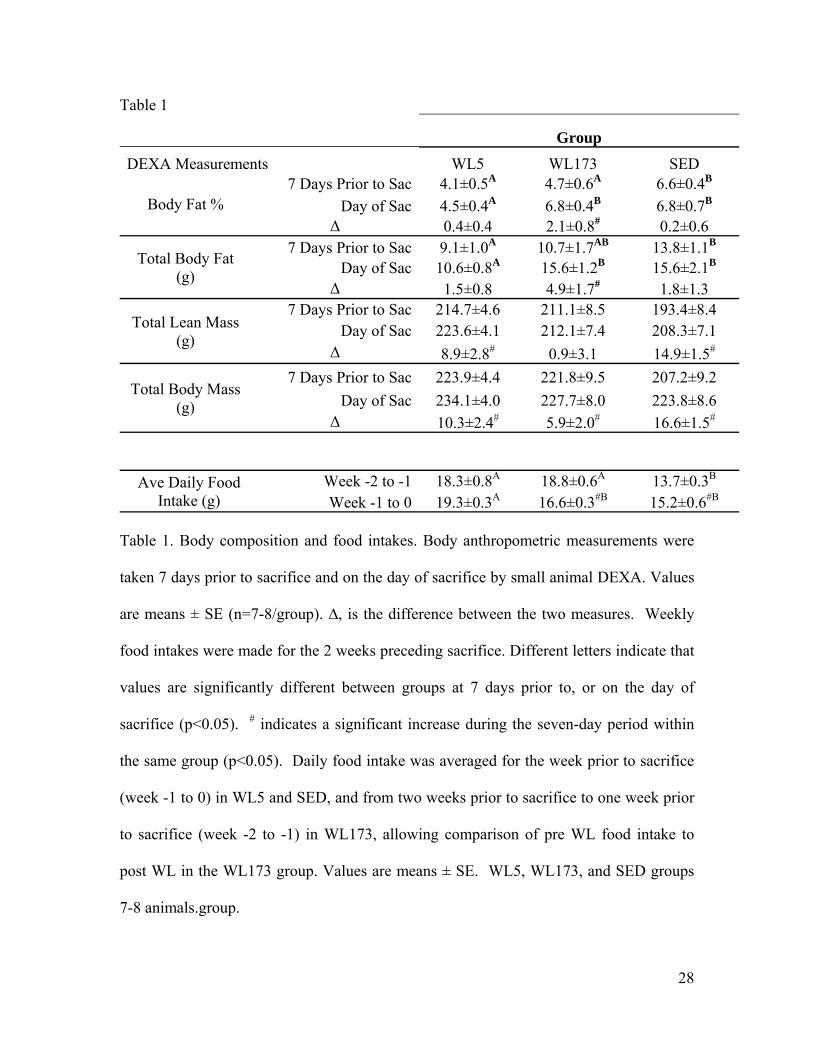
Table 1. Body composition and food intakes. Body anthropometric measurements were
taken 7 days prior to sacrifice and on the day of sacrifice by small animal DEXA. Values
are means ± SE (n=7-8/group). ∆, is the difference between the two measures. Weekly
food intakes were made for the 2 weeks preceding sacrifice. Different letters indicate that
values are significantly different between groups at 7 days prior to, or on the day of
sacrifice (p<0.05). # indicates a significant increase during the seven-day period within
the same group (p<0.05). Daily food intake was averaged for the week prior to sacrifice
(week -1 to 0) in WL5 and SED, and from two weeks prior to sacrifice to one week prior
to sacrifice (week -2 to -1) in WL173, allowing comparison of pre WL food intake to
post WL in the WL173 group. Values are means ± SE. WL5, WL173, and SED groups
7-8 animals.group.

29
Table 2. Epididymal Fat Pad Characteristics WL5 WL173 SED Epididymal Fat Pad (g/g of BW*100) 5.13±0.24A 6.84±0.38B 6.63±0.42B
Epididymal Fat Pad (g) 1.20±0.06 1.57±0.13 1.50±0.15 Serum Measurements WL5 WL173 SED Triacylglycerol (mg/mL) 34.3±2.4 44.8±3.3 38.3±4.2 Free fatty acids (mmol/L) 146.2±9.7 168.6±9.4 176.3±13.7Glucose (mg/dL) 470.9±10.6 462.8±19.7 429.9±13.7
Table 2. Epididymal adipose and serum measurements. Values are means ± SE (n=6-
8/group. Different letters indicate that values are significantly different between groups
(p<0.05). Values are means ± SE.

30
Table 3 - Enzyme Activities WL5 WL173 SED Red Gastrocnemius
β-HAD (nmol/min/ug) 26.5±3.7 26.6±2.6 23.1±2.0 Citrate synthase (nmol/min/ug) 1786±184 1908±270 1342±141
Cytochrome c oxidase (Units/min/g) 75.1±6.9 78.8±8.5 65.5±10.3 Liver
β-HAD (nmol/min/ug) 16.6±1.2 18.3±1.7 16.7±0.7 Citrate synthase (nmol/min/ug) 408±25 376±32 374±15
Cytochrome c oxidase (Units/min/g) 46.6±1.9 42.7±2.6 43.7±1.4 Epididymal Adipose
β-HAD (nmol/min/ug) U.D. U.D. U.D. Citrate synthase (nmol/min/ug) 21±7 20±4 21±6
Cytochrome c oxidase (Units/min/g) 0.7±0.1 1.0±0.2 0.9±0.2 Table 3 – Enzyme activities in red gastrocnemius, liver, and epididymal adipocytes.
Values are means ± SE (n= 6-8/group). No significant differences between groups were
detected. β-HAD = β-hydroxyacyl CoA dehydrogenase; U.D. = Undetectable.
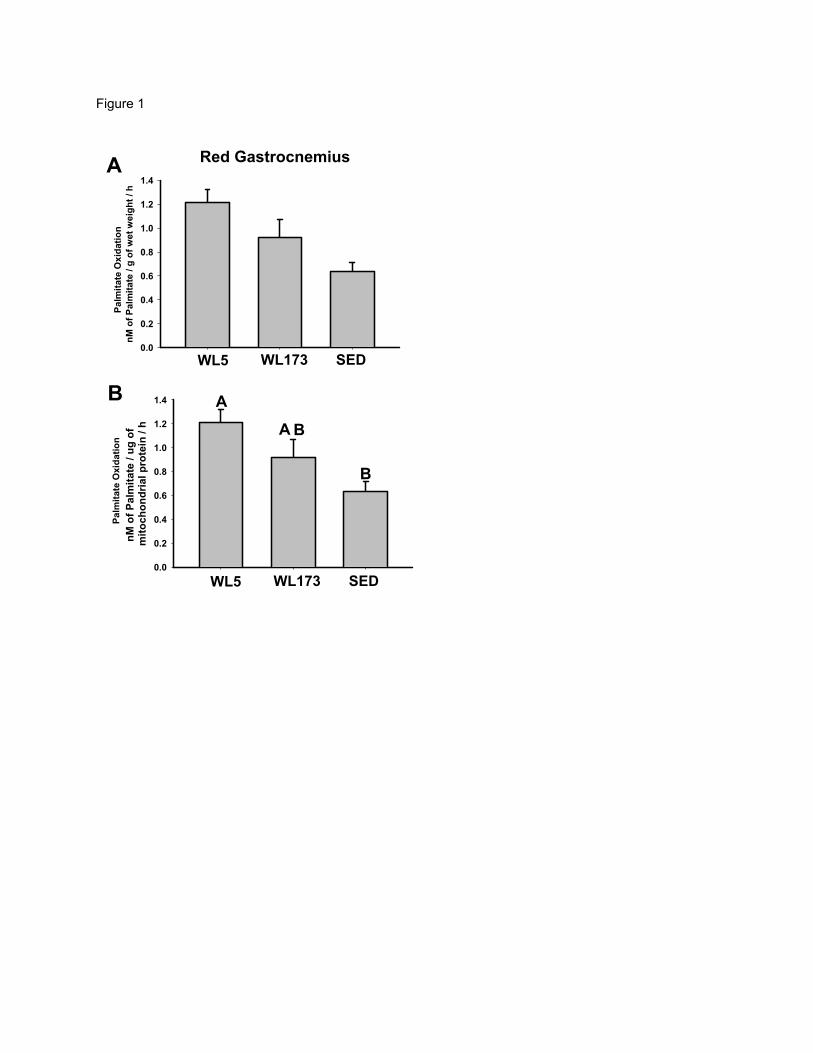
Figure 1
A
B
Red Gastrocnemius
nM o
f Pal
mita
te /
g of
wet
wei
ght /
h
0.0
0.2
0.4
0.6
0.8
1.0
1.2
1.4
WL5 WL173 SED
P = 0.059
nM o
f Pal
mita
te /
ug o
f m
itoch
ondr
ial p
rote
in /
h
0.0
0.2
0.4
0.6
0.8
1.0
1.2
1.4
WL5 WL173 SED
A
A B
B
Palm
itate
Oxi
datio
nPa
lmita
te O
xida
tion
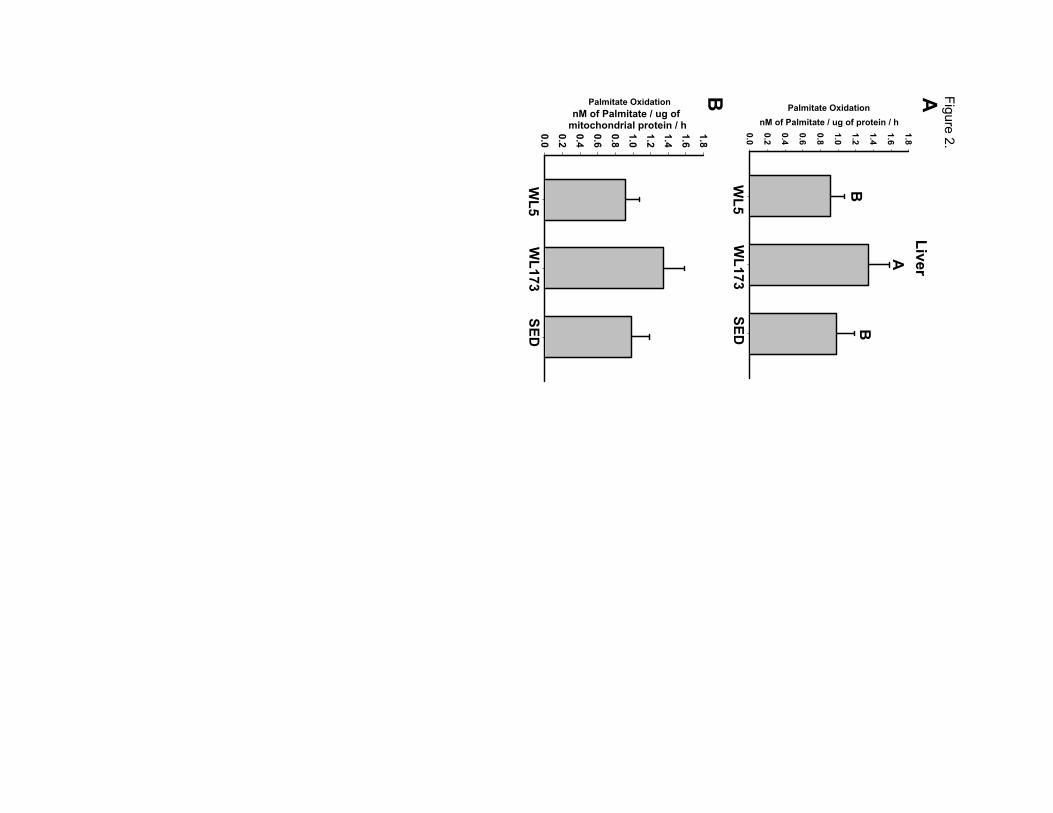
Figure 2.
LivernM of Palmitate / ug of protein / h
0.0
0.2
0.4
0.6
0.8
1.0
1.2
1.4
1.6
1.8
WL5
WL173
SED
A
BB
0.0
0.2
0.4
0.6
0.8
1.0
1.2
1.4
1.6
1.8
WL5
WL173
SED
nM of Palmitate / ug of mitochondrial protein / h
AB
Palmitate OxidationPalmitate Oxidation
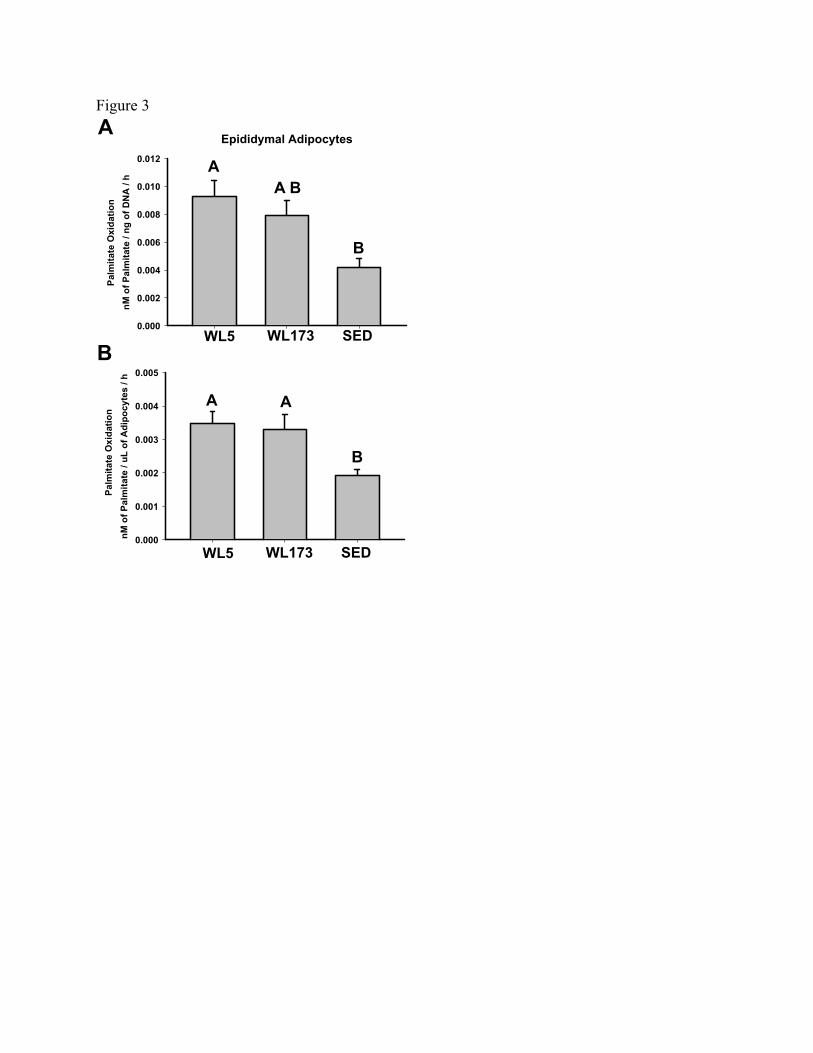
Figure 3
Epididymal AdipocytesnM
of P
alm
itate
/ ng
of D
NA
/ h
0.000
0.002
0.004
0.006
0.008
0.010
0.012
WL5 WL173 SED
AA B
B
nM o
f Pal
mita
te /
uL o
f Adi
pocy
tes
/ h
0.000
0.001
0.002
0.003
0.004
0.005
WL5 WL173 SED
A A
B
A
B
Palm
itate
Oxi
datio
nPa
lmita
te O
xida
tion

Figure 4 nM
/ g
/ min
(exp
ress
ed re
lativ
e to
WL5
)
0.0
0.2
0.4
0.6
0.8
1.0
1.2
1.4
WL5 WL173 SED
A
B
Red Gastrocnemius
0.0
0.2
0.4
0.6
0.8
1.0
1.2 Malonyl Co-A 0 uMMalonyl Co-A 10uMDelta
WL5 WL173 SED
nM /
g / m
in (e
xpre
ssed
rela
tive
to W
L5)
AA
B
A
B B
Liver
CPT
-1 A
ctiv
ityC
PT-1
Act
ivity
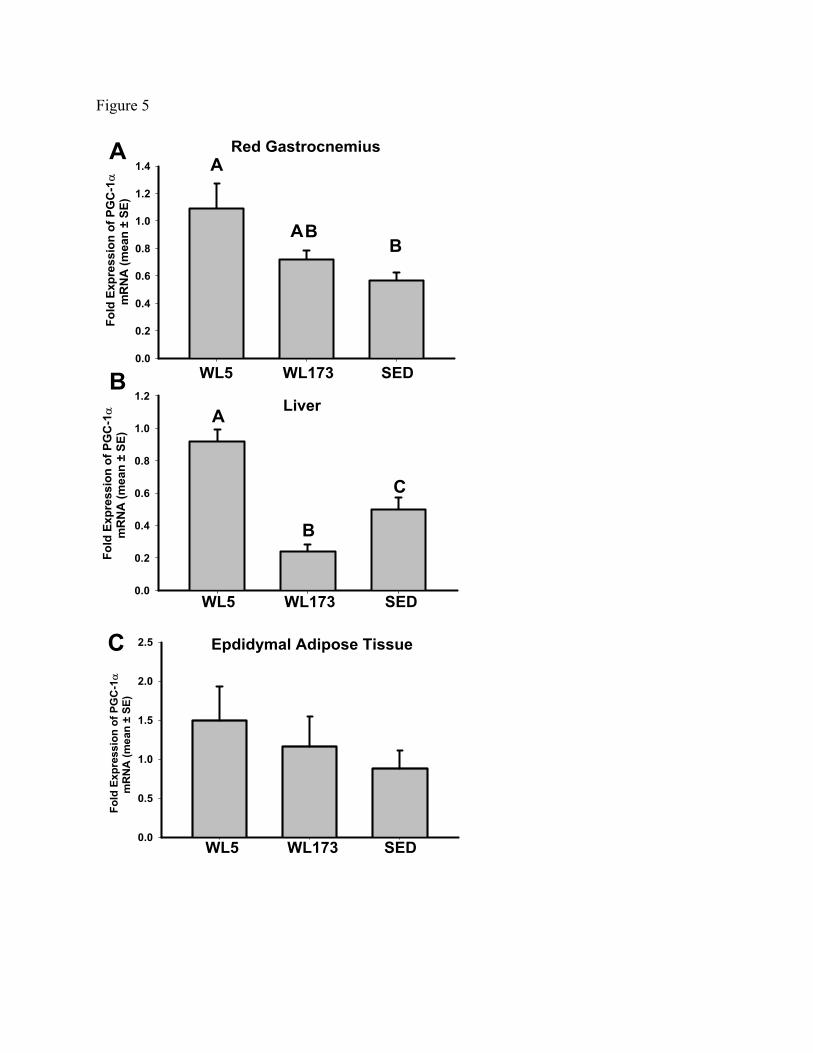
Figure 5
A
B
C
0.0
0.2
0.4
0.6
0.8
1.0
1.2
0.0
0.2
0.4
0.6
0.8
1.0
1.2
1.4
Fold
Exp
ress
ion
of P
GC
-1m
RN
A (m
ean
± SE
)
0.0
0.5
1.0
1.5
2.0
2.5
Fold
Exp
ress
ion
of P
GC
-1m
RN
A (m
ean
± SE
) Fo
ld E
xpre
ssio
n of
PG
C-1
mR
NA
(mea
n ±
SE)
WL5 WL173 SED
WL5 WL173 SED
WL5 WL173 SED
A
AB
A
B
C
Red Gastrocnemius
Liver
Epdidymal Adipose Tissue
B