Cardiovascular Risk Behavior among Sedentary Female Smokers and Smoking Cessation Outcomes
Upload
khangminh22Category
view
0download
0
WEIGHT GAIN ASSOCIATED WITH SMOKING CESSATION: A COHORT
ANALYSIS AND FEASIBILITY TRIAL FOR DIETARY MANAGEMENT
by
DEBORAH ANNE LYCETT
A thesis submitted to the
University of Birmingham
for the degree of
DOCTOR OF PHILOSOPHY
Behavioural Medicine Primary Care Clinical Sciences School of Health and Population Studies College of Medical and Dental Sciences University of Birmingham October 2011

University of Birmingham Research Archive
e-theses repository This unpublished thesis/dissertation is copyright of the author and/or third parties. The intellectual property rights of the author or third parties in respect of this work are as defined by The Copyright Designs and Patents Act 1988 or as modified by any successor legislation. Any use made of information contained in this thesis/dissertation must be in accordance with that legislation and must be properly acknowledged. Further distribution or reproduction in any format is prohibited without the permission of the copyright holder.

ABSTRACT Background
Quitting smokers gain weight, this offsets some advantages of quitting and may
increase risk of type 2 diabetes above that of continuing smokers. The extent of
weight gain, the associated characteristics, and management that will not hinder quit
success are unclear.
Method
Examination of weight gain in an 8year prospective cohort.
Feasibility trial of smoking cessation combined with a very low calorie diet(VLCD) or
individualised diet and physical activity planning(IDAP) with usual care.
Results
Abstainers gained 9kg, 7kg more than smokers over 8years. Underweight and obese
smokers gained most. Less weight gain (1.7kg) was associated with higher baseline
alcohol consumption (14units/week vs. none).
Recruitment from general practices was difficult and limited by VLCD
contraindications. Following training, primary care nurses competently delivered
specialist dietary interventions. The control condition was generally unacceptable.
Half those on the VLCD were non-adherent. Mean weight change was
+0.7kg(control), -1.3kg(IDAP), -7.1kg(VLCD) and +0.4kg for abstinence. We found

lower cigarette cravings in the VLCD than control arm, but no difference in IDAP and
unrelated to hunger. Relapse was greatest in the VLCD and least in the control.
Conclusion
Weight gain after cessation is important and IDAP but not VLCD is a feasible
approach for tackling this.

DEDICATION
To my wonderful husband Tim, I couldn‟t have done it without you.
Thank you for taking over all the cooking, cleaning, homemaking and kid‟s taxi
driving for the sake of my PhD!

STATEMENT OF CONTRIBUTION This thesis is written in the first person using the editorial „we‟. The author of the
thesis contributed the following:
Chapter 1.
The author conducted this literature review in its entirety.
Chapter 2.
The author received tutoring by Paul Aveyard on regression analysis of the „Oxford
patch data‟. Following this, the author carried out analysis on an updated set of these
data and developed the hypothesis for the analysis, which was informed by literature
review.
Chapter 3.
The feasibility trial developed from the author‟s idea in collaboration with Paul
Aveyard and Peter Hajek. The author was principal investigator and trial coordinator.
She designed the intervention, wrote the trial resources and trained the clinicians.
She obtained permissions necessary to run the trial within the NHS, she acquired
and set up the research sites.
Chapter 4.
The author carried out the analysis of feasibility including the qualitative interviews
and analysis. Codes and themes emerging from qualitative transcripts were
discussed with colleagues Nicola Lindson and Rachna Begh who are experienced in
qualitative methods.

Chapter 5.
The author developed and analysed the Healthy Choice Index (HCI) and Hunger
Craving Score (HCS). Paul Aveyard suggested the analyses to use.
Chapter 6.
The author carried out all the analyses contained in this chapter following discussion
with Paul Aveyard regarding which methods to use.
Chapter 7.
This chapter contains the author‟s own interpretations and conclusions.

ACKNOWLEDGEMENTS
Thank you to the UK Centre of Tobacco Control Studies (UKCTCS) who funded this
work. UKCTCS is a UKCRC Public Health Research: Centre of Excellence with
funding from British Heart Foundation, Cancer Research UK, Economic and Social
Research Council, Medical Research Council, and the Department of Health, under
the auspices of the UK Clinical Research Collaboration, which is gratefully
acknowledged.
Thank you to my first supervisor Paul Aveyard - you have taught me so much and
helped me so generously. Thank you to my second supervisor Peter Hajek for all
your support.
Thank you to Marcus Munafò, Elaine Johnstone and Michael Murphy who provided
me with access to the Oxford patch data.
Shelia Hirst, thank you for telling me about this PhD opportunity – it all began with
you! Thank you for your hard work in helping with the administration of DeMiST.
Thank you also to Mike Healy and Sarah Clark who helped with trial administration.
Thank you to the research nurses Rhona Alekna, Sharon Jones, Jackie Walsh,
Andrea Thomson, Jennie Inglis and Jackie Ingram.

To my two beautiful daughters, Abigail and Isabel, thank you for understanding when
I‟ve needed to work and making my time off such fun.
“I will give you [God] thanks, for you answered me; you have become my salvation.”
Psalm 118:21

CONTENTS 1. BACKGROUND: WHY AND HOW SHOULD WE ADDRESS THE PROBLEM OF WEIGHT GAIN ASSOCIATED
WITH SMOKING CESSATION? ........................................................................................................................... 1
1.1. THE UNDISPUTED BENEFITS OF SMOKING CESSATION ......................................................................................... 1
1.2. WEIGHT GAIN AS A CONSEQUENCE OF SMOKING CESSATION ............................................................................... 6
1.2.1. How much weight is gained? ........................................................................................................... 7
1.2.2. Does this weight gain continue indefinitely? ................................................................................... 9
1.2.3. What characteristics are associated with this weight gain? ......................................................... 16
1.2.4. Our contribution to this knowledge ............................................................................................... 18
1.3. WHAT CAUSES POST CESSATION WEIGHT GAIN? ............................................................................................. 20
1.3.1. Reduced basal metabolic rate and energy expenditure during physical activity ........................... 21
1.3.2. Increased fat storage ..................................................................................................................... 22
1.3.3. Increased energy intake ................................................................................................................. 23
1.3.4. Decreased physical activity post cessation .................................................................................... 25
1.4. THE IMPACT OF THE WEIGHT GAIN ASSOCIATED WITH SMOKING CESSATION ......................................................... 25
1.4.1. Association of smoking related weight gain with quit attempts and relapse to smoking ............. 25
1.4.1.1. Is concern about anticipated weight gain positively associated with reduced attempts to quit? .......26
1.4.1.2. Is concern about anticipated or concern about actual weight gain positively associated with relapse?
..............................................................................................................................................................27
1.4.1.3. Is actual weight gain associated with relapse back to smoking? ..........................................................28
1.4.2. Impact on risks of chronic diseases ................................................................................................ 31
1.4.2.1. Changes in body composition ..............................................................................................................31
1.4.2.2. Impact on type two diabetes mellitus ..................................................................................................33
1.4.2.3. Impact on lung function .......................................................................................................................36
1.4.2.4. Impact on cardiovascular risk and hypertension ..................................................................................37
1.5. HOW CAN WE PREVENT THIS WEIGHT GAIN? ................................................................................................. 37
1.5.1. Pharmacotherapies........................................................................................................................ 37
1.5.2. Cognitive behavioural therapy (CBT) to accept weight gain ......................................................... 39
1.5.3. Exercise .......................................................................................................................................... 39

1.5.4. Dietary interventions ..................................................................................................................... 39
1.6. OVERVIEW OF THESIS ............................................................................................................................... 44
1.6.1. Aims of thesis ................................................................................................................................. 44
1.6.2. Objectives of thesis ........................................................................................................................ 44
2. ASSOCIATIONS BETWEEN POTENTIAL PREDICTORS OF WEIGHT CHANGE OVER EIGHT YEARS IN A
COHORT OF CONTINUING AND QUITTING SMOKERS ......................................................................................46
2.1. INTRODUCTION ....................................................................................................................................... 47
2.1.1. Associations of weight gain over eight years with baseline body mass index (BMI) ..................... 47
2.1.2. Associations of weight gain over eight years with baseline alcohol consumption ........................ 48
2.1.3. Associations of weight change over eight years with patch or placebo use during quitting. ........ 51
2.1.4. Associations of weight change over eight years with age, gender, smoking rate and
socioeconomic status at baseline................................................................................................................. 51
2.1.4.1. Age .......................................................................................................................................................51
2.1.4.2. Gender .................................................................................................................................................52
2.1.4.3. Smoking rate ........................................................................................................................................52
2.1.4.4. Socioeconomic status ...........................................................................................................................52
2.2. METHODS .............................................................................................................................................. 52
2.2.1. Participants .................................................................................................................................... 52
2.2.2. Measures of height and weight ..................................................................................................... 53
2.2.3. Characterisation of smoking status ............................................................................................... 54
2.2.3.1. Quitters ................................................................................................................................................54
2.2.3.2. Smokers ................................................................................................................................................54
2.2.3.3. Relapsers ..............................................................................................................................................54
2.2.3.4. Late quitters .........................................................................................................................................54
2.2.4. Measure of alcohol intake ............................................................................................................. 55
2.2.5. Baseline characteristics ................................................................................................................. 55
2.3. STATISTICAL METHODS ............................................................................................................................. 55
2.3.1. Weight change according to smoking status................................................................................. 55
2.3.2. Association with baseline BMI ....................................................................................................... 57

2.3.3. Association with baseline alcohol intake ....................................................................................... 58
2.3.4. Associations of weight change over eight years with patch or placebo use during quitting; age,
gender, smoking rate and socioeconomic status at baseline ...................................................................... 58
2.4. RESULTS ................................................................................................................................................ 59
2.4.1. Baseline characteristics ................................................................................................................. 59
2.4.2. Weight change over eight years .................................................................................................... 61
2.4.3. Mean weight and BMI change according to smoking status......................................................... 61
2.4.4. Weight Change and Baseline BMI ................................................................................................. 63
2.4.5. Association between BMI and weight change in quitters .............................................................. 65
2.4.6. Association between BMI and weight change in smokers ............................................................. 65
2.4.7. Sensitivity Analysis ......................................................................................................................... 65
2.4.8. Estimating weight change in individuals ....................................................................................... 66
2.4.9. Baseline alcohol consumption as an effect modifier of weight change according to smoking
status............. .............................................................................................................................................. 69
2.4.10. Association between alcohol consumption and weight change in smokers ............................. 69
2.4.11. Association between alcohol consumption and weight change in quitters .............................. 69
2.4.12. Variability of weight change in quitters according to baseline alcohol consumption and BMI 70
2.4.13. Weight change over eight years with patch or placebo use during quitting ............................ 72
2.4.14. Associations of weight change over eight years with age, gender, smoking rate and
socioeconomic status at baseline................................................................................................................. 72
2.4.14.1. Age .......................................................................................................................................................72
2.4.14.2. Gender .................................................................................................................................................72
2.4.14.3. Smoking rate ........................................................................................................................................73
2.4.14.4. Socioeconomic status ...........................................................................................................................73
2.5. DISCUSSION ........................................................................................................................................... 75
2.5.1. Findings .......................................................................................................................................... 75
2.5.1.1. Weight change according to smoking status ........................................................................................75
2.5.1.2. Association with baseline BMI .............................................................................................................75
2.5.1.3. Association with baseline alcohol intake .............................................................................................75

2.5.1.4. Associations of weight change over eight years with patch or placebo use during quitting; age,
gender, smoking rate and socioeconomic status at baseline ....................................................................................76
2.5.2. Strengths and limitations of this study .......................................................................................... 76
2.5.2.1. Characterisation of smokers and quitters ............................................................................................76
2.5.2.2. BMI investigation robust to sensitivity analysis ...................................................................................77
2.5.2.3. Reporting bias ......................................................................................................................................77
2.5.2.4. Response bias .......................................................................................................................................78
2.5.2.5. The role of confounding .......................................................................................................................79
2.5.2.6. Lack of a never-smoker category .........................................................................................................82
2.5.2.7. Lack of ethnic diversity .........................................................................................................................83
2.5.3. Comparison with other literature .................................................................................................. 83
2.5.3.1. Weight change according to smoking status ........................................................................................83
2.5.3.2. Association with baseline BMI .............................................................................................................84
2.5.3.3. Association with baseline alcohol intake .............................................................................................84
2.5.3.4. Weight change over eight years with patch or placebo use during quitting ........................................86
2.5.3.5. Association with age ............................................................................................................................86
2.5.3.6. Association with gender .......................................................................................................................87
2.5.3.7. Association with smoking rate .............................................................................................................87
2.5.3.8. Association with socioeconomic status ................................................................................................88
2.5.4. Implications for clinical practice .................................................................................................... 88
2.5.5. Implications for research ............................................................................................................... 90
2.6. CONCLUSIONS......................................................................................................................................... 91
3. TRIAL PROTOCOL: DIETARY MANAGEMENT IN SMOKERS TRIAL (DEMIST) .............................................93
3.1. INTRODUCTION ....................................................................................................................................... 93
3.1.1. To maximise the difference in hunger between trial arms ............................................................ 95
3.1.2. To measure hunger and food craving ............................................................................................ 96
3.1.3. DeMiST dietary assessment ........................................................................................................... 98
3.1.4. Meeting the needs of trial participants ....................................................................................... 100
3.2. METHODS ............................................................................................................................................ 102
3.2.1. Participants .................................................................................................................................. 102
3.2.1.1. Inclusion criteria .................................................................................................................................103
3.2.1.2. Exclusion criteria ................................................................................................................................104
3.2.1.3. Removal of participants from therapy ...............................................................................................106
3.2.2. Dietary Interventions ................................................................................................................... 106
3.2.2.1. Treatment Stage 1 – VLCD ..................................................................................................................107
3.2.2.2. Treatment Stage 1 – Individual Dietary and Activity Planning (IDAP) ................................................109
3.2.2.3. Treatment Stage 1 – Control (Step by Step (SBS)) .............................................................................112
3.2.3.1. Treatment Stage 2 - VLCD ..................................................................................................................113
3.2.3.2. Treatment Stage 2 – Individually Tailored Diet and Activity Plan (IDAP) ...........................................114
3.2.3.3. Treatment Stage 2 – Control (Step by Step (SBS)) ..............................................................................114
3.2.3. Smoking Cessation Interventions for all Participants .............................................................. 114
3.2.4. Nicotine replacement therapy (NRT) ........................................................................................... 115
3.2.5. Training and supervision .............................................................................................................. 116
3.2.6. Fidelity checking and monitoring ................................................................................................. 117
3.3. OBJECTIVES .......................................................................................................................................... 117
3.3.1. Primary objectives ....................................................................................................................... 117
3.3.2. Secondary objectives ................................................................................................................... 118
3.3.3. Tertiary objectives ....................................................................................................................... 118
3.4. OUTCOME MEASURES ............................................................................................................................ 118
3.4.1. Acceptability ................................................................................................................................ 118
3.4.2. Feasibility ..................................................................................................................................... 119
3.4.3. Measurement of urges to smoke and hunger, ............................................................................. 120
3.4.4. Ketosis .......................................................................................................................................... 121
3.4.5. Measurement of smoking status ................................................................................................. 121
3.4.6. Measurement of Disease Risk Factors ......................................................................................... 122
3.4.7. Measurement of diet and activity ................................................................................................ 123
3.4.8. Confidence in trial arm ................................................................................................................ 124
3.5. SAMPLE SIZE ........................................................................................................................................ 124
3.6. RANDOMISATION .................................................................................................................................. 127
3.7. ANALYSIS AND STATISTICAL METHODS ........................................................................................................ 127

3.7.1. Data Validation ............................................................................................................................ 129
3.8. TRIAL SCHEDULE .................................................................................................................................... 129
3.9. DEFINITION OF END OF TRIAL ................................................................................................................... 130
3.10. VALUE OF RESULTS ................................................................................................................................. 130
3.11. ASSESSMENT OF SAFETY .......................................................................................................................... 130
3.11.1. VLCDs ...................................................................................................................................... 131
3.11.2. Dietary and Lifestyle Advice .................................................................................................... 132
3.11.3. NRT Patches ............................................................................................................................ 132
3.11.4. Salbutamol .............................................................................................................................. 134
3.11.5. Reporting of adverse events ................................................................................................... 134
3.12. ETHICS AND RESEARCH GOVERNANCE ....................................................................................................... 135
3.13. DATA MANAGEMENT, PROTECTION AND CONFIDENTIALITY ............................................................................. 136
4. FEASIBILITY AND ACCEPTABILITY OF THE DEMIST TRIAL ...................................................................... 138
4.1. INTRODUCTION ..................................................................................................................................... 138
4.2. RESPONSE AND RECRUITMENT RATES ......................................................................................................... 139
4.2.1. Methods ....................................................................................................................................... 139
4.2.1.1. Recruitment improvement strategy 1 ................................................................................................140
4.2.1.2. Recruitment improvement strategy 2 ................................................................................................141
4.2.2. Results.......................................................................................................................................... 141
4.2.2.1. Original recruitment strategy .............................................................................................................141
4.2.2.2. Recruitment improvement strategy 1 ................................................................................................142
4.2.2.3. Recruitment improvement strategy 2 ................................................................................................143
4.2.3. Discussion .................................................................................................................................... 145
4.2.3.1. Potential reasons for poor recruitment .............................................................................................145
4.2.3.1.1. Poor marketing .............................................................................................................................146
4.2.3.1.2. Weight control during smoking cessation .....................................................................................146
4.2.3.1.3. The target population ...................................................................................................................147
4.2.3.2. Potential solutions to poor recruitment.............................................................................................147
4.2.4. Conclusion .................................................................................................................................... 149

4.3. ACCEPTABILITY TO PARTICIPANTS .............................................................................................................. 150
4.3.1. Methods ....................................................................................................................................... 150
4.3.1.1. Sampling .............................................................................................................................................151
4.3.1.2. Analysis ..............................................................................................................................................152
4.3.1.2.1. Familiarisation...............................................................................................................................152
4.3.1.2.2. Coding/Indexing ............................................................................................................................153
4.3.1.2.3. Identification of themes ................................................................................................................154
4.3.1.2.4. Charting themes by trial arm ........................................................................................................154
4.3.1.2.5. Interpretation ...............................................................................................................................154
4.3.2. Results.......................................................................................................................................... 155
4.3.2.1. Baseline Characteristics......................................................................................................................155
4.3.2.2. Hindering factors ................................................................................................................................155
4.3.2.2.1. Dissatisfaction with trial arm allocation ........................................................................................157
4.3.2.2.2. Diet fell below expectations .........................................................................................................158
4.3.2.2.3. Perceived lack of support ..............................................................................................................160
4.3.2.2.4. Disappointed with self ..................................................................................................................160
4.3.2.2.5. Socially difficult .............................................................................................................................161
4.3.2.2.6. Difficulty of task ............................................................................................................................161
4.3.2.2.7. Personal circumstances ................................................................................................................163
4.3.2.3. Reasons for and links with attrition ...................................................................................................163
4.3.2.3.1. Difficulty in keeping appointments ...............................................................................................164
4.3.2.3.2. A sense of failure ..........................................................................................................................164
4.3.3.4. Helpful factors ....................................................................................................................................167
4.3.3.4.1. Pleased with trial arm allocation ..................................................................................................167
4.3.3.4.2. Weekly support .............................................................................................................................167
4.3.3.4.3. Peer support .................................................................................................................................168
4.3.3.4.4. NRT Patches ..................................................................................................................................168
4.3.3.4.5. Dietary aspects..............................................................................................................................169
4.3.3.4.6. Evidence of success .......................................................................................................................170
4.3.3.4.7. Feeling good about oneself ...........................................................................................................171
4.3.3.4.8. Timing ...........................................................................................................................................172
4.3.4. Interpretation and Discussion ...................................................................................................... 172

4.3.4.1. Poor acceptability...............................................................................................................................172
4.3.4.1.1. When the trial did not meet participants’ perceived needs .........................................................172
4.3.4.1.2. When participants are ‘expert’ .....................................................................................................174
4.3.4.1.3. When problems become in surmountable ...................................................................................175
4.3.4.2. Acceptability .......................................................................................................................................175
4.3.4.2.1. When trial met participants’ perceived needs ..............................................................................175
4.3.4.3. How can we improve acceptability? ..................................................................................................176
4.3.4.4. Methodological strengths and limitations .........................................................................................179
4.3.4.4.1. Strengths .......................................................................................................................................179
4.3.3.4.2. Limitations ....................................................................................................................................180
4.3.3.4.2.1. Sample size ............................................................................................................................180
4.3.3.4.2.2. Data collection and interview skills ........................................................................................181
4.3.3.4.2.3. Organising data ......................................................................................................................181
4.3.3.4.2.4. Method of analysis .................................................................................................................182
4.3.3.4.2.5. Validation of findings .............................................................................................................182
4.3.4. Conclusion .................................................................................................................................... 183
4.4. FEASIBILITY OF TRIAL DELIVERY ................................................................................................................. 183
4.4.1. Methods ....................................................................................................................................... 183
4.4.1.1. Fidelity checking .................................................................................................................................183
4.4.1.2. Nurses debriefing ...............................................................................................................................184
4.4.2. Results.......................................................................................................................................... 185
4.4.2.1. Fidelity checking .................................................................................................................................185
4.4.2.2. Nurses debriefing ...............................................................................................................................186
4.4.3. Discussion .................................................................................................................................... 189
4.4.4. Conclusion .................................................................................................................................... 189
5. DEMIST: PROCESS MEASURES .............................................................................................................. 190
5.1. INTRODUCTION ..................................................................................................................................... 190
5.1.1. The healthy choice index (HCI) ..................................................................................................... 191
5.1.1.1. Introduction .......................................................................................................................................191
5.1.1.2. Methods .............................................................................................................................................193
5.1.1.3. Results ................................................................................................................................................194

5.1.1.3.1. Baseline nutrient intakes from food dairy ....................................................................................194
5.1.1.3.2. HCI Scores .....................................................................................................................................195
5.1.1.3.3. Correlation and agreement between mean nutrient values measured by the food diary and HCI
.....................................................................................................................................................195
5.1.1.3.4. Change in fat intake, HCI score and health behaviours ................................................................207
5.1.1.3.5. Change in fat intake ......................................................................................................................207
5.1.1.3.6. Change in HCI score ......................................................................................................................208
5.1.1.3.7. Change in health behaviours ........................................................................................................208
5.1.1.3.8. Change in fat intake and HCI score as mediators of change in body fat .......................................218
5.1.1.4. Discussion ...........................................................................................................................................218
5.1.1.4.1. Baseline nutrient intake ................................................................................................................218
5.1.1.4.2. The Healthy Choice Index (HCI) .....................................................................................................220
5.2. THE HUNGER AND FOOD CRAVING SCORE (HCS) .......................................................................................... 221
5.2.1. Introduction ................................................................................................................................. 221
5.2.2. Method ........................................................................................................................................ 224
5.2.3. Results.......................................................................................................................................... 225
5.2.4. Discussion .................................................................................................................................... 229
5.3. MEASURE OF CONFIDENCE IN TRIAL ARM .................................................................................................... 230
5.3.1. Introduction ................................................................................................................................. 230
5.3.2. Method ........................................................................................................................................ 231
5.3.3. Results.......................................................................................................................................... 231
5.3.4. Discussion .................................................................................................................................... 232
6. DEMIST RESULTS: CHANGES IN CIGARETTE CRAVING, SMOKING STATUS AND PHYSICAL MEASURES BY
TRIAL ARM .................................................................................................................................................... 233
6.1. INTRODUCTION ..................................................................................................................................... 233
6.2. RESULTS .............................................................................................................................................. 238
6.2.1. Baseline characteristics ............................................................................................................... 238
6.2.2. Cigarette craving ......................................................................................................................... 240
6.2.3. Modelling of trajectories of cigarette craving by trial arm .......................................................... 243
6.2.4. Change in food desire and food need by trial arm ....................................................................... 248
6.2.5. Is food desire and /or food need affected by trial arm? .............................................................. 248
6.2.6. Is cigarette craving affected by food desire and /or food need? ................................................. 250
6.2.7. Change in smoking status - time to relapse ................................................................................. 252
6.2.8. Change in anthropometric, body composition and disease risk factors: completer analysis ...... 254
6.2.8.1. Prequit change in weight, BMI and body composition ......................................................................254
6.2.8.2. Change in weight, BMI and body composition, baseline to the end of the first week post quit date259
6.2.8.3. Change in weight, BMI and body composition baseline to the end of Stage 1 ..................................259
6.2.8.4. Change in weight, BMI and body composition, baseline to the end of treatment ............................260
6.2.8.5. Change in lung function, blood glucose and cardiovascular risk parameters at the end of treatment
..........................................................................................................................................................262
6.2.9. Change in weight, BMI and body composition from baseline to 1 week post quit, in those
achieving 7 day point prevalent abstinence............................................................................................... 264
6.2.10. Change in weight, BMI and body composition from baseline to 4 weeks of continued
abstinence ................................................................................................................................................264
6.2.11. Change in weight, BMI and body composition from baseline to 12 weeks of continued
abstinence ................................................................................................................................................264
6.2.12. Change in lung function, blood glucose and cardiovascular risk parameters by end of
treatment in abstainers ............................................................................................................................. 266
6.2.13. Change in weight and body composition in lapsers from baseline to 1 week post quit date . 267
6.2.14. Change in weight and body composition in lapsers from baseline to four weeks post quit date
(end of treatment, Stage 1) ........................................................................................................................ 267
6.2.15. Change in weight body composition and disease risk factors in lapsers from baseline to end of
treatment............... .................................................................................................................................... 268
6.2.16. Individual trajectories of change in weight and fat mass ....................................................... 270
6.2.17. Change in mean weight and fat mass by trial arm ................................................................. 274
6.2.18. Modelling of weight and fat mass trajectories by trial arm ................................................... 274
6.2.19. Change in fat intake and HCI score as mediators of change in body fat ................................ 281
6.2.20. Change in anthropometrics and body composition: Intention to treat (ITT) analysis ............. 284
6.2.20.1. Prequit change in weight, BMI and body composition ......................................................................284
6.2.20.2. Change in weight and body composition from baseline to one week post quit date ........................284

6.2.20.3. Change in weight, BMI and body composition from baseline to the end of Stage 1 .........................286
6.2.20.4. Change in weight and body composition from baseline to the end of treatment .............................286
6.2.21. Change in weight and body composition in abstainers only: intention to treat (ITT) analysis
.................................................................................................................................................288
6.2.22. Change in weight and body composition in lapsers only: intention to treat (ITT) analysis .... 288
6.2.23. Change disease risk factors from baseline to end of treatment in lapsers ............................. 293
6.2.24. Adverse Events ........................................................................................................................ 296
6.3. DISCUSSION ......................................................................................................................................... 298
6.3.1. Limitations ................................................................................................................................... 298
6.3.2. Summary and interpretation of cigarette cravings by trial arm .................................................. 298
6.3.3. Summary of and interpretation of smoking status by trial arm .................................................. 300
6.3.4. Summary and interpretation of physical measures by trial arm ................................................. 301
6.3.5. Summary and interpretation of disease risk factors by trial arm ................................................ 302
6.3.6. Failure to attend and intention to treat analysis ......................................................................... 303
7. SUMMARY OF CONCLUSIONS. REFLECTIONS AND FUTURE DIRECTION ................................................ 305
7.1. THE OXFORD PATCH COHORT ANALYSIS ...................................................................................................... 305
7.2. THE DEMIST TRIAL ................................................................................................................................ 308
7.2.1. Acceptability ................................................................................................................................ 308
7.2.2. Feasibility ..................................................................................................................................... 311
7.2.3. Process measures......................................................................................................................... 313
7.2.3.1. The Healthy Choice Index (HCI) ..........................................................................................................313
7.2.3.2. The Hunger and Craving Score (HCS) .................................................................................................314
7.3.1. Effects of trial arms on urges to smoke ....................................................................................... 316
7.3.2. Effects of trial arms on relapse .................................................................................................... 316
7.3.3. Effects of trial arms on smoking cessation related weight gain .................................................. 317
7.3.4. What DeMiST means for clinical practice and future research.................................................... 320

LIST OF FIGURES Figure 1. Percentage frequency of weight change according to smoking status ................................. 62
Figure 2. Percentage of smokers and quitters in BMI categories at baseline and at eight years ......... 63
Figure 3. Predicted mean and confidence intervals for weight change according to BMI in smokers
and quitters ........................................................................................................................................... 67
Figure 4. Weight change over 8 years in quitters (n=84) according to baseline alcohol consumption in
quitters .................................................................................................................................................. 70
Figure 5. Weight change according to BMI and baseline alcohol consumption in quitters ................. 71
Figure 6. Treatment stages for DeMiST .............................................................................................. 108
Figure 7. Flowchart of participants through demist from identification of potential participants to
numbers who completed trial ............................................................................................................. 144
Figure 8. Scatter plots of nutrient intake (energy (kcal), carbohydrate (g), alcohol (g), fat(g), fibre (g),
sodium (mg), calcium (mg) and vitamin C (mg)) from food diary compared to HCI with lines of best fit
............................................................................................................................................................. 198
Figure 9. Bland-Altman plot of mean alcohol intake from food diary and HCI with difference in alcohol
between food diary and HCI (graph on the left hand side). Bland-Altman plots of log mean alcohol
intake from food diary and HCI with difference of log alcohol intake between food diary and HCI
(graph on the right hand side). ........................................................................................................... 199
Figure 10. Bland-Altman plot of mean calcium intake from food diary and HCI with difference in
calcium between food diary and HCI (graph on the left hand side). Bland-Altman plot of log mean
calcium intake from food diary and HCI with difference of log calcium intake between food diary and
HCI (graph on the right hand side). ..................................................................................................... 200
Figure 11. Bland-Altman plot of mean fat intake from food diary and HCI with difference in fat
between food diary and HCI (graph on the left hand side). Bland-Altman plot of log mean fat intake
from food diary and HCI with difference of log fat intake between food diary and HCI (graph on the
right hand side). .................................................................................................................................. 201
Figure 12. Bland-Altman plot of mean energy intake from food diary and HCI with difference in
energy between food diary and HCI (graph on the left hand side). Bland-Altman plots of log mean
energy intake from food diary and HCI with difference of log energy intake between food diary and
HCI (graph on the right hand side). ..................................................................................................... 202
Figure 13. Bland-Altman plot of mean carbohydrate intake from food diary and HCI with difference in
carbohydrate between food diary and HCI (graph on the left hand side). Bland-Altman plot of log
mean carbohydrate intake from food diary and HCI with difference of log carbohydrate intake
between food diary and HCI (graph on the right hand side). ............................................................. 203

Figure 14. Bland-Altman plot of mean vitamin C intake from food diary and HCI with difference in
vitamin C between food diary and HCI (graph on the left hand side). Bland-Altman plots of log mean
vitamin C intake from food diary and HCI with difference of log Vitamin C intake between food diary
and HCI (graph on the right hand side). .............................................................................................. 204
Figure 15. Bland-Altman plot of mean protein and fibre intakes and sodium from food diary and HCI
with difference in nutrient between food diary and HCI .................................................................... 205
Figure 16. Percentage frequency of response to multiple-choice questions on eating behaviours by
trial arm at baseline and end of treatment. Dashed lines differentiate between questions ............. 211
Figure 17. Percentage frequency of response to multiple-choice questions on food choice by trial arm
at baseline and end of treatment. Dashed lines differentiate between questions ............................ 213
Figure 18. Percentage frequency of response to multiple-choice questions on dietary fat by trial arm
at baseline and end of treatment. Dashed lines differentiate between questions. ........................... 215
Figure 19. Percentage frequency of response to multiple-choice questions on sucrose, salt alcohol
and activity by trial arm from baseline to end of treatment. Dashed lines differentiate between
questions ............................................................................................................................................. 217
Figure 20. Hunger and food craving score (HCS) ................................................................................ 223
Figure 21. Scree plot of components in the HCS ................................................................................. 227
Figure 22. Component plot in rotated space using oblimin rotation .................................................. 228
Figure 23. Mean change in MPSS-C score in each trial Arm (1=SBS, 2=IDAP, 3=VLCD) ...................... 241
Figure 24. Trajectories of Cigarette craving for individuals ................................................................ 242
Figure 25. Plot of fixed effects of trial arm dependent on time on MPSS-C from model 7 ................ 247
Figure 26. Plot of fixed effects of trial arm dependent on time squared on MPSS-C from model 10 247
Figure 27. Kaplan Meier curve for survival of abstinence, until relapse to smoking within the first 12
weeks post quit attempt in each trial arm .......................................................................................... 253
Figure 28. Bar chart of mean change in weight by trial arm, from baseline to week 0, +1, +4 and +12
............................................................................................................................................................. 256
Figure 29. Bar chart of mean change in fat mass by trial arm, from baseline to week 0, +1, +4 and +12
............................................................................................................................................................. 256
Figure 30. Bar chart of mean change in fat free mass by trial arm, from baseline to week 0, +1, +4 and
+12 ....................................................................................................................................................... 257
Figure 31. Bar chart of mean change in total body water by trial arm, from baseline to week 0, +1, +4
and +12 ................................................................................................................................................ 257

Figure 32. Individuals’ change in weight over weeks -1 to +12, annotated by trial arm, change in
smoking status and dietary change ..................................................................................................... 272
Figure 33. Individuals’ change in fat mass over weeks -1 to +12, annotated by trial arm, change in
smoking status and dietary change ..................................................................................................... 273
Figure 34. Mean weight change by trial arm over weeks post quit .................................................... 276
Figure 35. Mean fat mass change by trial arm over weeks post quit ................................................. 276
Figure 36. Plot of fixed effects of weight change trajectories by trial arm (model 8) ........................ 280
Figure 37. Plot of fixed effects of fat mass change trajectories by trial arm (model 8) ...................... 280

LIST OF TABLES Table 1. Causal relationships between smoking and disease established in 2004 by the US Surgeon
General’s review...................................................................................................................................... 5
Table 2. Definition of causality used by US Surgeon General, 2004 ....................................................... 6
Table 3. Critical appraisal of systematic reviews addressing the amount of post cessation weight gain
............................................................................................................................................................... 10
Table 4. Critical appraisal of cross sectional studies comparing BMI in quitters with never smokers . 14
Table 5. Critical appraisal of cohort studies comparing change in weight and BMI in quitters with
never smokers ....................................................................................................................................... 15
Table 6. Baseline characteristics associated with weight gain.............................................................. 19
Table 7. Appraisal of systematic reviews that examine associations between weight concern and
weight gain with quit attempts and relapse ......................................................................................... 30
Table 8.Review of prospective cohort studies assessing relative risk of type two diabetes in quitting
smokers ................................................................................................................................................. 35
Table 9. Effects of dietary interventions on weight change and abstinence during smoking cessation
(Adapted from Parsons et al., 2009) ..................................................................................................... 43
Table 10. Baseline characteristics by smoking status ........................................................................... 60
Table 11. Regression analysis for weight change over eight years according to four groups of smoking
status, smokers were used as the reference category ......................................................................... 64
Table 12. Regression model for the effect of BMI on weight gain in quitters ...................................... 67
Table 13. Estimated mean weight gain according to BMI for ‘smokers’, ‘quitters’ and ‘quitters without
potential outliers*’, ‘smokers combined with relapsers’, and ‘quitters combined with late quitters’ 68
Table 14. Regression model for the effect of BMI on weight gain in smokers ..................................... 68
Table 15. Regression Analysis of weight change according to baseline BMI and alcohol consumption
in quitters .............................................................................................................................................. 71
Table 16. Coefficients with 95% confidence intervals for potential explanatory variables of weight
gain in continuous quitters over eight years ......................................................................................... 74
Table 17. Schedule of measurements during DEMIST ........................................................................ 125
Table 19. Baseline characteristics of DeMiST participants engaging in semi-structured interviews .. 155
Table 20. Themes and sub-themes of difficult experiences during DeMiST, according to trial arm .. 156
Table 21. Themes and subthemes of reason for not completing the trial ......................................... 165

Table 22. Themes and sub-themes of helpful experiences during DeMiST, according to trial arm ... 166
Table 23. Nurses report of training and support, logistics, data management and recruitment.
Improvements made during DeMiST .................................................................................................. 187
Table 24. Nurses report of the clinical aspects, protocol, delivery of interventions and dealing with
failure to attend. Improvements made during DeMiST ...................................................................... 188
Table 25. Baseline nutrient intake and physical activity level for all participants and by trial arm
(Mean (SD)) ......................................................................................................................................... 196
Table 27. Correlation coefficients for nutrients measured by food diary and HCI ............................. 197
Table 28. Mean (SD), lower, upper and range of agreement of raw and log transformed data for
difference between food diary and HCI measurements. Also shows interpretation of antilogs as a
percentage of nutrient values. ............................................................................................................ 206
Table 29. Mean, minimum and maximum values of fat intake from food dairies and the
corresponding range identified by the HCI ......................................................................................... 206
Table 30. Change in fat intake and HCI score from baseline to week +12 according to trial arm and
between trial arm ................................................................................................................................ 210
Table 31. Percentage frequency of response to multiple-choice questions on eating behaviours in the
whole sample and by trial arm at baseline and end of treatment. Inside borders differentiate
between questions. ............................................................................................................................. 210
Table 32. Percentage frequency of response to multiple-choice questions on food choice behaviours
in the whole sample and by trial arm at baseline and end of treatment. Inside borders differentiate
between questions. ............................................................................................................................. 212
Table 33. Percentage frequency of response to multiple-choice questions on sources of dietary fat in
the whole sasmple and by trial arm at baseline and end of treatment. Inside borders differentiate
between questions. ............................................................................................................................. 214
Table 34. Percentage frequency of response to multiple-choice questions on sucrose, salt alcohol and
activity for the whole sample by trial arm from baseline to end of treatment. Inside borders
differentiate between questions. ....................................................................................................... 216
Table 33. Baseline nutrient intake in comparison to the dietary reference values and current intakes
of the general population ................................................................................................................... 219
Table 35. Kaiser-Meyer-Olkin and Bartlett’s Test for the HCS ............................................................ 226
Table 36. Total variance explained by component extraction from the HCS ..................................... 226
Table 37. Pattern matrix for components 1 and 2 .............................................................................. 226
Table 38. Structure matrix for components 1 and 2 ........................................................................... 227
Table 39. Cronbach’s alpha for Component 1 ‘food desire’ over time ............................................... 228

Table 40. Unadjusted linear regression coefficient with 95% confidence intervals for association
between participants who received the allocation they considered to be successful and the length of
time they stayed in study .................................................................................................................... 232
Table 41. Baseline characteristics of all participants by trial arm (mean(SD)) ................................... 237
Table 42. Baseline characteristics all participants and by trial arm (Frequency) ................................ 239
Table 43. Mean change(SD) in trial arms and mean difference [95% CI] between trial arms in MPSS-C
after 24 hours, 7 days and 1 month post quit date (ANOVA with Gabriel post hoc tests) ................. 241
Table 44. Difference in fit between models 1 to 7 for trajectory of change in cigarette craving ....... 245
Table 45. Coefficients of multilevel models 1 to 7 for cigarette cravings ........................................... 246
Table 46. Difference in fit between models 1 to 4 for trajectory of change in food desire and food
need..................................................................................................................................................... 249
Table 47. Coefficients of multilevel models 1 to 4 for food desire and food need ............................ 249
Table 48. Difference in fit between models 5 to 7 examining change in food desire and food need on
the trajectory of change in cigarette craving ...................................................................................... 251
Table 49. Coefficients of multilevel models 5 to 7 for which examine food desire and food need on
cigarette craving .................................................................................................................................. 251
Table 50. Number of relapses, median time to relapse and hazard ratios of relapse to smoking at 12
weeks according to trial arm ............................................................................................................... 253
Table 51. Mean (SD) change in anthropometrics, body composition and blood pressure from baseline
to week 0 and to week +1 in all completers by trial arm and mean difference [95% CI] in these
between trial arm ................................................................................................................................ 258
Table 52. Mean (SD) change in anthropometrics, body composition and blood pressure from baseline
to week +4 and to week +12 in all completers by trial arm and mean difference [95% CI] in these
between trial arm ................................................................................................................................ 261
Table 53. Mean Change (SD) in lung function and blood test results from baseline to week +12 in all
completers by trial arm and mean difference [95% CI] in these between trial arm .......................... 263
Table 54. Mean Change (SD) in anthropometrics, body composition and blood pressure from baseline
to week +1, +4 and +12 in completer abstainers by trial arm and mean difference [95% CI] in these
between trial arm ................................................................................................................................ 265
Table 55. Mean Change (SD) in lung function and blood test results from baseline to week +12 in SBS
abstainers and IDAP lapsers ................................................................................................................ 266
Table 56 Mean (SD) change in anthropometrics, body composition and blood pressure from baseline
to week +1 and to week +4 in completer lapsers by trial arm and mean difference [sample to small
for 95% CI] in these between trial arms .............................................................................................. 269

Table 57. Difference in fit between models of change in weight over time ....................................... 277
Table 58. Difference in fit between models of change in fat mass over time .................................... 277
Table 59. Coefficients of multilevel models for weight change .......................................................... 278
Table 60. Coefficients of multilevel models for change in fat mass ................................................... 279
Table 61. Change in fit of models for the trajectory of change in fat mass ........................................ 282
Table 62. Coefficients for multilevel models for trajectory of change in fat mass ............................. 283
Table 63. Mean (SD) change in anthropometrics, body composition and blood pressure from baseline
to week 0 and to week +1 in ITT population by trial arm and mean difference [95% CI] in these
between trial arm. ............................................................................................................................... 285
Table 64. Mean (SD) change in anthropometrics, body composition and blood pressure from baseline
to week +4 and to week +12 in ITT population by trial arm and mean difference [95% CI] in these
between trial arm ................................................................................................................................ 287
Table 65. Mean (SD) change in anthropometrics, body composition and blood pressure from baseline
to week +1 and to week +4 in ITT abstainer population by trial arm and mean difference [95% CI] in
these between trial arm ...................................................................................................................... 289
Table 66. Mean (SD) change in anthropometrics, body composition and blood pressure from baseline
to week +1 and to week +4 in ITT lapser population by trial arm and mean difference [95% CI] in
these between trial arm ...................................................................................................................... 290
Table 67. Mean (SD) change in anthropometrics, body composition and blood pressure from baseline
to week +12 ITT abstainer population by trial arm ............................................................................. 291
Table 68. Mean (SD) change in anthropometrics, body composition and blood pressure from baseline
to week +12 in ITT lapser population by trial arm and mean difference [95% CI] in these between trial
arms ..................................................................................................................................................... 292
Table 69. Mean Change (SD) in lung function and blood test results from baseline to week +12 in all
ITT by trial arm and mean difference [95% CI] in these between trial arms ...................................... 294
Table 70. Mean change (SD) in lung function and blood test results from baseline to week +12 in ITT
abstainers and ITT lapsers by trial arm ............................................................................................... 295
Table 71. Adverse Events (AE) during DeMiST .................................................................................... 297
Table 72. Summary of findings and academic contribution from the analysis of the Oxford patch data
............................................................................................................................................................. 307
Table 73. Feasibility Findings from DeMiST and their contribution to current evidence ................... 312
Table 74. Findings of the investigation of process measures in DeMiST their implication for further
research ............................................................................................................................................... 315

Table 75. Effects of DeMiST interventions on clinical outcomes and the implication for further
research ............................................................................................................................................... 319

LIST OF ABBREVIATIONS BMI Body mass index
BMR Basal metabolic rate
BOCF Baseline observation carried forward
CI Confidence interval
CO Carbon monoxide
CRF Case report form
CRP C-reactive protein
DeMiST Dietary Management in Smoker‟s Trial
EAR Estimated average requirement
FEV1 Forced expiratory volume in 1 second
FFM Fat free mass
FM Fat mass
FVC Forced vital capacity
HCI Healthy choice index
HCS Hunger craving score
HDL High density lipoprotein
HR Horne Russell (score)
IDAP Individualised dietary and activity plan
ITT Intention to treat
LDL Low density lipoprotein
MEOS Microsomal ethanol oxidising system
MPSS Mood and physical symptoms score
MPSS-C Mood and physical combined symptoms score
NHS National Health Service
NRT Nicotine replacement therapy
NSP Non starch polysaccharide
OR Odds ratio
PAL Physical activity level

RNI Reference nutrient intake
RR Relative risk
SBS Step by step
SD Standard deviation
SOP Standard operating procedure
TBW Total body water
TC Total cholesterol
VLCD Very low calorie diet
WC waist circumference
WHR Waist hip ratio
WIs Work instructions

1
1. BACKGROUND: WHY AND HOW SHOULD WE ADDRESS THE PROBLEM OF WEIGHT GAIN ASSOCIATED WITH
SMOKING CESSATION? This thesis begins with a review of the literature on post cessation weight gain, its
causes and consequences. It then presents original analysis of weight gain from a
prospective eight year cohort of continuous abstainers, smokers and „relapsers‟. It
describes the protocol and presents the results of a randomised controlled feasibility
trial designed to test dietary interventions to prevent smoking cessation related
weight gain.
1.1. The undisputed benefits of smoking cessation
In the year 2000, 4·83 million premature deaths worldwide were attributable to
smoking. Cardiovascular disease (1·69 million deaths), chronic obstructive
pulmonary disease (0·97 million deaths), and lung cancer (0·85 million deaths) were
the leading causes of death from smoking (Ezzati & Lopez, 2003).
The causal relationships between smoking and numerous diseases have been
established in the 2004 US Surgeon General‟s review (Table 1). This clearly defined
criteria for causality (Table 2) and incorporated 1600 key articles. Where evidence
was insufficient to infer causality three further categories were defined on the
strength of evidence. These were „suggestive but not sufficient to infer a causal

2
relationship‟, „inadequate to infer the presence or absence of a causal relationship‟
and „suggestive of no causal relationship‟.
Causality is bolstered by the removal of the factor of interest resulting in reduced risk
of or improvement in a disease. In 1990, the US Surgeon General reviewed a large
body of observational studies and clinical trials with respect to the health benefits of
stopping smoking. The conclusions were as follows:
Smoking cessation has major benefits for men and women of all ages, with
and without smoking related diseases,
Former smokers live longer than continuing smokers, those quitting before the
age of 50 have half the risk of dying in the next 15 years,
Smoking cessation decreases the risk of lung cancer, other cancers, heart
attack, stroke, chronic lung disease and low birthweight babies.
Since then, evidence of the benefits of smoking cessation has continued to mount. A
50 year prospective cohort of British male doctors showed stopping smoking at age
60, 50, 40, or 30 years resulted in a gain of approximately three, six, nine and 10
years of life expectancy respectively. Among the men born around 1920, cessation at
age 50 halved the risk of premature death, and cessation at age 30 avoided almost
all of it (Doll et al., 2004).
A systematic review of smoking cessation in patients with coronary heart disease
showed a 36% reduction in all cause mortality (relative risk (RR) 0.64, 95% CI (0.58,

3
0.71)) in quitting smokers compared to continuing smokers (Critchley & Capewell,
2003). However, this review only included studies where follow-up was 2 years or
more so risk during the first two years of quitting was not assessed.
The increased risk of non fatal acute myocardial infarction in current smokers
compared to never smokers (odds ratio (OR) 2·95, 95% CI (2·77, 3·14)) fell to 1·87
(1·55, 2·24) within three years of quitting. An excess risk remained 20 or more years
after quitting (1·22 (1·09, 1·37)). In light smokers (1-9 cigarettes/day) the risk was
elevated at one to three years post quit beyond that of current smokers, but reduced
after 3 years (Teo et al., 2006).
Data from national statistics and case control studies showed the risks of developing
lung cancer by the age of 75 were reduced from 16% in continuing smokers to 10%,
6%, 3%, and 2% for men who stopped at ages 60, 50, 40, and 30 respectively. In
women, they reduced from 10% to 5% and 2% in those who stopped at age 60 and
50 respectively (Peto et al., 2000). The risk of lung cancer in a prospective cohort of
women reduced with increasing duration of abstinence (Ebbert et al., 2003). Death
from lung cancer reduced in those who quit smoking (Anthonisen et al., 2005).
The impact of smoking cessation on lung function was first clearly demonstrated in
an eight year prospective study of 792 working men recruited in 1961, Fletcher and
Peto found that forced expiratory volume in 1 second (FEV1) gradually falls over a
lifetime. In most non smokers and in many smokers, clinically significant airflow
obstruction never develops. However, in those susceptible to chronic obstructive

4
pulmonary disease (COPD), smoking causes permanent obstructive airway changes.
Fletcher and Peto found that if susceptible smokers quit smoking, although their
current reduced lung function was permanent, the average rate of decline in FEV1
thereafter, reverted to follow a normal trajectory (Fletcher and Peto, 1977). More
recently, a prospective cohort in those with COPD who quit 11 years previously
showed FEV1 declined by 30.2ml/year in men and 21.5ml/year in women. Whereas
in those who continued to smoke, FEV1 declined by 60.1ml/year and 54.2ml/year, in
men and women respectively (Anthonisen et al., 2002).

5
Table 1. Causal relationships between smoking and disease established in 2004 by the US Surgeon General‟s review
Evidence sufficient to infer causality Suggestive but not sufficient to infer a causal relationship
Inadequate to infer the presence or absence of a causal relationship
Suggestive of no causal relationship
Chronic Obstructive Pulmonary disease (COPD) Ischaemic heart disease Stroke Aortic aneurism Atherosclerosis Peptic ulcer (Helicobactor (H.) Pylori positive) Pneumonia Osteoporosis (post menopausal) Hip fracture Periodontitis Cataract Reduced fertility Premature rupture of membranes Placenta previa Placental abruption Preeclampsia Foetal growth restriction low birth weight Sudden infant death syndrome Surgical complications Cancers:
– Lung – Oral cavity/pharyngeal – Laryngeal – Oesophagus – Bladder – Kidney – Stomach – Pancreas – Cervical – Endometrial
– Myeloid leukaemia
Acute respiratory infections Chronic respiratory disease in offspring (maternal smoking during pregnancy) Erectile dysfunction Ectopic pregnancy Peptic ulcer complications Oral clefts Dental caries (root surface) Macular degeneration Graves disease opthalmology Low bone density in older men Cancers:
– Colorectal – Liver – Non cardia gastric cancers
Asthma Glaucoma Dental caries (coronal) Peptic ulcer (H. Pylori negative) Idiopathic pulmonary fibrosis Poor sperm quality Congenital malformations Childhood growth (maternal smoking) Childhood neurocognitive development (maternal smoking) Reduced bone pre-menopausal bone density Fractures at sites other than the hip Cancers:
– Ovarian
Diabetic retinopathy Cancers:
– Prostate – Adult brain – Breast

6
Table 2. Definition of causality used by US Surgeon General, 2004
1.2. Weight gain as a consequence of smoking cessation
The 1990 US Surgeon General‟s review also showed that approximately 80% of
those who stop smoking will gain weight, but concluded that:
“The health benefits of smoking cessation far exceed any risks of the average
5-pound (2-3kg) weight gain or any adverse psychological effects that may
follow quitting.”
However, while there continues to be overwhelming evidence that smoking cessation
reduces morbidity and mortality despite weight gain, more recent evidence
demonstrates post cessation weight gain may be considerably greater than this early
estimate. This presents us with a challenge which needs addressing for several
reasons which I will elucidate in detail in this chapter. Firstly, for some this weight
gain presents a barrier to making a quit attempt and is a reason to relapse. Secondly,
those who gain weight receive less health benefit from smoking cessation than those
who do not. Thirdly, there is emerging evidence of some increased medium term
health risks in those who quit compared to that those who continue to smoke. For
some diseases there appears to be an adaptation period before the full benefits of
cessation become apparent, when ill health and health risk may in fact increase
Criteria for causality (USDHHR, 2004)
1. Consistency of evidence, 2. Strength of association, 3. A high degree of specificity, 4. Temporality (cause must precede effect) 5. Coherence, plausibility, and analogy such that a claim can be supported or refuted by plausible biological
mechanisms, 6. A biological gradient or dose-response relationship 7. Evidence from conditions which might imitate a randomised ‘natural’ experiment
7
beyond that of continuing smokers. This may be due to weight gain. If this proves to
be the case, strategies to prevent weight gain, provide treatment and reduce risk
during this period of heightened susceptibility may maximise the benefits of quitting
and help more smokers to quit.
The rest of this chapter discusses these issues more fully and provides the rationale
for our investigations, a cohort analysis and a randomised controlled feasibility trial,
during this period of doctoral study. These contribute to addressing the problem of
smoking cessation related weight gain.
1.2.1. How much weight is gained?
To obtain a more recent estimate of the amount of weight typically gained on
smoking cessation we searched Medline, Embase and PsycINFO from 1989 to
present day for review articles. We did a title search and used the terms „weight‟ AND
(„smoking cessation‟ OR „smoking‟). We limited our search to articles in English. We
excluded reviews where authors made no attempt to describe how they searched the
literature or selected articles. We identified three eligible review articles and
appraised them, together with the 1990 US Surgeon‟s General report. We used the
critical appraisal skills programme (CASP) tool for systematic review articles.
We found that none of these reviews assessed the validity of included studies or
addressed the heterogeneity between them adequately (Table 3). For example, in
the Klesges review (Klesges et al., 1989) estimated mean weight gain was derived

8
from studies reporting it at anything from four days to 40 years post quit. Weight gain
does not reach its full extent after four days and so this combined estimate is hard to
interpret. In addition, estimates included both studies that measured abstinence by
point prevalence (abstinence verified at a single point in time) and continuous
abstinence (reported continuous abstinence verified at follow-up). A prospective
cohort study has shown that continuously abstinent participants gained significantly
more weight at one year (5.9kg compared to 3.0kg respectively) than those who were
point prevalent abstinent at one year (Klesges et al. 1997). Estimates of weight gain
that include variable length of abstinence and point prevalence abstinence may
include those quit for too short a time to demonstrate the full extent of weight gain.
Therefore, we sought prospective cohort studies using continuous abstinence criteria
to define smoking status from a common time point of abstinence. We searched the
databases described above using terms: (weight gain AND smoking cessation) AND
(cohort OR prospective). We also searched our own reference library that contained
randomised controlled trials reporting on weight change during smoking cessation.
For another project we had conducted a meta-analysis of weight gain at follow up in
randomised controlled trials using continuous abstinence criteria, this showed weight
gain after one year to be 4.8kg (Aubin et al. 2011, unpublished). We only found two
longer term studies since the Klesges et al. review in 1989 which met these criteria.
They showed four and five years post cessation weight gain to be 8.9kg (Daughten et
al., 1999) and 8.1kg (O‟Hara et al., 1998) respectively. A further analysis of the Lung
Health Study (O‟Hara et al., 1998) was done using an instrumental variable approach
which takes into account unmeasured confounders between smokers and quitters,

9
raised this estimate to 9.7kg ( Eisenberg & Quinn, 2006). Therefore, recent
prospective studies over 4-5 years show a weight gain in quitters of 8-10kg,
compared to 1.6kg in continuing smokers (O‟Hara et al., 1998). However, these are
the only long term prospective cohort studies which we found that reported weight
gain in continuously abstinent smokers.
1.2.2. Does this weight gain continue indefinitely?
The Klesges review found reasonably consistent evidence from 24 out of 29 cross
sectional studies that smokers weigh less than non smokers. Eight out of nine cross
sectional studies showed smokers weigh less than ex-smokers. However, whether
ex-smokers weigh more than non smokers is less clear (2 out of 3 cross sectional
studies show that they do) (Klesges et al., 1989). Therefore, debate exists over
whether weight gain in quitters is permanent or temporary. It has been hypothesised
that weight gain in quitters only continues until it catches up with that of the never
smoking population (this could be explained by the „set point‟ theory of weight gain,
which is discussed later in the section 1.3 of this chapter).

10
Study Klesges et al.,1989 US Surgeon General., 1990 Froom et al.,1998 Pistelli et al, 2009
Was the question addressed?
Yes. Although the article did seek to answer several questions at once. We have taken the ones relevant to our discussion separately
Yes. Although other questions were addressed method for this question was clear
Yes. Article tried to answer several different questions
Yes. Article tried to answer several different questions
Is it likely that important relevant studies were missed?
Unclear. No method was described, although a large number of studies were identified
Unclear. Method of searching not described
Yes. Only searched medline, no attempt to obtain data from unpublished studies. Not all relevant MeSH terms were used i.e. used ‘smoking’ but this did not cover ‘smoking cessation’
Yes. No systematic selection procedure was applied. Large, population studies or large clinical trials from United States and Europe were preferably selected.
Was inclusion criteria for studies appropriate?
Not defined Yes. Prospective cohorts after 1970, with control of continuing smokers, at least 1 month of follow up and 10 participants. Excluded studies where weight loss interventions were used or relapsed subjects were included in analysis
Not defined As above
Was validity of included studies addressed?
To a degree. Narrative discussion mostly as an explanation for those which did not provide consistent results. No evidence of each study being formally assessed or excluded on the basis of its validity
Not beyond inclusion/exclusion described above
No No
Were the results homogeneous or was heterogeneity adequately addressed?
Discussed but not adequately addressed e.g. no sub-analysis
Variable length of follow up not addressed, but means adjusted for sample size
Not addressed No. Cross sectional and longitudinal studies were considered with equal merit. Some different methodological issues were discussed
What were the results? 41 prospective studies involving 110,000 participants were included. 76% show smokers who quit gain weight. Studies ranged in follow-up from 4 days to 40 years, mean follow up 2 years 11 months. Mean weight gain 2.9kg (range 0.3kg – 8kg) 19% of these studied relied of self reported smoking status 46% were in a select sample 37% either had small samples or high attrition rates
15 prospective studies, median follow up of 2 years. Weight gain among smokers who quit was 2.1kg (range 0.7-5kg) compared to 0.4kg (range 0-1.6kg) in continuing smokers. Relative risk of weight gain 1.45, 95% CI [1.31, 1.75]. Weight gain >9kg is rare
Narrative cited nine prospective studies and concluded sustained quitters gain on average 5kg more than continuing smokers, although how this figure was reached and over what period of time this refers to is unclear.
No attempt was made to combine findings into a mean estimate of weight gain. Authors concluded “most smokers who quit experience a weight gain, particularly within one year, and it may persist up to 8 years after smoking cessation”.
Table 3. Critical appraisal of systematic reviews addressing the amount of post cessation weight gain

11
The Froom review (Froom et al., 1998) attempted to answer this question concluding
evidence was conflicting. However, the authors of this review did not appraise the
validity of the studies or consider methodological differences between then. We
considered the relevant studies cited in the Froom review and searched for recent
ones in the databases described above. We did a keyword search, using the MeSH
terms “weight AND (never-smokers OR non-smokers) AND (abstainers OR
abstinence OR former OR ex-smokers OR quit*) AND (cross sectional) OR
(prospective OR cohort OR longitudinal OR follow-up)”.
We found six large cross sectional studies with relevant data (Table 4). Five
examined gender differences, four examined differences according to duration of
abstinence and three provided combined data of their whole sample.
Two out of three of the studies reporting on combined data found BMI was similar in
ex-smokers and never smokers (Klesges et al., 1991, Mizoue et al., 1998) one study
found it was higher in ex-smokers than never smokers (Chen et al, 1993).
In three out of the five studies examining gender, women had a similar BMI to never-
smokers, whereas men had a higher BMI (Klesges et al., 1991, Molarius et al., 1997,
Travier et al, 2009). Although in one of these studies women who had been
abstinent for less than one year, and only men who had been abstinent for more than

12
one year, had a higher BMI than never smokers. Men who had been abstinent for
less than one year had a lower BMI than never smokers (Klesges et al., 1991).
One study showed that women who had been abstinent for less than 10 years had a
higher BMI than never smokers, and women abstinent for more than 10 years had a
lower one. The same study showed the opposite was true for men. Those abstinent
for more than 10 years had a higher BMI, and those abstinent for less, had a lower
BMI than never-smokers (Flegal et al., 1995).
The three studies showing a higher BMI in male ex-smokers compared to male
never-smokers showed that this difference was between 0.4-0.6kg/m2, which is
clinically important (Klesges et al., 1991, Molarius et al., 1997, Travier et al, 2009).
Therefore, cross-sectional data suggests that the BMI of women who have been
abstinent for a relatively long period is similar to that of never-smokers, but in short
term abstainers it may be higher. Whereas men who have been abstinent for a long
time have a BMI that exceeds never-smokers and those abstinent for a shorter period
have a lower BMI than never-smokers.
Some of the inconsistencies in these cross sectional studies, in particular those that
show BMI in abstainers does not exceed former smokers, may be due to the

13
inclusion of shorter periods of abstinence. Prospective studies that track change in
BMI from a specific quit date may be more accurate.
We found five prospective studies, all of which gave consistent evidence that
increase in weight and BMI during the first five years post cessation exceeds that of
never smokers. In one study (Munafo et al., 2009) the increase in BMI after five years
of abstinence was not statistically different to that of never smokers over the same
period of time. However, the mean difference was 0.3kg/m2, which is clinically
relevant.
Two studies (Williamson et al., 1991, Munafo et al., 2009) reported on BMI at
baseline and at the end of study. They both found that quitters at baseline had lower
BMIs than never smokers, but BMIs after 13 years were not statistically significantly
different but the study by Munafo, in men only, did show a clinically relevant mean
difference of 0.6kg/m2 (Table 5).
Therefore, findings from prospective studies suggest initial rapid weight gain may
eventually, after a decade or more, result in a BMI which is not statistically different to
never-smokers, but sufficiently different to be of clinical relevance. This is consistent
with the cross-sectional evidence of long term male abstainers. Observational data,
at least for men, does not substantiate the set-point hypothesis.

14
Cross-sectional study Klesges et al., 1991 Chen et al., 1993 Flegal et al., 1995 Molarius et al., 1997
Mizoue et al., 1998 Travier et al, 2009
Was the study sample clearly defined?
Yes. Second National Health and Nutrition Examination Survey (NHANES II)
Yes Yes. NHANES III Yes. 42 populations in the WHO MONICA project
Yes Yes. European Prospective Investigation into Cancer and Nutrition (EPIC)
Was a representative sample achieved (e.g. was the response rate sufficiently high)?
Yes. 10,778 over 18 years old nationwide
1633 white Canadian men and women
Yes n=5837 69 000 men and women between 35 and 64 years
7324 working population of men
469, 543 men and women
Was exposure (smoking status) measured accurately?
Self reported recall
Self reported recall
Self reported recall up to 10 years previously
Self reported recall
Self reported recall
Self reported recall
Was outcome measured accurately?
Measured BMI Measured BMI Measured BMI Measured BMI Measured BMI Measured BMI
Were confounders adjusted for?
Yes Yes Yes Yes Yes Yes
What were the results and precision of these?
BMI in never smokers men: 25.5, women: 25.8
Quit< 1 year men: 25.2, women: 26.6
Quit >1year men 25.9, women: 25.8
Never and long term quitters BMI not significantly different.
Ex smokers (>6months) weighed more than never smokers.
BMI less in women with greater duration of abstinence (significant association)
BMI in never smoker men: 29.6 (0.35) women: 27.2 (0.26)
Quit <10years men: 27.9 (0.27) women: 27.7 (0.48)
Quit>10years men: 27.3 (0.24) women: 26.7 (0.26)
Mean difference in BMI (95% CI) between never smokers and ex-smokers men: 0.5 (0.4, 0.6) women: 0.1 (-0.1, 0.3)
BMI of former smokers and never smokers not significantly different, 2-4 year quitters higher BMI than never smokers
Mean difference in BMI (95% CI) between never smokers and ex-smokers men: 0.55 (0.44, 0.65) women: -0.02 (-0.24, 0.19)
Table 4. Critical appraisal of cross sectional studies comparing BMI in quitters with never smokers

15
Cohort study Williamson et al., 1991 Froom et al., 1999 Janzon et al., 2004 Reas et al., 2009 Munafo et al., 2009
Representative sample?
Yes N=9332
Males only N=1338
Females only All participating in the case control Malmo diet and cancer study N=10902
Yes N=1300
Males only N=2512
Common starting point?
For weight but not for smoking i.e. not from a set quit date
For weight but not for smoking i.e. not from a set quit date
Yes, actively smoking or never smoker
For weight but not for smoking i.e. not from a set quit date
For weight but not for smoking i.e. not from a set quit date
Adequate follow up (mean)?
13 years 2.6 years 11 years 11 years 13 years
Objective exposure?
Self report recall Self report recall Self reported recall Self reported recall Self report recall
Objective outcome?
Measured weight Measured weight Measured weight Self reported BMI Measured weight
Adjustment for confounding?
Yes Yes Not adjusted for case or control
yes Yes
Results & precision of results?
Mean difference (95%CI) between weight gain (kg) in continuing smokers and: men women
Recent quitters (<1yr)
2(0.6-3.4) 1.1(-0.4, 2.6)
Sustained quitters > 1 year
2.8 (2, 3.6) 3.8(2.9, 4.7)
Former smokers >12 years
1.2(0.3, 1.6) 1.6(0.8, 2.4)
Never smokers
0.9 (0.3, 1.5) 1.4(0.9, 1.9)
Smoking cessation had raised BMI from 25.7 to 27.7 in women and from 26.5 to 27.5 in men to never smokers 28.3 (women) and 27.6 (men)
Mean (SD) increase in BMI (kg/m2)
Quit after study entry
0.99(0.18)
Quit before study entry
0.19(0,1)
Never smokers
0.07(0.06)
Mean (SD) increase in weight (kg)
Quit < 1yr 7.3 (0.63)
Quit 1-2 yrs 8.8 (0.77)
Quit 2-5yrs 7.9 (0.61)
Quit 5-10yrs 7.7 (0.73)
Quit >10yrs 6.2 (0.72)
Never smokers
3.9(0.1)
Mean (SD) increase in BMI (kg/m2)
men women
Recent quitters (<5yr)
2.6(0.30) 2.4(0.34)
Sustained quitters > 5 year
1.9(0.22) 2.1(0.22)
Never smokers
1.6(0.15) 1.8(0.15)
No significant differences between long term quitters and never smokers
BMI (kg/m2) from
Quitters Never smokers
Baseline to
25.70 (3.64)
26.96 (3.56)
<4 years post quit
27.13(3.64) 27.08(3.60)
> 5 years 27.46(3.90) 27.12(3.64) >9 years 27.61(3.64) 26.97(2.86)
Attrition adequately addressed?
No Yes Yes No Yes
Table 5. Critical appraisal of cohort studies comparing change in weight and BMI in quitters with never smokers

16
1.2.3. What characteristics are associated with this weight gain?
Although it has been reported that 80% of quitters gain weight (USDHHR, 1990), this
leaves a potential 20% who do not, and there is a wide variation in the amount of
weight gained. Several studies that follow biochemically validated continuous
abstainers identify “supergainers”, quitters who gain an excessive amount. In a meta-
analysis of one year follow-up of trial data (Aubin et al., unpublished) 13% of quitters
gained more than 10kg. In a four year cohort, 7% gained more than 18kg (Daughten
et al., 1999) and in a 5 year cohort 4% gained in excess of 20kg (O‟Hara et al.,
1998).
It is important to identify characteristics that are associated with greater weight gain
for a couple of reasons. Firstly, on an individual level, preparing quitting smokers with
realistic expectations of weight gain may be an important element of success. We
know from weight loss interventions in obese participants that many people set
themselves unrealistic expectations of weight loss, become disheartened when they
fail to reach their target, and so give up (Foster et al., 1997). Also, there is some
evidence that those who are counselled to accept weight gain have an increased
chance of stopping smoking in the medium term. Increased abstinence rates were
shown at 6 months (but not at 12 months) in a randomised controlled trial comparing
cognitive behavioural therapy (CBT) to accept weight gain with usual care (Perkins et
al., 2001). But a later study could not replicate these findings (Levine et al., 2010).

17
Secondly, those who put on the most weight will have a greater increase in health
risks associated with weight gain such as diabetes and cardiovascular disease than
those who gain less. Therefore, although smoking cessation independently reduces
these risks, they rise again, although to a lesser extent, with post cessation weight
gain. Therefore, in a climate of limited NHS resources, those who gain the most
weight are the ones for who weight control interventions should be targeted.
Three of the reviews described in previous sections (Klesges et al., 1989, Froom et
al., 1998, Pistelli et al., 2009) also examined factors associated with greater weight
gain. They included cross sectional and longitudinal studies. We chose to pull out
from these the longitudinal studies which measured weight change between two time
points, rather than the cross-sectional studies, which may have recalled weight
inaccurately. We did not include those factors, such as physical activity and dietary
intake, which change over time following a quit attempt, as they are not fixed
characteristics, identifiable at the time of quitting. Combining the findings showed the
most consistent evidence, found in nine of 14 studies, was that higher smoking rates
were associated with greater weight gain. The association between weight gain and
age, baseline BMI and gender were all inconclusive (Table 6).
As discussed previously these reviews were not exhaustive, they did not appraise the
studies they included or classify them according to those which relied on point
prevalence or continuous abstinence. There is need for an updated systematic
review of prospective studies to examine the characteristics associated with post

18
cessation weight gain. Such a review would need more inclusive search criteria,
considered inclusion and exclusion study criteria, critical appraisal of studies and
appropriate addressing of heterogeneity than the reviews to date. There is a need
for more long term prospective studies with accurate classification of abstinence to
contribute to such a review.
1.2.4. Our contribution to this knowledge
In the 1990s an influential randomised controlled trial examined the effects of nicotine
patch versus placebo patch as an aid to smoking cessation within 19 general
practices in Oxfordshire. Participants were treated for three months, followed up at
six months, one year and eight years later. At these time points smoking status was
verified by expired CO concentration and salivary cotinine (ICRF GPRG, 1993, ICRF
GPRG,1994, Yudkin et al., 2003). Weight was recorded at baseline and at 8 years.
We used these data (which we will refer to as the „Oxford patch data‟ hereafter) to
investigate weight change over this time by smoking status. We investigated the
associations of baseline characteristics, recorded at the time of quitting in the Oxford
patch data, with weight gain over eight years. These investigations are reported in
chapter two of this thesis.

19
Baseline Characteristics Associations with weight gain Number of supporting cohort studies
Age No association/inconsistent association Negative (older gain less e.g. greater if under 55 years old)
4 3
Genetic disposition Greater concordance of weight among monozygotic than dizygotic twins 1
Self-rated health
Lower weight gain in quitters with lower self-rated health 1
Alcohol Lower weight gain among social drinkers compared to those who do not drink alcohol at baseline 1
BMI Positive (higher weight gain in quitters with higher baseline BMI) No association Negative (lower weight gain in quitters with higher baseline BM)
1 3 2
Smoking rate Positive (greater weight gain in those who smoke more (e.g. greater than 25 cigs/day) n-shaped association with moderate smokers gaining most weight after smoking cessation No difference in weight gain with baseline smoking rate
9 2 3
Socioeconomic status (SES) Lower weight gain in quitters with higher SES
2
Gender Greater weight gain in women No association Greater weight gain in men
3 2 2
Ethnicity Greater weight gain in African-Americans than European-Americans 2
Table 6. Baseline characteristics associated with weight gain

20
1.3. What causes post cessation weight gain?
Quitting smokers are faced with a number of weight promoting challenges
associated with nicotine withdrawal, that tip the energy balance equation in favour
of weight gain. As we have previously discussed (section 1.2.2) whether this
means that weight exceeds that which would have been reached, if quitters had
not smoked, or individuals reach their „set point‟ is not entirely clear. Perkins in
1993 postulated the „set-point‟ hypothesis in this context whereby smoking may
suppress an individuals‟ set point; a homeostatically regulated predetermined
weight regardless of whether this weight is in the ideal BMI range or not. Although
we cannot confirm or refute this with current evidence, it does not detract from the
health risks that post cessation weight gain poses. These are discussed in later
sections of this chapter (section 1.4).
The reviews described previously and a number of narrative reviews have
discussed potential causes of post cessation weight gain. They cited research
ranging from metabolic studies which measure metabolic rate in laboratory
conditions to cohort studies measuring processes such as dietary change and
change in physical activity levels. This has led to a variety of biologically plausible
theories; each of which could be a contributing factor. However, the body of
evidence shows findings that are inconsistent or samples that are too small to be
conclusive. However, we have summarised the possible mechanisms below.

21
1.3.1. Reduced basal metabolic rate and energy expenditure during physical activity
A reduction in basal metabolic rate on smoking cessation has been seen in some
but not all human laboratory studies. A pooling of these studies in the narrative
review reported that metabolic rate may drop by 4% to 16% with smoking
cessation, and could account for up to 40% of this weight gain (Filozof et al.,
2004). From meta-analysis of weight gain in the controlled arms of smoking
cessation trials (Aubin et al. 2011, unpublished) we know that there is
approximately a 5kg increase in weight by one year post cessation. Therefore, if
there was no other change, and quitters continued to eat and exercise at their pre-
quitting level, they could expect to gain 2kg (40% of 5kg) in the first year after
stopping smoking (solely as a result of a fall in metabolic rate). The fall in
metabolic rate is thought to arise primarily from reduced excitation of the
sympathoadrenal pathway due to withdrawal of nicotine (Perkins, 1992). Nicotine
is a cholinergic agonist, which enhances the effects of acetylcholine on nicotinic
receptors.
There is fairly consistent evidence from cohort studies as described in section
1.2.3 that those who smoke more cigarettes a day gain more weight on cessation
(Table 6). One explanation could be that excitation of the sympathoadrenal
pathway is greater in these smokers and withdrawal reduces metabolic rate further
in those who smoke more. This dose response relationship may explain why
different studies have shown different levels of change in metabolic rate (Perkins,
1992). However, empirical evidence refutes this. A laboratory study has shown

22
those who smoke less have a greater rise in energy expenditure after smoking
than those who smoke more; who seem to exhibit tolerance (Arcavi et al., 1994).
Smoking also affects energy expenditure during physical activity. A laboratory
study has shown that when 24 hour periods of equal physical activity and dietary
intake are compared within individuals in abstinent and smoking states, total
energy expenditure reduces in the abstinent state; but basal metabolic rate stays
constant (Hofstetter et al., 1986). Another laboratory study showed that the energy
expending effect of nicotine more than doubled during periods of physical activity
than during periods of rest (Perkins et al. 1989). Therefore, energy expenditure
during activity may be reduced further with nicotine withdrawal, than it is when at
rest.
In summary, nicotine withdrawal may reduce basal metabolic rate, but it is unclear
how this relates to smoking rate. Alternatively, energy expenditure during physical
activity may be affected more than basal metabolic rate by nicotine withdrawal.
The latter would suggest that those who are habitually more active would
experience greater weight gain, but we are not aware of any epidemiological
evidence to support this.
1.3.2. Increased fat storage
Smoking cessation may reduce fat oxidation leading to increased storage of body
fat. A small study has shown that fat oxidation, measured by indirect calorimetry
was positively associated with 24 hour urinary cotinine excretion in smokers

23
(Jensen et al., 1995). Yet another small study that measured fat oxidation
(lipolysis) in adipose tissue did not find it reduced in quitting smokers. However,
this study did show increased activity in the fat storage enzyme, adipose tissue
lipoprotein lipase, in gluteal (but not abdominal) adipose tissue which was
associated with four week post cessation weight gain (Fererra et al., 2001).
Therefore, increased storage of fat may be a factor contributed to post cessation
weight gain. However, the metabolic mechanism and the adipose tissue sites
involved are unclear.
1.3.3. Increased energy intake
Laboratory studies in rats have shown that nicotine suppresses food intake
(Myiata et al., 2001) and hunger is well established as a withdrawal symptom from
cigarette smoking (Hughes et al., 1986). Two human studies measured food
intake in quitters after the first two to three months after stopping smoking and
found daily energy intake increased. The mean value was shown as no more than
230kcal/day. This may account for 69% of post cessation weight gain (Stamford et
al., 1986, Moffart and Owens, 1991). However, an increase in energy intake has
not been found in all studies (Rodin et al., 1987).
An increase in food intake could arise from a number of mechanisms. We can
group these loosely into a homeostatic response to food deprivation and a
hedonic response to food reward (Saper et al., 2002, Blundell, 2006).

24
The first response is commonly perceived as an abdominal sensation and
described as emptiness in the stomach. This occurs through feedback
mechanisms acting in response to a starved state. For example, low levels of
leptin (released from adipose tissue in the fed state) allow Neuropeptide Y (NPY)
to bind to receptors in the hypothalamus and trigger the sensation of hunger.
There is some evidence from altered activity of NPY in rat studies to suggest that
increased energy intake during nicotine withdrawal may be due to increased
homeostatically regulated hunger (Li et al., 2000) but the mechanism is unclear. A
few studies in humans have measured leptin levels in quitting smokers but the
evidence shows no consistent decrease in leptin after cessation (Filozof et al.,
2004).
There is also evidence that eating based on sensory properties may increase on
cessation. A systematic review shows consistent evidence that during smoking
cessation the rewarding value of food increases (Berlin, 2009). Studies in rats
(Schroeder et al., 2001) and several studies in humans also suggest that both
nicotine and food increase dopamine through activation of the ventral tegmental
area (Volkow et al., 2008). It has been suggested that food used as a
“substitutional reinforcer” for smoking may contribute to weight gain (Audrain-
McGovern & Benowitz, 2011). Hedonistic eating and food craving is described in
more detail in section 3.1.2. However, we are unaware of any empirical studies
that have examined whether hedonistic eating increases during nicotine
withdrawal and how this contributes to post cessation weight gain.

25
Thus, while there is consistent evidence that hunger increases during smoking
cessation and increased energy consumption may account for a significant
proportion of weight gain. There is no strong evidence that this is mediated by
changes in neuropeptides or that hedonistic eating is responsible.
1.3.4. Decreased physical activity post cessation
A reduction in physical activity has been considered as another factor for smoking
cessation related weight gain, however a review of cohort studies shows a similar
number of studies report a rise in post cessation physical activity as those that
report a fall (Chiolero et al., 2007). Thus, the evidence suggests that changes in
physical activity after cessation are unlikely to be an important cause of post
cessation weight gain.
1.4. The impact of the weight gain associated with smoking cessation
In this section we examine the impact that smoking related weight gain may have
on attempts to quit smoking, relapse to smoking and the risks of chronic diseases.
1.4.1. Association of smoking related weight gain with quit attempts and relapse to smoking
Anecdotally, weight gain is a common reason reported in clinical practice for
relapse to smoking. Some individuals report they cannot tolerate the weight they
gain when they stop smoking and relapse to smoking in an attempt to return to

26
their previous weight. Others do not attempt to quit for fear that they will gain
unwanted weight. However, the evidence is less clear.
1.4.1.1. Is concern about anticipated weight gain positively associated with reduced attempts to quit?
The UK Office of National Statistics 2008/9 report showed only 3% of smokers
claim anticipated weight gain is the main reason not to quit (ONS, 2009). Given
that 21% of adults in the UK smoke (ONS, 2010), this is approximately 32,000
people. Whether these claims are in fact associated with lower quit rates, in those
who are weight concerned, needs to be explored independently in epidemiological
studies. In our searching of the literature, described at the beginning of this
chapter, we found one review (French & Jeffrey, 1995, Table 7) which addressed
the influence of weight concern on attempts to quit. The authors reported that
studies suggest greater smoking related weight concern was associated with
fewer attempts to quit. However, this evidence came from cross-sectional studies
showing higher prevalence of weight concern in current smokers than former
smokers. While this might suggest that weight concern is associated with fewer
quit attempts, other explanations are possible. Perhaps former smokers became
less concerned about weight after they quit smoking as a response to having put
weight on but were equally concerned beforehand. Without prospective evidence
showing a temporal relationship we cannot suggest causality.

27
1.4.1.2. Is concern about anticipated or concern about actual weight gain positively associated with relapse?
The UK Office of National Statistics 2008/9 report showed 5% of smokers claim
weight gain was the reason they relapsed in their last quit attempt; this is
approximately 53,000 people. In our searching of the literature we found two
reviews of studies addressing this (Klesges et al., 1989, French and Jeffery, 1995
(Table 7)). These both concluded that fear or concern about post cessation weight
gain was positively associated with relapse. As described above, the cross
sectional evidence for this was limited by comparing weight concern in current
versus former smokers. Where relapsed smokers were compared with former
smokers it was unclear whether weight concern preceded quitting or was a
consequence of post quit weight gain (Table 7).
Klesges et al. reported on two prospective studies examining prequit weight
concern, they found that in both of these higher weight concern prequit was
associated with higher relapse rates in those enrolled in smoking cessation
programmes. However, it is unclear whether these studies adjusted for the impact
of actual weight gain on weight concern. Without concurrent exploration of
changing attitudes to changing weight during smoking cessation we cannot make
conclusions regarding the effects of weight concern on relapse.
A more recent review (2010) of prospective studies, carried out as a masters
dissertation that I supervised, reported four out of nine studies showed a positive
association of weight concern with relapse and five found no association.

28
However, the heterogeneity between these studies means these findings are hard
to interpret. Four of the studies measured weight concern prequit, and two
identified weight concern post quit, as a reason for relapse.
1.4.1.3. Is actual weight gain associated with relapse back to smoking?
Klesges et al. reviewed three prospective studies measuring actual weight gain
and found a negative association between weight gain and relapse. This was
determined largely by the observation that greater weight gain was seen in those
achieving abstinence rather than in those that relapsed.
The masters dissertation reviewing more recent studies found two out of seven
reported a negative association. Four of the seven studies reported a positive
association, where greater weight gain was associated with a higher relapse rate
and one reported no association. Therefore, findings are inconclusive; some of
this may be accounted for by differences between the studies and sub group
analysis of these is needed. For example, in two of the seven studies these data
were derived from placebo controlled trials of bupropion, an effective cessation
aid. Bupropion may also temporarily delay weight gain. Therefore lower relapse
rates in those who gain less weight may be confounded by bupropion use.
So what can we conclude? Weight gain is not consistently associated with higher
relapse rates. Where it is, it may be due to weight concern at the amount gained

29
or it may be due to other factors. The opposite may also be true, weight gain may
be associated with lower relapse rates, this may reflect less concern about weight
in those who quit or it may simply be a consequence of abstinence.
Return to smoking is often a response to cravings for cigarettes, an impulsive
desire when faced with smoking cues. Whether a reasoned response dependent
on weight gain can result in the same impulsive action is questionable, although it
could undermine motivation to resist smoking urges. Weight gain may be an
excuse given for returning to smoking or it may be an underlying factor
contributing to relapse, but more research is needed before we can be certain.

30
Table 7. Appraisal of systematic reviews that examine associations between weight concern and weight gain with quit attempts and relapse
Study Klesges et al.,1989 French & Jeffrey, 1995 Masters Dissertation, 2010
Was the question addressed? Yes. Although the article did seek to answer several questions at once. We have taken the ones relevant to our discussion separately
Yes Yes
Is it likely that important relevant studies were missed?
Unclear. No method was described, although a large number of studies were identified
Possibly due to database search limited by search engines of the time
No, thorough search terms
Was inclusion criteria for studies appropriate?
Not defined Yes, cross sectional Yes, prospective only
Was validity of included studies addressed?
To a degree. Narrative discussion mostly as an explanation for those which did not provide consistent results. No evidence of each study being formally assessed or excluded on the basis of its validity
Yes Yes
Were the results homogeneous or was heterogeneity adequately addressed?
Discussed e.g. gender difference, but not adequately addressed e.g. no sub-analysis
Unclear Heterogeneity was discussed in the narrative but little attempt was made to unpick it e.g. results not presented according to homogenous categories.
What were the results/conclusions?
Investigations finding a positive relationship between weight gain and relapse have assessed beliefs, concerns, and fears regarding post cessation weight gain,
Investigations finding a negative relationship have assessed actual weight gain.
Actual weight gain may have little relationship to participants' perceptions of their weight status.
High degree of concern regarding post cessation weight gain and a small weight gain after cessation may confirm the fear and prompt relapse.
Conclusions predominantly based on cross-sectional studies
Weight concerns specific to smoking may have a negative influence on both cessation and relapse.
General weight concerns do not appear to have this influence
Seven prospective studies on actual weight gain. Four were found to be positively associated with relapse. Two negatively associated with relapse. One found no association. The positive association in one of the studies was valid in males but not in females. These associations were weakened by differing time points for assessment of the relationship, and by varying lengths of follow up for the studies.
Nine studies identified regarding weight concern. Four studies found it to be positively associated with relapse. No study was identified where weight gain concern was associated with less relapse. Five studies showed no significant association between post cessation weight gain concern and relapse to smoking.
Four studies presented the relationship between weight concern and relapse as the weight gain which participants identified prequit as the amount they would tolerate before relapsing. A range of 10 – 20 pounds was found to be the tolerable weight range, with women willing to tolerate less than men, and higher weight concerns correlating with less tolerable weight gain.
Two studies reported the proportion of subjects who mentioned weight gain after quitting as a reason why they would relapse to smoking. Women were more likely to relapse for this reason than men, and higher weight concerns predisposed to the naming of weight gain as a potential reason for relapse.

31
1.4.2. Impact on risks of chronic diseases
To examine recent evidence that smoking cessation may have an adverse risk on
chronic disease we searched Medline, Embase and PsycINFO from 1989 to
present day for review articles. We did a title search and used the following MeSH
terms „smoking cessation‟ AND „lung function OR diabetes OR metabolic OR
cardiovascular OR blood pressure OR waist OR body composition‟. We limited our
search to articles in English. We excluded reviews where authors made no
attempt to describe how they searched the literature and selected articles. Where
there was no review article available we searched for observational studies.
1.4.2.1. Changes in body composition
Abdominal obesity is independently associated with an atherogenic profile and
increased risk of type 2 diabetes (Berlin, 2008). Most studies looking at post
cessation weight gain have not measured change in waist circumference, waist to
hip ratio, or body fat distribution. Therefore, it is not yet clear whether the usual
pattern of post cessation fat deposition is gluteal or intra-abdominal. If intra-
abdominal it carries a greater health risk than gluteal fat. The Berlin review (2008)
indentified one prospective study that found waist circumference increased in
quitting compared to continuing smokers. This was a nine year prospective study
in 16,587 men (Koh-Banerjee et al., 2003). It reported a mean 2.0cm (SD 0.3)
increase in quitters and a reduction of 0.7cm (0.3) in continuing smokers. These
values were after adjustment for confounders at baseline and changes in diet and
physical activity levels during the study. When change in BMI was also adjusted

32
for, waist circumference was still shown to have increased in quitters and reduced
in smokers, but by a smaller amount, 0.8(0.3) and 0.4(0.2) respectively. However
this study relied on self reported recall of smoking abstinence, and the group of
abstainers contained those who had been quit for variable lengths of time.
We know of one study which has measured change in waist circumference in
validated quitters. Mean difference (SD) in waist circumference between quitters
and continuing smokers was 3.5cm (0.5) in men and 4.5cm (0.6) in women
(Pisinger et al., 2007).
One cross sectional study using computerised tomography scanning has shown
ex-smokers to have higher visceral fat area (124.0–132.0 cm2) than nonsmokers
(123.1 cm2) and current smokers (120.4 cm2)1.Categorising these ex-smokers by
length of reported abstinence showed that recent ex-smokers had higher visceral
fat area than ex-smokers of longer duration (Matsushita et al. 2011). Prospective
studies, using such precise measures of visceral fat, would help to confirm
whether smoking cessation leads to the accumulation of visceral fat and its
associated adverse health consequences.
Given there are few studies investigating post cessation fat distribution we
included measurement of waist to hip ratio and percentage body fat assessed by
1 Visceral fat areas from a single scan obtained at the level of the umbilicus are accepted as
highly correlated with the total visceral fat volume (Yoshizumi et al., 1991)

33
bioelectrical impedence analysis (BIA) in our feasibility trial, but due to limited
resources were unable to use more advanced BIA or imaging techniques to
differentiate between visceral and subcutaneous fat.
1.4.2.2. Impact on type two diabetes mellitus
A review article by Tonstad in 2009 cited two population studies investigating the
association between smoking status and the risk of type two diabetes. However,
the search terms used to identify and include or exclude studies for this review
were unclear. We considered the two cited articles together with another three
prospective studies identified from our own reference library to examine the
relative risk of developing type two diabetes associated with smoking cessation.
All five studies showed a higher relative risk of developing type two diabetes in
recent abstainers (quit for less that 5-8 years) than in continuing smokers
(reference category: never smokers) (Table 8). In comparing these relative risks,
the risk of type two diabetes increased by 6% to 73% in quitting compared to
continuing smokers. In one of these studies this was not seen in heavy smokers
(smoking 2 or more packs per day) (Will et al., 2001). Three of the five studies
investigated whether weight gain mediated this association. The evidence
suggested that some but not all the increased incidence of type two diabetes was
mediated by weight gain. (Wannamathee et al., 2001, Davey-Smith et al., 2005,
Yeh et al., 2010). The incidence of type two diabetes in long term ex-smokers was
investigated in three of the five studies. The incidence of diabetes in smokers who

34
had been abstinent for more than five , 10 and 12 years was similar to that of
never smokers in three separate proespective studies (Wannamethee et al., 2001,
Will et al., 2001 and Yeh et al., 2010).
Therefore prospective studies show consistently that risk of type two diabetes is
elevated in the first five years post cessation beyond that of continuing smokers,
and this may be explained in part by post cessation weight gain. These findings
can be further confirmed with long term prospective studies using biochemically
validated abstinence. To begin to collect some data on this we measured fasting
blood glucose at the start and end of our feasibility trial, where continuous
abstinence was measured by expired carbon monoxide of less than 10ppm.

35
Cohort study Wannamethee et al., 2001 Will et al., 2001 Davey-Smith et al., 2005 Hur et al., 2006 Yeh et al., 2010
Representative sample?
Men N=7,124
Yes N=709,827
Men N=11,827
Men N=27,635
Yes N=10,892
Common starting point?
Ex-smokers variable duration of abstinence at start
Ex-smokers variable duration of abstinence at start
Smoking cessation any point during follow-up
Smoking cessation any point during follow-up
Ex-smokers at baseline categorised by self report length of abstinence
Adequate follow up (mean)?
16.8years 13years 6-7years 8years 9years
Objective exposure?
Self reported recall of smoking status
Self reported recall of smoking status Self reported smoking status Self reported smoking status Self reported smoking status
Objective outcome?
Yes (diabetes incidence self report confirmed by medical records or death certificate)
Self report and death certificates Measured glucose, on anti-diabetic medication
Uncontrolled DM only (fasting blood glucose >7mmol/l)
fasting blood glucose, self report of diagnosis and on anti-diabetic medication
Adjustment for confounding?
Yes Yes Yes Yes Yes
Results & precision of results?
Ref: never smokers
Relative risk (95% CI)
Smokers 1.74(1.24, 2.43) Ex- smokers 1.33 (0.92, 1.90) <5 yr quit 1.89 (1.16, 3.06) 5-10 1.20 (0.67, 2.15) 11-19 1.42 (0.87, 2.31) >20 0.95 (0.54, 1.67)
Ref: never smokers
Incidence density ratio IDR (95%CI)
Men Women
Smoker < 1pack/d
1.05 (0.98, 1.12) 0.98(0.93, 1.03)
Smoker 1-2 pack/d
1.19(1.13, 1.26) 1.21(1.14, 1.29)
Smoker >2pack/d
1.45(1.34, 1.57) 1.74(1.49, 2.03)
Ex-smoker 1.07(1.02, 1.13) 1.07(0.99, 1.15) <5yr quit 1.20(1.09, 1.32) 1.19(1.04, 1.37) 5-10yr quit 1.12(1.03, 1.21) 0.99(0.86, 1.13) >10yr quit 0.99(0.92, 1.07) 1.02(0.91, 1.15)
Hazard ratio (95%CI)
smokers 1.27(1.10-1.46) Quit in intervention
1.21(0.99, 1.47)
Quit in usual care 1.35(1.06, 1.72)
Ref: never smokers
Risk Ratio (95%CI)
Smoker < 10cig/d
1.23(1.86*, 1.77)
Smoker 10-20cig/d
1.60(1.28, 2.00),
Smoker >20cig/d
1.75(1.35, 2.27)
Ex-smoker 0.95(0.72, 1.25) <6yr quit 1.44(0.96, 2.15) 6-8yr quit 2.13(1.51, 3.00)
* CI appear to be in error
Ref: never smokers
Hazard Ratio (95%CI)
Smoker 1.31(1.04, 1.65) Ex-smoker 1.22(0.99, 1.51) <3yr quit 1.73(1.19, 2.53) <6yrs quit 1.80(1.44, 2.25) <8yrs quit 1.54(1.10, 2.14) <12yrs quit 1.21(0.89, 1.65) >12yrs quit 1.16(0.99, 1.36)
Was risk attenuted by post cessation weight gain?
Partially Not investigated Partially Unclear Partially
Attrition adequately addressed?
99% follow-up achieved Unclear Did not compare characteristics between analysed and excluded individuals
Did not compare characteristics between analysed and excluded individuals
Did not compare characteristics between analysed and excluded individuals
Table 8.Review of prospective cohort studies assessing relative risk of type two diabetes in quitting smokers

36
1.4.2.3. Impact on lung function
Systematic review evidence of prospective studies consistently shows that compared
to continuing smokers, smoking cessation halts the accelerated decline in lung
function in those susceptible to COPD (Gratziou, 2009, Willemse et al., 2004). This
benefit can be seen within one year after cessation (Gratziou, 2009).
Both these reviews showed evidence that weight gain limited this benefit. One large
prospective study was cited and, from our own reference library, we knew of one
more that followed smokers and quitters for 5 years and investigated the association
between post cessation weight gain and change in lung function. Wise et al. (1998)
found that FEV1 decreased by a mean 2.2ml/year in men and 1.1ml/year in women
for every 1kg/year increase in post cessation weight. Chinn et al. (2005) found it
decreased by 11.5ml/kg/year in men and 3.7ml/kg/year in women. In these models
weight gain and decline in lung function was averaged over the five years with no
detail of the trajectory of lung function decline. We might expect lung function to
decline by a greater extent initially, given that weight gain is highest during the first
year post cessation (O‟Hara et al. 1998). Knowing this could help with monitoring and
thus more rigorous management of pulmonary disease. With a view to adding to this
knowledge we measured lung function at baseline and at follow-up in our feasibility
trial.

37
1.4.2.4. Impact on cardiovascular risk and hypertension
A review of studies has concluded that the reduction in cardiovascular risk in quitters
to that of never smokers takes between 2 and 20 years (Bolego et al., 2002).
Differences between the time it takes for this risk to reduce may be due to different
baseline characteristics between the studies and it may also depend on post
cessation weight gain.
A systematic review examined the association between smoking cessation and the
incidence of hypertension (Gratziou, 2009). Three of four prospective studies found
the incidence of hypertension was higher in quitters compared to continuing smokers
(relative risk was 80-350% higher and a greater risk was seen with longer duration of
abstinence). In all three studies there was evidence that the increased incidence of
hypertension was mediated by weight gain. One of these studies also showed
increased risk regardless of weight gain (Lee et al., 2001). Nonetheless, given that
weight gain is an independent risk factor for hypertension it seems reasonable to
suggest that greater reduction in cardiovascular risk, through a reduced risk of
hypertension, would be seen if post cessation weight gain could be prevented. To
add to this knowledge we measured changes in blood pressure in our feasibility trial.
1.5. How can we prevent this weight gain?
1.5.1. Pharmacotherapies
The most comprehensive evidence to date comes from a Cochrane review
investigating interventions to prevent weight gain during smoking cessation (Parsons

38
et al., 2009). This found that fluoxetine, bupropion, nicotine replacement therapy
(NRT), naltrexone and varenicline all had a small significant effect, and this meant
between 0.4-1.3kg less weight was gained at the end of treatment compared to
placebo. This is a prevention of between 14% and 46% of the mean weight gain
known to occur at this time (2.8kg at three months post quit, Aubin et al., 2011).
None of these pharmacotherapies had a long term effect on weight gain, by 12
months there was no significant difference in weight gain between those who had
received these treatments at quitting and those who had not.
There is some evidence from observational studies that NRT use for 12 months
prevents almost half the expected weight gain at 12 months (Hajek et al., 1988,
Sutherland et al., 1992). One study also showed that after 10 months of gum use, a
gradual reduction did not result in rebound weight gain (Hughes et al., 1991).
However, evidence of increased insulin resistance in long term users of NRT
(Eliasson, 1996) limits its use for this purpose.
The Cochrane review found no evidence of a dose response relationship with those
allocated to higher doses of NRT not significantly less likely to gain weight. However,
there is some observational evidence that people actually using more gum gain less
weight. Three prospective studies were identified in the Klesges review (Klesges et
al., 1989) and one more recently (Ferguson et al., 2011) showed this. However,
another study showed no difference in weight gain according to the amount of gum
used (Hajek et al., 1988). Therefore, although we cannot be certain, the evidence

39
does suggest that the amount of NRT actually used, rather than the amount people
are told to use, may be important for weight control.
1.5.2. Cognitive behavioural therapy (CBT) to accept weight gain
One early trial showed a paradoxical finding. CBT to encourage people to accept
weight gain was associated with 5.2kg less weight gain at one year compared to
standard care (Perkins et al., 2001). However, a replication study by the same
research team found no evidence that CBT to appease weight concern reduced
weight gain (Levine et al., 2009). Therefore, an effect is doubtful.
1.5.3. Exercise
Results from the Cochrane review showed that exercise does not appear to help
prevent weight gain during the actual period of smoking cessation, although by 12
months post quit there was less weight gain in those who had received exercise
interventions than those who had not (-2.07kg (-3.78, -0.36)) (Parsons et al., 2009).
The inconsistencies between these findings at these two time points create
uncertainty of the effects of these exercise intervention of preventing post cessation
weight gain.
1.5.4. Dietary interventions
Dietary intervention at the time of quitting holds the most promise for preventing post
cessation weight gain, although it is controversial. The main reason quit attempts fail
is due to quitters succumbing to their cravings to smoke. Evidence suggests that

40
hunger increases urges to smoke. Laboratory studies have shown that participants
on a low calorie diet (700kcal/day deficit) smoked 8% more cigarettes than those on
a normal-calorie diet (2000-2800kcal/day) (Cheskin et al., 2005). Smokers abstinent
for 18 hours when in a fasted state were more likely to smoke sooner than those who
had not fasted (Leeman et al., 2010). Observational studies have shown that people
who gain most weight are more likely to succeed in quitting smoking (Hall et al.,
1992) and use of glucose tablets during smoking cessation has been shown to
reduce cigarette cravings (McRobbie & Hajek, 2004). All these findings suggest that
avoiding hunger and feeding cigarette cravings with food may enhance smoking
abstinence. Therefore current smoking cessation advice is to avoid hunger and not to
diet during a quit attempt.
However the hypothesis that dieting while quitting increases hunger and thereby
increases urges to smoke in the early phases of a quit attempt has not been tested in
smokers who are attempting to quit. Results from a Cochrane review (Parsons et al.,
2009) suggested that not all types of dietary intervention were effective and some
may affect quit rates differently. The reviewers reported that general dietary
education to reduce energy intake through eating a low fat, healthy diet did not
prevent weight gain compared to standard smoking cessation behavioural support.
Furthermore, there was a statistically significant reduction in abstinence at 12 months
(Table 9). An individually tailored dietary plan to reduce energy intake; with regular
monitoring and adaptation of individual goals, reduced weight gain at 6 and 12
months; without a statistically significant reduction in abstinence rates (Table 9).
Intermittent use of a very low calorie diet (VLCD) provided the greatest effect on

41
preventing weight gain at end of treatment, but the effect was no longer statistically
significant at 12 months although the mean point estimate remained clinically
important. The use of the VLCD showed a statistically significant increased
abstinence rate to nearly double that of controls at end of treatment and long-term
follow up (Table 9).
These findings left a number of questions unanswered; firstly, although the effect of
the individually tailored dietary plan to prevent post cessation weight gain looked
promising, there was insufficient power to allow us to conclude it did not reduce
abstinence. A larger trial to do so was required.
Secondly, although the VLCD might have a neutral effect on post cessation weight
gain in the long term, it might have the benefit of improving abstinent rates. To
explore whether this is a causal finding, it helps to understand plausible mechanisms
by which this may occur.
Thirdly, all these previous trials were run in specialist units, where there was
considerable dietary expertise, the generalisability of these findings for NHS stop
smoking clinics is therefore questionable.
Therefore, we designed the Dietary Management in Smokers Trial (DeMiST) to see if
it was feasible train clinicians and provide these specialist dietary interventions in

42
primary care. If so, this could lead to an adequately powered trial which tests their
effects on abstinence, in real clinical settings.
Another main objective of DeMiST was to test the hypothesis that hunger increases
urges to smoke and ketosis reduces urges to smoke. As part of this we developed
and tested a tool to measure hunger and food craving. We also developed and tested
a tool to help non dietary experts assess and advise on diet, this tool also aimed to
measure dietary change as a process by which weight change may have occurred.
Chapter three of this thesis describes the methods of DeMiST. Chapter four
discusses the measures of feasibility. Chapter five discusses the process measures
developed and tested for DeMIST. Chapter six describes the effects of dietary
intervention on urges to smoke and short term measures of weight and other chronic
disease risk factors.

43
Intervention compared to standard smoking cessation Mean difference in weight change (Kg [95%CI]) Abstinence (RR [95%CI])
End of treatment At 12 months End of treatment At 12 months
General lifestyle and calorie reducing dietary advice -0.04 [-0.57, 0.50] -0.21 [-2.28, 1.86] 0.90 [0.76, 1.06]
0.66 [0.48, 0.90]
Individually tailored dietary and lifestyle advice -1.05 [-2.01, -0.09]
-2.58 [-5.11, -0.05] 1.11 [0.84, 1.46] 0.79 [0.47, 1.33]
VLCD compared to general calorie reducing dietary advice -3.70 [-4.82, -2.58] -1.30 [-3.49, 0.89] 1.40 [1.07, 1.85] 1.73 [1.10, 2.73]
Table 9. Effects of dietary interventions on weight change and abstinence during smoking cessation (Adapted from Parsons et al., 2009)

44
1.6. Overview of thesis
1.6.1. Aims of thesis
There are three aims of this thesis:
1. To report on the associations of potential predictors at the time of quitting with
post cessation related weight gain eight years later in a cohort with well defined
smoking status.
2. To report on the feasibility of trialling dietary interventions to prevent weight
gain within NHS stop smoking clinics.
3. To report on testing the hypothesis that hunger and ketosis affect urges to
smoke in free-living quitting smokers.
1.6.2. Objectives of thesis
These aims are met through achieving the objectives described below. Chapter
numbers are given in brackets beside each objective showing where in the thesis
these objectives were met.
1. To summarise and appraise literature to date on the potential predictors of post
cessation weight gain (Chapter 1).
2. To discuss the methodology and results of examining potential predictors of
post cessation related weight gain within the Oxford patch data (Chapter 2).
3. To discuss the design of a randomised controlled trial (DeMiST) to investigate
the feasibility of dietary interventions to prevent weight gain within NHS stop
smoking clinics and examine the effects of these dietary interventions on urges
to smoke (Chapter 3).

45
4. To report on the feasibility of running DeMiST, including discussion of
recruitment rates and experiences of the participants (Chapter 4).
5. To report on the development and validity of a dietary assessment tool for use
within DeMiST consultations (Chapter 5).
6. To report on the development of a questionnaire to measure both hunger and
food craving during quitting smoking (Chapter 5).
7. To report on the effects of the dietary interventions on urges to smoke and
whether this is a result of change in desire for food or ketosis (Chapter 6).
8. To report on the effects of dietary interventions on body weight and chronic
disease risk factors in quitting smokers (Chapter 6).
9. To discuss the implications of findings from this doctoral research to advance
understanding in this field and lead to improved clinical practice.

46
2. ASSOCIATIONS BETWEEN POTENTIAL PREDICTORS OF
WEIGHT CHANGE OVER EIGHT YEARS IN A COHORT OF
CONTINUING AND QUITTING SMOKERS
This chapter fulfils the aim of the thesis to report on weight change over eight
years according to clearly defined groups of quitting and continuing smokers. It
reports on associations of potential predictors of such weight change, namely
baseline BMI, baseline alcohol consumption, patch or placebo use at the time of
quitting, smoking rate, age, gender and socioeconomic status.
The investigation of baseline BMI was published in Addiction in January 2011
(Lycett et al., 2011, Appendix 1). An early version of the abstract was presented at
the 2009 Society for Social Medicine Annual Conference and published in the
Journal of Epidemiology and Community Health (Lycett et al., 2009, Appendix 2).
The abstract was also presented at the 2010 Annual Society of Nicotine and
Tobacco Research.
The investigation of baseline alcohol consumption was published in Nicotine and
Tobacco Research (Lycett et al., 2011b, Appendix 3).

47
The investigation of placebo or patch treatment during quitting was published as
an e-letter in the BMJ (Appendix 4). This was in response to Yudkin et al., 2003
who reported the odds of continuous abstinence at 8 years increase by 39% in
those who used nicotine patch over placebo.
2.1. Introduction
As discussed in section 1.2.3, there are few studies providing long-term follow up
of smokers and quitters to examine changes in body weight. Most are population-
based studies, where smoking status is typically characterised as point prevalence
abstinence and where the date of quitting is uncertain, usually lying between
follow up occasions (Klesges et al., 1989). Using point prevalence abstinence
underestimates weight gain (Kesges et al., 1997). The first aim of this study was
to examine weight gain over eight years in a group with well-characterised
smoking status.
2.1.1. Associations of weight gain over eight years with baseline body mass index (BMI)
Reviews of studies that have explored the characteristics associated with greater
weight gain have found conflicting findings regarding the association between
body mass index (BMI) at the time of quitting and weight gain (Klesges et al.,
1989, Froom et al., 1998). One study showed higher baseline BMI was positively
associated with subsequent weight gain. Three showed higher BMI was negatively
associated with weight gain, and four found no association. No study looked for a
curvilinear relationship of BMI and post cessation weight gain. The second aim
was therefore to examine more fully the relationship of baseline BMI to change in
weight in those who quit or continued to smoke.

48
2.1.2. Associations of weight gain over eight years with baseline alcohol consumption
Avoidance of alcohol is often advocated in smoking cessation support to reduce
cues to smoking. People trying to lose weight are often advised to moderate or
avoid alcohol because alcohol has a combustible energy value of 7kcal/g. (Fat
contains 9kcal/g and carbohydrate contains 4kcal/g). However, there is contrary
evidence on the effect of alcohol on weight gain in general, and very few
investigations have examined its association with post cessation weight gain.
Laboratory studies of the metabolic effects of alcohol show three important effects
on energy balance. First, alcohol increases energy intake (Tremblay et al., 1995,
Westerterp-Plantenga & Verwegen, 1999, Buemann, 2002), particularly when
consumed in combination with fat (Tremblay & St-Pierre, 1996) and the extra
energy from alcohol is not compensated for by reducing subsequent food intake
(Tremblay et al.,1995, Tremblay & St-Pierre, 1996, De Catro & Orozco, 1990,
Yeomans, 2004). Second, alcohol suppresses fat oxidation, which increases fat
storage (Suter et al., 1992). Third, alcohol increases 24 hour energy expenditure
through inducing thermogenesis by up to 30%. Dietary induced thermogenesis
from alcohol is greater than that from carbohydrate, fat, or protein (Suter et al.,
1994, Raben et al., 2003, Schutz, 2000, Westerterp, 2004). The first two effects
point towards alcohol promoting weight gain and the last effect works against it.
So what causes the balance to tip one way or the other?

49
The answer may depend on the pathway by which alcohol is metabolised. The
alcohol dehydrogenase (ADH) pathway produces adenosine triphosphate (ATP)
more efficiently than the microsomal ethanol oxidising system (MEOS). It is
thought that low levels of alcohol are metabolised by ADH, whereas a high blood
concentration of alcohol induces MEOS; and it is this that accounts for a higher
energy expenditure seen in people with alcohol dependence (Suter, 2005, Levine
et al., 2000). The threshold level of alcohol for MEOS induction is unknown, but
individual variation of body weight, smoking status, gender, and genetic variation
in enzymes metabolising alcohol may explain the different effects of alcohol on
body weight (Suter, 2005).
Cross sectional studies have shown inconsistent results, although this has been
explained in part by gender effects, smoking status and drinking patterns. Lower
alcohol intake has been associated with greater BMI in women, but less so, or with
the opposite effect, in men (Hellerstedt et al., 1990, Golditz et al., 1991, Breslow &
Smothers, 2005). This effect in men is not consistently seen among male smokers
(Mannisto et al., 1996, Cooke & Frost, 1982). More frequent drinking has been
associated with lower BMI independent of total alcohol consumption (Tolstrup et
al. 2005, Mannisto et al., 1996, Tolstrup et al., 2008).
Prospective studies have demonstrated increasing alcohol consumption over time
is not associated with an increase in waist circumference (Tolstrup et al., 2008),
but it is associated with weight gain (Gordon & Kannel, 1983), particularly in men

50
(Gordon et al., 1986, Wannamethee & Shaper, 2003). These studies have not
investigated effect modification by smoking status. Prospective studies in women
have found a U shaped curve (Wannamethee et al., 2004) and a significant
inverse relationship on weight gain which was not modified by smoking status
(Wang et al., 2010).
In the few short-term randomised trials, alcohol consumption did not influence
weight in obese people (Beulens, et al., 2006), but alcohol reduced weight in lean
people (Clevidence, et al., 1984).
Three prospective studies have considered the effects of alcohol on body weight
around the time of quitting smoking; these have all found an inverse effect of
alcohol consumption and weight gain (Froom et al., 1999; Kawachi et al., 1996;
Nides et al., 1994). However, these studies did not fully explore the association
according to smoking status. The weight gain trajectory in quitting and continuing
smokers is very different; the third aim of this study was to investigate the effect of
alcohol consumption on post cessation weight gain in both continuously abstinent
quitters and continuing smokers.

51
2.1.3. Associations of weight change over eight years with patch or placebo use during quitting.
The fourth aim of this study was to examine the association of weight change with
patch or placebo use at the time of quitting. A Cochrane review (Parsons et al.,
2009) showed nicotine replacement therapy (NRT), compared to placebo,
significantly reduced weight gain at the end of treatment by a mean difference
(95% confidence interval) of 0.46kg (-0.66, -0.27), and the point estimate for the
effect size was similar at the end of one year: 0.44kg (-1.02, 0.14). However, this
Cochrane review included no studies that reported weight gain more than one
year from commencement of a quit attempt. We have used our data to examine,
for the first time, the association of patch versus placebo use at the time of quitting
with very long term (over eight years) post cessation weight gain.
2.1.4. Associations of weight change over eight years with age, gender, smoking rate and socioeconomic status at baseline
The final aim of this study was to examine the associations of age, gender,
smoking rate and socioeconomic status (SES) with weight gain in quitters.
Evidence so far from prospective studies for this is inconsistent and we sought to
add to this with the results of our analysis.
2.1.4.1. Age
As discussed in section 1.2.3 the association between younger age and greater
post cessation weight gain has previously been shown in three out of seven
prospective studies, with four showing no association.

52
2.1.4.2. Gender
Three out of seven prospective studies have shown a greater weight gain in
women than men. Two studies have shown no association and two studies have
shown a greater weight gain in men than women (section 1.2.3).
2.1.4.3. Smoking rate
The most consistent finding in the literature so far has been that lower smoking
rate is associated with less weight gain after stopping smoking. Nine out of 14
prospective studies found a positive association and two studies found a U-
shaped curve (section 1.2.3).
2.1.4.4. Socioeconomic status
So far, two prospective studies have found greater weight gain in those with a
lower socioeconomic status (section 1.2.3).
2.2. Methods
2.2.1. Participants
1686 participants, aged between 25 and 65 years, smoking 15 or more cigarettes
a day enrolled in a clinical trial of a 21mg nicotine patch or placebo in 19 general
practices in Oxfordshire, UK, between June 1991 and March 1992. They were
invited to take part in a stop smoking study through a letter from their general
practitioner (GP). They made an appointment with a nurse, who told them what

53
the study involved. Then they saw their GP one week later, this was when they
were recruited, they were expected to quit completely from this day and given
nicotine patches (ICRFGPRG, 1993). The patch was used for three months then
stopped and participants were reviewed at four, eight and 12 weeks. Participants
were followed up six and 12 months later (ICRFGPRG, 1993). Abstinence was
confirmed by expired CO<10ppm when participants were using the nicotine patch
and by salivary cotinine <20ng/ml after they had stopped using the patch. Cotinine
is considered a more reliable measure of abstinence but, as it is a metabolite of
nicotine, it cannot confirm abstinence during nicotine replacement therapy. An
unplanned follow up took place eight years later, 1625 participants were living, we
were able to trace and contact 1532 participants, 840 of these responded.
Previous examination of this data showed baseline body mass index (BMI) was
similar between responders and non-responders. However, responders were older
(43.0 vs. 41.5 years p=0.010), more likely to be female (59% v 52% p<0.005) and
have stopped smoking during the trial than non-responders (13% v 6% p<0.0001
quit for 1 year) (Yudkin et al., 2003). Ethical approval for this was granted by
Anglia and Oxford Multicentre Research Ethics Committee, and 86 local research
ethics committees (Yudkin et al., 2003).
2.2.2. Measures of height and weight
Height and weight were measured at trial entry, although this was self-reported in
19% of participants. At eight year follow up, weight was self-reported on a
questionnaire completed by post.

54
2.2.3. Characterisation of smoking status
Participants completed questionnaires on smoking history and quit attempts that
spanned the last eight years and smoking status was biochemically confirmed at
each follow-up visit.
2.2.3.1. Quitters
Those who stopped smoking on or around quit day and declared continuous total
abstinence from three months to one year and were still abstinent eight years later
were defined as quitters. Abstinence was confirmed by salivary cotinine
concentration at three and six months, one and eight years.
2.2.3.2. Smokers
Those who were smoking at three months, six months, one year and eight years
were defined as smokers. People not attending follow up in the first year were also
classed as smokers.
2.2.3.3. Relapsers
Relapsers were those who were biochemically confirmed abstinent at three
months, six months and one year but relapsed by eight years.
2.2.3.4. Late quitters
Late quitters were those who smoked during the first year but were confirmed
abstinent at eight years.

55
2.2.4. Measure of alcohol intake
Baseline data on weekly units of alcohol was collected by a trained nurse
interviewer. Alcohol consumption was assessed by asking participants to report
daily consumption of beer, lager or cider (pints), wine (glasses), sherry, vermouth
or port (glasses), and spirits or liqueurs (single tots). Total weekly consumption
was then converted to UK units (equivalent to 8g ethanol) per week.
2.2.5. Baseline characteristics
Baseline questionnaires included questions on age, gender, ethnicity,
socioeconomic status, number of cigarettes smoked per day and the Horne
Russell score as a measure of smoking addiction.
2.3. Statistical Methods
2.3.1. Weight change according to smoking status
All statistical tests were carried out using Statistical Package for Social Sciences
version 15 for windows software (SPSS 15.0). The characteristics of each of the
four groups defined by smoking status were summarised with means and SDs or
proportions. Chi squared tests and one-way ANOVA with Games-Howell post hoc
testing were used to identify differences between the groups. Differences were
taken into account in multivariate regression analysis (see below). Means, SDs
and 95% confidence intervals (95% CI), were calculated for weight change within

56
each smoking status. We compared self reported weight and BMI data with
measured weight and BMI data.
We calculated the percentage of quitters that gained more weight than the
average continuing smoker. We compared the proportion of smokers that were in
each of the groups defined by the World Health Organisation (WHO) categories of
BMI (underweight <18.5kg/m2, ideal 18.5 to 24.9, overweight 25 to 29.9, and
obese 30kg/m2and above (WHO, 2000) at baseline and at eight years using
Mann-Whitney-U tests.
Linear regression analysis was used to investigate the differences in weight
change (from baseline to eight year follow-up) according to the four groups
defined by smoking status. This was adjusted for potential confounders using
multiple linear regression. Potential confounders were identified from the reviews
on predictors of post cessation weight gain weight gain. These have been
discussed in section 1.2.3. Categorical variables (treatment allocation, gender,
ethnic group (white European/non-white European), and socio-economic status
measured by the Registrar General‟s classification of occupational status (Drudy,
1991) were recoded into dummy variables. Continuous variables (BMI, height,
age, number cigarettes/day, smoking dependence measured by the Horn Russell
(HR) score (Russell et al., 1974) and weekly units of alcohol consumed at baseline
(1 unit defined as 8g of ethanol) were centred around the mean. These were
entered stepwise (to avoid overfitting the model) and considered potentially

57
important if the association between them and the outcome had a p value of <0.2
(Rothman & Greenland, 1998).
2.3.2. Association with baseline BMI
To investigate whether the effect of BMI depended upon smoking status linear
regression was carried out in the combined sample of smokers and quitters. This
analysis was conducted on smokers and quitters only for simplicity (excluding late
quitters and relapsers). Terms indicating smoking status, baseline BMI in kg/m2
and a multiplicative interaction term between the two were included. Potential
confounders were added as above.
There was evidence that the association of BMI with weight change was
dependent on smoking status and so separate models for quitters and smokers
examined these relationships further. In both models, we looked for curvilinear
relations between BMI and weight change by sequentially adding linear, quadratic,
and cubic terms for BMI. Ninety five percent prediction intervals were calculated
from the best fitting models to estimate the likely weight gain of most quitters or
smokers. In sensitivity analysis, the analysis was repeated including relapsed
smokers within the smokers group and late quitters within the quitters group.
Outliers defined by extreme baseline BMI and extreme weight change were
removed and the models re-run to examine whether the coefficients changed.

58
2.3.3. Association with baseline alcohol intake
To investigate the effect of baseline alcohol intake on weight change linear
regression analysis was used first with the combined cohort of smokers and
quitters. We used higher order terms to investigate curvilinear relationships. We
investigated effect modification by gender, baseline BMI and smoking status using
these terms and the appropriate multiplicative interaction terms. As smoking
status modified the effect of alcohol on weight change, separate regression
equations were used for smokers and quitters. In both sets of equations
confounding was controlled as described above. We used Cook‟s distance as a
measure of influential cases; if Cook‟s distance exceeded one we considered that
outliers had the potential to influence our findings.
2.3.4. Associations of weight change over eight years with patch or placebo use during quitting; age, gender, smoking rate and socioeconomic status at baseline
We calculated mean difference in weight change (kg) and 95% confidence
intervals (CI) between quitters who had received nicotine patch and those who
had received placebo.
We carried out a regression analysis of weight change over eight years in quitters.
We forced age, gender, heaviness of smoking (measured here in cigarettes per
day and as a measure of addiction using the Horne Russell score) and
socioeconomic status, along with treatment group, alcohol consumption and

59
baseline BMI into a multivariable model. We did not use a stepwise analysis here
as we were interested in the size of the coefficients of all these variables,
regardless of their statistical significance. We did not include ethnicity as there
was no ethnic variation within our quitters. We included a quadratic term for
cigarettes per day and Horn Russell score, given that some studies have
previously demonstrated a U-shaped association with smoking rate and weight
gain (see section 1.2.3).
2.4. Results
2.4.1. Baseline characteristics
Baseline characteristics of the smoking status groups differed modestly and
significantly in age, treatment allocation, and Horn Russell Score (p<0.05) (Table
10). Baseline weight data did not differ much or significantly between those whose
weight was measured and those who self-reported. A t-test showed a mean
difference of -0.58kg (-2.91, 1.75).

60
Variable smokers quitters relapsed Late quitter
N* 613 85 26 116
SES (%)
I (professional) 3 1 0 4
II (managerial/technical) 31 33 54 34
III (skilled, non-manual) 22 17 19 27
III (skilled, manual) 21 27 15 15
IV (partially skilled) 17 16 8 16
V (unskilled) 6 5 4 5
Horn Russell score #$
(mean(SD))
15 (5) 14 (4) 16 (3) 14 (4)
Cigs per day 24 (7) 23 (7) 27 (12) 23 (7)
Weekly units alcohol 10.1 (13.0) 9.2 (9.6) 13.6 (19.9) 11.8 (11.6)
Height (cm) 168 (9) 169 (9) 171 (9) 168 (9)
Age#&
(mean(SD)) 42 (10) 46 (11) 43 (11) 43 (11)
BMI (mean(SD)) 25 (4) 24 (4) 25 (4) 26 (5)
Ethnicity (%):
White 98.2 100 100 100
Asian 1.0 0 0 0
South East Asian Afro-caribbean Other
0 0 0.7
0 0 0
0 0 0
0 0 0
Not stated 0.2 0 0 0
Active patch treatment (%)#
49 58 65 41
Women (%) 59 59 50 60 *data was not available in all categories for every person.
#ANOVA/Chi p<0.05
$Post hoc analysis: smokers v
quitters p=0.089, relapsed v quitters p=0.067, smokers v late quitters p=0.093. &Post hoc analysis: smokers v
quitters p=0.057
Table 10. Baseline characteristics by smoking status

61
2.4.2. Weight change over eight years
Weight change in those who self reported at both points in time did not differ
significantly from those who were measured at baseline and self reported at 8
years. The mean difference (95% confidence interval) was -0.40kg (-1.67, 0.87).
There was no significant difference between measured or self-reported baseline
BMI. The mean difference was 0.47kg/m2 (-0.15, 1.09). Eighty three percent of
quitters gained more weight than the average smoker (Figure 1). Over the eight
years, 15% of quitters became obese compared to 2% of smokers, while 18% of
quitters became overweight compared to 5% of smokers (Figure 2).
2.4.3. Mean weight and BMI change according to smoking status
Quitters gained 8.79kg (SD 6.36) and BMI increased by 3.26kg/m2 (SD 2.94). This
was 6.55kg more than smokers; who gained on average 2.24kg (SD 6.65) in
weight and a 0.94kg/m2 (SD 2.92) in BMI. Late quitters, who were not continuously
abstinent during the first year but quit before eight years had a mean weight gain
of 8.33kg (SD 8.84), and this was not significantly different to those who had been
quit from the end of treatment. Those who had quit smoking for the whole of the
first year and subsequently relapsed gained a mean of 3.28kg (SD 7.16); this was
not significantly different to smokers. Adjustment for potential confounders did not
change these estimates (Table 11).

62
Figure 1 Percentage Frequency of Weight Change over 8 years according to Smoking Status
Figure 1. Percentage frequency of weight change according to smoking status
Qu
itters
La
te
Qu
itters

63
Figure 2. Percentage of smokers and quitters in BMI categories at baseline and at eight years
2.4.4. Weight Change and Baseline BMI
There was evidence that the association between BMI and weight change was
modified by smoking status, with a p value for the interaction term being 0.002
both with and without adjustment for potential confounders. Accordingly, separate
regression models in quitters and continuous smokers were examined.
quitters quitters

64
Smoking Status Unadjusted regression coefficient
95%CI Lower
Upper
P value R2 Adjusted*
regression coefficient
95%CI Lower
Upper
P value R2
Constant# 2.245 1.692 2.797 0.133 0.182
Quitters 6.576 4.992 8.161 <0.001 6.810 5.232 8.389 <0.001 Relapsed 1.047 -1.694 3.788 0.454 1.064 -1.655 3.783 0.442 Late quitters 6.108 4.722 7.494 <0.001 6.324 4.943 7.705 <0.001
*Adjusted for confounding variables of baseline height, BMI, Horn-Russell Score, daily number of cigarettes, weekly units of alcohol, age in years, socioeconomic status and ethnic origin, gender and treatment group.
#In the unadjusted model, the constant can be interpreted as the weight gain in
smokers (the reference group), but has no useful meaning in the adjusted model.
Table 11. Regression analysis for weight change over eight years according to four groups of smoking status, smokers were used as the reference category

65
2.4.5. Association between BMI and weight change in quitters
Regression modelling showed a significant linear association between BMI and
weight gain in quitters. Adding a quadratic term improved the fit (p for R2 change
= 0.015), but the cubic term did not improve this further. The quadratic model
accounted for 11% of the variability in weight change (Table 12) and the
coefficients changed only slightly on adjustment for potential confounders (Table
12). This model estimated mean weight change over eight years in quitters of
+9.8kg, +7.8kg, +10.2kg, +19.4kg where BMI was 18, 23, 29 and 36 respectively
(Table 13, Figure 3).
2.4.6. Association between BMI and weight change in smokers
There was a significant, negative, linear association between BMI and weight
change in smokers (p<0.001) and the fit was not improved by adding higher order
terms (Table 14). The negative association remained largely unchanged when
adjusted for confounders (p=0.002), (Table 14). This model estimated mean
weight change smokers of +3.9kg, +2.6kg, 1.0kg and -0.8kg where BMI was 18,
23, 29 and 36 respectively (Table 13, Figure 3).
2.4.7. Sensitivity Analysis
Late quitters were added to the quitters who had been abstinent for the entire
eight years while relapsers were added to the smokers who had smoked for the
entire eight years. The regression models on these combined groups gave similar
66
models and estimates to those derived from the smokers and quitters only (Table
13).
Excluding participants with higher baseline BMIs, extreme weight gain, and
excluding outliers judged by visual inspection of a plot did not really change the
findings (Table 13).
2.4.8. Estimating weight change in individuals
Although the estimates for mean weight change differed according to BMI, there
was overlap in the estimates for individuals. Calculating 95% prediction intervals in
quitters using the quadratic model gave values of -3 and 22kg for a BMI of 18, -4
and 20kg for a BMI of 23 and -2 and 22kg for a BMI of 29 and 5 and 33kg for a
BMI of 36.
Calculating 95% prediction intervals in smokers using the linear model gave
values of -9kg and 17kg for a BMI of 18, -10kg and 16kg for a BMI of 23, -12kg
and 14kg for a BMI of 29 and -14kg and 12kg for a BMI of 33.

67
Figure 3. Predicted mean and confidence intervals for weight change according to BMI in smokers and abstainers.
-5
0
5
10
15
20
25
30
35
18 23 28 33 38
mean weight change (smokers)
lower 95% CI (smokers)
upper 95% CI (smokers)
mean weight change (abstainers)
lower 95% CI (abstainers)
upper 95% CI (abstainers)
We
ight ch
ange
(kg)
BMI
Figure 3. Predicted mean and confidence intervals for weight change according to BMI in smokers and quitters
BMI terms
Unadjusted regression coefficient
95%CI Lower
Upper
P value
R2 Adjusted* regression coefficient
95%CI Lower
Upper
P value R2
Constant BMI-linear#
8.972
0.382
7.619
0.008
10.339
0.757
0.045
0.047
Constant
BMI-linear#
BMI-quadratic#
7.947
0.177
0.071
6.360
-0.225
0.014
9.514
0.578
0.128
0.015
0.114
0.217
0.062
-0.175
0.006
0.609
0.118
0.030
0.172
*Adjusted for confounding variables of baseline height, BMI, Horn Russell Score, daily number of cigarettes, weekly units of alcohol, age in years, socioeconomic status and ethnic origin. # Re-centred around the whole sample mean.
Table 12. Regression model for the effect of BMI on weight gain in quitters

68
Baseline BMI Mean weight (95% CI) gain estimated from regression models containing:
Smokers Smokers Combined with relapsers
Quitters Quitters excluding BMI>30kg/m
2
Quitters excluding BMI >30kg/m
2
and weight gain >20kg
Quitters combined with late quitters
Quitters combined with late quitters excluding (BMI>40kg/m
2)
18 3.9 (2.9, 4.9) 4.0 (3.0, 5.1) 9.8 (6.1,13.5) 10.9 (6.4, 15.7) 10.3 (6.3, 14.4) 10.6 (7.9, 13.5) 11.9 (8.6, 14.7)
23
29
2.6 (2.0, 3.1)
1.0 (0.2, 1.8)
2.7 (2.2, 3.3)
1.1 (0.3, 1.8)
7.8 (6.4,9.3)
10.2 (7.9,12.5)
7.4 (5.6, 9.1)
12.2 (5.7, 14.7)
7.2 (5.7, 8.9)
10.2 (7.5, 16.8)
8.6 (7.5, 9.7)
7.6 (6.2, 9.1)
8.4 (7.3, 9.6)
7.6 (6.3, 8.8) 29 1.0 (0.2, 1.8) 1.1 (0.3, 1.8) 10.2 (7.9, 12.5) 12.2 (5.7, 14.7) 10.2 (7.5, 16.8) 7.6 (6.2, 9.1) 7.6 (6.3, 8.8)
36 -0.8 (-2.4, 0.8) -0.8 (-2.4, 0,7) 19.4 (12.7,26.0) 8.3 (7.2, 9.3) 11.2 (8.5, 13.9)
40 -2.6 (-5.1, -0.3) -2.8 (-5.2, -0.3) 9.6 (7.8, 11.2)
*outliers are BMI>30kg/m2, weight gain >20kg and BMI>40kg/m
2
Table 13. Estimated mean weight gain according to BMI for „smokers‟, „quitters‟ and „quitters without potential outliers*‟, „smokers combined with relapsers‟, and „quitters combined with late quitters‟
Smoking Status
Unadjusted regression coefficient
95%CI Lower
Upper
P value R
2 Adjusted* regression coefficient
95%CI Lower
Upper
P value R
2
Constant 2.206 1.673 2.738 0.155 0.243
BMI# -0.265 -0.401 -0.128 <0.001 -0.222 -0.358 -0.087 0.002
Age in years# -0.131 -0.186 -0.076 <0.001
*Adjusted for confounding variables of baseline height, BMI, Horn Russell Score, daily number of cigarettes, weekly units of alcohol, age in years, socioeconomic status and ethnic origin.
# Re-centred around the whole sample mean
Table 14. Regression model for the effect of BMI on weight gain in smokers

69
2.4.9. Baseline alcohol consumption as an effect modifier of weight change according to smoking status
In the model including smokers and quitters, baseline alcohol consumption was
not associated with weight change. However, there was a significant interaction
between smoking status and alcohol consumption before (p=0.019) and after
(p=0.010) adjustment for confounding variables.
2.4.10. Association between alcohol consumption and weight change in smokers
Separate linear regression modelling in smokers found no association between
alcohol consumption and weight gain (regression coefficient: 0.005, 95% CI-0.037,
0.046; p=0.827). There was no evidence that this effect differed by gender, (p for
interaction term 0.728) or baseline BMI (p for interaction term 0.911). Cook‟s
distance did not exceed one (min <0.001, max 0.03).
2.4.11. Association between alcohol consumption and weight change in quitters
There was a significant, negative linear relationship between weight change and
alcohol consumption in quitters (p = .015, r2 = .070). For every additional unit of
alcohol consumed per week at time of quitting, mean weight change over eight
years was −0.174 kg (95% CI: −0.315 to −0.034) p=0.015 (unadjusted) (Figure 4)
(adjusted: −0.180 kg (95% CI: −0.318 to −0.043) p = 0.011). Fit did not improve
with higher order terms and effect did not differ by gender (p for interaction was
0.91). Cook‟s distance did not exceed one (min <0.001, max 0.087).

70
2.4.12. Variability of weight change in quitters according to baseline alcohol consumption and BMI
We have previously demonstrated that 11% of the variability in weight gain in
quitters (Table 12) was accounted for by a J-shaped curve with baseline BMI
(Figure 3). There was no evidence that the association between alcohol and
weight gain was modified by baseline BMI; p for interaction was 0.290. The effects
of BMI and alcohol consumption were therefore independent, together they
account for 17% of the variability of weight gain in quitters (Table 15). The
regression lines for mean population weight gain according to BMI at different
levels of alcohol consumption are plotted (Figure 5).
Figure 4. Weight change over 8 years in quitters (n=84) according to baseline alcohol consumption in quitters
We
ight
ch
an
ge
(kg
)

71
Figure 5. Weight change according to BMI and baseline alcohol consumption in quitters
Variable Regression
coefficient* Lower 95%CI
Upper 95%CI p value r2
Constant
BMI#
BMI2 #
Alcohol units/week#
7.886
0.217
0.062
-0.161
6.360
-0.175
0.006
-0.296
9.412
0.609
0.118
-0.026
<0.001
0.274
0.030
0.020
0.172
*Stepwise adjustment, using p=0.2 cut-off for confounding variables of baseline height, BMI, Horne Russell Score, daily number of cigarettes, weekly units of alcohol at baseline, age in years, socio-economic status and ethnic origin. # Re-centred around the total sample mean.
Table 15. Regression Analysis of weight change according to baseline BMI and alcohol consumption in quitters
BMI (kg/m2)

72
2.4.13. Weight change over eight years with patch or placebo use during quitting
On active patch treatment, there were 49 people who remained abstinent for eight
years and they gained a mean (standard deviation) of 8.84kg (5.82) while the 36
smokers using placebo patches, who remained abstinent for eight years gained
8.73 (7.11)kg. The mean difference (95% confidence interval) was 0.11kg (-2.68,
2.90).
2.4.14. Associations of weight change over eight years with age, gender, smoking rate and socioeconomic status at baseline
Age, gender, cigarettes per day, Horne Russell score, socioeconomic status and
treatment group were not significantly associated with weight change over eight
years in our group of continuous quitters (Table 16), although the point estimates
required further discussion to examine their clinical importance. The coefficients
provide a mean point estimate of these associations (Table 16).
2.4.14.1. Age
For age, the coefficient represented a 20g increase over eight years for every
additional year of age at baseline. This means a 25 year age difference in
baseline age would be required before an associated 0.5kg difference in weight at
eight years was seen.
2.4.14.2. Gender

73
The coefficient for gender showed women gained approximately 1.8kg more than
men at the end of eight years of abstinence. In unadjusted analysis this was a
difference of 1.69kg (-1.09, 4.48).
2.4.14.3. Smoking rate
For every additional cigarette smoked daily at baseline, there was an associated
mean weight increase of 50g eight years later. So 20 cigarettes (1 pack) extra a
day would need to be smoked to see an associated increase of 1kg eight years
later. An increase in the level of addiction to smoking, as measured by an
increase of 1 in the Horne Russell score, increased weight by 0.2kg after 8 years
of abstinence. The mean (SD) HR score in our sample was 14(4) and scores
ranged between 4 and 23. Therefore, those who were more addicted, for example
scoring 7 points higher on the HR score, had an associated weight gain of 1.4kg
more after 8 years of abstinence than those who were less addicted.
2.4.14.4. Socioeconomic status
The coefficients for socioeconomic status (SES) categories were large, but the
95% confidence intervals were very wide and outside of the range of weight
change within our sample. To get an idea of the overall effect of SES rather than
individual effects of smaller categories we examined whether the model without
adjustment for SES was improved significantly by adding in all the SES
categories. The improvement in fit was not significant (p=0.18).

74
Unstandardized Coefficients 95% Confidence Interval for B
Sig. B Lower Bound Upper Bound
(Constant) 12.13 2.39 21.88 0.015
SES II (managerial/technical)* -3.88 -13.77 6.01 0.437
SES III (skilled, non-manual)* -3.72 -13.97 6.52 0.471
SES III (skilled, manual)* -3.36 -13.17 6.45 0.496
SES IV (partially skilled)* -3.79 -13.90 6.33 0.457
SES V (unskilled)* -4.26 -15.77 7.26 0.463
Age# -0.02 -0.16 0.12 0.788
Cigarettes smoked per day# 0.05 -0.25 0.35 0.728
(Cigarettes smoker per day#)
2 0.00 -0.02 0.01 0.945
Horn Russell score# 0.21 -0.23 0.66 0.340
(Horn Russell score#)
2 0.01 -0.07 0.08 0.884
Weekly baseline alcohol consumption# -0.17 -0.35 0.00 0.051
Treatment group* -1.33 -4.42 1.75 0.391
Gender* 1.83 -2.56 6.22 0.409
BMI# 0.49 0.07 0.91 0.023
*reference category for SES was I (professional), for treatment group was placebo, for gender was male #values were re-
centered around the mean
Table 16. Coefficients with 95% confidence intervals for potential explanatory variables of weight gain in continuous quitters over eight years

75
2.5. Discussion
2.5.1. Findings
2.5.1.1. Weight change according to smoking status
In a cohort of people trying to stop smoking, those who failed and continued
smoking for eight years gained about 2kg. Those who abstained from smoking for
eight years gained nearly 9kg. People who stopped smoking for a whole year but
then resumed smoking had a weight gain that was similar to and not significantly
different from smokers. Some quitters gained much more weight than average
with only a quarter of long-term quitters being a healthy weight after eight years.
2.5.1.2. Association with baseline BMI
Quitters who were underweight or overweight on cessation were more likely to
gain more weight than those in the healthy BMI range. These findings were robust
to sensitivity analyses.
2.5.1.3. Association with baseline alcohol intake
For every unit of alcohol quitters consumed at baseline they weighed 0.17kg less
eight years later than those who did not drink. This equates to people drinking
alcohol at the maximum UK recommended weekly intake for women (14 units or
112g ethanol/week) weighing a mean 2.4kg less than those who did not drink.
This association was not significantly different in females and males. The effect
was independent of baseline BMI.

76
2.5.1.4. Associations of weight change over eight years with patch or placebo use during quitting; age, gender, smoking rate and socioeconomic status at baseline
We found no evidence of a statistically significant association between weight gain
over eight years of abstinence and placebo or patch treatment at baseline, age at
quitting, baseline smoking rate, gender or socioeconomic status.
2.5.2. Strengths and limitations of this study
2.5.2.1. Characterisation of smokers and quitters
In a cohort of smokers followed for eight years, many smokers will try to quit and
many quitters relapse. All quitters were biochemically verified as abstinent four
times over the eight year follow up. Likewise although some smokers tried to quit,
they were smoking at each follow up point. The strength of this study therefore
lies in its accurate characterisation of both these groups, which leads to more
precise estimates of weight change. There is evidence that post cessation weight
gain is under-estimated when smoking status is measured by point prevalence or
by self-report because self-reported point prevalence will classify intermittent
smokers and recent quitters as abstinent (Klesges et al., 1989, Klesges et al.,
1997).

77
2.5.2.2. BMI investigation robust to sensitivity analysis
The cohorts of late quitters and relapsers are less well characterised as the time of
individuals quitting and relapsing is variable, these events could occur at any time
after year one and before year eight. However, these groups showed similar
estimates of weight change and weight change in relation to baseline BMI,
indicating that for most their relapsed or quit state was sufficiently well established
for weight change to reflect that of long term quitters and smokers. In support of
this, other studies have shown that the greatest weight change associated with
smoking status occurs rapidly (O‟Hara et al., 1998).
2.5.2.3. Reporting bias
This study is limited by use of self-reported weight and BMI data at eight year
follow-up. However, sensitivity analysis showed no differences in mean baseline
weight, BMI or weight change when measured and self-reported data was
compared. The validity of self-reported weight data has also been demonstrated in
other epidemiological studies (Spencer et al., 2002), suggesting that reporting bias
is not a likely explanation of our results.
To explain the J-shaped association of baseline BMI with post cessation weight
change in quitters by reporting bias the pattern of misreporting weight would have
to vary in a particular way. Either it would have to vary by baseline BMI such that
people with a low or a high BMI eight years previously would over estimate their

78
current weight or people with an ideal BMI eight years ago would underestimate
their current weight. This seems unlikely.
Similarly, alcohol consumption may have been underreported. However,
underreporting of both measures could not account for the association we
observed. For underreporting to explain the association, those who underreported
weight would have had to over-report alcohol consumption and/or vice versa and
this seems counterintuitive.
Alcohol was measured by careful questioning at baseline only. There is evidence
that a single measure of alcohol consumption is a reasonable estimate of average
alcohol consumption over several years. The Nurses‟ Health Study shows a high
correlation between alcohol intake at a single point in time and alcohol intake over
the following 6 years (r=0.75) (Giovannucci et al., 1991). Also there is evidence
from a large cohort that alcohol consumption does not change as a consequence
of quitting smoking (Murray et al., 1996).
2.5.2.4. Response bias
Only 52% of the living participants enrolled in the original trial responded at eight
year follow up, with success at quitting in the trial being the factor most strongly
associated with response. However, non response is an unlikely explanation of
our findings and it is reassuring that baseline weight and BMI did not differ

79
between responders and non responders. The study participants enrolled in a
smoking cessation study and responded to a questionnaire on smoking status at
follow up, with only a single question on weight. It is unlikely therefore that
whether individuals gained weight or their pattern of weight change in relation to
BMI was associated with failure to respond. For non-response to explain the
association between BMI and weight change, weight change in non responders
would have to have been the reverse of what we observed in responders. That is
among non-responding quitters weight gain would have resulted in an inverted-J
shaped relation with baseline BMI, with those of a healthy BMI gaining the most
weight. There is no plausible reason for such an association.
Similarly, if non response were to account for the association of weight change
with baseline alcohol intake non-responders would have gained more weight the
more alcohol they consumed at baseline. While this remains a possibility, as this
was primarily a smoking cessation study, there is no reason to believe that a
participant‟s perception of weight gain or alcohol consumption influenced their
decision to complete the questionnaire.
2.5.2.5. The role of confounding
It is possible that confounding explains the association of weight change with
baseline alcohol intake. As this was a smoking cessation trial analyses on weight
change were not planned; consequently behaviours such as diet and physical
activity were not assessed. It is possible that those who drank more alcohol at
baseline also had better dietary behaviour and did more physical activity than

80
those who drank less. There is cross sectional evidence which shows a positive
correlation between moderate alcohol intake and habitual physical activity (r=0.41
p<0.01) (Westerterp et al., 2004), but prospective studies have reported higher
alcohol consumption is associated with lower weight gain after adjustment for
physical activity and diet (Wannamethee & Shaper, 2003, Wannamethee et al.,
2004, Wang et al., 2010). To explore this in an ex-smoking population we carried
out regression analysis on data from the Health Survey for England (HSE).
The HSE generates a cross sectional dataset from annual surveys on the health
and lifestyle of a large number of people in England. For maximum compatibility
with our own data set of quitters we carried out our analysis on a subset of white
ex-smokers. The distribution of socioeconomic class was similar between both
sets of data. We used the 1998 HSE dataset as this was the nearest year to our
cohort which contained comprehensive data on alcohol intake, physical activity
and dietary patterns in over 4000 ex-smokers. We excluded those classified as
problem drinkers.
We found in unadjusted analysis that an extra unit of alcohol drunk per week is
associated with an average increase in 2.6 minutes of activity each week,
including an extra 0.03 days a month doing 20 minutes or more, moderate to
vigorous physical activity. So someone consuming 14 units of alcohol a week
compared to no alcohol may be doing an extra 36 minutes of activity each week,
including an extra 0.4 days a month doing 20mins of moderate or physical activity.
If we consider a 68kg person walking briskly for one hour would burn

81
approximately 320kcal, an extra 36 minutes of similar intensity exercise each
week would burn an extra 192 kcal or theoretically an extra 27kcal each day. A
daily deficit of 550kcal is required for a 0.5kg weight loss over one week. So an
extra 27kcal expended daily could account for a theoretical weight change of
0.02kg each week. Based on this reasoning over 8 years one might expect an
8.3kg difference in weight to be seen, but this is not born out in epidemiological
studies. Current available evidence suggests that even the recommendation of 30
minutes physical activity a day for cardiovascular fitness, is insufficient to prevent
weight gain and 45 to 60 minutes moderate intensity activity each day is
considered necessary (Saris et al., 2003, Wareham et al., 2005). Given this, the
extra 36 minutes of activity a week associated with moderate alcohol consumption
is unlikely to account for the impact of alcohol on weight.
We analysed nine indicators of a healthy diet from food frequency questions.
There was a statistically significant association with all of these, although the sizes
of these associations were too small to be meaningful and the directions of these
associations were inconsistent. Some indicators showed alcohol consumption was
associated with a less healthy diet, namely more frequent salt use, red meat and
fried food consumption, a greater amount of total fat and less frequent fruit and
vegetable consumption. Other indicators found alcohol consumption was
associated with a more healthy diet, namely more fibre and less frequent
consumption of chocolate/crisps/biscuits and cakes. The largest association was
seen for cake consumption, which was equivalent to one additional unit of alcohol
resulting in an odds ratio of 0.987 for eating less cake.

82
Therefore although we did not measure physical activity and diet in our cohort,
these findings suggest that they are unlikely to be confounding the association we
found. However further studies which measure and adjust for these within the
same study population are needed before we can be certain.
Our measure of alcohol consumption gave an estimate of total quantity of alcohol
consumed on a weekly basis but no detail on the pattern of drinking. As
mentioned in the introduction consideration of drinking pattern may have helped to
explain our findings further.
2.5.2.6. Lack of a never-smoker category
Our cohort did not contain never-smokers so we have been unable to compare
weight change in smokers and quitters to never smokers. However data from
other cohorts allows some comparison which helps us to consider the impact this
weight gain has on the population‟s weight as a whole. The OXCHECK cohort
(Tang et al., 1997) and the Caerphilly male cohort (Munafo et al, 2009) show
weight gain in quitters during the first five years after stopping is greater than in
never smokers. Cross sectional analysis of these cohorts show never smokers
and ex-smokers have a similar BMI in the longer term. However cross sectional
studies show the BMI of ex-smokers exceeds that of never smokers, particularly in

83
men, suggesting that post-cessation weight gain has public health importance
(Klesges et al., 1989, Akbartbartoori et al., 2005, section 1.2.2).
2.5.2.7. Lack of ethnic diversity
Our cohort included predominately white European people living in Oxfordshire,
UK. There is evidence that weight gain varies by ethnic group. For example,
African Americans have greater weight after stopping smoking than European
Americans (Williamson et al., 1991, Klesges et al., 1998). It is therefore possible
that other ethnic groups might have a different pattern of weight gain in relation to
baseline BMI or alcohol intake than we observed in this cohort.
2.5.3. Comparison with other literature
2.5.3.1. Weight change according to smoking status
We know of only two other prospective studies that have reported on weight gain
over the long-term in biochemically confirmed quitters. The Lung Health Study
found quitters gained 8.2kg over five years whereas smokers gained 1.6kg, a
difference of 6.6kg (O‟Hara et al., 1998), almost identical to that we reported here.
A smaller study of 45 quitters showed a mean weight gain of 8.9kg over 4 years
but did not report weight change for continuing smokers (Daughton et al., 1999).

84
2.5.3.2. Association with baseline BMI
No other studies have looked for a curvilinear relationship of weight gain
according to BMI, although some studies have hinted that such a relationship
might exist. Froom et al. reported weight gain was lowest in those with a BMI
between 25.8-27.7kg/m2 and higher in those with a BMI above or below these
values (Froom et al, 1999). Caan et al. found that lighter and heavier women
gained more weight than those of intermediate weight, but this pattern was not
seen after adjusting for confounders (Caan et al., 1996). Other studies have
reported no association with baseline BMI (Rabkin, 1984, Rodin et al, 1987) some
have found a negative linear association (Flegal et al., 1995, Bosse et al., 1980,
Nides et al., 1994) and some a positive linear association (Dale et al., 1998,
Kawachi et al., 1996). This may be explained because these studies modelled a
linear relationship between BMI and weight gain. A linear model would tend to
show no association or a weak positive linear association if the true association
was U- or J-shaped. Re-evaluating data from the Lung Health Study and the
Caerphilly cohort using polynomial modelling would be useful to confirm or refute
our results.
2.5.3.3. Association with baseline alcohol intake
In a cohort study of smokers and quitters, spanning two to four years, quitting
smoking was associated with an increase in BMI, higher alcohol consumption,
measured at one point in time, attenuated this rise in BMI. When investigated
there was no evidence of effect modification by smoking status. However smoking
status was self reported and quitting date was variable (any time after study entry),

85
so a smaller weight gain may have diluted the results. That study may also have
lacked power to detect an effect modification because there were only 65 quitters
and alcohol consumption was a binary variable (Froom et al., 1999).
A two year cohort found a small but significant inverse effect of alcohol
consumption at the time of quitting and subsequent weight gain in female smokers
and quitters. This effect was seen after adjustment for physical activity (Kawachi et
al. 1996). There was no investigation of interaction by smoking status. Abstinence
was measured by point prevalence which may have underestimated weight gain
and accounted for the small effect size seen.
Our findings are similar to the results from the Lung Health Study (Nides et al.,
1994) which followed biochemically validated continuous quitters for 5 years. The
data showed that for each standard US drink per week consumed at baseline, the
regression coefficient was -0.098 (p=0.02) in men and -0.234 (p=0.02) in women.
(Although the Lung Health Study team reported these coefficients separately for
each gender, there is no statistically significant difference between them according
to our calculations). Equating these to UK units gave regression coefficients of -
0.083 and -0.132 for men and women respectively. These values fit within the
95% confidence intervals our mixed sample but suggest a slightly lower effect than
we found. The Lung Health Study also measured self reported alcohol
consumption at baseline only and did not measure or adjust for physical activity or
diet.

86
2.5.3.4. Weight change over eight years with patch or placebo use during quitting
Our data showed no evidence that active NRT has a long-term effect on reducing
weight gain but are too imprecise to exclude this possibility. However, the data
from one year follow up in a Cochrane review (Parsons et al, 2009) also showed
no sign of efficacy for nicotine patch to prevent weight gain, with a mean
difference of -0.15kg (-1.04, 0.74). The possible effect of NRT seen at one year (-
0.44kg (-1.02, 0.14) was generated by three trials of nicotine nasal spray where
spray use was allowed for up to one year and 21% of abstinent smokers
continued to use it. These trials had a combined effect of -1.55kg (-3.09, -0.00)
compared to placebo. Therefore it seems unlikely that patch use at the time of
quitting has a long term effect on attenuating post cessation weight gain.
2.5.3.5. Association with age
As described in the introduction to this chapter the association between younger
age and greater post cessation weight gain has previously been shown in three
out of seven studies, with four showing no association. Our study adds another
which shows no significant association and again our mean point estimate, of a 25
year difference associated with 1kg difference in weight gain after eight years, was
minor compared to other studies. One previous study showed a mean difference
in baseline age of one year between those who lost weight and those who gained
excessive amounts over 15 years (Swan et al., 1995). Another found the chance
of a 5kg further weight gain, in more than one year of abstinence, almost doubled

87
in those under 55 years compared to those over 55 years old (Williamson et al.,
1991). However, our mean estimate again had wide confidence intervals which
included larger estimates so we cannot be certain of no association.
2.5.3.6. Association with gender
We also found no significant association with gender; however, the coefficient was
large enough to be of clinical importance, with an unadjusted estimate of mean
weight gain of 1.69kg more in men, after eight years cessation, than women. As
described in the introduction to this chapter three out of seven studies have shown
a greater weight gain in women. Two studies have shown no association and two
studies have shown a greater weight gain in men. Our study continues to leave us
with inconsistent results.
2.5.3.7. Association with smoking rate
Of all the explanatory variables we included in our regression analysis on weight
change in continuous quitters, we expected lower smoking rate to be associated
with less weight gain, as this has been the most consistent finding in the literature
so far (section 1.2.3). However, we did not find evidence of this in our quitters
despite a wide range of smoking rates from 15 to 60 cigarettes per day. Instead,
we found a non statistically significant mean difference that showed an extra
packet of cigarettes smoked daily was associated with 1kg difference at eight
years. However, the confidence intervals were wide and extended to include the

88
possibility of a larger estimate, so we cannot be certain that no association exists.
The magnitude of weight change in those who were more addicted to smoking
was a little larger, with an increase in Horne Russell score of seven being
associated with an increase of 1.5kg, eight years after quitting. These differences
although important from a public health perspective are smaller than previous
estimates. Previous estimates have found the increased chance of a further 5kg
increase, in more than one year of abstinence, is associated with smoking 10
cigarettes per day more at baseline (Williamson et al., 1991). As discussed in
chapter one, three of 14 studies also found no association, and we have now
added a fourth, although our study was too small for us to be certain.
2.5.3.8. Association with socioeconomic status
We also found no association with socioeconomic status; this is in contrast to two
studies so far which have found greater weight gain in those with a lower
socioeconomic status. However, the number of individuals split between the
categories was small with the majority being between socioeconomic class two to
four so there was little scope to allow for differences to be examined accurately.
2.5.4. Implications for clinical practice
Patients in a smoking cessation clinic want to know how much weight they might
gain on cessation. The mean and 95% confidence intervals give information
about average or population effects, but do not give individuals a range in which
their weight is likely to lie. These are better defined by prediction intervals. Our

89
models showed that someone with a BMI of 22kg/m2 who quits smoking and
maintains abstinence can expect to lose up to 2kg or gain up to 20kg. Therefore
the 95% prediction intervals were wide, however, at higher BMIs, the prediction
intervals were more useful with a 95% chance that someone with a BMI of 36
would gain between 5kg and 33kg.
Adding alcohol consumption at baseline into the equation enabled us to explain a
further 6% of the variability in weight change in quitters, but again the confidence
intervals were wide and estimates imprecise. Therefore predicting weight change
on these baseline characteristics is currently too imprecise to be used in clinical
practice and further analysis in larger datasets is required.
Moderate drinking, with the potential to prevent a weight gain of 2.4 kg over eight
years (0.3 kg/year), in a population of ex-smokers could have a significant public
health impact. An increase of 0.7 kg/year has been shown to increase the risk of
developing diabetes by 86% in those with impaired fasting glycaemia (Gautier et
al., 2010). Those who quit smoking are at increased risk of developing diabetes for
about five years after cessation, which is unexplained by weight gain alone (Hur et
al., 2007, Wannamethee et al., 2001, Yeh et al., 2010). There is also consistent
systematic review evidence that shows moderate alcohol consumption is
associated with the lowest risk of developing diabetes (Baliunas et al., 2009,
Koppes et al., 2005). However, evidence is currently insufficient to recommend
quitters increase alcohol intake to moderate levels as a means to prevent weight

90
gain. Such recommendations would also need to be carefully balanced against the
harmful effects of increasing alcohol intake.
2.5.5. Implications for research
If the association between BMI and weight gain on cessation is causal, we would
need to delineate behavioural or physiological mechanisms. Nicotine suppresses
appetite and increases metabolic rate (Hofstetter et al., 1986). Underweight
smokers might gain more weight than ideal weight smokers because they are
particularly susceptible to these effects and, when they are removed by stopping
smoking, greater weight gain results. Those who are already obese while smoking
may have a cluster of unhealthy behaviours if, for example, they also eat a high fat
diet, this may be accentuated without nicotine to restrain their appetite. This may
result from an increased appetite for sweet and fatty food (Caan et al., 1996).
Alternatively those who are obese while smoking might be those who are
genetically predisposed to obesity, perhaps through poor expression of appetite
regulatory hormones (Cummings & Schwatz, 2003, Wynne et al, 2005) and, once
the appetite suppressing effect of nicotine is removed, weight increases more than
in healthy weight counterparts.
If the association between alcohol intake and post cessation weight gain was
causal it is plausible that MESO induction in quitters may play a role in increasing
metabolic rate. We did not measure changes in metabolic rate, energy intake or

91
physical activity, and studies which do so are required to understand the
mechanisms which might account for the associations we found.
2.6. Conclusions
Smokers who quit smoking gain 7kg more than if they had continued smoking,
while those who quit for a substantial period and then resume smoking seem to
resume their „smoking weight‟. This study is the first to look for and find a J-
shaped relation between baseline BMI and weight gain in quitters. If confirmed,
this has important implications for the treatment of tobacco addiction. Knowing that
underweight and obesity predicts greater weight gain on cessation helps clinicians
plan interventions with their patients and guides epidemiological and physiological
investigations into causes of weight gain on smoking cessation.
A complex relationship exists between alcohol consumption and weight gain. We
have found a dose response relationship in quitting smokers, which is consistent
across studies. It is plausible that MESO induction may play a role in this.
Therefore, advice to reduce alcohol consumption in this population may promote
rather that prevent weight gain. Studies are needed to investigate the mechanisms
of alcohol metabolism in quitting smokers and weigh the adverse health
consequences of increasing alcohol against the benefit of smaller weight gain.
Increasing alcohol should not currently be advised for preventing weight gain dur-
ing smoking cessation.

92
We found no evidence of an association between weight gain over eight years of
abstinence and treatment group, age at quitting, baseline smoking rate, gender or
socioeconomic status. However, our estimates were imprecise so we cannot be
certain and larger prospective studies in biochemically validated continuous
quitters are required.

93
3. TRIAL PROTOCOL: DIETARY MANAGEMENT IN SMOKERS TRIAL
(DeMiST) Chapters three to six report on DeMiST. A CONSORT checklist for the reporting of
this trial is included in Appendix 5.
Chapter three meets objective three of this thesis, to discuss the design of the
Dietary Management in Smokers Trial (DeMiST), a randomised controlled trial to
investigate the feasibility of dietary interventions to prevent weight gain within NHS
stop smoking clinics and examine the effects of these dietary interventions on urges
to smoke.
This protocol was published in the journal Trials (Lycett et al., 2010, Appendix 6). The
original present tense of the publication has been changed to past tense to fit better
with the thesis and some details on statistical analysis have been added.
3.1. Introduction
As discussed in section 1.5.4 a Cochrane review (Parsons et al, 2009) showed some
evidence that both an individiually tailored dietary plan and a very low calorie diet
(VLCD) reduced weight gain and the VLCD increased abstinence.

94
The effect of the VLCD on improving abstinence was unexpected. One hypothesis is
that the VLCD induced ketosis, which actually suppressed hunger (Johnstone et al.,
2008) and therefore reduced urges to smoke. This hypothesis is supported by data
supplied by Danielsson (personal communication), which showed a statistically
significant reduction of urges to smoke and a smaller increase in appetite during the
weeks on the VLCD diet than those in the control intervention. There was a 50%
reduction in urges to smoke after one week on the VLCD diet compared to a 27%
reduction after one week in the control group (P<0.0001). There was a 4-fold
increase in hunger in the control group after one week compared to only a 50%
increase in hunger in the VLCD group (p<0.0003).
We compared three dietary interventions. A VLCD, and an individual dietary and
activity plan (IDAP) which included a modest energy restriction, using a low fat diet
that meets the energy requirements of an individual‟s BMR. The third was a control
condition where general healthy eating advice was provided, but with an emphasis of
avoiding hunger, this is typical of the current advice given in NHS stop smoking
services.
Feasibility was the trial‟s primary outcome and we assessed this by measuring
recruitment and attrition rates. We also assessed acceptability through seeking the
views of the participants and clinicians who took part.

95
We developed and tested a tool to help non dietary experts assess and advise on
diet, this tool also aimed to measure dietary change as a process by which weight
change may have occurred.
The other main objective of DeMiST was to test the hypothesis that hunger increases
urges to smoke and ketosis reduces urges to smoke. We thought we could include
this within the feasibility trial as a small sample provided adequate power to test this
association. We developed and tested a tool to measure hunger and food craving for
this purpose.
3.1.1. To maximise the difference in hunger between trial arms
The VLCD trial (Danielsson et al., 1998) reviewed in the Parson‟s et al Cochrane
review used a VLCD intermittently. This may have underestimated the potential effect
of the VLCD on nicotine withdrawal symptoms. Moving into and out of a ketotic state
may influence mood and hunger, both symptoms of nicotine withdrawal.
We expected hunger to be greatest in the IDAP group where a moderate energy
restriction creates a negative energy balance. Appetite then increases in response to
the usual physiological and neurological mechanisms that work to restore energy
homeostasis (Wynne et al., 2005). In the control condition, we expected hunger to be
alleviated by eating freely.

96
We began the VLCD one week before quit day to ensure participants were in ketosis
before they quit (verified by the presence of urine ketones) and continued,
uninterrupted, for a further four weeks when nicotine withdrawal would be at its peak.
The IDAP also began one week before quit day to establish an energy deficit and
increase the likelihood of hunger in this intervention before the quit date. The control
group were advised to eat as usual. Therefore, at the time of quitting we expected to
see the maximal differences in hunger scores between the three groups.
3.1.2. To measure hunger and food craving
To measure a change in appetite, when food is restricted we cannot rely on a
measurement of food intake. Rather we need a measure to capture motivation to eat.
As discussed in section 1.3.3 motivation to eat which is affected by nicotine can
broadly be described as two main responses. A homeostatic response to food
deprivation and a hedonic response to food reward (Saper et al., 2002, Blundell,
2006).
The first response we called „genuine hunger‟, derived predominantly from a
physiological need for food, commonly perceived as an abdominal sensation and
described as emptiness in the stomach. When hungry, a wide variety of foods will
satisfy.

97
The second motivation we termed „food craving‟, this is most commonly described in
the scientific literature as „an intense desire to eat a specific food‟ (Pelchat et al.,
2004). Food craving can occur irrespective of hunger, although hunger and food
cravings have been shown to be interdependent (Gibson & Desmond, 1999).
The precise mechanism of food craving has been much debated. Some studies have
demonstrated that like tobacco addiction (Balfour, 2004), dopamine is released in the
nucleus accumbens in response to eating the desired food (Martel & Fantino, 1996,
Pelchat et al., 2004). Others have suggested endogenous opioid peptides (Mercer &
Holder, 1997) or a central serotonin deficit (Wurtman & Wurtmen, 1986) trigger food
cravings. However the serotonergic hypothesis has been questioned in later studies
(Christensen, 1997). Food craving has also been hypothesied as a learned response
(Gibson and Desmond, 1999) and a response to food related cues (Christensen,
2007).
Measurement of hunger and food craving has also been debated. The subjective
nature of these terms makes them hard to standardize although several scales have
been developed which have shown good internal consistency. The Food Craving
Inventory (FCI) measures craving for specific foods (White et al., 2002). The Trait
and State Food-Cravings Questionnaires, and modifications of these, measure
cravings in general, in terms of preoccupation with food, anticipation of positive effect
and loss of control (Cepeda-Benito, 2000, Nijis etal, 2007). The Questionnaire on

98
Craving for Sweet or Rich Foods (QCSRF) measured both and this was designed to
specifically measure food cravings during smoking cessation (Toll et al., 2008).
However no scales have sought to capture both hunger and craving or distinguish
between the two outside of laboratory conditions. There is a need to do so, as their
nature is different so the strategies needed to control them will be different. None of
the scales developed so far are brief enough or designed to capture cravings on a
daily basis.
3.1.3. DeMiST dietary assessment
As described in section 1.3.3 an increase in food and nutrient intake, energy from fat
and sugar, in particular has been suggested to account for 69% of weight gained
following smoking cessation (Stamford et al., 1986). Change in energy expenditure is
thought to account for less than 40% (Filozof et al., 2004). The goal of dietary
interventions to prevent weight gain in smoking cessation aim to restrict energy
intake both prevent this increase in consumption and balance intake with lowered
energy expenditure.
To measure this process to check adherence and see whether dietary change
explained change in weight we needed a measure for dietary intake and dietary
change that could be easily used and assessed in a clinical setting.

99
The accepted gold standard measure for nutrient intake is the seven day weighed
intake diary although validation studies with doubly labelled water have shown that
underreporting is common (Livingstone et al., 1990). Data collection and analysis
from a weighed intake diary is burdensome and the slightly less burdensome seven
day food diary is now most widely used. Portion sizes are estimated using household
measures or natural unit sizes (e.g. slices of bread). Individuals can choose to weigh
food, but the main purpose of using this method is to avoid the burden of weighing. A
comparison of methods in the UK arm of the European Prospective Investigation into
Cancer (EPIC) showed that the seven day estimated record, agreed most closely to
16 days of weighed intake (Bingham et al., 1997) and this is now considered the gold
standard field measure.
However, frequent recording of food intake even using the estimated seven day food
diary is extremely burdensome for trial participants and extremely laborious to
analyse. Even when it is done well, its accuracy is still only an estimate and it is
prone to misreporting. Food frequency questionnaires (FFQ) and 24 hour dietary
recalls are the next best dietary assessment methods correlated to biomarkers
(Bingham et al., 1997). However, FFQ are designed to measure average
consumption patterns over a long period so are unsuitable for detecting change over
short periods in a clinical trial. Twenty-four hour recalls are most accurate by using a
multiple pass method. This is a five step method, first a participant lists food and
drinks consumed, second frequently forgotten foods are probed, third time and eating
occasion are probed, fourth, descriptions and quantity of foods are probed and fifth is
a final probe of anything else that can be recalled (Conway et al., 2003, Conway et
100
al., 2004). However this technique is time consuming requires considerable training
and several assessments to take into account day-to-day variability. Diet histories are
most commonly used in clinical practice, these take into account habitual intake and
24 hour recall but require lengthy training of clinicians. They provide the basis on
which dietary advice is given. We searched the literature for a brief, simple and
reliable tool, which could help clinicians not trained in detailed dietary assessment
and therapeutic diets, to assess, advise and monitor dietary change. We did not find
a tool suitable for this purpose so we designed our own and tested its validity against
the gold standard field measure.
3.1.4. Meeting the needs of trial participants
As the aim of DeMiST was to inform a study large and long enough to assess long
term effects on dietary change, weight, cardiovascular risk, lung health and smoking
abstinence, the design extended beyond the initial quitting stage into a second
treatment stage where both the VLCD and the control group received individual
dietary and activity planning.
The reason for this in the VLCD group was to provide participants with conventional
support to establish long term healthy habits. The greatest criticism of VLCDs in
current clinical practice is that they may not establish long term healthy eating habits,
although a review by NICE reported that a 5% reduction in body weight is maintained
over two years in those following a VLCD plan (NICE, 2006).

101
The reason for this in the control group was two-fold. Firstly, we wanted to compare
the long term effects from IDAP, which restricts energy intake at the time of quitting,
with the „control‟ group which restricted it after they quit. There is preliminary
evidence to suggest that the latter may be more successful than the former, although
this has not been tested with an adequately powered trial (Spring, 2004).
Secondly, because the control was unblinded we hoped that by providing IDAP after
quitting this group would not feel „short changed‟ and abandon their quit attempt
prematurely. We investigated this quantitatively investigating the association between
belief in trial arm and attrition.
We also asked participants to tell us of their experience in each of the DeMiST trial
arms, we did this qualitatively using semi-structured interviews. We chose this
method above others for several reasons. Firstly we considered whether a
satisfaction survey or an acceptability scale would suffice, this has traditionally been
used to measure acceptability of interventions. However, the argument to use more
insightful methods is strong (Finn and Sladczek, 2001), these offer the opportunity to
discover more than might be predicted and included in preconceived surveys. In
other words qualitative research it allows us to develop inductive rather than
deductive reasoning. It allows us to embrace subjectivity of the participant and the
interviewer (Swift and Tischler, 2010). What this meant in our research is that we
were able to take a relativist ontological position, expecting different participants to
experience the same trial arm differently. We considered that there may not be one

102
real experience of trial arm, but rather many which are perceived differently; with
perceptions and opinions having been shaped by an individual‟s life experiences. We
were also able to take a reflexive epistemological approach and considering how our
own background and interest may have steered the conversation in one particular
direction or another.
3.2. Methods
3.2.1. Participants
Overweight (BMI>25Kg/m2) smokers listed on the databases of participating general
practices were invited to take part by a letter from their General Practitioner (GP)
(Appendix 7). All participants were from practices in Birmingham East and North
Primary Care Trust (PCT) and Worcestershire PCT, in the UK (see Appendix 8,
Appendix 9, Appendix 10 for practice recruitment documentation).
Interested participants telephoned the trial office at The University of Birmingham for
further information; they provided verbal consent to initial telephone screening for
eligibility (Appendix 11, Appendix 12, Appendix 13). If considered eligible they were
given an appointment with a trial nurse for full screening where they were invited to
give informed consent for participation (Appendix 14, Appendix 15). The trial office
sent out participant information sheets (Appendix 16) so that they were received at
least 24 hours before their first appointment. The clinics were run at local GP
practices. Daytime appointments were offered from 8.30am until 7pm.

103
3.2.1.1. Inclusion criteria
Participants had to:
Be aged over 18 years
Smoke cigarettes daily, and have an exhaled CO of at least 10ppm at least 15
minutes after last smoking
Have a BMI of at least 25kg/m2
Be willing to be randomised to any of the three arms and willing and able to
comply with the intervention and all study procedures.
We recruited only those with a BMI greater than or equal to 25 for the following
reasons: 1) the rate of weight loss on a VLCD is approximately 2kg/week so anyone
entering the trial would need to be able to lose 10kg. For example, a woman 1.64m
tall weighing 68kg with a BMI of 25.2 could potentially lose 10kg and reach a healthy
BMI of 21.6kg/m2. VLCDs have been shown to be as safe in those with a BMI >
25kg/m2 as in those with a BMI>30kg/m2 (RTSC, 2007). 2) Research shows that
those who are overweight or obese are likely to gain more weight than healthy weight
smokers and so they are an appropriate target for weight gain prevention (Chapter
two, Lycett et al., 2011a). 3) The smoking population has a lower mean BMI than the
non-smoking population (Klesges et al., 1989) so we could potentially struggle to
recruit only those with a BMI >30kg/m2.

104
3.2.1.2. Exclusion criteria
Individuals could not take part if they:
Had any of the absolute or relative contraindications to VLCD use. These
include situations in which rapid weight loss would be unsafe: pregnancy,
breastfeeding, myocardial infarction/unstable angina/acute coronary syndrome
in the past 6 months, cerebrovascular accident /transient ischaemic attack
/stroke in the past 3 months, major surgery in the last 3 months, severe
cardiac arrhythmias, severe hepatic impairment, severe renal impairment (i.e.
GFR ≤ 29mls/min), active carcinoma, untreated gallstones, past history of
anorexia nervosa or bulimia nervosa, type 1 diabetes, those aged over 70
years with a BMI<30kg/m2. A large energy deficit alters metabolic rate and so
anyone with unstable thyroid function was also excluded. Sudden weight loss
may cause fainting or precipitate gout in those who are susceptible so those
with regular blackouts or fainting, and untreated gout were also excluded. The
VLCD formula is made from milk so is unsuitable for anyone with a milk allergy
or intolerance.
Had uncontrolled hypertension and type two diabetes treated with medication.
Although these are not contraindications to the VLCD they are excluded as
adjusting the medications in these conditions would require specialist advice
beyond the scope of the research nurses in this trial (diet controlled type two
diabetics were included).
Were on oral anticoagulants, digoxin, phenytoin and lithium due to likelihood
of increased drug absorption if on a VLCD. Specialist advice beyond the

105
scope of our research nurses is needed to reduce and monitor these
medications.
Were on diuretics for diuresis were excluded as a VLCD can potentiate
diuresis and increase the risk of hypokalaemia. Those on low dose diuretics
for treatment of hypertension were not excluded as the risk of hypokalaemic
complications on these are low (Franse et al., 2000, Peters et al.,1989). The
effects of combining a VLCD with low dose thiazides has not been well studied
and may be unpredictable therefore serum potassium was to be monitored
weekly and the VLCD discontinued if levels fell below 3.1mmol/l. (Appendix
17 contains the full list of excluded medications and clinical protocol of this
developed for study nurses).
Had previous severe adverse reaction to nicotine patches (which precluded
further use).
Had active phaeocromocytoma as this combined with use of NRT may
increase the risk of hypertension and tachycardia.
Were concurrently using smoking cessation medication i.e. (NRT), vareniciline
or bupropion or medication (e.g. nortriptyline) that is known to help smokers
quit.
Were taking weight loss medication e.g. orlistat, sibutramine.
Were suspected of abuse of alcohol or other drugs as this might confound our
measure of cravings.
Were using smokeless tobacco
Were concurrently participating in other therapeutic clinical trials.

106
3.2.1.3. Removal of participants from therapy
Participants would discontinue therapy if:
A contraindication to treatment became apparent.
An adverse event occurred making it inadvisable to continue treatment.
Serum potassium fell below 3.1mmol/l in those taking thiazides, the VLCD
would be discontinued.
The person ceased to continue to quit smoking and wished also to abandon
the weight management programme. If a person failed to stop smoking they
could continue with the dietary treatment intervention, likewise if a person
abandoned the dietary treatment they could continue with their quit attempt.
Keeping participants like this in the trial would help us to explore the reasons
why a treatment was abandoned. We will find out whether abandonment of
one treatment ultimately leads to abandonment of both and how these
participants have decided to tackle their smoking or weight.
3.2.2. Dietary Interventions
Week 0 was quit week, negatively numbered weeks were the weeks before quit week
and positively numbered weeks were the weeks after quit week. Week -3 was
baseline, three weeks before quit week. Participants were seen and briefed at
baseline and a quit day was set for three weeks time. Participants were randomised
into the dietary interventions, VLCD, IDAP and Control (SBS), one week prior to
quitting (week -1). Each intervention contained two treatment stages. Stage 1 lasted

107
from week -1 to week +4 and treatment stage 2 lasted from week +4 to week +12
(Figure 6).
3.2.2.1. Treatment Stage 1 – VLCD
The VLCD formula we used was called Lipotrim. This was provided for the study at
cost price from the manufacturers, Howard Foundation Research Ltd. It was
purchased by participating Primary Care Trusts (PCTs) and provided free to
participants (Appendix 18). Participants were instructed to take 2-3 shakes each day
and drink a minimum of 4 pints of water, but not in excess of 4 litres. Black tea and
black coffee could be drunk but no other food or drink could be consumed, as any
additional carbohydrate or citric acid may suppress ketone production (Appendix 19).

108
Figure 6. Treatment stages for DeMiST
The female formula was 425kcal/day and the male formula was 559kcal/day, it
contained all essential nutrients and complied with the EU codex standard for VLCDs
(RTSC, 2002). This diet began one week before quitting, by which time the dieter
would be in ketosis. The diet continued during the first four weeks after quitting when
nicotine withdrawal symptoms would be at their worst. The rationale for this is that
dieters should be comfortably in ketosis when they quit and experience acute
nicotine withdrawal. It takes approximately 3 to 4 days to get into ketosis on a VLCD,
during which time the side effects of a VLCD are most apparent. After these first four
days individuals usually gain a feeling of wellbeing that accompanies ketosis and so

109
we wanted to coincide this period of ketosis exactly with the time of quitting to
maximise any attenuating effects it may have on urges to smoke.
Every effort was made to get the participants to adhere to the VLCD by using
behavioural change techniques as defined by Abraham and Michie in 2008
(Appendix 20). These included an explanation of the role of ketones and the
necessity for strict adherence in order to remain in a ketotic state. (Providing
instruction and providing information on consequences of action are behavioural
change techniques 2 and 8.) Ketosis is usually achieved by the third or fourth day on
the diet and so participants were advised that they would feel better after this time.
Encouragement (technique 6) and prompting of self-encouragement (technique 22)
was used e.g. suggestions for self talk: „today was difficult but if I keep going I will
feel better in 2 days‟, „if I can stick this out, I can lose weight and stop smoking in
time for my birthday‟. Support to identify and overcome barriers to adherence
(technique 5) was also given.
3.2.2.2. Treatment Stage 1 – Individual Dietary and Activity Planning (IDAP)
This contains dietary, activity and behavioural elements. Assessment of current
behaviours and food choices was made by using the Health Choice Index (HCI) (the
development and validity testing of the HCI is discussed in chapter seven). This is a
multiple choice questionnaire designed to get participants to score their food choices,
weekly food frequency, eating behaviours and activity. From this, both the participant

110
and the healthcare professional were able to identify areas for improvement and
agreed goals for progress. Typically three goals were decided, one focusing on food
choice e.g. I will buy skimmed milk instead of full fat milk; one on eating behaviour
e.g. „I will prepare a packed lunch the night before to take to work so that I don‟t miss
lunch‟. And one activity focused goal e.g. „I will park the car a block away from work
and take a brisk walk at lunchtime so that I fit in three ten minute exercise breaks
during my working day. Prompting specific goal setting is technique 10 in the
behavioural change taxonomy. These goals were reviewed regularly and adjusted as
necessary (behaviour change technique 11). Helping the participant to identify and
overcome barriers to achieving their goals, discussing time management to
incorporate these changes into their daily lives, helping them to plan relapse
prevention strategies and general encouragement all formed part of this intervention
(behavioural techniques 5, 26, 23 and 6 respectively).
As well as identification of specific goals instructions were given (technique 8) for
following a moderate calorie restricted diet plan tailored to the individual‟s energy
requirements. This provided a structure to help consolidate the goals identified and
ensure that the participants had the right tools to achieve a sufficient energy deficit
for weight control.
The energy prescription used in previous studies to prevent weight gain on smoking
cessation has varied. Pirie et al. advised generally to reduce energy intake by 150 to
300kcal/day (which was considered to equate to metabolic slowing upon nicotine

111
withdrawal, the level of which depended on number of cigarettes smoked) (Pirie et
al., 1992). Perkins et al. used a 500kcal deficit tailored to individual energy
requirements (Perkins et al., 2001). Hall used a 500kcal deficit tailored to individual
requirements should weight increase by 1kg (Hall, 1992). Spring used a 150kcal
deficit based on individual food diaries (Spring et al., 2004). Danielsson used a
1600kcal diet compared with a very low calorie diet (419kcal/day) (Danielsson et al.,
1999).
We decided to advise an approximate energy deficit of 600kcal, based on individual
requirements. This is recommended by NICE for weight loss of 0.5kg/week (NICE,
2006). This is sufficient to counter the mean rate of post-cessation weight gain and
promote modest weight loss which is desirable for our population with a
BMI>25kg/m2. Dietetic consensus considers a usual maximum energy prescription of
1800kcal. Anecdotally advising above this appears to be ineffective at achieving
weight loss, this may be due to people misunderstanding the volumes of food
recommended for larger portion sizes.
To calculate energy prescription in individuals we have assumed all participants will
have a physical activity level (PAL) of 1.4, which is consistent with a sedentary
occupation and leisure activities. The PAL is the factor by which BMR is multiplied to
give an estimate of total energy expenditure. For simplicity in clinical practice we
wrote dietary plans that equate to energy intakes of 1200kcal, 1500kcal or 1800kcal.
An individual is allocated the closest energy prescription to their BMR (as calculated

112
by the Tanita body composition analyser) (Appendix 21). Calculating total energy
requirement from a PAL of 1.4 and BMRs of 1200kcal, 1500kcal and 1800kcal,
shows energy requirement is an increase of 500kcal-700kcal above BMR. This
means we can approximately achieve the 600kcal deficit by using BMR alone for the
prescription of energy. The energy level advised was translated into the appropriate
number of portions from each of the food groups: complex carbohydrates, fruit and
vegetables, meat, fish and alternatives, dairy foods, sugar and fatty foods. The
proportion of food coming from these food groups make up a healthy diet with 15-
30% of energy from fat, 10-15% of energy from protein, 55-75% of energy from
carbohydrate and 0-5% energy from alcohol. Therefore, the diet is low in fat and
sugary foods which studies have shown significantly increase in the diets of smokers
when they quit (Perkins et al., 1990, Rodin, 1987, French et al., 1996, Hall et al.,
1989). The dietary plan was a „pick and choose‟ format, where individuals choose
from a list of items within different food groups at each meal. The food portions were
defined in American cup sizes and participants were given measuring cups to
measure out their portions (Appendix 22 for example).
3.2.2.3. Treatment Stage 1 – Control (Step by Step (SBS))
The control group received healthy eating advice when participants mentioned weight
concern. This is standard in smoking cessation interventions. Advice was given not to
„diet‟ but instead to avoid hunger by eating healthy, low fat foods. This is because it is
thought that hunger may lead to urges to smoke, and may make relapse more likely.
Tips for avoiding hunger include:

113
Regular meals, including breakfast (which is often missed in smokers
(Nishiyama et al., 2009)
Handy, healthy snacks e.g. fruit or chopped vegetables (carrot, celery sticks)
Drink plenty of water, particularly before meals, this helps fill the stomach and
satisfy „oral cravings‟.
There is evidence that glucose tablets satiate urges to smoke within minutes, so
these can be used (McRobbie & Hajek, 2004). Avoidance of total alcohol for the
immediate post-cessation period was advised. This was to avoid lapsing due to
disinhibition and the „cue‟ which alcohol provides, rather than to control weight.
Participants were advised to increase daily activity, e.g. including a 30 minute walk in
their day. Advice in the control group was given as general instruction and general
encouragement (behavioural techniques 6 and 8) but individual goal setting and
energy prescription was not included.
3.2.3.1. Treatment Stage 2 - VLCD
This spaned from week +4 to +12 and included four visits (Figure 6). The same
number of visits has been included in each of the intervention arms so that number of
consultations with a nurse was not a confounder.
The VLCD was discontinued at week +4, participants were weaned back onto food.
This weaning took one week. During this week the Lipotrim formula was reduced and
replaced by low fat meals with increasing amounts of carbohydrate until healthy

114
proportions were achieved (Appendix 23). Gradual reintroduction of carbohydrate is
necessary to avoid rapid replenishing and storage of muscle glycogen, which could
result in a rapid increase of body water weight (up to 5kg over the week). At week +5
lifestyle goals were set and energy prescription was given as described in treatment
stage one of IDAP. Behavioural support continued at reduced frequency to week
+12. The reason for this second stage of treatment is to cultivate the development of
long term healthy habits as explained in the introduction to this chapter (section
3.1.4).
3.2.3.2. Treatment Stage 2 – Individually Tailored Diet and Activity Plan (IDAP)
This behavioural support continued to week +12 and visits became less frequent.
3.2.3.3. Treatment Stage 2 – Control (Step by Step (SBS))
Participants in the control arm, received IDAP from week +8 to week +12. This
allowed them time to become established quitters before they embarked on weight
control.
3.2.3. Smoking Cessation Interventions for all Participants
All participants had identical treatment to stop smoking. This was the treatment which
is available on the NHS. It is withdrawal orientated such that behavioural strategies
(examples in Appendix 24) and nicotine replacement are given to relieve withdrawal

115
symptoms. This has been shown to be an effective model for stopping smoking
(Hajek, 2006). Individuals are seen over seven consecutive weeks, weeks -3 and -2
prepare them for quitting, they quit at week 0, weeks +1, +2, +3 and +4 support them
during the first four weeks after quitting when withdrawal symptoms are at their
strongest. The sessions incorporate a variety of behavioural change techniques:
pre-quit sessions prompt intent formation (technique 4) by setting a quit date,
they prompt barrier identification (technique 5)
and relapse prevention (technique 23) when participants identify times or
places when it will be particular hard for them to resist smoking, they discuss a
strategy to help them to deal with these circumstances; for example, changing
routine so the usual smoking cues are removed.
Quit week and the weeks that follow provide instruction (technique 8) in the use of
nicotine replacement, review of and further planning of strategies (technique 11) to
deal with withdrawal symptoms and general encouragement (technique 6). Self-talk
(technique 22) is encouraged such that participants are asked to see and describe
themselves as a „non-smoker‟ and to frequently bring to mind the benefits of quitting
that they are looking forward to.
3.2.4. Nicotine replacement therapy (NRT)
Nicorette 25mg transdermal 16 hour patches were provided for 8 weeks followed by
a 15mg patch and a 10mg patch each for 2 weeks. Patches were supplied free of
charge by McNeil Products Ltd. Other forms of NRT, such as gum or nasal spray or a
combination of NRT was not used to avoid the possibility that the amount of NRT

116
taken would differ by arm. This could confound effects of hunger or ketosis on urges
to smoke that we are trying to discover. We used a nicotine patch as it delivers a
consistent amount of nicotine to avoid this confounding. As no other NRT products
could be used in combination to help with acute cravings we used the 16 hour, 25mg
patch which has been shown to yield better abstinence than other available patches
(Tonnesen et al., 1999).
3.2.5. Training and supervision
Treatment was provided by trained practice nurses. Practice nurses were trained by
NHS stop smoking services (2 days), a research nurse, a general practitioner (GP)
(0.5 days), and a registered dietitian (1.5 days). Nurses were given the clinical
protocol to read before training sessions (Appendix 25). Training included
explanation of dietetic and behavioural interventions and practicing the interventions
on each other. The clinical protocol was clarified where needed and questions
answered. The aim of the training was to equip the nurses so that, once they had
completed it, they felt confident to deliver the interventions according to the clinical
protocol.
After the training, „hands on‟ supervision was available for the first few clinics.
Immediate telephone access to the dietitian and GP were available for all clinical
queries throughout the rest of the trial.

117
Medical history and any medication used or altered during the trial was monitored.
Any significant changes in clinical condition of individual participants, as measured
on a weekly basis, was discussed with the supervising GP and action taken, e.g.
clinically significant fall in blood pressure in participants on the VLCD taking anti-
hypertensives would require adjustment of anti-hypertensive medication (Appendix
26). The participant‟s own GP was kept informed.
3.2.6. Fidelity checking and monitoring
Fidelity to the clinical protocol and record keeping was assessed and monitored
against the clinical protocol by the principal investigator every few months;
consultations were audiotaped for this purpose. Any deviations were recorded,
discussed and corrected either immediately or at following clinics. The trial was
potentially subject to audit by the appropriate regulatory authorities and therefore
participants were asked to consent to allow their records to be viewed.
3.3. Objectives
3.3.1. Primary objectives
To investigate the feasibility of running this three-armed dietary intervention study as
part of the NHS stop smoking services using primary care nurses. This included the
feasibility of measuring and monitoring of physiological and biochemical risk factors
for cardiovascular disease, diabetes and chronic obstructive pulmonary disease
(COPD). It explored the acceptability of the interventions to participants.

118
3.3.2. Secondary objectives
To investigate whether smoking cessation advice and a nicotine patch in combination
with: a very low calorie diet (VLCD), or individually tailored dietary planning (IDAP), or
usual support affected urges to smoke, through hunger or ketosis in overweight
smokers trying to quit.
3.3.3. Tertiary objectives
To investigate the extent to which changes in smoking status, diet and activity
achieved during the treatment stages were maintained at the end of treatment and at
six and 12 months in each of the intervention arms. To investigate associations
between hunger, abstinence, early and late weight gain.
3.4. Outcome Measures
3.4.1. Acceptability
Participant acceptability was measured qualitatively by semi-structured interviewing
and quantitatively by response and attrition rates as described below:
Semi-structured telephone interviews were conducted after the participant had
completed treatment or dropped out of the programme. Participants who were
happy to do so gave their consent to this at the start of the trial. To help them
remember their thoughts and feelings „of the moment‟ they were given the

119
questions they would be asked at the start of the trial, with space to jot down
notes, during the trial. We aimed to interview participants until theoretical
saturation of responses was reached. We aimed to purposively sample
interviewees to encompass the full range of attrition characteristics, for
example, those who completed the trial, and those who dropped out of
quitting, dieting or both in each of the three trial arms. Interviews were audio
recorded and transcribed verbatim. Participants were asked what they found
helpful and unhelpful and their reasons for dropping out.
Rates of response to participant invitation letters and posters.
Rates of recruitment at telephone screening, at first consultation.
Rates of drop out before randomisation.
Rates of drop out after randomisation in each treatment arm.
Rates of attendance at each session.
Rates of participant adherence to treatment.
Quality of life measure, a scale on which the participant can score general life
satisfaction and well being at baseline, weeks +4, and +12.
3.4.2. Feasibility
Feasibility of running the trial within the primary care practice was measured
qualitatively as described below:
A focus group of participating nurses to investigate experiences of delivering
intervention, e.g. how easy was it to carry out the interventions, was training

120
sufficient, was consultation time adequate, what difficulties were encountered
taking the trial measurements.
Principal investigator‟s reflections on their experiences of primary care
involvement e.g. ease of GP practice recruitment, willingness for PCTs to
participant, obstacles encountered.
3.4.3. Measurement of urges to smoke and hunger,
Degree of smoking addiction was measured at baseline using the Fagerstrom Score
(Fagerstrom & Schneider, 1999). Urge to smoke was measured by the Mood &
Physical Symptoms Combined Scale (MPSS-C) (West & Hajek, 2004). Hunger and
food craving was measured by the Hunger and food Craving (HCS) score (discussed
further in chapter five). MPSS-C and HCS were recorded daily in a diary over the first
four weeks of quitting and weekly thereafter. The primary outcomes of interest were
over the first 24 hours and the first week of quitting; this is where the largest effects
are likely to be seen as withdrawal symptoms are at their peak during this time.
Comparisons between measures were made for all those who continued in their quit
attempt until they decided to abandon quitting, and adjusted for those who lapsed,
were point prevalent abstinent at 24 hours, 7 days or continuously abstinent at 4
weeks. Although it is standard practice in smoking trials to primarily analyse those
who are abstinent, our interest was in the effects on cravings and we cannot assume
that those who did not achieve abstinence did not experience cravings as they tried
to do so. Piasecki showed that cravings were heightened in both smokers who were

121
attempting to quit and lapsed, as well as in smokers who succeeded in quitting. He
found that more cigarettes, smoked on more occasions did reduce cravings
(presumably as these have served to treat nicotine withdrawal acutely) but also that a
few cigarettes increased cravings (100 vs 56 cigarettes p<0.001) (Piasecki, 2003).
Perhaps this reflects a greater struggle to cope with cravings before a cigarette is
finally smoked out of desperation.
3.4.4. Ketosis
The presence or absence of ketones was measured using ketostik test strips dipped
into urine samples. This was done weekly during the first six weeks of dietary
intervention, to check those in the VLCD were in ketosis throughout the five weeks
and come out of ketosis during the re-feeding week. It was also measured during this
time in IDAP and control arms to verify the absence of ketosis in these groups or
identify any participants which might be self-imposing excessive dietary restriction,
(unless undiagnosed diabetes presented itself).
3.4.5. Measurement of smoking status
Twenty-four hour point prevalence abstinence was measured by participants
achieving 24 consecutive hours of abstinence that was verified by exhaled
CO<10ppm. Seven day point prevalence abstinence was defined as those reporting
not smoking over the last seven days, and this was verified by exhaled CO < 10ppm.
Participants achieving one, six and 12 month abstinence were to be defined using
the Russell Standard which states that no more than five cigarettes have been

122
smoked since week +2, this was verified by CO<10ppm at each consultation (West et
al., 2005). Participants who have not achieved abstinence but were still attempting to
quit were termed „lapsed‟. Smokers who abandoned their quit attempt, such that it
was no longer their intention to quit, were considered „relapsed‟.
3.4.6. Measurement of Disease Risk Factors
These were measured as described below. The schedule of measurements is
contained in Table 17 .
Weekly weight, waist to hip ratio, body composition and blood pressure.
FEV1 and FVC post 200mg salbutamol as is recommended by the American
Thoracic Society 2005 standards for measuring lung function (Miller et al.,
2005) at baseline, three, six and 12 months.
Fasting blood glucose, Total cholesterol (TC), low density lipoprotein (LDL)
cholesterol, high density lipoprotein (HDL) cholesterol, TC/HDL ratio,
triglycerides, haemoglobin, white blood cell count, platelet count, mean cell
volume and c-reactive protein (CRP).
Full details of how these measurements were taken are referred to in the trial clinical
protocol (Appendix 25) as standard operating procedures (SOPs) and work
instructions (WIs) (e.g. Appendix 26). The nurses were trained in these procedures
so that they are carried out consistently at each trial site. The nurses were assessed
in practice against these SOPs and WIs, every couple of months, by the principal
investigator.

123
3.4.7. Measurement of diet and activity
Food choices, eating behaviour and activity were measured at baseline, end of
treatment, 6 and 12 months using the HCI. Validity between this simple, quick
measure of diet quality as an assessment of nutrient intake was investigated by
statistical analysis against an estimated seven day food intake diary which was also
completed at baseline (discussed further in chapter five). Participants were
encouraged to weigh their food when completing the seven day food diary, but
portion sizes could also be estimated using household measures or natural food
units. As discussed in the introduction to this chapter (section 3.1.3) despite
underreporting weighed diaries are considered the most accurate way to record
dietary intake and only an estimated food diary comes close to this level of accuracy
(Bingham et al., 1995, Bingham et al., 1997). Diaries which reported less than 1.2 x
BMR energy intake or were incomplete were discounted. Where necessary the
Goldberg cut-off was used to evaluate the mean population bias in reported energy
intake (Black, 2000). The seven day diaries also estimated physical activity levels
using the method which determined dietary references values for energy in the UK
(DRV, 1991).
Those on a VLCD who did not produce ketones or achieve the expected 2kg weekly
weight loss were considered non adherent. We expected any weight gain in the IDAP
group to be a result of poor adherence, although weight maintenance was acceptable
in this group.

124
3.4.8. Confidence in trial arm
Due to the unblinded nature of the trial, participants were asked prior to
randomisation to rate their confidence of each treatment arm being successful. From
this we were able to determine whether expectation of success in treatment
allocation was associated with attrition rates. We planned to measure this again at
weeks +4 and +12 to see if this changed over time.
3.5. Sample Size
Acceptability and feasibility was measured qualitatively through interviews and by
recording of recruitment and attendance rates. These outcomes were descriptive and
not analysed using statistical tests and so a power calculation for them was
inappropriate.
Instead, we based our sample size on the secondary objective to identify whether
dietary interventions affect cravings for cigarettes. In the trial by Danielsson
(Danielsson et al., 1999) the difference in cravings for cigarettes at week +2 was
mean 1.6 in the control and mean 1.1 in the VLCD group with a standard deviation of
0.7.

125
Table 17. Schedule of measurements during DEMIST
Treatment week -2 -1 0 1 2 3 4 5-7 8 - 10 12 26 52
Baseline Questionnaire (with Fagerstrom Score)
√
Seven day food diary √
Weight √ √ √ √ √ √ √ √ √ √ √ √
Waist/Hip ratio √ √ √ √ √ √ √ √ √ √ √ √
Blood Pressure √ √ √ √ √ √ √ √ √ √ √ √
Smoking Status √ √ √ √ √ √ √ √ √ √ √ √
Urinary ketones
√ √ √ √ √ √
Fasting Blood test √ √ √ √
Lung function √ √ √ √
Russell Standard √ √ √ √
QOL measure
√ √ √
Confidence in trial arm
√ √ √
Body composition
√ √ √ √ √ √ √ √ √ √ √ √
Daily Diaries (MPSS & HCS)
√ √ √ √ √ √
Weekly Diaries (MPSS & HCS)
√ √ √ √ √ √
HCI
√ √ √ √

126
The control in the Danielsson trial was a standard (not individualised) 1600kcal
diet, a moderate energy restriction, likely to lead to increased hunger. We were
looking to detect a difference of the same magnitude between our hungry (IDAP)
and not hungry (control) or hunger suppressed (VLCD) groups. Using Epicalc with
80% power and a type one error rate of 5% we needed 30 participants in each
group and 90 in total to detect a significant difference between them. For sufficient
power to detect a difference in an abstinent subgroup, assuming a 60% abstinent
rate in the first few weeks, we aimed to recruit 42 in each group.
Such a trial would be large enough to differentiate between dietary changes that
reflect a poor to a healthy diet using a dietary index, this is based on the figures by
Freisling et al. in 2009 who validated a food frequency index using values of <32
and >39 for a poor and very good diet respectively. With a standard deviation of
5.7, 10 people were needed in each arm of our trial to detect a similar difference.
Running a larger trial to identify long term effects on abstinence and weight was
premature at this stage, although we carried out all the measurements that would
be needed in such a trial to assess feasibility.

127
3.6. Randomisation
Randomisation was computer generated by an independent statistician within the
Primary Care Clinical Research and Trials Unit (PCCRTU) using random
permuted blocks of length 6, stratified by practice. The numbers were entered into
the trial database by an independent computer programmer within the trials unit.
The database concealed randomisation until after participants were screened and
entered into the trial. At week -3 the nurses clicked on the randomisation tab in the
database and this revealed the arm to which the participant was allocated. The
database was set up so that the randomisation „tab‟ would not work until all data
from week -2 was complete. Therefore, it was impossible for anyone to see
treatment allocation beforehand. This greatly minimised any risk of the trial
randomisation being undermined.
3.7. Analysis and statistical methods
Semi-structured interview and focus group transcripts were coded according to
content. Common themes regarding acceptability and feasibility were identified.
Quantitative measures of acceptability were presented as descriptive statistics.
Outcomes (including smoking abstinence, weight, dietary change) between the
three arms of the study were compared using statistical tests on adequately
powered measures. Descriptive statistics (mean, SD and 95% CI) were presented

128
on underpowered measures. Analysis of completer data allowed us to determine
efficacy of interventions if they were taken as planned. Intention to treat analysis
allowed us to determine pragmatic effects of these interventions if they are used in
clinical practice.
Multilevel modelling based on the Piasecki model of cigarette withdrawal (Piasecki
et al., 2003) was used to investigate the effects of the dietary interventions on
urges to smoke during the first four weeks of quitting. We investigated whether
these effects were mediated by hunger and food craving score (HCS) and ketosis.
We adjusted for confounding variables e.g. active treatment for depression.
Analysis was carried out on all those who continued to try to quit regardless of
lapses to smoking and this was adjusted for in the model as described above.
Significance was set at the 5% level, 95% confidence intervals and exact p values
were given where appropriate.
Analysis of data from treatment stage 1 was undertaken once every participant
has completed this stage. Analysis from treatment stage 2 and follow-up at 6
months and one year was planned to be undertaken once participants had gone
through each of these stages.

129
Trajectory of change in outcomes, e.g. weight change over time, was investigated
using multi-level modelling and the effects of trial arm and smoking status were
tested.
3.7.1. Data Validation
Data cleaning took place by a series of logical checks on the electronic data. (For
example, a person cannot be recorded as prolonged abstinent smoker at six
months if they were not in such a state at 8 weeks). Discrepant records were
checked with the source documents and the database amended as necessary.
3.8. Trial schedule
One Doctoral researcher was principal investigator and supervising dietitian. Part-
time support was provided by practice research nurses and research
administrators.
Recruiting was planned to continue over a period of one year until sufficient
participants were treated in each trial arm. Follow up took place as described and
it was estimated that the trial would be complete two years from the start.

130
3.9. Definition of end of trial
The end of the trial was defined as the final 12 month follow-up where the last
measurement was taken from the last participant and the last participant
undergoing the trial was debriefed.
3.10. Value of results
The results from this study were to provide new information about dieting during
smoking cessation. Their aim was to inform the design of a multi-component
intervention that tackles both smoking cessation and its related weight gain in a
way which can be rolled out into the NHS.
3.11. Assessment of safety
Potential participants‟ safety was ensured by screening for eligibility using a
structured form completed by the trial nurses. This recorded evidence of eligibility
and that the person did not have any exclusion criteria. In addition, the nurses
took a general medical and drug history to assess for other complicating diseases.
Any queries remaining as a result of this process were resolved by discussion
between the trial nurse, chief investigator and the relevant physicians providing
routine medical care, usually the participant‟s GP. Such concerns are unusual but
not rare. Typically, they arise from a participant‟s hazy knowledge or
understanding of their past medical history and are usually readily resolved. No
blood or further medical testing was necessary to ensure safety.

131
3.11.1. VLCDs
Very low calorie diets are a recognised treatment for obesity. They form part of the
NICE (2006) guidelines for the management of adult obesity and are advised for
up to three months of continuous use in people with a BMI>30. We used it for 5
weeks only in people with a BMI>25. Weekly monitoring of weight meant that if
BMI fell below a healthy level treatment was be discontinued. VLCDs have been
used safely for many years including in people with a BMI between 25 and 30
(RTSG, 2002). Since 1987 they have been subject to the regulations of the
Committee on Medical Aspects of Food (COMA, 1987). This is an extensively
researched evidence based document detailing the formulation of VLCDs to
ensure safety. The product used in this study complied with these standards.
Thus, there was every reason to expect that treatment in this trial was safe.
Participants were warned about the side-effects of VLCDs and could contact the
trial team to discuss any concerns. To this end, all participants were given a credit-
card-sized card with the trial team‟s contact details, this allowed participants to
receive advice on the VLCD or report perceived serious adverse effects and
receive advice as required. They were asked to carry this card with them at all
times so that it could be used to notify medical personnel of a participant‟s
treatment (and the likely presence of urinary ketones) and trial involvement in case
of emergency. Participants recorded the occurrence of side-effects of VLCDs as
specified by completing a checklist. The checklist was given to the trial nurse who
enquired about recorded adverse events, to determine the severity of any adverse
event and ensure that appropriate advice was given for its management (e.g.

132
drinking appropriate amounts of water to treat symptoms of mild dehydration.)
Minor adverse reactions were monitored and managed in this way. For each
known side effect listed in the checklist, the trial nurse had a definition of clinical
severity. Any side effect that was classified as moderate or severe was reported to
and discussed with the principal investigator. A decision on stopping therapy was
made with the participant, attending nurse, principal investigator and other
relevant parties as appropriate (Appendix 27).
3.11.2. Dietary and Lifestyle Advice
Healthy dietary and lifestyle advice was individually tailored to create a mild
energy deficit and gentle increase in activity. Appropriately trained nurses gave
this advice. It is usual practice and considered very safe. In the unlikely event of
side effects participants could contact the trial team to discuss any concerns. To
this end, all participants were given a credit-card-sized card with the trial team‟s
contact details to allow participants to report perceived serious adverse effects
and receive advice as required.
3.11.3. NRT Patches
NRT has been investigated in several hundred previous clinical trials and is widely
prescribed worldwide and subject to safety monitoring. It was replacing a product,
nicotine, which the participants were already consuming and will have consumed
for many years in cigarettes. Thus, there is every reason to expect that this
treatment in this trial is safe. Participants were warned about the side-effects of

133
NRT and advised not to stop taking the medication without consulting with the trial
team or an NHS professional if the trial team were unavailable. Participants
recorded the occurrence of side-effects of medication as specified on the
summary of product characteristics (SPC) for all relevant NRT preparations, by
completing a checklist. The checklist was given to the trial nurse who enquired
about recorded adverse events, to determine the severity of any adverse event
and ensure that appropriate advice was given for its management (such as
rotating the patch site or use of emollients for skin reactions). Minor adverse
reactions were monitored and managed in this way. For each known side effect
listed in the SPC, the trial nurse had a definition of clinical severity (Appendix 28).
For example, a mild skin site reaction to the patch was defined as burning
sensation that did not interfere with normal activities, redness or swelling at the
site of application, or mild blistering. Any reaction beyond that was classified as
potentially moderate or severe and was reported to and discussed with the
principal investigator. A decision on stopping therapy was then made with the
participant, attending nurse, principal investigator, and other relevant parties as
appropriate. Nicotine has a short half-life (2 hours), meaning that the blood
concentration does not build up during the course of treatment so that new side-
effects were not expected after the first few weeks. In addition, reactions to it
relate to local use, such as skin discomfort from patches and people become
accustomed to the side-effects after a short time of using the preparation. The
advice given depended upon the severity of the reported reaction and those with
moderate reactions were invited to an ad hoc consultation.

134
The SPCs for the relevant NRT products contain no warnings about serious
adverse reactions except rare allergic reactions, such as angioedema, and cardiac
arrhythmias, occurring in less than 1/1000 users. Thus we expect no or very few
suspected unexpected serious adverse reactions (SUSARs) in this trial.
3.11.4. Salbutamol
Salbutamol has been thoroughly investigated in clinical trials and is widely
prescribed worldwide and subject to safety monitoring. Thus, there was every
reason to expect that its use in this trial was safe. Common side effects to
salbutamol are mild (e.g. headache, tremor) and rare with small doses; severe
reaction is very rare. Any reaction tends to be immediate. Participants were
warned about the side-effects of salbutamol and asked to give verbal consent to
taking it. They took a small dose (200mcg) in the company of a nurse and were
given a contact number should they experience any adverse events in the hours
that followed. This was administered four times during the year, at baseline, 12
weeks, six months and one year. For each known side effect listed in the SPC, the
trial nurse had a definition of clinical severity (Appendix 29). Any reaction beyond
that was classified as potentially moderate or severe and was reported to and
discussed with the principal investigator. If a person had side-effects potentially
related to salbutamol then they were not given salbutamol at the next visit.
3.11.5. Reporting of adverse events
The long history of use in and outside of trials for NRT and salbutamol meant that
SUSARs were unlikely. On the reverse of the trial card giving the contact number

135
for advice on side-effect management, there were instructions for reporting of
serious adverse events (SAEs) (Appendix 30). Through direct contact from the
participant or contact from their attending physician, we became aware of serious
adverse events. When any member of the trial team became aware, they informed
the principal investigator within 24 hours. The principal investigator assessed the
seriousness, causality, expectedness and severity of the adverse effects. An
immediate decision was made on the interim use of medication for that participant.
If an event was judged severe, it was reported to the trial sponsor, who report the
event to the research ethics committee (REC). Definitions of adverse events (AEs)
are contained in Appendix 30.
Participants were asked weekly to report intercurrent illnesses and the response
was recorded. If any of these intercurrent illnesses contra-indicated salbutamol,
NRT, VLCD or healthy dietary advice, this was immediately reported to the
principal investigator and a decision made about continued use.
3.12. Ethics and Research Governance
The trial was conducted in compliance with the principles of the Declaration of
Helsinki (1996), the principles of the International Conference on Harmonisation
(ICH) - Good Clinical Practice (GCP) and run in accord with EU Clinical Trials
Directive and all of the applicable regulatory requirements. The study protocol and
other documentation was approved by South Birmingham Research Ethics
Committee (Appendix 31), Birmingham and Black Country Comprehensive Local

136
Research Network and West Midlands South Comprehensive Local Research
Network (example in Appendix 32). Protocol amendments were submitted to the
REC for approval and the other bodies when necessary (example of approval in
Appendix 33). We complied with ICH-GCP Guidelines over the reporting of
adverse events (AEs), serious adverse events (SAEs) and suspected unexpected
serious adverse reaction SUSARs. In addition, we provided the REC with progress
reports as well as a copy of the final study report.
3.13. Data management, protection and confidentiality
The trial was run as part of the portfolio of trials in the Primary Care Clinical
Research and Trials Unit (PCCRTU), NIHR accredited trials unit number 33, in
Primary Care Clinical Sciences at the University of Birmingham. The data
management was run in accord with the standard operating procedures (SOPs),
which are fully compliant with the Data Protection Act and ICH GCP. The trial was
registered with the Data Protection Act website at the University of Birmingham.
Participant identifiable data was shared only within the clinical team on a need-to-
know basis to provide clinical care and ensure good and appropriate follow up.
Participant identifiable data was shared with their general practitioner and
approved auditors from the REC or NHS Research & Development (R&D) as was
necessary. Otherwise, confidentiality was maintained and no one outside the trial
team had access to either the case report forms (CRFs) (Appendix 34) or the
database. The source documents for the trial were CRFs which were stored in a
locked cabinet at the participating practice. The trial database was securely held

137
and maintained by the PCCRTU. On completion of the trial and data checking, the
CRFs were transferred to Modern Records, a secure archiving facility at the
University of Birmingham, where they are held for 15 years and then destroyed.
The database was anonymised and a secure compact disk containing the link
between ID number and participant identifiable information was stored in Modern
Records.

138
4. FEASIBILITY AND ACCEPTABILITY OF THE DeMiST TRIAL
4.1. Introduction
The primary objective of DeMiST, as described in chapter three, was to investigate
the feasibility of running a trial to investigate the most promising dietary
interventions identified in a Cochrane review (Parsons et al., 2009) to prevent
smoking cessation related weight gain. These were individual dietary and physical
activity planning (IDAP) and a very low calorie diet (VLCD) which we compared
with a control intervention of usual care; this was Stage 1 of the trial. Stage 2
included delivery of IDAP to both the control arm and the VLCD arm for reasons
discussed in section 3.1.4.
The main reason for a feasibility trial was to prepare for a trial large enough to
provide evidence of beneficial effects on weight and smoking abstinence in these
interventions compared to usual care. No trial has yet compared all three options
and no trial has examined the feasibility of these specialist interventions in nurse
led clinics, typical of NHS stop smoking services. A commentator on the
Danielsson trial of VLCD doubted that the intervention could be delivered in usual
clinical settings (Jones K, 1999).
We measured the response and recruitment rates. We assessed the acceptability
of each of these interventions to participants and investigated attrition rates and
reasons behind these. We explored the feasibility of training nurses to deliver

139
these interventions in primary care clinics. For clarity we have dealt with each of
these aspects of feasibility in three separate sections each with their own
methods, results and conclusions. This chapter therefore meets objective four of
the thesis: to report on the feasibility of running DeMiST, including discussion of
recruitment rates and experiences of the participants (Chapter 4).
4.2. Response and recruitment rates
4.2.1. Methods
As described in chapter three, (section 3.4.1) we measured rates of response to
participant invitation letters and posters, we measured rates of recruitment at
telephone screening, and at first consultation. This included a count of drop out
prior to and post randomisation in each trial arm, which reflected attendance rates
at visits.
In an effort to improve our recruitment rates we amended our recruitment
strategies in several ways. However, we had to consider the following limitations:
Location
We had to stay within Birmingham East and North (BEN) and Worcestershire
Primary Care Trusts (PCTs) to run the trial as they had funded the excess
treatment cost of the VLCD formula up front.
Timescale
We only had another six months in which to meet our recruitment target in order to
complete the trial in time

140
Finance
We had only budgeted to run one training course for our research nurses.
4.2.1.1. Recruitment improvement strategy 1
Therefore, we first tried to increase recruitment within BEN PCT, as there was one
of our trained nurses available to cover this. We needed to target more people
from more general practices to boost our recruitment rates quickly. The general
practice participating in the trial refused to allow our research nurse to see
participants from other practices on their premises for insurance reasons.
However, we were able to use a room at the PCT run health centre, and one of
our trained nurses had spare capacity to work locally as a bank nurse here. We
did not have the facilities to run routine blood tests at the PCT so we amended our
protocol and obtained further ethical approval to use skin prick measures instead.
We also amended our protocol to allow us to advertise more widely, which we did
by placing flyers and adverts in local newspapers (Appendix 35). Flyers inside
newspapers were distributed to 9000 homes and an advert in a newspaper went
to another 2000 homes.
In addition to widening the geographical area for recruitment we also widened the
inclusion criteria. We no longer excluded those who were unsuitable for a VLCD
and we opened the trial to all smokers, regardless of BMI, this meant we were
effectively running two trials, side by side. DeMiST 1, which used the original
exclusion criteria, and randomised participants into three arms and DeMiST 2
which independently randomised participants into either the SBS or the IDAP arm.
Although we would not increase recruitment into the VLCD arm by doing this, we

141
hoped to increase numbers in the other two arms sufficiently to meet the sample
size to compare those two arms. Without the strict exclusion criteria, this trial was
now suitable for most smokers regardless of their BMI, energy prescription
protocols were amended to prevent weight gain without achieving weight loss in
those with a BMI <25kg/m2 (Appendix 36). Broadening the inclusion criteria made
it more suitable to advertise the trial to the general public. We anticipated a large
response and so fewer screening criteria also improved the ease of initial of
telephone screening.
4.2.1.2. Recruitment improvement strategy 2
Our final attempt to boost recruitment was to adapt a method previously used in
Nottingham. This had demonstrated recruitment into the NHS stop smoking
service could be enhanced from 5% to 30% by first offering a telephone
consultation with a stop smoking advisor (Murray et al. 2008). We amended our
protocol to do this and sent out the first 100 letters containing a questionnaire,
stamped addressed envelope and an offer of a consultation (Appendix 37).
4.2.2. Results
4.2.2.1. Original recruitment strategy
Three family practices in the West Midlands (Bromsgrove, Redditch and Sutton
Coldfield) identified 1892 potential participants through electronic searching of
their databases using search criteria of „current smoker‟ and „BMI above 25kg/m2

142
or BMI unrecorded‟ as per protocol. After the research nurses and general
practitioners (GPs) checked these records for exclusion criteria, 68% were
suitable and invited to participate in the trial. Of those unsuitable no specific
reason was given by the practice in 44% of cases, although most of these were
from one practice which reported significant difficulties searching their database.
The other practices reported that 37% of participants were medically unfit to follow
the VLCD or on medication that would require adjustment, beyond the scope of
our research nurses (Figure 7).
It took nine months to negotiate with the PCTs, obtain NHS permission to run the
trial at these sites. It took a further five months to recruit the three general
practices and train our research nurses. Over the following six months these three
practices yielded 32 respondents, of which 14 were randomised into the trial. Most
of the other responders did not enter the trial because they dropped out without
giving a reason or they were not willing to be randomised to the VLCD (Figure 7).
4.2.2.2. Recruitment improvement strategy 1
We had two responses (Figure 7) and one new recruit from advertising with flyers
through the newspaper. The cost of advertising in this was £1000.
Widening our exclusion criteria allowed us to carry out a second more inclusive
search of the general practice databases. However, after initial poor recruitment
only one of our practices was willing to carry out a second search, we sent out 100

143
more letters and received one response. Therefore, overall 33 out of 1282 (2.6%)
potential participants who received a letter (original recruitment strategy plus
improvement strategy one) telephoned the research office. With
the addition of newspaper advertising we were able to bring the total of
responders up to 35 (2.7%) (Figure 7).
4.2.2.3. Recruitment improvement strategy 2
We received two responses both of whom were unsuitable for recruitment as they
had already stopped smoking.
At this point, it was apparent that we could no longer recruit our original target
sample size within the timeframe of writing up this PhD, so we closed trial
recruitment.

144
Figure 7. Flowchart of participants through demist from identification of potential participants to numbers who completed trial

145
4.2.3. Discussion
It took us 15 months to recruit two PCTs, three general practices and randomise
16 people into DeMiST. The response rate from GP letters was 2.6% and the
overall recruitment rate from all our efforts was 1.2%. This recruitment rate was
less than our estimates which were based on a local weight loss trial which
recruited 10% of those invited to take part by GP letter (Jolly et al., 2011).
Based on our recruitment rate to meet our minimum sample size of 90 we would
have needed another 15 months, 17 general practices, with two full time nurses to
travel and cover these clinics. This was beyond our resources.
We have demonstrated that recruiting into a trial which offers help to control
weight together with smoking cessation is very difficult. This was unexpected
given the anecdotal evidence that many smokers are concerned about weight gain
and ask stop smoking advisors for help control it.
4.2.3.1. Potential reasons for poor recruitment
Our results show that at least 37% of those who were identified as smokers with a
BMI over 25Kg/m2 could not be invited to take part because of the exclusions due
to using a VLCD in this clinical environment. In addition, 16% of those who wanted
to take part, when it came to signing up, were unwilling to be randomised to the
VLCD. Therefore, use of a VLCD, a drastic weight loss measure, was one reason

146
that limited our ability to recruit but it did not account for all of the difficulty we
experienced.
The poorest response to recruitment seemed to occur at the point of GP invitation
and newspaper advertisement. It seemed that there was very little interest in this
particular study and this may have been for the following reasons:
4.2.3.1.1. Poor marketing
We need to consider whether the invitation letter and flyers were insufficiently
captivating to generate interest. However, we modeled our invitations on materials
that had previously resulted in good recruitment into stop smoking trials. The main
difference was the added element of weight control.
4.2.3.1.2. Weight control during smoking cessation
Perhaps weight control during smoking cessation is more of an excuse for not
quitting rather than a true obstacle. This may mean that when smokers are offered
this help they do not accept it and choose to continue smoking. Indeed evidence
from trials and cohort studies suggests that the impact of weight concern on quit
attempts is conflicting as we have discussed in chapter one (section 1.4).
Perhaps smokers consider weight control during smoking cessation too
insurmountable a task to attempt it. Perhaps the message from the NHS, that

147
smokers should stop smoking first and not tackle weight at the same time,
overrides the desire to do so. However, surveys of smokers do not seem to
support this. In addition, other studies in other countries, such as those cited in a
Cochrane review (Parsons et al, 2009), have had a good recruitment form
advertising for such studies.
4.2.3.1.3. The target population
The problem may therefore lie in the population from which we were trying to
recruit. We were „cold calling‟ in an area with easy access to stop smoking
services, so many of those keen to take such an opportunity may have already
done so. The resulting population may have been the „hardened smokers‟ who are
either complacent about their smoking and weight or, after repeated failures, have
given up attempting to change their habits.
4.2.3.2. Potential solutions to poor recruitment
We did try to widen our inclusion criteria by running a trial without the VLCD
element and this remains an option to improve recruitment, however by the time
we did this some of our practices had become so disillusioned with the poor
recruitment rates that they pulled out of the trial. However knowing the difficulty of
recruiting into a VLCD trial means this may mean it is not feasible to use in a
future trial within stop smoking clinics.

148
Engaging individuals with research is notoriously difficult and ways to improve
recruitment be it through marketing strategies or tailoring it to specific „hard to
reach‟ communities has been the subject of much research. A Cochrane review
(Treweek et al, 2010) reviewed studies investigating ways to improve recruitment
into randomised controlled trials. It reported that the most effective strategies were
telephone reminders to discuss the trial with those who had not responded to the
original invitation to participate. This increased the chance of recruitment more
than 2 ½ fold (RR 2.66 95% CI 1.37, 5.18). Secondly using an „opt out‟ rather than
an „opt in‟ procedure, for example, notifying participants that they will be called
regarding the invitation to take part unless they request otherwise, increased
recruitment by 37% (RR 1.37, 95% CI 1.07, 1.84). However an „opt out‟ procedure
is ethically controversial.
If we used telephone reminders to GP letters in a future trial we could potentially
increase the number we randomised into this trial, over the same time period, from
15 to 40 individuals. This would come at the additional cost and labour of making
at least 1249 phone calls, but this is likely to be considerable less cost per
participant than the rate of recruitment we got from the newspaper flyers.
We still need to bear in mind the added challenge of attempting to engage
smokers in changing two health behaviours simultaneously. This may mean that
realistically we cannot achieve a better recruitment rate than this. One option is to
accept that recruiting for such a trial will yield a smaller return for the time,
advertising costs and labour required than other trials. Budgeting for this

149
adequately in future trials would be one solution but with scarce resources of
funding bodies this may not prove possible.
Another option is to recruit from a population who were already planning a quit
attempt. For instance, we could attempt to recruit on entry to the stop smoking
services, rather than cold calling from the GP population of eligible smokers. A
trial in Scotland in stop smoking groups successfully randomised 90% of their
smokers entering the service into a nutrition education programme that ran
alongside it (Hankey et al., 2010).
In designing DeMiST we had considered running group sessions to maximise
recruitment in a short space of time, this was contained in an earlier version of the
protocol (Appendix 38) for which we gained ethical approval. However this was
labour intensive and required further funding. We applied to the NIHR Research
for Patient Benefit stream for this. However, our application was rejected and the
feasibility of running groups was questioned (Appendix 39) and so, in
consideration of reviewers comments, we substantially amended our protocol and
ran the trial as reported in this thesis.
4.2.4. Conclusion
Recruitment from GP invitations and newspaper flyers into a three armed
randomised controlled trial of dietary interventions to prevent weight gain during
quitting smoking was poor in a population with easy access to NHS stop smoking

150
services. Recruitment may be improved somewhat by avoiding the use of a VLCD,
and offering telephone reminders, but the additional time and resources that would
be needed may prove too expensive to be feasible. However recruiting from those
already intending to quit and attending the stop smoking services offers a
potentially viable alternative.
4.3. Acceptability to participants
4.3.1. Methods
We investigated participant acceptability of trial arm qualitatively by semi-
structured interviews. The interviews were conducted by telephone; evidence
suggests that well planned telephone interviews can gather the same material as
those held face to face (Sturges et al, 2004, Taylor et al, 1998). They are less
intrusive, which may be particularly useful to engage with those who dropped out
of the programme, and they do not require payment of travel expenses.
Interviews were conducted after the participant had completed treatment or
dropped out of the programme. Participants could not be interviewed before this
time point in case the interview influenced their views of the trial or the intervention
being delivered.
Participants were asked to discuss what they found helpful and unhelpful with
regard to the intervention they received. What did they attribute to their success or
abandonment of an intervention? To draw this out we asked the following open

151
ended questions: What did you expect to get from taking part? What did you
actually get from taking part? What, if anything disappointed you? How would you
have liked things done differently? If you needed to try things again what would
you do? How did you get on with quitting? (What worked well? What was hard?)
How did you get on with the dietary side of things? (What worked well? What was
hard?) How do you feel about your smoking status now? How do you feel about
your weight now? If you pulled out of the trial early, why was this? (Appendix 40
contains the interview schedule) To help participants remember their thoughts and
feelings „of the moment‟ they were given the questions they would be asked, with
space to jot down notes, during the trial. Interviews lasted 10 to 20 minutes.
With participant consent, the interviews were audio recorded and transcribed
intelligent verbatim (words such as „um‟ were not transcribed). Audiofiles were
outsourced for transcription to Type Research, a recommended transcription
service for qualitative research. The data was analysed thematically, as
discussed below, so that comparisons could be made within and across the
interviews, and the views participants held towards particular issues, e.g. the
intervention they received or preventing weight gain whilst quitting smoking, were
highlighted.
4.3.1.1. Sampling
We had hoped, as described in the protocol (chapter three, section 3.4.1), to
obtain a wide set of experiences within each trial arm. We wanted to include all
152
aspects of attrition, for example, those who completed the trial, and those who
dropped out of quitting, dieting or both. We wanted gain maximum variation in
relation to gender, age, socio-economic background, ethnicity, smoking rate and
research site. We wanted to sample until theoretical saturation was reached and
to do so purposively. However due to the small sample size and the unwillingness
of some people to be interviewed, we interviewed all those who were willing, and
ended up with a convenience sample.
4.3.1.2. Analysis
We carried out a thematic analysis that was informed by the five stage framework
approach described by Pope et al in 2000. However, it was not a full framework
analysis as we did not want to test an „a priori‟ concept or framework. We wanted
to deduce solely from the participants themselves the experiences they found
helpful and those they did not. As described by Lacey and Luff in 2007 there is no
one way to analyse qualitative data but rather a considered approach which best
answers the research question must be taken (Lacey & Luff, 2007).
Our analysis contained the following steps:
4.3.1.2.1. Familiarisation
We immersed ourselves in the data by listening to the audio recordings, reading
and re-reading transcripts (Pope et al, 2000).

153
4.3.1.2.2. Coding/Indexing
We reassembled fractured discourse by pulling together scattered responses to
questions from wherever they came in the transcripts. For example where an
earlier question was expanded on later in the conversation, this was cut and
pasted together as an expanded chunk of conversation. Then we coded the
content of these responses, our codes were identified predominantly from „in vivo‟
words, group of words, sentences, or paragraphs from the transcripts (Lacy and
Luff , 2007) that described a particular positive or negative experience of the trial.
Each new code was highlighted using a different coloured pen (Lacy and Luff ,
2007).
We included both literal and interpretative coding and considered reflexively
whether interviewer prompting or empathy could have led the response or
changed it over time (Swift and Tischler, 2010).
We did not carry out a discourse analysis (coding for signs to latent meanings),
this went beyond the scope of the PhD. Instead we noted where content appeared
particularly emotive, or aspects were stressed repeatedly and it was intuitively
clear that opinion was strong or contradicting of itself.

154
4.3.1.2.3. Identification of themes
We then grouped our codes into broader themes and sub themes (Lacy and Luff,
2007). We did this in Microsoft Word by cut and pasting quotes and/or their codes
into sub themes under the heading of a broader theme. We took care to keep the
quote linked to the participant identifier. An example of the worksheet for the
development of negative themes and subtheme from quotes/codes is contained in
appendix 41.
4.3.1.2.4. Charting themes by trial arm
We then developed a matrix of themes and subthemes according to trial arm to
observe the similarities and differences between them. We took note of the
presence or absence of any links to trial outcomes. Throughout the process we
kept the data of responses linked to the individual who gave them.
4.3.1.2.5. Interpretation
Finally we considered whether the most acceptable and least acceptable aspects
could be defined by trial arm or by the characteristics or typologies of participants
(Lacy and Luff, 2007).
A selection of codes and themes were peer reviewed for credibility purposes. A
colleague reviewed a transcript and comparsion was made between the two sets
of codes identified by different researchers from the same transcript. Ongoing
discussion with other qualitative researchers regarding the development of

155
themes, particularly given the context in which codes were identified within
transcripts, also took place.
4.3.2. Results
4.3.2.1. Baseline Characteristics
We carried out semi-structured interviews on 13 participants, baseline
characteristics are shown in Table 18.
4.3.2.2. Hindering factors
Seven main themes, each with subthemes, emerged which described what
participants found unhelpful or hindered their success at weight control or stopping
smoking. These are listed in Table 19 and how these were developed can be
found in Appendix 41. , some aspects were common to all trial arms and others
were specific to individual trial arms. We have expanded key themes in the text
below and substantiated these with quotes.
Mean (SD)
n 13
Age (years) 50 (11)
Cigs/day 24 (8)
Fagerstrom score 5.3 (1.7)
Weight (kg) 83.2 (10.8)
BMI (kg/m2) 30.80 (5.41)
SBS 46%
IDAP 23%
VLCD 31%
Gender (% female) 77%
Table 18. Baseline characteristics of DeMiST participants engaging in semi-structured interviews

156
Theme Trial arm
Sub theme VLCD IDAP SBS
Displeased with trial arm allocation Unreasonable* X Did not address weight adequately* X
Diet fell below expectations Taste* X
Food choice* X X (Stage 2 only)
Thought knew better* X X (Stage 2 only)
Hunger X X
Portions X (Stage 2 only)
Feeling unwell X
Perceived lack of support Not frequent enough* X
Negative rather than a positive approach* X
Feeling alone* X
Wanting peer support* X X
Wanting more psychological therapy* X X
Disappointed with self Low self-worth*
X
Inability to stop smoking* X X
Socially difficult For diet X X
For smoking X X
Personal circumstances Inconvenient appointments* X X X
As a reason for limited success X X X
Difficulty of task A sense of loss of coping mechanism* X X X
Tackling both smoking and weight at the same time* X X
Could only focus on diet X
Could only focus on smoking X X
Stopping smoking X X
Getting out of the habit/changing routines X X X
Mood changes* X
Something to do with your hands X
A sense of loss of identity* X X X
*some participants who reported these difficulties also dropped out of the trial early
Table 19. Themes and sub-themes of difficult experiences during DeMiST, according to trial arm

157
4.3.2.2.1. Displeased with trial arm allocation
There was dissatisfaction with trial arm allocation in both the VLCD and SBS
arms. The VLCD evoked an emotive response:
“I was allocated in to that stupid powder stuff...I think it is totally unreasonable to ask somebody to...eat that stuff” Male on VLCD, abandoned VLCD after 3 days, stopped smoking for 5 weeks, did not complete programme.
this was linked to the taste of the Lipotrim formula
“ surely in this day and age somebody can make that food taste better than it tasted...” Male on VLCD, abandoned VLCD after 3 days, stopped smoking for 5 weeks, did not complete programme.
In the SBS arm participants expressed both mild disappointment
“I would have preferred...” Female, quit, weight gain in Stage 1, weight loss in Stage 2.
and strong objections
“I was absolutely gutted...” Female, SBS, left at week +9 smoking no weight loss.
to being allocated the SBS arm. This was because weight was not being
addressed adequately or soon enough, some even felt cheated
“that was one of my major reasons…was the weight as well and to be told that oh
no, just carry on as you are for a few…more weeks,” Female, SBS, left at week
+9 smoking no weight loss.
“I found it a bit of a misnomer really thinking I was going to give up smoking I
mean I understand with the trial but I did honestly expect some sort of assistance with the diet side I didn‟t really expect to be just left to get on with it.... I think I was a little misled on that score.” Female, SBS, temporarily stopped smoking, dropped out of programme before diet given in Stage 2.
One particular participant was so dissatisfied that they could not adhere to the
programme:

158
“I didn‟t really fully go with the trial if you like, because I did start cutting back on some sort of food in that first 8 weeks because I was not prepared to put a stone on.” Female quit smoking, resorted to dieting during SBS Stage 1.
No participants reported any dissatisfaction with being randomised into the IDAP
intervention.
Therefore although at the time of consent participants agreed to randomisation, it
was clear that while participants were willing to take a chance, they had strong
individual preferences, and these were linked to acceptability of the programme.
“ I know the programme said you haven‟t got a choice...I was hoping and praying that I, on which one I would be allocated to and when, when I got one I was disappointed anyway but when I tried eating it, crikey, you know, it went downhill after that.” Male on VLCD, abandoned VLCD after 3 days, stopped smoking for 5 weeks, did not complete programme.
4.3.2.2.2. Diet fell below expectations
In all the trial arms, there were those for whom the diet fell below expectations,
this was caused by difficulty in a number of areas. Firstly, in the VLCD arm the
taste and smell of the formula was a problem. For some this led to them
abandoning the diet
“Absolutely vile it was – I couldn‟t...I even like I was nearly sick just even smelling it” Male on VLCD, abandoned VLCD after 3 days, stopped smoking for 5 weeks, did not complete programme.
Whereas others continued despite this, when probed as to whether it improved
one response was:
“No, every single one of them was revolting!” Male, VLCD, lost weight, reduced smoking, did not quit, did not complete programme.

159
Initial hunger and feeling unwell was also a problem in the VLCD arm. The
reasons behind continued adherence despite these difficulties are explored in
section 4.3.2.4.
In the IDAP arm and Stage 2 of the SBS arm diet fell below expectations of some
with respect to food choice,
“I mean, I thought... the options that were recommended were clearly restrictive and not very imaginative [interviewer probed further]... more or less the same the everyday”. Female in IDAP, stopped smoking for 8 days, lost weight, did not complete programme
Hunger was also a problem in the IDAP arm. Other participants did not like to be
told what to do, they thought they knew how to do these things better themselves:
“I won't lie, I love pasta and rice [large portions] and I don‟t particularly like measuring cups of vegetables, you know if I want a plate full of vegetables I like a plate full of vegetables. I have to say...” Female in SBS, quit, weight gain in Stage 1, weight loss in Stage 2.
It is important to note that these themes ran through IDAP and SBS (where IDAP
was received in Stage 2), but there was no dissatisfaction with IDAP in Stage 2 of
the VLCD arm. It is possible that disgruntlement was due to disappointment in trial
arm allocation and not just to the nature of IDAP. In particular, it was interesting to
note that one individual who initially was rather angry with both allocation to SBS
and the Stage 2 diet on further probing did in fact change her mind:
“I probably will [use the cups], I'd use them for like, cos I was amazed when I did go on the diet that the nurse gave me after 8 weeks that the portions are really, really small so I'm trying, I am aware of the portion size because of what you've given me. It has been quite positive yeah there's only that little minor negative that, about the whole situation.” Female quit smoking, resorted to dieting during SBS Stage 1.
Whether probing encouraged the participant to reflect on opinion and establishing
a rapport dissipated anger such that a reasoned opinion was reached; or whether

160
the initial reaction is more in keeping with true opinion is hard to tell. Researcher
belief in IDAP, coupled with clinical skills, which encourage a reasoned, well
informed response to treatment, may have biased this response.
4.3.2.2.3. Perceived lack of support
In the IDAP and SBS arms, but not in the VLCD arm, there was a perceived lack
of support for some, which was related to the desire for peer support:
“I thought I would have liked to have listened to how other people were getting on with their different things, you know and that you know, I think that would‟ve been good.” Female SBS, temporarily stopped smoking, dropped out of programme before diet given in Stage 2.
Also some participants felt they should have received further psychological
support:
“Well something about you know [helps with] feelings of deprivation, if you have any, feelings of not being who you were, feelings of loss...trying to balance that...” Female in IDAP, stopped smoking for 8 days, lost weight, did not complete programme.
Some of these needs may have stemmed from underlying issues which went
beyond dealing with withdrawal symptoms and this was expressed as another
theme about how participants felt about themselves as described below.
4.3.2.2.4. Disappointed with self
For one participant this seemed related to low self-worth:
“I just think I am so stupid and then I get annoyed with myself and then you just think „Oh have a fag‟...the way you think about yourself...you‟re not really that important, so what if you overeat and smoke and pop your clogs, you know.” Female, SBS, temporarily stopped smoking, dropped out of programme before diet given in Stage 2.

161
In the VLCD and SBS arms participants were disappointed in their own ability to
quit smoking:
“I just, just so disappointed you know, I don‟t, no, I can‟t tell you how much disappointed that I couldn‟t stop smoking, you know.” Male on VLCD, abandoned VLCD after 3 days, stopped smoking for 5 weeks, did not complete programme.
4.3.2.2.5. Socially difficult
Participants in the VLCD and SBS arms reported on the social difficulties of
following the diets and those encountered when stopping smoking:
“[I] didn't sit at the table...normally [I] sit and talk.” Female on VLCD, successfully controlled weight and then quit smoking.
“Sticking to it [the diet] because my neighbour across the road bakes cakes, that was hard.” Female in SBS, left at week +9 still smoking, no weight loss.
“So my friend at work who smokes I wasn‟t going outside with her so I wasn‟t speaking much” Female on VLCD, successfully lost weight and then quit smoking.
4.3.2.2.6. Difficulty of task
Many participants in the VLCD and SBS arms described the most difficult thing as
“the giving up”,
this is one participant‟s account of his preoccupation with cigarettes as he tried to
live without them:
“It was just on me mind 24 hours a day and I just could not shake it off, I could not. I couldn‟t wake up in the morning without thinking about cigarettes, I couldn‟t go to sleep at night without thinking of cigarettes and it – I mean, I was, I was just cracking up, I actually couldn‟t, you know, I needed something to block me brain out and, you know...” Male on VLCD, abandoned VLCD after 3 days, stopped smoking for 5 weeks, did not complete programme.
The difficultly of changing diet and stopping smoking at the same time was also
apparent:

162
“there was a difficult period with no food and no cigarettes... it was just almost unbearable.” Female on VLCD, successfully lost weight and then quit smoking.
For some this meant that they concentrated on the weight loss attempt and for
others they focused on smoking cessation:
“that [VLCD formula] started to show effect...I think I put all the effort into that” Female, VLCD, abandoned quit attempt first and so later gave up on diet too and pulled out of programme.
“And to be perfectly honest, because I wasn‟t smoking I thought, well, you know, that‟s what I want [whole tubs of Haagan Das ice cream]...have it” Female in SBS, quit, weight gain in Stage 1, weight loss in Stage 2.
Stopping smoking was perceived as being difficult for a number of reasons, these
were changing moods, which were most apparent in the VLCD arm, and
aggression:
“I felt slightly miserable and like let down with myself” Female VLCD, did not stop smoking or lose weight or complete programme. „my aggression, I was just so aggressive...” Male on VLCD, abandoned VLCD
after 3 days, stopped smoking for 5 weeks, did not complete programme.
One person in the SBS arm mentioned the difficulty of not
“having something to do with my hands.” Male SBS, lapsed intermittently, weight maintained during Stage 1, lost weight in Stage 2.
In all trial arms trying to change habits and routines were difficult:
“the hardest thing has been the habit, routine of having a cigarette,” Female in SBS, quit, weight gain in Stage 1, weight loss in Stage 2.
And there was a sense of loss, a loss of identity:
“...feelings of not being who you were...” Female in IDAP, stopped smoking for 8 days, lost weight, did not complete programme.
And a loss of support:
163
“... feels like a crutch...kind of lost without that” Female on VLCD, successfully controlled weight and then quit smoking.
This loss of support was linked to no longer having a coping mechanism when
circumstances were difficult:
“it was just pressure of work, pressure of life, you know...the pressure of everything just...the pressure really” Male on VLCD, abandoned VLCD after 3 days, stopped smoking for 5 weeks, did not complete programme.
Therefore, despite the dietary interventions, it seems that for many the stopping
smoking that was the main difficulty. For a few this was compounded by being
hungry or trying to control food intake.
4.3.2.2.7. Personal circumstances
In all trial arms there was evidence that personal circumstances made it difficult to
keep appointments (see next section) and achieve outcomes:
“...from a personal point of view I actually found myself in extremely difficult circumstances just after I started and that was the main reason for failure…” Female in SBS, quit smoking, no weight gain (resorted to dieting during Stage 1) did not complete programme.
4.3.2.3. Reasons for and links with attrition
Both participants who did not abandon the treatment programme early and those
who did reported the problems described above (Table 19). Some attributed their
lack of adherence to the insuperability of these problems. When participants were
specifically questioned about their reason for drop out two key themes emerged
(Table 20).

164
4.3.2.3.1. Difficulty in keeping appointments
In all trial arms personal circumstances changed which made keeping
appointments difficult, both the time and frequency of appointments were no
longer convenient. Then once an appointment had been missed participants
became embarrassed to go back to see the nurse or they lost motivation.
“Ahh, I had so much crap at home and also I wasn‟t able to get up to the doctor‟s at half past nine...” Female in SBS, left at week +9 still smoking, no weight loss.
“But it was that that stopped me going back it wasn‟t that it wasn‟t working, it wasn‟t that it wasn‟t very good or that I felt it wasn‟t worth it; it was purely work and hospital commitments...” Male, VLCD, lost weight, reduced smoking, did not quit, did not complete programme. “I popped into the surgery the other day and [she] gave me a wry smile, and I just sort of hid!” Male, VLCD, lost weight, reduced smoking, did not quit, did not complete programme.
The associated loss of motivation may be a key theme here as the inconvenience
of appointment time could have been overcome by changing the appointment
schedule, if motivation was high enough to do so.
4.3.2.3.2. A sense of failure
In all trial arms a participant‟s sense of failure in their own ability to stop smoking,
or their inability to both stop smoking and control weight were also reported as
reasons for leaving the trial early.
“....but I think, as I say, once I knew that I wasn‟t going to quit the smoking then obviously it went downhill pretty quickly...” Female, VLCD unable to maintain weight loss or quit smoking .
“Yeah, I ended up smoking again and I wasn‟t sticking to the diet” Female, IDAP temporarily stopped smoking, lost weight after pulled out of trial.

165
However no one reported abandoning the programme just because they were
unable to control their weight.
Table 20. Themes and subthemes of reason for not completing the trial
Theme Trial arm
Sub theme VLCD IDAP SBS
Difficult to keep appointment Personal circumstances X X Time was inconvenient X Frequency of visits was inconvenient X X Embarrassment X Lost motivation X X
Sense of failure Quit smoking only X X Unable to do both X X

166
Theme Trial arm
Sub theme VLCD IDAP SBS
Pleased with trial arm Enthusiasm/excitement X Satisfaction X X
Weekly support Seeing someone /accountability X X
CO monitoring X X Weight/fat mass/blood pressure monitoring X X
Clear instructions X Discussions, tips to tackle cravings X
Peer support Support from partners/friends X X
NRT Patches Controlled cravings X
Dietary aspects Portion control using cups
X
Cups simple to use X X (Stage 2 only)
Structure X (Stage 2 only)
Increase of fruit and vegetables X (Stage 2 only)
Variety of food X (Stage 2 only)
Lack of hunger X X
Mood stability X
Replacing cigarettes with healthy snack X
Able to continue dietary plan after end of trial X (stage 2)
Evidence of success* Rapid, dramatic weight loss X
Moderate weight loss X (Stage 2 only)
More money X
Smell of smoke gone X
Improved taste and smell X X
Reduction in number of cigarettes smoked X
Eating more healthily
X
Feelings of being in control of smoking X
Feelings of being in control of eating X
Sense of achievement on behalf of family
Sense of achievement for self
Feeling good about self* Encouraged by own success X X
Motivation/determination X X
Timing Lose weight at same time X X
Lose weight after quit X
Preference to lose weight before quit X X X
*strongly overlapping themes Table 21. Themes and sub-themes of helpful experiences during DeMiST, according to trial arm

167
4.3.3.4. Helpful factors
Eight themes with sub-themes emerged that participants found helpful in DeMiST
(Table 21).
4.3.3.4.1. Pleased with trial arm allocation
In all trial arms there were participants that were happy with their allocated
intervention, a quiet satisfaction characterised responses in the IDAP and SBS
arms whereas there was notably more enthusiasm and excitement for some of
those allocated the VLCD:
“I knew that diet was right for me! ...I just knew that that was the only thing that was going to work!” Female, VLCD, lost weight then quit smoking.
4.3.3.4.2. Weekly support
In all trial arms participants said they found the weekly support helpful. Particularly
helpful aspects were accountability (SBS and VLCD) and carbon monoxide (CO)
monitoring (IDAP and SBS),
“...seeing [the nurse] every week knowing that I was gunna have to blow into a thing, knowing that she'd know whether I'd had a fag or not huh, just gave me the incentive to keep going. I mean I did slip a couple of times but I find it a lot easier to get back into stopping smoking knowing that I was being monitored every week.” Female, SBS, quit smoking, gained weight.
Monitoring of CO, weight, fat mass and blood pressure (VLCD and SBS) were
also helpful, not only for reasons of accountability but also, for motivation arising
from fear and shock at health status:

168
“I was actually told exactly what my weight was, my BMI and all those things you know, and I think that‟s quite helpful when you… to look at your… to actually find out what, oh I forget what they called it now, but the volume of … basically in your body. It‟s sort of a bit scary actually when you‟re told that a certain percentage of your body is…[fat] I know it kind of makes you sit up and think.” Female, SBS, initially motivated then could not quit so abandoned diet and programme.
Monitoring was also a source of encouragement:
“[I] saw my blood pressure come down, my carbon monoxide level, the weight come off...” Female on VLCD, lost weight, then quit smoking.
Other helpful aspects of support were the clarity of instructions and the opportunity
to discuss how to resist urges to smoke
“The discussions were very helpful; she was giving me useful tips on how to get around the cravings and getting over the willpower side of things.” Male, SBS, lapsed intermittently, weight maintained during Stage 1, weight lost in Stage 2.
4.3.3.4.3. Peer support
As well as clinical support, support from others was also an important aspect, if
the venture was acceptable to those around the participants then it seemed to be
acceptable to them too:
“Yeah it was a bit hard during the first few days but because I had sort of told all my work colleagues what I was doing, but it wasn‟t „oh where is your food today and why have you got?‟ they were really, really supportive.” Female, VLCD, initially enthusiastic then couldn‟t quit, abandoned diet and programme.
4.3.3.4.4. NRT Patches
Several participants in the SBS arm mentioned the usefulness of the NRT patches
to help control cigarette cravings.

169
4.3.3.4.5. Dietary aspects
In all trial arms, there were various aspects attributed to the diets that participants
found helpful. In the VLCD arm participants were surprised by their lack of hunger
and mood stability
“and I‟ve got to be honest, it did really fill you up, I mean I‟ve been on one of these for… but this, it did fill you up and, you know, I was amazed at that” Female VLCD, lost weight then quit smoking.
“the lack of food...it worked far better than the patches. There were many days when I didn‟t put the patches on at all...[my mood] was more controlled, yeah, it was more even.” Male, VLCD, lost weight, reduced smoking, did not complete programme.
In the IDAP arm and Stage 2 of the SBS arms, simple control of portion size using
the measuring cups were reported as useful,
“...cups were the most helpful. I cut my portion sizes down...”
as was the structured nature of the diet “Well, she just – what, what she did was give me, erm, a list of what I could have, breakfast, dinner, tea which was far better, saying you can have that off that list, that off that list and that off that list. [probed: what sort of advice have you had in the past?] “Make your own really.” Female, SBS, left at week +9 smoking, no weight loss despite being pleased with diet, as abandoned programme due to personal circumstances. Also, initially very disappointed with allocation to SBS.
And advice to eat a greater variety of food “It [Stage 2 food plan] did point out that I wasn‟t eating as varied a diet maybe...Yeah it was very good.” Male, lapsed intermittently, weight maintained during Stage 1, lost in Stage 2.
and increase fruit and vegetables; this was in contrast to others described
previously who felt that the variety of the diet was poor.

170
4.3.3.4.6. Evidence of success
The main aim of the programme was to assist cessation and control weight;
however, participants also measured success in several other ways, some of
which were a result of stopping smoking e.g. having more money, improved taste
and smell, the smell of smoke gone.
“when I'm driving behind somebody now that's smoking in their car I can smell it coming into mine, you know and you can smell people in the supermarket and I think oh god did I used to smell like that?” Female, SBS, quit smoking, gained weight.
Some success was related to feelings of being in control, of both food and
smoking; this was linked to a sense of achievement. This seemed important as
participants were able to do what they felt was right for themselves, and pleasing
to their families.
“and having tried before...one thing I will say, it made me very, very grouchy and very irritable. I didn‟t find comments from my family, this time, so obviously this was... (Laugh). My wife has just chipped in with “yeah, you‟re just grumpy some of the time instead of all of the time” Male, VLCD, lost weight, reduced smoking, did not complete programme.
“I‟m not eating as many fatty foods, I mean, I read all my leaflets and stuff like that and, you know, I‟m trying well, the whole family‟s trying to eat more healthily anyway so ...” Male on VLCD, abandoned VLCD after 3 days, stopped smoking for 5 weeks, did not complete programme.
Initial successes spurred participants to further success, making them more
determined to persevere through difficulties. This was particularly noticeable in the
VLCD arm where weight loss was rapid and dramatic, and a sense of
achievement came at considerable cost. For example
“...if I hadn‟t had lost nine pounds or something like that in the first week I wouldn‟t have carried on that was the incentive, that's why I knew that diet was right for me. Having gone through all of that torment and then found it would have

171
been 2 lbs I would have gone to the chip shop or got a packet of cigarettes...” Female on VLCD, successfully controlled weight and then quit smoking.
“It‟s instant, you do start to notice within days and that‟s the good thing, and of course, when you get that buzz and when your clothes start feeling loose so quickly. Obviously it‟s so very planned and very boring but you get over that first stage, you know, it‟s like any diet isn‟t it, once you see the results, but because that‟s a bit quicker” Female, VLCD, unable to quit smoking and so later gave up on diet too and pulled out of programme.
“giving up the food the week before, you‟re to question whether you really needed something... it got me used to saying no to myself ....so then when it came to the cutting out the smoking it was well, „do I really need that?‟ ... I began to take control of my smoking instead of having them out of habit or of them controlling me; telling me when I wanted them, so it was good, it was very good.” Male, VLCD, lost weight, reduced smoking, did not quit, did not complete programme
[So what made you really...persevere though every time they tasted awful?] “Because I didn‟t think I would and actually thought it was a very… it was a good opportunity to try and control if not give up smoking. I then saw the benefit of the weight loss…[I thought] Hey! This is really cool...” Male, VLCD, lost weight, reduced smoking, did not quit, did not complete programme.
However early evidence of success or early positive experiences were not always
associated with clinical outcomes of long term weight loss maintenance or
smoking cessation, as shown by the outcomes labelled beside the participants‟
quotes.
4.3.3.4.7. Feeling good about oneself
As well as a sense of achievement and doing what is right for oneself and others,
becoming self motivated was valued highly:
“I was very motivated, I was absolutely determined I was going to do it. I was, I was very… my mindset was right and I felt that talking to the nurse and getting sort of the health checks and things kind of made me think.” Female quit smoking, resorted to dieting during SBS Stage 1.

172
4.3.3.4.8. Timing
In all trial arms the timing of the dietary intervention in relation to the quit attempt
was important. For some in the SBS arm they were pleased to tackle weight after
the stopping smoking, others would have preferred to have tackled it at the same
time. In the IDAP and VLCD arm some were pleased to tackle weight at the same
time, others wanted to have tackled it before, but none in these arms wanted to
wait till afterwards.
“I think you probably would‟ve been better to get used to being on the diet first. And then like slowly, maybe cutting, maybe I don't know which is the best way to do it maybe cut down on the cigarettes but such a drastic diet and then you feel that there is just nothing, you can‟t do anything really.” Female on VLCD, successfully controlled weight and then quit smoking.
I‟d have probably started the diet a month before…got used to it and then stopped. Lose weight first, but you know, quite a bit of weight. Female, IDAP temporarily stopped smoking, lost weight after pulled out of programme.
4.3.4. Interpretation and Discussion
4.3.4.1. Poor acceptability
4.3.4.1.1. When the trial did not meet participants’ perceived needs
Participants described several main themes that they believed hindered their full
participation in, and successful outcome from, DeMiST. We saw in DeMiST when
participants were allocated to the SBS arm they were disappointed because it did
not address their weight from the start. All our participants were overweight, and
so some felt the desire for weight loss keenly, some participants particularly
wanted rapid and dramatic weight loss. Both disappointment with allocation to
control arms (Lindstrom et al., 2010) and unfulfilled high expectations of weight

173
loss (Foster et al., 1997) have been previously shown to be a source of
considerable disappointment.
Disappointment in trial arm allocation was also seen in the VLCD arm by those
who found it too unpalatable and too drastic a dietary restriction to continue with.
Therefore poor acceptability may be due not only to allocation to control but to
whichever arm did not meet participants perceived needs. Systematic review
evidence shows that whether participants feel they will personally benefit from a
programme is closely linked to their preferences within a clinical trial (King et al.,
2005) and their decision to participate (Edwards et al., 1998).
In addition, many studies have shown that many participants do not understand
randomisation (Kerr et al., 2004, Moffat et al., 2006) which can cause participants
to feel their needs are not met. There can be an expectation that even in trials,
clinicians will do what is of most benefit to the individual (Kerr et al., 2004). This is
considered a therapeutic misconception, where the goals of research, which are
for the benefit of future patients, are confused with the goals of clinical care of the
individual. It is proposed that this can result in participants misplacing their trust in
research as though it were clinical care and this creates a barrier to the
acceptability of research (de Melo-Martin & Ho, 2008). We found evidence to
suggest mistrust of this kind as some of our trial participants felt cheated.
Once participants received the dietary intervention in Stage 2 of SBS, some were
satisfied, but others continued to feel hard done by. Initial disappointment may
have contributed to a negative appraisal of the dietary intervention in Stage 2 of

174
the SBS arm. People allocated to IDAP initially were generally more positive about
it than those who received it later. As discussed in chapter three (section 3.1.4) we
included IDAP in a second stage of SBS with the aim of avoiding such
disappointment, but for some this was not enough as they were not prepared to
wait.
Support, in particular lack of peer support and psychological help, also fell below
expectations. Although some of this may have been due to underlying
psychological issues. Such issues are known to be prevalent among smoking and
obese populations, but whether they are caused by or an effect of smoking and
obesity is unclear (Strine et al., 2008).
We explored whether allocation to the trial arm that participants thought would
work was associated with time until drop out, but we found no evidence of this
(Chapter five). However, our sample was too small to be conclusive.
4.3.4.1.2. When participants are ‘expert’
Dietary intervention also fell below the expectations of some participants allocated
to the IDAP arm, who received this from the beginning. The participants with these
views tended to be seasoned dieters who felt they had received better dietary
advice in the past and were experts themselves. This is in line with studies
showing tensions between „expert‟ or self-reliant patients and their acceptance of
medical advice. These individuals consider medical advice highly reflexively, in the
light of their own experiences (Fox et al., 2005).

175
4.3.4.1.3. When problems become in surmountable
Participants found it difficult to stop smoking because of mood changes and the
loss of a „coping mechanism‟, particularly if personal circumstances were difficult.
Many smokers experience these problems on trying to quit (Hughes et al., 1991,
Shiffman, 1982). Participants who were unable to quit were disappointed and felt
they had failed.
4.3.4.2. Acceptability
4.3.4.2.1. When trial met participants’ perceived needs
What some participants found helpful others found a hindrance. Some people
were happy at concurrent weight management and dieting, while others preferred
to tackle both of these sequentially. Participants also found helpful the same
aspects of the same interventions that others perceived as poor. For example, in
contrast to the lack of support described by some, others praised nurse support
highly and considered it an important source of advice, motivation and
reassurance.
Some in the VLCD arm were particularly excited and enthused by this intervention.
They found that the rapid effects of weight loss and improved sense of self-control
provided a sense of achievement from which they took tremendous
encouragement. In the VLCD arm, this achievement came at considerable
personal cost, but the evidence of their success motivated them to persevere in

176
spite of difficulties. This process is very much in line with the theory that behaviour
change is prompted by self-efficacy (Bandura, 1977). However, despite early
success, excitement and enthusiasm this was not always sustained or associated
with retention in the programme or long term successful clinical outcomes. It
seemed that, for some, early success was overtaken later by the inability to stop
smoking or the demands of other life circumstances.
Emotive responses of excitement and disappointment were not so apparent in the
IDAP arm which may have resulted from quiet satisfaction that both smoking and
weight were being handled sensibly.
4.3.4.3. How can we improve acceptability?
We can make steps to improve the acceptability of SBS based on these findings.
For example, future trial arms involving a sequential weight control element after
quitting smoking could reduce the delay in receiving this from eight to four weeks.
However, different views were held on what was acceptable within each trial arm.
To be able to randomise individuals so that they accept their allocation whatever it
is we need to consider how an individual may view or respond to it, rather than just
the inherent properties of that particular intervention. In other words, acceptance
may depend on whether properties of each intervention meet participants‟

177
individual needs and expectations, which may have been shaped by their previous
experiences of treatment.
Where participants experience the benefit of their needs being met, this may have
lead to potentially unacceptable treatments being tolerated despite the cost. This
seemed to continue until the cost became too high because the demand of life
circumstances took priority. Therefore to provide effective interventions we need to
design programmes which are not just well received initially, but stand the test of
time when things get difficult. We need to explore further what elements will help
participants to persevere and keep them motivated. Given that both stop smoking
and weight loss interventions have a high degree of non attendance, a larger
sample size would be needed to evaluate attrition, this then becomes a question
which needs answering quantitatively.
So how can we address the issues raised by our trial participants to make the
clinical trial experience more positive and prevent them abandoning interventions
in the future. Perhaps we need to preempt some of these challenges and prepare
participants on an individual basis to deal with them. This could be done in the first
visit where not only is the understanding of the trial checked and consent taken,
but time is taken to explore an individual‟s response to events during the trial
which might sabotage it. For example embarrassment at unachieved goals or
missed appointments; disappointment in trial arm allocation, or treatment falling
short of expectations. Helping participants to prepare for these events and plan
how to deal with them at the outset may alleviate disappointment and reduce

178
emotional distress which can undermine self control and self regulation (Tice et
al., 2001). Discussing participant needs and how far the trial is able to fulfill these
would be an important aspect of this. A qualitative study has shown that treatment
preferences within a randomised controlled trial are dynamic and exploration of
these can help participants accept other treatment options (Mills et al., 2011). Both
lowering expectations and investing extra effort in obtaining an outcome are two
key strategies used to avoid disappointment (Van Dijk et al., 2003). We could build
on these principals to improve acceptability of randomisation and the interventions
offered in clinical trials.
Additionally, are there ways in which we could design a trial that will allow us to
better tailor interventions to individual needs? A number of trial designs have
considered this. Pragmatic trials randomise participants to either usual care or a
package of care in which participants are given the intervention which best suits
their needs (Thorpe et al, 2009). However, these may still contain dissatisfied
participants in the usual care group. Trials with a Zelen design randomise
participants to usual care or intervention prior to consent. They are only told about
the intervention if they are randomised to it; this is when they are asked if they will
consent. Analysis is carried out as intention to treat (Zelen, 1979). This means that
those in usual care may not know there is an alternative treatment to which they
could have been randomised and as such, there is less chance that they will
object to usual care. However, post randomisation consent trials have raised
ethical concerns. Preference trials ask participants if they have a treatment
preference and randomise those with no preference to either intervention or
control; those which have a preference are allowed to chose the intervention

179
which they feel will best suit their needs (Brewin & Bradley, 1989). This is a design
that theoretically would fit best with the findings from our participant interviews.
However a systematic review of patient level data compared attrition of those who
did not received their preference to those who did showed there was no significant
difference (Odds ratio 1.35, (95% confidence interval 0.78 to 2.33) P=0.29
(n=1583)). A number of trials included in the review contained behavioural
interventions, so there is little reason to suggest findings from our type of
interventions would be any different.
4.3.4.4. Methodological strengths and limitations
4.3.4.4.1. Strengths
We used semi-structured interviews to understand participants‟ views on the
acceptability of the DeMiST treatment programmes. This revealed a response to
experiences which we could not have predicted. If we had carried out a survey,
with a set agenda, we may have missed some of these. For example, considering
the clinical priority for this population was smoking cessation, we may have asked
participants if they would have preferred to tackle weight when they stopped
smoking or afterwards. We may not have discovered that some wanted to lose
significant weight before quitting.
Immersion in the interview data provided a depth of insight which we could not
have gained otherwise. This has led to new ideas for how we can work to make
clinical trials more acceptable to participants, for example, by pre recruitment

180
counselling which explores participants needs and expectations as described in
the previous section.
We took a reflexive approach to our analysis, we reflected on the effect of our own
bias where this seemed to occur as in the example of exploring the influence of
clinical skills which may have led to one participant changing their opinion (section
4.3.2.2,2 ). This meant we could identify instances that may not have yielded a
true perspective of the experience at the time. For the same reason we also tried
to avoid leading questions or suggestive lines of enquiry during the interview.
4.3.3.4.2. Limitations
There were several limitations to our interviews and qualitative analysis which we
have discussed in turn below.
4.3.3.4.2.1. Sample size
As described above we did not have enough people to „purposely sample‟ all
those we wanted to or reach theoretical saturation of responses in each of the trial
arms. This means at best our data can only describe some of the experiences of
our trial participants, which have led to suggestive interpretations, but we cannot
infer that these are typical of all those who will enter such a trial. Therefore we
cannot be certain of our conclusions. Acceptability to interventions may for
example differ according to gender or social group and our sample was too small
to explore the responses within these different groups.

181
4.3.3.4.2.2. Data collection and interview skills
With hindsight from analysing the data, we could have probed responses further to
gain a greater understanding of the balance of driving forces which made
participants decide to drop out or remain in the programme. We could have
explored further what may have helped them to stay in. Where we did probe, we
were cautious to avoid making assumptions about the meaning behind a
response, by asking respondents to explain what they meant and to confirm our
understanding of their response. However, there seemed to be a fine line between
probing sufficiently and not leading a response, this is a qualitative interview skill,
which is likely to improve with experience. The interviewer was relatively
inexperienced in qualitative research and this may have accounted for the limited
understanding we gained on some issues.
4.3.3.4.2.3. Organising data
Much of the organising of data for analysis, for example, the tagging of who said
what within which theme was carried out manually. This became difficult to keep
track of, particularly as new themes and links rapidly emerged. Therefore, despite
a relatively low volume of data, if we had had the resources it may have been a
worthwhile investment to use a qualitative analysis software package such as
NVivo.

182
4.3.3.4.2.4. Method of analysis
We have previously justified our choice of thematic analysis, but we are aware that
opinions on how best to analyse qualitative data will vary. With hindsight, we
appreciate there were issues for which we could have collected further data, and
these may have warranted an analysis based on grounded theory methods. For
example, as mentioned above, the balance of driving forces leading to attrition
could have been further explored. In addition, the reasons why participants
prioritised weight loss over quitting and vice versa would have been an interesting
exploration. However, these are wider questions requiring further studies to
answer them fully. Such studies are important as they may lead to the
development of theories regarding attrition in clinical trials such as this one and
why individuals chose to change one health behaviour over another.
4.3.3.4.2.5. Validation of findings
We did not return our analysis of an individual‟s response to them for confirmation
of meaning. Doing so might have added credibility to our findings. However, it may
also have allowed a participant to reflect and change their responses from a
reactive to a more reasoned one. This would have lost some emotion that was an
important component in understanding reactions to the interventions.
Also considering the time constraints and the resources available we were unable
to peer review the analysis of all transcripts, so as we have previously described
only a selection were discussed and interpretation agreed upon.

183
4.3.4. Conclusion
Individual responses to the DeMiST interventions did not seem to depend on the
trial arm to which they were allocated, but rather on whether the trial arm met their
individual needs. As we were unable to purposely sample or reach theoretical
saturation our analysis can only offer preliminary findings and suggestive
conclusions. Further studies are required with adequate sampling and further
„probing without leading‟ interview techniques to answer fully how acceptable
these dietary interventions are to quitting smokers and what leads to attrition. A
grounded theory approach may be helpful to explore the theory of attrition more
fully. Our effort to reduce disappointment in the control arm by offering IDAP
intervention after the initial treatment stage (Stage 1) was not successful. It may
be worth exploring whether more in-depth counselling prior to randomisation might
reduce disappointment with random allocation to a non-preferred trial arm, and
help participants remain in the trial arm when difficult circumstances arise.
4.4. Feasibility of trial delivery
4.4.1. Methods
4.4.1.1. Fidelity checking
We visited sites to assess how well the behavioural interventions were being
delivered and assess adherence to other aspects of the protocol. These were
formative visits in that we used them to identify where nurses needed further
training. The visits were audio recorded with the participant‟s permission and an
assessment form was completed during the visit. The form audited, against the

184
clinical protocol, how many of the required behavioural change techniques were
used and how many of the required procedures were carried out during the
consultations (Appendix 42).
We also entered the trial database on an ad hoc basis to assess the quality of
data management and identify any problems which needed addressing.
4.4.1.2. Nurses debriefing
Our protocol (chapter three, section 3.4.2) stated that we would carry out a focus
group with our nurses at the end of the trial. However, with poor recruitment and
the changes in protocol we decided to hold a debriefing session, six months into
the trial, instead. Debriefing sessions are becoming increasingly recognised for
their value in the evaluation and education of medicine practice (Rudolph et al.,
2008, Raemer et al., 2011). A debriefing session rather than a focus group
provided the opportunity for reflective learning of both the research nurses and
investigator, which we considered was a more appropriate way to evaluate and
resolve issues with trial delivery that were apparent at the time.
The debriefing session lasted two hours, and the discussion was semi-structured
to ensure all aspects were covered (Appendix 43). The session was audio
recorded so an accurate record was kept. We reported on the factual content of
the debriefing, i.e. what went well and what did not go well with running the trial,

185
the discussion of potential solutions and action points to be carried out. We did not
intend to analyse this discussion as qualitative data. The objective here was to
understand descriptively what worked and what did not, rather than explore
nurses opinion.
4.4.2. Results
4.4.2.1. Fidelity checking
Eight trial consultations were assessed, in five of these there was no deviation
from either the clinical or the research protocol. In the other three, the following
issues needed addressing. With each the nurse was prompted and helped at the
time to avoid deviation from the protocol. The issues were noted for inclusion of
additional training in these areas:
A reminder that participants must have bare feet on the Tanita scales, tights
should not be worn.
There was difficulty in measuring waist and hip circumference particularly
for individuals who had a large amount of adipose tissue which hid the
exact location of the inferior margin of the last rib and the crest of the ilium.
Avoiding hunger in the SBS arm needed greater emphasis.
Dietary goal setting needed to be more participant-centred and less
prescriptive.
Thirteen consultation entries were reviewed in the trial database. One of these
had no data recorded and a problem with the save function was identified. Data

186
was re-entered from the case report form (CRF). There were two other queries.
One was missing the date of stopping a medication. This was checked with the
participant and completed on the database. The other was a missing CO reading,
which was missed when data was transferred from the CRF to the database and
was subsequently filled in.
4.4.2.2. Nurses debriefing
Several aspects of the preparation and practical working out of the trial were
discussed (Table 22 and Table 23). For each of these there were positive aspects,
difficulties, and suggestions of improvements which could be made. Some of
these suggestions were implemented with immediate effect for the remainder of
the trial; others were unsuitable for incorporation at the time, but noteworthy for
consideration in the management of future trials in this field.

187
Issues Positive aspects Difficulties Suggested Solutions Action taken
Training and support
Initial supervision by research nurse
Complicated study, especially with three arms Dietary interventions were most difficult to grasp Delay between some of the training and use of skills e.g. spirometry meant their confidence waned for some procedures. Interpreting body composition and providing feedback on diaries and clinical measures in response to participants questions How to deal with those who include their own dieting strategies, how much flexibility is allowed within the protocol?
Expanded training sessions Back ground session with incentive i.e. those on bank being paid hourly rate to read and become thoroughly familiar with protocol, to practise filling in diaries to gain a participants perspective. More opportunity for role play, to run through first two or three sessions and practice the following Explaining the trial and gaining consent Giving the dietary advice Consolidating training on new clinical procedures
To consider in nurse training session for future trial in this field
Logistics and data management
Database entry encouraged a double check that everything had been completed
The volume of VLCD formula created storage difficulties Some equipment was very heavy if it needed transporting to different clinic rooms e.g. Tanita scales Accessing the Citrix database was sometimes a problem depending on clinic room Data entry was time consuming
Starting pack of equipment and products Central storage space possibly at the university stock could be ordered and/or collected Extra time to set up and wrap up each clinic and enter data
Consider for future trials
Recruitment
Worked well where practice had an expert who could search GP database
Difficulties with some appointments booked centrally while others booked by the nurse Problems with identifying and excluding potential participants from GP databases
Nurses preferred to be responsible for booking all participants, Step by step guide with list of read codes (although not all practices use the national read codes ranking Identify and agree who will carry out searches at a planning meeting involving everyone who will be dealing with the trial
Changes made to appointment booking process Other suggestions to be considered in the future
Table 22. Nurses report of training and support, logistics, data management and recruitment. Improvements made during DeMiST
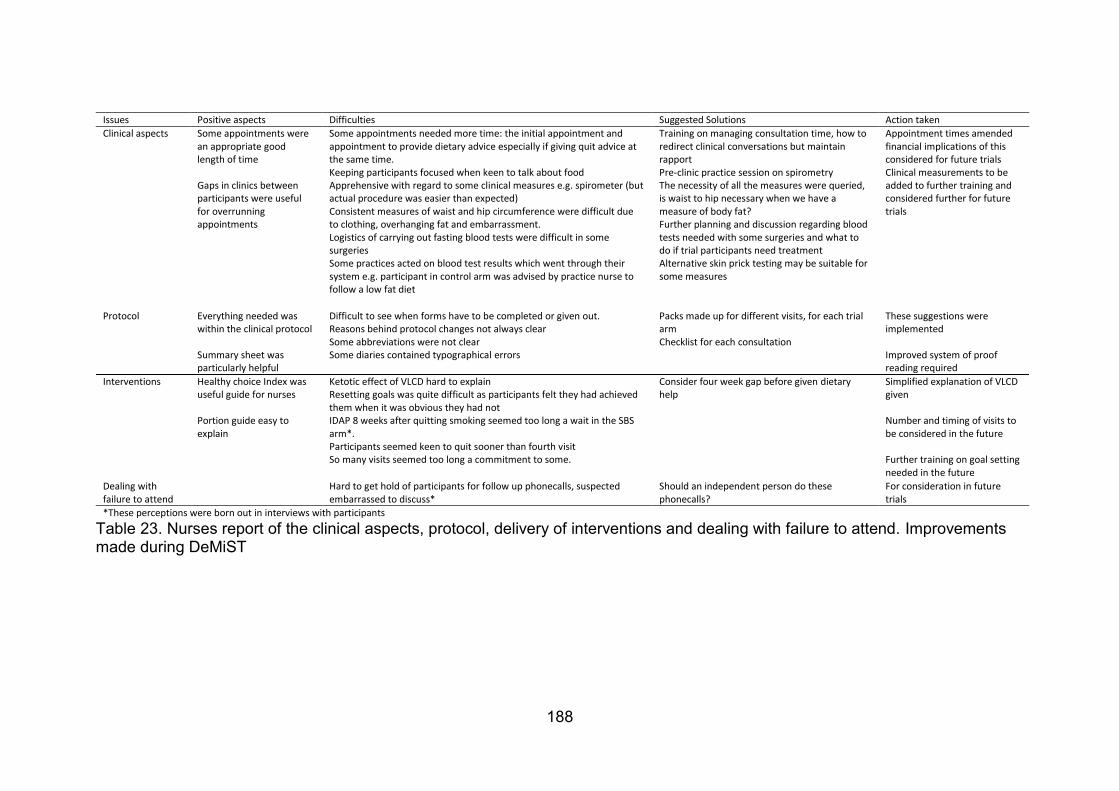
188
Issues Positive aspects Difficulties Suggested Solutions Action taken
Clinical aspects
Some appointments were an appropriate good length of time Gaps in clinics between participants were useful for overrunning appointments
Some appointments needed more time: the initial appointment and appointment to provide dietary advice especially if giving quit advice at the same time. Keeping participants focused when keen to talk about food Apprehensive with regard to some clinical measures e.g. spirometer (but actual procedure was easier than expected) Consistent measures of waist and hip circumference were difficult due to clothing, overhanging fat and embarrassment. Logistics of carrying out fasting blood tests were difficult in some surgeries Some practices acted on blood test results which went through their system e.g. participant in control arm was advised by practice nurse to follow a low fat diet
Training on managing consultation time, how to redirect clinical conversations but maintain rapport Pre-clinic practice session on spirometry The necessity of all the measures were queried, is waist to hip necessary when we have a measure of body fat? Further planning and discussion regarding blood tests needed with some surgeries and what to do if trial participants need treatment Alternative skin prick testing may be suitable for some measures
Appointment times amended financial implications of this considered for future trials Clinical measurements to be added to further training and considered further for future trials
Protocol
Everything needed was within the clinical protocol Summary sheet was particularly helpful
Difficult to see when forms have to be completed or given out. Reasons behind protocol changes not always clear Some abbreviations were not clear Some diaries contained typographical errors
Packs made up for different visits, for each trial arm Checklist for each consultation
These suggestions were implemented Improved system of proof reading required
Interventions
Healthy choice Index was useful guide for nurses Portion guide easy to explain
Ketotic effect of VLCD hard to explain Resetting goals was quite difficult as participants felt they had achieved them when it was obvious they had not IDAP 8 weeks after quitting smoking seemed too long a wait in the SBS arm*. Participants seemed keen to quit sooner than fourth visit So many visits seemed too long a commitment to some.
Consider four week gap before given dietary help
Simplified explanation of VLCD given Number and timing of visits to be considered in the future Further training on goal setting needed in the future
Dealing with failure to attend
Hard to get hold of participants for follow up phonecalls, suspected embarrassed to discuss*
Should an independent person do these phonecalls?
For consideration in future trials
*These perceptions were born out in interviews with participants
Table 23. Nurses report of the clinical aspects, protocol, delivery of interventions and dealing with failure to attend. Improvements made during DeMiST

189
4.4.3. Discussion
Despite lack of confidence expressed in the nurses debriefing, fidelity checks within
clinics showed that they delivered the intervention competently and collected data
appropriately as described in the protocol. We have demonstrated that we were able
to train nurses to provide specialist dietary interventions within NHS stop smoking
clinics.
The nurses debriefing session and fidelity checks provided us with suggestions to
increase nurses‟ confidence in delivering the interventions and to streamline the
practicalities of doing so. The nurses appreciated the debriefing session and such
opportunities are important for their job satisfaction and morale which positively
influences their job performance (Kennedy et al., 1990) so they should not be
underestimated.
There were several technical difficulties encountered with the Citrix onsite trial
database. These were resolved but this emphasised the value of completing a paper
copy in clinic, so that trial data is not lost.
4.4.4. Conclusion
We found that it was feasible to train nurses to provide each of the DeMiST
interventions according to a randomised controlled trial protocol within primary care
stop smoking clinics typical of the NHS.

190
5. DEMIST: PROCESS MEASURES
5.1. Introduction
Chapter five is concerned with the measures of underlying processes, which may
have led to changes in outcomes in DeMiST. To capture the processes of change we
designed a number of questionnaires, some of which needed to be tested to examine
their reliability and validity. This chapter meets objective five: to report on the
development and validity of a dietary assessment tool for use within DeMiST
consultations, and objective six of the thesis: to report on the development of a
questionnaire to measure both hunger and food craving during quitting smoking.
However as we were unable to recruit our sample size to test the reliability and
validity of these questionnaires with any degree of certainty we have analysed the
data using the same methods, as we would have done if we had been able to recruit
full numbers. The reasons for this were two-fold. Firstly, they allowed me to show that
I can carry out such analyses for the purposes of the PhD and secondly allowed us to
identify large effects that may provide preliminary evidence on which further research
may be developed.
The healthy choice index (HCI) (chapter three, section 3.4.7), was developed as a
simple tool to identify and be used to promote change in eating pattern and physical
activity; to explore how much this influenced change in body composition. We tested

191
the validity of HCI as a nutritional assessment tool against the gold standard field
measure of the estimated seven day food diary.
The hunger and food craving score (HCS) (chapter three, section 3.4.3 ), was
developed to measure hunger and food craving to explore whether changes in these
mediated changes in cigarette cravings (this mediation analysis is covered in chapter
six). We tested the reliability of this questionnaire using factor analysis.
We also asked participants which trial arm they thought would be most successful
(chapter three, section 3.4.8). We did this to explore whether there was greater
attrition in those who were allocated a treatment which they did not think would work.
This helped us to understand the influence that the unblinded nature of the study had
on retaining trial participants.
This chapter provides further background, it describes the methods, results and
discusses the findings concerning each of these process measures in turn.
5.1.1. The healthy choice index (HCI)
5.1.1.1. Introduction
As described in chapter three (section 3.1.3), a gap exists for a dietary assessment
tool that is brief, reliable, and can be used in routine clinical practice as a prompt for

192
behaviour change. We developed the Healthy Choice Index (HCI) to do this
(Appendix 44). This multiple-choice questionnaire required participants to score their
usual eating patterns, level of physical activity and usual choices of key foods known
to contribute a large proportion of the intake of a particular nutrient in a typical British
diet. For example, we know from national surveys that the major contributors of fat in
the population‟s diet are dairy produce, fatty meats and cereal products (FSA and
DOH, 2009). Therefore, our questions relating to fat asked about the type of these
foods eaten, the portion size and the frequency of consumption. Depending on the
participant‟s answer, they were scored one to three, one being the score for the least
healthy and three for the healthiest answer. From this the clinician, led by the
participant, set guided goals to increase healthy choices and decrease unhealthy
choices. This was part of the IDAP intervention where these dietary goals were
consolidated with individual energy prescriptions (chapter three, section 3.2.2.2).
There were 25 questions designed to capture some of the assessment, and prompt
discussion of key behaviour change needed for weight loss, that would typically be
contained in a dietitian‟s initial consultation. This was a simple approach to enable
non-dietitians to provide similar advice without the need for lengthy training and
detailed dietary history taking. Questions covered:
eating pattern and response to hunger (questions 1 and 2),
portion size (questions 4, 7 and 12)
fat (questions 9, 10 , 11, 12, 13, 14, 15, 16 and 20)
carbohydrate (questions 3, 4, 6, 8, 10, 16, 17 and 18)

193
energy (question 2 and questions for fat and carbohydrate)
non-starch polysaccharide (NSP) (dietary fibre) (questions 5 and 8)
calcium (question 10)
sodium (questions 11, 19 and 20)
alcohol (questions 23 and 24)
vitamin C (questions 6 and 7)
time spent being active (question 25)
We measured HCI at baseline and at the end of treatment (week +12). The food
diary was completed at baseline only. So, how valid was the HCI as an assessment
of nutrient intake? Did it serve as a sufficiently accurate method to determine whether
diets were high or low in particular nutrients?
5.1.1.2. Methods
We investigated agreement between baseline measures of nutrient intake from the
HCI and the widely accepted seven day estimated food diary (Chapter three section
3.4.7, Appendix 45). We analysed the nutrient values from the food diaries using the
WISP version 3 dietary analysis package (Tinuviel software, based on the McCance
and Widdowson‟s food tables). This provided data on the DeMiST sample to
compare with population and recommended dietary intakes. We estimated the
nutrient values from the HCI from representative food items described by each
question (using McCance and Widdowson‟s food tables FSA, 2002). We estimated
portion sizes of these foods from standard tables (MAFF, 1994), participants answers
to the proportion of the plate a food covered, and the frequency of consuming these
foods daily or weekly.
194
We assessed correlation between the nutrient intakes from the food diary and the
HCI using Pearson‟s regression coefficients. We calculated the limits of agreement
between these two assessments using the Bland–Altman technique. Where there
was evidence of a relation between the difference and the mean, we log transformed
the data to base e for improved accuracy of the limits of agreement (Bland and
Altman, 1986).
We applied the limits of agreement for the HCI to the mean, minimum and maximum
nutrient values of our sample to see whether the HCI could differentiate between the
higher and lower intakes.
Where limits of agreement were acceptable we compared the change in HCI scores
and the reported behaviour changes by trial arm and investigated their effect as
mediators on change in body fat.
5.1.1.3. Results
5.1.1.3.1. Baseline nutrient intakes from food dairy
The food diary data showed a mean energy intake of 2053kcal/day, 2666kcal/day in
men (n=3) and 1942kcal/day in women (n=10) (Table 24). This may represent an
underreporting of about 8% in men and 13% in women. These are the values by
which the actual intakes differ from the expected intakes. Expected intakes are

195
calculated from using the Schofield et al. (1985) energy prediction equation based on
the average weight in the male and female participants (Table 24), and using the
mean physical activity level of 1.5 (2896kcal/d and 2228kcal/day respectively).
5.1.1.3.2. HCI Scores
Scores could potentially range from 25 to 75. Mean HCI score was 52. Minimum and
maximum HCI scores in the DeMiST sample were 40 and 66 respectively. Minimum
scores were generated from the least healthy food choices and eating behaviours
described, and maximum scores from the most healthy.
5.1.1.3.3. Correlation and agreement between mean nutrient values
measured by the food diary and HCI
Correlation was significant between the two measures for total energy, carbohydrate
and alcohol, but not fat, fibre, sodium, calcium, vitamin C or protein (Table 25)
(Figure 8). The Bland-Altman plots for alcohol (Figure 9), calcium (Figure 10), fat
(Figure 11), energy (Figure 12), carbohydrate (Figure 13) and vitamin C (Figure 14)
showed a relation between the difference and mean which was partially improved
with log transformation of these data. Log transformation of the Bland-Altman plots
for fibre, sodium and protein (Figure 15) were not appropriate.

196
Table 24. Baseline nutrient intake and physical activity level for all participants and by trial arm (Mean (SD))
Trial arm All SBS IDAP VLCD
Nutrient Intake and physical activity level at baseline (7 day diary)
N 13 5 5 3
Energy (kcal/day) 2053(552) 1891(513) 1937(401) 2517(745)
Men only (kcal/day) 2666(256) 2485 - 2847
Women only (kcal/day) 1942(520) 1743(451) 2353(974) 2353(974)
Total Fat(g/day) 89(24) 84(24) 70(16) 105(32)
Fat (% Energy) 39% 40% 33% 38%
Of which saturated fat (g/day) 34(12) 36(15) 30(10) 38(10)
Saturated fat (% Energy) 15% 17% 14% 14%
Carbohydrate(g/day) 220(58) 218(82) 217(41) 228(57)
Carbohydrate(% Energy) 43% 46% 45% 36%
NSP (g/day) 10(2) 10(2) 10(3) 11(1)
Protein (g/day) 79(22) 70(16) 70(16) 100(34)
Protein (% Energy) 15% 15% 14% 16%
Sodium(mg/day) 2896(976) 2397(583) 2720(807) 4022(1065)
Salt(g/day) 7.4(2.5) 6.1(1.4) 6.9(2.0) 10.2(2.7)
Alcohol (g/day) 17(26) 3(4) 13(15) 45(44)
Alcohol(% Energy) 6% 1% 5% 13%
Calcium (mg/day) 882(238) 847(234) 739(73) 1170(185)
Vitamin C (mg/day) 78(80) 127(107) 59(50) 27(1)
Physical Activity Level (PAL) 1.5(0.3) 1.4(0.2) 1.3(0.2) 1.8(0.3)
HCI 52(7) 54(4) 53(1) 47(3)

197
The range of agreement for the nutrient values for raw data and log transformed data
showed that the HCI overestimation or underestimation of food diary values was too
wide ranging for differentiation between high and low intakes of most of the nutrients
measured. The one exception was dietary fat, after log transformation the range of
agreement was 32% (4% above to 28% below) the mean food diary value (Table 26).
Applying these limits to the minimum, mean and maximum values of our sample
showed that the limits of agreement did not overlap and the HCI could detect
between high, medium and low intakes in our population (Table 27).
Nutrient Pearsons correlation coefficient
Energy (kcal) 0.77*
Fat (g) 0.51
Carbohydrate (g) 0.74*
NSP (fibre) (g) 0.26
Sodium (mg) 0.42
Alcohol 0.57*
Calcium (mg) 0.37
Vitamin C (mg) 0.13
Protein (g) 0.26
*p<0.05
Table 25. Correlation coefficients for nutrients measured by food diary and HCI

198
Figure 8. Scatter plots of nutrient intake (energy (kcal), carbohydrate (g), alcohol (g), fat(g), fibre (g), sodium (mg), calcium (mg) and vitamin C (mg)) from food diary compared to HCI with lines of best fit

199
Mean difference (solid line) and upper and lower limits of agreement are plotted (dashed lines)
Figure 9. Bland-Altman plot of mean alcohol intake from food diary and HCI with difference in alcohol between food diary and HCI (graph on the left hand side). Bland-Altman plots of log mean alcohol intake from food diary and HCI with difference of log alcohol intake between food diary and HCI (graph on the right hand side).

200
Mean difference (solid line) and upper and lower limits of agreement are plotted (dashed lines)
Figure 10. Bland-Altman plot of mean calcium intake from food diary and HCI with difference in calcium between food diary and HCI (graph on the left hand side). Bland-Altman plot of log mean calcium intake from food diary and HCI with difference of log calcium intake between food diary and HCI (graph on the right hand side).

201
Mean difference (solid line) and upper and lower limits of agreement are plotted (dashed lines)
Figure 11. Bland-Altman plot of mean fat intake from food diary and HCI with difference in fat between food diary and HCI (graph on the left hand side). Bland-Altman plot of log mean fat intake from food diary and HCI with difference of log fat intake between food diary and HCI (graph on the right hand side).

202
Mean difference (solid line) and upper and lower limits of agreement are plotted (dashed lines)
Figure 12. Bland-Altman plot of mean energy intake from food diary and HCI with difference in energy between food diary and HCI (graph on the left hand side). Bland-Altman plots of log mean energy intake from food diary and HCI with difference of log energy intake between food diary and HCI (graph on the right hand side).

203
Mean difference (solid line) and upper and lower limits of agreement are plotted (dashed lines)
Figure 13. Bland-Altman plot of mean carbohydrate intake from food diary and HCI with difference in carbohydrate between food diary and HCI (graph on the left hand side). Bland-Altman plot of log mean carbohydrate intake from food diary and HCI with difference of log carbohydrate intake between food diary and HCI (graph on the right hand side).

204
Mean difference (solid line) and upper and lower limits of agreement are plotted (dashed lines) Figure 14. Bland-Altman plot of mean vitamin C intake from food diary and HCI with difference in vitamin C between food diary and HCI (graph on the left hand side). Bland-Altman plots of log mean vitamin C intake from food diary and HCI with difference of log Vitamin C intake between food diary and HCI (graph on the right hand side).

205
Figure 15. Bland-Altman plot of mean protein and fibre intakes and sodium from food diary and HCI with difference in nutrient between food diary and HCI

206
Nutrient Mean difference
SD LLA ULA Range of agreement
Mean difference (log transformed data)
SD (log transformed data)
LLA (log transformed data)
ULA(log transformed data)
Antilog LLA
Antilog ULA
% range HCI over or under estimates nutrients from food diary
Range of agreement (%)
Energy(kcal) -1114 366 -1831 -396 1435 -0.4428 0.16222 -0.76 -0.12 0.47 0.88 212 113 99
Fat(g) -20.1 26.0 -71.1 30.9 102.0 -0.1993 0.26511 -0.72 0.32 0.49 1.38 104 72 32
Carbohydrate (g) -188.8 65.6 -317.5 -60.2 257.3 -0.6347 0.18980 -1.01 -0.26 0.37 0.77 270 130 140
NSP (g) -2.1 3.9 -9.8 5.5 15.3 -0.1598 0.39384
Sodium(g) 1096 1189 -1235 3426 4661 1.4039 3.09456
Alcohol (g) -6.3 21.3 -48.0 35.5 83.4 -0.5706 0.90124 -2.34 1.20 0.10 3.31 1000 30 970
Protein (g) -7.0 22.0 -50.1 36.1 86.2 0.8325 0.42315 0.00 1.66 1.00 5.27 100 19 81
Calcium(mg) 454 254 -43 952 995 -0.0583 0.77128 -1.57 1.45 0.21 4.28 476 23 453
Vitamin C (mg) 16 77 -135 168 303 -0.1093 0.25436 -0.61 0.39 0.54 1.48 185 68 117
Table 26. Mean (SD), lower, upper and range of agreement of raw and log transformed data for difference between food diary and HCI measurements. Also shows interpretation of antilogs as a percentage of nutrient values.
Nutrient Minimum FD
values
HCI range Mean FD
values
HCI range Maximum FD
values
HCI range
Lower HCI
Upper HCI
Lower HCI
Upper HCI
Lower HCI
Upper HCI
Fat(g) 51 37 53 86 62 89 132 95 137
Table 27. Mean, minimum and maximum values of fat intake from food dairies and the corresponding range identified by the HCI

207
5.1.1.3.4. Change in fat intake, HCI score and health behaviours
The HCI was completed at baseline and at the end of treatment. By the end of
treatment all arms had been given the intervention to develop long term healthy
eating patterns through IDAP. So we would expect some improvement in all arms,
although perhaps less in the SBS group who had only received IDAP in the last four
weeks of the trial.
As an assessment of nutrient intake, the HCI was only reliable for measuring dietary
fat within the margins of error described above. Questions that did not relate to
dietary fat, or were not sensitive enough to measure other specific nutrients,
described healthy food choices and behaviours only.
5.1.1.3.5. Change in fat intake
Fat intake reduced by an amount that was measureable by the HCI in the IDAP and
the VLCD arms (39% and 31% reduction in IDAP and VLCD respectively). The
difference between the rise in the SBS arm and the reduction in the IDAP and VLCD
arms was also measurable by the HCI and of a clinically important amount (63g/day
and 57g/day fat respectively)(Table 28).

208
5.1.1.3.6. Change in HCI score
HCI score increased most in the IDAP arm. An increase of one shows a move from a
less healthy to a more healthy choice or behaviour on a scale of one to three. A
mean increase of 11 represents a moderate improvement in 11 food choices or
lifestyle behaviours, or a more dramatic improvement in five to six of these. This was
an increase of 21% from baseline HCI score (Table 28).
5.1.1.3.7. Change in health behaviours
Based on the percentage frequency of each of the answers to the multiple choice
questionnaires. The following change in behaviours were reported in our sample as a
whole:
More regular meals, including breakfast (Table 29),
increased fruit and vegetable intake (Table 30)
more high fibre food choices (Table 30)
more high calcium food choices (Table 30)
greater daily fluid intake (Table 30)
more low fat food choices (Table 31),
reduced use of sugar and salt (Table 32),
reduced alcohol intake (Table 32),
and increased frequency of activity (Table 32).
Participants began to choose more high fibre food and fewer convenience foods,
these changes were similar in all arms (Figure 17, Figure 18).

209
Participants ate more breakfast (Figure 16), calcium rich foods on a daily basis
(Figure 17) and more oily fish on a weekly basis. They ate fewer fatty snacks on a
daily basis (Figure 18) and increased their daily fluid intake. These changes were
most apparent in the SBS arm (Figure 18).
Choosing to consume fewer fatty meats (Figure 18) and fewer high sugar foods
(Figure 19) was reported most in the IDAP arm. Increasing daily fruit and vegetables
consumption (Figure 17), adding less oil when cooking (Figure 18) was reported
most in both the SBS and IDAP arms. Changing to lower fat choices of dairy food
and spreading fats was reported most in the IDAP and VLCD groups (Figure 18).
Daily alcohol consumption and reduced mealtime salt use was reported most in the
VLCD arm (Figure 19). Weekly activity levels increased most in the SBS and VLCD
arm (Figure 19).

210
Whole sample SBS IDAP VLCD SBS-
IDAP SBS-VLCD
IDAP-VLCD
Change in fat intake (g) (mean (SD) -15 (35) +16 (16) -47 (6) -41 63 57 6
HCI score 4 (8) 1 (6) 11 (1) -1 10 0 12
* between trial arms p<0.05 (ANOVA) but sample too small for post hoc tests.
Table 28. Change in fat intake and HCI score from baseline to week +12 according to trial arm and between trial arm
All
SBS IDAP VLCD
Baseline
End of treatment Baseline
End of treatment Baseline
End of treatment Baseline
End of treatment
Daily miss breakfast & lunch 7 20
Sometimes miss breakfast & lunch 64 50 20 33 83 50 100 100
Daily breakfast and 3 meals a day 29 50 60 67 17 50
Eat even if feel full 21 13 20 17 33 100
Sometimes eat when not hungry 29 50
67 33 50 67 Eat when hungry & stop when full 50 38 80 33 50 50
Eat similar foods and meals every day of week 14 13 33 25 Eat similar foods and meals several times a week 29 38 60 34
25 33 100
Eat different foods and meals every day 57 50 40 67 67 50 67
Table 29. Percentage frequency of response to multiple-choice questions on eating behaviours in the whole sample and by trial arm at baseline and end of treatment. Inside borders differentiate between questions.

211
0
20
40
60
80
100Baseline
End of treatment
20
40
60
80
100
0
20
40
60
80
100
D
aily
mis
s b
reakfa
st &
lunch
S
om
etim
es m
iss b
reakfa
st &
lunch
Daily
bre
akfa
st a
nd
3 m
eals
a d
ay
Eat even if fe
el fu
ll
Som
etim
es e
at w
he
n n
ot
hu
ngry
Eat w
hen h
ung
ry &
sto
p w
hen f
ull
Eat sim
ilar
foods a
nd m
eals
every
day
Eat sim
ilar
foods
severa
l tim
es/ w
eek
Eat diffe
ren
t fo
ods a
nd m
eals
eve
ry d
ay
Pe
rce
nta
ge
freq
uen
cy
VLCD
IDAP
SBS
Figure 16. Percentage frequency of response to multiple-choice questions on eating behaviours by trial arm at baseline and end of treatment. Dashed lines differentiate between questions

212
All SBS IDAP VLCD
Baseline End of treatment
Baseline End of treatment
Baseline End of treatment
Baseline End of treatment
Eat white cereal products 36 13 40 17 25 67
Eat wholemeal cereal products 50 38 40 33 66 25 33 100
Eat seeded cereal products 14 50 20 67 17 50
Hardly ever eat fruit and vegetables 7 13 33 100
Eat 1 - 4 portions fruit or veg/day 86 50 80 33 100 75 67
Eat 5 or more portion fruit or veg/day 7 38 20 67 25
Eat 0-1 dairy portions/day 57 50 80 33 50 50 33 100
Eat 1-2 dairy portion/day 29 25
33 33 25 67
Eat at least 3 dairy portions/day 14 25 20 33 17 25
Drink less than 3 glasses fluid a day 7 13 20 20 100
Drink 3-5 glasses fluid a day 29
20 20 33
33
Drink 6-8 glasses fluid a day 64 88 60 60 67 100 67
Table 30. Percentage frequency of response to multiple-choice questions on food choice behaviours in the whole sample and by trial arm at baseline and end of treatment. Inside borders differentiate between questions.

213
E
at w
hite c
ere
al pro
ducts
Eat
whole
me
al cere
al pro
ducts
Eat seeded c
ere
al pro
ducts
H
ard
ly e
ver
eat fr
uit &
veg
Eat
1 -
4 p
ort
ions f
ruit o
r veg/d
Eat
5 o
r 5
+ p
ort
ion f
ruit o
r veg/d
Eat
0-1
dairy p
ort
ions/d
ay
Eat
1-2
dairy p
ort
ion/d
ay
Eat
at
least 3 d
airy p
ort
ions/d
ay
Drin
k less t
han 3
gla
sses flu
id /
d
Drin
k 3
-5 g
lasses flu
id a
day
Drin
k 6
-8 g
lasses flu
id a
day
Figure 17. Percentage frequency of response to multiple-choice questions on food choice by trial arm at baseline and end of treatment. Dashed lines differentiate between questions
20
40
60
80
100
Baseline
End of treatment
20
40
60
80
100
20
40
60
80
100
Pe
rcen
tag
e
freq
uen
cy
SBS
IDAP
VLCD

214
All SBS IDAP VLCD
Baseline End of treatment
Baseline End of treatment
Baseline End of treatment
Baseline End of treatment
Eat full fat dairy products 21 33 33
Eat reduced fat dairy products 50 63 60 67 33 50 67 100
Eat virtually fat free dairy products 29 38 40 33 33 50
Eat fried or fatty meats regularly 64 25 40 33 67 100 100
Occasionally eat fried or fatty meats 7 13 20 33
Eat lean meats only 29 63 40 33 33 100
Meat portion covers half of plate 7 17
Meat portion cover 1/3 of plate 50 38 60 67 33
67 100
Meat portion covers 1/4 of plate 43 63 40 33 50 100 33
Eat fried fish each week 36 13 60 17 33 100
Eat plain white fish each week 21 13
33 25 33
Eat plain white fish and oily fish each week 29 50 40 100 17 25 33
Pour oil freely 36 13 20 33 40
Measure out oil 50 38 60
60 50 67 100
Use oil spray 7 38 20 67 25 33
Use butter or margarine 50 25 40 67 50 67
Reduced fat spreads 21 25 20
17 25 33 100
Low fat spreads 29 50 40 33 33 75
Eat 3 or more fatty snacks a day 7 20
Eat 2-3 fatty snacks a day
Eat fatty snacks once a day or less 93 100 80 100 100 100 100 100
Table 31. Percentage frequency of response to multiple-choice questions on sources of dietary fat in the whole sasmple and by trial arm at baseline and end of treatment. Inside borders differentiate between questions.

215
Eat fu
ll fa
t d
airy p
rodu
cts
Eat re
duce
d fa
t d
airy p
rod
ucts
Eat vir
tually
fa
t fr
ee
dair
y p
rodu
cts
Eat fr
ied o
r fa
tty m
ea
ts r
eg
ula
rly
Occasio
nally
eat fr
ied o
r fa
tty m
eats
Eat le
an m
eats
only
Mea
t p
ort
ion c
overs
half o
f pla
te
Mea
t p
ort
ion c
over
1/3
of
pla
te
Mea
t p
ort
ion c
overs
1/4
of
pla
te
Eat fr
ied f
ish e
ach w
eek
Eat pla
in w
hite
fis
h e
ach w
ee
k
Eat pla
in w
hite
fis
h a
nd o
ily fis
h e
ach
week
Pour
oil
fre
ely
Mea
su
re o
ut
oil
Use o
il sp
ray
Use b
utt
er
or
ma
rgari
ne
Redu
ce
d fa
t sp
reads
Low
fat spre
ads
Eat 3 o
r m
ore
fatt
y s
nacks a
da
y
Eat 2
-3 f
att
y s
nacks a
day
Eat fa
tty s
nacks o
nce
a d
ay o
r le
ss
20
40
60
80
100
Baseline
End of treatment
20
40
60
80
100
0
20
40
60
80
100
VLCD
SBS
IDAP
Pe
rcen
tag
e
freq
uen
cy
Figure 18. Percentage frequency of response to multiple-choice questions on dietary fat by trial arm at baseline and end of treatment. Dashed lines differentiate between questions.

216
All
SBS IDAP VLCD
Baseline End of treatment
Baseline End of treatment
Baseline End of treatment
Baseline End of treatment
Always add sugar 29 13 20 33 17 67
Sometimes add sugar 29
40
33
Never add sugar 43 88 40 67 50 100 33 100
Eat sweets every day 7 17
Eat sweets most days 14 13 20 33 17
Eat sweets less than once a week 79 88 80 67 67 100 100 100
Add salt to cooking and food 36 22 40 33 33 33
Add salt either to cooking or food 50 36 40 33 50 75 67
Use herbs and spices instead of salt 14 53 20 33 17 25 100
Use processed foods often 21 20 17 33
Choose reduced fat salt & sugar varieties
Rarely use convenience food 79 100 80 100 83 100 67 100
Drink alcohol daily 14 13 17 25 33
Drink alcohol 1-5 times a week 57 50 40 33 67 50 67 100
Don't drink alcohol 29 38 60 67 17 25
Drink more than 2-3 units alcohol/day 57 13 20 83 25 67
Drink less than 2-3 units alcohol/day 14 50 20 33
50 33 100
Don't drink alcohol 29 38 60 67 17 25
Spend most of spare time sitting down
43 13 60
33 25 33
Exercise on 2-3 day of the week 29 38 20 67 33 25 33
Exercise 30 minutes or more each day
29 50 20 33 33 50 33 100
Table 32. Percentage frequency of response to multiple-choice questions on sucrose, salt alcohol and activity for the whole sample by trial arm from baseline to end of treatment. Inside borders differentiate between questions.

217
Alw
ays a
dd
su
gar
Som
etim
es a
dd
su
gar
Neve
r a
dd s
ug
ar
Eat sw
eets
every
day
Eat sw
eets
most
days
Eat sw
eets
less t
han o
nce a
we
ek
Add s
alt t
o c
ookin
g a
nd
fo
od
Add s
alt e
ith
er
to c
ookin
g o
r fo
od
Use h
erb
s &
spic
es inste
ad o
f salt
Use p
rocessed f
oo
ds o
ften
red
uce
d f
at/salt/ sug
ar
vari
etie
s
Rare
ly u
se c
onvenie
nce fo
od
Drink a
lco
hol daily
Drink a
lco
hol 1-5
tim
es a
week
Don't d
rink a
lco
hol
Drink 2
-3 +
units a
lco
hol/da
y
Drink <
2-3
units a
lcohol/d
ay
D
on
't d
rink a
lcoh
ol
Spen
d s
pare
tim
e s
ittin
g d
ow
n
Exerc
ise o
n 2
-3 d
ay o
f th
e w
eek
Exerc
ise 3
0 m
inu
tes +
e
ach
day
20
40
60
80
100
Baseline
End of treatment
20
40
60
80
100
20
40
60
80
100
Pe
rcen
tag
e
freq
uen
cy
IDAP
VLCD
SBS
Figure 19. Percentage frequency of response to multiple-choice questions on sucrose, salt alcohol and activity by trial arm from baseline to end of treatment. Dashed lines differentiate between questions

218
5.1.1.3.8. Change in fat intake and HCI score as mediators of change in body
fat
We investigated whether change in dietary fat intake or HCI score mediated the
effect of dietary intervention on fat mass. This is reported, together with other multi-
level models, in chapter six.
5.1.1.4. Discussion
5.1.1.4.1. Baseline nutrient intake
In comparison with the Department of Health dietary reference values (DRV) for
nutrients (DOH, 1991), mean intake data showed the participants exceeded
recommendations for total fat, saturated fat, alcohol (although only the VLCD group
exceeded alcohol recommendations) and salt (again only the VLCD group notably
exceeded this). The participants met the recommendations for protein and calcium
intake. They met the reference nutrient intake (RNI2) for vitamin C, but not quite for
vitamin C in smokers; those in the VLCD group only met the estimated average
requirement (EAR3) for vitamin C. The participants fell short of the requirement for
carbohydrate and non-starch polysaccharides (fibre) (Table 33). These aspects of
the participants‟ diets were also poorer than the general population as determined by
the national diet and nutrition survey (NDNS) (FSA and DOH, 2010) (Table 33).
2 The RNI is the level of intake considered to be sufficient to meet the requirements of 97.5% of the population
3 The EAR is the level of intake considered to be sufficient to meet the requirements of 50% of the population.

219
This is in line with a meta analysis of cross-sectional studies by Dallongville et al in
1998 that also showed smokers have a higher intake of total and saturated fat and a
lower intake of fibre than non smokers (Dallongville et al., 1998). The meta analysis
also provided evidence of higher intakes of energy and alcohol, lower intakes of
polyunsaturated fat, vitamin E and β-carotene. The authors showed that protein and
carbohydrate intakes did not differ between smokers and nonsmokers.
Comparing DeMiST measures of energy intake with estimated energy requirements
showed that the underreporting in our sample might have been below that previously
observed in overweight populations (Kretsch, 1999, Hill and Davies, 2001). The food
diary was very similar to others used in the field and there is no reason to expect its
format led to more accurate reporting. However, participants were advised that if they
were to take part fully in the trial they had to demonstrate their commitment to it by
Nutrient Participants DRV (DOH, 1991) General Population (FSA and DOH, 2010)
Total fat (% energy) 39 33 33
Saturated fat (% energy) 15 10 12
Total Carbohydrate (% energy) 43 47 45
Alcohol (% energy) 6 5 6
Protein (% energy) 15 15 16.5
Salt (g/day) 7.4 6 6.1
NSP (g/day) 11 18 14
Calcium (mg/day) 882 RNI: 700mg 824
Vitamin C (mg/day) 78 RNI: 40mg (Smokers: 80mg) 94
Table 33. Baseline nutrient intake in comparison to the dietary reference values and current intakes of the general population

220
completing the food diary accurately. This incentive may have resulted in more
careful self reporting. Secondly, there was a potential source of personal bias. I
carried out the analyses of the food diaries and I am keenly aware of underreporting,
so where there was ambiguity I tended to over rather than underestimate.
5.1.1.4.2. The Healthy Choice Index (HCI)
Despite good correlation between measures of nutrient intake from the food diary
and the HCI, investigating the levels of agreement between these two measures
showed that the HCI could not provide a valid estimate to determine high or low
intakes of energy, carbohydrate, fibre, sodium, alcohol, calcium, vitamin C or protein.
The risk in accepting any new clinical measure to replace a gold standard measure
through considering only correlation between the measures rather than their limits of
agreement has been well documented since the 1980s (Bland & Altman, 1986).
However, some studies that do so continue to be published (Paxton et al., 2011).
The HCI was able to estimate fat intake reasonably accurately, giving limits of
agreement from 28% below to 4% above the value obtained from food diary data.
This was accurate enough to differentiate between high, medium and low intakes of
our population. Changes in the frequency of responses to food behaviours, food
choice and physical activity were captured by the HCI. The sample was too small to
look for statistically significant changes between arms and over time. However, it did
show worthwhile improvements in eating behaviours, for example daily breakfast
eating and fruit and vegetable consumption increased and participants chose to eat

221
foods that were high in sugar and fat less frequently. Improvements, that are all
necessary, in the diets of smokers (Stefanikova et al., 2009, Margetts and Jackson,
1993).
However, we have assumed that a reported change in HCI score reflected a change
in behaviour. But, it is possible that after help and support to change behaviours
participants scored what they had learnt they ought to do or what they had agreed
they would do, rather than what they actually did.
The HCI was not a good indicator of whether diets were high or low in many
nutrients, but it may identify large changes in dietary fat and improvements in food
choices and eating behaviours. Future efforts could focus on refining questions to
improve sensitivity to detect smaller changes in fat intake and change in the other
nutrients discussed. It could then be used in an adequately powered sample to test
its validity. Before it can be used as a nutrient assessment tool within clinical trials its
repeatability and sensitivity to dietary change associated with a change in clinical
outcomes is needed.
5.2. The hunger and food craving score (HCS)
5.2.1. Introduction
As discussed in chapter one, there are no scales which capture both hunger and
craving for food or distinguish between these two motivations. In addition, no current
food craving scales are brief enough or designed to be administered daily. We

222
needed such a scale to identify day-to-day change in hunger and food craving, which
may differ by dietary intervention, to show whether hunger and/or food craving is
associated with urges to smoke.
We mirrored the questions on craving for food on the mood and physical symptoms
scale (MPSS) which has been shown to be a reliable measure of cigarette withdrawal
(West, 2004). The MPSS is brief and asks two questions to measure cigarette
cravings: “How much of the time have you felt the urge to smoke in the last 24
hours?” and “How strong have these urges been?” Answers are chosen from a six
point rating.
To capture the amount of time craving food and the strength of food craving we
asked analogous questions. Food craving was broken down into desire for sweet
food, sweet and fatty food, and savoury and fatty food. These categories were
chosen as previous studies have shown an increase in the intake of sweet foods
(Rodin, 1987, French et al., 1996), sucrose and fat (Hall et al., 1989) after smokers
quit. Women typically crave sweet, and sweet and fatty foods. Men typically crave
savoury foods (Pelchat, 1997). The questionnaire also included a question on
hunger and a desire for healthy food, which aimed to assess genuine food need or
hunger (Figure 20).
We measured hunger and food craving at baseline and daily for the first four weeks
after quit day. So how well did the HCI capture different components of food desire
and food need? Was it possible to reduce the data for ease of analyses?

223
Figure 20. Hunger and food craving score (HCS)

224
5.2.2. Method
We checked whether the data from the HCS was suitable for principal components
analysis by doing two tests (UCLA ATA, 2011). Firstly, the Kaiser-Meyer-Olkin
Measure of Sampling Adequacy should have a minimum cut off value of 0.6.
Secondly, Bartlett's Test of Sphericity should show that the correlation matrix is
significantly different from an identity matrix (an identity matrix consists of all the
diagonal elements being one and all off diagonal elements being zero).
We then extracted the main components this questionnaire sought to address, using
principal components analysis with a direct oblimin rotation in SPSS 17. This is the
standard method when the factors are allowed to correlate (a non-orthogonal/oblique
solution). As discussed in chapter three (section 3.1.2) hunger and food craving have
been shown to be interdependent. Components were included using the Kaiser
criterion i.e. if they had an Eigenvalue greater than one.
We reduced the data by creating a „component score‟ from the mean scores of
answered questions showing good internal consistency (r > 0.8). These mean scores
were used in further analyses.
To confirm the internal consistency of component 1, the measure of craving for sweet
or fatty foods, we calculated Cronbach‟s alpha. We did this for one day‟s data each
week, to see if the internal consistency of the questionnaire changed over time.

225
5.2.3. Results
The Kaiser-Meyer-Olkin Measure of Sampling Adequacy and the Bartlett's Test both
met the criteria for suitability to perform a principal components analysis (Table 34).
There were two principal components identified, which together accounted for 80% of
the variance (Table 35, Figure 21).
The first component had a high correlation (>0.8) on all the questions relating to
cravings for sugary or fatty foods both in the pattern (Table 36) and structure matrix
(Table 37). I called this component „food desire‟, the score of which was a mean of
answers to questions 2a, 2b, 2c, 3 and 4 (Figure 20). The second component was
most highly correlated with a desire for healthy food (r=0.9) both in the pattern and
structure matrix. It was also more weakly correlated with „genuine hunger‟ (r=0.7). I
called this component „food need‟ and it was scored solely on healthy food desire as
the plot in rotated space showed „genuine hunger‟ to be midway between component
1 and 2 (Figure 22).
There was good internal consistency of the elements that made up food desire at
various point in time (Table 38).

226
Kaiser-Meyer-Olkin Measure of Sampling Adequacy 0.6
Bartlett's Test of Sphericity Approx. Chi-Square 63.0
df 21.0
Sig. <0.001
Table 34. Kaiser-Meyer-Olkin and Bartlett‟s Test for the HCS
Component
1 2
Hunger 0.542 0.730
Sweetcraving 0.875 0.167
Sweetfatcraving 0.864 0.251
Sweetsavourycraving 0.788 0.037
Timecravingsugarandfat 0.972 0.156
Strengthofcraving 0.969 0.173
Healthyfoodcraving -0.002 0.899
Table 36. Pattern matrix for components 1 and 2
Component
Initial Eigenvalues
Rotation Sums of Squared
Loadingsa
Total % of
Variance Cumulative
% Total
1 4.3 62.1 62.1 4.3
2 1.2 17.6 79.7 1.5
3 0.7 10.4 90.1
4 0.5 7.2 97.3
5 0.1 2.0 99.3
6 0.0 0.6 99.9
7 0.0 0.1 100.0
Table 35. Total variance explained by component extraction from the HCS

227
Component 1 2
Hunger 0.424 0.653
Sweetcraving 0.873 0.009
Sweetfatcraving 0.846 0.097
Sweetsavourycraving 0.808 -0.109
Timecravingsugarandfat 0.976 -0.020
Strengthofcraving 0.970 -0.003
Healthyfoodcraving -0.170 0.930
Table 37. Structure matrix for components 1 and 2
Figure 21. Scree plot of components in the HCS

228
Figure 22. Component plot in rotated space using oblimin rotation
Day since quit date cronbach's alpha
1 0.9
7 0.9
14 0.9
27 0.8
Table 38. Cronbach‟s alpha for Component 1 „food desire‟ over time

229
5.2.4. Discussion
The HCS captured two different motivations to eat, the first was a craving for sweet
or fatty foods and the second was desire to eat healthy foods. The high correlation
between the elements in the first component, lent itself well to data reduction. This
suggests that it may not be necessary to capture craving for sweet, sweet and fatty
or sweet and savoury foods separately as discussed in Toll‟s paper (Toll et al., 2008).
Rather, grouping the desire for these foods together may be just as reliable measure.
The second component was unexpected; it did not fit well with the notion of genuine
hunger. Although hunger can be differentiated from craving as a drive for any food
type and the healthy foods defined here were in direct contrast to the fatty and
sugary foods usually craved (White, 2002). However, the expected defining question
on hunger was strongly correlated to both components so we are still some way from
defining this as a separate entity from food craving.
One limitation of developing a brief questionnaire, such as this, was that we could not
measure all dimensions of food craving such as perceived positive affect (Toll et al.,
2008, Nijis et al., 2007), loss of control, preoccupation and emotional craving (Nijis et
al., 2007). Instead, we focused on intensity of craving, the feeling most likely to lead
to impulsive behaviour rather than preoccupation; the behavioural aspects were left
to speak for themselves as outcomes on smoking and weight. In addition, we used
the words „crave and want‟ in contrast with „genuine and need‟ without further
explanation of their meaning, so they were open to interpretation. For some people
the distinction between the two may have been unclear.

230
Future efforts to differentiate between hunger and food craving require us to
backtrack a little. We need to expand our questionnaire further before reducing it to
the brief tool that we needed. Our questions and definitions need to incorporate more
dimensions of hunger and craving which clarify the differences between the two. It
would be helpful to start with a qualitative study to understand whether and how
people conceptualise, express notions of craving or desire for food, and differentiate
these from more physiological notions of hunger.
The value of developing this tool goes beyond smoking cessation studies; measuring
food craving is being developed for research into the causes and treatments of
obesity, mood disorders and addictions. However, none of these have sought to
differentiate between physiological hunger and the more impulsive based food
craving, which could be confused.
5.3. Measure of confidence in trial arm
5.3.1. Introduction
Blinding of participants is the usual method to avoid participants‟ expectations
affecting the apparent response to treatment (Altman et al., 2001). Participants who
know the treatment they receive may have favourable or unfavourable expectations
of it. If they are assigned to a treatment they do not think will work or a control group,
they may become disheartened and drop out early.

231
It was impossible to blind the different dietary interventions in DeMiST so participants
were asked, prior to randomisation, which treatment they were most confident would
be successful. We used this to determine whether expectation of success in the
allocated treatment was associated with attrition.
5.3.2. Method
We coded participants according to whether they were randomised into the arm
which they thought would be most successful or not. We then compared the
association between this and the mean length of retention in the study using
unadjusted linear regression in SPSS 17.
5.3.3. Results
Most participants (10/16, 63%) thought the IDAP arm had the greatest chance of
success, (5/16, 31%) thought the VLCD would be most effective and one participant
thought the SBS arm would be most successful. Sixty-three percent of participants
(10/16) received the arm they thought would be successful and 37% (6/16) did not.
Unadjusted linear regression showed no significant association between considering
a treatment would be successful and length of time staying in the treatment
programme (Table 40). The mean difference showed those who did not receive the
allocation they thought would be successful stayed in the study -0.3 weeks [-3.2, 2.6]
less than those who did. However, confidence intervals around this mean difference
were large. In addition, semi-structured interviewing revealed some very strong

232
feelings of disappointment in those receiving SBS, which was interpreted as a control
group, a treatment that they did not feel met their needs (chapter four).
Regression
coefficient Standard
error
p value
95% LCI 95% UCI
(Constant) 9.3 0.8 7.5 11.1
Received allocation thought successful
-0.3 1.3 0.826 -3.2 2.6
Reference category: did not receive the treatment thought successful
Table 39. Unadjusted linear regression coefficient with 95% confidence intervals for association between participants who received the allocation they considered to be successful and the length of time they stayed in study
5.3.4. Discussion
There was no evidence that participants dropped out of DeMiST early because they
did not receive the treatment they thought had the most chance of success. As
discussed previously in section 4.2.3.2 there are many trials which have examined
the association of receiving preferred treatment on attrition, overall these have not
found an association.
However, our qualitative findings suggest that participants had strong feelings of
disappointment when they did not receive their favoured treatment but other reasons
for attrition were given, for example life circumstances becoming difficult and failure
to stop smoking (chapter four).

233
6. DeMiST RESULTS: CHANGES IN CIGARETTE CRAVING, SMOKING
STATUS AND PHYSICAL MEASURES BY TRIAL ARM
6.1. Introduction
The primary objective of DeMiST was to determine acceptability and feasibility of
running a dietary intervention trial in smoking cessation clinics, which was discussed
in chapter four.
Chapter six contains the results of the quantitative measurements collected to meet
the secondary and tertiary outcomes, the measurement of which have been
described in detail in chapter three. This fulfils objective seven: to report on the
effects of the dietary interventions on urges to smoke and whether this is a result of
change in desire for food or ketosis, and objective eight of the thesis: to report on the
effects of dietary interventions on body weight and chronic disease risk factors in
quitting smokers.
We have included analysis for data up to the end of treatment. Data was not
available at all time points, in particular, six month and 12 month follow up data was
not available at the time of completing this PhD so long term outcomes were not
included.

234
The outcomes assessed were:
The effects of each intervention on cigarette cravings and whether this was
mediated by hunger or ketosis,
Smoking cessation rates in each intervention arm,
Weight gain according to treatment arm. In addition, we included a sub-group
analysis splitting by those who abstained (abstainers) and those who lapsed
back to smoking but did not abandon their quit attempt (lapsers)?
The effects of each intervention on body composition, cardiovascular risk
factors, blood glucose and lung function.
We were unable to recruit sufficient people to test the hypothesis that cravings would
be worsened by hunger, but would improve with ketosis. Nevertheless, we have
analysed the data using the same methods, as we would have done if we had been
able to recruit full numbers. The reasons for this were two-fold. Firstly, they allowed
me to show that I can carry out such analyses for the purposes of the PhD and
secondly allow us to identify large effects that may provide preliminary evidence for
these interventions.
As described in the protocol (section 3.7 ) we analysed data in completers to
investigate efficacy of interventions if they were taken as planned. Sub-analyses and
modelling excluded those who were not adherent to the VLCD (verified by the
absence of urinary ketones). Then we carried out intention to treat analyses (ITT),
which accounted for people who began treatment but dropped out.

235
ITT gives a pragmatic estimate of benefit were the intervention to be used in clinical
practice (rather than the potential benefit in those who receive treatment exactly as
planned). Without ITT analyses falsely positive results are common, as those with
poor outcomes may drop out of the intervention and bias the results (Hollis and
Campbell, 1999). Where there were missing values, we imputed baseline
observation carried forward (BOCF).This assumed that all those who dropped out of
the trial early relapsed to smoking and regained lost weight. Where there was
missing data but participants had not dropped out, a mean of their weight measured
immediately before and after was imputed. Imputation from available longitudinal
data for a particular person is considered the most reliable way of dealing with
missing data (Engels and Diehr, 2003).
As described in the protocol (section 3.7) we focused on outcomes at the following
key time points. Firstly we did so regardless of smoking status and then in abstainers
and lapsers only. Change in anthropometrics (measurements of weight, waist and
hip) were investigated:
From baseline to prequit week, to give an idea of the effects of diet before
quitting,
From baseline to the first week post quit date – when abstinence rates are
likely to be highest and differences between the trial arms can be most clearly
seen3.4.3,
At four weeks post quit date which defines the end of Stage 1 of treatment
and the Russell standard of abstinence
At the end of Stage 2 of treatment (12 weeks post quit) when the control
group will have received the IDAP intervention.

236
Multilevel modelling of the trajectory of weight change and change in fat mass used
all the weekly time points to investigate the effects of trial arm and smoking status. In
addition we investigated the mediating effects of change in fat intake and HCI score
on change in fat mass as discussed in the previous chapter .
We modelled the trajectory of cigarette cravings using daily measures during the first
four weeks of treatment. We paid particular attention, as per protocol, to the change
from baseline cigarette craving score in the first 24 hours and during the first week
when differences between trial arms were expected to be at their highest. In the
multilevel model this was taken into account using a time*trial interaction. Multilevel
modelling was carried out using MLwiN 2.20 software.
The most sensitive approach for detecting differences in cravings between trial arms
is to adjust for baseline cravings as a covariate (West et al., 2006). However as the
sample size was so small we used change in craving score rather than baseline
score as a covariate, to minimise the number of variables in the model. Multilevel
modelling between individuals at level two is limited by the level two sample size and
follows the same rules as single level regression.
To minimise overfitting we did not test all the explanatory and mediating variables in
one model, as we would have liked, instead we tested them individually in separate
models as described in later sections. Even so, in such a small sample we could not
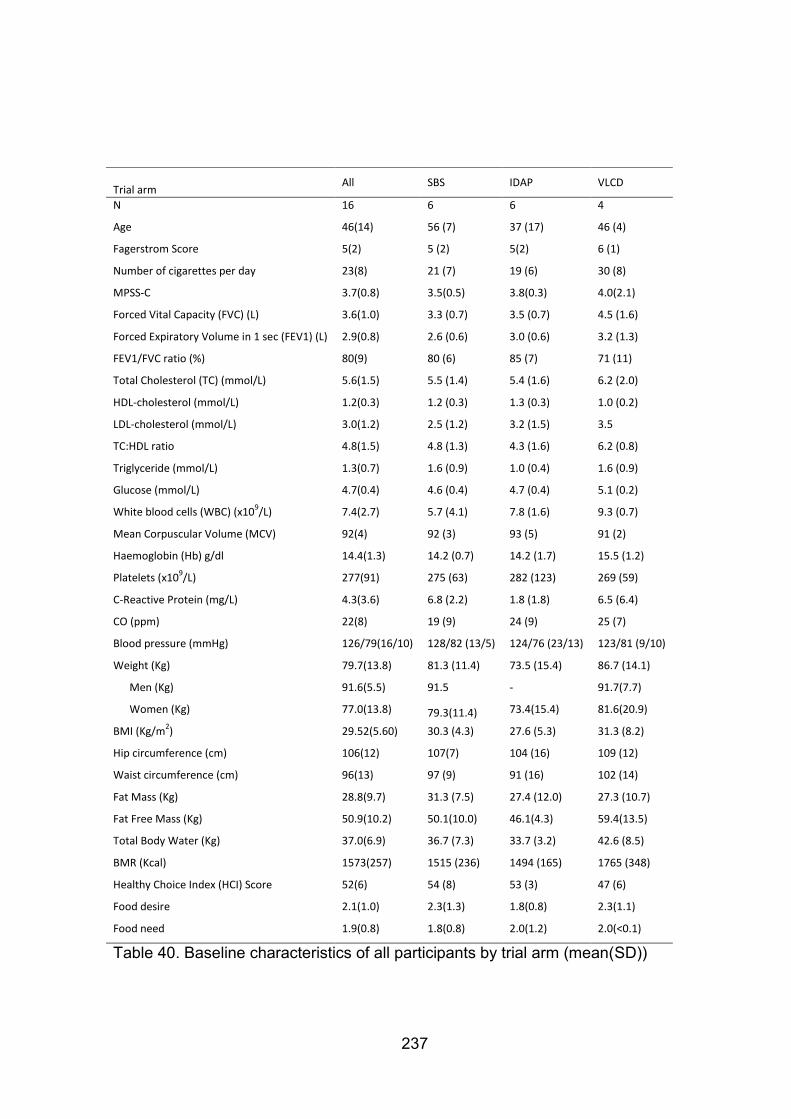
237
Trial arm
All SBS IDAP VLCD
N 16 6 6 4
Age 46(14) 56 (7) 37 (17) 46 (4)
Fagerstrom Score 5(2) 5 (2) 5(2) 6 (1)
Number of cigarettes per day 23(8) 21 (7) 19 (6) 30 (8)
MPSS-C 3.7(0.8) 3.5(0.5) 3.8(0.3) 4.0(2.1)
Forced Vital Capacity (FVC) (L) 3.6(1.0) 3.3 (0.7) 3.5 (0.7) 4.5 (1.6)
Forced Expiratory Volume in 1 sec (FEV1) (L) 2.9(0.8) 2.6 (0.6) 3.0 (0.6) 3.2 (1.3)
FEV1/FVC ratio (%) 80(9) 80 (6) 85 (7) 71 (11)
Total Cholesterol (TC) (mmol/L) 5.6(1.5) 5.5 (1.4) 5.4 (1.6) 6.2 (2.0)
HDL-cholesterol (mmol/L) 1.2(0.3) 1.2 (0.3) 1.3 (0.3) 1.0 (0.2)
LDL-cholesterol (mmol/L) 3.0(1.2) 2.5 (1.2) 3.2 (1.5) 3.5
TC:HDL ratio 4.8(1.5) 4.8 (1.3) 4.3 (1.6) 6.2 (0.8)
Triglyceride (mmol/L) 1.3(0.7) 1.6 (0.9) 1.0 (0.4) 1.6 (0.9)
Glucose (mmol/L) 4.7(0.4) 4.6 (0.4) 4.7 (0.4) 5.1 (0.2)
White blood cells (WBC) (x109/L) 7.4(2.7) 5.7 (4.1) 7.8 (1.6) 9.3 (0.7)
Mean Corpuscular Volume (MCV) 92(4) 92 (3) 93 (5) 91 (2)
Haemoglobin (Hb) g/dl 14.4(1.3) 14.2 (0.7) 14.2 (1.7) 15.5 (1.2)
Platelets (x109/L) 277(91) 275 (63) 282 (123) 269 (59)
C-Reactive Protein (mg/L) 4.3(3.6) 6.8 (2.2) 1.8 (1.8) 6.5 (6.4)
CO (ppm) 22(8) 19 (9) 24 (9) 25 (7)
Blood pressure (mmHg) 126/79(16/10) 128/82 (13/5) 124/76 (23/13) 123/81 (9/10)
Weight (Kg) 79.7(13.8) 81.3 (11.4) 73.5 (15.4) 86.7 (14.1)
Men (Kg) 91.6(5.5) 91.5 - 91.7(7.7)
Women (Kg) 77.0(13.8) 79.3(11.4) 73.4(15.4) 81.6(20.9)
BMI (Kg/m2) 29.52(5.60) 30.3 (4.3) 27.6 (5.3) 31.3 (8.2)
Hip circumference (cm) 106(12) 107(7) 104 (16) 109 (12)
Waist circumference (cm) 96(13) 97 (9) 91 (16) 102 (14)
Fat Mass (Kg) 28.8(9.7) 31.3 (7.5) 27.4 (12.0) 27.3 (10.7)
Fat Free Mass (Kg) 50.9(10.2) 50.1(10.0) 46.1(4.3) 59.4(13.5)
Total Body Water (Kg) 37.0(6.9) 36.7 (7.3) 33.7 (3.2) 42.6 (8.5)
BMR (Kcal) 1573(257) 1515 (236) 1494 (165) 1765 (348)
Healthy Choice Index (HCI) Score 52(6) 54 (8) 53 (3) 47 (6)
Food desire 2.1(1.0) 2.3(1.3) 1.8(0.8) 2.3(1.1)
Food need 1.9(0.8) 1.8(0.8) 2.0(1.2) 2.0(<0.1)
Table 40. Baseline characteristics of all participants by trial arm (mean(SD))

238
rule out over-fitting and so conducted the analysis predominately to demonstrate my
ability to do so and ability to interpret these analyses. Therefore, we interpreted our
coefficients and model plots cautiously with careful reference to how well the models
fitted the raw data.
6.2. Results
6.2.1. Baseline characteristics
As we were unable to randomise more than fourteen participants into DeMiST 1 and
two participants into DeMiST 2 it was not possible to analyse DeMiST 1 and 2
separately and then combine them in a meta-analysis as we had planned. Instead to
maximise the data we had we combined the results and adjusted for baseline
differences.
Participants were overweight (Table 40), white European population in middle age,
heavy smokers and predominantly female. The majority had a mortgage or owned
their home, and were in employment. Half were educated up to secondary school
level and a quarter had a professional qualification (Table 41).
If we had recruited the full sample size, no difference in baseline characteristics
between the groups would have been expected, as randomisation determined
allocation into each trial arm. Randomisation, based on the theory of probability,
generates similar numbers in the three trial arms that have an approximately equal
distribution of known and unknown potential confounders. Therefore, any differences

239
should be due to chance alone rather than a reflection of selection bias (Altman et
al., 2001).
Trial arm All SBS ITDA VLCD
Gender
Male 19% 1/6 - 2/4 Female 81% 5/6 6/6 2/4 Ethnicity
White 100% 6/6 6/6 4/4
Pakistani - - -
Bangladeshi - - -
Indian - - -
Black-African - - -
Black Caribbean - - -
Black-other - - -
Chinese - - -
Other groups – Asian - - -
Other groups – other - - -
Car ownership
No car - - -
I car 69% 2/6 6/6 3/4
2 or more cars 31% 4/6 - 1/4 Home ownership
Owning it/Buying it 56% 5/6 2/6 2/4
Renting it 38% 1/6 4/6 1/4
Not disclosed 6% - - 1/4 Educational level
Secondary 50% 3/6 2/6 3/4
Sixth Form 6% 1/6 - -
Professional/Technical
25% 1/6 3/6 -
University/Polytechnic Degree
13% - 1/6 1/4
Still In Full-time Education
- - -
None of the above 6% 1/6 - - Employment
In paid employment 75% 3/6 5/6 4/4
Unemployed 13% 2/6 - -
Looking after home 13% 1/6 1/6 -
Retired - - -
Full-time Student - - -
Medical history
Depression/Anxiety 20% 1/6 1/6 1/4
Table 41. Baseline characteristics all participants and by trial arm (Frequency)

240
However, with our small sample and combining DeMiST 1 and DeMiST 2 participants
there were moderate differences between trial arms such as age and gender (Table
40, Table 41). These may have influenced change in weight so we adjusted for these
in analyses of weight and body fat changes.
6.2.2. Cigarette craving
Baseline MPSS-C in smokers, measured before they attempted to quit was
approximately four in all trial arms (Table 40), scored from a range of zero to six.
There was a mean fall after 24 hours post quit date in the SBS arm (-1.1), a rise in the
IDAP, (0.8) and no change in the VLCD arm. Mean differences between these arms
was clinically, but not statistically different (Table 42). After one week, there was a
reduction in score of approximately two in all arms. After one month, MPSS-C had
reduced most in the VLCD arm and least in the SBS arm (Table 42).
Trajectories of mean change in daily MPSS-C score varied considerably in each trial
arm, perhaps less so in the SBS arm. MPSS-C appeared to fall most towards the end
of the month in those on the VLCD (Figure 23).
We can see from the trajectories in individuals that this variability was not clearly
associated with 7 day point prevalent abstinence or daily smoking (cigarette smoking
was recorded daily in individuals: 21, 26, 30, 31, 32) (Figure 24).

241
Table 42. Mean change(SD) in trial arms and mean difference [95% CI] between trial arms in MPSS-C after 24 hours, 7 days and 1 month post quit date (ANOVA with Gabriel post hoc tests)
Change from baseline in: SBS (n=5) IDAP (n=3) VLCD (n=2) VLCD-SBS IDAP-SBS VLCD-IDAP
After 24 hours MPSS-C
-1.1 (0.7) 0.8 (1.7) 0.0 (0.7) 1.1[-1.7, 3.9]
1.9[-0.6, 4.4] -0.8[-4.0, 2.3]
After 7days MPSS-C
-1.8(0.8) -2.0(0.9) -2.0(2.1) -0.2[-2.9, 2.5] -0.2[2.6, 2.2] 0.0[-3.0, 3.0]
After 1month MPSS-C
-1.1(1.0) -2.5 -4.5 -3.4 -1.4 -2.0
Figure 23. Mean change in MPSS-C score in each trial Arm (1=SBS, 2=IDAP, 3=VLCD)

242
1= Abstinent 0=Lapsed
Figure 24. Trajectories of Cigarette craving for individuals

243
6.2.3. Modelling of trajectories of cigarette craving by trial arm
We used seven random effects models to investigate differences in change in
MPSS-C score by trial arm, adjust for smoking status, and explored the mediating
effects of food desire and food need on cigarette cravings. Ketosis characterised
those adhering to the VLCD. Model one was an unadjusted linear function of
change in craving score over time, we added trial arm variables to create model
two. We compared these models using chi squared to see if adjusting for trial arm
improved the fit of the model. We then created models to investigate the mediating
effects of food desire (model 3), food need (model 4), and abstinent/lapsed status
(model 5) on the differences of trial arm.
There was no statistically significant improvement in fit when we included trial arm
(Model 1 to 2,Table 43). However, the coefficient for trial arm showed that each
day mean craving score in the VLCD arm was 1.0 less than in the SBS arm (the
SBS arm was the reference category in which MPSS-C score fell by a mean 0.9
from baseline) (Model 2, Table 44). If this were the true difference between the
VLCD and SBS diets then this would be of clinical relevance. By comparison the
Danielsson trial showed craving score fell by 0.5 in VLCD compared to the control
arm, which was associated with improved abstinence (Danielsson et al.,
1999)(section 3.1).
Adding food desire (Model 2 to 3, Table 43) and food need (Model 2 to 4, Table
43) significantly improved the fit of the model. However, including these variables

244
did not mediate/explain the difference in cigarette craving by trial arm. Mediation
would be shown if the coefficients for trial arm reduced substantially by including
these terms, but as Table 44 shows this did not happen. The VLCD coefficient
remained approximately -1.0.
The magnitudes of the coefficients for food desire (0.1 (Model 3)) and food need
(0.1(Model 4)) were too small to be clinically relevant (Table 44). These
represented a 0.1 increase in craving score with a one unit increase on a six point
scale (zero being the least desired and five being the most desired) of food desire
and a five point scale (zero to four) of food need.
Adjusting for complete abstinence and lapses to smoking a cigarette significantly
improved the model fit (Model 2 to 5, Table 43), and suggested that total
abstinence was associated with a reduction in MPSS-C score of 0.4. However it
did not explain the difference in craving between trial arms as the coefficients for
trial arm changed very little (Model 2 compared to model 5, Table 44 ).
We allowed the effects of trial arm to vary over time as the plots of the mean
trajectories by trial arm suggested these might differ (Figure 23). To do this we
included a time by trial interaction term (model 7). This significantly improved the
fit of the model (Table 43) and the model fit better with the observed data.
Piasecki, in 2003, found that the best fitting curve for cigarette cravings was a
quadratic one, so we added in a trial arm by time squared interaction. This did not

245
significantly improve the fit further (Model 8, Table 43) and including this risked
overfitting the model. However, visually comparing both the linear model (Figure
25) and the quadratic model slopes (Figure 26) to the observed mean (Figure 23)
showed that the quadratic model appeared to fit best. However, these models did
not capture or explain the dramatic peaks and troughs which varied within and
between individuals (Figure 24).
Model Steps -2LL -2LL Chi df p
1 to 2 619.49 616.98 2.51 2 0.285
2 to 3 616.98 504.31 112.68 1 0.000*
2 to 4 616.98 585.06 31.92 1 0.000*
2 to 5 616.98 613.08 3.090 1 0.048*
2 to 6 616.98 606.12 10.86 2 0.001*
2 to 7 606.12 603.75 2.36 2 0.125 *statistically significant improvement in fit of model to data p<0.05.
Model 1: change in craving score, according to linear function of time. Model 2: model 1 plus trial arm. Model 3: model 2 adjusted for food desire. Model 4: model 2 adjusted for food need. Model 5: model 2 adjusted for abstinence. Model 6: model 2 plus trial arm*time interaction. Model 7: model 6 plus trial arm*time
2 interaction.
Table 43. Difference in fit between models 1 to 7 for trajectory of change in cigarette craving

246
*statistically significant improvement in fit of model to data p<0.05. Model 1: change in craving score, according to linear function of time. Model 2: model 1 plus trial arm. Model 3: model 2 adjusted for food desire. Model 4: model 2 adjusted for food need. Model 5: model 2 adjusted for abstinence. Model 6: model 2 plus trial arm*time interaction. Model 7: model 6 plus trial arm*time
2 interaction.
Table 44. Coefficients of multilevel models 1 to 7 for cigarette cravings
Model 1 S.E. 2 S.E 3 S.E 4 S.E. 5 S.E. 6 S.E. 7 S.E.
Fixed Part
cons -1.116 0.282 -0.913 0.343 -0.747 0.354 -0.932 0.334 -0.561 0.374 -1.081 0.335 -1.321 0.387 Days post quit date (Time) -0.002 0.009 -0.003 0.009 -0.011 0.008 -0.001 0.009 -0.007 0.009 0.01 0.011 0.061 0.044
IDAP
-0.007 0.542 0.016 0.640 -0.027 0.526 -0.149 0.523 0.062 0.554 0.466 0.642
VLCD
-0.994 0.616 -1.022 0.620 -0.912 0.593 -1.282 0.607 -0.098 0.635 -0.106 0.736
Food desire
0.054 0.108
Food need
-0.112 0.096
Abstinent
-0.388 0.195
IDAP*Time
-0.003 0.021 -0.094 0.081
VLCD*Time
-0.08 0.024 -0.076 0.088
Time*time
-0.002 0.002
Time*time*IDAP
0.003 0.003
Time*time*VLCD
0 0.003
Random Part
Level: Participant ID
cons/cons 0.656 0.314 0.494 0.242 0.501 0.255 0.443 0.22 0.449 0.222 0.421 0.207 0.409 0.202
Level: Time
cons/cons 0.895 0.088 0.896 0.088 0.733 0.077 0.885 0.089 0.883 0.087 0.856 0.084 0.847 0.083
-2*loglikelihood: 619.491
616.981
504.306
583.057
613.079 606.124 603.766
Units: Participant ID 10
10
9
10
10 10 10
Units: Time 217 217 190 206 217 217 217

247
Figure 25. Plot of fixed effects of trial arm dependent on time on MPSS-C from model 7
Figure 26. Plot of fixed effects of trial arm dependent on time squared on MPSS-C from model 10
Trial arm SBS IDAP VLCD
Trial arm SBS IDAP VLCD

248
6.2.4. Change in food desire and food need by trial arm
In examining whether the effects of trial arm on cravings are mediated by food
desire and/or food need, we have made two assumptions. One that food desire
and/or food need is dependent on trial arm and two that cigarette craving is
dependent on desire and/or food need, but so far, we have not examined these
independently. We do so in this section with the use of seven models. (Food
desire and food need were measured using the HCS).
6.2.5. Is food desire and /or food need affected by trial arm?
Model 1 is the change in food desire over time; we tested with chi square whether
the fit of this model improved by adding in the explanatory variable, trial arm
(Model 2). We found that the improvement in fit did not reach statistical
significance (Table 45), but the difference in hunger score between trial arms, as
shown by the coefficients were quite large. On a scale of 1 to 6, food desire was
reduced during this time by a mean 0.7 points in the SBS arm. Whereas in the
IDAP arm its increase was 1.3 points higher than in the SBS arm and in the VLCD
arm it was 0.7 points higher than in the SBS (Table 46).
Model 3 is the change in food need over time; we tested with chi square whether
the fit of this model improved by adding in the explanatory variable, trial arm
(Model 4). We found that the improvement in fit did not reach statistical
significance (Table 45), but the difference in food need score between trial arms,

249
as shown by the coefficients were again quite large. On a scale of 1 to 6, food
need increased slightly in the SBS arm (0.4) but it was 1.7 points less in the IDAP
arm than in the SBS arm and 0.7 points less in the VLCD than in the SBS arm
(Table 46).
*statistically significant improvement in fit of model to data p<0.05.
Model 1: change in food desire, according to linear function of time. Model 2: model 1 plus trial arm. Model 3:change in food need, according to linear function of time. Model 4: model 3 plus trial arm
Table 45. Difference in fit between models 1 to 4 for trajectory of change in food desire and food need
Model 1 S.E. Model 2 S.E. Model 3 S.E. Model 4 S.E.
Response Food desire
Food desire
Food need
Food need
Fixed Part cons -0.351 0.356 -0.799 0.409 -0.081 0.391 0.371 0.51
Time -0.007 0.005 -0.007 0.005 -0.024 0.006 -0.025 0.006
Cigarette craving IDAP
1.317 0.759
-1.017 0.827
VLCD
0.702 0.756
-0.733 0.946
Random Part Level: Participant ID
cons/cons 1.089 0.521 0.8 0.385 1.465 0.665 1.255 0.571
Level: Time cons/cons 0.292 0.031 0.292 0.031 0.37 0.037 0.37 0.037
-2*loglikelihood: 345.989
343.229
423.149
421.599 Units: Participant
ID 9
9
10
10 Units: Time 191 191 206 206
Model 1: change in food desire, according to linear function of time. Model 2: model 1 plus trial arm. Model 3:change in food need, according to linear function of time. Model 4: model 3 plus trial arm
Table 46. Coefficients of multilevel models 1 to 4 for food desire and food need
Model Steps -2LL -2LL Chi df p
1 to 2 345.989 343.229 2.76 2 0.097
3 to 4 423.149 421.599 1.55 2 0.213

250
Therefore this shows that our measure of food craving (food desire) fell in the
control (SBS) arm where people were allowed to eat freely, but by comparison it
increased the most in the IDAP arm but was unaffected in the VLCD arm. Our
measure of hunger (food need) was largely unchanged in the SBS arm, but fell by
comparison in the VLCD arm and fell the most in the IDAP arm. So it would seem
that food craving rather than actual hunger becomes the stronger motivation to eat
and is felt most keenly in the IDAP arm.
6.2.6. Is cigarette craving affected by food desire and /or food need?
The fit of the model of cigarette craving over time was statistically significantly
improved by adding in both food desire and food need as explanatory variables
(Table 47). However, the coefficients of food desire and food need seemed too
small to have any meaningful influence on craving (Table 48). So this lack of
meaningful association accounts for the lack of evidence we found for food craving
and hunger mediating the difference in cigarette craving by trial arm, and suggests
the difference in craving by trial arm is caused by another mechanism.

251
Model Steps -2LL -2LL Chi df p
5 to 6 619.491 506.875 112.616 1 <0.001*
5 to 7 619.491 585.359 34.132 1 <0.001*
*statistically significant improvement in fit of model to data p<0.05. Model 5: change in cigarette craving, according to linear function of time. Model 6: model 5 plus food desire. Model 7: model 5 plus food desire
Table 47. Difference in fit between models 5 to 7 examining change in food desire and food need on the trajectory of change in cigarette craving
Model 5 S.E. Model 6 S.E. Model 7 S.E.
Fixed Part cons -1.114 0.285 -0.979 0.303 -1.124 0.271
time -0.002 0.009 -0.01 0.008 0 0.009
food desire
0.038 0.108 food need
-0.101 0.097
Random Part Level: Participant ID
cons/cons 0.656 0.314 0.688 0.343 0.574 0.279
Level: time cons/cons 0.895 0.088 0.733 0.077 0.885 0.089
-2*loglikelihood: 619.491
506.875
585.359 Units: Participant
ID 10
9
10 Units: time 217
190
206
Model 5: change in cigarette craving, according to linear function of time. Model 6: model 5 plus food desire. Model 7: model 5 plus food desire
Table 48. Coefficients of multilevel models 5 to 7 for which examine food desire and food need on cigarette craving

252
6.2.7. Change in smoking status - time to relapse
All those in the IDAP and VLCD arms had either relapsed to smoking or dropped
out and assumed relapsed back to smoking by 12 weeks (Table 49) although we
know that one person became abstinent later on in the VLCD arm, after initial
weight loss (ID 31, Figure 32).
The median time to relapse was early at 1 and 2 weeks in the IDAP and VLCD
arms respectively (Table 49, Figure 27). The hazard ratios from Cox regression
using the SBS arm as the reference category show those in the IDAP arm were
almost 4 times more likely to relapse than those in the SBS arm. And those in the
VLCD arm were 8 times more likely to relapse than those in the SBS arm. These
differences did not reach statistical significance, but we cannot exclude type two
error as the sample size was small and confidence intervals wide giving imprecise
results.

253
Trial Arm Median time to relapse (weeks)
Number of relapses/Total number in arm
HR [95%CI] for relapse to smoking
SBS 2/6 Reference Category IDAP 1 6/6 3.7 [0.7 , 18.8] VLCD 2 4/4 7.8[1.2, 50.3]
Table 49. Number of relapses, median time to relapse and hazard ratios of relapse to smoking at 12 weeks according to trial arm
Figure 27. Kaplan Meier curve for survival of abstinence, until relapse to smoking within the first 12 weeks post quit attempt in each trial arm

254
6.2.8. Change in anthropometric, body composition and disease risk factors: completer analysis
Statistically significant differences between trial arms were unlikely considering the
small sample size. The wide 95% confidence intervals (CIs) of many mean
differences (Table 50) show imprecise estimates, so we cannot conclude these
effects were due to chance alone. Therefore, we interpreted the findings in light of
the possible clinical significance of means, bearing in mind the precision of the
estimates. For example, we decided that a clinically important difference in weight
change was approximately 0.5kg per week as this is considered a good rate of
weight loss for the treatment of obesity in the NHS (NICE, 2006, SIGN, 2010).
The exception to this was for change in waist circumference, hip circumference and
blood pressure; these were highly variable, with little obvious trend (Table 50). The
95% CIs for the mean differences between trial arms were so wide as to encompass
biologically implausible changes over a week. In addition, the trial nurses reported
difficulty obtaining accurate waist and hip measurements (chapter four), which adds
to this uncertainty. Therefore, it would be unwise to draw any conclusions from such
data, so although we have presented these measures for completeness, we will not
discuss them further.
6.2.8.1. Prequit change in weight, BMI and body composition
Over the week prior to quitting, weight, BMI, and fat mass reduced by a clinically
significant amount in the IDAP and VLCD arms, but by a clinically insignificant
255
amount in the SBS arm (week 0 in Figure 28, Figure 29). There was a fall in fat free
mass, in particular total body water (which accounted for 82% of fat free mass loss)
in the VLCD arm (week 0 in Figure 30, Figure 31). The standard deviations of these
measurements were large, often exceeding the mean, sometimes several times over,
which indicates that there was wide variation between individuals (Table 50).
The large loss of total body water seen in the VLCD arm is expected; initially
glycogen stores become completely depleted by such severe energy restriction and
water is released as glycogen is converted to glucose.
Those in the VLCD arm lost statistically significantly more weight than those in the
SBS arm. The differences between the VLCD and SBS arm in change in fat mass, fat
free mass and total body water were of clinical importance. Removing those who did
not adhere to the VLCD from the analysis increased the difference between these
two arms (Table 50).There was a clinically important difference in weight change and
in particular fat mass change between the IDAP and SBS arm (0.4kg and 0.5kg
respectively).

256
-12.0
-10.0
-8.0
-6.0
-4.0
-2.0
.0
2.0
4.0
0 1 2 3 4 5 6 7 8 9 10 11 12
Ch
ange
in f
at m
ass(
kg)
Weeks post quit attempt
VLCD
IDAP
SBS
Figure 28. Bar chart of mean change in weight by trial arm, from baseline to week 0, +1, +4 and +12
Figure 29. Bar chart of mean change in fat mass by trial arm, from baseline to week 0, +1, +4 and +12

257
Figure 30. Bar chart of mean change in fat free mass by trial arm, from baseline to week 0, +1, +4 and +12
Figure 31. Bar chart of mean change in total body water by trial arm, from baseline to week 0, +1, +4 and +12

258
Change from baseline in: SBS (n$=6) IDAP (n
$=6) VLCD (n
$=4) VLCD(a)(n=2) VLCD-SBS VLCD(a)-SBS IDAP-SBS VLCD-IDAP VLCD(a)-IDAP
Week 0
Weight (kg) -0.1(0.6) -0.5(1.0) -2.3(1.8) -3.5(1.6) -2.2[-4.1, -0.3]* -3.4[-5.4, -1.5]* -0.4[-2.1, 1.3] -1.8[-3.7, 0.1] -3.03[-4.99, -1.07]*
BMI (kg/m2) -0.01(0.21) -0.18(0.36) -0.84(0.70) -1.25(0.77) -0.83[-1.57, -0.10]* -1.24[-2.04, -0.45]* -0.17[-0.83, 0.49] -0.66[-1.39, 0.07] -1.07[-1.86,-0.27]
Systolic BP -1(12) -2(8) 4(11) 7(16) 4[-14, 22] 7[-17, 31] -1[-18, 15] 6[-12, 23] 9[-15, 32]
Diastolic BP -1(6) 0(3) 2(7) 6(6) 3[-7, 12] 7[-3, 17] 1[-7, 9] 2[-7, 10] 6[-4, 16] Waist circumference (cm) 1(1) -4(6) -2(2) -4 -3[-11,6] -5[-12, 2] 2[-6, 10]
Hip circumference (cm) 1(2) 3(7) 0(3) 1.00 0[-11, 11] 2[-7, 11] -2[ -12, 8]
WHR -0.00(0.02) -0.07(0.13) -0.02(0.27) -0.05 -0.20[-0.22,0.18] -0.7[-0.24,0.10] -0.05[-0.14, 0.23]
Fat mass (kg) -0.2(0.7) -0.6(0.5) -0.5(1.5) -0.8(1.1) -0.3[-1.8,1.2] -0.6[-2.0, 0.8] -0.5[-1.8, 1.2] 0.2 [-1.3, 1.6] -0.2[-1.6, 1.2]
Fat free mass (kg) 0.1(0.8) 0.1(0.9) -1.8(2.0) -2.7(0.4) -1.9[-4.0, 0.2] -2.8[-4.5, -1.0]* 0.1[-1.9, 2.0] -2.0[-4.1, 0.2] -2.8[-4.6, -1.1]*
Total body water (kg) <0.0(0.6) 0.2(0.6) -1.7(1.9) -2.8(1.3) -1.8[-3.6, 0.1] -2.8[-4.3, -1.3]* 0.1[-1.5,1.8] -1.9 [-3.7, -0.1] -2.9[-4.4, -1.4]*
Week +1
Weight (kg) 0.4(0.9) -0.9(0.8) -4.4(3.3) -6.3(0.1) -4.8[-8.1, -1.6]* -6.7[-8.6,-4.9]* -1.3 [-4.0, 1.4] -3.5[-6.6, -0.4]* -5.4[-7.2, -3.6]*
BMI (kg/m2) 0.19(0.36) -0.33(0.29) -1.50(1.18) -2.15(0.48) -1.68[-2.86, -0.50]* -2.34[-3.14, -1.54]* -0.51[-1.50, 0.47] -1.17[-2.30, -0.04]* -1.82[-2.59, -1.06]*
Systolic BP 3(18) -7(2) -6(5) -1(6) -9[-33,16] -11[-40, 18] -10[-32,11] 1[-23,26] -1[-30,29]
Diastolic BP 2(8) -2(9) -6(9) -2(6) -9[-26,9] -4[-23, 15] -4[-19, 11] -5[-2, 12] 0[-19, 19]
Waist circumference (cm) 1(3) -7(9) -5(6) -9 -6[-23, 12] -8[-21, 2] 2[-14, 18]
Hip circumference (cm) 2(1) 1(9) 1(4) -2 -2[-25, 21] -1[-20,18] 0[-19,18]
WHR -0.01(0.01) -0.09(0.18) -3.00 -0.07 -0.04[-0.49, 0.42] -0.07[-0.45, 0.30] -0.03[-0.34, 0.41]
Fat mass (kg) 0.3(1.2) -0.8(0.8) -2.6(1.2) -4.8 -2.9[-5.0, -0.8]* -3.6[-5.3, -1.4]* -1.0[-2.8, 0.7] -1.9[-3.9, 0.1] -2.5[-4.6, -0.4]*
Fat free mass (kg) 0.2(0.9) -0.2(0.4) -1.8(2.1) -3.0 -1.9[-4.1, 0.3] -3.2[-4.6, 1.7] -0.3[-2.1, 1.5] -1.6[-3.7, 0.5] -2.9[-4.3, -1.5]*
Total body water (kg) 0.1(0.6) -0.1(0.3) -1.9(2.3) -3.1 -2.0[-4.1, 0.2] -3.2[-4.6, -1.7]* -0.2[-2.0,1.5] -1.8[-3.8, 0.3] -2.9[-4.3, -1.5]*
#p<0.05 ANOVA *p<0.05 post-hoc Gabriel. Post hoc tests could not be performed in all cases due to small numbers.
$Not complete numbers for all measurements, where no SD, mean is an individual
measurement. (a)= those adherent to VLCD.
Table 50. Mean (SD) change in anthropometrics, body composition and blood pressure from baseline to week 0 and to week +1 in all completers by trial arm and mean difference [95% CI] in these between trial arm

259
6.2.8.2. Change in weight, BMI and body composition, baseline to the end of the first week post quit date
Weight gain in the SBS arm and weight loss in the IDAP arm was attributed to
change in fat mass (week 1 in Figure 28, Figure 29) , but a large proportion of
weight loss in the VLCD arm was due to change in total body water occurring
during the first week (week 1 in Figure 30) (Table 50). During the second week
on a VLCD people lose less water because glycogen stores are exhausted.
Instead fat is metabolized for energy. Loss of body water during the second
week may have occurred because people find it difficult to drink enough water.
When the SBS arm was compared with those adhering to the VLCD arm, there
were statistically and clinically significant differences between the change in
weight, BMI and fat mass (-6.7kg[-8.6, -4.9], -2.34kg/m2[-3.14, -1.54], -3.6kg[-
5.3, -1.4]). Such differences were also clinically important, but not statistically
significant, between the SBS and IDAP arms (-1.3kg, -0.51kg/m2, -1.0kg
respectively) (Table 50).
6.2.8.3. Change in weight, BMI and body composition baseline to the end of Stage 1
Weight, BMI and fat mass had increased in the SBS arm and reduced in the
IDAP and VLCD arms (week 4 in Figure 28, Figure 29). The differences
between the intervention and control arms were clinically important and in
favour of both interventions (Table 51). There was an increased loss of fat free
mass, not explained by body water (-0.9kg) in those adhering to the VLCD
(week 4 in Figure 30, Figure 31). This indicates an unexpected loss of lean

260
body tissue, although this has been a concern with VLCD formulas in the past,
current formulas are tailored to minimise loss of lean tissue (section 3.11.1).
However, useful conclusions cannot be drawn from data on one individual.
6.2.8.4. Change in weight, BMI and body composition, baseline to the end of treatment
No participants in the IDAP arm attended their end of treatment visit (reasons
behind attrition have been explored in chapter four). One participant attended in
the VLCD arm and four in the SBS arm. By this point in the trial both the SBS
and VLCD arm had entered Stage 2 and had received IDAP advice.
In the SBS arm, there was a small further rise in weight (week 12 in Figure 28).
Most of this was fat free mass, 73% of which was body water indicating some of
the increase was lean body tissue (week 12 in Figure 30, Figure 31). Fat mass
was slightly above baseline at this point (0.2kg) indicating that the gain seen
after four weeks (0.6kg) had reduced during Stage 2 (week 12 in Figure 29,
Table 51). In the VLCD arm approximately half of the weight lost was regained
by the end of treatment, although the amount lost from baseline was still
clinically significant (-4.6kg). Body composition analysis indicated that most of
this weight regain was fat mass (+3.0kg) (week 12 in Figure 29) with an
accompanying loss of fat free mass (-7.6kg) (week 12 in Figure 30) 92% of
which was body water (-7.0kg) (week 12 Figure 31, Table 51). Changes in
trends over time are explored more fully using multilevel modelling in section
6.2.18 .

261
Table 51. Mean (SD) change in anthropometrics, body composition and blood pressure from baseline to week +4 and to week +12 in all completers by trial arm and mean difference [95% CI] in these between trial arm
Change from baseline in:
SBS (n
$=5)
IDAP (n
$=3)
VLCD (n=1)
VLCD-SBS
IDAP-SBS
VLCD-IDAP
Week+4
Weight (kg) 1.0 (0.8) -1.2 (1.7) -8.6 -9.6#
-2.2#
-7.4#
BMI (kg/m2) 0.38(0.31) -0.49 (0.66) -2.54 -2.92
# -0.87
# -2.05
#
Systolic BP 4(11) -17(9) 3 -1 -22 20
Diastolic BP 3(9) -2 (9) 12 9 -5 14
Waist circumference (cm)
4(<0) -8 (9) -12 -16 -12 -4
Hip circumference (cm) 1 4 (11) -3 -4 3 -7
WHR 0.03 -0.12 (0.18) -0.09 -0.12 -0.15 0.03
Fat mass (kg) 0.4(1.5) -1.2 (1.6) -4.8 -5 -1.6 -3.6
Fat free mass (kg) 0.6(0.9) -0.1 (0.5) -3.8 -4.4#
-0.7#
-3.7#
Total body water (kg) 0.4(0.7) -0.0 (0.3) -2.9 -3.3#
-0.5#
-2.9#
Week +12
Weight (kg) 1.2 (2.2) -4.6 -5.8 -1.2
BMI (kg/m2) 0.45(0.78) -1.79 -2.24 -0.45
Systolic BP 1 (7) -9 -10 -1
Diastolic BP -3(18) 12 15 3
Waist circumference (cm)
-3(6)
Hip circumference (cm) 2(1)
WHR
Fat mass (kg) 0.2(2) 3.0 2.9 -0.2
Fat free mass (kg) 1.0(0.5) -7.6 -8.6#
-1.0#
Total body water (kg) 0.7(0.4) -7.0 -7.7#
-0.7#
#p<0.05 ANOVA Post hoc tests could not be performed due to small numbers
$Not complete
numbers for all measurements, where no SD, mean is an individual measurement.

262
6.2.8.5. Change in lung function, blood glucose and cardiovascular risk parameters at the end of treatment
Data on change in lung function was only available for the SBS arm and showed lung
function reduced by a clinically irrelevant amount over the course of treatment (Table
52). (Known large intra-individual variability in measured lung function means a
clinically meaningful change in forced expiratory volume in 1 second (FEV1) should
exceed 15% (Brusasco, 2009).
Blood glucose rose slightly in SBS and less so in IDAP, where dietary intervention
had been present in both Stage1 and 2. Plasma lipid profile improved more in the
IDAP arm than the SBS arm. The differences in change between these arms were
clinically, although not statistically, significant as calculated as a percentage of the
baseline value (Table 52) (10% and 18% improvement in TC:HDL ratio and
triglycerides respectively). Most other markers of cardiovascular risk, elevated CRP,
WBC, platelets, MCV and Hb (Lloyd-Jones et al., 2006, Libby et al., 2002, Davi &
Patrono, 2007, Lowik et al, 1992) improved in both arms; generally more so in IDAP.
Again, the sample size was too small to draw any conclusions from these changes,
but these differences as a percentage of baseline values were clinically important
(WBC and platelets improved by at 66% and 27% respectively). CRP reduced in both
arms by more than 2.4mg/l (CRP above 2.4mg/l is associated with double the
cardiovascular risk of CRP of 1mg/l (Lloyd-Jones et al., 2006)).

263
Change in: SBS (n$=4) IDAP (n
$=1) IDAP-SBS
Week +12
Week +12
Fasting blood glucose (mmol/L) 0.3(<0.1) 0.2 0.1
Forced Expiratory Volume in 1 sec (FEV1) (L)
-0.1(0.2)
Forced Vital Capacity (FVC) (L) -0.1(0.2)
C-Reactive Protein (mg/L) -3.5(0.7) -4.0 0.7[-10.5, 11.5]
TC:HDL ratio -0.3(0.6) -0.8 0.5[-8.3, 9.3]
LDL-cholesterol (mmol/L) -0.2 -0.3 0.1
HDL-cholesterol (mmol/L) 0.2(0.4) 0.3 -0.1[-6.5, 6.3]
Total Cholesterol (TC) (mmol/L) -0.2(0.6) 0.0 -0.2[-10.1, 9.8]
Fasting triglycerides (mmol/L) 0.2(0.2) -0.1 0.2[-2.2, 2.7]
White Blood Cells (WBC) (x109/L) 3.9(6.2) -1.0 4.9[-90.9,100.6]
Platelets (x109/L) -14(42) -89 75[-585,735]
Mean Corpuscular Volume (MCV) -1(1) 1 -2[-25, 21]
Haemoglobin (Hb) g/dl -0.2(<0.1) -0.4 0.2 $Not complete numbers for all measurements, where no SD, mean is an individual measurement.
Table 52. Mean Change (SD) in lung function and blood test results from baseline to week +12 in all completers by trial arm and mean difference [95% CI] in these between trial arm

264
6.2.9. Change in weight, BMI and body composition from baseline to 1 week post quit, in those achieving 7 day point prevalent abstinence
One, four and no participants fell into this category in the SBS arm, IDAP arm and
adhering to the VLCD respectively. Comparison of abstainers in the SBS was only
possible with those in the IDAP arm. A clinically important difference in change in
weight (1.4kg), BMI (0.53kg/m2) and fat mass (1.2kg) was seen between these
groups. This was from gains in the SBS arm and losses in the IDAP arm. Fat free
mass and body water reduced slightly in both groups but values did not represent
clinically meaningful differences (Table 53).
6.2.10. Change in weight, BMI and body composition from baseline to 4 weeks of continued abstinence
Weight, BMI and fat mass continued to rise in the SBS arm and fall in the IDAP arm.
The difference in the measures between the groups was clinically significant (-3.9kg,
-1.52 kg/m2 and -3.0kg respectively), although this was based on just one individual
in the IDAP group (Table 53).
6.2.11. Change in weight, BMI and body composition from baseline to 12 weeks of continued abstinence
Twelve week abstinence data was only available for those in the SBS arm. In the
preceding 4 weeks, participants in the SBS arm received the IDAP intervention. At 12
weeks participants BMI was the same as that recorded at 4 weeks post quit (Table
53). Fat mass was less than the 4 weeks post quit values, fat free mass and total
body water had increased.

265
*p<0.05 Students‟ t-test
Table 53. Mean Change (SD) in anthropometrics, body composition and blood pressure from baseline to week +1, +4 and +12 in completer abstainers by trial arm and mean difference [95% CI] in these between trial arm
Change in: SBS IDAP IDAP-SBS
Week +1
n 4 5
Weight (kg) 0.2(1.0) -1.2(0.5) 1.4[0.2, 2.5]*
BMI (kg/m2) 0.11(0.37) -0.42(0.20) 0.53[0.08, 0.98]*
Systolic BP (mm/Hg) 3(21) -7(2) 10[-24, 44]
Diastolic BP (mm/Hg) 2(9) -2(9) 3[-11, 17]
Waist circumference (cm) 1.0(3.2) -6.6(8.6) 7.6[-3.2, 18.4]
Hip circumference (cm) 2.3(1.1) 1.2(1.1) 1.1[-15.5, 17.6]
WHR -0.01(0.01) -0.09(0.01) 0.07[-0.27, 0.41]
Fat mass (kg) 0.3(1.4) -0.9(0.8) 1.2[-0.4, 2.9]
Fat free mass (kg) -0.1(0.8) -0.2(0.4) 0.1[-0.8, 1.1]
Total body water (kg) -0.1(0.6) -0.2(0.3) 0.1[-0.6, 0.8]
Week+4
n 4 1 Weight (kg) 1.1(0.8) -2.8 -3.9[-6.8, -1.0]*
BMI (kg/m2) 0.43(0.34) -1.09 -1.52 [-2.70, -0.32]*
Systolic BP 6(13) -19 -25 [-69, 20]
Diastolic BP 4(10) 3 -1 [-36, 35]
Waist circumference (cm) 4(<0) -9 -13
Hip circumference (cm) 1 -7 -8
WHR 0.03 -0.02 -0.05
Fat mass (kg) 0.8(1.4) -2.3 -3.1[-8.2, 2.0]
Fat free mass (kg) 0.4(0.9) -0.5 -0.9[-3.9, 2.2]
Total body water (kg) 0.2(0.6) -0.3 -0.5[-2.7, 1.6] Week +12
n 4 Weight (kg) 1.15(2.22) BMI (kg/m
2) 0.45(0.78)
Systolic BP 1.25(6.84) Diastolic BP -2.50(17.82) Waist circumference (cm) -2.50(6.36) Hip circumference (cm)
WHR
Fat mass (kg) 0.15(2.18) Fat free mass (kg) 1.00(0.52)
Total body water (kg) 0.73(0.43)

266
6.2.12. Change in lung function, blood glucose and cardiovascular risk parameters by end of treatment in abstainers
Data on these parameters was only available for the four continuous abstainers in
the SBS arm. Lung function reduced by a clinically insignificant amount (section
6.2.8.5). Most cardiovascular risk factors improved (TC:HDL cholesterol ratio reduced
by 6% of baseline value) but triglycerides (rose by 14% of baseline value) and fasting
blood glucose rose (Table 54).
Table 54. Mean Change (SD) in lung function and blood test results from baseline to week +12 in SBS abstainers and IDAP lapsers
Change in: SBS (A) (n=4) IDAP (L) (n=1)
Week +12
Glucose (mmol/L) 0.3(0.00) 0.2
Forced Expiratory Volume in 1 sec (FEV1) (L) -0.1(0.2)
Forced Vital Capacity (FVC) (L) -0.1(0.2)
C-Reactive Protein (mg/L) -3.5(0.7) -4.0
TC:HDL ratio -0.3(0.6) -0.8
LDL-cholesterol (mmol/L) -0.2 -0.3
HDL-cholesterol (mmol/L) 0.2 (0.4) 0.3
Total Cholesterol (TC) (mmol/L) -0.2(0.6) 0.0
Triglycerides (mmol/L) 0.2(0.2) -0.1
WBC (x109/L) 3.9(6.2) -1.0
Platelets (x109/L) -14(42) -89
MCV -1.15(1.48) 0.80
HB -0.2(0.0) -0.4
A=Abstainers L=Lapsers

267
6.2.13. Change in weight and body composition in lapsers from baseline to 1 week post quit date
There was data on one lapser each in the SBS and IDAP arms and two on the
VLCD. Weight increased in the SBS arm by a clinically meaningful amount (1.2kg).
By comparison, weight fell dramatically in the VLCD arm (-6.3kg) and increased
moderately in the IDAP arm (0.4kg). These accounted for clinically meaningful
differences in weight between the trials arms but much of these weight changes were
attributable to body water (67%, 25% and 49% in the SBS, IDAP and VLCD arms
respectively) (Table 55).
6.2.14. Change in weight and body composition in lapsers from baseline to four weeks post quit date (end of treatment, Stage 1)
There was data on one participant in the SBS arm, two in the IDAP arm and one in
the VLCD arm who were still trying to quit but were not doing so successfully. The
person in the SBS arm had gained weight (0.5kg) but had lost fat mass (-1.1kg), in
the IDAP arm weight (fat mass(-0.6kg)) was lost. The individual in the VLCD arm had
lost a large amount of weight (-8.6kg), which included fat mass (-4.8kg), fat free mass
(-0.9kg) and total body water (-2.9kg). Differences between the VLCD and SBS arm
were clinically important, but not between the IDAP and SBS arms (the sample was
too small to generate confidence intervals for these differences between the trial
arms) (Table 55).

268
6.2.15. Change in weight body composition and disease risk factors in lapsers from baseline to end of treatment
There were anthropometric data available on one lapsed individual in the VLCD arm
who gained fat mass by this time (section 6.2.8.4). Data for lung function and blood
test results were available for one individual who was in the IDAP arm. Lung function
showed no clinically relevant change (Section 6.2.8.5). Blood glucose rose slightly,
triglycerides fell by 5% of baseline value, TC:HDL cholesterol fell by 19% of baseline
value (both LDL cholesterol fell and HDL cholesterol rose). CRP fell by 4mg/L, and
platelets fell by 27% of baseline value, which are clinically meaningful changes
(Table 54).
There was a smaller rise in blood glucose and a greater improvement in
cardiovascular markers in the individual who followed IDAP, but continued to smoke,
than in the individuals in the SBS arm who stopped smoking. But the sample is far
too small to draw any meaningful conclusions (Table 54).

269
$Not complete numbers for all measurements, where no SD, mean is an individual measurement.
Table 55 Mean (SD) change in anthropometrics, body composition and blood pressure from baseline to week +1 and to week +4 in completer lapsers by trial arm and mean difference [sample to small for 95% CI] in these between trial arms
Change from baseline in: SBS (n$=1) IDAP (n
$=1) VLCD (n
$=2) VLCD-SBS IDAP-SBS VLCD-IDAP
Week +1
Weight (kg) 1.2 0.4 -6.3(0.1) -7.5 -0.8 -6.7
BMI (kg/m2) 0.5 0.15 -2.15(0.48) -2.65 -0.35 -2.3
Systolic BP 4
-1(6) -4.8
Diastolic BP 4
-2(6) -6
Waist circumference (cm)
-9
Hip circumference (cm)
-2
WHR
-0.07
Fat mass (kg) 0.1 0.1 -4.8 -4.9 0 -4.9
Fat free mass (kg) 1.1 0.2 -3.0 -4.1 -0.9 -3.2
Total body water (kg) 0.8 0.1 -3.1 -3.9 -0.7 -3.2
Week +4
Weight (kg) 0.5 -0.5(1.5) -8.6 -9.1 -1.0 -8.2
BMI (kg/m2) 0.21 -0.19(0.58) -2.54 -2.75 -0.4 -2.35
Systolic BP -1 -17(12) 3 4 -16 20
Diastolic BP -1 -5(11) -4 -3 -4 1
Waist circumference (cm)
-8(12) -12 -5
Hip circumference (cm)
9(7) -3 -12
WHR
-0.18(0.22) -0.09 0.09
Fat mass (kg) -1.1 -0.6(1.8) -4.8 -3.7 0.5 -4.2
Fat free mass (kg) 1.6 0.2(0.4) -3.8 -5.4 -1.5 -4.0
Total body water (kg) 1.2 0.1(0.3) -2.9 -4.1 -1.1 -3

270
6.2.16. Individual trajectories of change in weight and fat mass
The measures of weight and fat mass over time were of most clinical interest here.
As there are only a small number of participants, we have presented the change in
weight and fat mass trajectories of all individuals (Figure 32). By doing so
annotating the time points of abstinence, lapses, dietary change and colour coding
them by trial arm we can see these effects within each individual. This helps with
understanding and interpreting the data in subsequent analyses.
For most participants in the SBS arm weight increased over time (ID 3, 21, 32) and
slowed or fell following the start of IDAP in Stage 2 (ID 3, 6, 26 32). One individual
lapsed back to smoking (although their intention was not to abandon their quit
attempt at this point) and weight began to fall (ID 6).
Weight initially fell (ID 4, 10, 8 and 30) in the IDAP arm and then rose again towards
the end of treatment (ID 10, 18 and 30).
In the VLCD arm two participants abandoned their diet early and also failed to quit
and left the programme (ID 7 and 21). Two participants continued the diet and lost a
lot of weight until re-feeding (ID 12 and 31); Neither had quit by this point. One of
these two (ID 31) quit after initial weight loss and during the re-feeding stage.

271
The change in fat mass paralleled and largely accounted for the change in weight.
This was true for all individuals in all trial arms (Figure 33), except for one person.
This person (ID 31) put on a large amount of fat mass during Stage 2 of the VLCD
intervention. This coincided with the time that they quit smoking. Therefore, they had
a greater fat mass at the end of treatment (week +12) than at baseline. Quitting in
the other trial arms was not associated with this dramatic increase in fat mass.

272
Figure 32. Individuals‟ change in weight over weeks -1 to +12, annotated by trial arm, change in smoking status and dietary change

273
Figure 33. Individuals‟ change in fat mass over weeks -1 to +12, annotated by trial arm, change in smoking status and dietary change

274
6.2.17. Change in mean weight and fat mass by trial arm
In Stage 1 weight and fat mass rose in the SBS arm, fell moderately in the IDAP arm
and fell dramatically in the VLCD arm. During Stage 2 weight began to fall in the SBS
arm, rise in the in the IDAP arm and rise dramatically in the VLCD arm. Fat mass
began to level off in the SBS arm, continued to fall in the IDAP arm and rose
significantly beyond baseline in the VLCD arm (Figure 34,Figure 35).
6.2.18. Modelling of weight and fat mass trajectories by trial arm
We modelled the effects of trial arm to adjust for the effects of abstinence or lapsing,
gender and age. We built up the multilevel model in several stages. From the mean
plots of weight and fat mass over time we could see that the effects of trial arm were
not linear. So we modelled a quadratic and then cubic function of time. The fit
significantly improved from the linear to the quadratic model, but not to the cubic
model for both weight (Model 1-2 and 2-3,Table 56) and fat mass (Model 1-2 and 2-
3,Table 57).
The effects of trial arm, with SBS as the reference category, were interpreted from
the coefficients for each trial arm in a model containing a quadratic function of time
and trial arm (Models 4 in Table 58, Table 59). Over the 12 weeks, the mean
differences for weight and fat mass change between the IDAP and SBS arm were
-1.3kg and -0.9kg respectively. Between the VLCD and SBS arm they were -7.1kg
for weight -3.4kg for fat.

275
Adjusting for point prevalent abstinence (with lapsing as the reference category)
significantly improved the fit of the models for both weight and fat mass (models 4 to
models 5). The coefficients showed weight and fat mass was 0.4kg higher in those
who were abstinent. But this did not explain the differences by trial arm, the
coefficients for trial arm hardly changed (Models 5,Table 58 & Table 59).
Adjusting for age significantly improved the fit of the models, such that a one year
increase in age was associated with a 40g increase in weight and fat mass.
Therefore, someone who was 60 years old might gain 0.8kg more than someone
who was 30 years old. But this did not explain differences between trial arms as the
trial arm coefficients were unaltered (model 6, Table 58 & Table 59). Adjusting for
gender (female was the reference category) did not significantly improve the fit of the
model or explain difference by trial arm, but the coefficients suggested that males
gained 0.7kg more and had 0.9kg more fat mass than females (model 7, Table 58 &
Table 59).
The mean plots of change in weight (Figure 34) and fat mass (Figure 35) by trial arm
suggest that rate of change was different within each trial arm, this was expected as
during Stage two participants received the IDAP intervention at different times (week
5 in VLCD and Week 8 in SBS). To account for these changes we included a time by
trial arm interaction, which showed a large, significant reduction in -2loglikelihood and
hence improvement in the fit of the model (model 8 Table 58 & Table 59). Plotting the
fixed effects of these models (Figure 36 & Figure 37) showed that they fit the mean
plots well (Figure 34 & Figure 35).

276
VLCD re-feeding
Start of IDAP Start of IDAP
VLCD re-feeding
Figure 34. Mean weight change by trial arm over weeks post quit
Figure 35. Mean fat mass change by trial arm over weeks post quit

277
Model Steps -2LL -2LL Chi df p
1 to 2 294.314 287.966 6.348 1 0.012* 2 to 3 287.966 287.656 0.31 1 0.578 2 to 4 287.966 258.986 28.98 2 <0.001* 4 to 5 258.986 257.891 1.095 1 0.295 4 to 6 258.986 254.871 4.115 1 0.043* 4 to 7 258.986 257.765 1.221 1 0.269 4 to 8 258.986 221.629 37.357 4 <0.000*
*statistically significant improvement in fit of model to data using Chi-squared test. Model 1: weight change according to linear function of time. Model 2: weight change according to quadratic function of time. Model 3: weight change according to cubic function of time. Model 4: weight change according to quadratic function of time and trial arm. Model 5: weight change according to quadratic function by time, trial arm, adjusted for point prevalence abstinence. Model 6: weight change according to quadratic function by time, trial arm, adjusted for age Model 7: weight change according to quadratic function by time, trial arm, adjusted for gender Model 8: weight change according to quadratic function by time, trial arm, and trial arm by time interaction.
Table 56. Difference in fit between models of change in weight over time
Model Steps -2LL -2LL Chi df p
1 to 2 311.09 300.862 10.228 1 0.001* 2 to 3 300.862 300.846 0.016 1 0.899 2 to 4 300.846 287.133 13.713 2 <0.001* 4 to 5 287.133 283.265 3.868 1 0.049* 4 to 6 287.133 283.394 3.739 1 0.053 4 to 7 287.133 285.014 2.119 1 0.145 4 to 8 287.133 223.007 64.126 4 <0.001*
*statistically significant improvement in fit of model to data using Chi-squared test. Model 1:fat mass change according to linear function of time. Model 2: fat mass change according to quadratic function of time. Model 3: fat mass change according to cubic function of time. Model 4: fat mass change according to quadratic function of time and trial arm. Model 5: fat mass change according to quadratic function by time, trial arm, adjusted for point prevalence abstinence. Model 6: fat mass change according to quadratic function by time, trial arm, adjusted for age Model 7: fat mass change according to quadratic function by time, trial arm, adjusted for gender Model 8: fat mass change according to quadratic function by time, trial arm, and trial arm by time interaction.
Table 57. Difference in fit between models of change in fat mass over time

278
Model 1 S.E. Model 2 S.E. Model 3 S.E. Model 4 S.E. Model 5 S.E. Model 6 S.E. Model 7 S.E. Model 8 S.E.
Fixed Part
cons -1.206 0.687 -0.858 0.692 -0.793 0.699 0.744 0.42 0.622 0.441 2.575 0.918 0.895 0.421 0.175 0.414
Time 0.035 0.037 -0.265 0.122 -0.377 0.235 -0.268 0.118 -0.328 0.13 -0.266 0.117 -0.277 0.118 0.172 0.129
Time*time
0.027 0.011 0.055 0.05 0.028 0.01 0.032 0.011 0.027 0.011 0.028 0.010 -0.011 0.011
Time*time*time
-0.002 0.003
IDAP
-1.323 0.535 -1.294 0.547 -1.738 0.505 -1.417 0.511 -0.736 0.591
VLCD
-7.133 0.734 -6.988 0.763 -7.312 0.642 -6.950 0.709 -4.585 0.824
Point prevalence(PP)
0.361 0.345
Age (years)
-0.038 0.017
Gender
-0.713 0.616
IDAP*time
-0.526 0.223
VLCD*time
-1.787 0.262
IDAP*time*time
0.054 0.023
VLCD*time*time
0.148 0.022
Random Part
Level: Participant ID cons/cons 6.078 2.418 5.971 2.367 5.924 2.349 0.582 0.31 0.623 0.326 0.389 0.232 0.490 0.276 0.607 0.284
Level: Time cons/cons 1.274 0.22 1.164 0.201 1.16 0.2 1.145 0.197 1.117 0.192 1.139 0.196 1.152 0.193 0.670 0.116
-2*loglikelihood: 294.314
287.966
287.656
258.986
257.928
254.817
257.765
211.629
Units: Participant ID 14
14
14
14
14
14
14
14
Units: week from quit 81 81 81 81 81 81 81 81
Model 1: weight change according to linear function of time. Model 2: weight change according to quadratic function of time. Model 3: weight change according to cubic function of time. Model 4: weight change according to quadratic function of time and trial arm. Model 5: weight change according to quadratic function by time, trial arm, adjusted for point prevalence abstinence. Model 6: weight change according to quadratic function by time, trial arm, adjusted for age Model 7: weight change according to quadratic function by time, trial arm, adjusted for gender Model 8: weight change according to quadratic function by time, trial arm, and trial arm by time interaction.
Table 58. Coefficients of multilevel models for weight change

279
Model 1:fat mass change according to linear function of time. Model 2: fat mass change according to quadratic function of time. Model 3: fat mass change according to cubic function of time. Model 4: fat mass change according to quadratic function of time and trial arm. Model 5: fat mass change according to quadratic function by time, trial arm, adjusted for point prevalence abstinence. Model 6: fat mass change according to quadratic function by time, trial arm, adjusted for age Model 7: fat mass change according to quadratic function by time, trial arm, adjusted for gender Model 8: fat mass change according to quadratic function by time, trial arm, and trial arm by time interaction.
Table 59. Coefficients of multilevel models for change in fat mass
Model 1 S.E. 2 S.E. 3 S.E. 4 S.E. 5 S.E. 6 S.E. 7 S.E. 8 S.E.
Fixed Part cons -0.962 0.417 -0.415 0.441 -0.397 0.463 0.485 0.430 0.344 0.459 2.201 0.906 0.695 0.423 -0.115 0.408
Time 0.044 0.044 -0.411 0.143 -0.442 0.281 -0.401 0.140 -0.48 0.155 -0.399 0.139 -0.412 0.140 0.095 0.125
Time*time
0.041 0.012 0.049 0.06 0.04 0.012 0.046 0.013 0.040 0.012 0.041 0.012 -0.005 0.011
Time*time*time
0 0.003 IDAP
-0.886 0.522 -0.856 0.537 -1.264 0.492 -1.019 0.481 -0.508 0.583
VLCD
-3.459 0.711 -3.289 0.748 -3.627 0.623 -3.267 0.655 -0.859 0.813 Point prevalence(PP)
0.436 0.405
Age (years)
-0.036 0.017 Gender
-0.924 0.585
IDAP*time
-0.214 0.220
VLCD*time
-2.178 0.259
IDAP*time*time
0.006 0.023
VLCD*time*time
0.208 0.021
Random Part Level: Participant ID
cons/cons 1.657 0.784 1.665 0.769 1.66 0.769 0.44 0.288 0.486 0.307 0.263 0.216 0.301 0.233 0.586 0.279 Level: Time cons/cons 1.95 0.334 1.687 0.289 1.687 0.289 1.669 0.284 1.641 0.281 1.667 0.283 1.684 0.286 0.662 0.113
-2*loglikelihood: 311.09
300.862
300.846
287.133
283.265
283.394
285.014
223.007 Units: Participant ID 14
14
14
14
14
14
14
14
Units: week from quit 82 82 82 82 81 81 81 82

280
Figure 36. Plot of fixed effects of weight change trajectories by trial arm (model 8)
Figure 37. Plot of fixed effects of fat mass change trajectories by trial arm (model 8)
Trial arm SBS IDAP VLCD

281
6.2.19. Change in fat intake and HCI score as mediators of change in body fat
As described in chapter five we had data on change in fat intake and HCI score for
some individuals. So we tested these as mediators within a multilevel model of
change in body fat for these individuals.
The HCI could only detect large differences in fat intake (there was a 32% level of
agreement). So we classed the guideline daily amount of fat (70g (females)) with
corresponding lower and upper levels of agreement as a medium level of fat intake,
anything below and above this was classed as low and high respectively. Change in
fat intake from baseline to the end of treatment was defined as a move between
these categories. All our participants either stayed within the same category or
moved from a high to medium or a medium to a low category of fat intake.
Adding change in fat intake and change in HCI score into the multilevel model for
trajectory of fat mass did not significantly improve the fit of the models (Table 60)
but the coefficients were of clinical importance. A fall by one category of fat intake
(with no change being the reference category) was associated with a decrease in
body fat mass of 1.0kg. The change in the coefficients for trial arm showed that this
explained 22% of the reduction in body fat in the IDAP arm but had a negligible effect
in the VLCD arm (Table 61).

282
An increase of one point in HCI score was associated with an increase in fat mass of
0.056kg (56g), or to put it another way an increase of 10 was associated with a
increase of 0.6kg. But it did not explain the change in fat mass by trial arm, the
coefficient for the VLCD arm hardly changed and the coefficient for the IDAP arm got
larger (Table 61).
Model Steps -2LL -2LL Chi df p
1 to 2 132.926 131.781 1.145 1 0.285
1 to 3 132.926 132.444 0.482 1 0.488
Table 60. Change in fit of models for the trajectory of change in fat mass

283
Table 61. Coefficients for multilevel models for trajectory of change in fat mass
Model 1 S.E. 2 S.E. 3 S.E.
Fixed Part
cons 0.877 0.618 0.969 0.615 0.692 0.669
week from quit day -0.392 0.246 -0.422 0.243 -0.389 0.244
Week from quit2 0.051 0.021 0.052 0.021 0.05 0.021
IDAP -0.968 0.601 -0.651 0.66 -1.39 0.85
VLCD -4.623 0.696 -4.64 0.686 -4.385 0.771
Drop by one fat intake category
-1.013 0.939
Change in HCI score
0.056 0.081
Random Part
Level: Participant ID
cons/cons 0 0 0 0 0 0
Level: week from quit day
cons/cons 2.35 0.554 2.277 0.537 2.319 0.547
-2*loglikelihood: 132.926
131.781 132.444
Units: Participant ID 5
5 5
Units: week from quit day 36
36 36
Models: trajectory of change in fat mass by trial arm (1) adjusted for change in fat intake (2) adjusted for change in HCI score (3)

284
6.2.20. Change in anthropometrics and body composition: Intention to treat (ITT) analysis
As described in section 6.1, to get an idea of the pragmatic effects of our trial we
carried out an ITT analysis. We input BOCF for missing values of those who dropped
out and means of before and after values for intermittent missing data.
All results are presented in the tables that follow but only the key similarities and
differences between the results from ITT and completer analysis are described in the
sections below.
6.2.20.1. Prequit change in weight, BMI and body composition
No one had dropped out by week 0 so results for the ITT analysis were the same as
those from completer analysis without removed of those who were not adhering to
the VLCD (Table 62).
6.2.20.2. Change in weight and body composition from baseline to one week post quit date
Differences in change in weight and fat mass between IDAP and the SBS arm was
the same for ITT and completer analysis (1.3kg and 1kg respectively). Differences in
changes in weight and fat mass between VLCD and SBS arms were less marked but
still statistically and clinically significant (3.7kg and 2.2kg respectively) (Table 62).

285
Table 62. Mean (SD) change in anthropometrics, body composition and blood pressure from baseline to week 0 and to week +1 in ITT population by trial arm and mean difference [95% CI] in these between trial arm.
Change from baseline in: SBS (n=6) IDAP (n=6) VLCD (n=4) VLCD-SBS IDAP-SBS VLCD-IDAP
Week 0
Weight (kg) 0.1(0.6) -0.5(1.0) -2.3(1.8) -2.2[-4.1, -0.3]* -0.4[-2.1, 1.3] -1.8[-3.7, 0.1]
BMI (kg/m2) -0.01(0.21) -0.18(0.36) -0.84(0.70) -0.83[-1.57, -0.10]* -0.17[-0.83, 0.49] -0.66[-1.39, 0.07]
Systolic BP -1(12) -2(8) 4(11) 4[-14, 22] -1[-18, 15] 6[-12, 23]
Diastolic BP -1(5) <-1(3) 2(7) 3[-6, 11] 1[-6, 8] 2[-7, 10]
Waist circumference (cm) 1(1) -4(6) -2(2) -3[-10, 5] -5[-11, 1] 2[-5, 10]
Hip circumference (cm) <0(1) 3(7) <0(2) <0[-8, 8] 2[-5, 9] -2[-10, 5]
WHR -0.00(0.02) -0.07(0.13) -0.02(0.02) -0.15[-0.16, 0.13] -0.07[-0.20, 0.06] 0.06[-0.09, 0.20]
Fat mass (kg) -0.2(0.7) -0.6(0.5) -0.5(1.5) -0.3[-1.8, 1.2] -0.5[-1.8, 0.9] 0.2[-1.3, 1.6]
Fat free mass (kg) 0.1(0.8) 0.1(0.9) -1.8(2.0) -1.9[-4.0, 0.2] 0.1[-1.9, 2.0] -2.0[-4.1, 0.2]
Total body water (kg) <0.0(0.6) 0.2(0.6) -1.7(1.9) -1.8[-3.6, 0.1] 0.1[-1.5, 1.8] -1.9[-3.7, -0.1]*
Week +1
Weight (kg) 0.4(0.9) -0.9(0.8) -3.3(3.5) -3.7[-6.8, -0.5]* -1.3[-4.1, 1.6] -2.4[-5.6, 0.8]
BMI (kg/m2) 0.16(0.33) -0.33(0.29) -1.12(1.22) -1.28[-2.41, -0.15]* -0.48[-1.50, 0.53] -0.80[-1.93, 0.33]
Systolic BP 3(17) -6(3) -5(5) -7[-26, 12] -9[-26, 8] 2[-17, 20]
Diastolic BP 2(7) -1(8) -5(8) -7[-20, 6] -3[-15, 9] -3[-16,10]
Waist circumference (cm) 1(3) -6(8) -3(5) -4[-15, 8] -6[-16, 3] 3[-9, 14]
Hip circumference (cm) 1(1) 1(8) <0(2) <0[-9, 8] <0[-8, 8] -1[-9, 8]
WHR -0.00(0.01) -0.07(0.16) -0.03(0.04) -0.02[-0.20, 0.16] -0.07[-0.23, 0.09] 0.05[-0.13, 0.22]
Fat mass (kg) 0.2(1.1) -0.8(0.8) -2.0(1.6) -2.2[-4.2, -0.2]* -1.0[-2.8, 0.8] -1.2[-3.2, 0.8]
Fat free mass (kg) 0.1(0.8) -0.2(0.4) -1.3(2.0) -1.5[-3.4, 0.4] -0.3[-2.0, 1.4] -1.2[-3.1, 0.7]
Total body water (kg) 0.1(0.6) -0.1(0.3) -1.4(2.1) -1.5[-3.4, 0.4] -0.2[-1.9, 1.5] -1.3[-3.2, 0.6] #p<0.05 ANOVA *p<0.05 post-hoc Gabriel. Post hoc tests could not be performed in all cases due to small numbers.
286
6.2.20.3. Change in weight, BMI and body composition from baseline to the end of Stage 1
By four weeks post quit date differences in change in weight and fat mass between
VLCD and SBS arms were less marked but still statistically and clinically significant
(5.4kg and 1.5kg respectively). Differences in change in weight and fat mass
between IDAP and SBS arms were less marked but still of some clinical importance
(1.6kg and 1.0kg respectively) (Table 63).
6.2.20.4. Change in weight and body composition from baseline to the end of treatment
By the end of treatment, differences in change in weight and fat mass between VLCD
and SBS arms were again less marked but still clinically significant (1.9kg and 0.7kg
respectively). Differences in change in weight and fat mass between IDAP and SBS
arms were small (0.8kg and 0.1kg respectively) (Table 63). However, they arose
essentially from lack of weight gain in the IDAP compared to the SBS arm. At three
months post quit we would expect an increase of almost 3kg in untreated abstinent
smokers (Aubin et al., under review) but the weight gain in the SBS arm was a third
of this, which may have been due to the IDAP intervention in Stage 2. However little
weight gain in these both arms may just reflect the weights of many participants who
dropped out, and were assumed to have relapsed to smoking and their baseline
weight. Splitting the analysis into abstainers and lapsers helps address this.

287
#p<0.05 ANOVA *p<0.05 post-hoc Gabriel. Post hoc tests could not be performed in all cases due to small numbers.
Table 63. Mean (SD) change in anthropometrics, body composition and blood pressure from baseline to week +4 and to week +12 in ITT population by trial arm and mean difference [95% CI] in these between trial arm
Change from baseline in: SBS (n=6) IDAP (n=6) VLCD (n=4) VLCD-SBS IDAP-SBS VLCD-IDAP
Week+4
Weight (kg) 0.8(0.8) -0.8(1.3) -4.5(5.2) -5.4[-10.0, -0.7]* -1.6[-5.8, 2.6] -3.7[-8.4, 1.0]
BMI (kg/m2) 0.32(0.32) -0.30(0.48) -1.56(1.86) -1.88[-3.56, -0.20]* -0.62[-2.13, 0.89] -1.25[-2.93, 0.42]
Systolic BP 4(10) -9(11) 1(2) -3[-19, 13] -12[-27, 2] 9[-7, 26]
Diastolic BP 2(8) -1(6) -1(2) -3[-14, 8] -3[-13, 6] <1[-11, 11]
Waist circumference (cm) 1(2) -4(7) -3(6) -4[-14, 5] -5[-14, 3] 1[-8, 10]
Hip circumference (cm) <0(0) 2(7) -1(2) -1[-9, 7] 2[-5, 8] -3[-10, 5]
WHR 0.00(0.01) -0.06(0.13) -0.02(0.04) -0.03[-0.18, 0.12] -0.07[-0.20, 0.07] 0.04[-0.11, 0.19]
Fat mass (kg) 0.3(1.4) -0.7(1.2) -2.5(2.9) -2.9[-6.0, 0.3] -1.0 [-3.8, 1.8] -1.8[-5.0, 1.3]
Fat free mass (kg) 0.5(0.9) <0.0(0.3) -1.0(1.9) -1.5[-3.3, 0.4] -0.5[-2.2, 1.2] -0.9[-2.8, 1.0]
Total body water (kg) 0.4(0.6) 0.1(0.3) -1.9(2.3) -2.3[-4.4, -0.2]* -0.3[-2.2, 1.6] -2.0[-4.1, 0.1]
Week +12
Weight (kg) 0.8(1.8) 0.0(0.0) -1.2(2.3) -1.9[-4.7, 0.8] -0.8[-3.2, 1.7] -1.2[-3.9, 1.6]
BMI (kg/m2) 0.30(0.65) 0.00(0.00) -0.45(0.90) -0.75[-1.78, 0.28] -0.30[-1.22, 0.62] -0.45[-1.48, 0.58]
Systolic BP 1(5) 0(0) -2(5) -3[-10,4] -1[-7, 5] -2[-9, 5]
Diastolic BP -2(14) 0(0) 3(6) -5[-11, 20] -2[-13, 16] 3[-13, 19]
Waist circumference (cm) -1(3) 0(0) 0(0) 0.1[-3, 4] 0.8[-2, 4] 0[-3, 3]
Hip circumference (cm) 0(0) 0(0) 0(0)
WHR 0.00(0.00) 0.00(0.00) 0(0)
Fat mass (kg) 0.1(1.7) 0.0(0.0) 0.8(1.5) 0.7[-1.6, 2.9] -0.1[-2.1, 1.9] 0.6[-1.5, 3.0]
Fat free mass (kg) 0.7(0.7) 0.0(0.0) -1.9(3.8) -2.6[-5.8, 0.7] 0.7[-3.0, 2.3] -1.9[-5.2, 1.4]
Total body water (kg) 0.5(0.5) 0.0(0.0) -1.8(3.5) -2.2[-5.2, 0.8] -0.5[-3.2, 2.2] -1.8[-4.7, 1.2]

288
6.2.21. Change in weight and body composition in abstainers only: intention to treat (ITT) analysis
ITT results for abstainers followed a very similar pattern to the completer analysis for
changes after one, four (Table 64) and 12 weeks post quit (Table 66) in the SBS and
IDAP arms. Differences between IDAP and SBS arms were very slightly less marked
at the end of seven day point prevalence abstinence than in the completer analysis
(Table 64 vs Table 50). In the ITT analysis clinically important differences between
the IDAP and SBS group after four weeks of continuous abstinence were seen for
weight and fat mass (0.5kg and 0.9kg respectively) (Table 64).
6.2.22. Change in weight and body composition in lapsers only: intention to treat (ITT) analysis
Differences in change in weight and fat mass between the IDAP and SBS arms in the
ITT analysis for lapsers did not differ from the completer analysis at the end of one
week post quit date, and were very similar after four weeks post quit date (Table 65).
These differences in change in weight and fat mass between the VLCD and SBS
arms were the same after one week post quit date but approximately half that seen in
completer analysis at the end of week four (Table 65 versus Table 51)
In lapsers the only change still apparent by 12 weeks was in the VLCD arm which
showed a smaller, although still clinically important, reduction in weight (-1.3kg) and
an increase in fat mass (0.8kg) (Table 68).

289
*p<0.05 ANOVA post-hoc Gabriel. #p<0.05 students t test
Table 64. Mean (SD) change in anthropometrics, body composition and blood pressure from baseline to week +1 and to week +4 in ITT abstainer population by trial arm and mean difference [95% CI] in these between trial arm
Change from baseline in: SBS (n=5) IDAP (n=5) VLCD (n=2) VLCD-SBS IDAP-SBS VLCD-IDAP
Week +1
Weight (kg) 0.2(0.8) -1.2(0.5) -0.3(0.4) -0.5 [-2.0, 1.1] -1.3[-2.5, -0.2]* 0.9[-0.7, 2.4]
BMI (kg/m2) 0.09(0.32) -0.42(0.20) -0.09(0.13) -0.18[-0.78, 0.42] -0.51[-0.98, -0.04]* 0.33[-0.27, 0.93]
Systolic BP 2(18) -8(2) -1(1) -3[-32, 26] -10[-32, 13] -3[-23, 36]
Diastolic BP 1(8) -2(9) -8(11) -9[-29, 11] -3[-19, 13] -6[-26, 14]
Waist circumference (cm) 1(3) -7(9) 0(0) -0.80[-15.02, 13.42] -7.40[-18.42, 3.62] 6.60[-7.62, 20.82]
Hip circumference (cm) 1(1) 1(9) 2(2) 1[-13, 15] <1[-10, 11] 1[-13, 14]
WHR -0.01(0.01) -0.09(0.18) -0.2(0.03) -0.01[-0.29, 0.26] -0.08[-0.30, 0.13] 0.07[-0.21, 0.35]
Fat mass (kg) 0.2(1.2) -0.9(0.8) -0.6(0.9) -0.9[-3.2, 1.4] -1.2[-3.0, 0.6] 0.3[-2.0, 2.6]
Fat free mass (kg) -0.1(0.7) -0.2(0.4) 0.4(0.5) 0.4[-0.9, 1.7] -0.2[-1.2, 0.9] 0.6[-0.8, 1.9]
Total body water (kg) <0.1(0.5) -0.2(0.3) 0.3(0.4) 0.3[-0.7, 1.3] -0.1[-0.9, 0.7] 0.4[-0.6, 1.4]
Week+4
Weight (kg) 1.1(0.8) -2.8 -3.9[-6.9, -1.0]#
BMI (kg/m2) 0.43(0.34) -1.09 -1.51[-2.71, -0.32]#
Systolic BP 6(13) -19
Diastolic BP 4(10) 3
Waist circumference (cm) 2(2) -9 -11[-19, -3]#
Hip circumference (cm) <1(<1) -7 -7[-9, -6]#
WHR 0.01(0.01) -0.02 -0.03[-0.08, 0.2]
Fat mass (kg) 0.8(1.4) -2.3 -3.1[-8.2, 2.0]
Fat free mass (kg) 0.4(0.9) -0.5 -0.9[-3.9, 2.2]
Total body water (kg) 0.2(0.6) -0.3 -0.5[-2.7, 1.6]

290
*p<0.05 ANOVA post hoc tests could not be performed in all cases due to small numbers.
Change from baseline in: SBS (n=1) IDAP (n=1) VLCD (n=2) VLCD-SBS IDAP-SBS VLCD-IDAP
Week +1 Weight (kg)* 1.2 0.4 -6.3(0.14) -7.5 -0.8 -6.7
BMI (kg/m2) 0.5 0.15 -2.15(0.48) -2.65 -0.35 -2.3
Systolic BP 4 0 -8(6) -12 -4 -8
Diastolic BP 4 0 -2[6] -6 -4 -2
Waist circumference (cm) 0 0 -5(6) -5 0 -5
Hip circumference (cm) 0 0 -1(1) -1 0 -1
WHR 0 0 -0.03(0.05) -0.03 0 -0.03
Fat mass (kg)* 0.1 0.1 -3.3(0.1) -3.4 0 -3.4
Fat free mass (kg) 1.1 0.2 -3.0(0.3) -4.1 -0.9 -3.2
Total body water (kg) 0.8 0.1 -3.1(1.3) -3.9 -0.7 -3.2
Week+4
Weight (kg) 0.3(0.4) -0.4(0.9) -4.5(5.2) -4.8[-13.0, 4.5] -0.7[-8.5, 7.2] -4.1[-10.6, 2.3]
BMI (kg/m2) 0.10(0.15) -0.15(0.33) -1.56(1.86) -1.66[-4.60, 1.27] 0.25[-3.06, 2.56] -1.41[-3.71, 0.89]
Systolic BP -1(1) -7(11) 1(2) 1[-18, 21] -6[-25, 13] 7[-8, 23]
Diastolic BP -1(1) -2(6) -1(2) -1[-12, 11] -2[-13, 11] 1[-8, 10]
Waist circumference (cm) 0(0) -3(7) -3(6) -3(-19, 13] -3[-18, 12] 0[-13, 13]
Hip circumference (cm) 0(0) 4(6) -1(2) -1[-12, 10] 4[-7, 14] -4[-13, 4]
WHR 0(0) -0.07(0.15) -0.22(0.04) -0.22[-0.29, 0.35] -0.07[-0.29, 0.25] 0.05[-10.57, 2.34]
Fat mass (kg) -0.6(0.8) -0.4(1.0) -2.5(2.9) -2.0[-6.9, 2.9] -0.7[-4.5, 4.9] -2.2[-6.0, 1.7]
Fat free mass (kg) 0.8(1.1) 0.1(0.2) -1.0(1.9) -1.8[-4.9, 1.4] -0.7[-3.7, 2.3] -1.0[-3.5, 1.4]
Total body water (kg) 0.6(0.9) 0.2(0.3) -1.9(2.3) -2.5[-6.2, 1.2] -0.4[-4.0, 3.1] -2.1[-5.0, 0.9]
Table 65. Mean (SD) change in anthropometrics, body composition and blood pressure from baseline to week +1 and to week +4 in ITT lapser population by trial arm and mean difference [95% CI] in these between trial arm

291
Change from baseline in: SBS (n=4)
Week +12
Weight (kg) 1.2(2.2)
BMI (kg/m2) 0.45(0.78)
Systolic BP 1(7)
Diastolic BP -3(18)
Waist circumference (cm) -1(4)
Hip circumference (cm) 0(0)
WHR 0(0)
Fat mass (kg) 0.2(2.2)
Fat free mass (kg) 1.0(0.5)
Total body water (kg) 0.7(0.4)
Table 66. Mean (SD) change in anthropometrics, body composition and blood pressure from baseline to week +12 ITT abstainer population by trial arm

292
Table 67. Mean (SD) change in anthropometrics, body composition and blood pressure from baseline to week +12 in ITT lapser population by trial arm and mean difference [95% CI] in these between trial arms
Change from baseline in: SBS(n=1) IDAP(n=1) VLCD (n=2) VLCD-SBS IDAP-SBS VLCD-IDAP
Week +12
Weight (kg) 0.0(0.0) 0.0(0.0) -1.2(2.3) -1.2[-4.4, 2.1] 0[-3.0, 3.0] -1.2[-3.6, 1.3]
BMI (kg/m2) 0.00(0.00) 0.00(0.00) -0.5(0.9) -0.45[-1.72, 0.83] 0[-1.18, 1.18] -0.45-1.41, 0.51]
Systolic BP 0(0) 0(0) -2(5) -2[-9, 4] 0[-6, 6] -2[-7, 3]
Diastolic BP 0(0) 0(0) 3(6) 3[-6, 12] 0[-8, 8] 3[-3, 9]
Waist circumference (cm) 0(0) 0(0) 0(0)
Hip circumference (cm) 0(0) 0(0) 0(0)
WHR 0.00(0.00) 0.00(0.00) 0.00(0.00)
Fat mass (kg) 0.0(0.0) 0.0(0.0) 0.8(1.5) 0.8[-1.4, 2.9] 0[-2.0, 2.0] 0.8[-0.9, 2.4]
Fat free mass (kg) 0.0(0.0) 0.0(0.0) -1.9(3.8) -1.9[-7.3, 3.5] 0[-5.0, 5.0] -1.9[-6.0, 2.2]
Total body water (kg) 0.0(0.0) 0.0(0.0) -1.8(3.5) -1.8[-6.7, 3.2] 0[-4.6, 4.6] -1.8[-5.5, 2.0]

293
6.2.23. Change disease risk factors from baseline to end of treatment in lapsers
In contrast to completer analysis, the ITT analysis showed that all changes in the
disease risk factors we measured were of negligible clinical importance (Table 68). It
was not possible to examine the difference between arms in abstainers because only
participants in SBS arm maintained abstinence. In the SBS arm the changes from
baseline here were less than those seen in completer analysis and were minimal
(0.2mmol rise in blood glucose, a 6% rise in triglycerides, an 8% rise in HDL
cholesterol and fall of 4% in LDL cholesterol and TC:HDL ratio (Table 69).

294
Change in: SBS IDAP VLCD VLCD-SBS IDAP-SBS VLCD-IDAP
Week +12
Glucose (mmol/L) 0.1(0.2) <0.1(0.1) 0.0(0.0) -0.1[-0.3, 0.1] -0.1[-0.2, 0.1] <0.1[-0.2, 0.2]
Forced Expiratory Volume in 1 sec (FEV1) (L) -0.1(0.14) 0.0(0.0) 0.0(0.0) 0.1[-0.1, 0.2] 0.1[-0.1, 0.2] 0[-0.2. 0.2]
Forced Vital Capacity (FVC) (L) -0.1(0.2) 0.0(0.0) 0.0(0.0) 0.1[ -0.1, 0.2] 0.6[-0.1, 0.2] 0[-0.2, 0.2]
C-Reactive Protein (mg/L) -1.2(1.8) -0.7(1.6) 0.0(0.0) -1.2[-1.5, 3.8] 0.5[-1.9, 2.9] 0.7[-2.0, 3.3]
TC:HDL ratio -0.1(0.3) -0.1(0.3) 0.0(0.0) 0.1[-0.4, 0.6] <0.1[-0.5, 0.4] 0.1[-0.3, 0.6]
LDL-cholesterol (mmol/L) <0.1(0.1) 0.0(0.0) 0.0(0.0) <0.1[-0.1, 0.2] <0.1[-0.5, 0.1] 0.1[-0.3, 0.6]
HDL-cholesterol (mmol/L) 0.1(0.2) 0.1(0.1) 0.0(0.0) -0.1[-0.3, 0.2] <0.0[-0.2, 0.2] -0.1[-0.3, 0.2]
Total Cholesterol (TC) (mmol/L) -0.1(0.3) 0.0(0.0) 0.0(0.0) <0.1[-0.3, 0.4] <0.1[-0.3, 0.3] 0.0[-0.3, 0.3]
Triglycerides (mmol/L) 0.1(0.1) <0.1(<0.0) 0.0(0.0) -0.1[-0.2, 0.1] -0.1[-0.2, 0.1] <0.1[-0.1, 0.1]
WBC (x109/L) 1.3(3.4) -0.2(0.4) 0.0(0.0) -1.3[-5.0, 2.4] -1.5[-4.8, 1.9] -1.3[-3.5, 3.9]
Platelets (x10
9/L) -4.7(20.3) -14.8(36.3) 0.0(0.0) 4.7[-40.4, 49.7] -10.2[-50.7, 30.3] 14.8[-30.2, 59.9]
MCV -0.38(0.89) 0.13(0.33) 0.00(0.00) 0.38[-0.64, 1.41] 0.52[-0.41, 1.44] -0.13[-1.16, 0.89]
HB -0.1(0.1) -0.1(0.2) 0.0(0.0) 0.1[-0.1, 0.8] 0.0[-0.2, 0.2] 0.1[-0.1, 0.3]
Table 68. Mean Change (SD) in lung function and blood test results from baseline to week +12 in all ITT by trial arm and mean difference [95% CI] in these between trial arms
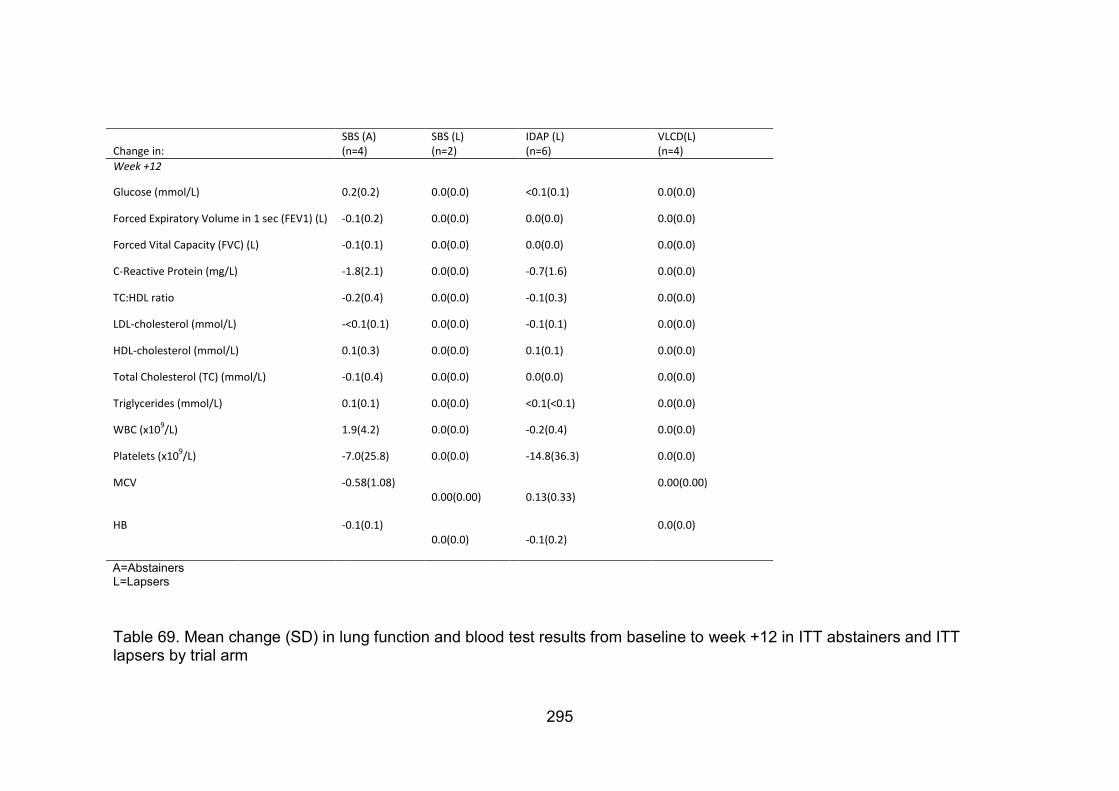
295
Table 69. Mean change (SD) in lung function and blood test results from baseline to week +12 in ITT abstainers and ITT lapsers by trial arm
Change in: SBS (A) (n=4)
SBS (L) (n=2)
IDAP (L) (n=6)
VLCD(L) (n=4)
Week +12
Glucose (mmol/L) 0.2(0.2) 0.0(0.0) <0.1(0.1) 0.0(0.0)
Forced Expiratory Volume in 1 sec (FEV1) (L) -0.1(0.2) 0.0(0.0) 0.0(0.0) 0.0(0.0)
Forced Vital Capacity (FVC) (L) -0.1(0.1) 0.0(0.0) 0.0(0.0) 0.0(0.0)
C-Reactive Protein (mg/L) -1.8(2.1) 0.0(0.0) -0.7(1.6) 0.0(0.0)
TC:HDL ratio -0.2(0.4) 0.0(0.0) -0.1(0.3) 0.0(0.0)
LDL-cholesterol (mmol/L) -<0.1(0.1) 0.0(0.0) -0.1(0.1) 0.0(0.0)
HDL-cholesterol (mmol/L) 0.1(0.3) 0.0(0.0) 0.1(0.1) 0.0(0.0)
Total Cholesterol (TC) (mmol/L) -0.1(0.4) 0.0(0.0) 0.0(0.0) 0.0(0.0)
Triglycerides (mmol/L) 0.1(0.1) 0.0(0.0) <0.1(<0.1) 0.0(0.0)
WBC (x109/L) 1.9(4.2) 0.0(0.0) -0.2(0.4) 0.0(0.0)
Platelets (x109/L) -7.0(25.8) 0.0(0.0) -14.8(36.3) 0.0(0.0)
MCV -0.58(1.08) 0.00(0.00) 0.13(0.33)
0.00(0.00)
HB -0.1(0.1) 0.0(0.0) -0.1(0.2)
0.0(0.0)
A=Abstainers L=Lapsers

296
6.2.24. Adverse Events
There were no serious adverse events during the trial. Most adverse events (7)
occurred in the SBS arm, 5 of which may have been related to NRT use. There
was one adverse event in the IDAP arm related to NRT and there were 4 adverse
events in the VLCD arm, 2 of which were related to the VLCD formula (Table 70).

297
Table 70. Adverse Events (AE) during DeMiST
AE ID visit Trial arm
PARTICIPANT ID Diagnosis Syndrome Start Date Stop Date Intensity Serious Cause: Study Med? Action taken (study Med) Outcome
1 +1 2 27 Sore/heavy/ inflamed arm at site of patch 04/06/2010 08/06/2010 moderate No Yes (NRT) Intervention discontinued Recovered
2 0 3 29 unable to tolerate lipotrim formula 11/06/2010 13/06/2010 mild No Yes (Lipotrim) Intervention discontinued Recovered
3 +4 1 21 headache 28/07/2010 29/07/2010 moderate No Possibly (NRT) Reduced patch* Recovered
4 +4 1 21 central chest pain 29/07/2010 29/07/2010 moderate No Possibly (NRT) Reduced patch* Recovered
5 +4 1 21 nausea 29/07/2010 29/07/2010 mild No Possibly (NRT) Reduced patch* Recovered
6 +4 1 21 backache 28/07/2010 29/07/2010 moderate No Unlikely None Recovered
7 +4 1 21 pain in right forearm 28/07/2010 29/07/2010 mild No Unlikely None Recovered
8 +4 1 21 visual disturbance 28/07/2010 29/07/2010 moderate No Possibly (NRT) Reduced patch* Recovered
9 +4 1 21 cold sweating /flushing 28/07/2010 29/07/2010 mild No Possibly (NRT) Reduced patch* Recovered
10 +1 3 31 Headaches 16/09/2010 23/9/2010 mild No Yes (Lipotrim) None Recovered
11 +2 3 31 Headache & sore throat 26/09/2010 30/9/2010 mild No Unlikely None Recovered
12 +3 3 31 Flu-like symptoms. 30/09/2010 2/10/2010 mild No Unlikely None Recovered
*Unlikely related to NRT as been on patches for 4 weeks by this time, no ECG changes. Med = medication

298
6.3. Discussion
6.3.1. Limitations
The greatest limitations for our findings came from the small sample size. Firstly,
randomisation of few participants led to an unequal balance of characteristics in the
intervention arm, these presented a possible source of confounding. However where
it was appropriate and possible we adjusted for these; we adjusted for age and
gender in the analysis of change in weight and fat mass. Secondly, there was
insufficient quantitative data to draw conclusions as lack of statistical significance
may have been due to type two error rather than lack of real effect. Thirdly, although
some effects did reach statistical and clinical significance the sample was too small to
be representative of the population as a whole. Fourthly, a larger sample size is
needed to overcome measurement error. This may have been the case for
bioelectrical impedence measures of body fat. We used a standard operating
procedure and trained nurses to standardise measurements and kept participants
appointment times consistent. However natural variations in body water throughout
the day or throughout the menstrual cycle may have increased random error. Also,
the large variability in waist and hip measurements meant we had to discount these.
6.3.2. Summary and interpretation of cigarette cravings by trial arm
We found no evidence that cravings in people on IDAP were different from the
control group (Stage 1 of SBS). There was however, evidence that VLCD reduced
cravings by a clinically relevant degree. This is similar to the findings of Danielsson

299
that also showed a reduction in cravings in those on a VLCD (Danielsson et al.,
1999).
We examined whether the effect of the diets on cigarette cravings was mediated by
food desire and/or food need. Food desire, in particular, increased in the IDAP arm,
but there was no evidence that either food desire or food need accounted for the
difference in cigarette cravings between trial arms. Those adhering to the VLCD were
in ketosis and this may have explained the reduction in cravings in the VLCD arm.
Periods of abstinence were associated with lower cigarette craving scores.
Abstinence varied by trial arm, but there was no evidence that these differences in
abstinence accounted for the difference in cigarette cravings seen between trial
arms.
The best fitting model of cigarette cravings over time was a quadratic function that
varied by trial arm but this did not capture or explain the dramatic peaks and troughs
within and between individuals. This variability in withdrawal patterns among
individuals has previously been reported by Piasecki in 2003. He described and
mathematically defined „symptomatic volatility‟ to model the deviations of the
observed data from an individual‟s predicted quadratic model of craving. He
suggested that it is these peaks which make an individual suceptible to relapse. He
also showed that lapsing to smoking can result in either a peak or a trough. We also
saw that abstinence was associated with drop in cigarette craving. We expected the

300
opposite to be true. But as discussed by Piasecki, higher cravings may be associated
with lapsing, as desire to smoke may become too great to resist, rather than smoking
reducing desire. In other words the association may have been due to cause rather
than effect. To explore this further a time lagged model is needed to differentiate
between cause and effect, investigating whether an increase in craving preceeds
lasping and whether lapsing leads to a reduction in craving.
To better explore the relationships between lapsing and cigarette craving, food need
and food desire with cigarette craving we need a more sensitive measure of cigarette
cravings, food cravings and hunger over time. This could be done using ecological
momentary assessment (Shiffman et al., 2002), together with a record of when
cigarettes are smoked. Then, perhaps the most useful way to model these data
would be a time lagged model on the symptomatic volatility of cigarette cravings.
6.3.3. Summary of and interpretation of smoking status by trial arm
Participants were 4 and 8 times more likely to relapse in the IDAP and VLCD arms
respectively, than those in the SBS arm. These values were not statistically
significant and the small sample size and wide 95% confidence intervals around the
means makes the findings uncertain.

301
Cravings may predict relapse, data from an observational study (n=1500), where
smokers enrolled in a smoking cessation trial assessed withdrawal symptoms four
times a day over the two weeks prior to and two weeks post quit date, showed a
postive association between mean craving score and relapse (Piper et al, 2011). So
our findings that relapse is higher and cravings are lower in the VLCD arm seem
contradictory, although our study was not powered to detect difference in abstinence
rates.
6.3.4. Summary and interpretation of physical measures by trial arm
Weight and fat mass reduced in the IDAP arm and increased in the SBS arm. These
effects lessened as the intervention continued and the SBS arm went into Stage 2.
The differences between these trial arms were of clinical importance at all time
points. Reduction in dietary fat intake explained 22% of the reduction in body fat
mass.
Weight, fat mass and total body water reduced dramatically in the VLCD arm, by four
weeks post quit there was also evidence of some loss of lean body mass, which is of
clinical concern. Most lost weight was regained in Stage 2 of the VLCD but weight
gain was less than in the SBS arm. Fat mass in the VLCD arm exceeded its baseline
value at 12 weeks post quit date and this gain was greater than in the SBS arm.

302
Subgroup analysis by abstinence status showed that participants who lapsed or
relapsed to smoking lost greater weight than those who stopped smoking. This is
consistent with previous cohort studies (O‟Hara et al., 1998) and our own analysis of
the Oxford Patch data (section 2.4.3) which shows those who relapse to smoking
return to their smoking weight.
IDAP showed the most promise of a clinically important effect on weight and body fat
in particular, and this was greatest when given at the time of quitting. The Cochrane
review also showed that an individually tailored dietary intervention prevented more
weight gain compared to usual care 12 months, than did a VLCD or general healthy
eating education (Parsons et al., 2009). We found IDAP was not associated with any
adverse events, but people were more likely to relapse to smoking in this arm,
however our study was inadequately powered to investigate abstinence rates. The
Cochrane review showed no significant difference in abstinence rates at 12 months
between those on this type of intervention and usual care, but the sample size from
which this was calculated was still too small to be certain. IDAP now needs to be
compared to usual care in an adequately powered trial to detect long term change in
body composition and effects on relapse.
6.3.5. Summary and interpretation of disease risk factors by trial arm
There were no data on these parameters in the VLCD arm. We had some on lung
function in the SBS arm which showed no important change during the trial.

303
By the end of treatment blood glucose rose slightly in both the SBS and IDAP arms.
In general, cardiovascular risk factors improved in both these arms but more so in the
IDAP arm. The exception was triglycerides, these fell in the IDAP arm but rose in the
SBS arm. It was interesting to note that the data from the IDAP arm was from a
lapsed individual and the data from the SBS arm was from abstainers, but even so,
parameters improved most in the IDAP arm. The sample was too small to draw
conclusions. However, it does draw attention to the benefit:risk ratio of smoking
cessation on short term increase in disease risk factors that were discussed at length
in the introduction to this thesis. The investigation of which needs further
investigation with the aim of targeting and reducing these risks in quitting smokers.
6.3.6. Failure to attend and intention to treat analysis
This trial, as expected from other smoking cessation trials (Marteau et al., 2010), had
a large proportion of participants not attending their appointments and assumed
relapsed to smoking. More participants completed the programme in the SBS arm,
and they were less likely to relapse to smoking although this was an underpowered
measure. It is possible that the incentive of weight control support at eight weeks,
after they stopped smoking, helped to keep them motivated and adhering to the
programme. Whereas, by then, the other arms already received most of their
intervention and incentive to return for visits was reduced.
304
High non-attendance rates meant a large number of missing data had to be imputed
for intention to treat analysis. Although I used BOCF that assumed no effect (i.e. a
return to smoking and original weight) this did not allow for the possibility of weight
gain following relapse after a quit attempt. However, available data suggests that this
is unlikely as „relapsers‟ return to their smoking weight (Lycett et al., 2011a, O‟Hara et
al., 1998). Not accounting for this worst case scenario may have made the results
from the ITT analysis appear more favourable than they were.
The ITT analysis provided a similar pattern of results, but with a diluted effect, on
physical measures compared to completer analysis. Clinically important differences
in favour of the IDAP and VLCD interventions compared to the SBS arm were found.
However, changes in disease risk factors were no longer clinically important in the
ITT analysis.

305
7. SUMMARY OF CONCLUSIONS. REFLECTIONS AND FUTURE
DIRECTION I presented many of the findings of this doctoral research and its implication for
clinical practice and future research as a plenary at the annual UK National
Smoking Cessation Conference in June 2011 (Appendix 46).
Chapter seven fulfils objective nine of the thesis : to discuss the implications of
findings from this doctoral research to advance understanding in this field and lead
to improved clinical practice.
7.1. The Oxford patch cohort analysis
We began this thesis by discussing the problem of smoking cessation related
weight gain. We sought to add to current knowledge by investigating long term
weight gain in a cohort of smokers and abstainers where abstinence was
biochemically validated and continuous over eight years. We then investigated the
baseline characteristics associated with this weight gain. Key points are
summarised in Table 71 with respect to what was already known at the start of our
research, what our research has added and reflections on what this means for
public health, clinical practice and further research. Further detail is discussed in
the text below.

306
We found that smokers who quit smoking gain, over eight years, 7kg more than if
they had continued to smoke, while those who quit for a substantial period and
then resume smoking seem to resume their „smoking weight‟. We were the first
researchers to find a J-shaped relation between baseline BMI and weight gain in
quitters. We also found evidence to suggest that moderate alcohol consumption
at the time of quitting is associated with less weight gain in quitters over eight
years. A complex relationship exists between alcohol consumption and weight
gain and this has long been a source of controversy, so far it has rarely been
explored in quitting smokers.
Our cohort included well-defined continuous abstainers, over a full eight years,
however this group of abstainers was relatively small (n=85) and did not measure
all potential confounders. Therefore, further studies are needed to confirm our
findings, but if these are confirmed, they have important implications for the
management of weight during smoking cessation, in particular to identify those
individuals who are at most risk and at most need of weight control interventions.
From a personal point of view, this cohort analysis helped me develop my skills in
multiple regression analysis and I learnt to identify the strengths and limitations of
our data. This was helped by the peer review process when I submitted these
findings for publication and had to justify the value of my findings despite
limitations of a high level of attrition, some self reported data and unmeasured
confounders. All these things I will consider in designing future studies.

307
Area of investigation
Previous Evidence Our method Our contribution to further evidence
Implications for further research Implications for public health/clinical practice
Risks of post cessation weight gain
Some of the benefit of smoking cessation such as reduced decline in lung function, is offset by weight gained
Literature review Several large prospective cohort studies show that the risk of type two diabetes during the first five years of quitting exceeds that of continuing smokers.
Full systematic review and meta-analysis of these studies is required to quantify the risk of diabetes during the years after quitting smoking
Quitting smokers may benefit from screening for diabetes during this time.
Extent of post cessation weight gain
5kg at one year post cessation, 8-9 at four and five years post cessation
Oxford Cohort analysis
9kg at eight years post cessation. Large standard deviations of our estimates show variable weight gain. 2kg gain in continuing smokers, which is similar to relapsed smokers over this time. Only 25% of those who quit remain a healthy weight 8 years later.
Further long term prospective cohort studies are needed with comparison to the continuing and never smoking population to further determine the extent and duration of post cessation weight gain
Mean weight gain over 8 years is 7kg above continuing smokers, for some it is a lot more. Those who quit smoking are a population at risk of accelerated weight gain
Association of baseline BMI with post cessation weight gain
Evidence is inconclusive Oxford Cohort analysis
We showed for the first time a J shaped relation between baseline BMI and weight gain which may account for some previous inconsistencies.
Confirmatory analysis needed in a larger cohort, with more potential confounders measured and adjusted for.
If confirmed those who are already obese, should be targeted for interventions to prevent further weight gain on smoking cessation
Association of baseline alcohol consumption with post cessation weight gain
One study showed weight gain is greater at 5 years with lower baseline alcohol consumption
Oxford Cohort analysis
Higher baseline alcohol consumption is associated with less weight gain at eight years.
Confirmatory analysis needed in a larger cohort, with more potential confounders measured and adjusted for.
If confirmed advice to avoid alcohol during smoking cessation may need to be revised for those at greatest risk of weight gain. Or non drinkers may need to be targeted for weight gain prevention strategies.
Table 71. Summary of findings and academic contribution from the analysis of the Oxford patch data

308
7.2. The DeMiST trial
We considered how we could add to the evidence base to advance clinical
practice to prevent or treat post cessation weight gain. The Cochrane review
(Parsons et al., 2009) showed evidence that two separate dietary strategies may
prevent weight gain and not reduce abstinence and may even increase it. The
interventions were an individualised dietary and physical activity plan (IDAP) and a
very low calorie diet (VLCD). We therefore designed a three armed randomised
controlled feasibility trial comparing these interventions to usual care within NHS
stop smoking clinics. To do this we used a variety of research methods to answer
a number of questions. Key aspects of our findings on feasibility, process
measures and clinical outcomes, and how these contribute to the current evidence
are summarised in Table 72, Table 73 and Table 74 respectively with some further
detail described below.
7.2.1. Acceptability
To investigate the acceptability of the trial to participants we measured response
and recruitment rates. We found that using a VLCD excluded many potential
participants. We demonstrated that it is difficult to recruit into a trial which offers
help to control weight together with smoking cessation, from GP practices and
advertisement by fliers in newspapers. We were recruiting in an area with access
to free smoking cessation services, so many of those keen to have stop smoking
support may have already done so. It may also be that people are not keen to
tackle weight control and smoking cessation together.

309
Our plan is to move to a full scale trial of the IDAP intervention for weight control
versus usual care during smoking cessation. To improve recruitment we plan to
recruit from a population who are already enrolled in an NHS stop smoking
service. A recent trial in Scotland did so and recruited 90% of smokers entering
the service into a trial to prevent weight gain through education about healthy
eating (Hankey et al., 2010).
We carried out qualitative interviews to understand participants‟ views of the
interventions and trial design. Reasons for acceptability of the IDAP arm seemed
to be a conservative approach to weight loss, whereas in the SBS lack of
acceptability was because participants wanted a weight control intervention
sooner than offered in the control arm. Participants attracted to this kind of trial
were not persuaded that tackling this „step by step‟ was appropriate. Acceptability
seemed also to depend on whether the allocated intervention met participants‟
individual needs rather that the inherent properties of a particular trial arm.
However, our conclusions are tentative as we were unable to meet our purposive
sample. Nevertheless there are several ways we could incorporate meeting
participants‟ needs within our future trial design to test these findings. We could
run a pragmatic trial where participants are randomised into control or a pragmatic
intervention arm in which participants are offered one of several strategies from
which to choose and/or swap between. However, this still leaves us with a control
arm which some might find unacceptable. We could run a preference trial, where
participants without preference are randomised into control or intervention and
those with a preference are allowed to choose. However, systematic review

310
evidence shows that this does not improve retention within an intervention,
although it may improve recruitment rates at the outset (King et al., 2005).
We also asked participants prior to randomisation which intervention they thought
would be most successful. We found no evidence that those who got the
intervention they believed in followed the programme for longer than those who
did not. Aside from the small sample, this evidence is clouded because our
question did not assess whether this was a general belief about the efficacy of the
intervention in a population, or whether it was a belief that it would work for them
personally.
Further investigations of ways to improve retention in behavioural treatment
programmes are needed. One way might be to counsel participants to deal with
difficulties and disappointments that might arise during a clinical trial.
During the exploration of acceptability, I developed skills in semi-structured
interview techniques and learnt that there is a fine balance between insufficient
probing which can lead to false assumption, and too much probing which can
sway participants‟ opinion. The complexity of analysing qualitative data with its
many levels of meaning and interlinking themes has reminded me of the necessity
to keep to a clearly focused research question.

311
7.2.2. Feasibility
Fidelity checks within clinics showed that nurses were competent to run the trial
and deliver the clinical interventions according to the protocol. We have therefore
demonstrated that we were able to train nurses to provide these specialist dietary
interventions within NHS stop smoking clinics. The nurses debriefing session and
fidelity checks provided suggestions to increase nurses‟ confidence in delivering
the interventions and to streamline the practicalities of the full scale trial. In
particular, we will reduce the number of clinical parameters measured. The nurses
found some of these clinical measures difficult. Although they performed them
adequately, the complexity undermined their confidence in their work. In a phase
three trial, where less supervision is likely, there is the potential that this lack of
confidence could lead to stress and reduced competence.

312
Area of investigation
Previous Evidence Our method Our contribution to further evidence
Implications for further research Implications for public health/clinical practice
Recruitment to a stop smoking and weight control trial through invitations from GPs
When we began our research this has not been tried in an NHS setting
Demist feasibility trial
Recruitment to such a trial through invitation via GP practices is difficult
We should try recruiting those already enrolled in the stop smoking services
If recruitment continues to be unsuccessful, we may need to question whether there is a real need for the development and provision of a service which combines smoking cessation and weight control.
Acceptability of randomisation into SBS
Preference trials have shown recruitment can be increased if individuals are given a choice although there is little effect seen on attrition.
Demist feasibility trial
Despite attempts to appease those in the control group with belated dietary intervention participants still found randomisation to the control arm unacceptable. Although there was no evidence to suggest that those randomised to the control arm left the programme earlier than the other arms.
Further research should consider ways to help participants prepare for difficulties and disappointments within clinical trials in order to improve retention in these
Feasibility of a VLCD for quitting smokers
One trial showed a VLCD was feasible for us in this population in a research setting
Demist feasibility trial
VLCD was not a practical option for use in typical NHS stop smoking services
Alternative ketogenic diets could be explored
It is unlikely that VLCDs will form standard care for preventing smoking cessation related weight gain.
Feasibility of delivery of IDAP by stop smoking nurses
When we began our research this has not been tried in an NHS setting
Demist feasibility trial
This was feasible This model could now be trialed on a larger scale.
Table 72. Feasibility Findings from DeMiST and their contribution to current evidence

313
7.2.3. Process measures
7.2.3.1. The Healthy Choice Index (HCI)
We developed the healthy choice index and assessed its validity against a seven
day food diary where food quantity was estimated but not weighed. We measured
the limits of agreement for nutrient intake. We found that while the HCI was a
useful prompt for setting dietary goals within the IDAP intervention it was not a
valid measure of nutrient intake. The one exception to this was total fat, where it
was able to distinguish between low, medium and high intakes. Our results
showed that a fall by one category of fat intake over 12 weeks was associated with
a decrease in body fat mass of 1.0kg. This explained 22% of the reduction in body
fat seen in the IDAP arm.
The assessment of dietary fat was based on more questions than any of the other
nutrients which may have influenced the validity of this measure. Future efforts
should focus on refining the questions in the HCI to improve sensitivity to detect
change in the other nutrients. It could then be used in an adequately powered
sample to test its validity. Before it can be used as a full nutrient assessment tool
within clinical trials, investigating its repeatability and sensitivity to dietary change
associated with a change in clinical outcomes is also needed.

314
7.2.3.2. The Hunger and Craving Score (HCS)
We designed the HCS to capture two different motivations to eat, that resulting
from a homeostatic response to lack of food and the more hedonistic food craving.
There have been independent measures of hunger and cravings developed before
(section 3.1.2). Also, laboratory experiments have measured „implicit wanting‟ and
„explicit liking‟ as a response to food cues before and after test meals (Finlayson et
al., 2008). However, we know of no questionnaire to distinguish between these
two motivations in free living conditions.
We carried out principal components analysis on our HCS to reduce our data for
further analysis. We found that we could distinguish between a craving for fatty
and sugary food and desire for healthy food, but that the item measuring hunger
could be perceived as either. We found no evidence that either of these
motivations to eat was associated with urge to smoke, but we cannot be sure that
this did not arise from the limitations of our questionnaire.
More work on this is needed to better differentiate between hunger and food
craving. A new good starting point would be a qualitative study to understand how
people conceptualise and express notions of craving or desire for food, in contrast
to more physiological notions of hunger. It would have value in investigating not
only hunger and food cravings during smoking cessation, but also their role in
obesity development.

315
Area of investigation Previous Evidence Our method Our contribution to further evidence Implications for further research
Hunger and food craving in quitting smokers
No questionnaire available to distinguish between food need and food craving in the usual living conditions Laboratory studies showed that hunger may increase cravings for cigarettes
Development of Hunger Craving Score (HCS)
It was possible to distinguish between two motivations to eat using a questionnaire, but the nature of ‘hunger’ was still unclear Despite cigarette cravings and food craving being different between trial arms we found no evidence that desire for food mediated cravings for cigarettes
There was considerable overlap of these motivations which require further exploration before these can be measured accurately. This was a process measure which needs confirmation in a larger trial
Dietary change in quitting smokers
There was no validated tool which can be used to assess diet and prompt dietary change in clinical practice
Development of Healthy Choice Index (HCI)
The HCI was validated for assessing high, medium and low intakes of dietary fat, but not of other nutrients. Change in fat as calculated by the HCI partially accounted for reduction in fat mass in the IDAP arm The nurses found it a useful tool to initiate discussion regarding dietary behaviour change
This tool needs revision and further investigation of its validity as a dietary assessment tool. Its role in helping to prompt and monitor change in fat intake needs to be confirmed.
Table 73. Findings of the investigation of process measures in DeMiST their implication for further research

316
7.3.1. Effects of trial arms on urges to smoke
We found no evidence that IDAP reduced cravings compared with control (Stage 1
of SBS) but there was evidence that the VLCD, in which adherent participants
were ketotic, reduced cravings by a score of one on the MPSS similar to previous
findings (Danielsson et al., 1998). However, our modelling did not capture or
explain the dramatic peaks and troughs within and between individuals, which
may be the most likely cause of relapsing (Piasecki et al., 2003). Also it was not a
time lagged model to allow us to investigate whether hunger clearly preceeded
uges to smoke. Our daily measures were also not frequent enough to capture a
variation in urges over the course of a day. This could be investigated in future
studies using ecological momentary assessment (Shiffman et al., 2002).
Analysis of our repeated measures data in DeMiST developed my skill and
confidence in multilevel modelling.
7.3.2. Effects of trial arms on relapse
Participants were four and eight times more likely to relapse in the IDAP and
VLCD arms respectively, than those in the SBS arm, but our sample size was too
small for us to be certain. If cravings predict relpase (Piper at al., 2011) this finding
does not support our findings or those of Danielsson et al. (1998) that cravings are
reduced on a VLCD. The Cochrane review (Parsons et al, 2009) also showed that
abstinence rates were not statistically significantly worse in an individualised

317
dietary intervention compared to usual care, and abstinence rates were better in
those receiving a VLCD than a control condition.
7.3.3. Effects of trial arms on smoking cessation related weight gain
Completer analysis of all those attempting to quit showed weight and fat mass
reduced in the IDAP arm and increased in the SBS arm. These effects lessened
as the intervention continued, and the SBS arm went into Stage 2, and received
their dietary advice. The differences between these trial arms were of clinical
importance at all time points. Intention to treat analysis showed a similar pattern
but the differences were smaller.
In those achieving four week continuous abstinence weight rose in the SBS arm
by 1.1(0.8)kg, this is comparable with weight gain of 1.3kg at four weeks shown by
meta-analysis of those in control arms of smoking cessation trials (Aubin et al.,
unpublished). By contrast weight fell by 2.8kg in the IDAP arm but this was based
on one individual. Two studies have weight data at four weeks in continuous
abstainers who were given individualised dietary advice, one showed weight
increased by 0.6(1.6)kg (n=72) (Perkins et al, 2001) and the other showed virtually
no mean weight increase 0.08(2.4)kg (n=26) (Hall et al., 1992). However, the
standard deviations for these means were large indicating a wide variability, so
with more people we may find that mean weight loss in IDAP is not quite so big.

318
There were no continuous abstainers in the VLCD arm at four weeks, but during
this time participants had quit and lapsed. Overall weight loss was dramatic.
However, there was some evidence of loss of lean body mass by four weeks and
excessive gain in body fat by 12 weeks, which is of clinical concern, but our
sample was too small to be conclusive. Many other studies, in the general
population, have investigated changes in body composition on a VLCD and these
have been reassuring (COMA, 1987). However Danielsson et al. (1998) carried
out the only trial using a VLCD in quitting smokers and they not measure changes
in body composition. So more research is needed if a VLCD is to be pursued for
quitting smokers. However, because of the reasons summarised in the next
section we do not feel this is a feasible option within typical NHS stop smoking
services.
We did not have enough abstainers at the end of twelve weeks to compare
changes in body composition by trial arm.

319
Area of investigation Previous Evidence Our method Our contribution to further evidence Implications for further research
Effect of intervention on weight control
Individual tailored advice and a VLCD looked most promising
Demist feasibility trial VLCD may have unfavorable changes on body composition in this population. IDAP continues to look promising
IDAP needs to be trialed on a larger scale in comparison to usual care to determine its long term effect on weight gain in this population. Changes in body composition in quitting smokers need to be investigated further before a VLCD can be recommended in clinical practice
On cigarette cravings VLCD looked promising Demist feasibility trial Cravings reduced in the VLCD arm compared to the control but were no different between the IDAP and SBS arm
See above
On relapse to smoking VLCD looked promising, individual tailored advice looked neutral, general healthy eating education was identified as potentially problematic.
Demist feasibility trial Those in the SBS arm were least likely to relapse, those in the VLCD arm were most likely to relapse
A trial large enough to test the equivalence of IDAP compared to usual care on smoking rates is needed. The evidence from the Danielsson trial (Danielsson et al., 1998) of reduced abstinence still stands as our trial was so small however the effects on body composition would need to be investigated before recommendations could be made
Table 74. Effects of DeMiST interventions on clinical outcomes and the implication for further research

320
7.3.4. What DeMiST means for clinical practice and future research
The sample was too small to draw firm conclusions for clinical practice. However,
the value of VLCD use within NHS stop smoking clinics appears to be limited for
several reasons. Firstly, only half of those randomised to the VLCD were able to
adhere to it. Secondly, adverse events related to the VLCD were reported. Thirdly,
lean body tissue reduced and fat mass increased beyond that of the control.
Fourthly, the VLCD contraindications, including necessary monitoring which fell
outside of the scope of stop smoking clinics, limited recruitment. This translates to
its limited suitability as a treatment option for quitting smokers. We are therefore
not keen to pursue further research of a VLCD within this population. However, the
reduction in mean craving score found here, similar to those in the Danielsson
study, cited in the Cochrane review (Parsons, 2009), should not be overlooked. It
may be that there is a more practical, food based, ketogenic diet with the potential
to reduce cigarette cravings, and we are keen to explore further.
IDAP showed the most promise at promoting weight loss in abstainers. Cravings
in these individuals were no worse than those who were not actively trying to diet
in the SBS arm. This goes a little way to alleviate concerns based on laboratory
studies that dietary restriction leads to an increase in cigarette cravings. However,
none of the individuals in the IDAP arm achieved 12 week abstinence; and it is not
possible to tell whether this was an artifact of a small sample or an effect of
dieting. Qualitative data showed that this was the least resisted arm of the trial.
The Cochrane review (Parsons et al, 2009) also showed an individually tailored
approach, with an energy prescription, was effective at preventing weight gain. It

321
also showed that this approach did not significantly reduce abstinence rates at 12
months, although the estimate was too imprecise to be sure that there is not a
substantial harmful effect. We are now planning a large equivalence trial to
investigate the long term effects of IDAP on smoking cessation related weight gain
to determine whether abstinence rates in IDAP are equivalent to those in usual
care.
In the meantime how should smoking cessation related weight gain be tackled in
routine clinical practice? In the 2010 national survey of stop smoking advisors
(n=484), we asked advisors what advice they give clients regarding preventing
weight gain. Seventy-six percent reported they encourage healthy food choices
(Appendix 47). Therefore, education about healthy eating is currently prevalent in
practice, but it is not supported by evidence. We offered general healthy eating
messages to those in the SBS arm, but they felt disgruntled and it did not prevent
weight gain. The Cochrane review showed general healthy eating advice was
ineffective in preventing weight gain and suggested that such an approach
reduced abstinence. So, it seems prudent to discourage this practice.
For now, we advocate that smoking cessation advisors encourage patients not to
embark on a dietary strategy to control weight until a quit attempt is established.
Advisors can be reassured that there is no clear evidence, from a review of the
literature, that allowing some weight gain will lead to relapse. However, given the
evidence that this weight gain was unacceptable to some there is a need to be
pragmatic. We would recommend quitting smokers who are keen to control their

322
weight follow the individually tailored dietary advice with an energy prescription.
Many NHS dietitians currently provide this as a treatment for obesity. It appears
the most promising and least likely to cause harm when quitting smoking. For now,
the most expedient way is for a quitter to attend a weight loss service. In the
future, if abstinence rates prove to be equivalent, stop smoking services could be
trained to provide this dietary treatment as part of usual care. An alternative model
is for weight management services to provide smoking cessation support. It need
not only be an option for the weight concerned, but for all individuals as this weight
gain attenuates some of the benefits of stopping smoking and may increase
diabetes risk in the medium term.
323
REFERENCES Abraham C & Michie S. A taxonomy of behavior change techniques used in interventions. Health
Psychology 2008: 27 (3) 379-387
Akbartabartoori M, Lean ME & Hankey CR. Relationships between cigarette smoking, body size
and body shape. International Journal of Obesity 2005: 29, 236-243
Al-Delaimy WK, Manson JE, Solomon CG, Kawachi I, Stampfer MJ, Willett WC, et al., Smoking and
risk of coronary heart disease among women with type 2 diabetes mellitus. Archives of Internal
Medicine 2002: 162 (3) 273–279
Altman DG, Schulz KF, Moher D, Egger M, Davidoff F, Elbourne D, Gøtzsche PC, Lang T and for the
CONSORT Group, The Revised CONSORT Statement for Reporting Randomized Trials: Explanation
and Elaboration. Annals Internal Medicine 2001: 134:663-694
Anthonisen NR, Connett JE, and Murray RP. Smoking and Lung Function of Lung Health Study
Participants after 11 Years. American Journal Respiratory Critical Care Medicine 2005: 166, 675-
679
Anthonisen NR, Connett JE, Enright PL, Manfreda J. Hospitalizations and mortality in the Lung
Health Study. American Journal Respiratory Critical Care Medicine 2002: 166, 333-9
Arcavi L, Peyton Jacob P, Hellerstein M and Neal L Benowitz NL. Divergent tolerance to metabolic
and cardiovascular effects of nicotine in smokers with low and high levels of cigarette
consumption Clinical Pharmacology and Therapeutics (1994) 56, 55–64;
doi:10.1038/clpt.1994.101
Aubin H-J, Berlin I, Smadja E, West R. Factors Associated with Higher Body Mass Index, Weight
Concern, and Weight Gain in a Multinational Cohort Study of Smokers Intending to Quit.
International Journal of Environmental Research and Public Health 2009: 6(3) 943-957
Audrain-McGovern J and Benowitz NL. Cigarette Smoking, Nicotine, and Body Weight. Clinical
Pharmacology & Therapeutics 2011: 90 (1) 164–168. doi:10.1038/clpt.2011.105
Balfour DJK. The neurobiology of tobacco dependence: A preclinical perspective on the role of the
dopamine projections to the nucleus. Nicotine & Tobacco Research 2004: 6(6) 899-912
doi:10.1080/14622200412331324965
Baliunas D O, Taylor B J, Irving H, Roerecke M, Patra J, Mohapatra S. Alcohol as a risk factor for
type 2 diabetes: A systematic review and meta-analysis. Diabetes Care 2009: 32, 2123–2132.
doi:10.2337/dc09-0227
Bandura A. Self-efficacy: Toward a unifying theory of behavioral change. Psychological Review
1977: 84(2) 191-215. doi: 10.1037/0033-295X.84.2.191

324
Berlin I. Endocrine and metabolic effects of smoking cessation. Current Medical Research and
Opinion 2009: (25) (2) 527-534
Berlin I. Smoking-induced metabolic disorders: A review. Diabetes & Metabolism 2008: 34 (4) Pt
1, 307-314
Beulens JWJ, vanBeers RM, Stolk RP, Schaafsma G, Hendricks HFJ The effect of moderate alcohol
consumption on fat distribution and adipocytokine. Obesity 2006: 14(1) 60-66
doi:10.1038/oby.2006.8
Bingham SA, Cassidy A, Cole TJ, Welch A, Runswick SA, Black AE et al. Validation of weighed
records and other methods of dietary assessment using the 24 h urine nitrogen technique and
other biological markers. British Journal of Nutrition 1995: 73(4) 531-550
Bingham SA, Gill C, Welch A, Cassidy A, Runswick SA, Oakes S, Lubin R, Thurnham DI, Key TJ, Roe
L, et al. Validation of dietary assessment methods in the UK arm of EPIC using weighed records,
and 24-hour urinary nitrogen and potassium and serum vitamin C and carotenoids as biomarkers.
Int J Epidemiol. 1997; 26 Suppl 1:S137-51.
Bingham SA. Dietary assessments in the European prospective study of diet and cancer (EPIC).
European Journal of Cancer Prevention. 1997: 6(2)118-24
Bingham, S.A., Gill, C., Welch, A., Day, K., Cassidy, A., Khaw, K.T., Sneyd, M.J., Key, T.J.A., Roe, L. &
Day, N.E. (1994) Comparison of dietary assessment methods in nutritional epidemiology: weighed
records v 24h recalls, FFQ and estimated-diet records. Br. J. Nutr. 72, 619 – 643.
Black AE. Critical evaluation of energy intake using the Goldberg cut-off for energy intake:basal
metabolic rate. A practical guide to its calculation, use and limitations. International Journal of
Obesity & Related Metabolic Disorders: Journal of the International Association for the Study of
Obesity 2000: 24(9), 1119-1130.
Bland J and Altman D. Statistical methods for assessing agreement between two methods of
clinical measurement. Lancet I 1986:307–310
Blundell JE. Perspective on the Central Control of Appetite Obesity Research 2006: 14, S160–
S163; doi: 10.1038/oby.2006.298
Bolego C, Poli A and Paoletti R. Smoking and gender. Cardiology Research 2002: 53, 568–576
Bosse R, Garvey AJ, Costa PT Jr. Predictors of weight change following smoking cessation . Int J
Addict 1980; 15:969–91
Breslow RA, Smothers BA. Drinking Patterns and Body Mass Index in Never Smokers: National
Health Interview Survey, 1997-2001. American Journal Epidemiology 2005: 161(4)368-376.
doi:10.1093/aje/kwi061
Brewin CR, Bradley C. Patient preferences and randomised clinical trials. British Medical
Journal1989:299,313-5

325
Brusasco V. Statistically significant or clinically useful? From population studies to patient care
European Respiratory Journal 2009: 34, 291-292; doi:10.1183/09031936.00061509
Buemann B. The effect of wine or beer versus a carbonated soft drink, served at a meal, on ad
libitum energy intake. International Journal Obesity 2002: 26(10) 1367-1372.
doi:10.1038/sj.ijo.0802069
Burke LE, Warziski M, Styn MA, Music E, Hudson AG, Sereika SM. A randomized clinical trial of a
standard versus vegetarian diet for weight loss: the impact of treatment preference. International
Journal of Obesity 2008: 32;166-176.
Caan B, Coates A, Schaefer C, Finkler L, Sternfeld B & Corbett K. Women gain weight 1 year after
smoking cessation while dietary intake temporarily increases. Journal of the American Dietetic
Association 1996: 96, 1150-1155
Cepeda-Benito A, Gleaves DH, Williams TL et al. The development and validation of the state and
trait food-cravings questionnaires. Behavior Therapy 2000 31: 151–73
Chen Y, Horen SL and Dosman JA, Body weight and weight gain related to pulmonary function
decline in adults: a six year follow up study. Thorax 1993: 48, 375–380
Chen Y, Horne SL & Dosman JA. The influence of smoking cessation on body weight may be
temporary. American Journal of Public Health, Vol 83(9), Sep 1993, 1330-1332. doi:
10.2105/AJPH.83.9.1330
Cheskin LJ, Hess JM, Henningfield J, Gorelick DA. Calorie restriction increases cigarette use in
adult smokers. Psychopharmacology 2005: 179(2):430-436
Chinn S, Jarvis D, Melotti R, Luczynska C, Ackermann-Liebrich U, Anto J M, et al. Smoking
cessation, lung function, and weight gain: A follow-up study. The Lancet 2005: 365, 1629–1635.
doi:10.1016/S0140-6736(05)66511-7
Chiolero A, Faeh D, Paccaud F, Cornuz J. Consequences of smoking for body weight, body fat
distribution, and insulin resistance. American Journal of Clinical Nutrition 2008: 87(4):801-809
Christensen L. Craving for sweet carbohydrate and fat-rich foods – possible triggers and impact
on nutritional intake. Nutrition Bulletin 2007 32(s1) 43–51 DOI: 10.1111/j.1467-
3010.2007.00615.x
Christensen L. The effect of carbohydrates on affect. Current concepts in clinical nutrition
doi:10.1016/S0899-9007(97)00003-8 Nutrition 1997: 13 (6) 503-514
Clevidence BA, Taylor PR, Campbell WS, Judd JT, Lean and heavy women may not use energy from
alcohol with equal efficiency. Journal of Nutrition 1995: 125, 2536-2504
Colditz GA, Giovannucci E, Rimm EB, Stampfer MJ, Rosner B, Speizer FE et al. Alcohol intake in
relation to diet and obesity in women and men. American Journal of Clinical Nutrition 1991:
54(1), 49-55.

326
COMA RHSS. The Use of Very Low Calorie Diets in Obesity: Report of the Working Group on Very
Low Calorie Diets. RHSS. 1987. HMSO, London
Compher C, Frankenfield D, Keim N, Roth-Yousey L. Best Practice Methods to Apply to
Measurement of Resting Metabolic Rate in Adults: A Systematic Review. Journal of the American
Dietetic Association 2006: 106(6) 881-903
Conway JM, Ingwersen LA, Moshfegh AJ, Accuracy of dietary recall using the USDA five-step
multiple-pass method in men: an observational validation study. Journal of the American Dietetic
Association 2004: 104, 595-603
Conway JM, Ingwersen LA, Vinyard BT, Moshfegh AJ. Effectiveness of the US Department of
Agriculture 5-step multiple-pass method in assessing food intake in obese and nonobese women.
American Journal of Clinical Nutrition 2003: 77,1171-8
Cooke KM, Frost GW, Thornell IR Alcohol consumption and blood pressure. Survey of the
relationship at a health-screening clinic. Medical Journal of Australia 1982: 1, 65-69
Crawley H. Food Portion Sizes. HMSO 1992: London
Critchley JA and Capewell S. Mortality risk reduction associated with smoking cessation in
patients with coronary heart disease: a systematic review. Journal of the American Medical
Association 2003: 290, 86–97
Cummings DE & Schwartz MW. Genetics and Pathophysiology of Human Obesity. Annual Review
of Medicine 2003: 54, 453-471
Dale LC, Schroeder DR, Wolter TD, Croghan IT, Hurt RD, Offord KP. Weight change after smoking
cessation using variable doses of transdermal nicotine replacement. Journal of General Internal
Medicine 1998: 13, 9–15.
Dallongeville J, Marécaux N, Fruchart JC, Amouyel P. Cigarette smoking is associated with
unhealthy patterns of nutrient intake: a meta-analysis. Journal of Nutrition. 1998;128:1450-1457
Danielsson T, Rossner S, Westin A. Open randomised trial of intermittent very low energy diet
together with nicotine gum for stopping smoking in women who gained weight in previous
attempts to quit. British Medical Journal 1999: 494; 319(7208):490-493
Daughton DM, Fortmann SP, Glover ED, et al. The smoking cessation efficacy of varying doses of
nicotine patch delivery systems 4 to 5 years post-quit day. Preventive Medicine 1999: 28, 113-118
Davey-Smith G, Bracha Y, Svendsen KH et al. Incidence of type 2 diabetes in the randomized
multiple risk factor intervention trial. Annals of Internal Medicine. 2005:142(5)313-322.
Davì G, Patrono C.Platelet activation and atherothrombosis. New England Journal of Medicine
2007: 357(24) 2482-94.
De Castro JM & Orozco S. Moderate alcohol intake and spontaneous eating patterns of humans:
evidence of unregulated supplementation. American Journal of Clinical Nutrition 1990: 52, 246-
253

327
de Melo-Martín,I, Jo A. Beyond informed consent: the therapeutic misconception and trust.
Journal of Medical Ethics 2008:34,202-205. doi:10.1136/jme.2006.019406
Department of Health (DOH). Dietary Reference Values for Food and Nutrients in the United
Kingdom. HMSO 1991, London
Department of Health, Food Standards Agency. National Diet and Nutrition Survey 2009
Department of Health, Food Standards Agency. National Diet and Nutrition Survey 2010
Doll R, Peto R, Boreham J and Sutherland I. Mortality in relation to smoking: 50 years’
observations on male British doctors. British Medical Journal 2004: 328, 1519–1528
Draper A and Swift JA, Qualitative research in nutrition and dietetics: data collection issues.
Journal of Human Nutrition and Dietetics 2011: 24, 3-12
Drudy S. The Classification of Social Class in Sociological Research. The British Journal of Sociology
1991: 42(1) 21-41
Ebbert JO, P. Yang P, Vachon CM, Vierkant RA, Cerhan JR, Folsom AR, Sellers TA. Lung Cancer Risk
Reduction After Smoking Cessation: Observations From a Prospective Cohort of Women Journal
of Clinical Oncology 2003: 21 (5) 921-926
Edwards SJL, David A Braunholtz DA, Lilford RJ, Stevens AJ. Randomisation in trials: do potential
trial participants understand it and find it acceptable? British Medical Journal 1999: 318 : 1407
Eisenberg D, and Quinn B C. Estimating the Effect of Smoking Cessation on Weight Gain: An
Instrumental Variable Approach. Health Services Research 2006: 41, 2255–2266. doi:
10.1111/j.1475-6773.2006.00594.x
Eliasson B & Smith U. Leptin levels in smokers and long-term users of nicotine gum. European
Journal of Clinical Investigation 1999: 29 (2) 145-152
Eliasson B, Taskinen MR, Smith U. Long-term use of nicotine gum is associated with
hyperinsulinemia and insulin resistance. Circulation 1996: 94(5) 878-81
Engels JM and Diehr P. Imputation of missing longitudinal data: a comparison of methods. Journal
of Clinical Epidemiology 2003: 56 (10) 968-976 doi:10.1016/S0895-4356(03)00170-7
Etter JF & Stapleton JA. Nicotine replacement therapy for long-term smoking cessation: a meta-
analysis. Tobacco Control 2006: 15, 280-285
Ezzati M and Lopez AD. Estimates of global mortality attributable to smoking in 2000, Lancet 2003
362, 847–852
Fagerstrom K-O andSchneider NG. Measuring nicotine dependence: A review of the Fagerstrom
Tolerance Questionnaire. Journal of Behavioral Medicine 1989: 12 (2)
Ferguson SG, Shiffman S, Rohay JM, Gitchell JG & Garvey AJ. Effect of compliance with nicotine
gum dosing on weight gained during a quit attempt. Addiction 2011: 106 (3) 651-656

328
Ferrara CM, Kumar M, Nicklas B, Mccrone S, Goldberg AP. Weight gain and adipose tissue
metabolism after smoking cessation in women. International Journal of Obesity 2001; 25: 1322–
1326.
Filozof C, Fernandez Pinilla MC & Fernandez-Cruz A. Smoking cessation and weight gain. Obesity
Reviews 2004: 5(2) 95-103
Finlayson G, King, N & Blundell J. The role of implicit wanting in relation to explicit liking and
wanting for food: Implications for appetite control. Appetite 2008: 50(1) 120-
127doi:10.1016/j.appet.2007.06.007
Finn CA and Sladeczek IE. Assessing the social validity of behavioral interventions: a review of
treatment acceptability measures. School Psychology Quarterly 2001: 16 (2) 176–206
Flanagan, Moore, Godsland, Cockington, Robinson and Phillips. Alcohol consumption and insulin
resistance in young adults. European Journal of Clinical Investigation 2000: 30: 297–301
Flegal KM, Troiano RP, Pamuk ER, Kuczmarski RJ & Campbell SM. The influence of smoking
cessation on the prevalence of overweight in the United States. New England Journal of Medicine
1995: 333, 1165-1170
Fletcher C & Peto R. The natural history of chronic airflow obstruction. British Medical Journal
1977: 1, 1645-1648
Food Standards Agency McCance and Widdowsons Composition of Foods. Fifth Summary Edition.
Cambridge: Royal Chemistry Society.
Food Standards Agency Project 2009 NO 902025
Foster GD, Wadden TA, Vogt RA & Brewer G, What is a reasonable weight loss? Patients'
expectations and evaluations of obesity treatment outcomes. Journal of Consulting and Clinical
Psychology 1997: 65(1)79-85. doi: 10.1037/0022-006X.65.1.79
Fox NJ Ward KJ, O’Rourke AJ. The ‘expert patient’: empowerment or medical dominance? The
case of weight loss, pharmaceutical drugs and the Internet. Social Science & Medicine 2005: 60,
1299–1309
Franse LV, Pahor M, Di Bari M, Somes GW, Cushman WC, Applegate WB. Hypokalemia
associated with diuretic use and cardiovascular events in the systolic hypertension in the elderly
program. Hypertension 2000: 35, 1025–30
Freisling H, Elmadfa I, Schuh W & Wagner KH. Development and validation of a food frequency
index using nutritional biomarkers in a sample of middle-aged and older adults. Journal of Human
Nutrition and Dietetics 2009: 22 (1) 29–39
French SA and Jeffrey RW. Weight concerns and smoking: A literature review Annals of Behavioral
Medicine 1995: 17 (3) 234-244, DOI: 10.1007/BF02903918

329
French, SA. Hennrikus DJ, Jeffery RW. Smoking status, dietary intake, and physical activity in a
sample of working adults. Health Psychology 1996: 15(6) 448-454. doi: 10.1037/0278-
6133.15.6.448
Froom P, Kristal-Boneh E, Melamed S, Gofer D, Benbassat J, Ribak J. Smoking cessation and body
mass index of occupationally active men: the Israeli CORDIS Study. American Journal of Public
Health 1999: 89(5) 718-722
Froom P, Melamed S & Benbassat J. Smoking cessation and weight gain. Journal of Family Practice
1998: 46, 460-464
Gautier A, Roussel R, Ducluzeau PH, Lange C, Vol S, Balkau B, et al. Increases in waist
circumference and weight as predictors of type 2 diabetes in individuals with im¬paired fasting
glucose: Influence of baseline BMI: Data from the DESIR study. Diabetes Care 2010: 33, 1850–
1852. doi:10.2337/dc10-0368
Gerace TA, Hollis JF, Ockene JK & Svendsen KH. Smoking cessation and change in diastolic blood
pres¬sure, body weight, and plasma lipids. MRFIT Research Group. Preventive Medicine 1991: 20
(5) 602–620
Gibson EL and Desmond E. Chocolate Craving and Hunger State: Implications for the Acquisition
and Expression of Appetite and Food ChoiceAppetite 1999 32 (2) 219-240
doi:10.1006/appe.1998.0207
Giovannucci E, Colditz G, Stampfer MJ, Rimm EB, Ljtjn L, Sampson L and Willett WC. The
Assessment of Alcohol Consumption by a Simple Self-administered Questionnaire. American
Journal of Epidemiology 1991: 133(8) 812-817
Gordon T, Joseph T & Doyle JT. Alcohol Consumption and Its Relationship to Smoking, Weight,
Blood Pressure, and Blood Lipids. The Albany Study. Archives of Internal Medicine 1986: 146(2),
262-265
Gordon T, Kannel WB. Drinking and Its Relation to Smoking, BP, Blood Lipids, and Uric Acid. The
Framingham Study. Archives of Internal Medicine 1983: 143(7) 1366-1374
Gratziou C. Respiratory, cardiovascular and other physiological consequences of smoking
cessation. Current Medical Research and Opinion 2009: 25 (2) 535-545
Hajek P, Jackson P, Belcher M (1988) Long-term use of nicotine chewing gum. Occurrence,
determinants, and effect on weight gain. JAMA 260:1593–1596
Hajek P, Jackson P, Belcher M. Long-term use of nicotine chewing gum. Occurrence,
determinants, and effect on weight gain. Journal of the American Medical Association 1988:
260:1593–1596
Hajek, P. Withdrawal-oriented Therapy for Smokers. British Journal of Addiction 2006: 84 (6) 591
– 598

330
Hall SM, Tunstall CD, Vila KL, Duffy J. Weight gain prevention and smoking cessation: cautionary
findings. American Journal of Public Health 1992: 82(6),799-803
Hankey CR, Leslie WS Koshy PR, Mackenzie M, Murray H, Boyle S and Lean MEJ. Food choice and
changes in body weight and shape in those attempting smoking cessation. 2009. FSA Report.
Hellerstedt WI, Jeffery RW, Murray DM. The association between alcohol intake and adiposity in
the general population. American Journal of Epidemiology 1990: 132(4) 594-59a.
Hill RJ and Davies PSW. Review article:The validity of self-reported energy intake as determined
using the doubly labelled water technique. British Journal of Nutrition 2001: 85, 415-430
Hofstetter A, Schutz Y, Jequier E, Wahren J. Increased 24-hour energy expenditure in cigarette
smokers. New England Journal of Medicine 1986: 314(2) 79-82
Hollis S and Campbell F. What is meant by intention to treat analysis? Survey of published
randomised controlled trials. British Medical Journal 1999: 319, 670
Hughes JR & Dorothy Hatsukami D. Signs and Symptoms of Tobacco Withdrawal.Archives of
General Psychiatry 1986: 43(3)289-294
Hughes JR, Gust SW, Keenan R, Fenwick JW, Skoog K & Higgins ST. Long-term use of nicotine vs
placebo gum. Archives of Internal Medicine 1991: 51:1993–1998
Hughes JR, Gust SW, Keenan R, Fenwick JW, Skoog K, Higgins ST (1991) Long-term use of nicotine
vs placebo gum. Arch Int Med 51:1993–1998
Hur NW, Kim HC, Nam CM, Jee SH, Lee HC, & Suh I. Smoking cessation and risk of type 2 diabetes
mellitus: Korea Medical Insurance Corporation Study. European Journal of Cardiovascular
Prevention and Rehabilitation 2007: 14, 244–249
Iino KI, Wase M, Tsutsu N, Iida M. Smoking cessation and glycaemic control in type 2 diabetic
patients. Diabetes, Obesity and Metabolism 2004: 6 (3) 81–186
Imperial Cancer research Fund General Practice Research Group (ICRFGPRG). Randomised trial of
nicotine patches in general practice: results at one year. British Medical Journal 1994: 6942, 1476-
7
Imperial Cancer research Fund General Practice Research Group. Effectiveness of a nicotine patch
in helping people stop smoking: Results of a randomised trial in general practice. British Medical
Journal 1993: 306, 1304–1308. doi:10.1136/bmj.306.6888.1304
Introduction to SAS. UCLA: Academic Technology Services, Statistical Consulting Group. from
http://www.ats.ucla.edu/stat/sas/notes2/ (accessed May 2010).
Janzon E, Hedblad B, Berglund G & Engstrom G. Changes in blood pressure and body weight
following smoking cessation in women Journal of Internal Medicine 2004: 255 (2) 266-272
Jatoi NA, Jerrard-Dunne P, Feely F and Mahmud A. Impact of smoking and smoking cessation on
arterial stiffness and aortic wave reflection in hypertension. Hypertension 2007: 49, 981-985

331
Jeffery, Robert W.; Hennrikus, Deborah J.; Lando, Harry A.; Murray, David M.; Liu, Jane W.
Reconciling conflicting findings regarding postcessation weight concerns and success in smoking
cessation. Health Psychology 2000: 19(3) 242-246. doi: 10.1037/0278-6133.19.3.242
Jensen EX, Fusch C, Jaeger P, Peheim E, Horber FF. Impact of chronic cigarette smoking on fuel
metabolism. Journal of clinical Endocrinology and Metabolism 1995: 80, 2181–2185.
Johnstone AM, Horgan GW, Murison SD, Bremner DM, Lobley GE. Effects of a high-protein
ketogenic diet on hunger, appetite, and weight loss in obese men feeding ad libitum. American
Journal of Clinical Nutrition 2008: 87(1) 44-55
Jolly K, Lewis A, Beach J, Denley J, Adab P, Deeks JJ, Daley A , Aveyard P. A randomised controlled
trial to compare a range of commercial or primary care led weight reduction programmes with a
minimal intervention control for weight loss in obesity: the Lighten Up trial. 2010 Unpublished
Jones K. Commentary on Danielsson 1998: results are unlikely to be as good in routine practice .
BMJ 1999: 319, 49
Kawachi I, Troisi RJ, Rotnitzky AG, Coakley EH, Colditz GA. Can physical activity minimize weight
gain in women after smoking cessation? American Journal of Public Health 1996: 86(7) 999-1004
Kennedy C, Camden C, and Timmerman G. Relationships among perceived supervisor
communication, nurse morale, and sociocultural variables. Nursing Administration Quarterly
1990: 14(4) 38-46
Kerr C, Robinson E, Stevens A, Braunholtz D, Edwards SJL, Lilford R. Ethical issues in the design
and conduct of cluster randomised controlled trials. Journal of Medical Ethics 2004:30, 80-84.
doi:10.1136/jme.2002.001123
King M, Nazareth I, Lampe F, Bower P, Chandler M, Morou M, Sibbald B and Lai R. Conceptual
framework and systematic review of the effects of participants’ and professionals’ preferences in
randomised controlled trials. Health Technology Assessment 2005; Vol. 9: No. 35
Klesges RC, Klesges LM & Meyers AW. Relationship of Smoking Status, Energy Balance, and Body
Weight: Analysis of the Second National Health and Nutrition Examination Survey Journal of
Consulting and Clinical Psychology1991: 59(6) 899-905
Klesges RC, Winders SE, Meyers AW et al. How much weight gain occurs following smoking
cessation? A comparison of weight gain using both continuous and point prevalence abstinence.
Journal of Consulting & Clinical Psychology. 1997: 65(2) 286-291
Klesges RC, Winders SE, Meyers AW, Eck LH, Ward KD, Hultquist CM et al. Smoking, body weight
and their effects on smoking behavior: A comprehensive review of the literature. Psychological
Bulletin 1989: 106, 204-230
Koh-Banerjee P, Chu N-F, Spiegelman D, Rosner B, Colditz G and Willett W et al., Prospective
study of the association of changes in dietary intake, physical activity, alcohol consumption, and
smoking with 9-y gain in waist circumference among 16 587 US men. American Journal of Clinical
Nutrition 2003 78, 719–727

332
Koppes, LLJ, Dekker JM, Hendriks HFJ, Bouter LM, & Heine RJ. (2005). Moderate alcohol
consumption lowers the risk of type 2 diabetes: A meta-analysis of prospective observational
studies. Diabetes Care, 28, 719–725. doi:10.2337/diacare.28.3.719
Kretsch MJ, Fong AKH, Green MW. Behavioral and Body Size Correlates of Energy Intake
Underreporting by Obese and Normal-weight Women. Journal of the American Dietetic
Association 99(3)300-306 doi:10.1016/S0002-8223(99)00078-4
Lacey A. and Luff D. Qualitative Research Analysis. The NIHR RDS for the East Midlands / Yorkshire & the Humber, 2007.
Lee DH, Ha M-H, Kim J-R and Jacobs DR. Effects of Smoking Cessation on Changes in Blood
Pressure and Incidence of Hypertension A 4-Year Follow-Up Study Hypertension 2001: 37,194-198
Leeman RF, O'Malley SS, White MA, McKee SA. Nicotine and food deprivation decrease the ability
to resist smoking. Psychopharmacology (Berl). 2010 Jun 29. [Epub ahead of print]
Levine JA, Harris MM & Morgan MY. Energy expenditure in chronic alcohol abuse. European
Journal of Clinical Investigation 2000: 30 (9) 779–786 doi:10.1046/j.1365-2362.2000.00708.x
Levine MD, Perkins KA, Kalarchian MA, Cheng Y, Houck PR, Slane JD, Marcus MD. Bupropion and
Cognitive Behavioral Therapy for Weight-Concerned Women Smokers. Archives of Internal
Medicine 2010:170(6)543-550
Li M. (2000) Nicotine administration enhances NPY expression in the rat hypothalamus. Brain
Research 867:1-2, 157-164
Libby P, Ridker PM and Maseri A. Inflammation and Atherosclerosis Circulation 2002: 105: 1135-
1143 doi: 10.1161/hc0902.104353
Lindstrom D, Sundberg-Petersson I, Adami J & Tonnesen H. Disappointment and drop-out rate
after being allocated to control group in a smoking cessation trial. Contemporary Clinical Trials
2010: 31, 22-26
Livingstone MB, Prentice AM, Coward WA, Ceesay SM, Strain JJ, McKenna PG, Nevin GB, Barker
ME and Hickey RJ. Simultaneous measurement of free-living energy expenditure by the doubly
labeled water method and heart-rate monitoring. American Journal of Clinical Nutrition 1990: 52,
59-65
Lloyd-Jones DM, Liu K, Tian L, Greenland P. Narrative Review: Assessment of C-Reactive Protein in
Risk Prediction for Cardiovascular Disease. Annals Internal Medicine 2006: 145(1) 35-42
Löwik MRH, Odink J, Kok FJ, Ockhuizen T. Hematocrit and Cardiovascular Risk Factors among
Elderly Men and Women. Gerontology 1992: 38, 205-213 (DOI: 10.1159/000213329)
Lycett D (b), Munafò M, Johnstone E, Murphy M, Aveyard P. Weight Change Over Eight Years in
Relation to Alcohol Consumption in a Cohort of Continuing Smokers and Quitters. Nicotine and
Tobacco Research. 2011 May 26. [Epub ahead of print]

333
Lycett D, Aveyard P, Munafò M, Johnstone E, Murphy M. What happened to their weight 8 years
after nicotine patch treatment? BMJ eletters 2009
Lycett D, Hajek P, Aveyard P. Trial Protocol: Randomised controlled trial of the effects of very low
calorie diet, modest dietary restriction, and sequential behavioural programme on hunger, urges
to smoke, abstinence and weight gain in overweight smokers stopping smoking. Trials 2010: 11,
94doi:10.1186/1745-6215-11-94
Lycett D. Abstract 052. Weight change over eight years in relation to baseline body mass index in
a cohort of continuing and quitting smokers. Journal of Epidemiology and Community Health
2009: 63 (Supp Ii): A20
Lycett, D (a), Munafo M, Johnstone E, Murphy M, & Aveyard P. Associations between weight
change over 8 years and baseline body mass index in a cohort of continuing and quitting smokers.
Addiction 2011: 106, 188–196. doi:10.1111/j.1360-0443.2010.03136.x
Mannisto S, Pietinen P, Haukka J, Ovaskainen ML, Albanes D, Virtamo J. Reported alcohol intake,
diet and body mass intake in male smokers. Eurpoean Journal of Clinical Nutrition 1996: 50, 239-
245
Margetts BM and Jackson AA. Interactions between people's diet and their smoking habits: the
dietary and nutritional survey of British adults. British Medical Journal 1993: 307 : 1381 doi:
10.1136/bmj.307.6916.1381
Marteau TM, Munafo MR, Aveyard P, Hill C, Whitwell S, Willis TA, Johnstone EC, Wright AJ,
Prevost AT, Armstrong D, Weinman J, Kinmonth AL, Sutton S. Trial Protocol: Using genotype to
tailor prescribing of nicotine replacement therapy: a randomised controlled trial assessing impact
upon adherence. BMC Public Health 2010: 10, 680. doi:10.1186/1471-2458-10-680
Martel P and Fantino M. Mesolimbic dopaminergic system activity as a function of food reward: A
microdialysis study. Pharmacology Biochemistry and Behavior 1996: 53(1) 221-226.
doi:10.1016/0091-3057(95)00187-5
Matsushita Y, Nakagawa T, Yamamoto S, et al. Associations of smoking cessation with visceral fat
area and prevalence of metabolic syndrome in men: the Hitachi health study. Obesity 2011: 19,
647-51
McRobbie H, Hajek P. Effect of glucose on tobacco withdrawal symptoms in recent quitters using
bupropion or nicotine replacement. Human Psychopharmacology 2004: 19(1) 57-61
Mercer ME, Holder MD Food Cravings, Endogenous Opioid Peptides, and Food Intake: A Review
Appetite 1997: 29 (3) 325-352 doi:10.1006/appe.1997.0100
Miller MR, Hankinson J, Brusasco V, Burgos F, Casaburi R, Coates A et al. Standardisation of
spirometry. European Respiratory Journal 2005: 26(2) 319-338
Mills N, Donovan JL, Wade J Hamdy FC, Neal DE and Lane JA. Exploring treatment preferences
facilitated recruitment to randomized controlled trials. Journal of Clinical Epidemiology 2011: 64
(10) 1127-1136 doi:10.1016/j.jclinepi.2010.12.017

334
Miyata G, Meguid MM, Varma M, Fetissov SO, Kin H. Nicotine alters the usual reciprocity
between meal size and meal number in female rat. Physiology & Behaviour 2001: 74, 169–176.
Mizoue T, Ueda R, Tokui N, Hino Y & Yoshimura T. Body mass decrease after initial gain following
smoking cessation International Journal of Epidemiology 1998, 279 84-98
Moffatt RJ and Owens S. Cessation from cigarette smoking: changes in body weight, body
composition, resting metabolism and energy consumption. Metabolism Clinical and Experimental
1991: 40, 465–470
Moffatt S, Mackintosh J, White M, Howel D, Sandell A. The acceptability and impact of a
randomised controlled trial of welfare rights advice accessed via primary health care: qualitative
study Biomedical Central (BMC) Public Health 2006: 6, 163. doi:10.1186/1471-2458-6-163
Molarius A, J C Seidell JC, K Kuulasmaa K,Dobson AJ & Sans S. Smoking and relative body weight:
an international perspective from the WHO MONICA Project Journal of Epidemiology and
Community Health1997: 51, 252-260
Moore DJ and Williams D. Emotional distress about weight gain and attitude to goal achievement
failure as predictors of self-regulatory efficacy: Does ethnicity make a difference? Journal Health
Psychology published online 25 March 2011
Munafo MR, Tilling K & Ben-Shlomo Y. Smoking status and body mass index: A longitudinal study.
Nicotine & Tobacco Research 2009: 11, 765-771
Murray RL, Coleman T, Antoniak M, Stocks J, Fergus A, Britton J, and Lewis SA. The effect of
proactively identifying smokers and offering smoking cessation support in primary care
populations: a cluster-randomised trial. Addiction 2008: 103: 998–1006. doi: 10.1111/j.1360-
0443.2008.02206.x
Murray RP, Istvan JA, Voelker HT. Does Cessation of Smoking Cause a Change in Alcohol
Consumption? Evidence from the Lung Health Study. Substance Use & Misuse 1996: 31(2), 141-
156
National Institute of Clinical Excellence (NICE). CG43 Obesity: the prevention, identification,
assessment and management of overweight and obesity in adults and children. 2006
Nides M, Rand C, Dolce J, Murray R, O'Hara P, Voelker H et al. Weight gain as a function of
smoking cessation and 2-mg nicotine gum use among middle-aged smokers with mild lung
impairment in the first 2 years of the Lung Health Study. Health Psychology 1994: 13(4) 354-361
Nijs IMT, Franken IHA, Muris P. The modified Trait and State Food-Cravings Questionnaires:
Development and validation of a general index of food craving. Appetite 2007:49 (1), 38-
46doi:10.1016/j.appet.2006.11.001
Nishiyama M, et al. The combined unhealthy behaviors of breakfast skipping and smoking are
associated with the prevalence of diabetes mellitus. Tokohu Journal of Experimental Medicine
2009: 218, 259-264

335
Nordmann AJ, Abigail Nordmann A, Briel M, Keller U, Yancy WS, Brehm BJ, Bucher HC. Effects of
Low-Carbohydrate vs Low-Fat Diets on Weight Loss and Cardiovascular Risk Factors A Meta-
analysis of Randomized Controlled Trials. Arch Intern Med. 2006;166:285-293.
Office of National Statistics. Statistics on Smoking: England, NHS Information Centre for Health
and Social Care. 2010
O'Hara P, Connett JE, Lee WW, Nides M, Murray R & Wise R. Early and late weight gain following
smoking cessation in the Lung Health Study. American Journal of Epidemiology 1998: 148, 821-
830
Parsons AC, Shraim M Inglis J Aveyard P Hajek P. Interventions for preventing weight gain after
smoking cessation. Cochrane Database of Systematic Reviews. 2009: 21 (1) CD006219
Paxton AE, Strycker LA, Toobert DJ, Ammerman AS, Glasgow RE. Starting The Conversation:
Performance of a Brief Dietary Assessment and Intervention Tool for Health Professionals.
American Journal of Preventive Medicine 2011: 40(1) 67-71doi:10.1016/j.amepre.2010.10.009
Pelchat ML, Johnson A, Chan R, Valdez J, Ragland JD. Images of desire: food-craving activation
during fMRI. NeuroImage 2204: 23 (4)1486-1493 doi:10.1016/j.neuroimage.2004.08.023
Perkins KA, Epstein LH, Marks BL, Stiller RL, Jacob RG. The effect of nicotine on energy
expenditure during light physical activity. New England Journal of Medicine 1989; 320:898–903
Perkins KA, Epstein LH, Sexton JE & Pastor S. Effects of smoking cessation on consumption of
alcohol and sweet, high-fat foods. Journal of Substance Abuse 1990 2(3) 287-297
Perkins KA, Epstein LH, Sexton JE, Solberg-Kassel R, Stiller RL, Jacob RG. (1992) Effects of nicotine
on hunger and eating in male and female smokers. Psychopharmacology 106:1, 53-59
Perkins KA, Marcus MD, Levine MD, D'Amico D, Miller A, Broge M et al. Cognitive-behavioral
therapy to reduce weight concerns improves smoking cessation outcome in weight-concerned
women. Journal of Consulting & Clinical Psychology 2001: 69(4) 604-613
Perkins KA. Effects of tobacco smoking on caloric intake. Addiction 1992 87 (2) 193-205
Perkins KA. Weight gain following smoking cessation. Journal of Consulting and Clinical
Psychology 1993: 61(5) 768-777. doi: 10.1037/0022-006X.61.5.768
Peters RW, Hamilton J &Hamilton BP. Incidence of cardiac arrhythmias associated with mild
hypokalemia induced by low-dose diuretic therapy for hypertension. South Medical Journal 1989:
82, 966–69
Peto R, Darby S, Deo H, Silcocks P, Whitley E, Doll R. Smoking, smoking cessation, and lung cancer
in the UK since 1950: combination of national statistics with two case-control studies BMJ
2000;321:323-329 doi:10.1136/bmj.321.7257.323

336
Piasecki TM, Jorenby DE, Smith SS, Baker TB. Smoking withdrawal dynamics: I. Abstinence distress
in lapsers and abstainers. Journal of Abnormal Psychology 2003: 112, 3-13. Doi: 10.1037/0021-
843X.112.1.3
Pirie PL, McBride CM, Hellerstedt W, Jeffery RW, Hatsukami D, Allen S et al. Smoking cessation in
women concerned about weight. American Journal of Public Health 1992: 82(9) 1238-1243
Pisinger C, Jorgensen T. Waist circumference and weight following smoking cessation in a general
population: the Inter99 study. Preventive Medicine 2007: 44, 290-5
Pistelli F, Aquilini F and Carrozzi LWeight Gain after Smoking Cessation Monaldi Arch Chest
Disease 2009: 71(2) 81-87
Raben A, gerholm-Larsen L, Flint A, Holst JJ & Astrup A. Meals with similar energy densities but
rich in protein, fat, carbohydrate, or alcohol have different effects on energy expenditure and
substrate metabolism but not on appetite and energy intake. American Journal of Clinical
Nutrition 2003: 77(1) 91-100
Rabkin S. Relationship between weight change and the reduction or cessation of cigarette
smoking. International Journal of Obesity 1984: 8, 665-673
Raemer D, Anderson M, Cheng A, Fanning R, Nadkarni V and Savoldelli G. Research Regarding
Debriefing as Part of the Learning Process. Simulation in Healthcare 2011: 6 (7) pp S52-S57 doi:
10.1097/SIH.0b013e31822724d0
Reas DL, Nygard JF, Sorensen T. Do quitters have anything to lose? Changes in body mass index
for daily, never, and former smokers over an 11-year period (1990—2001). Scandinavian Journal
of Public Health 2009: 37( 7) 774-777
Renjilian DA, Perri MG, Nezu AM, McKelvey WF, Shermer RL, Anton SD. Individual versus group
therapy for obesity: effects of matching participants to their treatment preferences. Journal of
Consulting and Clinical Psychology 2001: 69(4)717-721.
Reports on tasks for scientific cooperation (RTSC). Report of experts participating in Task 7.3.
September 2002. Collection of data on products intended for use in very-low-calorie-diets
RHSS Working Group on Very Low Calorie Diets. 1987. HMSO, London
Rodin J. Weight change following smoking cessation: The role of food intake and exercise.
Addictive Behaviors 1987: 12, 303-317
Rothman KJ, Greenland S. Modern Epidemiology. Second Edition. 1998. Lippincott - Raven. US
Rudolph J W, Simon R, Raemer DB, and Eppich WJ. Debriefing as Formative Assessment: Closing
Performance Gaps in Medical Education. Academic Emergency Medicine 2008 : 15: 1010–1016.
doi: 10.1111/j.1553-2712.2008.00248.x
Rudolph JW, Simon R, Raemer DB, Eppich WJ. Debriefing as formative assessment: closing
performance gaps in medical education. Academic Emergency Medicine 2008: 15,1010–1016

337
Russell MA. The classification of smoking by factorial structure of motives. Journal of the Royal
Statistical Society 1974: 137, 313-333
Saper CB, Chou TC, Elmquist JK. The need to feed: homeostatic and hedonic control of eating.
Neuron. 2002: 36
Schofield WN. Predicting basal metabolic rate, new standards and review of previous work.
Human Nutrition: Clinical Nutrition 1985: 39 C (supp 1), 5-41
Schroeder BE, Binzak JM, Kelley AE. A common profile of prefrontal cortical activation following
exposure to nicotine- or chocolate-associated contextual cues. Neuroscience 2001: 105 (3) 535-
545doi:10.1016/S0306-4522(01)00221-4
Scotiish Intercollegiate Guideline Network (SIGN) Guideline Management of Obesity 2010: 115,
ISBN 978 1 905813 57 5
Shiffman S, Gwaltney CJ, Balabanis MH, Liu KS, Paty JA, Kassel JD, Hickcox M, Gnys M. Immediate
antecedents of cigarette smoking: An analysis from ecological momentary assessment. Journal of
Abnormal Psychology 2002: 111(4) 531-545. doi: 10.1037/0021-843X.111.4.531
Shiffman S. Relapse Following Smoking Cessation: A Situational Analysis. Journal of Consulting
and Clinical Psychology 1982, Vol. 50, No. 1,71-86
Shimokata H, Muller DC, Andres R. Studies in the distribution of body fat. III. Effects of cigarette
smoking. Journal of the American Medical Association 1989: 261(8) 1169 –73.
Spencer EA, Appleby PN, Davey GK & Key TJ. Validity of self-reported height and weight in 4808
EPIC Oxford participants. Public Health Nutrition 2002: 5, 561-565
Spring B, Doran N, Pagoto S, Schneider K, Pingitore R & Hedeker D. Randomized controlled trial
for behavioral smoking and weight control treatment: effect of concurrent versus sequential
intervention. Journal of Consulting and Clinical Psychology 2004: 72(5), 785-796
Stamford BA, Matter S, Fell R and Papanek P. Effects of smoking cessation on weight gain,
metabolic rate, caloric consumption and blood lipids. American Journal of Clinical Nutrition 1986:
43, 486–494
Stefanikova Z, Jurkovicova J, Sevcikova L, Sobotova L, Aghova L. Association Between Tobacco
Smoke and Nutritional Behavior. Epidemiology 2009: 20 (6) s160 doi:
10.1097/01.ede.0000362546.98667.d7
Strine TW, Mokdad AH, Dube SR, Balluz LS, Gonzalez O, Berry JT, Manderscheid R and Kroenke K.
The association of depression and anxiety with obesity and unhealthy behaviors among
community-dwelling US adults General Hospital Psychiatry 2008: 30 (2) 127-137
doi:10.1016/j.genhosppsych.2007.12.008
Sturges JE, Hanrahan KJ. Comparing telephone and face to face qualitative interviewing: a research note. Qualitative Research 2004;4:107-118.

338
Suter PM, Is alcohol consumption a risk factor for weight gain and obesity? Critical Reviews in
Clinical Laboratory Sciences 2005 42(3): 197-227
Suter PM, Jequier E, Schutz Y. Effect of ethanol on energy expenditure. American Journal of
Physiology, Regulatory Integregrated Compensatory Physiology 1994: 266(4) R1204-R1212
Suter PM, Schutz Y, Jequier E. The effect of ethanol on fat storage in healthy subjects. New
England Journal of Medicine 1992: 326, 983-987
Sutherland G, Stapleton JA, Russell MA, Jarvis MJ, Hajek P, Belcher M, Feyerabend C Randomised
controlled trial of nasal nicotine spray in smoking cessation. Lancet 1992: 340, 324–329
Swan GE and D. Carmelli D. Characteristics associated with excessive weight gain after smoking
cessation in men. American Journal of Public Health 1995: 85, 73–77
Swift JA and Tischler V. Qualitative research in nutrition and dietetics: getting started. Journal of
Human Nutrition and Deietics 2010: 23, 559-566
Tang J, Muir J, Lancaster T, Jones L & Fowler G. Health profiles of current and former smokers and
lifelong abstainers. OXCHECK Study Group. Oxford and Collaborators Health Check. Journal of the
Royal College of Physicians of London 1997: 31, 304-309
Taylor AH, Ussher MH and Faulkner G. The acute effects of exercise on cigarette cravings,
withdrawal symptoms, affect and smoking behaviour: a systematic review. Addiction 2007 102:
534–543. doi: 10.1111/j.1360-0443.2006.01739.x
Taylor AW, Wilson DH, and Wakefield M. Differences in health estimates using telephone and door-to-door survey methods - a hypothetical exercise. Australian and New Zealand Journal of Public Health 1998;22:223-226.
Teo KK, Ounpuu S, Hawken S, Pandey MR, V. Valentin V and Hunt D et al., Tobacco use and risk of
myocardial infarction in 52 countries in the INTERHEART study: a case- control study, Lancet
2006: 368, 647–658
Tice DM, Bratslavsky E, and Baumeister RF. Emotional distress regulation takes precedence over
impulse control: If you feel bad, do it! Journal of Personality and Social Psychology. 2001: 80(1)
53-67
Toll BA, Katulak NA, Williams-Piehota P, O’Malley S Validation of a scale for the assessment of
food cravings among smokers. Appetite 2008: 50 (1) 25-32 doi:10.1016/j.appet.2007.05.001
Tolstrup JS, Halkjaer J, Heitmann BL, Tjonneland AM, Overvad K, Sorensen TIA, Gronbaek MN.
Alcohol drinking frequency in relation to changes in waist circumference. American Journal
Clinical Nutrition 2008: 87(4) 957-962
Tolstrup JS, Heitmann BL, Tjonneland AM, Overvad OK, Sorensen TIA, Gronbaek MN. The relation
between drinking pattern and body mass index and waist and hip circumference. International
Journal of Obesity 2005: 29, 490-497

339
Tønnesen P, Paoletti P, Gustavsson G, Russell MA, Saracci R, Gulsvik A, Rijcken B, Sawe U. Higher
dosage nicotine patches increase one-year smoking cessation rates: results from the European
CEASE trial. Collaborative European Anti-Smoking Evaluation. European Respiratory Society.
European Respiratory Journal 1999: 13(2) 238-46
Tonstad S. Cigarette smoking, smoking cessation, and diabetes. Diabetes Research & Clinical
Practice 2009: 85(1) 4-13
Travier N, Agudo A & May AM, et al. Smoking and body fatness measurements: a cross-sectional
analysis in the EPIC-PANACEA study. Preventive Medicine 2009: 49 (5) 365–373
Treweek S, Pitkethly M, Cook J, Kjeldstrom M, Taskila T, Johansen M, Sullivan F, Wilson S, Jackson
C, Jones R and Mitchell E. Strategies to improve recruitment to randomised controlled trial
(Review). The Cochrane Library 2010 Issue 4.
Tremblay A, St-Pierre S. The hyperphagic effect of a high-fat diet and alcohol intake persists after
control for energy density. American Journal of Clinical Nutrition 1996: 63(4) 479-482
Tremblay A, Wouters E, Wenker M, St-Pierre S, Bouchard C, Despres JP. Alcohol and a high-fat
diet: a combination favoring overfeeding. American Journal of Clinical Nutrition 1995: 62(3) 639-
644
US Department of Health and Human Services. The health benefits of smoking cessation: a report
of the Surgeon General. Washington, D.C.: Government Printing Office, 1990. (DHHS publication
no. (CDC) 90–8416.)
van Dijk WW, Zeelenberg M, van der Pligt J. Blessed are those who expect nothing: Lowering
expectations as a way of avoiding disappointment. Journal of Economic Psychology2003: 24, 505–
516
Volkow ND, Wang G-J, Fowler JS, Telang F. Overlapping neuronal circuits in addiction and obesity:
evidence of systems pathology. Philosophical Transactions of the Royal Society 2008: 363 (1507)
3191-3200.doi: 10.1098/rstb.2008.0107
Wang L, Lee IM, Nanson JE, Buring JE & Sesso HD. Alcohol consumption, weight gain, and risk of
becoming overweight in middle-aged and older women. Archives of Internal Medicine 2010: 170
(5) 453-461
Wannamethee SG and Shaper AG. Alcohol, body weight, and weight gain in middle-aged men.
American Journal of Clinical Nutrition 2003: 77, 1312–7.
Wannamethee SG, Field AE, Colditz GA & Rimm EB. Alcohol intake and 8-year weight gain in
women: a prospective study. Obesity Research 2004: 12 (9) 1396
Wannamethee SG, Shaper AG, Perry IJ. Smoking as a modifiable risk factor for type 2 diabetes in
middle-aged men. Diabetes Care 2001: 24 (9) 1590–1595
Weiner B. Intrapersonal and interpersonal theories of motivation from an attributional
perspective. Educational Psychology Review 2000: 12(1)

340
West R, Hajek P, Stead L & Stapleton J. Outcome criteria in smoking cessation trials: proposal for a
common standard. Addiction 2005: 100(3) 299-303
West R, Hajek P. Evaluation of the mood and physical symptoms scale (MPSS) to assess cigarette
withdrawal. Psychopharmacology 2004: 177(1-2) 195-199
West R, Ussher M, Evans M, Rashid M. Assessing DSM-IV nicotine withdrawal symptoms: a
comparison and evaluation of five different scales. Psychopharmacology 2006: 184 (3) 619-184
Doi: 10.1007/s00213-005-0216-z
Westerterp KR, Meijer EP, Goris AHC & Kester ADM. Alcohol energy intake and habitual physical
activity in older adults. British Journal of Nutrition 2004: (1)149-152
Westerterp KR. Diet induced thermogenesis. Nutrition and Metabolism 2004: 1(5)
Westerterp-Plantenga MS, Verwegen CRT. The appetizing effect of an aperitif in overweight and
normal-weight humans. American Journal of Clinical Nutrition 1999: 69(2) 205-212
White MA, Whisenhunt BL, Williamson DA et al. Development and validation of the food-craving
inventory. Obesity Research 2002: 10, 107–14
Will JC, Galuska DA, Ford ES, A. Mokdad A, and Calle EE. Cigarette smoking and diabetes mellitus:
evidence of a positive association from a large prospective cohort study, International Journal of
Epidemiology 2001: 30 (3) 540–546
Willemse BWM, Postma DS, Timens W and ten Hacken NHT. The impact of smoking cessation on
respiratory symptoms, lung function, airway hyperresponsiveness and inflammation European
Respiratory Journal 2004: 23, 464-476; doi:10.1183/09031936.04.00012704
Willemse BWM, Postma DS, Timens W and ten Hacken NHT. The impact of smoking cessation on
respiratory symptoms, lung function, airway hyperresponsiveness and inflammation European
Respiratory Journal 2004: 23, 464-476, doi:10.1183/09031936.04.00012704
Willi C, Bodenmann P, Ghali WA, Faris PD, Coruz J. Active smoking and the risk of type 2 diabetes.
JAMA 2007:298(22)
Williamson DF, Madans J, Anda RF, Kleinman JC, Giovino GA, Byers T. Smoking Cessation and
Severity of Weight Gain in a National Cohort. New England Journal of Medicine 1991: 324, 739-
745
Wise RA, Enright PL, Connett JE et al. and for the Lung Health Research Group. Effect of weight
gain on pulmonary function after smoking cessation in the Lung Health Study. American Journal
Respiratory Critical Care Medicine 1998: 157, 866–872
World Health Organisation (WHO). Obesity: preventing and managing the global epidemic.
Report of a WHO Consultation. WHO Technical Report Series 894. Geneva: World Health
Organization, 2000.
Wurtman RJ and Wurtman JJ, Carbohydrate craving, obesity and brain serotonin. Appetite 1986:
7, 99–103.

341
Wynne K, Stanley S, McGowan B & Bloom S. Appetite control. Journal Endocrinology 2005: 184,
291-318
Yeh HC, Duncan BB, Schmidt MIs, Wang NY, Brancati FL. Smoking, Smoking Cessation, and Risk for
Type 2 Diabetes Mellitus. Annals of Internal Medicine. 2010: 152(1):10-17
Yeomans MR. Effects of alcohol on food and energy intake in human subjects: Evidence for
passive and active over-consumption of energy. British Journal of Nutrition 2004: 92 (SUPPL.
1):S31-S34
Yoshizumi T, Nakamura T, Yamane M, Hasan AH, Islam W, Menju M, Yamasaki K, Arai T, Kotani K,
Funahashi T, Yamashita S, Matsuzawa Y. Abdominal Fat: Standardized Technique for
Measurement at CT Radiology 1999: 211, 283-286.
Yudkin P, Hey K, Roberts S, Welch S, Murphy M, Walton R. Abstinence from smoking eight years
after participation in randomised controlled trial of nicotine patch. British Medical Journal 2003:
327 (7405):28-29
Yves Schutz. 2nd Plenary Session: 'Body-weight balance and regulation' Role of substrate
utilization and thermogenesis on body-weight control with particular reference to alcohol.
Proceedings of the Nutrition Society 2000: 59, 511-517
Zelen M. A New Design for Randomized Clinical Trials. New England Journal of Medicine 1979:
300, 1242-1245
Copyright © 2022 FDOKUMEN