Monitoring the resin infusion manufacturing process under industrial environment using distributed...
17
http://jcm.sagepub.com/ Journal of Composite Materials http://jcm.sagepub.com/content/46/6/691 The online version of this article can be found at: DOI: 10.1177/0021998311410479 2012 46: 691 originally published online 3 August 2011 Journal of Composite Materials P. Wang, J. Molimard, S. Drapier, A. Vautrin and J.C. Minni sensors Monitoring the resin infusion manufacturing process under industrial environment using distributed Published by: http://www.sagepublications.com On behalf of: American Society for Composites can be found at: Journal of Composite Materials Additional services and information for http://jcm.sagepub.com/cgi/alerts Email Alerts: http://jcm.sagepub.com/subscriptions Subscriptions: http://www.sagepub.com/journalsReprints.nav Reprints: http://www.sagepub.com/journalsPermissions.nav Permissions: http://jcm.sagepub.com/content/46/6/691.refs.html Citations: What is This? - Aug 3, 2011 OnlineFirst Version of Record - Feb 27, 2012 Version of Record >> by guest on September 7, 2012 jcm.sagepub.com Downloaded from
Transcript of Monitoring the resin infusion manufacturing process under industrial environment using distributed...

http://jcm.sagepub.com/Journal of Composite Materials
http://jcm.sagepub.com/content/46/6/691The online version of this article can be found at:
DOI: 10.1177/0021998311410479
2012 46: 691 originally published online 3 August 2011Journal of Composite MaterialsP. Wang, J. Molimard, S. Drapier, A. Vautrin and J.C. Minni
sensorsMonitoring the resin infusion manufacturing process under industrial environment using distributed
Published by:
http://www.sagepublications.com
On behalf of:
American Society for Composites
can be found at:Journal of Composite MaterialsAdditional services and information for
http://jcm.sagepub.com/cgi/alertsEmail Alerts:
http://jcm.sagepub.com/subscriptionsSubscriptions:
http://www.sagepub.com/journalsReprints.navReprints:
http://www.sagepub.com/journalsPermissions.navPermissions:
http://jcm.sagepub.com/content/46/6/691.refs.htmlCitations:
What is This?
- Aug 3, 2011 OnlineFirst Version of Record
- Feb 27, 2012Version of Record >>
by guest on September 7, 2012jcm.sagepub.comDownloaded from
JOURNAL OFC O M P O S I T EM AT E R I A L SArticle
Monitoring the resin infusionmanufacturing process under industrialenvironment using distributed sensors
P. Wang1,2,3, J. Molimard1,2,3, S. Drapier1,2,3, A. Vautrin1,2,3 andJ.C. Minni4
Abstract
A novel direct approach to detect the resin flow front during the Liquid Resin Infusion process under industrial envi-
ronment is proposed. To detect the resin front accurately and verify the results, which are deduced from indirect micro-
thermocouples measurements, optical fiber sensors based on Fresnel reflection are utilized. It is expected that the
results derived from both techniques will lead to an improvement of our understanding of the resin flow and in particular
prove that micro-thermocouples can be used as sensors as routine technique under our experimental conditions.
Moreover, comparisons with numerical simulations are carried out and experimental and simulated mold filling times
are successfully compared.
Keywords
Polymer–matrix composites, in situ monitoring, liquid resin infusion
Introduction
Recently, liquid composite molding (LCM) processeshave been developed as interesting alternative processesto prepregs. Especially, the resin infusion-based pro-cesses (liquid resin infusion (LRI)/resin film infusion(RFI)) are now considered as cost-effective processesto make lighter thick and complex composite struc-tures.1 They have been developed to overcome someof the limitations encountered in resin transfer molding(RTM).2 The resin infusion processes can be utilized inflexible conditions, for example, in low-cost open moldswith vacuum bags in nylon or silicone. As these pro-cesses only require low resin pressure and the tooling isless expensive than RTM rigid molds, they are partic-ularity suitable for many small and medium sizecompanies.
As one type of resin infusion processes, LRI processseems quite promising. In this process (Figure 1), resininfusion is performed through a highly permeabledraining fabric placed on the top of the fiber preforms.A differential pressure is created by a vacuum at thevent of the system which leads to the resin impregna-tion in the compressible perform, mainly in the trans-verse direction. The LRI process leads to final part
quality improvement since resin flow and cure are dis-tinct. However, both dimensions and fiber volume frac-tion of the final piece are still not well controlled mainlybecause of the large variation of the perform volumewhen vacuum and pressure are applied. Indeed, dimen-sions result from a transient mechanical equilibriumbetween flow dominated phenomena and preform com-paction which is strongly non-linear. Controlling theresin flow is therefore a main issue to master the com-posite parts service properties. An experimentalapproach is developed here to monitor the main exper-imental data during the LRI process, such as the resinflow, in order to improve our knowledge, characterize
1Department of Mechanics and Materials Processing, Structures and
Materials Science Division, Ecole Nationale Superieure des Mines de
Saint-Etienne, Saint-Etienne Cedex 02, France2Laboratory Claude Goux, UMR CNRS 5146, Ecole Nationale Superieure
des Mines de Saint-Etienne, Saint-Etienne Cedex 02, France3Universite de Lyon, Ecole Nationale Superieure des Mines de Saint
Etienne, Saint-Etienne Cedex 02, France4Hexcel Corporation SAS, Les Avenieres, France
Corresponding author:
J. Molimard, Universite de Lyon, Ecole Nationale Superieure des Mines de
Saint Etienne, 42023 Saint-Etienne Cedex 02, France
Email: [email protected]
Journal of Composite Materials
46(6) 691–706
! The Author(s) 2011
Reprints and permissions:
sagepub.co.uk/journalsPermissions.nav
DOI: 10.1177/0021998311410479
jcm.sagepub.com
by guest on September 7, 2012jcm.sagepub.comDownloaded from
the physical mechanisms and compare the measuredresults with a numerical model3,4 predictions.
Experimental techniques dealing with flow frontcharacterization can mainly be found in the literaturerelated to permeability measurement issues. The deter-mination of permeability in the preform plane has beenintensively studied by measuring the one-dimensionaland radial flows in resin injection processes.5–7
Compared with the in-plane flow measurement, thetransverse flow detection is however considered muchmore difficult. The first results for transverse permeabil-ity were published in 1971 by Stedile,8 and then thisdetection was extended by Parnas and Han.9,10 Afterthe development of in-situ sensors such as thermistor,thermocouple, and optical fiber (OF) sensor,11 thistechnique has been widely used to study the resinfront in RTM6,12,13 and resin infusion processes.14,15
Micrometer gage16 or pressure sensors17 were alsoemployed to characterize the infusion process. Morerecently, ultrasound technique18 and optical full fieldmethod19,20 have monitored successfully the transverseresin flow during the LCM processes.
In order to reduce the complexity in the measure-ment while decreasing as much as possible the pertur-bation in the real manufacturing process, during thewhole LRI process, micro-thermocouple and OFsensor have been used in this article to monitor theresin infusion process (Figure 2(b)). It was shown that
these two types of sensors could not only overcome thedrawbacks of existing techniques used in our industrialconditions, but also characterize the resin flow position,the filling time, the curing time, and the preform tem-perature which are key parameters controlling the partquality manufactured through LRI process.
Monitoring LRI process by OF sensorand micro-thermocouples
Principle
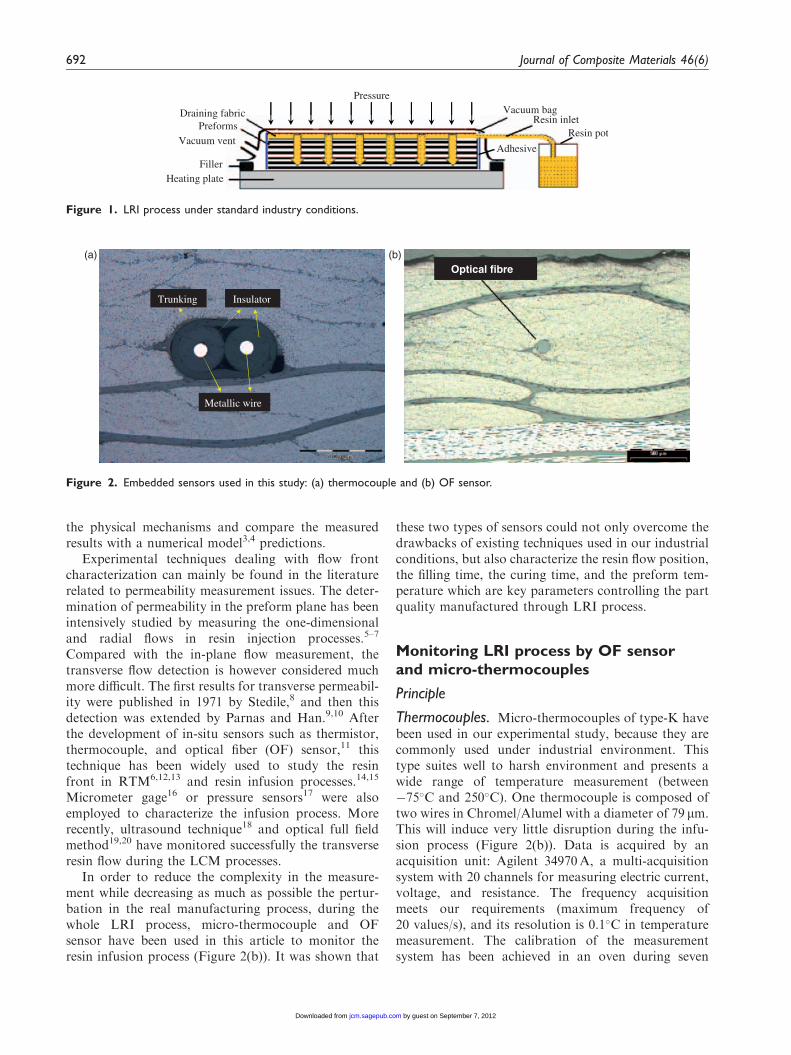
Thermocouples. Micro-thermocouples of type-K havebeen used in our experimental study, because they arecommonly used under industrial environment. Thistype suites well to harsh environment and presents awide range of temperature measurement (between�75�C and 250�C). One thermocouple is composed oftwo wires in Chromel/Alumel with a diameter of 79 mm.This will induce very little disruption during the infu-sion process (Figure 2(b)). Data is acquired by anacquisition unit: Agilent 34970A, a multi-acquisitionsystem with 20 channels for measuring electric current,voltage, and resistance. The frequency acquisitionmeets our requirements (maximum frequency of20 values/s), and its resolution is 0.1�C in temperaturemeasurement. The calibration of the measurementsystem has been achieved in an oven during seven
Metallic wire
InsulatorTrunking
(a) (b)Optical fibre
Figure 2. Embedded sensors used in this study: (a) thermocouple and (b) OF sensor.
PressureVacuum bag
Resin inletDraining fabric
PreformsVacuum vent
Filler
Resin pot
Heating plate
Adhesive
Figure 1. LRI process under standard industry conditions.
692 Journal of Composite Materials 46(6)
by guest on September 7, 2012jcm.sagepub.comDownloaded from
isothermal heating conditions and compared with areference platinum probe (PT100). The resolution ofthis calibration is 0.1�C too.
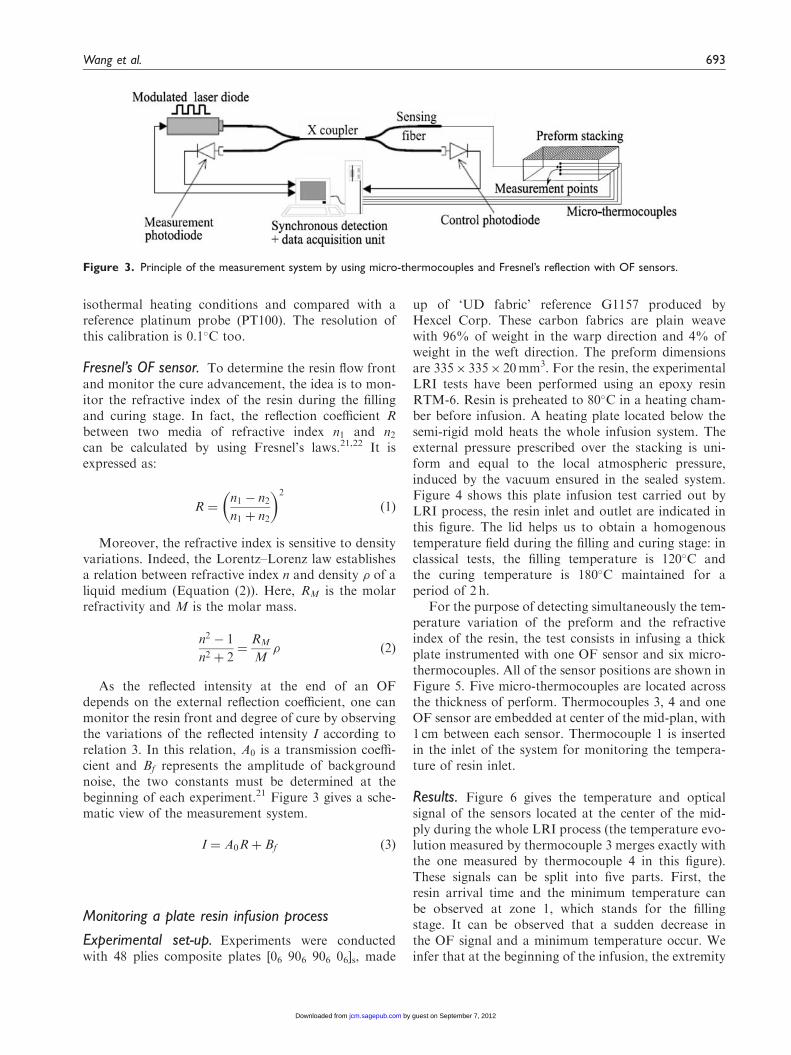
Fresnel’s OF sensor. To determine the resin flow frontand monitor the cure advancement, the idea is to mon-itor the refractive index of the resin during the fillingand curing stage. In fact, the reflection coefficient Rbetween two media of refractive index n1 and n2can be calculated by using Fresnel’s laws.21,22 It isexpressed as:
R ¼n1 � n2n1 þ n2
� �2
ð1Þ
Moreover, the refractive index is sensitive to densityvariations. Indeed, the Lorentz–Lorenz law establishesa relation between refractive index n and density � of aliquid medium (Equation (2)). Here, RM is the molarrefractivity and M is the molar mass.
n2 � 1
n2 þ 2¼
RM
M� ð2Þ
As the reflected intensity at the end of an OFdepends on the external reflection coefficient, one canmonitor the resin front and degree of cure by observingthe variations of the reflected intensity I according torelation 3. In this relation, A0 is a transmission coeffi-cient and Bf represents the amplitude of backgroundnoise, the two constants must be determined at thebeginning of each experiment.21 Figure 3 gives a sche-matic view of the measurement system.
I ¼ A0Rþ Bf ð3Þ
Monitoring a plate resin infusion process
Experimental set-up. Experiments were conductedwith 48 plies composite plates [06 906 906 06]s, made
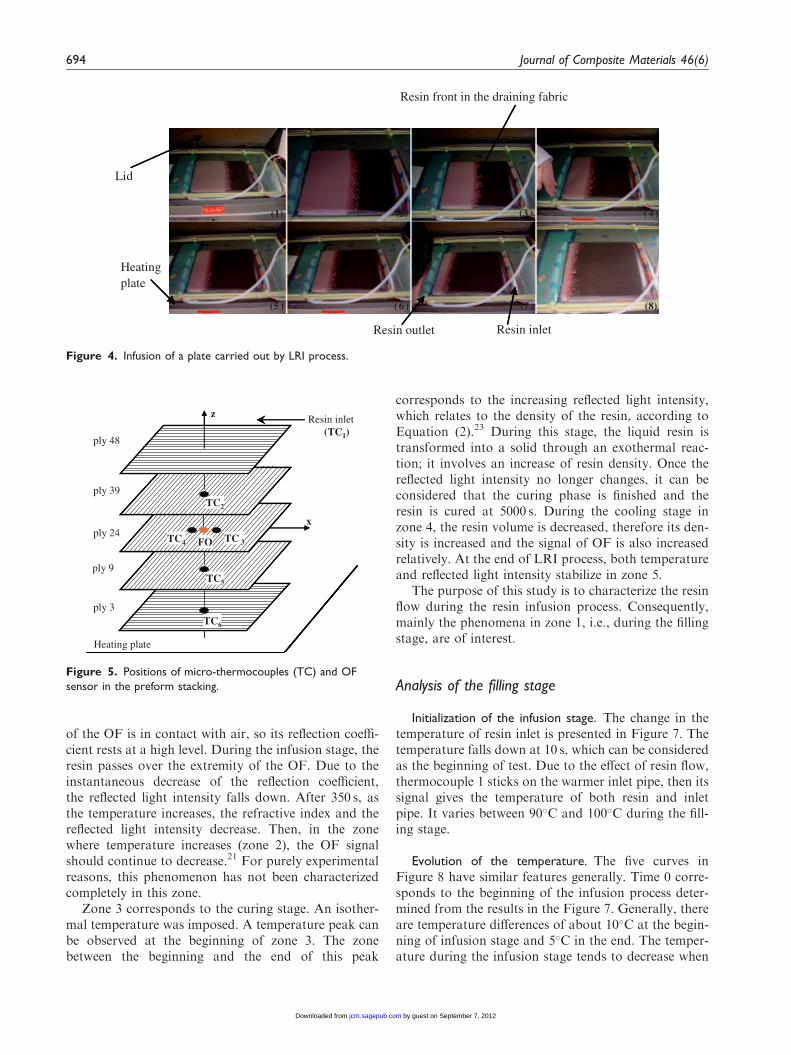
up of ‘UD fabric’ reference G1157 produced byHexcel Corp. These carbon fabrics are plain weavewith 96% of weight in the warp direction and 4% ofweight in the weft direction. The preform dimensionsare 335� 335� 20mm3. For the resin, the experimentalLRI tests have been performed using an epoxy resinRTM-6. Resin is preheated to 80�C in a heating cham-ber before infusion. A heating plate located below thesemi-rigid mold heats the whole infusion system. Theexternal pressure prescribed over the stacking is uni-form and equal to the local atmospheric pressure,induced by the vacuum ensured in the sealed system.Figure 4 shows this plate infusion test carried out byLRI process, the resin inlet and outlet are indicated inthis figure. The lid helps us to obtain a homogenoustemperature field during the filling and curing stage: inclassical tests, the filling temperature is 120�C andthe curing temperature is 180�C maintained for aperiod of 2 h.
For the purpose of detecting simultaneously the tem-perature variation of the preform and the refractiveindex of the resin, the test consists in infusing a thickplate instrumented with one OF sensor and six micro-thermocouples. All of the sensor positions are shown inFigure 5. Five micro-thermocouples are located acrossthe thickness of perform. Thermocouples 3, 4 and oneOF sensor are embedded at center of the mid-plan, with1 cm between each sensor. Thermocouple 1 is insertedin the inlet of the system for monitoring the tempera-ture of resin inlet.
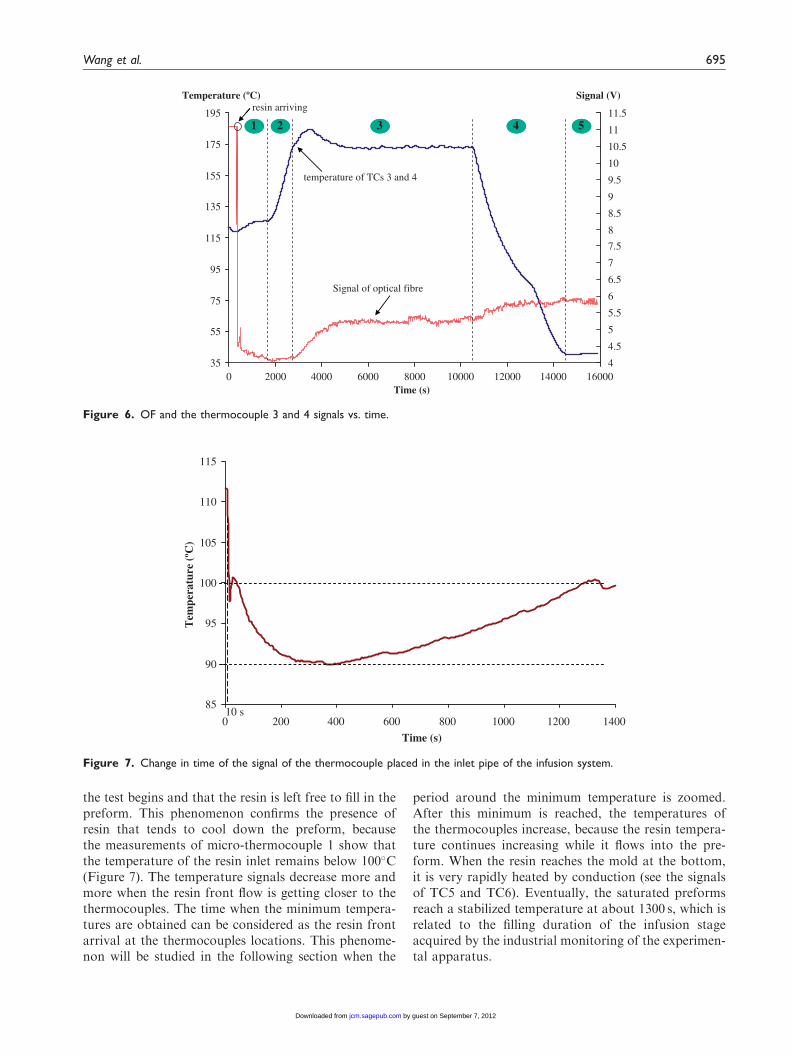
Results. Figure 6 gives the temperature and opticalsignal of the sensors located at the center of the mid-ply during the whole LRI process (the temperature evo-lution measured by thermocouple 3 merges exactly withthe one measured by thermocouple 4 in this figure).These signals can be split into five parts. First, theresin arrival time and the minimum temperature canbe observed at zone 1, which stands for the fillingstage. It can be observed that a sudden decrease inthe OF signal and a minimum temperature occur. Weinfer that at the beginning of the infusion, the extremity
Figure 3. Principle of the measurement system by using micro-thermocouples and Fresnel’s reflection with OF sensors.
Wang et al. 693
by guest on September 7, 2012jcm.sagepub.comDownloaded from
of the OF is in contact with air, so its reflection coeffi-cient rests at a high level. During the infusion stage, theresin passes over the extremity of the OF. Due to theinstantaneous decrease of the reflection coefficient,the reflected light intensity falls down. After 350 s, asthe temperature increases, the refractive index and thereflected light intensity decrease. Then, in the zonewhere temperature increases (zone 2), the OF signalshould continue to decrease.21 For purely experimentalreasons, this phenomenon has not been characterizedcompletely in this zone.
Zone 3 corresponds to the curing stage. An isother-mal temperature was imposed. A temperature peak canbe observed at the beginning of zone 3. The zonebetween the beginning and the end of this peak
corresponds to the increasing reflected light intensity,which relates to the density of the resin, according toEquation (2).23 During this stage, the liquid resin istransformed into a solid through an exothermal reac-tion; it involves an increase of resin density. Once thereflected light intensity no longer changes, it can beconsidered that the curing phase is finished and theresin is cured at 5000 s. During the cooling stage inzone 4, the resin volume is decreased, therefore its den-sity is increased and the signal of OF is also increasedrelatively. At the end of LRI process, both temperatureand reflected light intensity stabilize in zone 5.
The purpose of this study is to characterize the resinflow during the resin infusion process. Consequently,mainly the phenomena in zone 1, i.e., during the fillingstage, are of interest.
Analysis of the filling stage
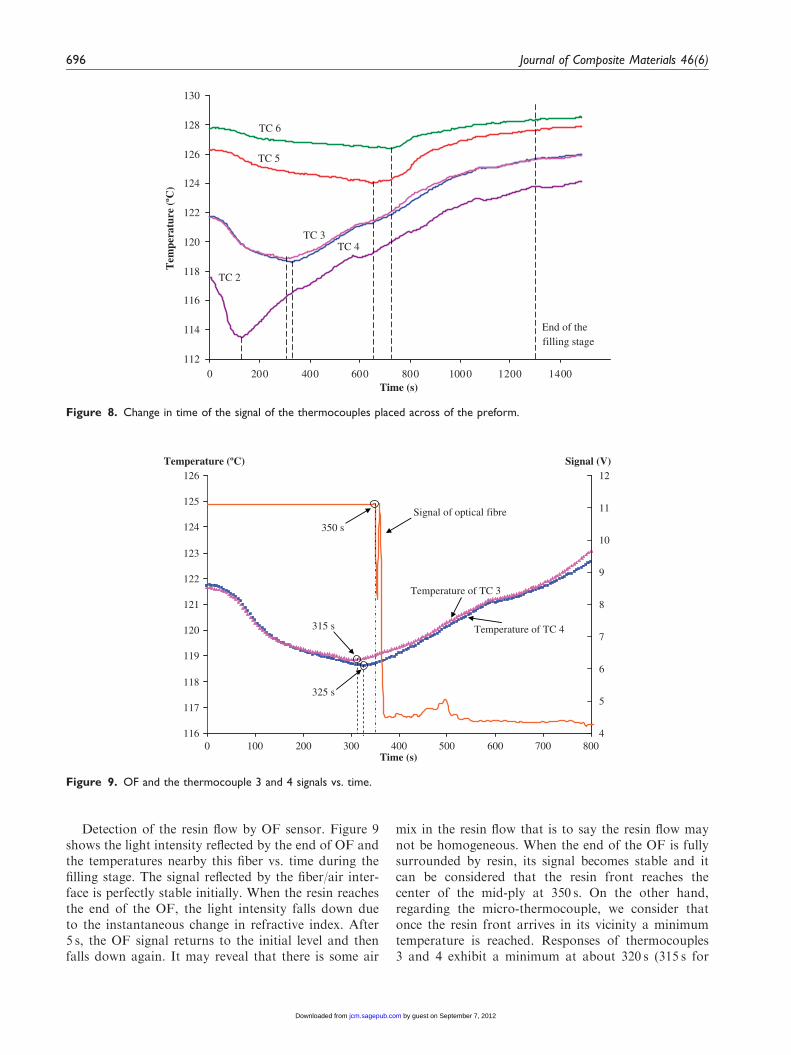
Initialization of the infusion stage. The change in thetemperature of resin inlet is presented in Figure 7. Thetemperature falls down at 10 s, which can be consideredas the beginning of test. Due to the effect of resin flow,thermocouple 1 sticks on the warmer inlet pipe, then itssignal gives the temperature of both resin and inletpipe. It varies between 90�C and 100�C during the fill-ing stage.
Evolution of the temperature. The five curves inFigure 8 have similar features generally. Time 0 corre-sponds to the beginning of the infusion process deter-mined from the results in the Figure 7. Generally, thereare temperature differences of about 10�C at the begin-ning of infusion stage and 5�C in the end. The temper-ature during the infusion stage tends to decrease when
Lid
Heatingplate
Resin front in the draining fabric
Resin inletResin outlet
(1) (2)
(5 ) (6) (7 )
(3 ) (4)
(8)
Figure 4. Infusion of a plate carried out by LRI process.
ply 9
ply 24
ply 48
ply 3
z
Heating plate
x
TC6
TC5
TC4
TC2
TC 3
ply 39
Resin inlet(TC1)
FO
Figure 5. Positions of micro-thermocouples (TC) and OF
sensor in the preform stacking.
694 Journal of Composite Materials 46(6)
by guest on September 7, 2012jcm.sagepub.comDownloaded from
the test begins and that the resin is left free to fill in thepreform. This phenomenon confirms the presence ofresin that tends to cool down the preform, becausethe measurements of micro-thermocouple 1 show thatthe temperature of the resin inlet remains below 100�C(Figure 7). The temperature signals decrease more andmore when the resin front flow is getting closer to thethermocouples. The time when the minimum tempera-tures are obtained can be considered as the resin frontarrival at the thermocouples locations. This phenome-non will be studied in the following section when the
period around the minimum temperature is zoomed.After this minimum is reached, the temperatures ofthe thermocouples increase, because the resin tempera-ture continues increasing while it flows into the pre-form. When the resin reaches the mold at the bottom,it is very rapidly heated by conduction (see the signalsof TC5 and TC6). Eventually, the saturated preformsreach a stabilized temperature at about 1300 s, which isrelated to the filling duration of the infusion stageacquired by the industrial monitoring of the experimen-tal apparatus.
35
55
75
95
115
135
155
175
195
0 2000 4000 6000 8000 10000 12000 14000 160004
4.5
5
5.5
6
6.5
7
7.5
8
8.5
9
9.5
10
10.5
11
11.5
Time (s)
)V( langiSTemperature (ºC)
temperature of TCs 3 and 4
Signal of optical fibre
resin arriving
1 3 4 52
Figure 6. OF and the thermocouple 3 and 4 signals vs. time.
85
90
95
100
105
110
115
0 200 400 600 800 1000 1200 1400
Time (s)
10 s
Tem
pera
ture
(ºC
)
Figure 7. Change in time of the signal of the thermocouple placed in the inlet pipe of the infusion system.
Wang et al. 695
by guest on September 7, 2012jcm.sagepub.comDownloaded from
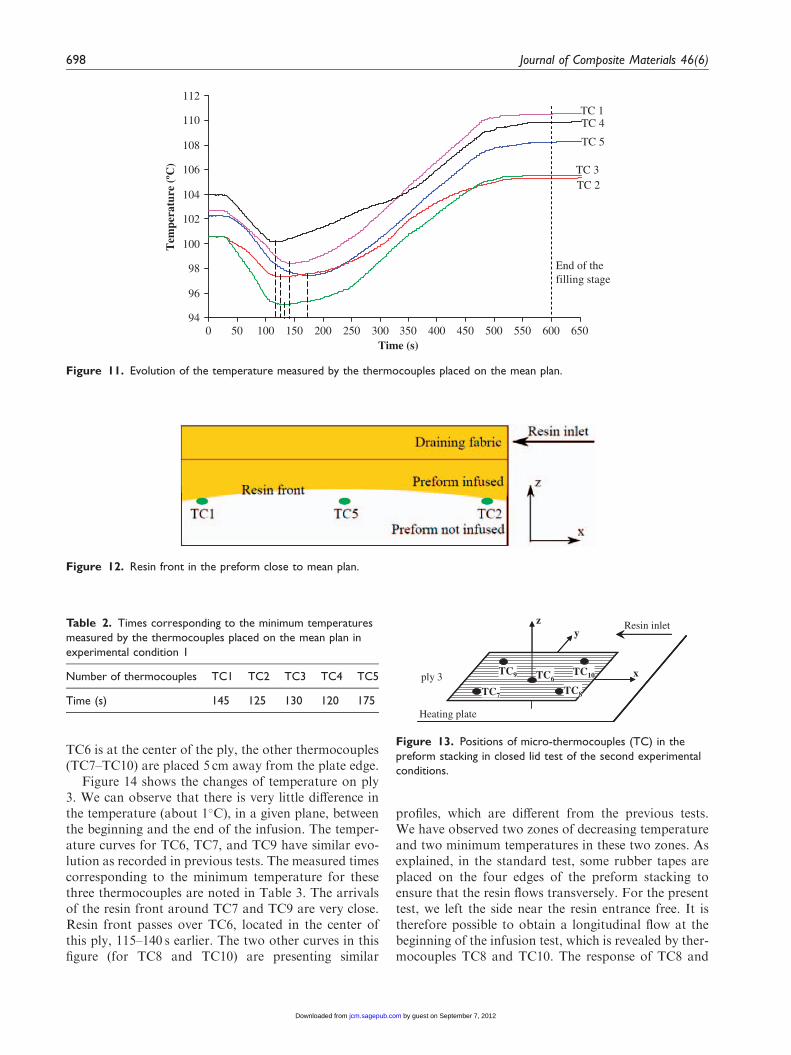
Detection of the resin flow by OF sensor. Figure 9shows the light intensity reflected by the end of OF andthe temperatures nearby this fiber vs. time during thefilling stage. The signal reflected by the fiber/air inter-face is perfectly stable initially. When the resin reachesthe end of the OF, the light intensity falls down dueto the instantaneous change in refractive index. After5 s, the OF signal returns to the initial level and thenfalls down again. It may reveal that there is some air
mix in the resin flow that is to say the resin flow maynot be homogeneous. When the end of the OF is fullysurrounded by resin, its signal becomes stable and itcan be considered that the resin front reaches thecenter of the mid-ply at 350 s. On the other hand,regarding the micro-thermocouple, we consider thatonce the resin front arrives in its vicinity a minimumtemperature is reached. Responses of thermocouples3 and 4 exhibit a minimum at about 320 s (315 s for
116
117
118
119
120
121
122
123
124
125
126
0 100 200 300 400 500 600 700 8004
5
6
7
8
9
10
11
12
Time (s)
)V(langiS)Cº(erutarepmeT
Temperature of TC 3
Temperature of TC 4
Signal of optical fibre
350 s
315 s
325 s
Figure 9. OF and the thermocouple 3 and 4 signals vs. time.
112
114
116
118
120
122
124
126
128
130
0 200 400 600 800 1000 1200 1400Time (s)
TC 2
TC 3TC 4
TC 5
TC 6
End of the filling stage
Tem
pera
ture
(ºC
)
Figure 8. Change in time of the signal of the thermocouples placed across of the preform.
696 Journal of Composite Materials 46(6)
by guest on September 7, 2012jcm.sagepub.comDownloaded from
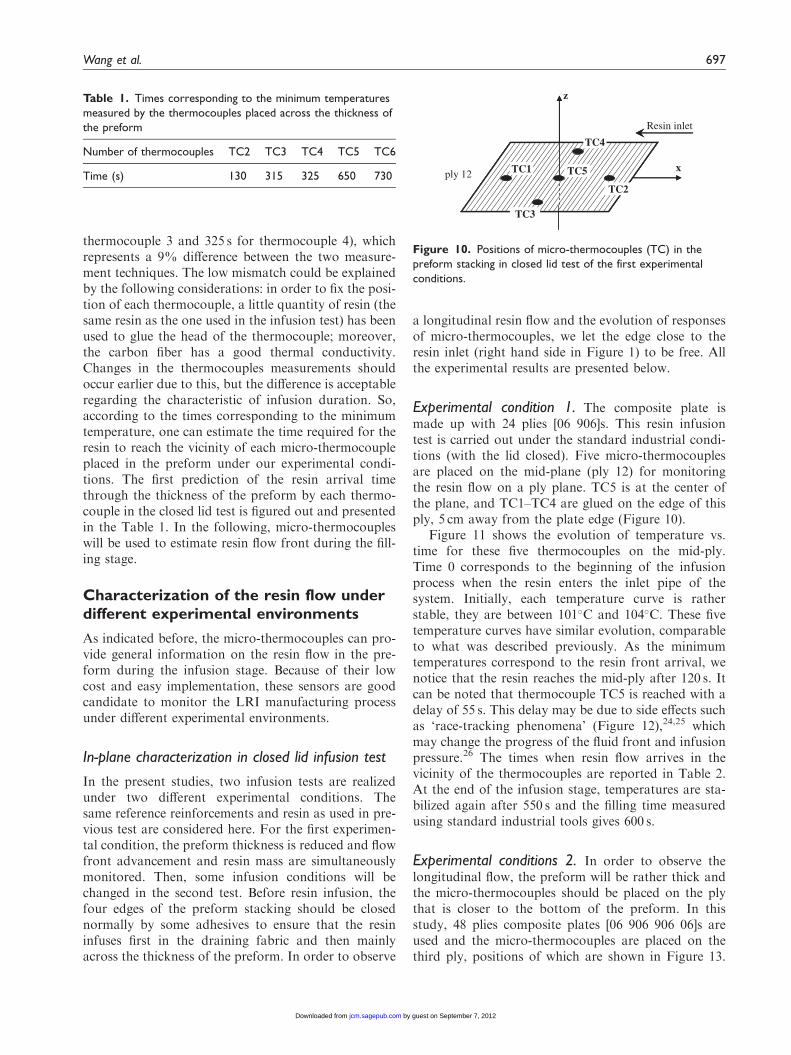
thermocouple 3 and 325 s for thermocouple 4), whichrepresents a 9% difference between the two measure-ment techniques. The low mismatch could be explainedby the following considerations: in order to fix the posi-tion of each thermocouple, a little quantity of resin (thesame resin as the one used in the infusion test) has beenused to glue the head of the thermocouple; moreover,the carbon fiber has a good thermal conductivity.Changes in the thermocouples measurements shouldoccur earlier due to this, but the difference is acceptableregarding the characteristic of infusion duration. So,according to the times corresponding to the minimumtemperature, one can estimate the time required for theresin to reach the vicinity of each micro-thermocoupleplaced in the preform under our experimental condi-tions. The first prediction of the resin arrival timethrough the thickness of the preform by each thermo-couple in the closed lid test is figured out and presentedin the Table 1. In the following, micro-thermocoupleswill be used to estimate resin flow front during the fill-ing stage.
Characterization of the resin flow underdifferent experimental environments
As indicated before, the micro-thermocouples can pro-vide general information on the resin flow in the pre-form during the infusion stage. Because of their lowcost and easy implementation, these sensors are goodcandidate to monitor the LRI manufacturing processunder different experimental environments.
In-plane characterization in closed lid infusion test
In the present studies, two infusion tests are realizedunder two different experimental conditions. Thesame reference reinforcements and resin as used in pre-vious test are considered here. For the first experimen-tal condition, the preform thickness is reduced and flowfront advancement and resin mass are simultaneouslymonitored. Then, some infusion conditions will bechanged in the second test. Before resin infusion, thefour edges of the preform stacking should be closednormally by some adhesives to ensure that the resininfuses first in the draining fabric and then mainlyacross the thickness of the preform. In order to observe
a longitudinal resin flow and the evolution of responsesof micro-thermocouples, we let the edge close to theresin inlet (right hand side in Figure 1) to be free. Allthe experimental results are presented below.
Experimental condition 1. The composite plate ismade up with 24 plies [06 906]s. This resin infusiontest is carried out under the standard industrial condi-tions (with the lid closed). Five micro-thermocouplesare placed on the mid-plane (ply 12) for monitoringthe resin flow on a ply plane. TC5 is at the center ofthe plane, and TC1–TC4 are glued on the edge of thisply, 5 cm away from the plate edge (Figure 10).
Figure 11 shows the evolution of temperature vs.time for these five thermocouples on the mid-ply.Time 0 corresponds to the beginning of the infusionprocess when the resin enters the inlet pipe of thesystem. Initially, each temperature curve is ratherstable, they are between 101�C and 104�C. These fivetemperature curves have similar evolution, comparableto what was described previously. As the minimumtemperatures correspond to the resin front arrival, wenotice that the resin reaches the mid-ply after 120 s. Itcan be noted that thermocouple TC5 is reached with adelay of 55 s. This delay may be due to side effects suchas ‘race-tracking phenomena’ (Figure 12),24,25 whichmay change the progress of the fluid front and infusionpressure.26 The times when resin flow arrives in thevicinity of the thermocouples are reported in Table 2.At the end of the infusion stage, temperatures are sta-bilized again after 550 s and the filling time measuredusing standard industrial tools gives 600 s.
Experimental conditions 2. In order to observe thelongitudinal flow, the preform will be rather thick andthe micro-thermocouples should be placed on the plythat is closer to the bottom of the preform. In thisstudy, 48 plies composite plates [06 906 906 06]s areused and the micro-thermocouples are placed on thethird ply, positions of which are shown in Figure 13.
z
x
TC2
TC1
TC4
TC3
TC5ply 12
Resin inlet
Figure 10. Positions of micro-thermocouples (TC) in the
preform stacking in closed lid test of the first experimental
conditions.
Table 1. Times corresponding to the minimum temperatures
measured by the thermocouples placed across the thickness of
the preform
Number of thermocouples TC2 TC3 TC4 TC5 TC6
Time (s) 130 315 325 650 730
Wang et al. 697
by guest on September 7, 2012jcm.sagepub.comDownloaded from
TC6 is at the center of the ply, the other thermocouples(TC7–TC10) are placed 5 cm away from the plate edge.
Figure 14 shows the changes of temperature on ply3. We can observe that there is very little difference inthe temperature (about 1�C), in a given plane, betweenthe beginning and the end of the infusion. The temper-ature curves for TC6, TC7, and TC9 have similar evo-lution as recorded in previous tests. The measured timescorresponding to the minimum temperature for thesethree thermocouples are noted in Table 3. The arrivalsof the resin front around TC7 and TC9 are very close.Resin front passes over TC6, located in the center ofthis ply, 115–140 s earlier. The two other curves in thisfigure (for TC8 and TC10) are presenting similar
profiles, which are different from the previous tests.We have observed two zones of decreasing temperatureand two minimum temperatures in these two zones. Asexplained, in the standard test, some rubber tapes areplaced on the four edges of the preform stacking toensure that the resin flows transversely. For the presenttest, we left the side near the resin entrance free. It istherefore possible to obtain a longitudinal flow at thebeginning of the infusion test, which is revealed by ther-mocouples TC8 and TC10. The response of TC8 and
94
96
98
100
102
104
106
108
110
112
0 50 100 150 200 250 300 350 400 450 500 550 600 650
TC 2
TC 4TC 1
TC 5
TC 3
Time (s)
End of the filling stage
Tem
pera
ture
(ºC
)
Figure 11. Evolution of the temperature measured by the thermocouples placed on the mean plan.
Figure 12. Resin front in the preform close to mean plan.
ply 3
z
Heating plate
xTC6
Resin inlet
TC9
TC7
TC10
TC8
y
Figure 13. Positions of micro-thermocouples (TC) in the
preform stacking in closed lid test of the second experimental
conditions.
Table 2. Times corresponding to the minimum temperatures
measured by the thermocouples placed on the mean plan in
experimental condition 1
Number of thermocouples TC1 TC2 TC3 TC4 TC5
Time (s) 145 125 130 120 175
698 Journal of Composite Materials 46(6)
by guest on September 7, 2012jcm.sagepub.comDownloaded from
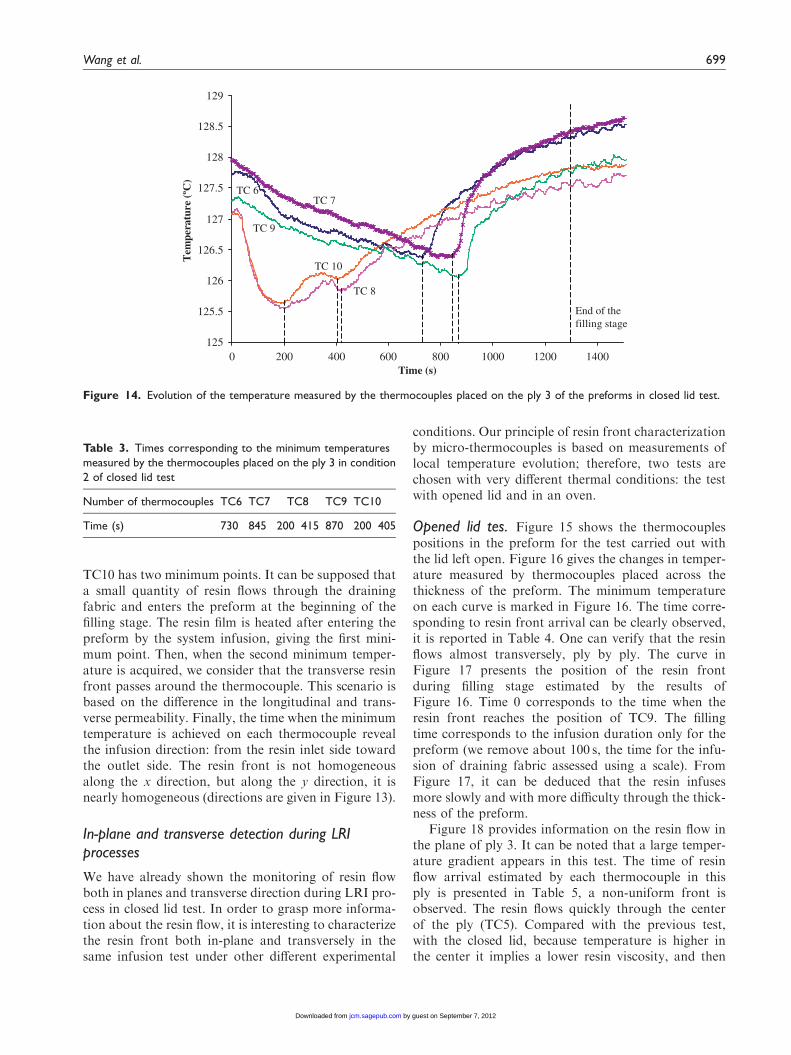
TC10 has two minimum points. It can be supposed thata small quantity of resin flows through the drainingfabric and enters the preform at the beginning of thefilling stage. The resin film is heated after entering thepreform by the system infusion, giving the first mini-mum point. Then, when the second minimum temper-ature is acquired, we consider that the transverse resinfront passes around the thermocouple. This scenario isbased on the difference in the longitudinal and trans-verse permeability. Finally, the time when the minimumtemperature is achieved on each thermocouple revealthe infusion direction: from the resin inlet side towardthe outlet side. The resin front is not homogeneousalong the x direction, but along the y direction, it isnearly homogeneous (directions are given in Figure 13).
In-plane and transverse detection during LRIprocesses
We have already shown the monitoring of resin flowboth in planes and transverse direction during LRI pro-cess in closed lid test. In order to grasp more informa-tion about the resin flow, it is interesting to characterizethe resin front both in-plane and transversely in thesame infusion test under other different experimental
conditions. Our principle of resin front characterizationby micro-thermocouples is based on measurements oflocal temperature evolution; therefore, two tests arechosen with very different thermal conditions: the testwith opened lid and in an oven.
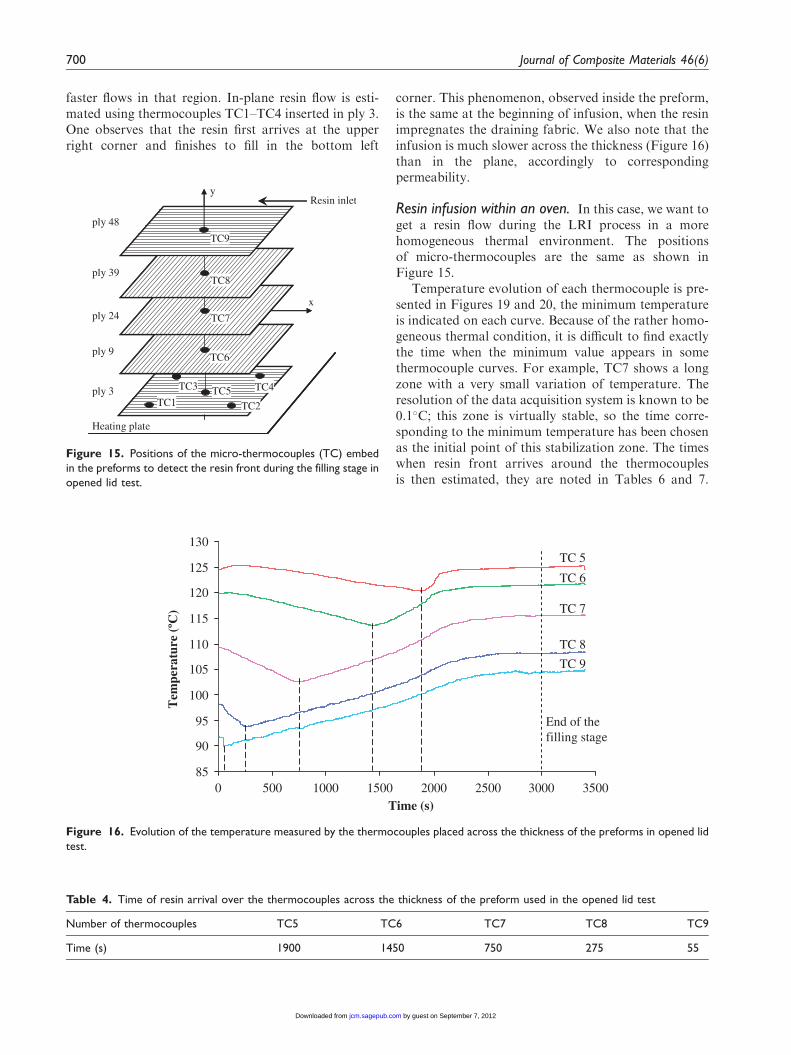
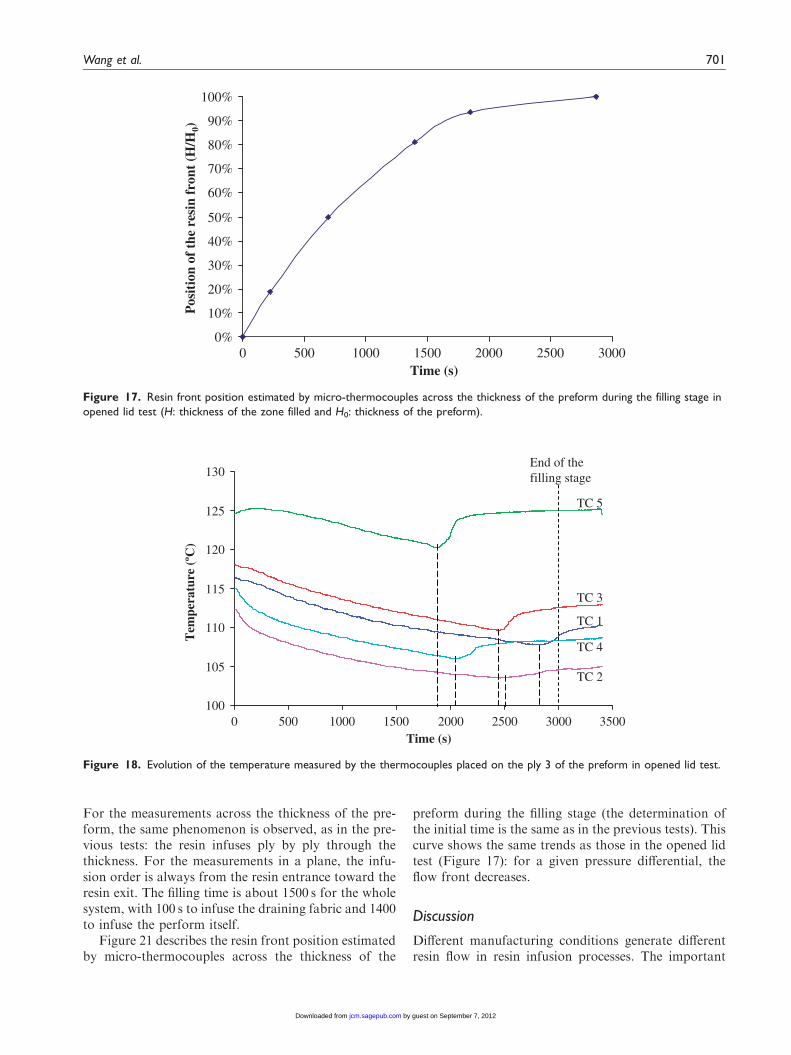
Opened lid tes. Figure 15 shows the thermocouplespositions in the preform for the test carried out withthe lid left open. Figure 16 gives the changes in temper-ature measured by thermocouples placed across thethickness of the preform. The minimum temperatureon each curve is marked in Figure 16. The time corre-sponding to resin front arrival can be clearly observed,it is reported in Table 4. One can verify that the resinflows almost transversely, ply by ply. The curve inFigure 17 presents the position of the resin frontduring filling stage estimated by the results ofFigure 16. Time 0 corresponds to the time when theresin front reaches the position of TC9. The fillingtime corresponds to the infusion duration only for thepreform (we remove about 100 s, the time for the infu-sion of draining fabric assessed using a scale). FromFigure 17, it can be deduced that the resin infusesmore slowly and with more difficulty through the thick-ness of the preform.
Figure 18 provides information on the resin flow inthe plane of ply 3. It can be noted that a large temper-ature gradient appears in this test. The time of resinflow arrival estimated by each thermocouple in thisply is presented in Table 5, a non-uniform front isobserved. The resin flows quickly through the centerof the ply (TC5). Compared with the previous test,with the closed lid, because temperature is higher inthe center it implies a lower resin viscosity, and then
125
125.5
126
126.5
127
127.5
128
128.5
129
0 200 400 600 800 1000 1200 1400Time (s)
TC 8
TC 9
TC 10
TC 6TC 7
End of the filling stage
Tem
pera
ture
(ºC
)
Figure 14. Evolution of the temperature measured by the thermocouples placed on the ply 3 of the preforms in closed lid test.
Table 3. Times corresponding to the minimum temperatures
measured by the thermocouples placed on the ply 3 in condition
2 of closed lid test
Number of thermocouples TC6 TC7 TC8 TC9 TC10
Time (s) 730 845 200 415 870 200 405
Wang et al. 699
by guest on September 7, 2012jcm.sagepub.comDownloaded from
faster flows in that region. In-plane resin flow is esti-mated using thermocouples TC1–TC4 inserted in ply 3.One observes that the resin first arrives at the upperright corner and finishes to fill in the bottom left
corner. This phenomenon, observed inside the preform,is the same at the beginning of infusion, when the resinimpregnates the draining fabric. We also note that theinfusion is much slower across the thickness (Figure 16)than in the plane, accordingly to correspondingpermeability.
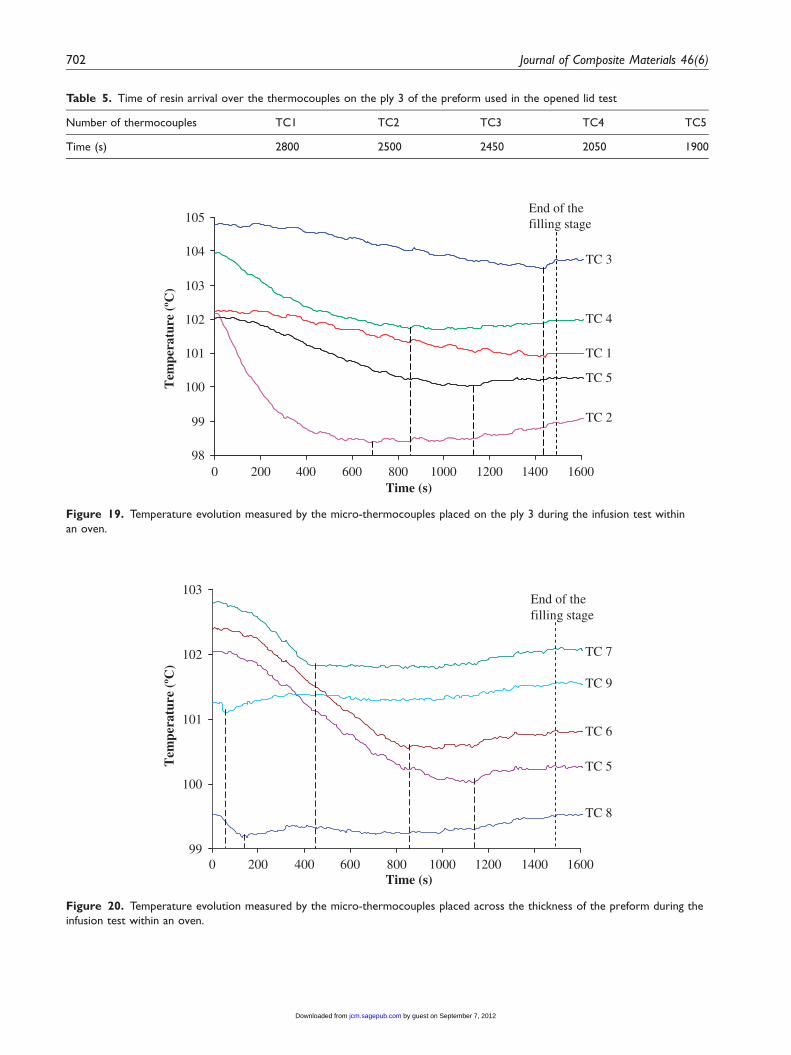
Resin infusion within an oven. In this case, we want toget a resin flow during the LRI process in a morehomogeneous thermal environment. The positionsof micro-thermocouples are the same as shown inFigure 15.
Temperature evolution of each thermocouple is pre-sented in Figures 19 and 20, the minimum temperatureis indicated on each curve. Because of the rather homo-geneous thermal condition, it is difficult to find exactlythe time when the minimum value appears in somethermocouple curves. For example, TC7 shows a longzone with a very small variation of temperature. Theresolution of the data acquisition system is known to be0.1�C; this zone is virtually stable, so the time corre-sponding to the minimum temperature has been chosenas the initial point of this stabilization zone. The timeswhen resin front arrives around the thermocouplesis then estimated, they are noted in Tables 6 and 7.
85
90
95
100
105
110
115
120
125
130
0 500 1000 1500 2000 2500 3000 3500
Tem
pera
ture
(ºC
)
Time (s)
TC 9
TC 8
TC 7
TC 5
TC 6
End of the filling stage
Figure 16. Evolution of the temperature measured by the thermocouples placed across the thickness of the preforms in opened lid
test.
ply 9
ply 24
ply 48
ply 3
y
Heating plate
x
TC5TC3
TC1
TC4
TC2
TC6
TC7
TC8
TC9
ply 39
Resin inlet
Figure 15. Positions of the micro-thermocouples (TC) embed
in the preforms to detect the resin front during the filling stage in
opened lid test.
Table 4. Time of resin arrival over the thermocouples across the thickness of the preform used in the opened lid test
Number of thermocouples TC5 TC6 TC7 TC8 TC9
Time (s) 1900 1450 750 275 55
700 Journal of Composite Materials 46(6)
by guest on September 7, 2012jcm.sagepub.comDownloaded from
For the measurements across the thickness of the pre-form, the same phenomenon is observed, as in the pre-vious tests: the resin infuses ply by ply through thethickness. For the measurements in a plane, the infu-sion order is always from the resin entrance toward theresin exit. The filling time is about 1500 s for the wholesystem, with 100 s to infuse the draining fabric and 1400to infuse the perform itself.
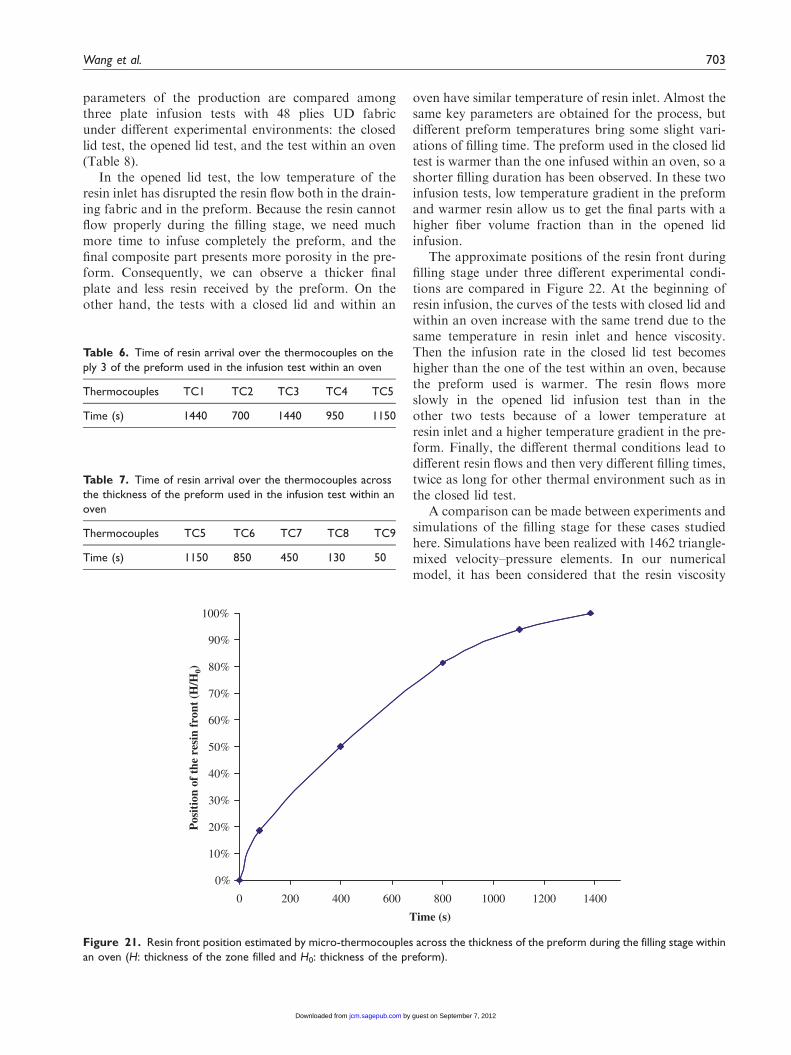
Figure 21 describes the resin front position estimatedby micro-thermocouples across the thickness of the
preform during the filling stage (the determination ofthe initial time is the same as in the previous tests). Thiscurve shows the same trends as those in the opened lidtest (Figure 17): for a given pressure differential, theflow front decreases.
Discussion
Different manufacturing conditions generate differentresin flow in resin infusion processes. The important
0%
10%
20%
30%
40%
50%
60%
70%
80%
90%
100%
0 500 1000 1500 2000 2500 3000
Pos
itio
n of
the
res
infr
ont
(H/H
0)
Time (s)
Figure 17. Resin front position estimated by micro-thermocouples across the thickness of the preform during the filling stage in
opened lid test (H: thickness of the zone filled and H0: thickness of the preform).
100
105
110
115
120
125
130
0 500 1000 1500 2000 2500 3000 3500Time (s)
TC 2
TC 4
TC 1
TC 5
TC 3
End of the filling stage
Tem
pera
ture
(ºC
)
Figure 18. Evolution of the temperature measured by the thermocouples placed on the ply 3 of the preform in opened lid test.
Wang et al. 701
by guest on September 7, 2012jcm.sagepub.comDownloaded from
99
100
101
102
103
0 200 400 600 800 1000 1200 1400 1600Time (s)
TC 9
TC 8
TC 7
TC 5
TC 6
End of the filling stage
Tem
pera
ture
(ºC
)
Figure 20. Temperature evolution measured by the micro-thermocouples placed across the thickness of the preform during the
infusion test within an oven.
98
99
100
101
102
103
104
105
0 200 400 600 800 1000 1200 1400 1600Time (s)
TC 2
TC 4
TC 1
TC 5
TC 3
End of the filling stage
Tem
pera
ture
(ºC
)
Figure 19. Temperature evolution measured by the micro-thermocouples placed on the ply 3 during the infusion test within
an oven.
Table 5. Time of resin arrival over the thermocouples on the ply 3 of the preform used in the opened lid test
Number of thermocouples TC1 TC2 TC3 TC4 TC5
Time (s) 2800 2500 2450 2050 1900
702 Journal of Composite Materials 46(6)
by guest on September 7, 2012jcm.sagepub.comDownloaded from
parameters of the production are compared amongthree plate infusion tests with 48 plies UD fabricunder different experimental environments: the closedlid test, the opened lid test, and the test within an oven(Table 8).
In the opened lid test, the low temperature of theresin inlet has disrupted the resin flow both in the drain-ing fabric and in the preform. Because the resin cannotflow properly during the filling stage, we need muchmore time to infuse completely the preform, and thefinal composite part presents more porosity in the pre-form. Consequently, we can observe a thicker finalplate and less resin received by the preform. On theother hand, the tests with a closed lid and within an
oven have similar temperature of resin inlet. Almost thesame key parameters are obtained for the process, butdifferent preform temperatures bring some slight vari-ations of filling time. The preform used in the closed lidtest is warmer than the one infused within an oven, so ashorter filling duration has been observed. In these twoinfusion tests, low temperature gradient in the preformand warmer resin allow us to get the final parts with ahigher fiber volume fraction than in the opened lidinfusion.
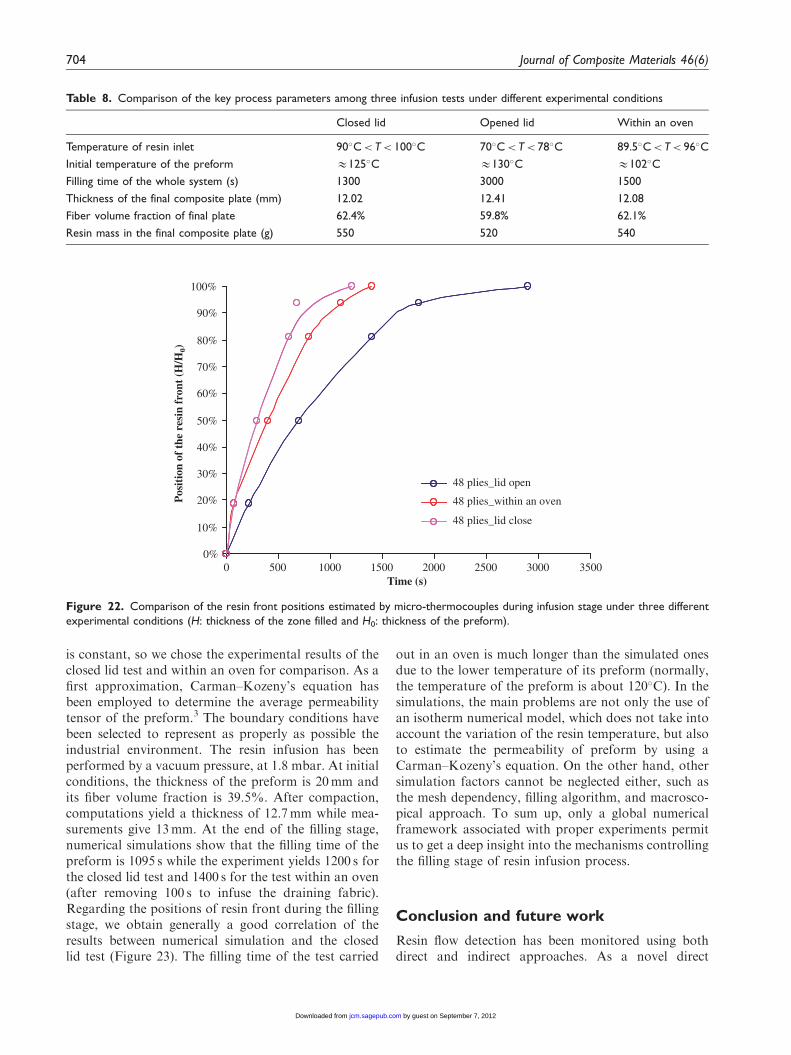
The approximate positions of the resin front duringfilling stage under three different experimental condi-tions are compared in Figure 22. At the beginning ofresin infusion, the curves of the tests with closed lid andwithin an oven increase with the same trend due to thesame temperature in resin inlet and hence viscosity.Then the infusion rate in the closed lid test becomeshigher than the one of the test within an oven, becausethe preform used is warmer. The resin flows moreslowly in the opened lid infusion test than in theother two tests because of a lower temperature atresin inlet and a higher temperature gradient in the pre-form. Finally, the different thermal conditions lead todifferent resin flows and then very different filling times,twice as long for other thermal environment such as inthe closed lid test.
A comparison can be made between experiments andsimulations of the filling stage for these cases studiedhere. Simulations have been realized with 1462 triangle-mixed velocity–pressure elements. In our numericalmodel, it has been considered that the resin viscosity
Table 6. Time of resin arrival over the thermocouples on the
ply 3 of the preform used in the infusion test within an oven
Thermocouples TC1 TC2 TC3 TC4 TC5
Time (s) 1440 700 1440 950 1150
Table 7. Time of resin arrival over the thermocouples across
the thickness of the preform used in the infusion test within an
oven
Thermocouples TC5 TC6 TC7 TC8 TC9
Time (s) 1150 850 450 130 50
0%
10%
20%
30%
40%
50%
60%
70%
80%
90%
100%
0 200 400 600 800 1000 1200 1400
Time (s)
Pos
itio
n of
the
res
infr
ont
(H/H
0)
Figure 21. Resin front position estimated by micro-thermocouples across the thickness of the preform during the filling stage within
an oven (H: thickness of the zone filled and H0: thickness of the preform).
Wang et al. 703
by guest on September 7, 2012jcm.sagepub.comDownloaded from
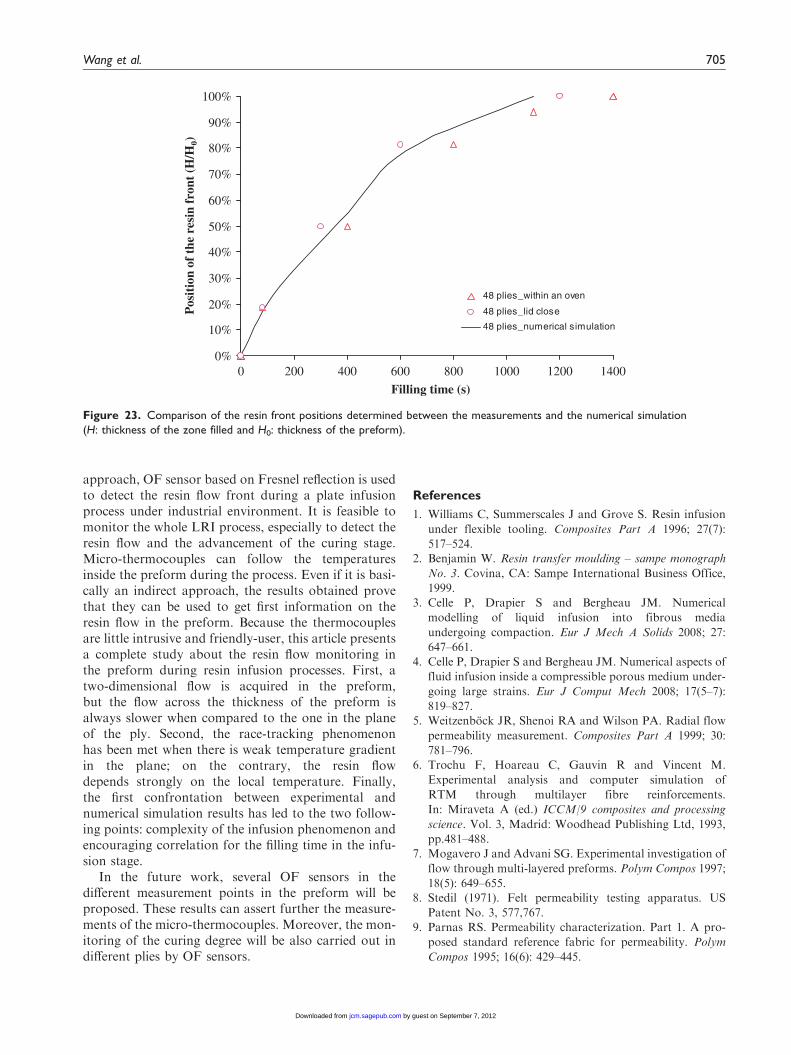
is constant, so we chose the experimental results of theclosed lid test and within an oven for comparison. As afirst approximation, Carman–Kozeny’s equation hasbeen employed to determine the average permeabilitytensor of the preform.3 The boundary conditions havebeen selected to represent as properly as possible theindustrial environment. The resin infusion has beenperformed by a vacuum pressure, at 1.8 mbar. At initialconditions, the thickness of the preform is 20mm andits fiber volume fraction is 39.5%. After compaction,computations yield a thickness of 12.7mm while mea-surements give 13mm. At the end of the filling stage,numerical simulations show that the filling time of thepreform is 1095 s while the experiment yields 1200 s forthe closed lid test and 1400 s for the test within an oven(after removing 100 s to infuse the draining fabric).Regarding the positions of resin front during the fillingstage, we obtain generally a good correlation of theresults between numerical simulation and the closedlid test (Figure 23). The filling time of the test carried
out in an oven is much longer than the simulated onesdue to the lower temperature of its preform (normally,the temperature of the preform is about 120�C). In thesimulations, the main problems are not only the use ofan isotherm numerical model, which does not take intoaccount the variation of the resin temperature, but alsoto estimate the permeability of preform by using aCarman–Kozeny’s equation. On the other hand, othersimulation factors cannot be neglected either, such asthe mesh dependency, filling algorithm, and macrosco-pical approach. To sum up, only a global numericalframework associated with proper experiments permitus to get a deep insight into the mechanisms controllingthe filling stage of resin infusion process.
Conclusion and future work
Resin flow detection has been monitored using bothdirect and indirect approaches. As a novel direct
Table 8. Comparison of the key process parameters among three infusion tests under different experimental conditions
Closed lid Opened lid Within an oven
Temperature of resin inlet 90�C< T< 100�C 70�C< T< 78�C 89.5�C< T< 96�C
Initial temperature of the preform &125�C &130�C &102�C
Filling time of the whole system (s) 1300 3000 1500
Thickness of the final composite plate (mm) 12.02 12.41 12.08
Fiber volume fraction of final plate 62.4% 59.8% 62.1%
Resin mass in the final composite plate (g) 550 520 540
0%
10%
20%
30%
40%
50%
60%
70%
80%
90%
100%
0 500 1000 1500 2000 2500 3000 3500
48 plies_lid open
48 plies_within an oven
48 plies_lid close
Time (s)
Pos
itio
n of
the
res
infr
ont
(H/H
0)
Figure 22. Comparison of the resin front positions estimated by micro-thermocouples during infusion stage under three different
experimental conditions (H: thickness of the zone filled and H0: thickness of the preform).
704 Journal of Composite Materials 46(6)
by guest on September 7, 2012jcm.sagepub.comDownloaded from
approach, OF sensor based on Fresnel reflection is usedto detect the resin flow front during a plate infusionprocess under industrial environment. It is feasible tomonitor the whole LRI process, especially to detect theresin flow and the advancement of the curing stage.Micro-thermocouples can follow the temperaturesinside the preform during the process. Even if it is basi-cally an indirect approach, the results obtained provethat they can be used to get first information on theresin flow in the preform. Because the thermocouplesare little intrusive and friendly-user, this article presentsa complete study about the resin flow monitoring inthe preform during resin infusion processes. First, atwo-dimensional flow is acquired in the preform,but the flow across the thickness of the preform isalways slower when compared to the one in the planeof the ply. Second, the race-tracking phenomenonhas been met when there is weak temperature gradientin the plane; on the contrary, the resin flowdepends strongly on the local temperature. Finally,the first confrontation between experimental andnumerical simulation results has led to the two follow-ing points: complexity of the infusion phenomenon andencouraging correlation for the filling time in the infu-sion stage.
In the future work, several OF sensors in thedifferent measurement points in the preform will beproposed. These results can assert further the measure-ments of the micro-thermocouples. Moreover, the mon-itoring of the curing degree will be also carried out indifferent plies by OF sensors.
References
1. Williams C, Summerscales J and Grove S. Resin infusion
under flexible tooling. Composites Part A 1996; 27(7):
517–524.2. Benjamin W. Resin transfer moulding – sampe monograph
No. 3. Covina, CA: Sampe International Business Office,
1999.
3. Celle P, Drapier S and Bergheau JM. Numerical
modelling of liquid infusion into fibrous media
undergoing compaction. Eur J Mech A Solids 2008; 27:
647–661.
4. Celle P, Drapier S and Bergheau JM. Numerical aspects of
fluid infusion inside a compressible porous medium under-
going large strains. Eur J Comput Mech 2008; 17(5–7):
819–827.5. Weitzenbock JR, Shenoi RA and Wilson PA. Radial flow
permeability measurement. Composites Part A 1999; 30:
781–796.
6. Trochu F, Hoareau C, Gauvin R and Vincent M.
Experimental analysis and computer simulation of
RTM through multilayer fibre reinforcements.
In: Miraveta A (ed.) ICCM/9 composites and processing
science. Vol. 3, Madrid: Woodhead Publishing Ltd, 1993,
pp.481–488.
7. Mogavero J and Advani SG. Experimental investigation of
flow through multi-layered preforms. Polym Compos 1997;
18(5): 649–655.8. Stedil (1971). Felt permeability testing apparatus. US
Patent No. 3, 577,767.
9. Parnas RS. Permeability characterization. Part 1. A pro-
posed standard reference fabric for permeability. Polym
Compos 1995; 16(6): 429–445.
0%
10%
20%
30%
40%
50%
60%
70%
80%
90%
100%
0 200 400 600 800 1000 1200 1400
48 plies_within an oven
48 plies_lid close
48 plies_numerical simulation
Filling time (s)
Pos
itio
n of
the
res
infr
ont
(H/H
0)
Figure 23. Comparison of the resin front positions determined between the measurements and the numerical simulation
(H: thickness of the zone filled and H0: thickness of the preform).
Wang et al. 705
by guest on September 7, 2012jcm.sagepub.comDownloaded from
10. Han KK, Lee CM and Rice BP. Measurements of thepermeability of fiber preforms and applications.Compos Sci Technol 2000; 60: 2435–2441.
11. Walsh SW (1993). In-situ sensor method and device. USPatent No. 5, 210,499.
12. Lim ST and Lee WI. An analysis of the three-dimensionalresin-transfer mold filling process. Compos Sci Technol
2000; 60: 961–975.13. Kissinger C, Mitschang P and Neitzel M. 3-Dimensional
fluid propagation in RTM-processing. In: Crivelli
Visconti I (ed.) Advancing with composites 2000. Milan:Verlag, 2000, pp.93–98.
14. Antonucci V, Giordano M, Nicolais L, Calabro A,
Cusano A, Cutolo A, et al. Resin flow monitoring inresin film infusion process. J Mater Process Technol2003; 143–144: 687–692.
15. Wang P, Drapier S, Molimard J, Vautrin A and MinniJC. Characterization of Liquid Resin Infusion (LRI) fill-ing by fringe pattern projection and in-situ thermocou-ples. Composites Part A 2010; 41: 36–44.
16. Duan YX, Tan ZY, Zhao Y and Sun J. Compressionresponses of preform in vacuum infusion process. ChinJ Aeronaut 2008; 21: 370–377.
17. YenilmezB, SenanMandMurat SozerE.Variationof partthickness and compaction pressure in vacuum infusionprocess. Compos Sci Technol 2009; 69(11–12): 1710–1719.
18. Stoven T, Weyrauch F, Mitschang P and Neitzel M.Continuous monitoring of three-dimensional resin flowthrough a fibre preform. Composites Part A 2003; 34:475–480.
19. Govignon Q, Bickerton S, Morris J and Kelly PA. Fullfield monitoring of the resin flow and laminate propertiesduring the resin infusion process. Composites Part A
2008; 39: 1412–1426.20. Drapier S, Molimard J, Vautrin A and Henrat P.
Characterisation of the perform thickness variationduring the infusion-based manufacturing processes
using fringe projection. In: 9th International Conferenceon Flow Processes in Composite Materials, Montreal(FPCM-9), Quebec, Canada, 2008.
21. Vacher S, Molimard J, Gagnaire H and Vautrin A. AFresnel’s reflection optical fiber sensor for thermosetpolymer cure monitoring. Polym Polym Compos 2004;
12(4): 269–276.22. Vacher S, Molimard J, Vautrin A, Gagnaire H and
Henrat P. Monitoring of resin infusion process by embed-
ded optical fibres. 12th European Conference onComposite Materials (ECCM 12). Biarritz: France, 2006.
23. Liu YM, Ganesh C, Steele JP and Jones JE. Fiber opticsensor development for real-time in-situ epoxy cure mon-
itoring. J Compos Mater 1997; 31(1): 87–102.24. Bickerton S and Advani SG. Characterization and
modelling of race-tracking in liquid composite molding
processes. Compos Sci Technol 1999; 59: 2215–2229.25. Advani SG and Sozer EM. Liquid molding of thermoset
composites. Comprehensive composite materials. Chapter
2.23, 2003, pp.807–844.26. Lawrence JM, Barr J, Karmakar R and Advani SG.
Characterization of preform permeability in the presenceof race tracking. Composites Part A 2004; 35: 1393–1405.
706 Journal of Composite Materials 46(6)
by guest on September 7, 2012jcm.sagepub.comDownloaded from