Population Modeling of Filgrastim PK-PD in Healthy Adults Following Intravenous and Subcutaneous...
13
http://jcp.sagepub.com/ Pharmacology The Journal of Clinical http://jcp.sagepub.com/content/50/9_suppl/101S The online version of this article can be found at: DOI: 10.1177/0091270010376966 2010 50: 101S J Clin Pharmacol Wojciech Krzyzanski, Pawel Wiczling, Phil Lowe, Etienne Pigeolet, Martin Fink, Alexander Berghout and Sigrid Balser Administrations Population Modeling of Filgrastim PK-PD in Healthy Adults Following Intravenous and Subcutaneous Published by: http://www.sagepublications.com On behalf of: American College of Clinical Pharmacology can be found at: The Journal of Clinical Pharmacology Additional services and information for http://jcp.sagepub.com/cgi/alerts Email Alerts: http://jcp.sagepub.com/subscriptions Subscriptions: http://www.sagepub.com/journalsReprints.nav Reprints: http://www.sagepub.com/journalsPermissions.nav Permissions: at National Institutes of Health Library on November 19, 2010 jcp.sagepub.com Downloaded from
-
Upload
independent -
Category
Documents
-
view
0 -
download
0
Transcript of Population Modeling of Filgrastim PK-PD in Healthy Adults Following Intravenous and Subcutaneous...
http://jcp.sagepub.com/
PharmacologyThe Journal of Clinical
http://jcp.sagepub.com/content/50/9_suppl/101SThe online version of this article can be found at:
DOI: 10.1177/0091270010376966
2010 50: 101SJ Clin PharmacolWojciech Krzyzanski, Pawel Wiczling, Phil Lowe, Etienne Pigeolet, Martin Fink, Alexander Berghout and Sigrid Balser
AdministrationsPopulation Modeling of Filgrastim PK-PD in Healthy Adults Following Intravenous and Subcutaneous
Published by:
http://www.sagepublications.com
On behalf of:
American College of Clinical Pharmacology
can be found at:The Journal of Clinical PharmacologyAdditional services and information for
http://jcp.sagepub.com/cgi/alertsEmail Alerts:
http://jcp.sagepub.com/subscriptionsSubscriptions:
http://www.sagepub.com/journalsReprints.navReprints:
http://www.sagepub.com/journalsPermissions.navPermissions:
at National Institutes of Health Library on November 19, 2010jcp.sagepub.comDownloaded from

J Clin Pharmacol xxxx;xx:x-x 101J Clin Pharmacol 2010;50:101S-112S 101S
Filgrastim is a recombinant methionyl form of human granulocyte-colony stimulating factor
(r-metHuG-CSF) derived from Escherichia coli. It con-sists of 175 amino acids and has a molecular weight of 18 800 daltons. The biological activity of filgrastim is identical to the endogenous G-CSF, which controls neutrophil production within the bone marrow by stimulating activation, proliferation, differentiation, and survival of myeloid progenitor cells.1 The G-CSF mediates its biological actions by binding to a specific cell-surface receptor (G-CSFR). The G-CSFR is present
on cells of the neutrophilic granulocyte lineage from the myeloblasts to the mature neutrophils. Binding of the G-CSF to its receptor activates a number of cyto-plasmic tyrosine kinases that initiate a cascade of downstream signaling events.2 The G-CSF-G-CSFR complex is internalized to the endosomal compart-ments, and either recycled or degraded.3 It is believed that only a minority of G-CSFRs need to be occupied to elicit maximal biological response.
Neutrophil production in a normal adult human takes place in the bone marrow by a process termed granulopoiesis. It is a continuous process of differen-tiation, divided in a series of steps based on a morpho-logical appearance of cells. Granulocytic progenitors originated from bone marrow pluripotent stem cells differentiate into the precursor cells myeloblasts, pro-myelocytes, and myelocytes. These cells are capable of division and constitute the mitotic compartment with the transit time equal to 143 hours.4 The more mature forms of neutrophil series (in order of age: metamyelocytes, band and polymorphonuclear neu-trophils) are incapable of cell division and constitute
Filgrastim is a recombinant human granulocyte colony stimulating factor (G-CSF) that stimulates production of neutrophils. The objective of this analysis was to develop a pharmacokinetic (PK) and pharmacodynamic (PD) model to account for an increase in G-CSF clearance on multiple dosing because of an increase of the G-CSF receptor-mediated endocytosis. Data from 4 randomized studies involving healthy volunteers were used for analysis. Subjects received filgrastim (Neupogen) via subcutaneous (SC) and intravenous (IV) routes. Filgrastim was administered SC daily for 1 week at 2.5, 5, and 10 µg/kg doses and as single IV infusions (5 µg/kg over 0.5 hours) and SC (1 µg/kg) doses. PK data comprised serum concentration-time measurements and the blood abso-lute neutrophil count (ANC) was used for PD evaluations. Population nonlinear mixed-effect modeling was done using
NONMEM VI (Version 6.1.0, Icon Development Solutions, Ellicott City, Maryland). The model depicted the decaying trend in Cmax values with repeated doses and an increase in ANCmax values consistently with an increase in the G-CSF receptor pool. Simulated time courses of the total clearance exhibited an increasing pattern. The increase in filgrastim clearance on multiple dosing was attributed to the increased neutrophil count in the bone marrow and blood paralleled by an increase in the total G-CSF receptor density.
Keywords: Granulocyte-colony stimulating factor; neu-trophils; granulopoiesis; target-mediated drug disposition; mechanistic models
JournalofClinicalPharmacology,2010;50:101S-112S©2010TheAuthor(s)
From Department of Pharmaceutical Sciences, State University of New York at Buffalo, Buffalo, New York (Dr Krzyzanski); the Department of Biophar-maceutics and Pharmacodynamics, Medical University of Gdansk, Poland (Dr Wiczling); Novartis Pharma AG, Modeling and Simulation, Basel, Switzerland (Dr Lowe, Dr Pigeolet, Dr Fink); and Sandoz Biopharmaceutical Development, Holzkirchen, Germany (Dr Berghout, Dr Balser). Submitted for publication April 14, 2010; revised version accepted May 27, 2010. Address for correspondence: Wojciech Krzyzanski, University at Buffalo, 565B Hochstetter Hall, Buffalo, NY 19426; [email protected]:10.1177/0091270010376966
Population Modeling of Filgrastim PK-PD in Healthy Adults Following Intravenous
and Subcutaneous Administrations
Wojciech Krzyzanski, PhD, Pawel Wiczling, PhD, Phil Lowe, PhD, Etienne Pigeolet, PhD, Martin Fink, PhD, Alexander Berghout, MD, and Sigrid Balser, PhD
at National Institutes of Health Library on November 19, 2010jcp.sagepub.comDownloaded from

102S • J Clin Pharmacol 2010;50:101S-112S
KRZYZANSKI ET AL
the maturing compartment with the transit time equal to 166 hours.4 From the maturation compartment, cells migrate to the blood. In the blood, cells are distributed approximately equally between circulating (49%) and marginal pools (51%).5 Cells in the marginal pool move through the vessel wall to enter the tissues (diape-desing). The average neutrophil circulates approxi-mately 10 hours in the blood before diapedesing to the tissues.6 Once neutrophils leave the blood, they do not return in significant numbers.4
The primary effects of G-CSF on normal hemato-poietic cells are limited to cells of the neutrophil lin-eage. G-CSF supports the survival and stimulates the proliferation of neutrophil progenitors and promotes their differentiation into mature neutrophils.7,8 Addi-tionally, G-CSF causes premature release of neutro-phils from the bone marrow as well as enhancement of mature cell function. The mobilizing effect of G-CSF extends on other hematopietic cells in the bone mar-row including stem cells.9 G-CSF also promotes mar-gination of neutrophils.1 Filgrastim is an agent used therapeutically for treatments of neutropenia associ-ated with chemotherapy, conditions of severe chronic neutropenia, and for the mobilization of hematopoietic stem cells and progenitors for transplantation.10
The pharmacokinetics of the G-CSF has been reported to be nonlinear.11,12 The receptor-mediated binding of the G-CSF followed by internalization and degradation was shown to be an important mode of drug clearance.13,14 Glomerular filtration and subse-quent renal metabolism is a major elimination path-way for G-CSF besides receptor-mediated elimination.15 The nonlinearity in the G-CSF clearance was modeled by means of the Michaelis-Menten elimination that was independent of the number of neutrophils.12 In recent models, the receptor-mediated clearance of G-CSF has been accounted for by setting the Vmax term in the Michaels-Menten equation to be proportional to the circulating neutrophils.16 Our group has applied the target-mediated drug disposition (TMDD) concept to develop a PK model for G-CSF administered in healthy volunteers.17 The TMDD has been introduced to account for clearance of drugs that are majorly elimi-nated by binding to their receptors followed by degra-dation.18,19 TMDD PK models were successfully applied to describe nonlinear disposition of monoclonal anti-bodies20 and cytokines,21 including hematopoietic fac-tors such as erythropoietin22 and thrombopoietin.23
Mathematical models for granulopoiesis with G-CSF as a major regulatory factor have been developed to account for dominant mechanisms controlling neutro-phil turnover as well as G-CSF pharmacokinetics.15,24,25
Despite the mathematical complexity, these models would be difficult to apply to analysis of typical clinical data consisting of G-CSF plasma concentrations and absolute neutrophil counts (ANC) without encounter-ing parameter identifiability issues. More parsimonious pharmacodynamic models have been proposed where the ANC data were modeled by a basic indirect response model.12 Subsequent models included transit compart-ments accounting for all stages of neutrophil develop-ment spanning from metamyelocytes up to circulating neutrophils and implementing all major modes of G-CSF actions on neutrophil progenitor cells.16
Our primary objective was to expand our previously developed TMDD pharmacokinetic model for filgrastim administration in healthy volunteers onto a PK-PD model describing also the ANC data.17 The data included in our analysis comprised both single and multiple IV and SC injections. We observed that the time dependent G-CSF clearance significantly increased following mul-tiple drug administrations. This phenomenon was reported previously26 and it was attributed to an increase in the G-CSFR pool size because of an increase of cell number in bone marrow precursor and blood neutrophil compartments. Our secondary objective was to include this mechanism in the PK-PD model. We adopted the published models of the neutrophil dynam-ics and combined them with our TMDD PK model so that the receptor mediated clearance depended on the total neutrophil count. This constitutes a significant improvement of the description of mechanisms of fil-grastim clearance provided by existing models. Fur-thermore, we used computer simulations to explore the impact of neutrophil dynamics on the G-CSF clear-ance, as well as the time course of the G-CSFR pool.
MetHoDS
Clinical Study Design
Data from 4 randomized studies involving healthy male (n = 37) and female (n = 30) volunteers were used for analysis. A summary of clinical studies of filgrastim is shown in Table I. Subjects received filgrastim (Neupogen) via SC and IV routes. Filgrastim was administered as repeated SC daily administration for 1 week of 2.5, 5, and 10 µg/kg doses and as single IV infusions (5 µg/kg over 0.5 hours) and SC (1 µg/kg) doses. The samples were analyzed for serum G-CSF using an ELISA assay. The serum G-CSF concentra-tions below LQ = 0.04 ng/ml were set to the half of LQ (0.02 ng/mL). Only a part of the pretreatment observa-tions were below LQ levels. Serum concentration-time
at National Institutes of Health Library on November 19, 2010jcp.sagepub.comDownloaded from

FILGRASTIM PK-PD FOLLOWING INTRAVENOUS AND SUBCUTANEOUS ADMINISTRATIONS
INNOvAtION 103S
records were evaluated from rich sampling profiles consisting of the total of 1778 points. For hematology evaluation, whole blood samples were analyzed. The ANC was calculated as the product of the percentage of neutrophils and the total white blood cell count. Pharmacodynamic data (ANC) were comprised of 1661 points. The descriptive statistics of subjects enrolled in our analysis are presented in Table II.
PK-PD Fixed effects Model
The schematic representation of the proposed PK-PD model is shown in Figure 1. The free G-CSF concentra-tion C in the serum was assumed to be in an instanta-neous equilibrium with the bone marrow and to bind to G-CSF receptors R present on blood and bone mar-row neutrophils at a second order rate constant kon, to form drug receptor complex RC. The G-CSF can also be directly eliminated by a glomerular filtration and subsequent renal metabolism represented by a first order elimination rate kel. The endogenous G-CSF was assumed to be continuously produced at a zero-order rate constant kGCSF. The drug receptor complex RC can dissociate at a rate koff or be internalized at a rate kint. The internalized G-CSF receptor complex was assumed to be further degraded in the endosomes and not to recycle as a free receptor and a drug molecule. Because
the identification of the binding parameters in the pres-ence of the PD data was difficult, the TMDD model of G-CSF disposition was further reduced to a rapid bind-ing form27 where the free drug and receptor concentra-tions are replaced by total concentrations because of the quasi-equilibrium assumption:
(1)
The differential equation describing the total G-CSF concentration Ctot = C + RC was:
(2)
where input accounted for both IV and SC administra-tion of filgrastim as follows:
(3)
and ka denotes the first-order absorption rate constant, F is the bioavailability, and VD is the volume of dis-tribution. The filgrastim serum concentration was calculated as27:
(4)
table I Summary of Clinical Studiesof Filgrastim
Study
Route
N
Doses, µg/kg
Dosing times, Day of Study
101 SC 16 10 0, 1, 2, 3, 4, 5, 6102 IV 12 5 0103 SC 27 2.5 (n = 14)
5 (n = 13)0, 1, 2, 3, 4, 5, 6
105 SC 12 1 0
SC, subcutaneous; IV, intravenous.
table II Descriptive Statistics of Patients Enrolled in Clinical Studies of Filgrastim
Name Descriptive Statistic
Gender Male, n = 37Female, n = 30
Race White, n = 67Height, m 175.7 (158-205)Weight, kg 75.4 (56.6-111.8)Age, y 36.7 (22-53)
ASC C R RC+ka
F DSCDIV kGCSF
kel kint
koff
kon
NBM1 NBM2 NBMn NB
kt kt ktkt
kmt
kin...
⋅
Smax1,SC50 Smax2,SC50 Smax2,SC50 Smax2,SC50Smax2,SC50
ξ
Figure 1. Schematic diagram of the PK-PD model. The model opera-tion and parameters are explained in the Methods section. The open boxes represent stimulatory effects of filgrastim described by the Hill functions, Equation 10. The upper box containing R and RC stands for the total receptor concentration Rtot. The lower box containing all neutrophil compartments in the bone marrow and blood represents the total neutrophil count in these tissues NBM + NB. The total neu-trophil count controls Rtot (broken arrow) according to Equation 6.
C RRC
kk
Koff
onD
⋅= =
dCdt
Input k k C k RCtotGCSF el= + − ⋅ − ⋅int
Input
Dose V tD
=/ / ,inf
0,
k
t t IV
t t I
a
inf
inf
⋅ ⋅ ⋅
≤>
− ⋅F Dose V e
for
for
Dk ta/ ,
;
; VV
SC
C C R K C R K K Ctot tot D tot tot D D tot= ⋅ − − + − − + ⋅ ⋅0 5 42. (( ) ( ) )
at National Institutes of Health Library on November 19, 2010jcp.sagepub.comDownloaded from

104S • J Clin Pharmacol 2010;50:101S-112S
KRZYZANSKI ET AL
and the bound G-CSF complex as27:
(5)
where Rtot = R + RC is the total concentration of G-CSFR. A key assumption for the structure of the PK-PD model was the relationship between Rtot and the neutrophil count. Because G-CSFR is expressed on both bone marrow precursors NBM and circulating neutrophils NB we assumed that:
(6)
where ξ is a proportionality constant. The neutrophil dynamics was described according to a previously introduced model16 with a modification of the produc-tion rate kin. Instead of a zero-order rate constant, kin was assumed to be a first-order as suggested by models of chemotherapy-induced myelosuppression.28 The development of neutrophil precursor cells in the bone marrow was described by a sequence of n = 9 transit compartments with a transit rate constant kt. The model of neurophils in blood comprised of 1 pool with a first-order elimination rate constant kmt. An attempt was made to include additional processes such as mobiliza-tion of neutrophil precursors from the bone marrow to the blood, and marginalization of the circulating neu-trophils represented by a marginal pool. However, none of these mechanisms were identified with an acceptable precision and were not included in the final model. The PD model equations were as follows:
(7)
(8)
(9)
where H1 and H2 denote the stimulatory Hill functions
(10)
For parsimony reasons, the same potency param-eter, SC50 (drug serum concentration eliciting 50% of the maximum effect), was used for the G-CSF effect on cell proliferation (kin) and cell maturation (kt). The total neutrophil count in the bone marrow can be expressed as:
(11)
The system was assumed to be at a steady-state prior to the administration of the drug. The baseline equa-tions derived from Equations 2, 7, 8, and 9 are as follows:
(12)
(13)
(14)
(15)
(16)
(17)
where C0 was a baseline serum G-CSF concentration, and NBM10, …., NBMn0 are the baseline values for neu-trophil precursor compartments in the bone marrow. The baseline total receptor concentration Rtot0 was calculated as:
(18)
The baseline values of C0 and NB0 were used in the model as parameters to be estimated. The initial con-ditions for differential Equations 2, 7, 8, and 9 were set to the following:
(19)
The estimated fixed effect parameters were F, ka, kel, VD, KD, kint, ξ, kmt, kt, NB0, SC50, Smax1, and Smax2.
RCR CK C
tot
D
=⋅
+
R N Ntot BM B= ⋅ +ξ ( )
dNdt
k H N k H NBMin BM t BM
11 1 2 1= ⋅ ⋅ − ⋅ ⋅
dNdt
k H N k H N i nBMit BMi t BMi= ⋅ ⋅ − ⋅ ⋅ =−2 1 2 2, ,..., .
dNdt
k H N k NBt BMn mt B= ⋅ ⋅ − ⋅2
HS CSC C
and HS CSC C1
1
502
2
50
1 1= +⋅+
= +⋅+
max max
N N NBM BM BMn= + +1 ...
k k C k RCGCSF el= ⋅ + ⋅0 0int
kk H
Hint=⋅ 20
10
N NBM BMn10 0= =...
Nk Nk HBMnmt B
t0
0
20
=⋅⋅
RCR CK C
tot
D0
0 0
0
=⋅
+
HS CSC C
and HS CSC C10
1 0
50 020
2 0
50 0
1 1= +⋅+
= +⋅+
max max
R N N Ntot BM BMn B0 10 0 0= ⋅ + + +ξ ( ... )
C C RC N N
N Ntot B B
BMi BMn
( ) , ( ) ,
( )
0 0
00 0 0
0
= + ==
and ,, ,..., . i n= 1
at National Institutes of Health Library on November 19, 2010jcp.sagepub.comDownloaded from

FILGRASTIM PK-PD FOLLOWING INTRAVENOUS AND SUBCUTANEOUS ADMINISTRATIONS
INNOvAtION 105S
Population PK-PD Modeling
Population nonlinear mixed-effect modeling was done using NONMEM (Version 6.1.0, Icon Development Solutions, Ellicott City, Maryland) and the Intel For-tran Compiler 9.0. NONMEM runs were executed using Wings for NONMEM (WFN611; http://wfn.sourceforge.net/index.html). The first-order condi-tional estimation (FOCE) method with interaction was used. The observed concentrations of filgrastim and blood neutrophil counts were defined by the following equations:
(20)
(21)
where C and NB were described by Equations 4 and 9 of the basic structural population model, and εprop and εadd represented the proportional and additive residual random errors. It was assumed that all ε are normally distributed around a mean of 0, with variances denoted by σ2
prop and σ2add. Interindividual variability (IIV) for
the PK-PD parameters was modeled using the following exponential variability model:
(22)
where P is a PK-PD parameter, θP is the typical value of this parameter in the population, and ηP is a random effect of that parameter with mean 0 and variance ωP
2. The IIV was estimated for kel, VD, ka, ξ, SC50, Smax1, and NB0. The baseline G-CSF concentrations C0 were fixed at individual pretreatment values. The other param-eters were estimated without intersubject variability to reduce the number of parameters in the model.
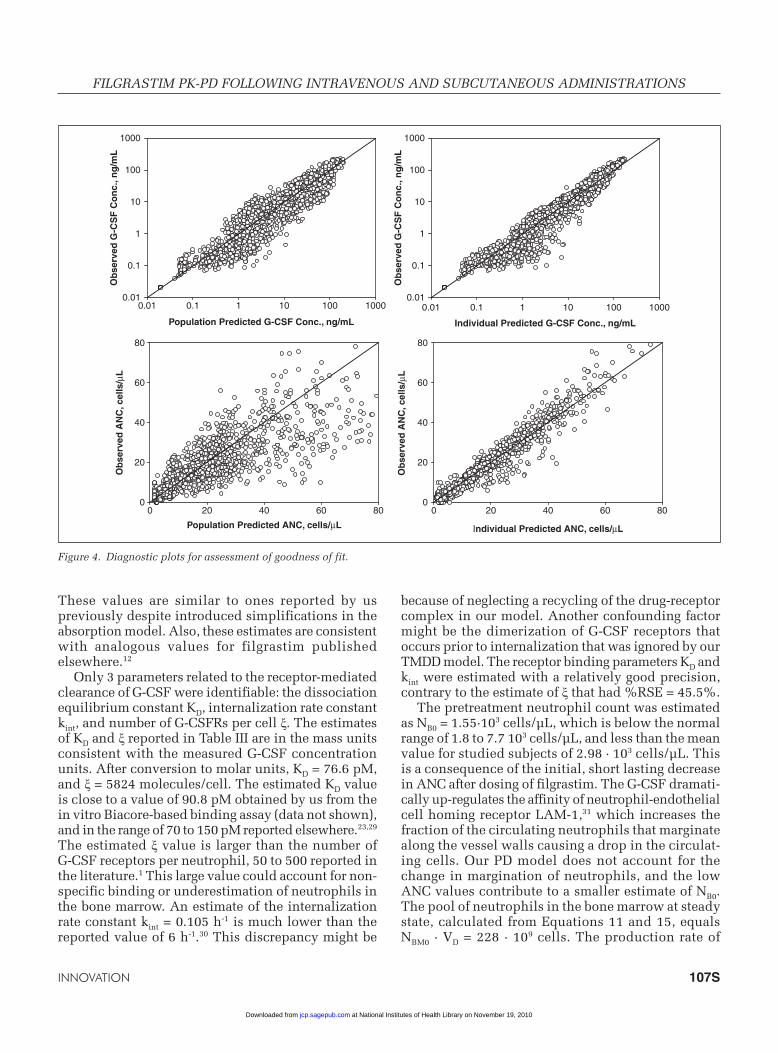
Goodness-of-fit was evaluated by visual inspection of diagnostic scatter plots, including observed and predicted values versus time, and observed versus population and individual predicted values. The visual predictive performance of the final model was performed by simulating 200 subjects using model parameter estimates. The simulations were done using NONMEM and were presented as 5th, 50th (median), and 95th percentiles along with experimental data.
Simulations
The typical values of PK-PD parameters were used for all simulations. The baseline G-CSF serum
concentration was set to the mean baseline of the data C0 = 0.0246 ng/mL. The simulations included time profiles for R, RC, Rtot, Ctot, CLtot for dosing regimens 2.5, 5, and 10 µg/kg SC q.d. for 7 days. The total clear-ance was calculated according to the following equa-tion accounting for linear and receptor mediated elimination17:
(23)
A conversion factor of 53.2 pM/ng/mL, calculated based on the filgrastim molecular weight 18.8 kD, was used to express R, RC, Rtot, Ctot in molar concentration units.
ReSultS
The visual predictive checks of G-CSF concentrations and ANC responses are shown for all dosing schemes in Figures 2 and 3. These plots show that the final PK-PD model described the measured PK-PD data reasonably well. Decreasing concentration peaks and troughs following multiple doses were adequately captured by the PK model. The major misfits of fil-grastim concentrations were present for the terminal phases of the multiple dose data. The diagnostic plots in Figure 4 also demonstrate this shortcoming. The ANC data exhibited increases in peak and trough val-ues following multiple dosing. Although the model overall captured the trend in the PD data, the peaks for 1 and 2.5 µg/kg SC data were under-predicted and for 10 µg/kg data were over-predicted. There are 2 mechanisms responsible for an increase in ANC because of exposure to G-CSF: stimulation of the pro-liferation rate kin and acceleration of the maturation rate kt. Both are modeled using the Hill function, Equa-tion 10. Although physiologically different, they share the same parameter SC50 because of identifiability issues. This was sufficient to describe the individual PD data as shown in the diagnostic plots in Figure 4, but was not enough to eliminate systematic misfits of the ANC peaks.
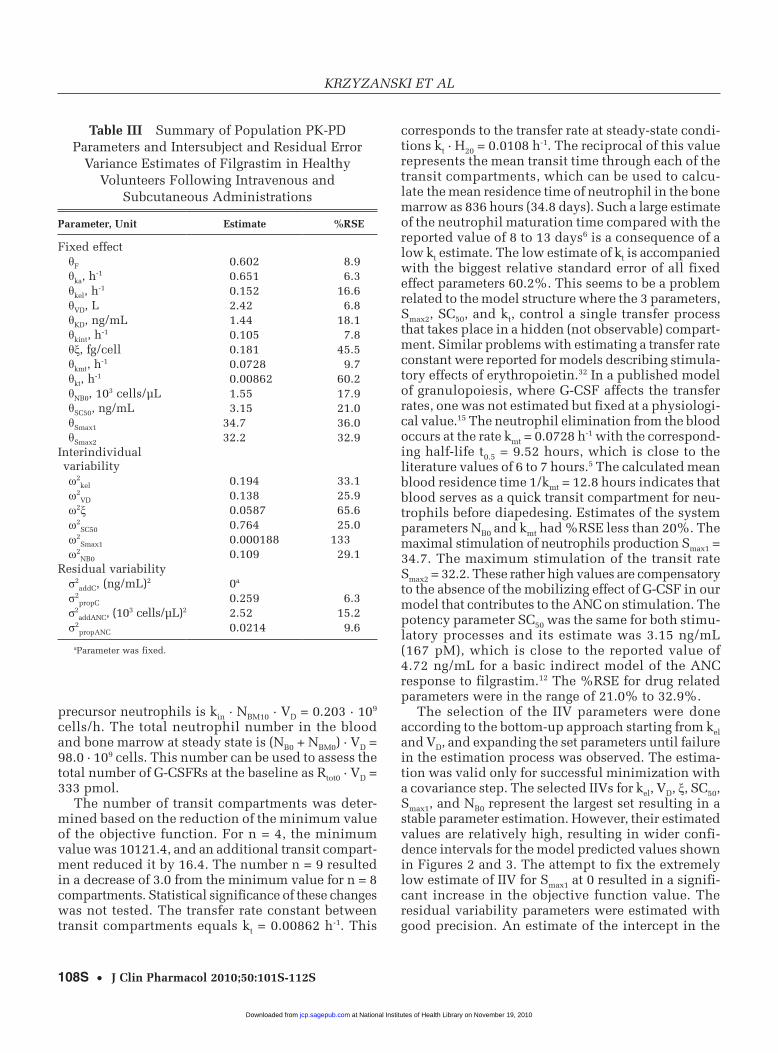
The parameter estimates obtained by the simultane-ous fitting of the PK-PD data are listed in Table III. The typical value of filgrastim absorption rate ka is 0.602 h-1, and the bioavailability F for the SC admin-istration equals 0.602. The volume of distribution VD equals 2.42 L. The linear clearance is small with the elimination rate constant kel = 0.152 h-1. Relative stan-dard errors of these estimates do not exceed 17%.
C Cobs propC addC= ⋅ + +( )1 ε ε
N NBobs B propNB addNB= ⋅ + +( )1 ε ε
P P P= θ ηexp( )
CL k Vk R V
K Ctot el Dtot D
D
= ⋅ +⋅ ⋅
+int .
at National Institutes of Health Library on November 19, 2010jcp.sagepub.comDownloaded from

106S • J Clin Pharmacol 2010;50:101S-112S
KRZYZANSKI ET AL
10 µg/kg SC
0 50 100 150 200
G-C
SF
Ser
um
Co
nc.
, ng
/mL
0.001
0.01
0.1
1
10
100
1000
Time, h
0 50 100 150 2000
20
40
60
80
100
120
140
10 µg/kg SC
5 µg/kg SC
0 50 100 150 200
G-C
SF
Ser
um
Co
nc.
, ng
/mL
0.01
0.1
1
10
100
5 µg/kg SC
Time, h
0 50 100 150 2000
20
40
60
80
100
2.5µg/kg SC
0 50 100 150 200
G-C
SF
Ser
um
Co
nc.
, ng
/mL
0.01
0.1
1
10
100
Time, h
0 50 100 150 200
AN
C, 1
03 c
ells
/µL
AN
C, 1
03 c
ells
/µL
AN
C, 1
03 c
ells
/µL
0
20
40
60 2.5 µg/kg SC
Figure 3. Time courses of filgrastim serum concentrations and ANCs (symbols) following multiple SC administrations of 2.5 µg/kg (left), 5 µg/kg (middle), and 10 µg/kg (right). The lines represent the 5th, 50th, and 95th percentiles of model-predicted values based on param-eter estimates shown in Table III.
5µg/kg IV
G-C
SF
Ser
um
Co
nc.
, ng
/mL
0.01
0.1
1
10
100
1000
5µg/kg IV
Time, h
AN
C, 1
03 c
ells
/µL
0
4
8
12
16
20
24
28
32
36
1µg/kg SC
G-C
SF
Ser
um
Co
nc.
, ng
/mL
0.01
0.1
1
10
100
1µg/kg SC
AN
C, 1
03 ce
lls/µ
L
0
4
8
12
16
20
24
28
Time, h
0 20 40 60 80 100 120 0 20 40 60 80 100 120
0 10 20 30 0 10 20 30
Figure 2. Time courses of filgrastim serum concentrations and ANCs (symbols) following a single administration of 1 µg/kg SC (left) and 5 µg/kg IV (right). The lines represent the 5th, 50th, and 95th percentiles of model-predicted values based on parameter estimates shown in Table III.
at National Institutes of Health Library on November 19, 2010jcp.sagepub.comDownloaded from
FILGRASTIM PK-PD FOLLOWING INTRAVENOUS AND SUBCUTANEOUS ADMINISTRATIONS
INNOvAtION 107S
These values are similar to ones reported by us previously despite introduced simplifications in the absorption model. Also, these estimates are consistent with analogous values for filgrastim published elsewhere.12
Only 3 parameters related to the receptor-mediated clearance of G-CSF were identifiable: the dissociation equilibrium constant KD, internalization rate constant kint, and number of G-CSFRs per cell ξ. The estimates of KD and ξ reported in Table III are in the mass units consistent with the measured G-CSF concentration units. After conversion to molar units, KD = 76.6 pM, and ξ = 5824 molecules/cell. The estimated KD value is close to a value of 90.8 pM obtained by us from the in vitro Biacore-based binding assay (data not shown), and in the range of 70 to 150 pM reported elsewhere.23,29 The estimated ξ value is larger than the number of G-CSF receptors per neutrophil, 50 to 500 reported in the literature.1 This large value could account for non-specific binding or underestimation of neutrophils in the bone marrow. An estimate of the internalization rate constant kint = 0.105 h-1 is much lower than the reported value of 6 h-1.30 This discrepancy might be
because of neglecting a recycling of the drug-receptor complex in our model. Another confounding factor might be the dimerization of G-CSF receptors that occurs prior to internalization that was ignored by our TMDD model. The receptor binding parameters KD and kint were estimated with a relatively good precision, contrary to the estimate of ξ that had %RSE = 45.5%.
The pretreatment neutrophil count was estimated as NB0 = 1.55·103 cells/µL, which is below the normal range of 1.8 to 7.7 103 cells/µL, and less than the mean value for studied subjects of 2.98 · 103 cells/µL. This is a consequence of the initial, short lasting decrease in ANC after dosing of filgrastim. The G-CSF dramati-cally up-regulates the affinity of neutrophil-endothelial cell homing receptor LAM-1,31 which increases the fraction of the circulating neutrophils that marginate along the vessel walls causing a drop in the circulat-ing cells. Our PD model does not account for the change in margination of neutrophils, and the low ANC values contribute to a smaller estimate of NB0. The pool of neutrophils in the bone marrow at steady state, calculated from Equations 11 and 15, equals NBM0 · VD = 228 · 109 cells. The production rate of
Population Predicted G-CSF Conc., ng/mL
0.01 0.1 1 10 100 1000
Ob
serv
ed G
-CS
F C
on
c., n
g/m
L
0.01
0.1
1
10
100
1000
Population Predicted ANC, cells/µL
0 20 40 60 80
Ob
serv
ed A
NC
, cel
ls/µ
L
Ob
serv
ed A
NC
, cel
ls/µ
L
0
20
40
60
80
Individual Predicted G-CSF Conc., ng/mL
0.01 0.1 1 10 100 1000
Ob
serv
ed G
-CS
F C
on
c., n
g/m
L
0.01
0.1
1
10
100
1000
Individual Predicted ANC, cells/µL
0 20 40 60 800
20
40
60
80
Figure 4. Diagnostic plots for assessment of goodness of fit.
at National Institutes of Health Library on November 19, 2010jcp.sagepub.comDownloaded from
108S • J Clin Pharmacol 2010;50:101S-112S
KRZYZANSKI ET AL
precursor neutrophils is kin · NBM10 · VD = 0.203 · 109 cells/h. The total neutrophil number in the blood and bone marrow at steady state is (NB0 + NBM0) · VD = 98.0 · 109 cells. This number can be used to assess the total number of G-CSFRs at the baseline as Rtot0 · VD = 333 pmol.
The number of transit compartments was deter-mined based on the reduction of the minimum value of the objective function. For n = 4, the minimum value was 10121.4, and an additional transit compart-ment reduced it by 16.4. The number n = 9 resulted in a decrease of 3.0 from the minimum value for n = 8 compartments. Statistical significance of these changes was not tested. The transfer rate constant between transit compartments equals kt = 0.00862 h-1. This
corresponds to the transfer rate at steady-state condi-tions kt · H20 = 0.0108 h-1. The reciprocal of this value represents the mean transit time through each of the transit compartments, which can be used to calcu-late the mean residence time of neutrophil in the bone marrow as 836 hours (34.8 days). Such a large estimate of the neutrophil maturation time compared with the reported value of 8 to 13 days6 is a consequence of a low kt estimate. The low estimate of kt is accompanied with the biggest relative standard error of all fixed effect parameters 60.2%. This seems to be a problem related to the model structure where the 3 parameters, Smax2, SC50, and kt, control a single transfer process that takes place in a hidden (not observable) compart-ment. Similar problems with estimating a transfer rate constant were reported for models describing stimula-tory effects of erythropoietin.32 In a published model of granulopoiesis, where G-CSF affects the transfer rates, one was not estimated but fixed at a physiologi-cal value.15 The neutrophil elimination from the blood occurs at the rate kmt = 0.0728 h-1 with the correspond-ing half-life t0.5 = 9.52 hours, which is close to the literature values of 6 to 7 hours.5 The calculated mean blood residence time 1/kmt = 12.8 hours indicates that blood serves as a quick transit compartment for neu-trophils before diapedesing. Estimates of the system parameters NB0 and kmt had %RSE less than 20%. The maximal stimulation of neutrophils production Smax1 = 34.7. The maximum stimulation of the transit rate Smax2 = 32.2. These rather high values are compensatory to the absence of the mobilizing effect of G-CSF in our model that contributes to the ANC on stimulation. The potency parameter SC50 was the same for both stimu-latory processes and its estimate was 3.15 ng/mL (167 pM), which is close to the reported value of 4.72 ng/mL for a basic indirect model of the ANC response to filgrastim.12 The %RSE for drug related parameters were in the range of 21.0% to 32.9%.
The selection of the IIV parameters were done according to the bottom-up approach starting from kel and VD, and expanding the set parameters until failure in the estimation process was observed. The estima-tion was valid only for successful minimization with a covariance step. The selected IIVs for kel, VD, ξ, SC50, Smax1, and NB0 represent the largest set resulting in a stable parameter estimation. However, their estimated values are relatively high, resulting in wider confi-dence intervals for the model predicted values shown in Figures 2 and 3. The attempt to fix the extremely low estimate of IIV for Smax1 at 0 resulted in a signifi-cant increase in the objective function value. The residual variability parameters were estimated with good precision. An estimate of the intercept in the
table III Summary of Population PK-PD Parameters and Intersubject and Residual Error
Variance Estimates of Filgrastim in Healthy Volunteers Following Intravenous and
Subcutaneous Administrations
Parameter, unit estimate %RSe
Fixed effectθF 0.602 8.9θka, h
-1 0.651 6.3θkel, h
-1 0.152 16.6θVD, L 2.42 6.8θKD, ng/mL 1.44 18.1θkint, h
-1 0.105 7.8θξ, fg/cell 0.181 45.5θkmt, h
-1 0.0728 9.7θkt, h
-1 0.00862 60.2θNB0, 103 cells/µL 1.55 17.9θSC50, ng/mL 3.15 21.0θSmax1 34.7 36.0θSmax2 32.2 32.9
Interindividual variabilityω2
kel 0.194 33.1ω2
VD 0.138 25.9ω2ξ 0.0587 65.6ω2
SC50 0.764 25.0ω2
Smax1 0.000188 133ω2
NB0 0.109 29.1Residual variabilityσ2
addC, (ng/mL)2 0a
σ2propC 0.259 6.3
σ2addANC, (103 cells/µL)2 2.52 15.2
σ2propANC 0.0214 9.6
aParameter was fixed.
at National Institutes of Health Library on November 19, 2010jcp.sagepub.comDownloaded from

FILGRASTIM PK-PD FOLLOWING INTRAVENOUS AND SUBCUTANEOUS ADMINISTRATIONS
INNOvAtION 109S
additive model of RV for PK data was very small and was subsequently fixed at 0. The plots of individual estimates of the parameters above versus dose (supple-mentary material) showed that VD and ξ estimates moderately increased with increasing dose. An appar-ent dose dependence of ξ indicates that the expression of G-CSF receptor on neutrophils increases with dose. An interpretation of the dose dependence of VD is difficult because in the presented model there are several contributing factors such as increasing with dose and time the pool of G-CSF receptors, or the absence of the neutrophil marginalization. Since our model does not account for per cell receptor upregula-tion or margination, the estimates of VD can compen-sate for a lack of these processes.
Figure 5 shows the simulated profiles of the PK model variables that were not measured, R, RC, Ctot, and Rtot. The time courses of the bound G-CSFR start at the baseline value of 15.5 pM and oscillate between
troughs and peaks that increased following each SC dose to reach the level of 266 to 879 pM for the last trough and 1762 to 4395 pM for the last peak. After the seventh dose, the RC variable returned to the base-line within 72 hours. Similar patterns exhibit the total G-CSF serum concentration time profiles, except for a lack of increase in trough and peak values, which remain at the same level of 276 to 899 pM (troughs) and 2101 to 7528 pM (peaks) for each dose. The time courses for the free receptors are inverted and oscillate between the peaks and troughs with peaks and trough increasing for each dose to reach the levels of 1898 to 3255 pM for peaks and 102 to 397 pM for troughs. After the last trough, the R values increase to reach a plateau. This behavior is dictated by the G-CSFRs expressed on neutrophils in the bone marrow, which residence time was estimated to be much longer than a physiological one resulting in an artificial steady-state for R rather then a decline to the baseline value
0 50 100 150 200
To
tal G
-CS
F C
on
c. C
tot,
pM
10
100
1000
Time, h
0 50 100 150 200
To
tal G
-CS
FR
Co
nc.
Rto
t, p
M
1000
2000
3000
4000
5000
0 50 100 150 200
Bo
un
d G
-CS
FR
Co
nc.
RC
, pM
10
100
1000
Time, h
0 50 100 150 200
Fre
e G
-CS
FR
Co
nc.
R, p
M
10
100
1000
5 g/kg SC2.5 g/kg SC
10 g/kg SC
Figure 5. Simulated time profiles of bound G-CSF receptors RC, free G-CSF receptors R, total filgrastim concentrations Ctot, and total G-CSF receptor concentrations Rtot, following multiple SC administrations of 2.5, 5, and 10 µg/kg. The variables are expressed in pM units. Equations 5 and 6 were used to calculate RC and Rrot. R was calculated as Rtot - RC, and Ctot as C + RC. The parameter values used for simu-lations are shown in Table III.
at National Institutes of Health Library on November 19, 2010jcp.sagepub.comDownloaded from

110S • J Clin Pharmacol 2010;50:101S-112S
KRZYZANSKI ET AL
of 907 pM. The amplitude of the decrease from the peak to the trough for R following each dose matches the amplitude of the increase from the trough to the peak for RC consistently with the receptor binding G-CSF molecules. The low levels of the troughs com-pared with the baseline indicate that after each dose almost all receptors are occupied. According to Equa-tion 6, the time courses of the total receptors parallel the time courses of the total neutrophil count in the blood and the bone marrow. Consequently, one can observe an accumulation of Rtot that reaches the level of 2346 to 5114 pM to slowly decline to a baseline level. The rate of the decline is small for the same reasons provided for R.
The primary objective of this study was to establish a relationship between the receptor-mediated clearance of G-CSF and the neutrophil count in the bone marrow and blood. Equation 23 offers such a relationship with Rtot linked to the total neutrophils via Equation 6. The simulated time profiles for CLtot on multiple SC dosing are shown in Figure 6. These curves seem to be scaled time profiles for free receptors R. This is indeed the case. One can use Equation 5 to show that:
(24)
Then, Equation 23 can be transformed to the following form:
(25)
Equation 25 offers a straightforward interpretation of the impact of receptor binding on the total clearance. The decrease in free receptors after each dose admin-istration causes a proportional decrease in total clear-ance of filgrastim. The clearance increases when the number of free receptors increases. The magnitude of the clearance increases with subsequent doses causing an observable decrease in filgrastim peak concentra-tions and AUC values.
DISCuSSIoN
The structure of the proposed PK-PD model is parsi-monious given the data used for our analysis. The absorption model was reduced to a standard first-order process compared with our model for PK data only.17 We also did not find it beneficiary to add a peripheral compartment that is present in PK-PD models of fil-grastim published previously,12 presumably because of the presence of the receptor-binding compartment. The physiologically present processes of mobilization of band and segmented neutrophils from the bone marrow, as well as the marginal pool, were tested and not included in the final model because of over-parameterization. The neutrophil margination was modeled by others as a drug effect on the blood neu-trophil dilution volume.16 Because of the limited amount of information on the data, the initial decrease in ANCs following G-SCF administration was not mod-eled. This phenomenon was described in previous models as a temporal increase in filgrastim volume of distribution for neutrophils.12
Our major contribution to the existing PK-PD mod-els for G-CSF was combining the receptor-mediated PK model with the PD model via our simplistic assumption that the total receptor pool size is propor-tional to the neutrophil count in the bone marrow and blood. Such an assumption to link the receptor com-partment to the number of cells expressing it was proposed previously for a PK-PD model of pegylated thrombopoietin mimetic peptide effects on platelets.33 Another mechanism was introduced that involved the modeling of the receptor turnover per cell and multiplying the receptor per cell by the number of neutrophils.34 More empirical approaches have been applied previously where the receptor mediated clear-ance was modeled by means of the Michaelis-Menten equation with Vmax proportional to the number of neu-trophils.12,15 In the view of the relationship between CLtot and Rtot (Equation 23), this is fully justifiable based on the receptor-mediated disposition PK model. The relationships between Michaelis-Menten and TMDD parameters have been established as follows35:
Time, h
0 50 100 150 200
To
tal C
lear
ence
CL
tot ,
L/h
0
2
4
6
8
10
12
14
16
182.5 µg/kg SC5 µg/kg SC10 µg/kg SC
Figure 6. Simulated time profiles of the filgrastim total clearance CLtot following multiple SC administrations of 2.5, 5, and 10 µg/kg. Equation 23 was used to calculate CLtot. The parameter values used for simulations are shown in Table III.
R R RCR KK Ctot
tot D
D
= − =⋅+
CL k V k VR
Ktot el d dD
= + ⋅ ⋅int
at National Institutes of Health Library on November 19, 2010jcp.sagepub.comDownloaded from

FILGRASTIM PK-PD FOLLOWING INTRAVENOUS AND SUBCUTANEOUS ADMINISTRATIONS
INNOvAtION 111S
(26)
The present shortcomings of our model can be attrib-uted to a too simplistic relationship between total recep-tors and total neutrophils. More mechanistic models of the link between receptors and the number of cells expressing them are necessary to account for different dynamics of these variables that are physically linked together. This is a subject for future studies.
The structural model describing the neutrophil dynamics is based on a previously introduced model where the maturation of the neutrophil precursors in the bone marrow is described by a sequence of transit (aging) compartments.16 An alternative approach has been proposed to model the effect of lenograstim on neutrophil production in healthy volunteers.36 There neutrophil maturation is described by a lifespan-based indirect model according to which cells exit the popu-lation at a rate determined by their lifespan. Lifespan-based PK-PD models have been successfully applied to describe the effects of other hematopoietic growth factors on red blood cells37 and platelets.33 The neu-trophil data presented in this report can also be mod-eled using a lifespan-based PD model. The only limitation is lack of PK-PD software that can solve the lifespan-based model equations involving delays (delay differential equations). A numerical method adopted in PK-PD software that converts delay dif-ferential equations to ordinary differential equations38 is poorly suited for the G-CSF-neutrophil system. Con-trary to the red blood cell lifespan of 120 days and platelet lifespan of 10 days, the neutrophil lifespan in the circulation is about 7 hours. This implied a large number of differential equations for the trans-formed lifespan-model, PK-PD model, and conse-quently this approach has been abandoned.
In our PK-PD model, the stimulatory effect of fil-grastim on neutrophil production and maturation is driven by the serum concentrations. A more mecha-nistic approach would involve the drug-receptor com-plex RC or receptor occupancy in accordance with the operational model of agonism.39 We have not attempted to include one of these variables as a PD driving force. Such a modification would be desired, especially because it has been successfully imple-mented in the modeling of pharmacological effects of other hematopoietic agents.22,33 This would enable a better understanding of the relationship between receptor affinity and filgrastim potency represented in our model by KD and SC50.
The PK-PD model presented here is meant to be used for modeling ANCs in response to an exposure to other agents that exhibit the same mechanism of
action as G-CSF. These include biosimilar drugs to filgrastim, and other modified G-CSF molecules such as pegfilgrastim. Computer simulations can be used to apply the PK-PD for assessment of the impact of the receptor-mediated disposition in biosimilarity studies.37 Another potential area for an application of the presented model is modeling the myelosupressive effects of anticancer agents with the administration of G-CSF as an adjuvant therapy. The bone structure of our PD model is very similar to models proposed by Frieberg et al.28 An inclusion of a toxic effect on the proliferating bone marrow cells would be neces-sary. A hypothesis that the negative feedback present in these models is because of an accumulation of the G-CSF, as a consequence of the depletion of the recep-tor pool by chemotherapy, could be tested and, if accepted, this model component might be removed.
In summary, the presented model expanded previ-ously published PK-PD models for filgrastim and peg-filgrastim by addition of the target mediated drug disposition. The increase in filgrastim clearance on multiple dosing was attributed to the increased neu-trophil count in the bone marrow and blood paralleled by an increase in the total G-CSF receptor density. Simultaneous modeling of filgrastim plasma concentra-tions and ANC was necessary to adequately describe PK data. Simulations with varying PK and PD parameter values indicated that the presented model could be used for data of other granulopoiesis stimulating agents.
This study was supported by grants from Novartis Pharma AG and the Laboratory for Protein Therapeutics University at Buffalo.
Financial disclosure: The articles in this supplement are spon-sored by the American Conference on Pharmacometrics.
ReFeReNCeS
1. Demetri GD, Griffin JD. Granulocyte colony-stimulating factor and its receptor. Blood. 1991;78:2791-2808.2. Anderlini P, Champlin RE. Biologic and molecular effects of granulocyte colony-stimulating factor in normal individuals: recent findings and current challenges. Blood. 2008;111:1767-1772.3. Robinson CR. Reduce, reuse, and recycle. Nat Biotechnol. 2002; 20:879-880.4. Skubitz KM. Neutrophilic leukocytes. In: Wintrobe MM, Greer J, eds. Wintrobe’s Clinical Hematology. 11th ed. Philadelphia, PA: Lippincott, Williams, & Wilkins; 2004.5. Bishop CR, Rothstein G, Ashenbrucker HE, Athens JW. Leuko-kinetic studies. XIV. Blood neutrophil kinetics in chronic, steady-state neutropenia. J Clin Inv. 1971;50:1678-1689.6. McKenzie SB. Textbook of Hematology. Baltimore, MD: Williams and Williams; 1996.7. Walte K, Gabrilove J, Bronchud MH, Platzer E, Morstyn G. Filgrastim (r-metHuG-CSF): the first 10 years. Blood. 1996;88: 1907-1929.
V k R V andtot Dmax int .= ⋅ ⋅ = K Km D
at National Institutes of Health Library on November 19, 2010jcp.sagepub.comDownloaded from

112S • J Clin Pharmacol 2010;50:101S-112S
KRZYZANSKI ET AL
8. Spiekermann K, Roesler J, Emmendoerffer A, Elsner J, Welte K. Functional features of neutrophils induced by G-CSF and GM-CSF treatment: differential effects and clinical implications. Leukemia. 1997;11:466-478.9. van Os R, van Schie ML, Willemze R, Fibbe WE. Proteolytic enzyme levels are increased during granulocyte colony-stimulating factor-induced hematopoietic stem cell mobilization in human donors but do not predict the number of mobilized stem cells. J Hematother Stem Cell Res. 2002;11:513-521.10. Sung L, Dror Y. Clinical applications of granulocyte-colony stimulating factor. Front Biosci. 2007;12:1988-2002.11. Borleffs JC, Bosschaert M, Vrehen HM, et al. Effect of escalat-ing doses of recombinant human granulocyte colony-stimulating factor (filgrastim) on circulating neutrophils in healthy subjects. Clin Ther. 1998;20:722-736.12. Wang B, Ludden TM, Cheung EN, Schwab GG, Roskos LK. Population pharmacokinetic-pharmacodynamic modeling of fil-grastim (r-metHuG-CSF) in healthy volunteers. J Pharmacokinet Pharmacodyn. 2001;28:321-342.13. Kuwabara T, Uchimura T, Kobayashi H, Kobayashi S, Sugi-yama Y. Receptor-mediated clearance of G-CSF derivative narto-grastim in bone marrow of rats. Am J Physiol. 1995;269:E1-E9.14. Layton JE, Hockman H, Sheridan WP, Morstyn G. Evidence for a novel in vivo control mechanism of granulopoiesis: mature cell-related control of a regulatory growth factor. Blood. 1989;74: 1303-1307.15. Foley C, Mackey MC. Mathematical model for G-CSF admin-istration after chemotherapy. J Theor Biol. 2009;257:27-44.16. Roskos LK, Lum P, Lockbaum P, Schwab G, Yang BB. Pharmacokinetic/pharmacodynamic modeling of pegfilgrastim in healthy subjects. J Clin Pharmacol. 2006;46:747-757.17. Wiczling P, Lowe P, Pigeolet E, Ludicke F, Balser S, Krzyzanski W. Population phramacokinetic modelling of filgrastim in healthy adults following intravenous and subcutaneous administrations. Clin Pharmacokinet. 2009;48:817-826.18. Levy G. Pharmacologic target-mediated drug disposition. Clin Pharmacol Ther. 1994;56:248-252.19. Mager DE, Jusko WJ. General pharmacokinetic model for drugs exhibiting target-mediated drug disposition. J Pharmacokin Pharmacodyn. 2001;28:507-532.20. Ng CM, Stefanich E, Anand BS, Fielder PJ, Vaickus L. Pharmacokinetics/pharmacodynamics of nondepleting anti-CD4 monoclonal antibody (TRX1) in healthy human volunteers. Pharm Res. 2006;23:95-103.21. Mager DE, Jusko WJ. Receptor-mediated pharmacokinetic/pharmacodynamic model of interferon-beta 1a in humans. Pharm Res. 2002;19:1537-1543.22. Woo S, Krzyzanski W, Jusko WJ. Target-mediated pharmaco-kinetic and pharmacodynamic model of recombinant human erythropoietin (rHuEPO). J Pharmacokin Pharmacodyn. 2007;34:849-868.23. Jin F, Krzyzanski W. Pharmacokinetic model of target-mediated disposition of thrombopoietin. AAPS Pharm Sci. 2004;6:E9.24. Sarkar CA, Lauffenburger DA. Cell-level pharmacokinetic model of granulocyte colony-stimulating factor: implications for ligand lifetime and potency in vivo. Mol Pharmacol. 2003;63:147-158.
25. Vainstein V, Ginosar Y, Shoham M, Ranmar DO, Ianovski A, Agur Z. The complex effect of granulocyte colony-stimulating fac-tor on human granulopoiesis analyzed by a new physiologically-based mathematical model. J Theor Biol. 2005;234:311-327.
26. Roskos L, Cheung E, Vincent M, Foote M, Morstyn G. Pharma-cology of filgrastim (r-metHuG-CSF). In: Morstyn G, Dexter TM, Foote M, eds. Filgrastim (r-metHuG-CSF) in Clinical Practice. New York: M. Dekker; 1998.
27. Mager DE, Krzyzanski W. Quasi-equilibrium pharmacokinetic model for drugs exhibiting target-mediated drug disposition. Pharm Res. 2005;22:1589-1596.
28. Friberg LE, Henningsson A, Maas H, Nguyen L, Karlsson MO. Model of chemotherapy-induced myelosuppression with parameter consistency across drugs. J Clin Oncol. 2002;20:4713-4721.
29. Avalos BR, Gasson JC, Hedvat C, et al., Human granulocyte colony-stimulating factor: biologic activities and receptor charac-terization on hematopoietic cells and small cell lung cancer cell lines. Blood. 1990;75:851-857.
30. Sarkar CA, Lowenhaupt K, Horan T, Boone TC, Tidor B, Lauffenburger DA. Rational cytokine design for increased lifetime and enhanced potency using pH-activated “histidine switching.” Nature Biotech. 2002;20:908-913.
31. Spertini O, Kansas GS, Munro JM, Griffin JD, Tedder TF. Regu-lation of leukocyte migration by activation of the leukocyte adhe-sion molecule-1 (LAM-1) selectin. Nature. 1991;349:691-694.
32. Krzyzanski W, Jusko WJ, Wacholtz MC, Minton N, Cheung WK, Pharmacokinetic and pharmacodynamic modeling of recombinant human erythropoietin after multiple subcutaneous doses in healthy subjects. Eur J Pharm Sci. 2005;26:295-306.
33. Samtani MN, Perez-Ruixo JJ, Brown K, Cerneus D, Molloy C. Pharmacokinetic and pharmacodynamic modeling of pegylated thrombopoietin mimetic peptide (PEG-TPOm) after single intra-venous dose in healthy subjects. J Clin Pharmacol. 2009;49: 336-350.
34. Jonsson EN, Macintyre F, James I, Krams M, Marshall S. Bridg-ing the pharmacokinetics and pharmacodynamics of UK-279,276 across healthy volunteers and stroke patients using mechanisti-cally based model for target-mediated disposition. Pharm Res. 2005;22:1236-1246.35. Yan X, Mager DE, Krzyzanski W. Selection between Michaelis-Menten and target-mediated drug disposition phar-macokinetic models. J Pharmacokinet Pharmacodyn. 2010;37: 25-48.36. Krzyzanski W, Ramakrishnan R, Jusko WJ. Basic models for agents that alter production of natural cells. J Pharmacokin Biopharm. 1999;27:467-489.37. Ramakrishnan R, Cheung WK, Wacholtz MC, Minton L, Jusko WJ. Pharmacokinetic and pharmacodynamic modeling of recombinant human erythropoietin after single and multiple doses in healthy volunteers. J Clin Pharmacol. 2004;44:991-1002.38. Perez-Ruixo JJ, Kimko HC, Chow AC, Piotrovsky W, Krzyzanski W, Jusko WJ. Population cell lifespan models for effects of drugs fol-lowing indirect mechanism of action. J Pharmacokin Pharmaco-dyn. 2005;32:767-793.39. Black JW, Leff P. Operational models of pharmacological agonism. Proc R Soc Lond B Biol Sci. 1983;220:141-162.
For reprints and permission queries, please visit SAGE’s Web site at http://www.sagepub.com/journalsPermissions.nav.
at National Institutes of Health Library on November 19, 2010jcp.sagepub.comDownloaded from