Reduction of nocturnal rise in bone resorption by subcutaneous GLP-2
8
Reduction of nocturnal rise in bone resorption by subcutaneous GLP-2 Dennis B. Henriksen, a, * Peter Alexandersen, b Inger Byrjalsen, a Bolette Hartmann, c Henry G. Bone, d Claus Christiansen, b and Jens Juul Holst c a Nordic Bioscience, Herlev Hovedgade 207, DK-2730 Herlev, Denmark. b Center for Clinical and Basic Research, 2750 Ballerup, Denmark c Department of Medical Physiology, University of Copenhagen, The Panum Institute, 2200 Copenhagen N, Denmark d Michigan Bone and Mineral Clinic, Detroit, MI 48236, USA Received 28 July 2003; revised 15 September 2003; accepted 30 September 2003 Abstract We have previously shown that a subcutaneous injection of glucagon-like peptide-2 (GLP-2) at 9 a.m. in fasting postmenopausal women results in a dose-dependent decrease in the serum concentration of fragments derived from the degradation of the C-terminal telopeptide region of collagen type I (s-CTX), a marker of bone resorption. In contrast, GLP-2 was found to have a neutral effect on bone formation, as assessed by serum osteocalcin. Since increased s-CTX levels are normally observed at night, we conducted bedtime studies in healthy postmenopausal women. The objective was to study the effect of GLP-2 injection on bone turnover given at bedtime. A total of 81 postmenopausal women were included in two randomised placebo-controlled studies. In conclusion, we found a dose-related reduction of s- CTX after injection of GLP-2 ( P < 0.05) and osteocalcin levels was increased as compared to placebo ( P = 0.07) by the treatment, suggestive of a stimulative effect on bone formation. An area under the curve (AUC 0 – 10 h ) analysis for s-CTX after GLP-2 injection confirmed the dose- related decrease as compared to placebo ( P < 0.05). D 2003 Elsevier Inc. All rights reserved. Keywords: Bone resorption; Glucagon like peptide 2; Osteocalcin; Bone turnover markers; Bone formation Introduction Bone remodelling is a dynamic and continuous process. Even a subtle perturbation of its balance can have pro- gressive effects on bone mass and structure and may result in metabolic bone disease. The acute increase in bone resorption associated with the decline in endogenous estrogen production at menopause is followed by a cou- pled, but smaller increase in bone formation. The failure of bone formation to fully compensate for the increased bone resorption during this phase may eventually lead to osteoporosis. Biochemical assessment of bone turnover processes shows a circadian pattern, with reduced bone resorption during daytime followed by a nocturnal increase [1,12, 21,22]. The circadian pattern in the bone turnover processes is of the same magnitude in men and women, and is not affected by menopausal status in women [21]. However, the circadian variation of bone resorption as assessed by the serum concentration of fragments derived from the degra- dation of the C-terminal telopeptide region of collagen type I (s-CTX) [6] is significantly dampened in fasting individ- uals [2,6,7,19]. The circadian variation of bone formation follows the same pattern as bone resorption, but the mag- nitude of the variation is less pronounced. Bone formation, as assessed by serum osteocalcin, has been found to be unaffected by ingestion of nutrients [2,6,7,19]. We have previously shown that in fasting postmenopausal women, a subcutaneous injection of the gastrointestinal hormone glu- cagon-like peptide-2 (GLP-2) resulted in a significant and acute reduction of bone resorption in a dose-related manner with seemingly no significant effect on bone formation [11]. GLP-2 is a 33-amino acid polypeptide, corresponding to amino acid 126–158 in proglucagon [10], and is released from the intestine within minutes after food intake. It is thought to serve, together with the other proglucagon- derived peptides, in the regulation of absorption and dis- posal of ingested nutrients [4,9,13]. 8756-3282/$ - see front matter D 2003 Elsevier Inc. All rights reserved. doi:10.1016/j.bone.2003.09.009 * Corresponding author. Fax: +45-4454-8830. E-mail addresses: [email protected] (D.B. Henriksen), [email protected] (P. Alexandersen), [email protected] (I. Byrjalsen), [email protected] (B. Hartmann), [email protected] (H.G. Bone), [email protected] (C. Christiansen), [email protected] (J.J. Holst). www.elsevier.com/locate/bone Bone 34 (2004) 140 – 147
Transcript of Reduction of nocturnal rise in bone resorption by subcutaneous GLP-2

www.elsevier.com/locate/bone
Bone 34 (2004) 140–147
Reduction of nocturnal rise in bone resorption by subcutaneous GLP-2
Dennis B. Henriksen,a,* Peter Alexandersen,b Inger Byrjalsen,a Bolette Hartmann,c
Henry G. Bone,d Claus Christiansen,b and Jens Juul Holstc
aNordic Bioscience, Herlev Hovedgade 207, DK-2730 Herlev, Denmark.bCenter for Clinical and Basic Research, 2750 Ballerup, Denmark
cDepartment of Medical Physiology, University of Copenhagen, The Panum Institute, 2200 Copenhagen N, DenmarkdMichigan Bone and Mineral Clinic, Detroit, MI 48236, USA
Received 28 July 2003; revised 15 September 2003; accepted 30 September 2003
Abstract
We have previously shown that a subcutaneous injection of glucagon-like peptide-2 (GLP-2) at 9 a.m. in fasting postmenopausal women
results in a dose-dependent decrease in the serum concentration of fragments derived from the degradation of the C-terminal telopeptide
region of collagen type I (s-CTX), a marker of bone resorption. In contrast, GLP-2 was found to have a neutral effect on bone formation, as
assessed by serum osteocalcin. Since increased s-CTX levels are normally observed at night, we conducted bedtime studies in healthy
postmenopausal women. The objective was to study the effect of GLP-2 injection on bone turnover given at bedtime. A total of 81
postmenopausal women were included in two randomised placebo-controlled studies. In conclusion, we found a dose-related reduction of s-
CTX after injection of GLP-2 (P < 0.05) and osteocalcin levels was increased as compared to placebo (P = 0.07) by the treatment, suggestive
of a stimulative effect on bone formation. An area under the curve (AUC0–10 h) analysis for s-CTX after GLP-2 injection confirmed the dose-
related decrease as compared to placebo (P < 0.05).
D 2003 Elsevier Inc. All rights reserved.
Keywords: Bone resorption; Glucagon like peptide 2; Osteocalcin; Bone turnover markers; Bone formation
Introduction
Bone remodelling is a dynamic and continuous process.
Even a subtle perturbation of its balance can have pro-
gressive effects on bone mass and structure and may result
in metabolic bone disease. The acute increase in bone
resorption associated with the decline in endogenous
estrogen production at menopause is followed by a cou-
pled, but smaller increase in bone formation. The failure
of bone formation to fully compensate for the increased
bone resorption during this phase may eventually lead to
osteoporosis.
Biochemical assessment of bone turnover processes
shows a circadian pattern, with reduced bone resorption
during daytime followed by a nocturnal increase [1,12,
21,22]. The circadian pattern in the bone turnover processes
8756-3282/$ - see front matter D 2003 Elsevier Inc. All rights reserved.
doi:10.1016/j.bone.2003.09.009
* Corresponding author. Fax: +45-4454-8830.
E-mail addresses: [email protected] (D.B. Henriksen),
[email protected] (P. Alexandersen), [email protected] (I. Byrjalsen),
[email protected] (B. Hartmann), [email protected] (H.G. Bone),
[email protected] (C. Christiansen), [email protected] (J.J. Holst).
is of the same magnitude in men and women, and is not
affected by menopausal status in women [21]. However, the
circadian variation of bone resorption as assessed by the
serum concentration of fragments derived from the degra-
dation of the C-terminal telopeptide region of collagen type
I (s-CTX) [6] is significantly dampened in fasting individ-
uals [2,6,7,19]. The circadian variation of bone formation
follows the same pattern as bone resorption, but the mag-
nitude of the variation is less pronounced. Bone formation,
as assessed by serum osteocalcin, has been found to be
unaffected by ingestion of nutrients [2,6,7,19]. We have
previously shown that in fasting postmenopausal women, a
subcutaneous injection of the gastrointestinal hormone glu-
cagon-like peptide-2 (GLP-2) resulted in a significant and
acute reduction of bone resorption in a dose-related manner
with seemingly no significant effect on bone formation [11].
GLP-2 is a 33-amino acid polypeptide, corresponding to
amino acid 126–158 in proglucagon [10], and is released
from the intestine within minutes after food intake. It is
thought to serve, together with the other proglucagon-
derived peptides, in the regulation of absorption and dis-
posal of ingested nutrients [4,9,13].

D.B. Henriksen et al. / Bone 34 (2004) 140–147 141
The acute postprandial reduction of bone resorption
coincides with the release of GLP-2 from the intestine
[11]. Furthermore, the nocturnal increase in bone resorption
occurs during fasting when the circulating GLP-2 levels are
lowest. Thus, part of the circadian variation of bone resorp-
tion might result from the nutrient-induced release of GLP-2
during the non-fasting phase of the day. However, the
mechanism of such a physiologic role of GLP-2 is presently
unknown.
These observations suggested that GLP-2 might be
useful as a pharmacological agent for the regulation of bone
turnover processes.
To further investigate the effect of GLP-2 on bone
turnover, we conducted two placebo-controlled bedtime
studies in healthy postmenopausal women with different
GLP-2 dosages and injection schemes.
Materials and methods
Study subjects
We studied healthy postmenopausal women who had
undergone a natural menopause at least 5 years earlier and
had not taken any medication known to influence calcium
metabolism or gastrointestinal function for at least 6 months
before entry into the studies. All had a blood pressure at rest
below 170/100 mm Hg, a body mass index (BMI) between
20.1 and 30.3 kg/m2, and all gave their written informed
consent.
Study design
Both studies were approved by the regional Ethics
Committee and conducted according to the principles of
the Helsinki Declaration II. At a screening visit performed
Fig. 1. Flowchart study design. Eligible subjects were randomised into two groups r
10 h), lunch at 12:00 (x) and dinner at 18:00 (x). (A) The subjects in Study 1 receivsaline containing 800 Ag GLP-2. (B) The subjects in Study 2 received subcutaneou
or saline containing 800 Ag or 1600 Ag GLP-2. Throughout the study period the su
after the injection of the study medication at 22:00.
2–3 weeks before randomisation, each participant under-
went a medical programme including medication and med-
ical history, and a physical examination including blood
pressure and pulse, oral temperature, weight and height,
general laboratory blood sample (hematology and serum
chemistry), and urine sample analyses.
Study 1
A total of 36 women were included and randomly
assigned in blocks of 2 to treatment with either placebo
(physiological saline solution, 0.9% NaCl) or 800 Ag GLP-
2. Fig. 1A shows the study design. Placebo (1.0 ml) or GLP-
2 (1.0 ml) was given as a subcutaneous injection into the
periumbilical region. The study code was blinded for the
participants as well as the persons giving the injection,
recording adverse events, and performing physical exami-
nations. The data and results from all participants were
included in the final analysis. The principal part of the study
lasted for 24 h. On the day of treatment, the women were
instructed to report in the morning after fasting from 10 p.m.
the evening before. Initial blood samples were collected at
8.45 a.m. At 9 a.m. (9:00), noon (12:00), and 6 p.m. (18:00),
all participants were served regular fixed meals. In between
meals, participants were fasting but were allowed to drink
water. Blood samples were collected at 1, 3, 6, 9, 12, and 13
h after time point 0 (Fig. 1A). At the 13 h time point
(22:00), each participant received an injection of GLP-2 or
placebo and blood samples were collected after the injection
at 30, 60, 120, 180 min and every 3 h thereafter during the
night until the next morning. Time points and sampling
procedures are shown in Fig. 1A. Blood samples (serum and
plasma) were stored at �18jC until analysis. Information on
adverse clinical reactions of any kind was obtained by
interviewing the participants and performing serial physical
examinations. A final visit was scheduled at 1–2 weeks
eceiving breakfast in the morning at 9:00 (x) after overnight fast (minimally
ed a subcutaneous injection at 22:00 (*). The injection consisted of saline or
s injections at 22:00 (*) and at 01:00 (*). The injections consisted of saline
bjects were allowed to drink tap water. Blood sampling (E) was extensive
D.B. Henriksen et al. / Bone 34 (2004) 140–147142
after the study, where standard blood and urine tests for
assessment of safety parameters and physical examination
were performed and adverse clinical reactions registered.
Study 2
The study design, procedure, and meal schedule were as
described for Study 1 except for the injection schedule,
GLP-2 dosages, and the blood and urine sampling schedule.
A total of 45 women were included and randomly assigned
to treatment with either placebo (saline), 1600 Ag GLP-2 or
800 Ag GLP-2 twice (administered 3 h apart). Allocation
was in blocks of 3. Placebo (2 � 1.0 ml saline, administered
3 h apart, respectively), GLP-2/Placebo (1.0 ml containing
1600 Ag GLP-2 and 1.0 ml saline, administered 3 h apart,
respectively) or GLP-2/GLP-2 (2 � 1.0 ml containing 800
Ag GLP-2, administered 3 h apart, respectively) were given
as a subcutaneous injection in the periumbilical region. As
in Study 1, the study code was blinded for the participants as
well as the persons giving the injection, recording adverse
events, and performing physical examinations. Fig. 1B
shows the study design. At the 13-h time point (22:00),
participant received an injection of GLP-2 800 Ag, 1600 Agor placebo and blood samples were collected hourly after
the injection. At the 16-h time point (01:00, next day), each
participant received a second injection of saline (placebo
and 1600 Ag GLP-2 groups) or 800 Ag GLP-2 for the 800 +
800 Ag GLP-2 group. Hourly blood samplings were con-
tinued until 08:00 next day. In this study, we collected urine
samples at 0, 1, 3, 6, 9, 13, 14, 16, 17, 19, 21, and 23 h time
points, (Fig. 1B). Blood samples (serum and plasma) and
urine samples were stored at �18jC until analysis. Infor-
mation on adverse clinical reactions of any kind was
obtained by interviewing the participants and performing
serial physical examinations. The data of all participants
were included in the analysis. A final visit was scheduled at
1–2 weeks after the study, where standard blood and urine
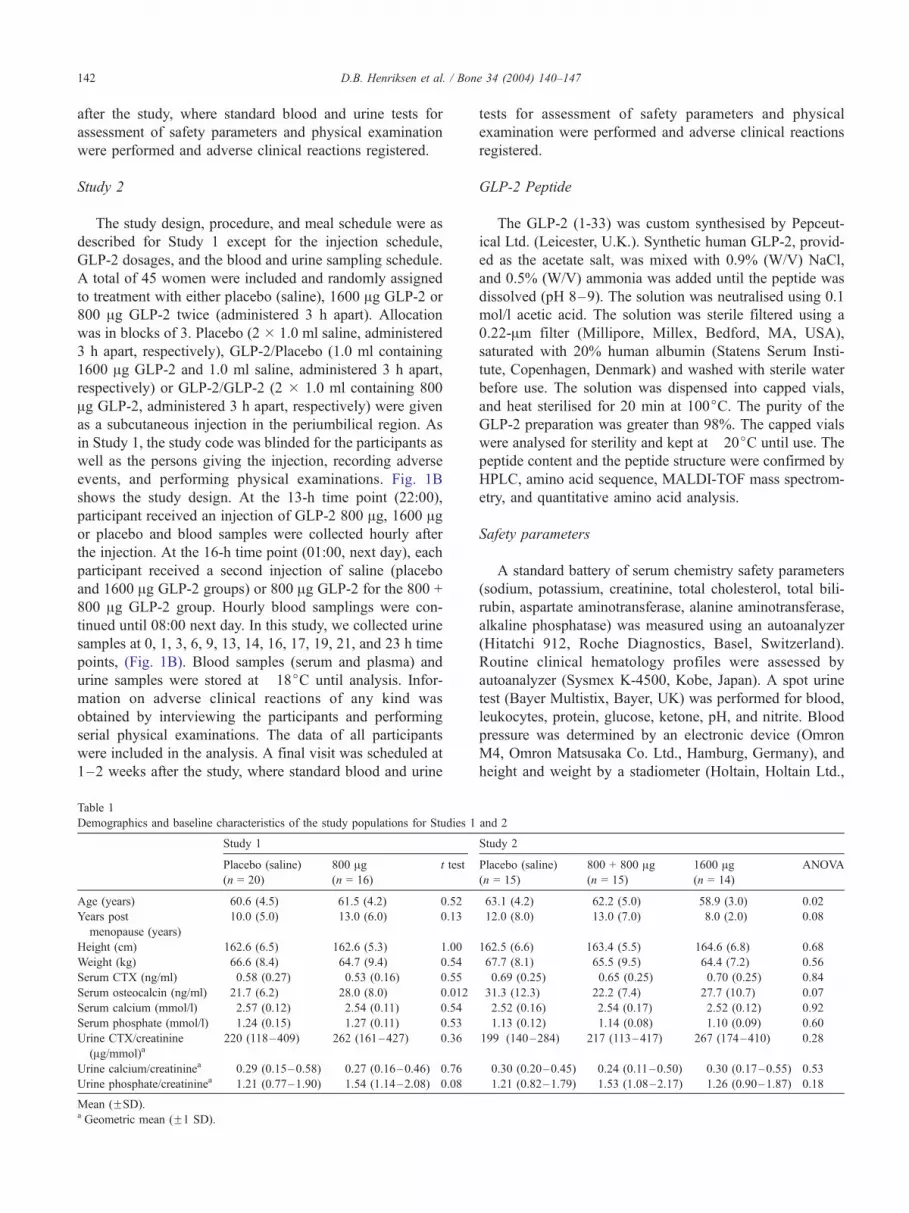
Table 1
Demographics and baseline characteristics of the study populations for Studies 1
Study 1
Placebo (saline)
(n = 20)
800 Ag(n = 16)
t test
Age (years) 60.6 (4.5) 61.5 (4.2) 0.52
Years post
menopause (years)
10.0 (5.0) 13.0 (6.0) 0.13
Height (cm) 162.6 (6.5) 162.6 (5.3) 1.00
Weight (kg) 66.6 (8.4) 64.7 (9.4) 0.54
Serum CTX (ng/ml) 0.58 (0.27) 0.53 (0.16) 0.55
Serum osteocalcin (ng/ml) 21.7 (6.2) 28.0 (8.0) 0.012
Serum calcium (mmol/l) 2.57 (0.12) 2.54 (0.11) 0.54
Serum phosphate (mmol/l) 1.24 (0.15) 1.27 (0.11) 0.53
Urine CTX/creatinine
(Ag/mmol)a220 (118–409) 262 (161–427) 0.36
Urine calcium/creatininea 0.29 (0.15–0.58) 0.27 (0.16–0.46) 0.76
Urine phosphate/creatininea 1.21 (0.77–1.90) 1.54 (1.14–2.08) 0.08
Mean (FSD).a Geometric mean (F1 SD).
tests for assessment of safety parameters and physical
examination were performed and adverse clinical reactions
registered.
GLP-2 Peptide
The GLP-2 (1-33) was custom synthesised by Pepceut-
ical Ltd. (Leicester, U.K.). Synthetic human GLP-2, provid-
ed as the acetate salt, was mixed with 0.9% (W/V) NaCl,
and 0.5% (W/V) ammonia was added until the peptide was
dissolved (pH 8–9). The solution was neutralised using 0.1
mol/l acetic acid. The solution was sterile filtered using a
0.22-Am filter (Millipore, Millex, Bedford, MA, USA),
saturated with 20% human albumin (Statens Serum Insti-
tute, Copenhagen, Denmark) and washed with sterile water
before use. The solution was dispensed into capped vials,
and heat sterilised for 20 min at 100jC. The purity of the
GLP-2 preparation was greater than 98%. The capped vials
were analysed for sterility and kept at �20jC until use. The
peptide content and the peptide structure were confirmed by
HPLC, amino acid sequence, MALDI-TOF mass spectrom-
etry, and quantitative amino acid analysis.
Safety parameters
A standard battery of serum chemistry safety parameters
(sodium, potassium, creatinine, total cholesterol, total bili-
rubin, aspartate aminotransferase, alanine aminotransferase,
alkaline phosphatase) was measured using an autoanalyzer
(Hitatchi 912, Roche Diagnostics, Basel, Switzerland).
Routine clinical hematology profiles were assessed by
autoanalyzer (Sysmex K-4500, Kobe, Japan). A spot urine
test (Bayer Multistix, Bayer, UK) was performed for blood,
leukocytes, protein, glucose, ketone, pH, and nitrite. Blood
pressure was determined by an electronic device (Omron
M4, Omron Matsusaka Co. Ltd., Hamburg, Germany), and
height and weight by a stadiometer (Holtain, Holtain Ltd.,
and 2
Study 2
Placebo (saline)
(n = 15)
800 + 800 Ag(n = 15)
1600 Ag(n = 14)
ANOVA
63.1 (4.2) 62.2 (5.0) 58.9 (3.0) 0.02
12.0 (8.0) 13.0 (7.0) 8.0 (2.0) 0.08
162.5 (6.6) 163.4 (5.5) 164.6 (6.8) 0.68
67.7 (8.1) 65.5 (9.5) 64.4 (7.2) 0.56
0.69 (0.25) 0.65 (0.25) 0.70 (0.25) 0.84
31.3 (12.3) 22.2 (7.4) 27.7 (10.7) 0.07
2.52 (0.16) 2.54 (0.17) 2.52 (0.12) 0.92
1.13 (0.12) 1.14 (0.08) 1.10 (0.09) 0.60
199 (140–284) 217 (113–417) 267 (174–410) 0.28
0.30 (0.20–0.45) 0.24 (0.11–0.50) 0.30 (0.17–0.55) 0.53
1.21 (0.82–1.79) 1.53 (1.08–2.17) 1.26 (0.90–1.87) 0.18

Fig. 2. Effect of subcutaneous injection of GLP-2 in Study 1 on s-CTX and
osteocalcin levels in healthy postmenopausal individuals for the time period
after injection given at 22:00. The figure shows results of subcutaneous
injection of GLP-2 in 800 Ag GLP-2 (5) or placebo (saline) (n). (A) s-CTX
concentrations expressed as % of values at the time of injection. Repeated
measures ANOVAwas P = 0.08; (B) s-osteocalcin concentrations expressed
as % of values at the time of injection. Repeated measures ANOVAwas P =
0.86. Data are mean F SEM. * P < 0.05 compared to placebo.
D.B. Henriksen et al. / Bone 34 (2004) 140–147 143
UK, F 0.5 cm) and an electronic scale (Seca 708, Seca
Corp., MD, F 0.5 kg).
Efficacy parameters
Efficacy measurements included markers of bone resorp-
tion, that is, urine CrossLaps ELISA (u-CTX) and Serum
CrossLaps One Step ELISAk (s-CTX), (Nordic Bioscience
A/S, Herlev, Denmark), and a marker of bone formation,
that is, Osteocalcin N-MID ELISA (s-OC), (Nordic Biosci-
ence A/S). The intra- and inter-assay coefficients of varia-
tion (CV’s) of these assays are in the range 3–5% and 6–
10%, respectively. Urine calcium, phosphate, and creatinine
were measured by standard methods. Plasma GLP-2 con-
centration measurements were performed using a specific
NH2-terminal radioimmunoassay as previously described
[10,23]. The intra- and inter-assay CVs for the GLP-2
RIA are both 5%.
Statistical analysis
The biochemical markers of bone resorption and forma-
tion, that is, s-CTX and s-osteocalcin, were expressed as
percent of the baseline value of the individual subject. A
multivariate test for repeated measures of variance of s-CTX
and s-osteocalcin were carried out by the General Linear
Model to assess the time course dependency, intervention
effect, and the interaction between time and intervention
effect. In addition, the effect of the given intervention as
compared with placebo control was assessed by two-tailed
Student’s t test for unpaired data for selected time points.
The concentrations of calcium, phosphate, and CrossLaps
measured in urine samples were normalized by the creati-
nine concentration. All parameters measured in the serum
and urine samples were expressed in percent of baseline
values, either relative to study start at 09:00 for assessment
of circadian variation, or to time of injection at 22:00 for
assessment of the treatment effect. The area under the curve
(AUC) of each parameter measured in serum samples was
calculated with the trapezoidal method, and the AUC of the
parameters measured in urine samples was calculated as the
concentration (or change) multiplied by the time period
representing the sample, that is, time period elapsed since
previous sampling. For assessment of the time course of the
efficacy parameters, a multivariate test for repeated meas-
ures of variance was carried out by the General Linear
Model to assess the time course dependency, intervention
effect, and interaction between time and intervention effect
(SAS Institute Inc., Cary, NC, USA, 1999–2001). The
assessment of the time courses of the parameters measured
in urine was performed on logarithmically transformed
values to obtain normality and homogeneity of variance.
If significant differences were found, the two-tailed Stu-
dent’s t test for unpaired data was used for assessment of
statistical significance of the effect of intervention as com-
pared with the control.
Results
Baseline characteristics for the studies are presented in
Table 1. The treatment groups were comparable at baseline,
except for some variability in the serum osteocalcin levels
for Study 1 and age for Study 2. In Study 1, the active
treatment group was slightly higher in urine phosphate than
the placebo group (P = 0.08), while in Study 2, the 800 +
800 Ag GLP-2 group was slightly older and the 1600-Aggroup was younger than the placebo group (P = 0.08). The
mean serum osteocalcin level was higher for the active-
treatment subjects in Study 1, but in Study 2, it was lower in
the 800 + 800 Ag GLP-2 group versus placebo.
Before the injection of GLP-2 or saline in both studies,
the participants were served regular meals at 9:00, 12:00,
and 18:00 (Fig. 1). The serum samples were analysed for s-
CTX and s-osteocalcin levels, and values were normalised
to the sample taken immediately before the first meal (9:00).
The s-CTX level revealed no differences in the food-
induced effect among the groups in any of the studies

D.B. Henriksen et al. / Bone 34 (2004) 140–147144
(ANOVA, P = 0.57). The placebo groups of the two studies
showed no differences and reveal an identical nocturnal
increase in s-CTX. The meal at 18:00 resulted in a slight
reduction of s-CTX not seen in any of the previous studies
of the s-CTX circadian variation [2,6]. The pattern of
variation in the s-osteocalcin levels of this time period
was similar in all groups in both studies (ANOVA, P =
0.39, data not shown).
Study 1
The effect of 800 Ag GLP-2 transiently suppressed the
nocturnal rise in s-CTX level with a difference between the
GLP-2 and placebo groups at 3 h after injection (P = 0.01),
but s-CTX was similar in the two groups after 6 h, (Fig. 2A).
Bone formation as measured by s-osteocalcin was unaffect-
ed by GLP-2 treatment (P = 0.57), but the level in the
treated group tended to be higher than the placebo group
(Fig. 2B). Both creatinine-corrected urine calcium and
Fig. 3. Effect of subcutaneous injection of GLP-2 in Study 2 on s-CTX, u-CTX, o
time period after injection given at 22:00. The figure shows results of subcutaneous
2 � 800 Ag GLP-2 (administered 3 h apart) (n) or placebo (saline) (.). (A) s-CT(22:00). Repeated measures ANOVA, P = 0.0001; and P values for the individua
GLP-2), and P = 0.03 (2 � 800 Ag GLP-2), respectively. (B) U-CTX concentration
(22:00). Repeated measures ANOVA, P < 0.0001; and P values for the individua
GLP-2), and P = 0.002 (2 � 800 Ag GLP-2), respectively. (C) s-osteocalcin conce
Repeated measures ANOVA, P = 0.0001 and P values for the individual treatment
P = 0.08 (2 � 800 Ag GLP-2), respectively. (D) Plasma levels of GLP-2 after sub
time period up to 10 h after injection given at 22:00. The actual values of subcutan
shown. Data are presented as mean F SEM. * P < 0.05 and ** P < 0.01 compa
phosphate declined after GLP-2 injection. The nocturnal
rise in urine calcium excretion was attenuated, but not
different from the placebo group. However, there was an
acute reduction of urine phosphate levels during the first 2
h after GLP-2 injection (P = 0.0006–0.002). This effect was
transient and urine phosphate levels returned to normal
levels after 6 h (data not shown).
Study 2
In both the 800 + 800 Ag GLP-2 group and the 1600 Agsingle-dose group, GLP-2 treatment in this study induced a
decrease in the nocturnal rise in s-CTX, which was sus-
tained throughout the night (Fig. 3A). In both GLP-2
groups, a significant reduction in s-CTX (P < 0.05) com-
pared to placebo was observed 3 h after injection, indicating
an acute suppression of bone resorption. This reduction in
the s-CTX levels was more prolonged in the 1600-Ag GLP-2group and s-CTX was suppressed during the night in both
steocalcin and GLP-2 levels in healthy postmenopausal individuals for the
injection of GLP-2 in two different dosing schemes: 1600 Ag GLP-2 (5) or
X concentrations were expressed as % of value determined at injection time
l treatment groups as compared to saline controls were P = 0.004 (1600 Ags (creatinine-corrected) expressed as % of value determined at injection time
l treatment groups as compared to saline controls were P = 0.01 (1600 Agntrations were expressed as % of value determined at injection time (22:00).
groups as compared to saline controls were P = 0.11 (1600 Ag GLP-2) and
cutaneous injection of GLP-2 in healthy postmenopausal individuals for the
eous injections of GLP-2 (1600 Ag and 2 � 800 Ag) or placebo (saline) are
red to placebo.

D.B. Henriksen et al. / Bone 34 (2004) 140–147 145
treatment groups. Urine CTX (corrected for creatinine
excretion) revealed the same pattern as seen for s-CTX with
a similar reduction in the nocturnal rise in bone resorption,
(Fig. 3B). In both GLP-2 groups, a reduction in u-CTX
compared to placebo was observed at 4 h after injection
(P < 0.01) and this effect was sustained through the night in
both treatment groups. S-osteocalcin levels were increased
in both GLP-2 treatment groups, as compared to the placebo
control group, (Fig. 3C). In both GLP-2 groups, an increase
in s-osteocalcin compared to placebo (P < 0.05) was
observed at 5 h after injection, and this was sustained at
the 6-h time point for the 800+800 Ag GLP-2 group (P <
0.01). The plasma level of GLP-2 reflected the dosing
schedule used in the study, (Fig. 3D). The 1600-Ag GLP-2
group reached a peak plasma concentration of 3300 pM and
the GLP-2 concentration was below 125 pM in the placebo
control group, (LDL = 125 pM GLP-2 at the degree of
dilution required for accurate measurement at high concen-
trations). The GLP-2 plasma concentration for the 800 +
800 Ag GLP-2 group resulted in a mean peak plasma GLP-2
concentration of 1500 pM after the 22:00 injection and 1600
pM GLP-2 after the 01:00 injection 3 h later.
Urine calcium excretion (corrected for creatinine)
showed a similar pattern as for u-CTX with a reduction of
urine calcium level after injection of GLP-2 (P = 0.009),
(data not shown). The nocturnal increase in calcium excre-
tion seen for the placebo group coincided with the increase
in u-CTX and s-CTX, and this increase in urine calcium was
eliminated for the 1600 Ag GLP-2 group. The urine calcium
level for the 800 + 800 Ag GLP-2 group reflected the
injection scheme and showed a more transient pattern. The
urine phosphate excretion (corrected for creatinine) was
reduced after GLP-2 injection in both treatment groups
(P = 0.002) and for the 1600-Ag GLP-2 group, this effect
was different from placebo for the first 3 h (P = 0.005–
0.03), (data not shown).
Area under the curve (AUC) analysis (placebo cor-
rected) for s-CTX at 0–3, 0–6, and 0–10 h after injection
of 1600 Ag and 800 + 800 Ag GLP-2 showed an accumu-
lative effect during the night. For the 1600-Ag GLP-2 group,
the AUC0–6 h was different from placebo (P = 0.03) and this
was sustained for AUC0–10 h (P = 0.07), (Fig. 4A). The
AUC analysis for u-CTX revealed the same integrated
reduction in CTX after GLP-2 injection for both groups.
The AUC at 0–3, 0–6 and 0–10 h after injection showed
Fig. 4. Accumulated effect of subcutaneous injection of GLP-2 in Study 2
on s-CTX, u-CTX and osteocalcin in healthy postmenopausal individuals
for the time period up to 10 h after injection given at 22:00. The figures
show results of the area-under-curve (AUC) analyses at 3, 6, and 10 h after
subcutaneous injections of GLP-2 (1600 Ag or 2 � 800 Ag) adjusted for
placebo. (A) s-CTX, t-test for the 1600 Ag GLP-2 group as compared to
placebo yielded P = 0.03–0.08 and P = 0.11–0.28 for the 2 � 800 Ag GLP-2 group. (B) u-CTX, t test for the 1600 Ag GLP-2 group as compared to
placebo controls yielded P = 0.02–0.08 and P = 0.11–0.28 for the 2 �800
Ag GLP-2 group. (C) osteocalcin, t test for the 1600 Ag GLP-2 group as
compared to placebo controls yielded P = 0.08–0.15 and P = 0.07–0.17 for
the 2 � 800 Ag GLP-2 group.
an accumulative effect difference from placebo (P < 0.05)
for both treatment groups at all time intervals (Fig. 4B).
AUC analyses for urine calcium (creatinine corrected)

D.B. Henriksen et al. / Bone 34 (2004) 140–147146
showed an accumulated reduction in the excretion for both
treatments groups similar to the u-CTX and, for the 1600 AgGLP-2 group, the AUC0–6 h and AUC0–10 h were different
from placebo (P = 0.05 and P = 0.02, respectively, data not
shown). Urine phosphate excretion (creatinine-corrected)
revealed a transient decrease in the AUC analysis. The
AUC0–3 h and AUC0–6 h were different from placebo for
both treatment groups (P = 0.006–0.07, data not shown).
AUC analysis (placebo-corrected) for s-osteocalcin at 0–
3, 0–6 and 0–10 h after injection (P = 0.04–0.13) revealed
an accumulated increase in s-osteocalcin level throughout
the night, (Fig. 4C). AUC0–3 h for s-osteocalcin suggests a
dose-dependent effect of GLP-2 on bone formation.
Discussion
Several studies have attempted to define the circadian
pattern of bone turnover. It has been shown that skeletal
unloading obtained through a 5-day bed rest or weightless-
ness during space flight did not alter the circadian variation
of bone resorption [5,21]. The circadian variation of bone
resorption was also found to be independent of age and
menopausal status [1,21], serum cortisol [12,20], and serum
PTH level [14,15]. Melatonin has also been implied as a
possible mediator of the circadian variation of bone turnover
[16]. The plasma concentration of melatonin at night is 10–
50 times higher than during the daytime [18] and this
coincides with increased bone resorption. Thus, melatonin
may be involved in the regulation of osteoclast activity,
which could explain the increased nocturnal bone resorp-
tion. However, the circadian variation of bone resorption is
significantly dampened in fasting individuals and the noc-
turnal increase in bone resorption is nearly eliminated
[6,19]. In contrast, bone formation as reflected in serum
osteocalcin levels has a less-pronounced circadian variation
than does s-CTX with amplitude of only approximately 10%
from baseline. In addition, no meal-induced variation has
been observed for this marker of bone formation [2,6,8].
Thus, based on the biochemical assessment of these pro-
cesses, food intake results in an uncoupling of the bone
formation and bone resorption.
The nocturnal increase in bone resorption, as observed in
both placebo groups, could be a consequence of the insuf-
ficient access to nutrients and minerals to maintain the
plasma calcium homeostasis and proliferative processes like
haematopoiesis and epithelial renewal. In this situation, the
mobilisation of skeletal stores of nutrients and minerals can
be brought about by stimulation of osteoclastic bone resorp-
tion [3,17]. Postprandial supplies of these nutrients and
minerals, on the other hand, abolish the need to harvest
from the skeletal stores resulting in an acute reduction of
bone resorption. In our Studies 1 and 2, an acute postpran-
dial reduction in bone resorption after intermediate fasting
was found and the greatest reduction was observed after 10
h fasting (i.e., at the breakfast meal). Lunch at 12:00 (after 3
h fasting) did not result in a decrease of s-CTX in contrast to
the dinner meal at 18:00 (after 6 h fasting), which resulted in
an intermediate decrease in the s-CTX. Thus, the length of
the fasting period seems to be important for the magnitude
of the response.
Several hormones are released in response to the inges-
tion of nutrients. Of these, recent investigations have shown
that insulin is unable to influence the bone resorption
process [2,8]. We found that bone turnover was unaffected
by subcutaneous injection of the gastrointestinal hormone
glucagon-like peptide-1 (GLP-1), as well as intravenous
injection of glucose-dependent insulinotropic polypeptide
(GIP) [11]. However, a subcutaneous injection of GLP-2
resulted in a significant and acute reduction of the bone
resorption (s-CTX) in a dose-dependent manner and with no
apparent effect on bone formation as assessed by osteocalcin
[11]. In that investigation, the acute reduction was also
found for u-DPD/creatinine after injection of GLP-2 and
this marker of bone resorption show changes of approxi-
mately the same magnitude and time course as those found
for s-CTX.
The rational for the study design for both studies was to
investigate whether a fixed meal and sampling schedule
would provide additional information about the food-in-
duced reduction of s-CTX and whether GLP-2 injection at
bedtime would result in similar effects on bone reduction
and formation as seen for injections given in the morning
[11]. Furthermore, participants in the previous study with
exogenous GLP-2 were all fasting before the injection and
thus non-fasting might influence the effect of GLP-2 on
bone turnover. Our data indicate that injection of 800 AgGLP-2 at bedtime for non-fasting individuals resulted in a
comparable reduction in s-CTX (Fig. 2A), as observed for
800 Ag GLP-2 given in the morning after a fasting period.
[11] An AUC analysis for the first 3 h after GLP-2 injection
did not reveal a difference between individuals treated in the
morning or at bedtime (P = 0.84, data not shown).
The 800 + 800 Ag GLP-2 dosing regime in Study 2 was
designed to resemble administration of a slow release
formulation of GLP-2 to investigate the response in bone
turnover markers after GLP-2, given by such a formulation.
The time course (Figs. 3A and B) and AUC analyses (Figs.
4A and B) revealed that both 800 + 800 Ag and 1600 AgGLP-2 have a similar response about the reduction of bone
resorption for both s-CTX and u-CTX. Furthermore, in the
current studies, we found that the nocturnal rise in urine
calcium was reduced and approximately normalised to the
level at injection time after treatment with GLP-2, which
should also be the case if the output of calcium resulting
from the bone resorption process was reduced. Urine
phosphate showed a similar response to treatment with
GLP-2 and for this parameter, the acute response was
significant (P = 0.0006), although transient.
At the same time, the osteocalcin levels were increased
compared to placebo for treatment with both 1600 Ag and
800 + 800 Ag GLP-2, (Fig. 3C). This response of osteo-

D.B. Henriksen et al. / Bone 34 (2004) 140–147 147
calcin to GLP-2 treatment was especially evident from the
placebo-subtracted AUC analysis for the 1600 Ag GLP-2
group (P = 0.02), (Fig. 4C) and these results indicate a
dose-dependent effect of GLP-2 on the bone formation
process.
These intriguing data confirm that GLP-2 does affect the
bone turnover processes even when given in the evening.
Interestingly, the observations suggest that bone resorption
is reduced while bone formation is not decreased but
actually appears to be increased by treatment with exoge-
nous GLP-2. Given that nocturnal increase in bone resorp-
tion reflects the highest activity level of the osteoclasts, we
speculate that a reduction of bone resorption during the
night could have an overall positive influence on the bone
health. Furthermore, this line of thought would predict that
treatment modalities, which, on one hand, reduces bone
resorption and, on the other hand, increase bone formation,
would have an even more positive impact on skeletal
health. Hence, these present findings may have a signifi-
cant importance for understanding mechanisms of post-
prandial bone turnover regulation, and for providing new
options for therapeutic intervention in preventing and
treating osteoporosis.
Acknowledgments
We gratefully acknowledge the excellent technical
assistance provided by Pia M. Hansen and Lone Bagger.
References
[1] Aoshima H, Kushida K, Takahashi M, Ohishi T, Hoshino H, Suzuki
M, et al. Circadian variation of urinary type I collagen crosslinked C-
telopeptide and free and peptide-bound forms of pyridinium cross-
links. Bone 1998;22:73–8.
[2] Bjarnason NH, Henriksen EE, Alexandersen P, Christgau S, Henrik-
sen DB, Christiansen C. Mechanism of circadian variation in bone
resorption. Bone 2002;30:307–13.
[3] Burr DB. Targeted and nontargeted remodeling. Bone 2002;30:2–4.
[4] Burrin DG, Petersen Y, Stoll B, Sangild P. Glucagon-like peptide 2: a
nutrient-responsive gut growth factor. J Nutr 2001;131:709–12.
[5] Caillot-Augusseau A, Vico L, Heer M, Voroviev D, Souberbielle JC,
Zitterman A, et al. Space flight is associated with rapid decreases of
undercarboxylated osteocalcin and increases of markers of bone re-
sorption without changes in their circadian variation: observations in
two cosmonauts. Clin Chem 2000;46:1136–43.
[6] Christgau S, Bitsch-Jensen O, Bjarnason NH, Henriksen EG, Qvist
P, Alexandersen P, et al. Serum CrossLaps for monitoring the re-
sponse in individuals undergoing antiresorptive therapy. Bone
2000;26:505–11.
[7] Clowes JA, Hannon RA, Yap TS, Hoyle NR, Blumsohn A, Eastell R.
Effect of feeding on bone turnover markers and its impact on bio-
logical variability of measurements. Bone 2002;30:886–90.
[8] Clowes JA, Robinson RT, Heller SR, Eastell R, Blumsohn A. Acute
changes of bone turnover and PTH induced by insulin and glucose:
euglycemic and hypoglycemic hyperinsulinemic clamp studies. J Clin
Endocrinol Metab 2002;87:3324–9.
[9] Drucker DJ. Biological actions and therapeutic potential of the glu-
cagon-like peptides. Gastroenterology 2002;122:531–44.
[10] Hartmann B, Johnsen AH, Orskov C, Adelhorst K, Thim L, Holst JJ.
Structure, measurement, and secretion of human glucagon-like pep-
tide-2. Peptides 2000;21:73–80.
[11] Henriksen DB, Alexandersen P, Bjarnason NH, Vilsboll T, Hart-
mann B, Henriksen EG, et al. Role of Gastrointestinal Hormones
in Postprandial Reduction of Bone Resorption. J Bone Miner Res
[in press].
[12] Heshmati HM, Riggs BL, Burritt MF, McAlister CA, Wollan PC,
Khosla S. Effects of the circadian variation in serum cortisol on
markers of bone turnover and calcium homeostasis in normal postme-
nopausal women. J Clin Endocrinol Metab 1998;83:751–6.
[13] Holst JJ. Gut hormones as pharmaceuticals. From enteroglucagon to
GLP-1 and GLP-2. Regul Pept 2000;93:45–51.
[14] Lakatos P, Blumsohn A, Eastell R, Tarjan G, Shinoda H, Stern PH.
Circadian rhythm of in vitro bone-resorbing activity in human serum.
J Clin Endocrinol Metab 1995;80:3185–90.
[15] Ledger GA, Burritt MF, Kao PC, O’Fallon WM, Riggs BL, Khosla S.
Role of parathyroid hormone in mediating nocturnal and age-related
increases in bone resorption. J Clin Endocrinol Metab 1995;80:
3304–10.
[16] Ostrowska Z, Kos-Kudla B, Swietochowska E, Marek B, Kajdaniuk
D, Gorski J. Assessment of the relationship between dynamic pattern
of nighttime levels of melatonin and chosen biochemical markers of
bone metabolism in a rat model of postmenopausal osteoporosis.
Neuroendocrinol Lett 2001;22:129–36.
[17] Parfitt AM. Targeted and nontargeted bone remodeling: relationship
to basic multicellular unit origination and progression. Bone 2002;
30:5–7.
[18] Reiter RJ. Pineal melatonin: cell biology of its synthesis and of its
physiological interactions. Endocr Rev 1991;12:151–80.
[19] Schlemmer A, Hassager C. Acute fasting diminishes the circadian
rhythm of biochemical markers of bone resorption. Eur J Endocrinol
1999;140:332–7.
[20] Schlemmer A, Hassager C, Alexandersen P, Fledelius C, Pedersen BJ,
Kristensen IO, et al. Circadian variation in bone resorption is not
related to serum cortisol. Bone 1997;21:83–8.
[21] Schlemmer A, Hassager C, Pedersen BJ, Christiansen C. Posture, age,
menopause, and osteopenia do not influence the circadian variation in
the urinary excretion of pyridinium crosslinks. J Bone Miner Res
1994;9:1883–8.
[22] Wichers M, Schmidt E, Bidlingmaier F, Klingmuller D. Diurnal
rhythm of CrossLaps in human serum. Clin Chem 1999;45:1858–60.
[23] Wojdemann M, Wettergren A, Hartmann B, Holst JJ. Glucagon-like
peptide-2 inhibits centrally induced antral motility in pigs. Scand J
Gastroenterol 1998;33:828–32.