Changes in nocturnal insect communities in forest-dominated ...
10
SHORT COMMUNICATION Open Access Changes in nocturnal insect communities in forest-dominated landscape relevant to artificial light intensity Lee Hakbong 1,2 , Cho Yong-Chan 1* , Jung Sang-Woo 3 , Kim Yoon-Ho 3 and Lee Seung-Gyu 4 Abstract Background: Artificial light at night has recently been identified as a major factor adversely affecting global insect diversity. Here, we compared the insect diversity in Gwangneung Forest Biosphere Reserve, specifically in the Korea National Arboretum (with no artificial light at night), with that of three nearby urban sites with a gradient of artificial light at night (five locations at each site). We analyzed the effects of the artificial night lighting index, mean annual temperature, and field light intensity (lux) at night on the insect community structure. Results: The urban sites generally exhibited higher species richness and abundance as well as clear indicator species compared with the control site. The size distribution of the collected insects markedly differed between the control and the three urban sites. The abundance of herbivorous and omnivorous insects increased and decreased, respectively, with the increase in light intensity. Species richness of herbivorous and omnivorous insects was likely correlated with the field light intensity at night and artificial night lighting index, respectively. Conclusions: This study demonstrates the association between nighttime environment and marked changes in insect community structure and revealed consequent transition of ecosystem services by changes in trophic group composition. Keywords: Artificial light at night, Biosphere reserve, Insect diversity, Protected area, Urbanization Background Insect species diversity and abundance are showing rap- idly declining trends in all habitats (Hallmann et al. 2017). Although habitat loss, pollution, invasive species, and climate change have recently been identified as major drivers of the decline, the effect of artificial light at night (ALAN), which has never occurred before in evolutionary time scales, is relatively overlooked (Owens et al. 2020). ALAN, from streetlights, car headlights, and signs, is correlated with urban expansion (Elvidge et al. 2014) and is now widespread (Falchi et al. 2016; Davies and Smyth 2018). Approximately 90% of Europe and 50% of the USA are exposed to various light sources at night (Falchi et al. 2016). In Korea, the ratio of land area exposed to light pollution is the second largest in the world, and the geographical and social characteristics of small land area, urbanization, and high-density popula- tion are the main causes of light pollution (Government of Korea 2018). Furthermore, approximately 60% of in- vertebrate species worldwide are active at nighttime (Hölker et al. 2010). Thus, ALAN can affect not only the biological traits of these species, such as physiology (Eisenbeis and Hänel 2009), behavior (Yoon et al. 2010; Russo et al. 2019), and reproduction (Witherington 1992; Mbugua et al. 2020) but also their ecological com- munities (Davies et al. 2012). However, because of a bias toward studies on diurnal species, the effect of ALAN on whole ecological communities remains relatively less ex- tensively studied (Sanders and Gaston 2018; Owens et al. 2020). © The Author(s). 2021 Open Access This article is licensed under a Creative Commons Attribution 4.0 International License, which permits use, sharing, adaptation, distribution and reproduction in any medium or format, as long as you give appropriate credit to the original author(s) and the source, provide a link to the Creative Commons licence, and indicate if changes were made. The images or other third party material in this article are included in the article's Creative Commons licence, unless indicated otherwise in a credit line to the material. If material is not included in the article's Creative Commons licence and your intended use is not permitted by statutory regulation or exceeds the permitted use, you will need to obtain permission directly from the copyright holder. To view a copy of this licence, visit http://creativecommons.org/licenses/by/4.0/. * Correspondence: [email protected] 1 Restoration Center for Endangered Species, National Institute of Ecology, Yeongyang 36531, South Korea Full list of author information is available at the end of the article Journal of Ecology and Environment Hakbong et al. Journal of Ecology and Environment (2021) 45:24 https://doi.org/10.1186/s41610-021-00207-9
-
Upload
khangminh22 -
Category
Documents
-
view
0 -
download
0
Transcript of Changes in nocturnal insect communities in forest-dominated ...
SHORT COMMUNICATION Open Access
Changes in nocturnal insect communitiesin forest-dominated landscape relevant toartificial light intensityLee Hakbong1,2, Cho Yong-Chan1*, Jung Sang-Woo3, Kim Yoon-Ho3 and Lee Seung-Gyu4
Abstract
Background: Artificial light at night has recently been identified as a major factor adversely affecting global insectdiversity. Here, we compared the insect diversity in Gwangneung Forest Biosphere Reserve, specifically in the KoreaNational Arboretum (with no artificial light at night), with that of three nearby urban sites with a gradient ofartificial light at night (five locations at each site). We analyzed the effects of the artificial night lighting index, meanannual temperature, and field light intensity (lux) at night on the insect community structure.
Results: The urban sites generally exhibited higher species richness and abundance as well as clear indicatorspecies compared with the control site. The size distribution of the collected insects markedly differed between thecontrol and the three urban sites. The abundance of herbivorous and omnivorous insects increased and decreased,respectively, with the increase in light intensity. Species richness of herbivorous and omnivorous insects was likelycorrelated with the field light intensity at night and artificial night lighting index, respectively.
Conclusions: This study demonstrates the association between nighttime environment and marked changes ininsect community structure and revealed consequent transition of ecosystem services by changes in trophic groupcomposition.
Keywords: Artificial light at night, Biosphere reserve, Insect diversity, Protected area, Urbanization
BackgroundInsect species diversity and abundance are showing rap-idly declining trends in all habitats (Hallmann et al.2017). Although habitat loss, pollution, invasive species,and climate change have recently been identified asmajor drivers of the decline, the effect of artificial lightat night (ALAN), which has never occurred before inevolutionary time scales, is relatively overlooked (Owenset al. 2020). ALAN, from streetlights, car headlights, andsigns, is correlated with urban expansion (Elvidge et al.2014) and is now widespread (Falchi et al. 2016; Daviesand Smyth 2018). Approximately 90% of Europe and50% of the USA are exposed to various light sources at
night (Falchi et al. 2016). In Korea, the ratio of land areaexposed to light pollution is the second largest in theworld, and the geographical and social characteristics ofsmall land area, urbanization, and high-density popula-tion are the main causes of light pollution (Governmentof Korea 2018). Furthermore, approximately 60% of in-vertebrate species worldwide are active at nighttime(Hölker et al. 2010). Thus, ALAN can affect not only thebiological traits of these species, such as physiology(Eisenbeis and Hänel 2009), behavior (Yoon et al. 2010;Russo et al. 2019), and reproduction (Witherington1992; Mbugua et al. 2020) but also their ecological com-munities (Davies et al. 2012). However, because of a biastoward studies on diurnal species, the effect of ALAN onwhole ecological communities remains relatively less ex-tensively studied (Sanders and Gaston 2018; Owenset al. 2020).
© The Author(s). 2021 Open Access This article is licensed under a Creative Commons Attribution 4.0 International License,which permits use, sharing, adaptation, distribution and reproduction in any medium or format, as long as you giveappropriate credit to the original author(s) and the source, provide a link to the Creative Commons licence, and indicate ifchanges were made. The images or other third party material in this article are included in the article's Creative Commonslicence, unless indicated otherwise in a credit line to the material. If material is not included in the article's Creative Commonslicence and your intended use is not permitted by statutory regulation or exceeds the permitted use, you will need to obtainpermission directly from the copyright holder. To view a copy of this licence, visit http://creativecommons.org/licenses/by/4.0/.
* Correspondence: [email protected] Center for Endangered Species, National Institute of Ecology,Yeongyang 36531, South KoreaFull list of author information is available at the end of the article
Journal of Ecologyand Environment
Hakbong et al. Journal of Ecology and Environment (2021) 45:24 https://doi.org/10.1186/s41610-021-00207-9
Despite the lack of strong evidence demonstrating theecological effect of ALAN on invertebrates, some recentstudies have reported changes in insect communitiesdue to ALAN (Davies et al. 2012; Holzhauer et al. 2015;Spoelstra et al. 2015; Plummer et al. 2016; De Medeiroset al. 2016; Sanders et al. 2018; Firebaugh and Haynes2020). For example, ALAN has affected the compositionof arthropod communities, leading to increases in theabundance of predatory and scavenging arthropods (Da-vies et al. 2012). Holzhauer et al. (2015) reported thatspecific groups of insects [e.g., beetles (Coleoptera), flies(Diptera), and bugs (Hemiptera)] were more abundant atsites with artificial light than in those without artificiallight and that such sites were characterized by high in-sect abundance compared with those without artificiallight. Plummer et al. (2016) and De Medeiros et al.(2016) demonstrated that radiations from ultravioletlight at night attracted large numbers of moths (Lepi-doptera) and beetles (Coleoptera), respectively, likely re-ducing insect diversity. Furthermore, Sanders et al.(2018) showed that ALAN increased the density ofaphids, changing the food web structure.In contrast to studies reporting changes in insect com-
munities due to ALAN, there were also studies that re-ported no effective change due to ALAN. For example,moth communities sensitive to light were not influencedby ALAN (Spoelstra et al. 2015). Firebaugh and Haynes(2020) monitored changes in an arthropod communityunder ALAN for 2 years, and they did not observe anyeffect of ALAN on the abundance of herbivores or pred-ators. Studies reporting the effect of ALAN on insectcommunities were generally conducted by controlled ex-periment by installation of artificial light sources; thus,field experiments in real-world situation were needed.The present study was conducted in Gwangneung For-
est Biosphere Reserve, one of the major areas for bio-diversity protection in South Korea. The reserve consistsof an area without artificial lighting (Korea National Ar-boretum) and several urbanized and light-polluted areas.The Korea National Arboretum has not containedALAN since the 1990s, although the night light condi-tions in areas adjacent to the arboretum have changedconsiderably over the past few decades. This environ-mental gradient has been maintained across Gwang-neung Forest Biosphere Reserve for a long time, andtherefore, the insect communities present in these areasreflect the ecological effects of ALAN as well asurbanization on insect communities over the last fewdecades.In the present study, we identified the ecological effect
of ALAN on insect communities in Gwangneung ForestBiosphere Reserve including a control site (no ALAN)and three nearby sites along a gradient of developmentsituations (DS). We aimed to determine the following:
(1) how insect species richness and abundance and indi-cator species differ along the gradient of sites; (2) whichof the potential environmental factors [e.g., temperature,artificial night lighting index (ANLI), and field light in-tensity] cause differences in the community structure ofnocturnal insects in the study area; (3) how distributionof insect body size differs along the gradient of sites; (4)how the composition of trophic groups differs along thegradient of sites; and (5) which factors significantly affectchanges in the composition of trophic groups.
Materials and methodsStudy areaWe conducted field surveys in Gwangneung Forest Bio-sphere Reserve in June and August 2017. The mean an-nual temperature and precipitation for this area were12.2 °C and 1387.9 mm, respectively (Cho et al. 2020).
Site descriptionWe selected the exhibition garden in the Korea NationalArboretum as a control site, and three urban sites withdifferent DS, namely, Neungnae Village (DS1), JikdongSamgeori (DS2), and Gwangneungnae (DS3) (Fig. 1).The area of each site was 100 ha. The distance from thecenter of the control site to the nearest light source(convenience store) is 1 km, and the streetlight on theroad where cars sometimes travel is 600 m. The otherthree sites received diverse levels of ALAN from varioussources, such as streetlights, shops, residential areas, andvehicular traffic. The DS1 site was surrounded by a for-est and included commercial and residential buildingswith some two-way, two-lane roads and streetlights.There was no artificial lighting on the roads outside theDS1 site. The DS2 site was surrounded by residentialbuildings as well as many lodging establishments andshops that were well lit at night. The DS3 site was lo-cated in an urban area with a complex road network anddensely packed apartment complexes and commercialfacilities.We measured the ANLI and mean annual air
temperature (°C) at each site. The ANLI was calculatedby dividing the area occupied by shops and residentialbuildings, including streetlights and roads, by the totalarea, based on high-resolution satellite images from Arc-GIS 10.3. ANLI ranged from 0 to 100, where 0 indicatedno ALAN and 100 indicated the maximum levels ofALAN. For example, if there is a 100-ha area composedof 30% of vegetation with no light and 70% of commer-cial areas and roads, ANLI is calculated as 30. ANLI assimple index is equal to vegetation area in the specificarea. We applied simple approach because it is very diffi-cult to quantify ALAN (e.g., type and amount of artificiallight at night) in complex urban situation. To incorpor-ate temperature changes during industrialization of this
Hakbong et al. Journal of Ecology and Environment (2021) 45:24 Page 2 of 10

area, we determined the mean annual air temperature inthe southern Korean peninsula between 1970 and 2014,using the map of mean annual air temperatures (Arc/Info binary grid), which is stored at the Korea NationalArboretum. This was applied to each site. We also mea-sured the field light intensity (lux) at night using a lightmeter (LX-1332, Custom Corp., Tokyo, Japan) at 50 lo-cations at each site (100 ha) divided into 100 grid cells.We randomly selected 50 grid cells to measure lux usingthe random-number generator in Excel 2016.
Insect collectionAt each study site, insects were collected along roadsand at the edges of commercial areas where plants suchas Rhododendron spp. and Buxus microphylla var. kor-eana were found. These sites have different levels of hu-man activity and consumption of plants by insects. Twonighttime surveys of insects were conducted in 2017, i.e.,before (June) and after (August) the rainy season. Eachsurvey was conducted on the same day of the month(8th) in the lunar calendar between 21:00 and 23:00, toaccount for natural nighttime light conditions and insect
activity. For each site, we conducted three round trips offive belt transects (5 × 20 m) and collected insects usinga sweep net (diameter 45 cm) to assess species richnessand abundance. Insect abundance data across the twoseasons (before and after the rainy season) were pooledfor analysis.
Insect species richness and abundance and indicatorspecies along the gradient of sitesTo identify differences in insect species richness andabundance along the gradient of sites, we identified theproportional richness and abundance of insect orders ateach site. Then, we used Venn diagrams (R package“VennDiagram”) (Chen and Boutros 2011) to illustratethe proportion of shared and unique insect species atthe sites. Finally, we quantitatively compared insect spe-cies richness and abundance at the sites.
Differences in insect community compositionBased on the insect abundance data at each site, we de-termined the patterns of turnover in insect communitiesand determined the factors that contributed most to the
Fig. 1 Aerial photographs of the study sites in Gwangneung Forest Biosphere Reserve. A the Korea National Arboretum, where there is noartificial light at night (control). B Neungnae Village, where there are two-lane roads, shops, and residential houses (DS1). C Jikdong Samgeori,where there is a three-way intersection with two-lane roads, shops, and residential houses (DS2). D Gwangneung, where there are numeroustwo-lane roads, shops, and residential houses, including apartment complexes (DS3)
Hakbong et al. Journal of Ecology and Environment (2021) 45:24 Page 3 of 10

changes. Meta-non-parametric multidimensional scalingwas performed using the R package “vegan” (Oksanenet al. 2019) to explore the turnover patterns. Of the en-vironmental factors (i.e., ANLI, mean annual airtemperature, and field light intensity), those that best ex-plained the changes with high predictability (p < 0.001)were exclusively displayed.
Size class distribution by siteWe referred to information from online databases (e.g.,Korea Biodiversity Information System) for data on thesize of the collected insects. Except for earwigs (Dermap-tera), we defined insect body size as the distance fromthe front of the head to the tip of the abdomen. The dis-tance from the front of the head to the base of the for-ceps was measured for determining the body size ofearwigs. We also analyzed patterns in the collected in-sects for abundance distribution by size class andchecked the differences in the abundance distributioncompared to the control site, using the two-sampleKolmogorov-Smirnov test.
Insect trophic structure by siteWe classified the collected insects according to thetrophic groups (i.e., herbivore, carnivore, omnivore, anddetritivore). The classification was based on the investi-gators’ knowledge and discussions, plus informationfrom online databases (i.e., Korea Biodiversity Informa-tion System, daum.net, naver.com, and google.com).
Statistical analysisThe mean annual air temperature and field light inten-sity for each site and the species richness and abundancedata for the collected insects were not normally distrib-uted, so the differences in data between the sites wereanalyzed using the rank-based non-parametric Kruskal-Wallis test followed by a Bonferroni post hoc test. Bon-ferroni correction (α = 0.05/ number of tests) was con-sidered to avoid type I errors. All statistical analyseswere conducted in R software (R Core team 2019). Dataare expressed as means ± standard deviations.
ResultsANLI, temperature, and light intensityOverall, the ANLI and field light intensity at the studysites increased with increasing development. The ANLIwas the highest in DS3 (56.5), followed by DS2 (30.5), DS1(17.1), and the control had an ANLI of zero (Table 1). Theurban site DS2 (median: 11.80 °C) had the highest meanannual air temperature, followed by DS3 (11.58 °C), thecontrol (11.36 °C), and DS1 (11.28 °C). However, these dif-ferences were not statistically significant. Field light inten-sity differed significantly among the sites (χ2 = 125.48, df =3, p = 0.001) and was the highest in DS2 (12.2 lux),
followed by DS3 (8.7 lux), DS1 (5.2 lux), and the control(0 lux). Field light intensity showed considerable variancedepending on the distance from the light sources, such asvehicular traffic and especially streetlights.
Proportional insect species richness and abundance ofinsect orders by siteThe Gwangneung Forest Biosphere Reserve has longmaintained the gradient of DS. The control site andthree nearby sites (DS1, DS2, and DS3) showed notabledifferences in proportional insect species richness andabundance (Fig. 2; Supplementary Table S1). This wasespecially evident with the proportion of hemipteranspecies increasing along the gradient of DS (Fig. 2).Neuropteran species were collected only from urbansites (DS1, DS2, and DS3), while dermapteran specieswere unique to the control site.In the control site, the five orders of Hemiptera
(23.2%), Hymenoptera (20.3%), Orthoptera (18.8%),Coleoptera (17.4%), and Diptera (11.6%) accounted for91.3% of the total collected species, with relatively equalproportions (Fig. 2A). In contrast, the proportion ofHemiptera increased at the urban sites (DS1 vs. DS2 vs.DS3 = 24.4% vs. 39.0% vs. 44.4%), and that of Coleopteradecreased (DS1 vs. DS2 vs. DS3 = 30.5% vs. 23.7% vs.22.2%; Fig. 2A).Although the five orders [Hemiptera (17.4%), Hymen-
optera (20.2%), Orthoptera (18.3%), Coleoptera (21.1%),and Diptera (15.6%)] had similar proportions of abun-dance (Fig. 2B), an uneven distribution of the insect or-ders was observed at the urban sites. Unlike the controlsite, hemipteran species at the urban sites accounted formore than half of total insect abundance (DS1 = 55.6%,DS2 = 64.6%, DS3 = 64.2%; Fig. 2A).The number of insect species common to the control
and urban sites was markedly lower than that commonto the urban sites only (3 vs. 16, Fig. 3). The only threespecies common to the control and urban sites wereMetcalfa pruinosa, Monolepta shirozui, and
Table 1 Summary of artificial night lighting index, mean annualair temperature, and field light intensity (lux) at the survey sites
Study sites ANLI Temperature (°C) Field light intensity (lux)
Control 0.0 11.36 0.0a
DS1 17.1 11.28 5.2b
DS2 30.5 11.80 12.2c
DS3 56.5 11.58 8.7bc
ANLI, artificial night lighting index; DS1, development situations at NeungnaeVillage; DS2, development situations at Jikdong Samgeori; DS3, developmentsituations at GwangneungnaeNo mean was calculated for the ANLI. Differences in mean annual airtemperature between the survey areas are not statistically significant, and thevalues are expressed as medians. Different letters in field light intensity valuesindicate significant differences (n = 50 per site). Refer to Fig. 1 for sitedescriptions and locations
Hakbong et al. Journal of Ecology and Environment (2021) 45:24 Page 4 of 10

Pristomyrmex pungens, and the number of speciesunique to the control, DS1, DS2, and DS3 sites was 33,22, 48, and 15, respectively (Fig. 3).Site conditions significantly affected insect abundance
(H = 12.177, df = 3, p = 0.007), but not species richness(H = 7.649, df = 3, p = 0.054) (Fig. 4). Pairwise compari-sons of species abundance between the sites revealedthat it was not significant (p > 0.008). However, DS2showed the highest maximum species richness andabundance (C vs. DS1 vs. DS2 vs. DS3 = 39 vs. 92 vs.101 vs. 50), and the control site showed the lowest mini-mum species abundance (C vs. DS1 vs. DS2 vs. DS3 =16 vs. 29 vs. 49 vs. 25) (Fig. 4).
Insect community composition and size distributionWhen the differences in species composition at eachstudy site were analyzed by rank, the NMDS1 differenti-ated the control site and three urban sites (DS1–3), andtheir spatial distribution was significantly correlated withANLI (r2 = 0.582, p = 0.002) (Fig. 5).By applying the two-sample Kolmogorov-Smirnov test
between the control site and each of the three urbansites (DS1, DS2, and DS3), we confirmed significant dif-ferences in the size class distribution of insects (control-DS1: Kolmogorov-Smirnov (KS) = 0.12, p < 0.0001;control-DS2: KS = 0.17, p < 0.0001; control-DS3: KS =0.12, p < 0.0001) (Fig. 6). Compared to the control site,
Fig. 2 A Proportional richness and B abundance of insect orders at the control site and the three urban sites (DS1, DS2, and DS3). Raw data ispresented in Supplementary Table S1. Refer to Fig. 1 for site descriptions and locations. He, Hemiptera; N, Neuroptera
Fig. 3 Venn diagram showing groups of insect species shared between study sites (control, DS1, DS2, and DS3). Refer to Fig. 1 for sitedescriptions and locations
Hakbong et al. Journal of Ecology and Environment (2021) 45:24 Page 5 of 10

the urban sites showed considerably increased numbersof small insects (≤ 15 mm). In particular, the control siteshowed a reverse-J-shaped distribution of insect sizes,but the three urban sites showed right-skewed unimodaldistributions (Fig. 6).
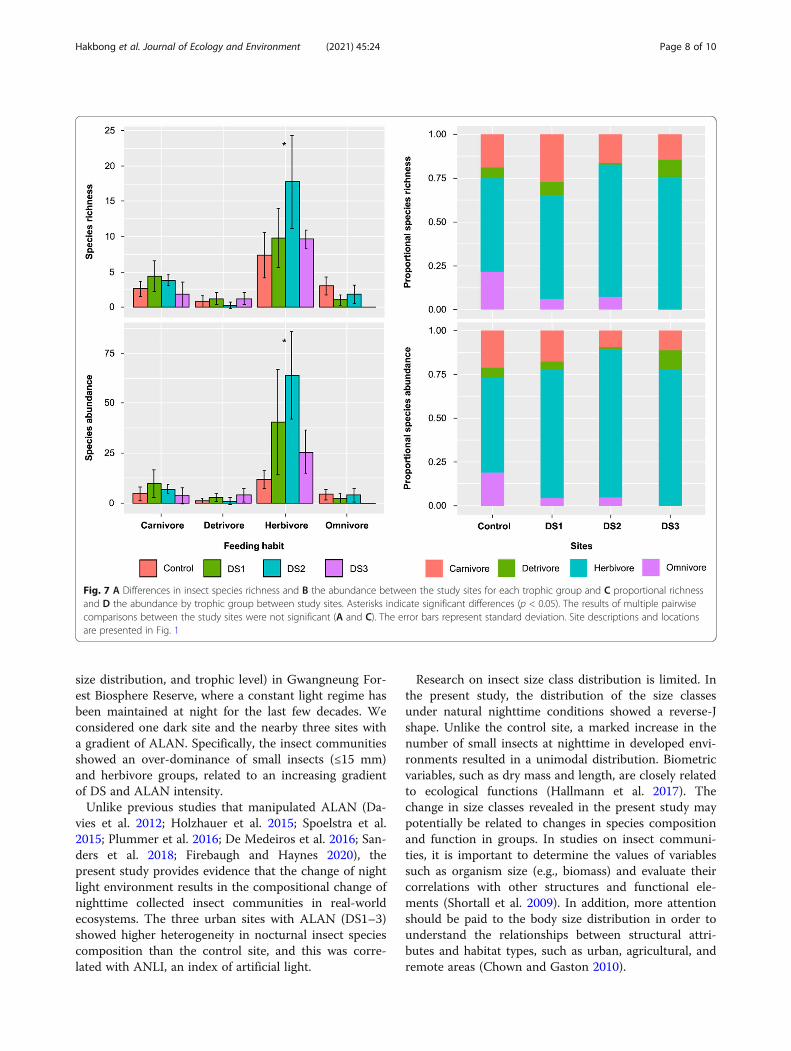
Insect trophic structure along the sitesThe collected insects were divided into four trophicgroups (herbivores, omnivores, carnivores, detritivores),and the median and proportional species richness andabundance of these groups were compared (Fig. 7). Ofthe four trophic groups, only herbivores (richness: H =7.944, df = 3, p = 0.047, abundance: H = 13.316, df = 3,p = 0.004) and omnivores (richness: H = 13.428, df = 3,p = 0.004, abundance: H = 10.895, df = 3, p = 0.012)showed significant differences in species richness andabundance between study sites (Fig. 7A). However,
pairwise comparisons between study sites were not sig-nificant for the two trophic groups. The proportionalspecies richness and abundance of herbivores were ap-proximately 54% and higher at the urban sites withALAN, compared with those at the control site. Theproportion of omnivores at the urban sites was lowerthan that of the control site, and in DS3 specifically,which was experiencing the highest development pres-sure, no omnivores were observed (Fig. 7).
DiscussionThe direct relationship between the effect of ALAN oninsects and urban expansion (Elvidge et al. 2014) is im-plicated in a reduction in insect diversity (Owens et al.,2020); however, community-based studies in real-worldecosystems are limited. We demonstrated that ALAN af-fected the insect community structure (species diversity,
Fig. 4 A Differences in insect species richness and B abundance among the four study sites (control, DS1, DS2, and DS3). Refer to Fig. 1 for sitedescriptions and locations. Bars and error bars indicate mean ± standard deviations, and pairwise comparisons of richness and abundancebetween the sites are not statistically significant by Bonferroni correction (p > 0.008)
Hakbong et al. Journal of Ecology and Environment (2021) 45:24 Page 6 of 10
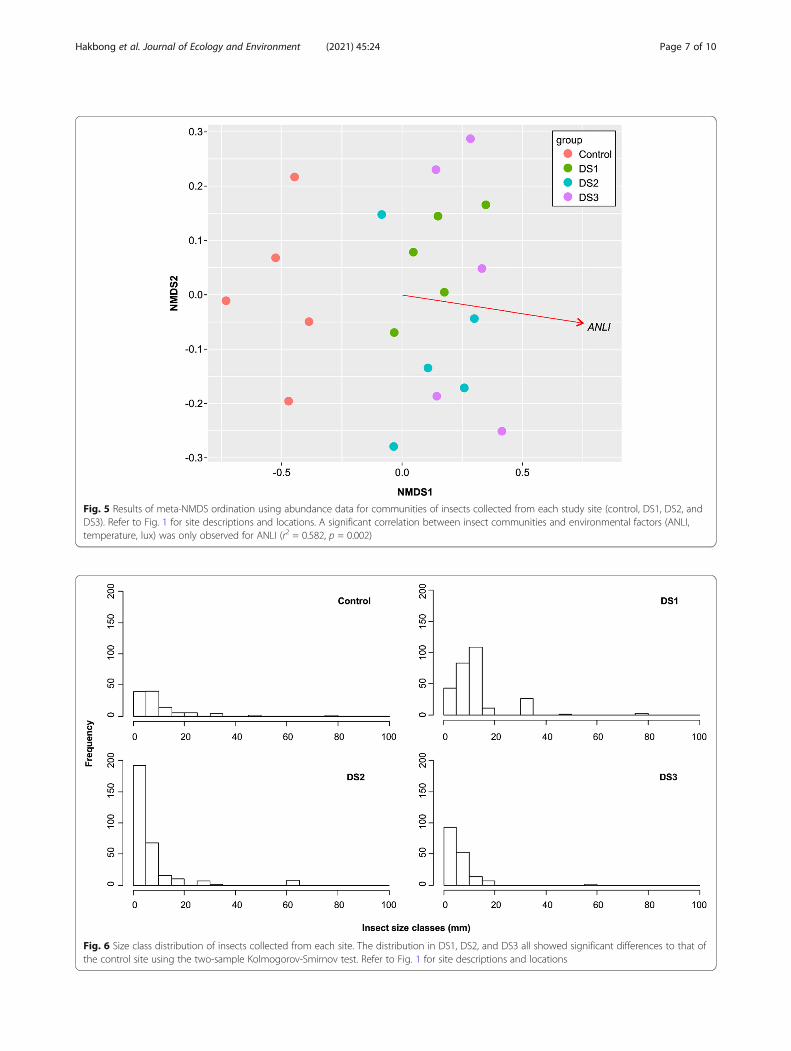
Fig. 5 Results of meta-NMDS ordination using abundance data for communities of insects collected from each study site (control, DS1, DS2, andDS3). Refer to Fig. 1 for site descriptions and locations. A significant correlation between insect communities and environmental factors (ANLI,temperature, lux) was only observed for ANLI (r2 = 0.582, p = 0.002)
Fig. 6 Size class distribution of insects collected from each site. The distribution in DS1, DS2, and DS3 all showed significant differences to that ofthe control site using the two-sample Kolmogorov-Smirnov test. Refer to Fig. 1 for site descriptions and locations
Hakbong et al. Journal of Ecology and Environment (2021) 45:24 Page 7 of 10
size distribution, and trophic level) in Gwangneung For-est Biosphere Reserve, where a constant light regime hasbeen maintained at night for the last few decades. Weconsidered one dark site and the nearby three sites witha gradient of ALAN. Specifically, the insect communitiesshowed an over-dominance of small insects (≤15 mm)and herbivore groups, related to an increasing gradientof DS and ALAN intensity.Unlike previous studies that manipulated ALAN (Da-
vies et al. 2012; Holzhauer et al. 2015; Spoelstra et al.2015; Plummer et al. 2016; De Medeiros et al. 2016; San-ders et al. 2018; Firebaugh and Haynes 2020), thepresent study provides evidence that the change of nightlight environment results in the compositional change ofnighttime collected insect communities in real-worldecosystems. The three urban sites with ALAN (DS1–3)showed higher heterogeneity in nocturnal insect speciescomposition than the control site, and this was corre-lated with ANLI, an index of artificial light.
Research on insect size class distribution is limited. Inthe present study, the distribution of the size classesunder natural nighttime conditions showed a reverse-Jshape. Unlike the control site, a marked increase in thenumber of small insects at nighttime in developed envi-ronments resulted in a unimodal distribution. Biometricvariables, such as dry mass and length, are closely relatedto ecological functions (Hallmann et al. 2017). Thechange in size classes revealed in the present study maypotentially be related to changes in species compositionand function in groups. In studies on insect communi-ties, it is important to determine the values of variablessuch as organism size (e.g., biomass) and evaluate theircorrelations with other structures and functional ele-ments (Shortall et al. 2009). In addition, more attentionshould be paid to the body size distribution in order tounderstand the relationships between structural attri-butes and habitat types, such as urban, agricultural, andremote areas (Chown and Gaston 2010).
Fig. 7 A Differences in insect species richness and B the abundance between the study sites for each trophic group and C proportional richnessand D the abundance by trophic group between study sites. Asterisks indicate significant differences (p < 0.05). The results of multiple pairwisecomparisons between the study sites were not significant (A and C). The error bars represent standard deviation. Site descriptions and locationsare presented in Fig. 1
Hakbong et al. Journal of Ecology and Environment (2021) 45:24 Page 8 of 10
The large increase in the herbivore population at thethree urban sites was the result of reduced overall preda-tion pressure due to lower numbers of omnivores. Thisincrease in herbivore numbers could be attributed totheir attraction to nitrogen- and phosphorus-rich food(leaves), which is a commonly reported limiting factorfor insects in urban environments (Moreira et al. 2019).The reduction in omnivores was the main factor respon-sible for the simplification of the food web. Omnivores,which comprise approximately 40 families in 12 orders,have generally adapted to supplemental nutrition that islacking in a plant-based diet and are an important elem-ent in natural and agricultural ecosystems (Krimmel2011). Because omnivores perform the roles of both her-bivores and carnivores within the food web, they canconsistently alter the intensity and direction (top-downor bottom-up) of trophic cascades. In the present study,it is likely that the three urban sites contained high-quality edible leaves. In these areas, the increased abun-dance and richness of herbivores may lead to increasedspatial competition between herbivores and omnivoresand thus affect the extent to which omnivorous insectscould enter the area. Moreover, with regard toomnivore-herbivore-plant interactions, the presence ofhigh-quality plant-based food reduces predatory behav-ior, rather than increasing the attraction for omnivores.This reduction, in turn, is beneficial to herbivores(Eubanks and Denno 2000). Omnivores can also en-hance top-down control by pressuring predator groups,but this pattern was not observed in the present study.Future studies that assess the effects of high-qualityplant resources on competition between herbivores andomnivores may provide important insights into the foodweb changes associated with urbanization.Although many studies have reported nighttime urban
light pollution using satellite images (Elvidge et al. 2007;Sutton et al. 2007; Gaston et al. 2015), the impact onbiodiversity at the community level has not been fullyclarified. However, it is an extremely challenging task tounderstand the effects of nighttime light on biologicalcommunities in urban environments because of the di-versity and interconnectedness of factors within urbannighttime environments. In the present study, we usedANLI, mean annual air temperature, and field light in-tensity at the survey sites as the factors characterizingthe urban nighttime environment. However, this ap-proach and these factors are not sufficient to explain thecausal relationships between ALAN and the observedchanges in the insect communities clearly.
AbbreviationsALAN: Artificial light at night; ANLI: Artificial night lighting index; C: Control;DS: Development situation; Meta-NMDS: Meta-non-parametric multidimensionalscaling
Supplementary InformationThe online version contains supplementary material available at https://doi.org/10.1186/s41610-021-00207-9.
Additional file 1:. Supplementary Table S1.
AcknowledgementsWe thank Kim Han-Gyul and Jung Songhie for data preparation and sincerelythank Professor Lim Jongok for providing pertinent information on thetrophic groups of the collected insects.
Authors’ contributionsLH and CYC designed the study; LSW, KYH, and LSG carried out fieldsampling and performed the analysis; and LH and CYC wrote themanuscript. The authors read and approved the final manuscript.
FundingThis research was supported by the Research Program (KNA1-2-17, 13-3,KNA1-2-26, 16-4, and KNA1-2-32, 18-3) of the Korea National Arboretum.
Availability of data and materialsThe datasets generated and/or analyzed during the current study areavailable from the corresponding author upon reasonable request.
Declarations
Ethics approval and consent to participateNot applicable.
Consent for publicationNot applicable.
Competing interestsThe authors declare that they have no competing interests.
Author details1Restoration Center for Endangered Species, National Institute of Ecology,Yeongyang 36531, South Korea. 2Conservation Center for GwangneungForest, Korea National Arboretum, 509, Gwangneungsumogwon-ro,Soheul-eup, Pocheon 11186, South Korea. 3DASARI Research Institute ofBioResources, Daejeon 34127, South Korea. 4Animal Resources Division,National Institute of Biological Resources, Incheon 22689, South Korea.
Received: 19 October 2021 Accepted: 11 November 2021
ReferencesChen H, Boutros PC. VennDiagram: a package for the generation of highly-
customizable Venn and Euler diagrams in R. BMC Bioinform. 2011;12(1):35.https://doi.org/10.1186/1471-2105-12-35.
Cho YC, Kim H-G, Kim JS, Lee H, Jung SH, Lee DH, et al. 2019 annual report onGwangneung forest and experimental forest. Seoul: Sumeungil; 2020.
Chown SL, Gaston KJ. Body size variation in insects: a macroecological perspective.Biol Rev. 2010;85(1):139–69. https://doi.org/10.1111/j.1469-185X.2009.00097.x.
Davies TW, Bennie J, Gaston KJ. Street lighting changes the composition of invertebratecommunities. Biol Lett. 2012;8(5):764–7. https://doi.org/10.1098/rsbl.2012.0216.
Davies TW, Smyth T. Why artificial light at night should be a focus for globalchange research in the 21st century. Glob Chang Biol. 2018;24(3):872–82.https://doi.org/10.1111/gcb.13927.
de Medeiros BAS, Barghini A, Vanin SA. Streetlights attract a broad array of beetle species.Rev Bras Entomol. 2016;61(1):74–9. https://doi.org/10.1016/j.rbe.2016.11.004.
Eisenbeis G, Hänel A. Light pollution and the impact of artificial night lighting oninsects. In McDonnell MJ, Hahs AH, Breuste JH, editors. Ecology of cities andtowns. Cambridge. Cambridge University Press, 2009. p. 243-263.
Elvidge CD, Safran J, Tuttle B, Sutton P, Cinzano P, Pettit D, et al. Potential forglobal mapping of development via a nightsat mission. GeoJournal. 2007;69(1-2):45–53. https://doi.org/10.1007/s10708-007-9104-x.
Elvidge CD, Sutton PC, Baugh K, Ziskin DC, Ghosh T, Anderson S. National trends insatellite observed lighting: 1992–2009. In: Weng Q, editor. Global urban monitoringand assessment through earth observation. Boca Raton, Florida: CRC Press; 2014.
Hakbong et al. Journal of Ecology and Environment (2021) 45:24 Page 9 of 10
Eubanks M, Denno RF. Host plants mediate omnivore-herbivore interactions andinfluence prey suppression. Ecology. 2000;81:936–47.
Falchi F, Cinzano P, Duriscoe D, Kyba CCM, Elvidge CD, Baugh K, et al. The newworld atlas of artificial night sky brightness. Sci Adv. 2016;2(6):e1600377.https://doi.org/10.1126/sciadv.1600377.
Firebaugh A, Haynes K. Multi-year experiment shows no impact of artificial lightat night on arthropod trophic structure or abundance. Ecosphere. 2020;11(8):e03227. https://doi.org/10.1002/ecs2.3227.
Gaston KJ, Visser ME, Hölker F. The biological impacts of artificial light at night:the research challenge. Philos Trans R Soc Lond B. 2015;370(1667):20140133.https://doi.org/10.1098/rstb.2014.0133.
Government of Korea. National plan for prevent light pollution (2019-2023).Sejong: Ministry of Environment; 2018.
Hallmann CA, Sorg M, Jongejans E, Siepel H, Hofland N, Schwan H, et al. Morethan 75 percent decline over 27 years in total flying insect biomass inprotected areas. PLoS One. 2017;12(10):e0185809. https://doi.org/10.1371/journal.pone.0185809.
Hölker F, Moss T, Griefahn B, Kloas W, Voigt CC, Henckel D, et al. The dark side oflight: a transdisciplinary research agenda for light pollution policy. Ecol Soc.2010;15(4). https://doi.org/10.5751/ES-03685-150413.
Holzhauer SIJ, Franke S, Kyba CCM, Manfrin A, Klenke R, Voigt CC, et al. Out ofthe dark: establishing a large-scale field experiment to assess the effects ofartificial light at night on species and food webs. Sustainability. 2015;7(11):15593–616. https://doi.org/10.3390/su71115593.
Krimmel BA. Omnivorous insects: evolution and ecology in natural andagricultural ecosystems. Nature Education Knowledge. 2011;3(10):52.
Mbugua SW, Wong CH, Ratnayeke S. Effects of artificial light on the larvae of thefirefly Lamprigera sp. in an urban city park, peninsular Malaysia. J Asia PacEntomol. 2020;23(1):82–5. https://doi.org/10.1016/j.aspen.2019.10.005.
Moreira X, Abdala-Roberts L, Berny Mier y Teran JC, Covelo F, de la Mata R, FranciscoM, et al. Impacts of urbanization on insect herbivory and plant defences in oaktrees. Oikos. 2019;128(1):113–23. https://doi.org/10.1111/oik.05497.
Oksanen J, Blanchet FG, Friendly M, Kindt R, Legendre P, McGlinn D, Minchin PR,O’Hara RB, Simpson GL, Solymos P, Stevens MHH, Szoecs E, Wagner H.vegan: Community Ecology Package. R package version 25-6. 2019.
Owens ACS, Cochard P, Durrant J, Farnworth B, Perkin EK, Seymoure B. Lightpollution is a driver of insect declines. Biol Conserv. 2020;241:108259. https://doi.org/10.1016/j.biocon.2019.108259.
Plummer KE, Hale JD, O’Callaghan MJ, Sadler JP, Siriwardena GM. Investigatingthe impact of street lighting changes on garden moth communities. J UrbanEcol. 2016;2(1):1–10. https://doi.org/10.1093/jue/juw004.
R Core Team. R: A language and environment for statistical computing. Vienna,Austria: R Foundation for Statistical Computing; 2019.
Russo D, Ancillotto L, Cistrone L, Libralato N, Domer A, Cohen S, et al. Effects ofartificial illumination on drinking bats: a field test in forest and deserthabitats. Anim Conserv. 2019;22(2):124–33. https://doi.org/10.1111/acv.12443.
Sanders D, Gaston KJ. How ecological communities respond to artificial light atnight. J Exp Zool A Ecol Integr Physiol. 2018;329(8-9):394–400. https://doi.org/10.1002/jez.2157.
Sanders D, Kehoe R, Cruse D, van Veen FJF, Gaston KJ. Low levels of artificial lightat night strengthen top-down control in insect food web. Curr Biol. 2018;28(15):2474–8e2473. https://doi.org/10.1016/j.cub.2018.05.078.
Shortall CR, Moore A, Smith E, Hall MJ, Woiwod IP, Harrington R. Long-termchanges in the abundance of flying insects. Insect Conservation Diversity.2009;2(4):251–60. https://doi.org/10.1111/j.1752-4598.2009.00062.x.
Spoelstra K, van Grunsven RHA, Donners M, Gienapp P, Huigens ME, Slaterus R,et al. Experimental illumination of natural habitat – an experimental set-upto assess the direct and indirect ecological consequences of artificial light ofdifferent spectral composition. Philos Trans R Soc Lond B. 2015;370(1667):20140129. https://doi.org/10.1098/rstb.2014.0129.
Sutton PC, Elvidge CD, Ghosh T. Estimation of gross domestic product at sub-nationalscales using nighttime satellite imagery. Int J Ecol Econ Stat. 2007;8:5–21.
Witherington BE. Behavioral responses of nesting sea turtles to artificial lighting.Herpetologica. 1992;48:31–9.
Yoon T, Kim DG, Kim S, Jo S-I, Bae Y, et al. Aquat Insects. 2010;32:195–203.
Publisher’s NoteSpringer Nature remains neutral with regard to jurisdictional claims inpublished maps and institutional affiliations.
Hakbong et al. Journal of Ecology and Environment (2021) 45:24 Page 10 of 10