Documentation of Vital Signs During the Post-Operative Phase
Upload
khangminh22Category
view
0download
0
HAL Id: tel-02152975https://tel.archives-ouvertes.fr/tel-02152975
Submitted on 11 Jun 2019
HAL is a multi-disciplinary open accessarchive for the deposit and dissemination of sci-entific research documents, whether they are pub-lished or not. The documents may come fromteaching and research institutions in France orabroad, or from public or private research centers.
L’archive ouverte pluridisciplinaire HAL, estdestinée au dépôt et à la diffusion de documentsscientifiques de niveau recherche, publiés ou non,émanant des établissements d’enseignement et derecherche français ou étrangers, des laboratoirespublics ou privés.
Nonintrusive Nocturnal Remote Monitoring of VitalSigns in Ambient Assisted Living Environments
Ibrahim Sadek Ibrahim Hussein Tahoun
To cite this version:Ibrahim Sadek Ibrahim Hussein Tahoun. Nonintrusive Nocturnal Remote Monitoring of Vital Signsin Ambient Assisted Living Environments. Systems and Control [cs.SY]. Université Montpellier, 2018.English. �NNT : 2018MONTS102�. �tel-02152975�

Présentée par Ibrahim SADEK IBRAHIM HUSSEIN TAHOUN Le 10 Avril 2018
Sous la direction de Mounir MOKHTARI, Zhang HAIHONG, Jit BISWAS
Devant le jury composé de :
[M. Timo JAMSA, Professeur, Faculté de Médecine, Université d'Oulu, Finlande]
[M. David FOFI, Professeur, Université de Bourgogne, France]
[M. Philippe FRAISSE, Professeur, Université de Montpellier, France]
[M. Eric CAMPO, Professeur, Université de Toulouse, France]
[M. Mounir MOKHTARI, Professeur, Institut Mines-Télécom, France]
[Rapporteur]
[Rapporteur]
[Examinateur]
[Examinateur]
[Directeur de thèse]
Titre de la thèse
Télésurveillance Nocturne Non Intrusive De Signes Vitaux Dans Des Environnements D’assistance A
L’autonomie A Domicile
THÈSE POUR OBTENIR LE GRADE DE DOCTEUR
DE L’UNIVERSITÉ DE MONTPELLIER
En Informatique
École doctorale : Information Structures Systèmes I2S
Unité de recherche : Image and Pervasive Access Lab., CNRS UMI 2955, Singapour


In front of a jury composed of:
[M. Timo JAMSA, Professor, Faculty of Medicine, University of Oulu, Finland]
[M. David FOFI, Professor, University of Burgundy, France]
[M. Philippe FRAISSE, Professor, University of Montpellier, France]
[M. Eric CAMPO, Professor, University of Toulouse, France]
[M. Mounir MOKHTARI, Professor, Institute Mines Telecom, France]
[Reviewer]
[Reviewer]
[Examiner]
[Examiner]
[Thesis Director]
THESIS TO OBTAIN THE DEGREE OF DOCTOR OF PHILISHOPY
DELIVERED BY THE UNIVERSITY OF MONTPELLIER
Specialty Computer Science
Doctoral School: Information, Structure and Systems (I2S) Research Unit: Image and Pervasive Access Lab, CNRS UMI 2955, Singapore
Presented by Ibrahim SADEK IBRAHIM HUSSEIN TAHOUN
On 10 April 2018
Under the Supervision of Mounir MOKHTARI, Zhang HAIHONG, Jit BISWAS
Thesis Tit le
Nonintrusive Nocturnal Remote Monitoring of Vital
Signs in Ambient Assisted Living Environments

v
Acknowledgments
First and foremost, I would like to thank all the people who supported and col-laborated with me to achieve this work. I could not have made it without yourhelp.
I would also like to extend my deepest gratitude to my thesis director, Professor.Mounir Mokhtari, the Image and Pervasive Access Lab’s (IPAL) director, for givingme the opportunity to explore this work and for his expert advice, and encourage-ments. I would like to thank him for giving me the opportunity to interact andcollaborate with scientists and industrial partners throughout meetings and demos.I would also like to thank him for the freedom and trust which he granted to meduring my work.
I would like to give great thanks to Professor. Jit Biswas who gave me a lot ofsupport and guidance throughout my thesis. Further, he assisted me a lot in mypublications by giving advice and reviewing my papers. I would also like to thankhim for initiating the collaboration between IPAL and Khoo Teck Puat (KTPH)hospital, Singapore.
Further thanks go to Professor. Bessam Abdulrazak for his interest in myresearch and also for his valuable contributions in my publications.
I would like to extend my appreciation to Dr. Edwin Seet for his role in datacollection during our clinical study at KTPH. Moreover, I would also like to thankhim for his contribution to my journal publication.
Special thanks go to Ms. Chia Audris for his valuable contribution and supportduring our clinical study. Without her support, we could not have completed thestudy.
Special thanks go to my colleagues at IPAL for their help and support duringmy stay, especially Dr. Thibaut Tiberghien, Dr. Joaquim Bellmunt, Martin Kodys,Antoine Demarasse, Fabien Clavier, Angela Saenz, Anssuya Etwaro. I also thankmy fellow PhDers and my other colleagues.
I would like to thank my colleagues at the University of Montpellier for theirhelp and support in my Ph.D. registration, especially Dr. Hamdi Aloulou, FirasKaddachi, and Dr. Romain Endelin.
My Ph.D. was partially supported by A*STAR Graduate Academy (AGA). Iwould also like to give warm thanks to Prof. Zhang Haihong who accepted to be myco-supervisor and for his follow up throughout my research.
And last, but not least important, very special thanks go to my beloved wifeLamees, parents, who supported and encouraged me during stressful moments.

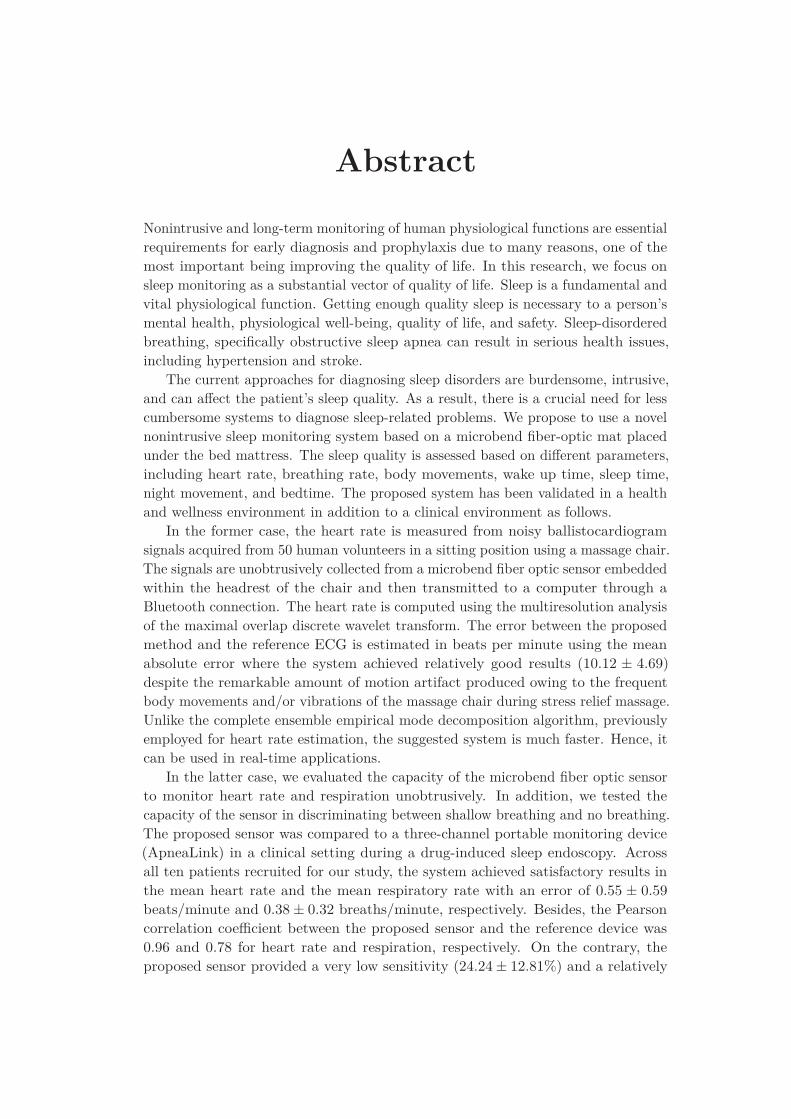
Abstract
Nonintrusive and long-term monitoring of human physiological functions are essentialrequirements for early diagnosis and prophylaxis due to many reasons, one of themost important being improving the quality of life. In this research, we focus onsleep monitoring as a substantial vector of quality of life. Sleep is a fundamental andvital physiological function. Getting enough quality sleep is necessary to a person’smental health, physiological well-being, quality of life, and safety. Sleep-disorderedbreathing, specifically obstructive sleep apnea can result in serious health issues,including hypertension and stroke.
The current approaches for diagnosing sleep disorders are burdensome, intrusive,and can affect the patient’s sleep quality. As a result, there is a crucial need for lesscumbersome systems to diagnose sleep-related problems. We propose to use a novelnonintrusive sleep monitoring system based on a microbend fiber-optic mat placedunder the bed mattress. The sleep quality is assessed based on different parameters,including heart rate, breathing rate, body movements, wake up time, sleep time,night movement, and bedtime. The proposed system has been validated in a healthand wellness environment in addition to a clinical environment as follows.
In the former case, the heart rate is measured from noisy ballistocardiogramsignals acquired from 50 human volunteers in a sitting position using a massage chair.The signals are unobtrusively collected from a microbend fiber optic sensor embeddedwithin the headrest of the chair and then transmitted to a computer through aBluetooth connection. The heart rate is computed using the multiresolution analysisof the maximal overlap discrete wavelet transform. The error between the proposedmethod and the reference ECG is estimated in beats per minute using the meanabsolute error where the system achieved relatively good results (10.12 ± 4.69)despite the remarkable amount of motion artifact produced owing to the frequentbody movements and/or vibrations of the massage chair during stress relief massage.Unlike the complete ensemble empirical mode decomposition algorithm, previouslyemployed for heart rate estimation, the suggested system is much faster. Hence, itcan be used in real-time applications.
In the latter case, we evaluated the capacity of the microbend fiber optic sensorto monitor heart rate and respiration unobtrusively. In addition, we tested thecapacity of the sensor in discriminating between shallow breathing and no breathing.The proposed sensor was compared to a three-channel portable monitoring device(ApneaLink) in a clinical setting during a drug-induced sleep endoscopy. Acrossall ten patients recruited for our study, the system achieved satisfactory results inthe mean heart rate and the mean respiratory rate with an error of 0.55 ± 0.59
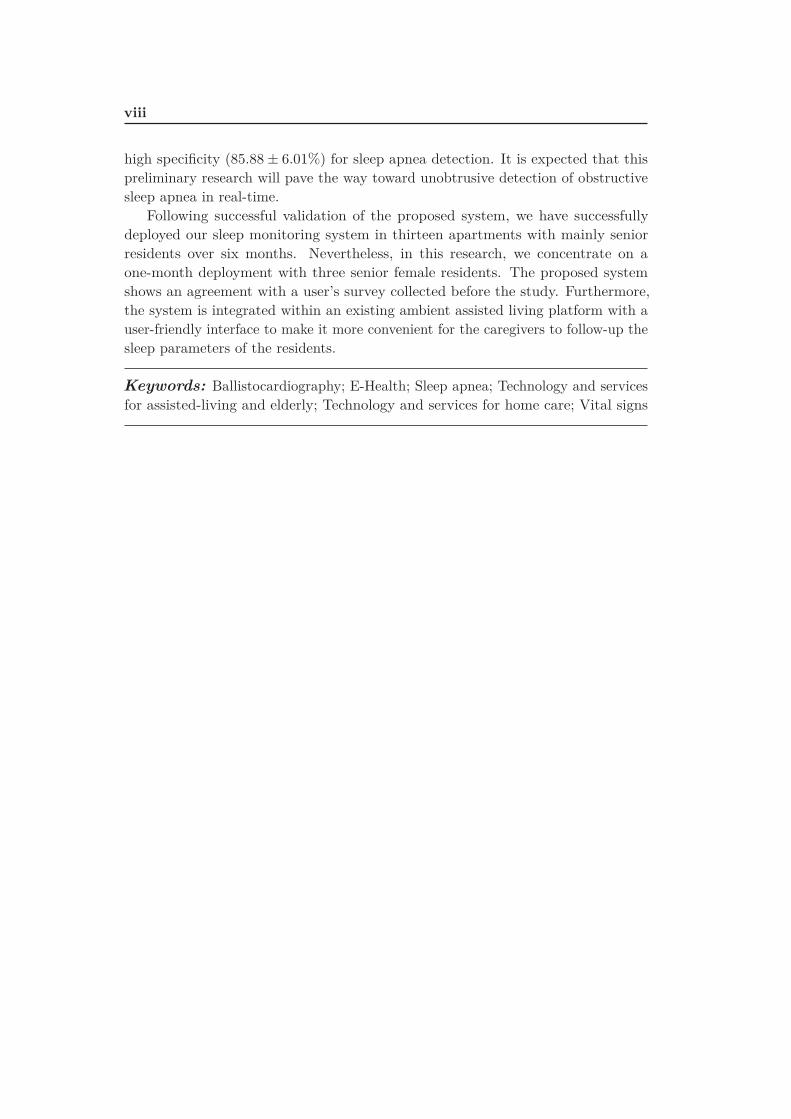
beats/minute and 0.38 ± 0.32 breaths/minute, respectively. Besides, the Pearsoncorrelation coefficient between the proposed sensor and the reference device was0.96 and 0.78 for heart rate and respiration, respectively. On the contrary, theproposed sensor provided a very low sensitivity (24.24 ± 12.81%) and a relatively
viii
high specificity (85.88 ± 6.01%) for sleep apnea detection. It is expected that thispreliminary research will pave the way toward unobtrusive detection of obstructivesleep apnea in real-time.
Following successful validation of the proposed system, we have successfullydeployed our sleep monitoring system in thirteen apartments with mainly seniorresidents over six months. Nevertheless, in this research, we concentrate on aone-month deployment with three senior female residents. The proposed systemshows an agreement with a user’s survey collected before the study. Furthermore,the system is integrated within an existing ambient assisted living platform with auser-friendly interface to make it more convenient for the caregivers to follow-up thesleep parameters of the residents.
Keywords: Ballistocardiography; E-Health; Sleep apnea; Technology and servicesfor assisted-living and elderly; Technology and services for home care; Vital signs
Résumé
En vue du diagnostic précoce et la prophylaxie, la surveillance des fonctions physi-ologiques humaines est exigée d’être essentiellement à la fois non intrusive et à longterme. Parmi nombreuses motivations, l’une des plus importantes est l’améliorationde la qualité de vie. Dans cette recherche, nous nous concentrons sur la surveillancedu sommeil comme un vecteur substantiel de qualité de vie. Le sommeil est unefonction physiologique fondamentale et vitale. Avoir suffisamment de sommeil dequalité est nécessaire pour la santé mentale, pour le bien-être physiologique, pour laqualité de vie et pour la sécurité d’une personne. La respiration irrégulière pendantle sommeil, particulièrement l’apnée obstructive du sommeil, peut entraîner degraves problèmes de santé, y compris l’hypertension artérielle et accident vasculairecérébral.
Les approches actuelles pour diagnostiquer les troubles du sommeil sont lourdes,intrusives et peuvent influer sur la qualité du sommeil du patient. Il y a donc unbesoin crucial de systèmes moins encombrants pour diagnostiquer les problèmes liésau sommeil. Nous proposons d’utiliser un nouveau système de suivi du sommeil nonintrusif basé sur un tapis à fibre optique à microflexion placée sous le matelas de lit.La qualité du sommeil est évaluée en fonction de différents paramètres, y comprisla fréquence cardiaque, le rythme respiratoire, les mouvements du corps, l’heuredu réveil, la durée du sommeil, le mouvement nocturne et l’heure du coucher. Lesystème proposé a été validé dans un environnement de santé et de bien-être, enplus d’un environnement clinique comme suit.
Dans le premier cas, la fréquence cardiaque est mesurée à partir de signauxballistocardiogramme bruités acquis de 50 volontaires en position assise à l’aide d’unechaise de massage. Les signaux sont recueillis discrètement à partir d’un capteur defibre optique microflexible intégrée dans l’appui-tête de la chaise, puis transmis à unordinateur par une connexion Bluetooth. La fréquence cardiaque est calculée à l’aidede l’analyse multi-résolution de la transformée discrète en ondelettes à chevauchementmaximal. L’erreur entre la méthode proposée et électrocardiogramme de référence estestimée en battements par minute en utilisant l’erreur absolue moyenne où le systèmea obtenu des résultats relativement bons (10.12±4.69) malgré la quantité remarquabled’artefact de mouvement produit en raison des fréquents mouvements corporelset/ou vibrations de la chaise de massage pendant le massage de soulagement dustress. Contrairement à l’algorithme complet de décomposition du mode empiriquede l’ensemble, précédemment utilisé pour l’estimation de la fréquence cardiaque, lesystème proposé est beaucoup plus rapide. Par conséquent, il peut être utilisé dansles applications temps réel.
Dans ce dernier cas, nous avons évalué la capacité du capteur de fibre optiquemicroflexible pour suivre la fréquence cardiaque et la respiration d’une manièrediscrète. En outre, nous avons testé la capacité du capteur dans la discriminationentre la respiration superficielle et pas de respiration. Le capteur proposé a été

x
comparé à un dispositif de surveillance portatif à trois canaux (ApneaLink) dans unmilieu clinique au cours d’une endoscopie sous anesthésie. Parmi les dix patientsrecrutés pour notre étude, le système a obtenu des résultats satisfaisants quant àla fréquence cardiaque moyenne et quant à la fréquence respiratoire moyenne avecune erreur de 0.55 ± 0.59 battements/minute et de 0.38 ± 0.32 respirations/minute,respectivement. De plus, le coefficient de corrélation Pearson entre le capteur proposéet le dispositif de référence était de 0.96 et 0.78 pour la fréquence cardiaque et larespiration, respectivement. Au contraire, le capteur proposé a fourni une très faiblesensibilité (24.24±12.81%) et une spécificité relativement élevée (85.88±6.01%) pourla détection de l’apnée du sommeil. On s’attend à ce que cette recherche préliminaireouvre la voie vers la détection discrète de l’apnée obstructive du sommeil en tempsréel.
Suite à la validation réussie du système proposé, nous avons déployé avec succèsnotre système de surveillance du sommeil pendant plus de 6 mois dans treizeappartements habités principalement par les personnes âgées. Néanmoins, danscette recherche, nous nous concentrons sur un déploiement d’un mois avec troisrésidents seniors de sexe féminin. Le système proposé montre l’accord avec l’enquêteutilisateur recueillie avant l’étude. En outre, le système est intégré dans une plate-forme d’autonomie assistée existante avec une interface conviviale pour rendre pluscommode pour les aidants le suivi des paamètres de sommeil des résidents.
Mots-clés: Balistocardiographie ; E-Santé ; Apnée du sommeil ; Technologie etservices pour les personnes âgées et assistées ; Technologie et services pour les soinsà domicile ; Signes vitaux

Publications
Papers in refereed journals
1. Sadek, I., Seet, E., Biswas, J., Abdulrazak, B., Mokhtari, M., 2018. Nonin-trusive Vital Signs Monitoring for Sleep Apnea Patients: A Preliminary Study.IEEE Access, 6, pp.2506-2514. [Impact factor 3.244].doi:10.1109/ACCESS.2017.2783939
2. Sadek, I., Mokhtari, M., 2018. Nonintrusive Remote Monitoring of Sleep inHome-Based Situation. Journal of medical systems, Springer Nature, 42, 64.[Impact factor 2.456].doi:10.1007/s10916-018-0917-6
Papers in refereed conferences
1. Sadek, I., Biswas, J., Fook, V.F.S., Mokhtari, M., 2015. Automatic heart ratedetection from FBG sensors using sensor fusion and enhanced empirical modedecomposition, in: 2015 IEEE International Symposium on Signal Processingand Information Technology (ISSPIT). IEEE, pp. 349–353.doi:10.1109/ISSPIT.2015.7394358
2. Sadek, I., Biswas, J., Yongwei, Z., Haihong, Z., Maniyeri, J., Zhihao, C.,Teng, T.J., Huat, N.S., Mokhtari, M., 2016. Sensor data quality processingfor vital signs with opportunistic ambient sensing, in: Proceedings of theAnnual International Conference of the IEEE Engineering in Medicine andBiology Society, EMBS. Institute of Electrical and Electronics Engineers Inc.,pp. 2484–2487.doi:10.1109/EMBC.2016.7591234
3. Sadek, I., Biswas, J., Abdulrazak, B., Haihong, Z., Mokhtari, M., 2017.Continuous and unconstrained vital signs monitoring with ballistocardiogramsensors in headrest position, in: 2017 IEEE EMBS International Conferenceon Biomedical and Health Informatics, BHI 2017. Institute of Electrical andElectronics Engineers Inc., pp. 289–292.doi:10.1109/BHI.2017.7897262
4. Sadek, I., Bellmunt, J., Kodyš, M., Abdulrazak, B., Mokhtari, M., 2017.Novel unobtrusive approach for sleep monitoring using fiber optics in anambient assisted living platform, in: Lecture Notes in Computer Science(Including Subseries Lecture Notes in Artificial Intelligence and Lecture Notesin Bioinformatics). Springer Verlag, pp. 48–60.doi:10.1007/978-3-319-66188-9_5


Contents
1 Introduction 1
1.1 Research Description . . . . . . . . . . . . . . . . . . . . . . . . . . . 11.2 Current Healthcare Challenges . . . . . . . . . . . . . . . . . . . . . 2
1.2.1 Growing Numbers of Elderly People . . . . . . . . . . . . . . 21.2.2 Prevalence of Chronic Diseases . . . . . . . . . . . . . . . . . 41.2.3 Shortage of Caregivers . . . . . . . . . . . . . . . . . . . . . . 51.2.4 Rising Costs of Healthcare . . . . . . . . . . . . . . . . . . . . 5
1.3 Research Objectives of this Thesis . . . . . . . . . . . . . . . . . . . 71.4 Structure of the Thesis . . . . . . . . . . . . . . . . . . . . . . . . . . 7
2 Background 9
2.1 Introduction . . . . . . . . . . . . . . . . . . . . . . . . . . . . . . . . 92.2 Cardiovascular System . . . . . . . . . . . . . . . . . . . . . . . . . . 102.3 Respiratory System . . . . . . . . . . . . . . . . . . . . . . . . . . . . 112.4 Physiology of Sleep . . . . . . . . . . . . . . . . . . . . . . . . . . . . 132.5 Sleep Monitoring . . . . . . . . . . . . . . . . . . . . . . . . . . . . . 142.6 Polysomnography . . . . . . . . . . . . . . . . . . . . . . . . . . . . . 152.7 Actigraphy . . . . . . . . . . . . . . . . . . . . . . . . . . . . . . . . 172.8 Consumer Sleep Tracking Devices . . . . . . . . . . . . . . . . . . . . 18
2.8.1 Wearable Sleep Tracking Devices . . . . . . . . . . . . . . . . 192.8.2 Sleep Tracking Apps on Smart-phones . . . . . . . . . . . . . 202.8.3 Bed-Based Sleep Tracking Devices . . . . . . . . . . . . . . . 22
2.9 Conclusion . . . . . . . . . . . . . . . . . . . . . . . . . . . . . . . . 25
3 Literature Review 27
3.1 Introduction . . . . . . . . . . . . . . . . . . . . . . . . . . . . . . . . 273.2 Ballistocardiography . . . . . . . . . . . . . . . . . . . . . . . . . . . 28
3.2.1 Piezoelectric Polyvinylidene Fluoride-Based Sensors . . . . . 313.2.2 Electromechanical Film-Based Sensors . . . . . . . . . . . . . 353.2.3 Pneumatic-Based Sensors . . . . . . . . . . . . . . . . . . . . 403.2.4 Strain Gauges-Based Sensors . . . . . . . . . . . . . . . . . . 423.2.5 Hydraulic-Based Sensors . . . . . . . . . . . . . . . . . . . . . 473.2.6 Fiber Optic-Based Sensors . . . . . . . . . . . . . . . . . . . . 50
3.3 Conclusion . . . . . . . . . . . . . . . . . . . . . . . . . . . . . . . . 53
4 System Design 55
4.1 Introduction . . . . . . . . . . . . . . . . . . . . . . . . . . . . . . . . 554.2 System Design . . . . . . . . . . . . . . . . . . . . . . . . . . . . . . 56
4.2.1 Suitable Sensor Selection . . . . . . . . . . . . . . . . . . . . 574.2.2 System Development . . . . . . . . . . . . . . . . . . . . . . . 59

xiv Contents
4.2.3 System Validation . . . . . . . . . . . . . . . . . . . . . . . . 604.2.4 UbiSMART Design . . . . . . . . . . . . . . . . . . . . . . . . 604.2.5 System Integration . . . . . . . . . . . . . . . . . . . . . . . . 61
4.3 Conclusion . . . . . . . . . . . . . . . . . . . . . . . . . . . . . . . . 62
5 Methodology 63
5.1 Introduction . . . . . . . . . . . . . . . . . . . . . . . . . . . . . . . . 635.2 Health and Wellness Application . . . . . . . . . . . . . . . . . . . . 64
5.2.1 Quality Processing of Fiber Optic Sensor Data . . . . . . . . 655.2.2 Application Specific Signal Data Quality . . . . . . . . . . . . 665.2.3 Data Processing . . . . . . . . . . . . . . . . . . . . . . . . . 67
5.3 Clinical Application . . . . . . . . . . . . . . . . . . . . . . . . . . . 825.3.1 Experimental Setup and Data Collection . . . . . . . . . . . . 865.3.2 Data Processing . . . . . . . . . . . . . . . . . . . . . . . . . 88
5.4 Real-life Deployment . . . . . . . . . . . . . . . . . . . . . . . . . . . 925.4.1 Data Collection . . . . . . . . . . . . . . . . . . . . . . . . . . 935.4.2 Data Processing . . . . . . . . . . . . . . . . . . . . . . . . . 94
5.5 Conclusion . . . . . . . . . . . . . . . . . . . . . . . . . . . . . . . . 95
6 Results and Discussion 97
6.1 Introduction . . . . . . . . . . . . . . . . . . . . . . . . . . . . . . . . 976.2 Results of Health and Wellness Application . . . . . . . . . . . . . . 97
6.2.1 Wavelet Analysis Versus CEEMDAN Algorithm . . . . . . . 1026.3 Results of Clinical Application . . . . . . . . . . . . . . . . . . . . . 105
6.3.1 Heart and Respiratory Rate Estimation . . . . . . . . . . . . 1056.3.2 Sleep Apnea Event Detection . . . . . . . . . . . . . . . . . . 107
6.4 Results of Real-life Deployment . . . . . . . . . . . . . . . . . . . . . 1116.5 Conclusion . . . . . . . . . . . . . . . . . . . . . . . . . . . . . . . . 117
7 Conclusion and Future Directions 119
7.1 Conclusion . . . . . . . . . . . . . . . . . . . . . . . . . . . . . . . . 1197.2 Future Directions . . . . . . . . . . . . . . . . . . . . . . . . . . . . . 121
Bibliography 123

List of Figures
1.1 Distribution of the world’s population by age and sex, 2017. Source:United Nations, Department of Economic and Social Affairs, Popula-tion Division (2017). World Population Prospects: The 2017 Revision.New York: United Nations. . . . . . . . . . . . . . . . . . . . . . . . 3
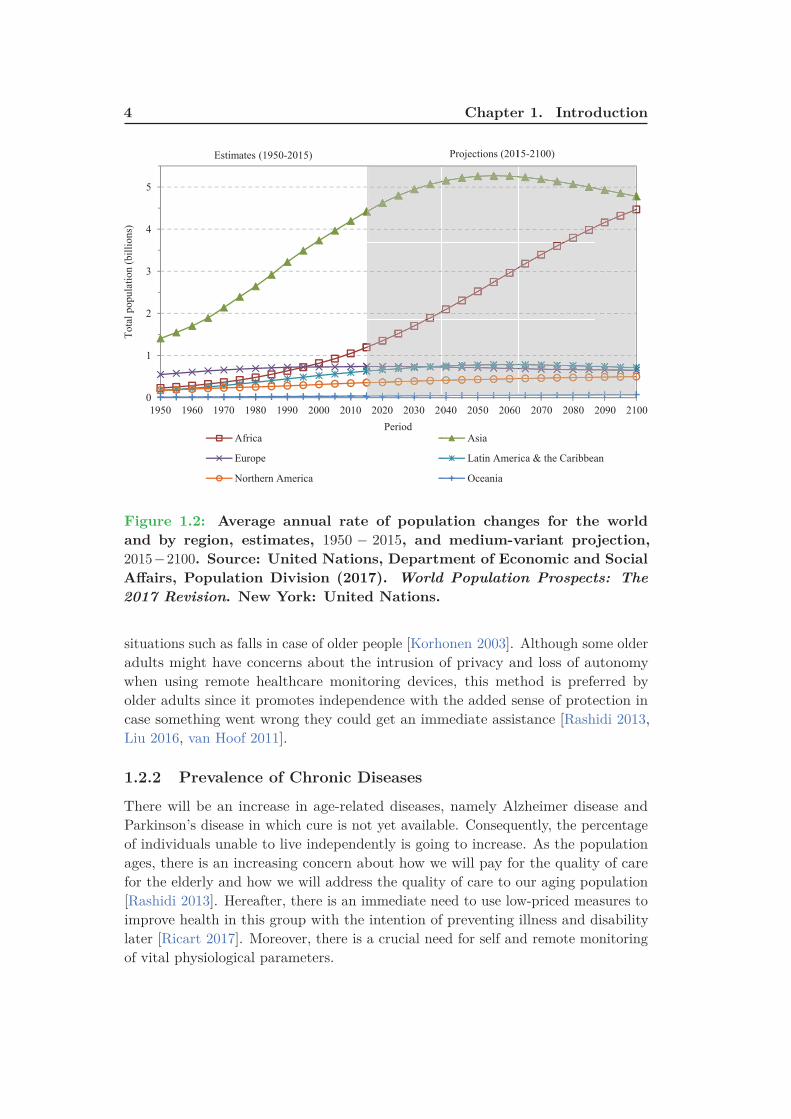
1.2 Average annual rate of population changes for the world and by region,estimates, 1950 − 2015, and medium-variant projection, 2015 − 2100.Source: United Nations, Department of Economic and Social Affairs,Population Division (2017). World Population Prospects: The 2017
Revision. New York: United Nations. . . . . . . . . . . . . . . . . . . 41.3 An illustration of a sensor mat as an example of an IoT device in a
medical setting. . . . . . . . . . . . . . . . . . . . . . . . . . . . . . . 6
2.1 Anatomy of the human heart. . . . . . . . . . . . . . . . . . . . . . . 102.2 A schematic view of the human respiratory system. Retrieved from
Wikimedia Commons website: https://en.wikipedia.org/wiki/
Respiratory_system . . . . . . . . . . . . . . . . . . . . . . . . . . 122.3 A sample hypnogram (defined by electroencephalogram) showing
sleep cycles designated by increasing REM sleep. . . . . . . . . . . . 132.4 An illustration of the location of the various electrodes and sensors
used for monitoring sleep. Image courtesy: British Lung Foundation. 162.5 A 30-second epoch from the PSG. Image adapted from [Basner 2012]. 172.6 Examples of wearable sleep tracker devices; (a) Zeo, (b) SleepImage,
(c) Fitbit, (d) Lark, (e) WakeMate, (f) Jawbone, (g) BodyMediaSenseWear armband, (h) Hexoskin, and (i) OURA. . . . . . . . . . . 21
2.7 Examples of bed-sensor devices; (a) Emfit QS, (b) Beddit, (c) Early-Sense, (d) Sleepace Reston, (e) Withings Aura. . . . . . . . . . . . . 23
3.1 (a) Example of a typical BCG signal with letters used to designatethe waves. The arrow indicates the position of the beginning ofthe electrical ventricular systole (QRS. complex of the electrocardio-gram). Image adapted from [Starr 1939, Starr 1940, Pinheiro 2010b],(b) Aortic arch and force vectors coming from blood ejection by theleft ventricle. Image adapted from [Eblen-Zajjur 2003]. . . . . . . . . 28
3.2 Example of a typical electrocardiogram signal. . . . . . . . . . . . . 29
4.1 The deployable sensor mat and processing unit (Mat dimensions:20 cm × 50 cm × 0.5 cm). . . . . . . . . . . . . . . . . . . . . . . . . 57
4.2 Longitudinal section of the microbend fiber-optic sensor. . . . . . . . 584.3 Simplified view of UbiSMART AAL platform with sleep mat and its
processing unit as a sensor. . . . . . . . . . . . . . . . . . . . . . . . 61

xvi List of Figures
4.4 UbiSMART user interface is organized in tiles and it provides followinginformation: daily quantity of sleep (selected day) with updated bedoccupancy status that changes the color of the icon and status line;aggregated week overview of sleep quantity; and heartbeat information. 62
5.1 Opportunistic remote monitoring of vital signs. . . . . . . . . . . . . 655.2 Screen capture of the labeling tool. . . . . . . . . . . . . . . . . . . . 665.3 Flowchart of the quality processing system. . . . . . . . . . . . . . . 685.4 Two examples for informative and non-informative segments (sampling
frequency: 50Hz). . . . . . . . . . . . . . . . . . . . . . . . . . . . . . 695.5 BCG signal with a reference ECG signal. ECG is shown in 1st row.
However, BCG signal and its 6th decomposition component are shownin 2nd row (sampling frequency: 50Hz). . . . . . . . . . . . . . . . . 71
5.6 Intrinsic mode functions (DC1-DC9) of a typical BCG signal (Fig-ure 5.5); the 6th component shows a match with cardiac cycles (sam-pling frequency: 50Hz). . . . . . . . . . . . . . . . . . . . . . . . . . 74
5.7 An example of a signal data quality processing (sampling frequency:50Hz). . . . . . . . . . . . . . . . . . . . . . . . . . . . . . . . . . . . 76
5.8 An example of a 60-second sleep signal (sampling frequency: 50Hz). 775.9 An example of a 60-second body movement signal (sampling frequency:
50Hz). . . . . . . . . . . . . . . . . . . . . . . . . . . . . . . . . . . . 785.10 An example of a 60-second bed-exit signal (sampling frequency: 50Hz). 795.11 Example for three-level MODWT; h{.} is a high-pass filter, g{.} is
a low-pass filter, W{.} is a wavelet coefficient, and V{.} is a scalingcoefficients. . . . . . . . . . . . . . . . . . . . . . . . . . . . . . . . . 80
5.12 The flowchart of the proposed heart rate estimation method; BM:Body Movement, RR: Respiratory Rate, and MRA: MultiresolutionAnalysis. . . . . . . . . . . . . . . . . . . . . . . . . . . . . . . . . . . 80
5.13 Symlet-8 MODWT multiresolution decomposition of a BCG signal(sampling frequency: 50Hz). . . . . . . . . . . . . . . . . . . . . . . . 81
5.14 The cepstrum of a 30-second ballistocardiogram signal; the heart beatinterval (HBI) is 1.02 seconds. . . . . . . . . . . . . . . . . . . . . . . 82
5.15 The autocorrelation of a 30-second ballistocardiogram signal; theheart beat interval (HBI) is 1.64 seconds. . . . . . . . . . . . . . . . 83
5.16 Drawing representing event and inter-event duration, as well as pre-and post-event amplitude (with upward deflection of flow duringinspiration). Image adapted from [Jaimchariyatam 2013]. . . . . . . 84
5.17 Sleep apnea sensor proposed by Zansors, LLC. Image adapted from[Jennifer 2017] . . . . . . . . . . . . . . . . . . . . . . . . . . . . . . 85
5.18 The positioning of the optical fiber mat on the operating room table. 865.19 Real deployment of the MFOS mat in the operating theatre of Khoo
Teck Puat Hospital. . . . . . . . . . . . . . . . . . . . . . . . . . . . 885.20 System components and operation of ApneaLink device (ApneaLink,
ResMed, San Diego, California, USA). . . . . . . . . . . . . . . . . . 89
List of Figures xvii
5.21 Overall system flowchart; BM: Body Movement, HR: Heart Rate, andRR: Respiratory Rate. . . . . . . . . . . . . . . . . . . . . . . . . . . 90
5.22 An example of a 10-second body movement signal for patient No. 4. 915.23 An example of a 10-second sleep signal for patient No. 4. . . . . . . 925.24 The first, second, and third rows represent a typical 10-second time-
window of the raw signal, the BCG signal along with the 4th waveletsmooth coefficient, and the respiratory signal respectively; amplitudevalues were normalized between -1 and 1. . . . . . . . . . . . . . . . 93
5.25 Overview of our unobtrusive monitoring in a living space. . . . . . . 945.26 Sleep mat integration at the three HDB apartments; (a) 1st home with
mat under sleeping rug, (b) 2nd home with mat under bed mattress,(c) 3rd home with mat under bed mattress. . . . . . . . . . . . . . . 95
5.27 Representation of a participant’s night from our real-life deployment.Three typical signal shapes are labeled according to recognized con-ditions: bed empty, bed motion, sleep. Gantt diagram: Row “B” isthe result of the signal processing from the bed sensor. Row “M”
shows a very inaccurate detection using motion sensors (blank spaceindicates activity detection in other rooms out of scope). Row “S”
indicates the participant’s answer in the survey Table 5.3 about theirwaking and sleeping habits. . . . . . . . . . . . . . . . . . . . . . . . 96
6.1 Bland-Altman plot between the reference ECG-derived heartbeatintervals to associated BCG-derived heartbeat intervals for Group1. 100
6.2 Bland-Altman plot between the reference ECG-derived heartbeatintervals to associated BCG-derived heartbeat intervals for Group2. 101
6.3 Box plots of the average MAE for CEEMDAN algorithm and waveletmethods regarding the average beats per minute across all 50 subjects.103
6.4 BCG signal with the 4th level smooth coefficient during a massagesession (sampling frequency: 50Hz). . . . . . . . . . . . . . . . . . . 104
6.5 Box plots of the average MAE for best wavelet, FFT, cepstrum,and autocorrelation methods regarding the average beats per minuteacross all 50 subjects. . . . . . . . . . . . . . . . . . . . . . . . . . . 105
6.6 (a) Bland-Altman plot and (b) Pearson correlation plot of all patientsregarding the HR measurement. . . . . . . . . . . . . . . . . . . . . . 108
6.7 (a) Bland-Altman plot and (b) Pearson correlation plot of all patientsregarding the RR measurement. . . . . . . . . . . . . . . . . . . . . . 109
6.8 The first and second rows represent a 10-second time window of theBCG signal and the respiratory signal for patient No. 4. . . . . . . . 111
6.9 Bland-Altman plot of waking-up time for resident No. 2; greenbigotimes symbols represent Wednesday. . . . . . . . . . . . . . . . . 112
6.10 Bland-Altman plot of sleep time for resident No. 3 over deploymenttime. . . . . . . . . . . . . . . . . . . . . . . . . . . . . . . . . . . . . 113
6.11 Bland-Altman plot of waking-up time for resident No. 3 over deploy-ment time. . . . . . . . . . . . . . . . . . . . . . . . . . . . . . . . . . 114

xviii List of Figures
6.12 Bland-Altman plot of total sleep time for the 2nd resident over de-ployment time. . . . . . . . . . . . . . . . . . . . . . . . . . . . . . . 115
6.13 Bland-Altman plot of heart rate representation of resident No. 3 overdeployment time. . . . . . . . . . . . . . . . . . . . . . . . . . . . . . 116
6.14 Bland-Altman plot of breathing rate representation of resident No. 2over deployment time. . . . . . . . . . . . . . . . . . . . . . . . . . . 116
6.15 Sleep disturbance distribution for resident No. 2 over deploymenttime; the moving average is computed using a time-window of threedays. . . . . . . . . . . . . . . . . . . . . . . . . . . . . . . . . . . . . 117

List of Tables
3.1 Nomenclature of ballistocardiogram (normal displacement) signal[Scarborough 1956, Pinheiro 2010b]. . . . . . . . . . . . . . . . . . . 30
3.2 Summary of unconstrained monitoring of vital signs using PVDF-based sensors. WT : wavelet transform, N/A: not available, P. Infants:premature infants, M : male, F : female, HR: heart rate, HRV : heartrate variability, RR: respiratory rate, ACF : autocorrelation function,Min: minutes, Hrs: hours, Sec: seconds, CLC : complete-linkage clus-tering, TM : template matching, FREQ: frequency, CEP: cepstrum,PCA: principal component analysis, MAP: maximum amplitude pairs,AMDF : adaptive-window average magnitude difference function, ECG
Sync: electrocardiogram synchronization, EMD: empirical mode de-composition, TH : threshold, CWT : continuous wavelet transform,Lab: laboratory. . . . . . . . . . . . . . . . . . . . . . . . . . . . . . . 36
3.3 Summary of unconstrained monitoring of vital signs using EMFi-based sensors. WT : wavelet transform, N/A: not available, M : male,F : female, HR: heart rate, RR: respiratory rate, ACF : autocorrelationfunction, Min: minutes, Hrs: hours, Sec: seconds, CEP: cepstrum,MAP: maximum amplitude pairs, AMDF : adaptive-window averagemagnitude difference function, EMD: empirical mode decomposition,TH : threshold, LT : linear transform, Lab: laboratory. . . . . . . . . 41
3.4 Summary of unconstrained monitoring of vital signs using Pneumatic-based sensors. N/A: not available, M : male, F : female, HR: heartrate, RR: respiratory rate, Min: minutes, Hrs: hours, Sec: seconds,STFT : short-time Fourier transform, Lab: laboratory. . . . . . . . . 43
3.5 Summary of unconstrained monitoring of vital signs using Pneumatic-based sensors. N/A: not available, M : male, F : female, HR: heartrate, RR: respiratory rate, Min: minutes, Hrs: hours, Sec: seconds,SWM/M : sliding window minimum/maximum, ECG Sync: electrocar-diogram synchronization, PCA: principal component analysis, CCF :cross-correlation function, ED: Euclidean distance, HVS : heart valvesignal, ACF : autocorrelation function, SE : Shannon entropy, EMD:empirical mode decomposition, Lab: laboratory. . . . . . . . . . . . . 46
3.6 Summary of unconstrained monitoring of vital signs using Hydraulic-based sensors. N/A: not available, M : male, F : female, HR: heartrate, RR: respiratory rate, Min: minutes, Hrs: hours, Sec: seconds,WPPD: windowed peak to peak deviation, CA: clustering approach:HT : Hilbert transform, STE : short-time energy, eFUMI : extendedfunction of multiple instances, Lab: laboratory. . . . . . . . . . . . . 49

xx List of Tables
3.7 Summary of unconstrained monitoring of vital signs using Hydraulic-based sensors. N/A: not available, M : male, F : female, HR: heart rate,RR: respiratory rate, Min: minutes, Hrs: hours, Sec: seconds, BP:blood pressure, PPG Sync: Photoplethysmography synchronization:STFT : short-time Fourier transform, CEPS : cepstrum, Lab: laboratory. 54
5.1 Features’ mathematical equations. . . . . . . . . . . . . . . . . . . . 705.2 Patients’ demographic information. . . . . . . . . . . . . . . . . . . . 875.3 Home situation and sleep habits of each resident. . . . . . . . . . . . 95
6.1 10-fold cross validation mean accuracy for Group1 and Group2, (RF:ntrees = 50, SVM: RBF kernel, NN: 50 hidden neuron). . . . . . . . 98
6.2 Accuracy results for testing Group2 Vs. Group1 (Experiment1) andtesting Group1 Vs. Group2 (Experiment2). . . . . . . . . . . . . . . 98
6.3 Confusion Matrix of random forest classifier for testing Group1 Vs.Group2 (Experiment2). . . . . . . . . . . . . . . . . . . . . . . . . . 99
6.4 The MAE for Group1 and Group2 before and after classificationregarding the average beats per minute. . . . . . . . . . . . . . . . . 99
6.5 The mean and standard deviation (SD) of the MAE for MODWTand CEEMDAN regarding the average beats per minute across all 50subjects. . . . . . . . . . . . . . . . . . . . . . . . . . . . . . . . . . . 102
6.6 The mean and standard deviation (SD) of the MAE for best wavelet,FFT, cepstrum, and autocorrelation methods considering the averagebeats per minute across all 50 subjects. . . . . . . . . . . . . . . . . 103
6.7 The mean absolute error of all 10 patients for the average beats perminute computed during the entire study. . . . . . . . . . . . . . . . 106
6.8 The mean absolute error of all 10 patients for the average breaths perminute computed during the entire study. . . . . . . . . . . . . . . . 106
6.9 Sensitivity and specificity of sleep apnea detection . . . . . . . . . . 1106.10 Starting and ending of napping time for resident No. 3. . . . . . . . 113
Chapter 1
Introduction
Contents
1.1 Research Description . . . . . . . . . . . . . . . . . . . . . . . 1
1.2 Current Healthcare Challenges . . . . . . . . . . . . . . . . . 2
1.2.1 Growing Numbers of Elderly People . . . . . . . . . . . . . . 2
1.2.2 Prevalence of Chronic Diseases . . . . . . . . . . . . . . . . . . 4
1.2.3 Shortage of Caregivers . . . . . . . . . . . . . . . . . . . . . . 5
1.2.4 Rising Costs of Healthcare . . . . . . . . . . . . . . . . . . . . 5
1.3 Research Objectives of this Thesis . . . . . . . . . . . . . . . 7
1.4 Structure of the Thesis . . . . . . . . . . . . . . . . . . . . . . 7
1.1 Research Description
Technological progress allows us to take better care of ourselves and our relativeswith less effort. Furthermore, we observe an emergence of Zero-Effort Technologies
(ZET) [Mihailidis 2011]. They represent technological solutions that provide aservice without requiring any form of active participation of the user. Their mainparadigm is to leverage on unobtrusive observations of daily activities and on smartuse of available information. Ambient Assisted Living (AAL) platforms, which is aspecific type of ZET, target improving the quality of life – of both the monitoredperson and their caregivers. Such a platform aims at empowering people who may beat risk without assistance, especially the elderly. It contributes to users’ autonomyin their own living space rather than leaving them completely dependent on others(e.g., a nursing home) [Sadek 2017b].
In this research, we focus on sleep monitoring as a substantial vector of quality oflife. Sleep is one of the most important elements all human needs similar to oxygen,water, and food. Getting enough quality sleep is necessary to a person’s mental health,physiological well-being, quality of life, and safety. Humans spend a third of their life’ssleeping. As advised, among other things, by the U.S. National Institutes of Health,sleep deficiency can lead to fatal health problems. Currently, sleep assessmentsand evaluation tools are burdensome, expensive, and time-consuming. For thesereasons, inexpensive, non-disruptive, and unobtrusive methods to monitor sleepand sleep quality are greatly needed. Healthcare systems worldwide are strugglingwith significant challenges, i.e., rapid growth in aging population, increased number

2 Chapter 1. Introduction
of people with chronic and infectious diseases, rising costs, and inefficiencies inhealth-care systems. As a response to these challenges, the healthcare community isseeking out novel noninvasive solutions that can improve the quality of healthcarefor the patient while maintaining the cost of the service provided. This is where amassive use of Internet of Things devices (wearables, low-energy sensors, beacons,apps) is playing a major shift in the quality of life of the population. To achievethese goals, early diagnosis, prevention, and a more efficient disease managementsystem are highly needed [Koenig 2008]. In the following section, we discuss in moredetail the current challenges facing the healthcare systems.
1.2 Current Healthcare Challenges
Across the world, healthcare challenges can exist in different shapes and forms.Thereafter, it introduces tremendous pressure on the current system. Even thoughevery country faces different challenges and encounters diverse effects, it is stillfeasible to identify overall global risk to current healthcare systems. These challengesare an essential starting point for the work ahead.
Population aging, the prevalence of chronic diseases, shortage of healthcareprofessionals, and the unexpected rise of healthcare costs, among other reasons, arethe major challenges facing today’s healthcare systems. For solving these issues,public and private sector players should collaborate together to find more innovativeand cost-effective systems that can be deployed in out-of-hospital environments[Niewolny 2013]. Nowadays, clouds and the Internet of Things can help improveaccess to care, increase the quality of care and above all reduce the cost of care.The major challenges facing the healthcare communities are discussed in ensuingsubsections.
1.2.1 Growing Numbers of Elderly People
Unlike earlier generations, people are living longer and healthier due to recentadvances in medical science. The elderly populations are growing more rapidly thanany other age group in just about every country around the world. The reasons forthis are declining fertility rates and/or rising life expectancy. In general, the world’spopulation is projected to increase by slightly more than one billion people overthe next 13 years, reaching 8.6 billion in 2030, and to increase further to 9.8 billionin 2050 and 11.2 billion by 2100 (Figure 1.1 and Figure 1.2), more specifically thenumber of older persons in the world is projected to be 1.4 billion in 2030 and 2.1billion in 2050, and could rise to 3.1 billion in 2100.
Over the next few decades, a further increase in the population of older per-sons is almost inevitable, given the size of the cohorts born in recent decades[United Nations 2017]. Typically, aging causes several limitations to older adultsas a result of their cognitive decline, chronic age-related diseases in addition toweaknesses in physical activities, vision, and hearing. Since the number of olderpeople who do require a special care has grown, too few specialists and resources are

1.2. Current Healthcare Challenges 3
5 4 3 2 1 0 1 2 3 4 5
0-4
10-14
20-24
30-34
40-44
50-54
60-64
70-74
80-84
90-94
100+
Percentage
Male Female
Figure 1.1: Distribution of the world’s population by age and sex, 2017.
Source: United Nations, Department of Economic and Social Affairs,
Population Division (2017). World Population Prospects: The 2017 Re-
vision. New York: United Nations.
going to be available to address their needs. Many seniors prefer to stay alone intheir homes. This phenomenon is referred to as aging in place, independent living athome, is denoted as the increased in the number of elders who remain in their ownhomes for the following years in their lives [Ricart 2017]. Providing a healthcareto elders living alone in their homes is a very challenging task given that fact thatmost of the elders might have a physical and/or cognitive decline.
Aging in place (defined as “remaining living in the community, with some level ofindependence, rather than in residential care” [Wiles 2012]) becomes possible thanksto advancements in sensor technology, wireless communications, and informationtechnology. Long-term monitoring of physiological data in real-life environments suchas users’ homes is essential to help manage health problems such as cardiovascularcomplications, diabetes, etc. Usually, recent modalities available to monitor physio-logical data can be divided into two main categories: non-wearable and wearablesensors. The non-wearable sensors can be integrated with home furnishings andstructures, whereas the wearable sensors can be embedded in a form factor of, forinstance, a wristwatch, bracelet, or ring, etc.
The benefit of these sensors is that they can monitor several variables fromindividuals in their own homes during their normal daily activities. In addition,they can observe trends in physiological data over an extended period of timeas well as automatically alert healthcare professionals or caregivers in emergency
4 Chapter 1. IntroductionT
ota
l p
op
ula
tion
(b
illi
on
s)
0
1
2
3
4
5
1950 1960 1970 1980 199
Africa
Europe
Northern Am
Estimates (1950-2
90 2000 2010
merica
2015)
2020 2030 20
Period
040 2050 2060
Asia
Latin Ameri
Oceania
Projections (201
0 2070 2080 2
ica & the Caribbea
15-2100)
2090 2100
an
Figure 1.2: Average annual rate of population changes for the world
and by region, estimates, 1950 − 2015, and medium-variant projection,
2015−2100. Source: United Nations, Department of Economic and Social
Affairs, Population Division (2017). World Population Prospects: The
2017 Revision. New York: United Nations.
situations such as falls in case of older people [Korhonen 2003]. Although some olderadults might have concerns about the intrusion of privacy and loss of autonomywhen using remote healthcare monitoring devices, this method is preferred byolder adults since it promotes independence with the added sense of protection incase something went wrong they could get an immediate assistance [Rashidi 2013,Liu 2016, van Hoof 2011].
1.2.2 Prevalence of Chronic Diseases
There will be an increase in age-related diseases, namely Alzheimer disease andParkinson’s disease in which cure is not yet available. Consequently, the percentageof individuals unable to live independently is going to increase. As the populationages, there is an increasing concern about how we will pay for the quality of carefor the elderly and how we will address the quality of care to our aging population[Rashidi 2013]. Hereafter, there is an immediate need to use low-priced measures toimprove health in this group with the intention of preventing illness and disabilitylater [Ricart 2017]. Moreover, there is a crucial need for self and remote monitoringof vital physiological parameters.
1.2. Current Healthcare Challenges 5
1.2.3 Shortage of Caregivers
The number of healthcare practitioners and caregivers trained to deal with agingpopulations will be limited. As a result, family members or relatives should informallyreplace the caregivers. Observing dependent individuals at home might cause somedifficulties to family members such as higher levels of painfulness and physical healthproblems [Ricart 2017]. Well-designed and -implemented technology can extend thereach of caregivers, ultimately offsetting the rising cost of healthcare and the needfor skilled caregivers. To give some examples, remote health monitoring technologiessuch as wearable devices and video teleconferences are now making it possible formonitoring to come to patients with disabilities rather than vice-versa.
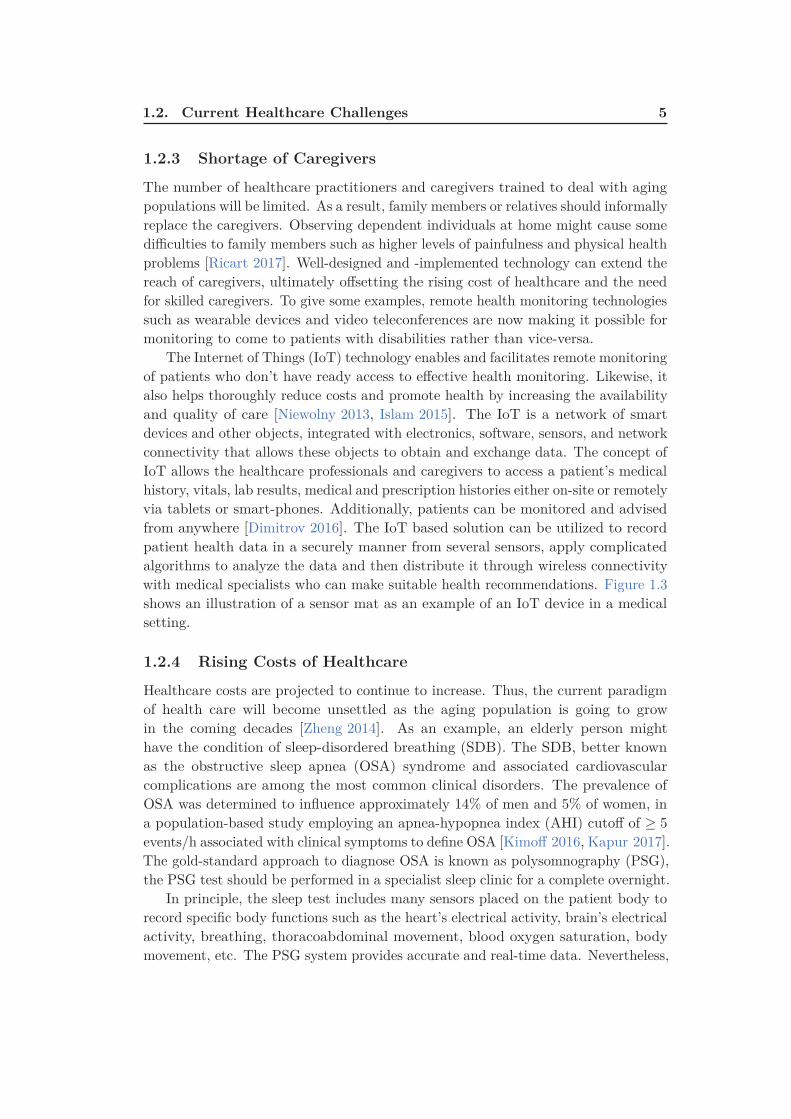
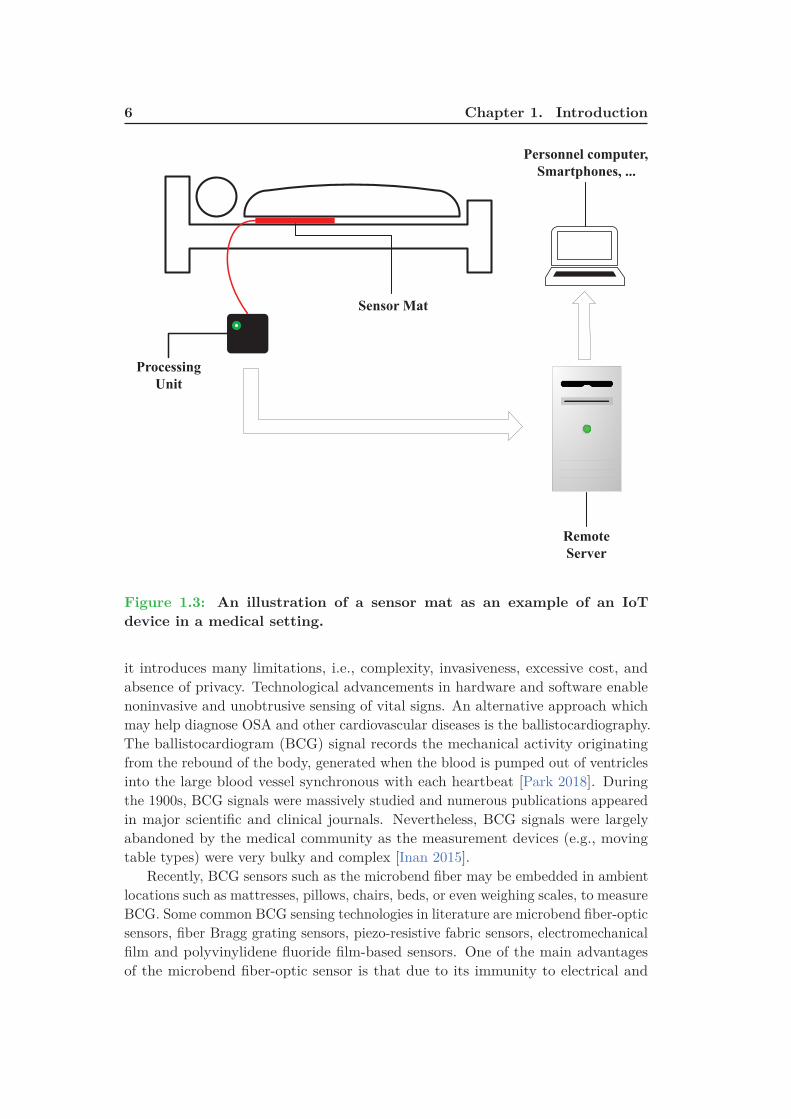
The Internet of Things (IoT) technology enables and facilitates remote monitoringof patients who don’t have ready access to effective health monitoring. Likewise, italso helps thoroughly reduce costs and promote health by increasing the availabilityand quality of care [Niewolny 2013, Islam 2015]. The IoT is a network of smartdevices and other objects, integrated with electronics, software, sensors, and networkconnectivity that allows these objects to obtain and exchange data. The concept ofIoT allows the healthcare professionals and caregivers to access a patient’s medicalhistory, vitals, lab results, medical and prescription histories either on-site or remotelyvia tablets or smart-phones. Additionally, patients can be monitored and advisedfrom anywhere [Dimitrov 2016]. The IoT based solution can be utilized to recordpatient health data in a securely manner from several sensors, apply complicatedalgorithms to analyze the data and then distribute it through wireless connectivitywith medical specialists who can make suitable health recommendations. Figure 1.3shows an illustration of a sensor mat as an example of an IoT device in a medicalsetting.
1.2.4 Rising Costs of Healthcare
Healthcare costs are projected to continue to increase. Thus, the current paradigmof health care will become unsettled as the aging population is going to growin the coming decades [Zheng 2014]. As an example, an elderly person mighthave the condition of sleep-disordered breathing (SDB). The SDB, better knownas the obstructive sleep apnea (OSA) syndrome and associated cardiovascularcomplications are among the most common clinical disorders. The prevalence ofOSA was determined to influence approximately 14% of men and 5% of women, ina population-based study employing an apnea-hypopnea index (AHI) cutoff of ≥ 5
events/h associated with clinical symptoms to define OSA [Kimoff 2016, Kapur 2017].The gold-standard approach to diagnose OSA is known as polysomnography (PSG),the PSG test should be performed in a specialist sleep clinic for a complete overnight.
In principle, the sleep test includes many sensors placed on the patient body torecord specific body functions such as the heart’s electrical activity, brain’s electricalactivity, breathing, thoracoabdominal movement, blood oxygen saturation, bodymovement, etc. The PSG system provides accurate and real-time data. Nevertheless,
6 Chapter 1. Introduction
Sensor Mat
Processing
Unit
Remote
Server
Personnel computer,
Smartphones, ...
Figure 1.3: An illustration of a sensor mat as an example of an IoT
device in a medical setting.
it introduces many limitations, i.e., complexity, invasiveness, excessive cost, andabsence of privacy. Technological advancements in hardware and software enablenoninvasive and unobtrusive sensing of vital signs. An alternative approach whichmay help diagnose OSA and other cardiovascular diseases is the ballistocardiography.The ballistocardiogram (BCG) signal records the mechanical activity originatingfrom the rebound of the body, generated when the blood is pumped out of ventriclesinto the large blood vessel synchronous with each heartbeat [Park 2018]. Duringthe 1900s, BCG signals were massively studied and numerous publications appearedin major scientific and clinical journals. Nevertheless, BCG signals were largelyabandoned by the medical community as the measurement devices (e.g., movingtable types) were very bulky and complex [Inan 2015].
Recently, BCG sensors such as the microbend fiber may be embedded in ambientlocations such as mattresses, pillows, chairs, beds, or even weighing scales, to measureBCG. Some common BCG sensing technologies in literature are microbend fiber-opticsensors, fiber Bragg grating sensors, piezo-resistive fabric sensors, electromechanicalfilm and polyvinylidene fluoride film-based sensors. One of the main advantagesof the microbend fiber-optic sensor is that due to its immunity to electrical and

1.3. Research Objectives of this Thesis 7
electromagnetic interference it is a very suitable tool to be implemented in themagnetic resonance imaging environment. Other advantages include small size,lightweight, and lower price. Additionally, the sensor is an appropriate choice forunconstrained and long-term monitoring of vital signs as it is highly sensitive topressure changes induced due to the ballistic forces of the heart, while not requiredto be in close contact with the body [Sadek 2017a].
1.3 Research Objectives of this Thesis
1. Design and developing a robust system for remotely collecting vital physiologi-cal signs namely heart rate, respiration, and body movement unobtrusivelyfrom subjects in their beds.
2. Design and developing a robust system for remotely monitoring the quality ofsleep unobtrusively from subjects in their beds.
3. Deploying and validating the proposed system in a clinical setting.
4. Deploying the proposed system in real-life environments such as users’ homes.
5. Integrating the proposed system within an existing ambient assisted livingplatform known as UbiSMART.
1.4 Structure of the Thesis
This thesis is structured as discussed below:
1. Chapter 1 describes the problem statement as well as general informationabout current healthcare challenges, namely growing number of older adults,the prevalence of chronic diseases, shortage of caregivers, and rising costs ofhealthcare. This chapter ends with the research aims and the thesis outline.
2. Chapter 2 briefly describes the human physiology, including cardiovascularand respiratory systems. The sleep cycles are also discussed, which consistof rapid eye movement sleep and non-rapid eye movement sleep. At last,the chapter discusses the gold-standard for assessing sleep and some of theavailable sleep monitoring technologies. These devices could be wearablessuch as bracelets; smart-watches or non-wearables like bed-sensors that canbe installed underneath the user’s bed mattress.
3. Chapter 3 gives a summary about ballistocardiography and how it has beenevolved over time to reach an acceptable level for healthcare providers. Thischapter also gives a comprehensive review of available sensors used in literatureto analyze and interpret ballistocardiogram signals. These sensors includemicrobend fiber-optic sensors, piezo-resistive fabric sensors, electromechanicalfilm and polyvinylidene fluoride film-based sensors, load cells, strain gauges,pneumatic, and hydraulic sensors.

8 Chapter 1. Introduction
4. Chapter 4 covers the operating principle of the proposed sensor, i.e., mi-crobend fiber-optic sensor. Likewise, it discusses our system development cycle.Furthermore, it presents how the proposed system is validated in health andclinical environments. Finally, it shows how the system is integrated withinan existing Ambient Assisted Living platform.
5. Chapter 5 discusses in detail the proposed methodology to analyze thedata acquired by the optical fiber sensor. Various algorithms have beenimplemented such as empirical mode decomposition, wavelet analysis, frequencyanalysis, and autocorrelation function to analyze ballistocardiogram signals,and therefore interbeat intervals can be computed unobtrusively. Moreover, thedata collection protocol for the two validation phases is also discussed. Waveletanalysis shows superior results compared with other algorithms. At last, thereal-life deployment of the proposed system in user’s homes is provided.
6. Chapter 6 describes results and discussions about the proposed methodologyto analyze the optical fiber data, in which a comparative study between variousalgorithms is provided. It also shows the suitability of the proposed sleepmonitoring system for unobtrusive vital signs monitoring in a clinical setting.Moreover, it discusses in detail the results of our real-life deployment in threeusers’ apartments in one month’s time.
7. Chapter 7 summarizes the main results, conclusions, limitation of the pro-posed system. In addition, it recommends some key factors to enhance theproposed methodology, and therefore it can provide continuous motoring ofphysiological functions.

Chapter 2
Background
Contents
2.1 Introduction . . . . . . . . . . . . . . . . . . . . . . . . . . . . 9
2.2 Cardiovascular System . . . . . . . . . . . . . . . . . . . . . . 10
2.3 Respiratory System . . . . . . . . . . . . . . . . . . . . . . . . 11
2.4 Physiology of Sleep . . . . . . . . . . . . . . . . . . . . . . . . 13
2.5 Sleep Monitoring . . . . . . . . . . . . . . . . . . . . . . . . . . 14
2.6 Polysomnography . . . . . . . . . . . . . . . . . . . . . . . . . 15
2.7 Actigraphy . . . . . . . . . . . . . . . . . . . . . . . . . . . . . 17
2.8 Consumer Sleep Tracking Devices . . . . . . . . . . . . . . . 18
2.8.1 Wearable Sleep Tracking Devices . . . . . . . . . . . . . . . . 19
2.8.2 Sleep Tracking Apps on Smart-phones . . . . . . . . . . . . . 20
2.8.3 Bed-Based Sleep Tracking Devices . . . . . . . . . . . . . . . 22
2.9 Conclusion . . . . . . . . . . . . . . . . . . . . . . . . . . . . . 25
2.1 Introduction
Sleep is a very significant biological function for the human being and is importantto have a physical balance and a proper regime for decent quality of life. Inadequatequality and quantity of sleep can lead to a severe influence on an individual health.As a result, sleep analysis is a very important step towards the detection anddiagnosis of sleep problems. Understanding cardiovascular and respiratory systemsis essential for analyzing sleep and sleep cycles, this is because the active processesin the human body are different in sleep and wakefulness. Typically, analyzinga person’s sleep requires an overnight sleep test or polysomnography that allowsmonitoring of several physiological functions a long with sleep cycles. Although thepolysomnography or as known as the gold standard for sleep monitoring providesreal-time and accurate information about sleep it is cumbersome, expensive, andtime-consuming. Thus, the healthcare community is seeking out inexpensive andmobile devices that can support a long-term data collection and be accessible tomost of the people. Actigraph is a very famous example that can be used forsleep analysis. The device is not as accurate as the polysomnography. However,the provided information which is based on the users’ activity is very importantfor healthcare professionals to understand and analyze the sleep behavior of the

10 Chapter 2. Background
users. As the hardware and software technology is advancing very fast, severaldevices and mobile Apps have been developed for general healthcare monitoring,including sleep. These devices could be wearable such as bracelets or smart-watchesor non-wearable like bed-sensors that can be installed underneath the user’s bedmattress. We briefly explain the human physiology, including cardiovascular andrespiratory systems in Section 2.2 and Section 2.3, respectively. The physiologicalaspects of sleep are discussed in Section 2.4. Sleep monitoring and available sleepmonitoring technologies are provided in Section 2.5, Section 2.6, Section 2.7, andSection 2.8, respectively. Finally, the chapter is concluded in Section 2.9.
2.2 Cardiovascular System
The cardiovascular system is an extensive network which achieves two main tasksas follows. First, it transports oxygen and nutrients to body organs. Second, iteliminates waste products formed by the metabolism of nutrients from the tissuecells. It consists of the heart and the blood vessels that circulate blood throughoutthe entire body [Tortora 2008].
The heart, the primary organ of the cardiovascular system, is positioned somewhatto the left of the center of the chest, i.e., between the two lungs and is shielded bythe rib cage. The adult heart is roughly the size of a large fist.
The human heart (Figure 2.1) consists of four chambers, i.e., two atria and twoventricles. The atria are the upper chambers that receive blood while the ventriclesare the lower chambers that pump blood. The right atrium receives the blood
Figure 2.1: Anatomy of the human heart.
2.3. Respiratory System 11
returning to the heart and then pumps it to the right ventricle. Next, the rightventricle pumps the deoxygenated blood to the lungs to be enriched with oxygen.Afterward, the blood is returned to the left atrium throughout the pulmonary veins.The left atrium contracts and sends the blood to the left ventricle. At last, theleft ventricle sends the blood through the aorta into the circulatory network. Theleft ventricle requires a thick muscular wall so that it can pump the blood all theway around the body. The blood in the heart is kept moving in a forward directionthanks to a system of four one-way valves. During the time of contraction, thevalves open to allow blood through, and close to prevent the blood flowing in theopposite direction when the chambers relax. Moreover, the valve system acts tosustain different pressure on the right and left sides of the heart.
The cardiac cycle, the electrical activity regulating the rhythmic contraction andrelaxation of the heart’s chambers, consists of two main phases, namely diastole,and systole. Diastole is the relaxation of the heart’s muscles, and it takes upapproximately two-thirds of the cycle. Systole is the contraction of the heart’smuscles, in particular, the ventricles, which takes the remaining one-third of thecycle. During the time of diastole, the two atria contract following the impulseoriginated in the sinus node. As a result, the blood is propelled from the atria tothe ventricles. During systole, the blood is ejected into the pulmonary artery andthe aorta, respectively. The cardiac output (CO) is the amount of blood ejectedfrom the left ventricle of the heart per minute. The cardiac output is the product ofthe heart rate (HR) multiplied by the stroke volume (SV) and is measured in litersper minute (L/m) as follows [Tortora 2008]:
CO = HR × SV (2.1)
The heart rate is the number of times the heart contracts or beats per minute (bpm).The stroke volume is the amount of blood ejected from the left ventricle with eachheartbeat (one contraction and relaxation of the heart muscle) of the heart rate. Itis measured in milliliters per beat (ml/beat); a decrease in the stroke volume is oneof the early signs of the failing heart.
2.3 Respiratory System
The respiratory system or a.k.a., the ventilator system plays a key role in control-ling homeostasis, i.e., balance between the multiple parts of the body’s internalenvironment. The respiratory system is responsible for gas exchange in the body,delivering vital oxygen to the body and removing toxic carbon-dioxide. It canachieve such important tasks during different activity levels from unconscious sleepto consciousness levels of maximal endeavor [Story 2017]. A schematic view of thehuman respiratory system is shown in Figure 2.2. The respiratory system can bedivided into two main parts: upper airways and lower airways. The upper airwayconsists of the nose, the paranasal cavities, i.e., sinuses, the pharynx, and part ofthe oral cavity. The function of the nose, paranasal cavities, and pharynx is to

12 Chapter 2. Background
Figure 2.2: A schematic view of the human respiratory system. Re-
trieved from Wikimedia Commons website: https://en.wikipedia.org/
wiki/Respiratory_system
warm, filter, and humidify the inspired air when it enters the respiratory tract. Thefiltering process is very important due to several reasons, among them clearing theinhaled air of dust and other debris and protecting the passage through the lungsagainst any potentially infectious foreign agents. The oral cavity is responsible forrespiration as well as enabling sensation and smell. The main components of thelower airways encompass the larynx, trachea, and lungs. The larynx and tracheaprovide a channel for the pathway of air to the lungs whereas the lungs themselvesreceive the air and promote the gas exchange process [Rogers 2010]. The respiratorycycle consists of one respiration followed by one expiration. Ventilation (V) is theamount of air breathed in (inspiration) and out (expiration) during one minute. Itcan be computed by multiplying tidal volume (TV) and respiratory rate (RR) asfollows:
V = TV × RR (2.2)
The tidal volume is the volume of air that enters or leaves during a single respiratorycycle. The respiratory rate is the amount of breaths per minute.
2.4. Physiology of Sleep 13
2.4 Physiology of Sleep
Knowing the basic principles of the sleep-wake cycle is very helpful to understandthe importance of sleep. In human, the sleep-wake cycle involves approximately eighthours of nocturnal sleep and sixteen hours of daytime wakefulness. Two internalinfluences control the sleep-wake cycle, i.e., homeostasis and circadian rhythms. Thehomeostasis is the process of which the body maintains a steady state of internalconditions such as blood pressure, body temperature, and acid-base balance. Inaddition, the amount of sleep each night is also under the homeostatic control. Thecircadian rhythms are driven by the brain’s biological clock, and it is referred toas cyclical changes. These cyclical changes are, for example, fluctuations in bodytemperature, hormone levels, and sleep that happen over a 24-hour period. In human,the biological clock contains a set of neurons in the hypothalamus of the brain knownas the suprachiasmatic nucleus. In physiology and behavior, these 24-hour rhythms
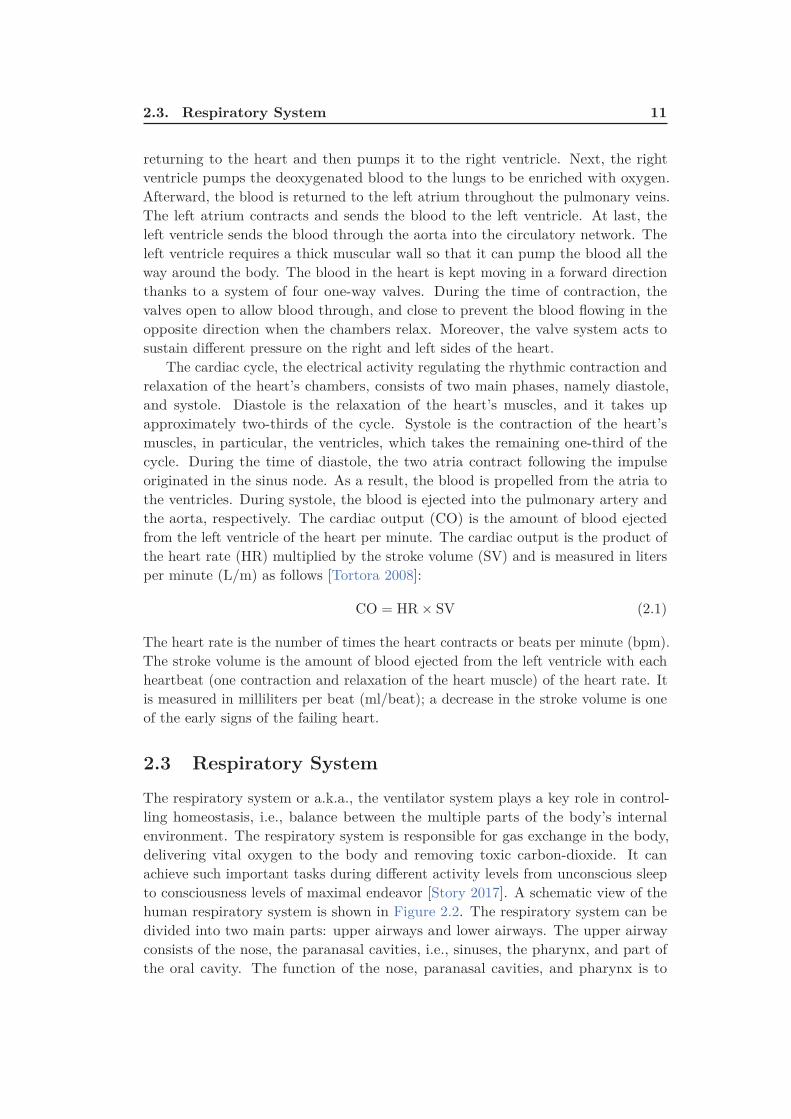
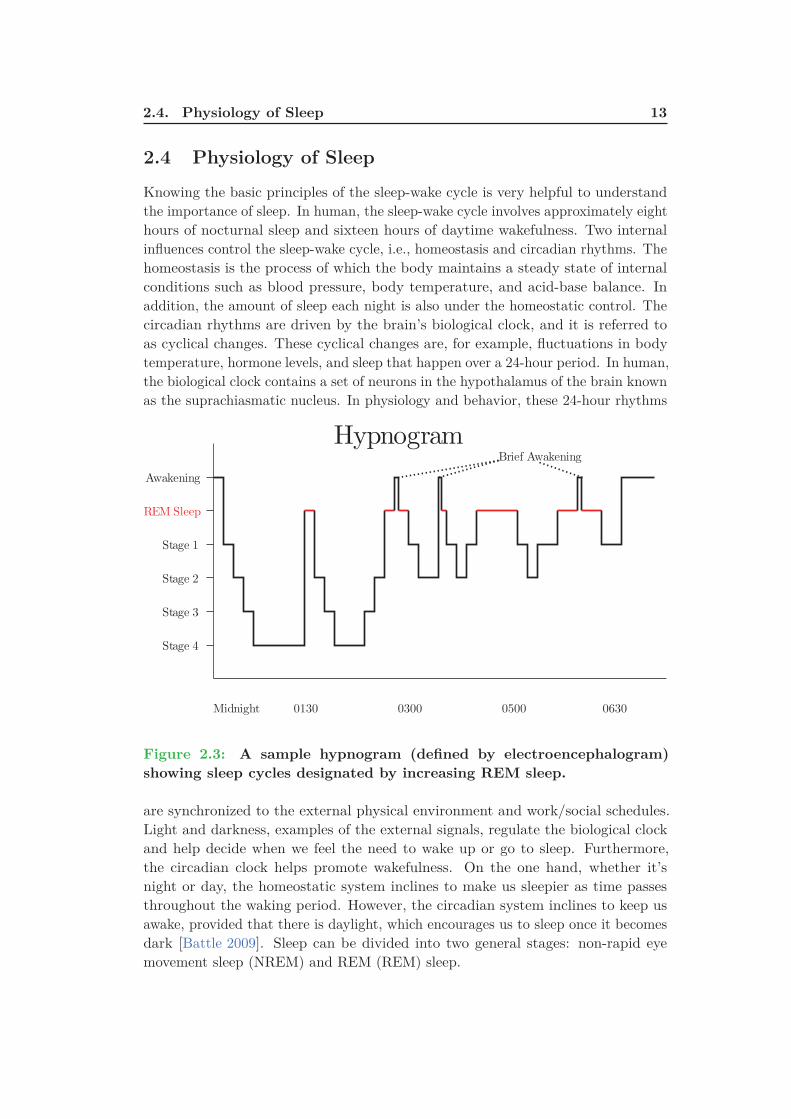
Figure 2.3: A sample hypnogram (defined by electroencephalogram)
showing sleep cycles designated by increasing REM sleep.
are synchronized to the external physical environment and work/social schedules.Light and darkness, examples of the external signals, regulate the biological clockand help decide when we feel the need to wake up or go to sleep. Furthermore,the circadian clock helps promote wakefulness. On the one hand, whether it’snight or day, the homeostatic system inclines to make us sleepier as time passesthroughout the waking period. However, the circadian system inclines to keep usawake, provided that there is daylight, which encourages us to sleep once it becomesdark [Battle 2009]. Sleep can be divided into two general stages: non-rapid eyemovement sleep (NREM) and REM (REM) sleep.

14 Chapter 2. Background
In the first stage, i.e., the NREM sleep, the physiological activities are reduced.When we get deeper into sleep, the brain activities become slower and have a greateramplitude as measured by the electroencephalogram. Moreover, the breathingand heart rate slow down, and blood pressure drops. The NREM sleep is furthersubdivided into four stages as follows [Battle 2009]:
1. First Stage is the period of time from being awake to falling asleep. The1st stage is characterized by a reduction in brain waves and muscle activity.During this stage, people might encounter sudden muscle jerks headed by afalling sensation.
2. Second Stage is considered as a light sleep period, where the eye movementsstop. During the 2nd stage, the brain activities become slower with sleepspindles, i.e., infrequent bursts of rapid waves. The sleep spindles are combinedwith uncontrollable episodes of muscle tone coupled with periods of musclerelaxation. Additionally, the heart rate decreases and body temperature drops.
3. Third Stage and Fourth Stage or a.k.a., slow-wave sleep / deep sleep isidentified by slow brain waves (i.e., delta waves) scattered with smaller fasterwaves. During slow-wave sleep, the physiological activities decrease, and thebody temperature falls even lower. In addition, the body becomes stationary.As eyes are not moving and the muscle’s activity decreases, the sleep becomesdeeper even though the muscles maintain their ability to work. Waking duringthe slow-wave sleep is very difficult. People will feel dizzy or disoriented forsome minutes if they wake during these stages. Some children might undergobed-wetting, sleepwalk, or night terrors during this stage.
The second stage, i.e., the REM sleep is a unique phase of sleep, where the brainwaves become very intense. Similar to those in the waking state, brain activitiesbecome faster and desynchronized. In addition, breathing waves becomes morerapid, irregular, and shallow; the eyes move rapidly in different directions, and limbmuscles become temporarily paralyzed. Furthermore, heart rate increases, and bloodpressure rises. The most memorable and vivid dreams occur during this stage aswell. It is also believed that the REM sleep plays a vital role to consolidate thememory, synthesize and organize the cognition, and regulate the mood [Battle 2009].Figure 2.3 shows the electroencephalogram of a sleep cycle described by increasingREM sleep.
2.5 Sleep Monitoring
Sleep monitoring is described as the process of obtaining a qualitative sleep metricsby monitoring a person’s sleep throughout the night. These metrics serves twofunctions. One is to formulate an objective view of the quality of a person’s sleep.The other function is to determine the trends in sleep over time. Respiratory rate andbody movements are considered the most related measurements for sleep monitoring

2.6. Polysomnography 15
during the sleeping session. The respiratory rate and respiratory rate variabilityare used for REM sleep identification, while the movement metrics are utilized todiscriminate between deep sleep, light sleep, and the waking stages of sleep. Severalsleep parameters can also be extracted, for example, duration of a sleep period, thenumber of awakenings, duration of disturbed sleep periods, and the amount of timerequired to fall asleep. Monitoring quality of sleep can be performed using variousdevices that use a combination of sensors and sensor technology to examine theuser’s sleep patterns [Seebo 2017]. In the following sections, we discuss some of thecommon techniques used to monitor and assess the quality of sleep.
2.6 Polysomnography
The term polysomnography (PSG) or a.k.a., the gold standard for sleep qualitymonitoring, is a complete recording of the biophysiological variations that occurduring sleep. In general, the PSG is an all-night test in a specialized sleep clinic.However, it might be performed during the day if this occurs to be the patient majorsleep period, such as the patients with specific circadian rhythm disorders, wheretheir regular bedtime is during the day.
Three main information can be inferred from the PSG study as follows. First,monitoring, staging and characterizing sleep. Second, identifying sleep-disorderedbreathing and its outcomes. Third, quantifying periodic limb movements duringsleep. Furthermore, the PSG can also provide information about irregular behaviorsduring sleep, i.e., parasomnias [Koenig 2008]. During a PSG study, several sensorsare mounted on various parts of the body in order to detect multiple physiologicalparameters in real-time (Figure 2.4). These physiological parameters can be detailedas follows:
• Electroencephalography (EEG) records the electrical activities of a person’sbrain using metal electrodes attached to the skin of the scalp to monitor threemain regions of the brain such as frontal, central, and occipital, i.e., back. TheEEG plays a vital role in determining the sleep stages of the patient.
• Electrooculography (EOG) monitors the eye movements, in which two leadsare used and one is placed on the outside of each eye. The EOG also plays arole in determining the stages of sleep based on eye movements.
• Electromyography (EMG) measures muscle activities. Four electrodesmight be used for the monitoring process such as two electrodes mounted onthe chin and the other two placed on each leg close to the shin. The EMG canbe employed to help diagnose sleep-related movement disorders such as restlessleg syndrome, periodic limb movement disorder, and REM sleep behaviordisorder.
• Electrocardiography (ECG / EKG) records the electrical activities of theheart using two to three electrodes on the person’s chest.

16 Chapter 2. Background
Figure 2.4: An illustration of the location of the various electrodes and
sensors used for monitoring sleep. Image courtesy: British Lung Foun-
dation.
• Respiratory effort measures the movements of the chest and abdominalwall. Two belts are used such as one belt around the chest and one aroundthe diaphragm.
• A nasal cannula/pressure transducer is inserted into the nostrils tomonitor changes in inhalation and exhalation as well as breathing rate.
• A pulse oximeter is placed on the patient’s finger in order to measure
2.7. Actigraphy 17
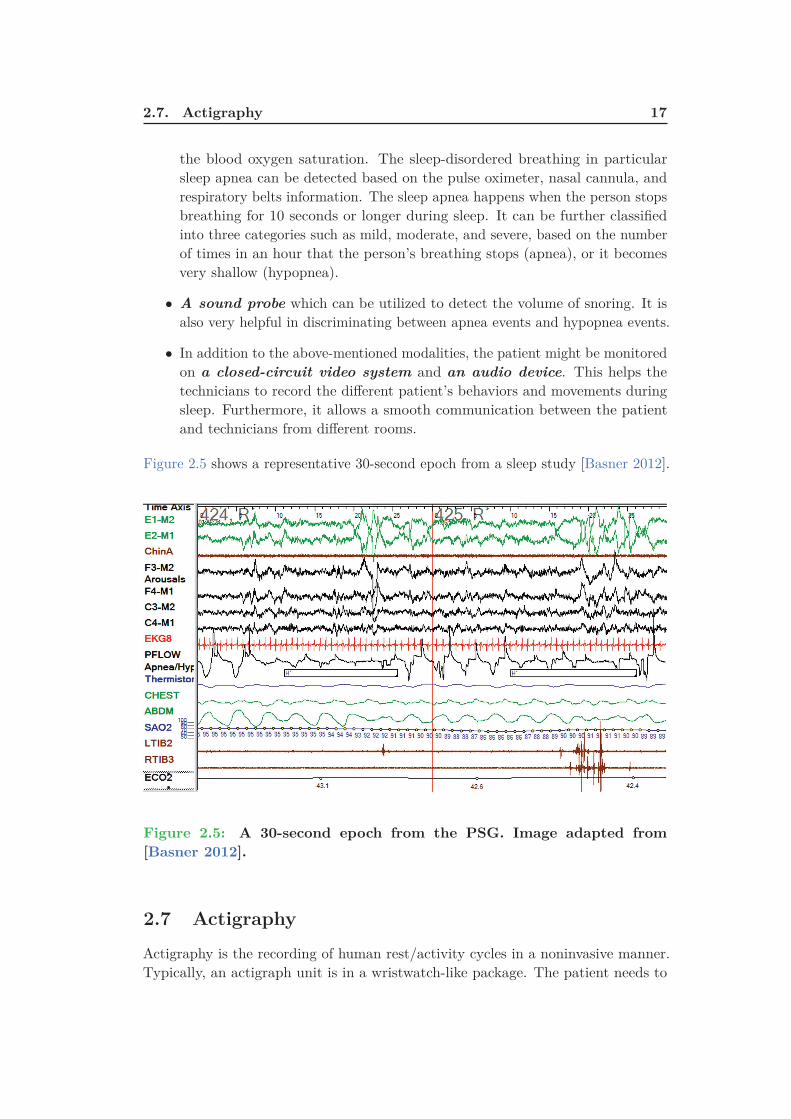
the blood oxygen saturation. The sleep-disordered breathing in particularsleep apnea can be detected based on the pulse oximeter, nasal cannula, andrespiratory belts information. The sleep apnea happens when the person stopsbreathing for 10 seconds or longer during sleep. It can be further classifiedinto three categories such as mild, moderate, and severe, based on the numberof times in an hour that the person’s breathing stops (apnea), or it becomesvery shallow (hypopnea).
• A sound probe which can be utilized to detect the volume of snoring. It isalso very helpful in discriminating between apnea events and hypopnea events.
• In addition to the above-mentioned modalities, the patient might be monitoredon a closed-circuit video system and an audio device. This helps thetechnicians to record the different patient’s behaviors and movements duringsleep. Furthermore, it allows a smooth communication between the patientand technicians from different rooms.
Figure 2.5 shows a representative 30-second epoch from a sleep study [Basner 2012].
Figure 2.5: A 30-second epoch from the PSG. Image adapted from
[Basner 2012].
2.7 Actigraphy
Actigraphy is the recording of human rest/activity cycles in a noninvasive manner.Typically, an actigraph unit is in a wristwatch-like package. The patient needs to

18 Chapter 2. Background
wear the unit for a week or more to measure entire motor activity. The movementsthat the actigraph unit receives are regularly recorded and some units also includelight exposure. The data can be later read by a computer and interpreted offline;in some new sensors, the data are transmitted and analyzed in real-time. Thecurrent actigraphs use accelerometers that produce different values according tovariations in orientation and the speed wherein the variation exists [Liu 2017b]. Theobjective is to sample these values multiple times a second and accumulate themover a period of time. At last, they are locally stored on the device and fetched ata later time. The actigraphs are able to record movements for many days, thanksto the accumulation of the data. As a result, they can provide a long-term dataabout circadian rhythms and the person’s activity patterns. Previously, the dataobtained from the analog actigraphs had to be manually scored through a verytime-consuming process. However, the scoring process becomes fully automated bycomputer algorithms installed in digital actigraphs.
Patients can put the actigraphs either on the wrist or on the ankle so thatthe different limb movements can be tracked. The movement received from theankle is very important in monitoring limb movements and/or restless syndrome.Actigraphs can provide very useful information about the sleep quality due to itslongitudinal nature of data collection and its suitability to be used in the subjects’homes. Additionally, actigraphs allow researchers to conduct studies at nursinghomes and assisted-living communities for both memory care and non-memory careresidents. These studies can provide more information about the causes and signsof dementia along with a better understanding of the sleep modes of the residentsand how their sleep requirements might deviate from people in other stages of life[Koenig 2008]. Although wearable sensors such as actigraphs can provide a long-termdata collection about the user’s sleep status, they might cause inconvenience to thedaily lives of older adults. This is not always true, and it might depend on the levelof education and the ability to learn and accept recent technologies.
2.8 Consumer Sleep Tracking Devices
In recent years, a lot of sensor technologies have been employed, particularly tomonitor sleep-wake patterns together with the gold standard polysomnography andactigraphy; these sensor technologies are usually denoted as consumer sleep trackingdevices.
In general, consumer sleep tracking devices are just like actigraphs becausethey allow the users to be mobile and sleep as normal while being monitoredclosely. Most of the commercially available sleep monitors pretend to help provideinformation about sleep duration, quality of sleep, enabling subjects to awaken onlyfrom light sleep. Typically, the data obtained from consumer sleep tracking devicesare not intended for routine diagnosis of sleep disorders. However, technologicaladvancements in hardware and software, accessibility, ready availability allows thepublic to adopt them for clinical purposes.
2.8. Consumer Sleep Tracking Devices 19
We summarize some of the consumer sleep tracking devices in following subsec-tions [Kelly 2012, Russo 2015, Jeon 2015, Kolla 2016, Ong 2016]:
2.8.1 Wearable Sleep Tracking Devices
2.8.1.1 ZeoTM
The device (Figure 2.6(a)) utilizes a headband to collect a combination of EEG andEMG signals from the forehead region. It classifies a 30-second epoch into lightNREM, deep NREM, and REM sleep.
2.8.1.2 SleepImageTM
The device (Figure 2.6(b)) records ECG signal, actigraphy, and body movementsusing a wire electrode attached to the chest with sticky pads. It helps provideknowledge about total time of sleep, quality of sleep, and the number of awakeningthat happen during sleep.
2.8.1.3 FitbitTM and Fitbit UltraTM
The device (Figure 2.6(c)) is an activity tracker that can provide information aboutsleep based on movement. The device can discriminate between sleep and wake aswell as provide information about total time of sleep, sleep latency, i.e., the lengthof time an individual can take to achieve the transition from full wakefulness tosleep and an arousal index.
2.8.1.4 LarkTM
The device (Figure 2.6(d)) is a wrist-watch actigraphy that features a silent vibratingalarm. It also can give information about total sleep duration, sleep latency, a sleepquality index. The device needs to be connected to an iPhone.
2.8.1.5 WakeMateTM
Another example of wrist-watch actigraphy is the WakeMate (Figure 2.6(e)). Itcan provide sleep information such as total sleep time, sleep latency, number ofawakenings, and a quality of sleep. The sleep information can be transmitted to asmart-phone. Similar to other devices it has the smart-alarm feature to awaken thewearer at an optimal time within a time-window that ends in the final alarm setting.
2.8.1.6 JawboneTM and Jawbone UPTM
The device (Figure 2.6(f)) is a wrist-watch actigraphy (bracelet-like) that can connectto an iPhone. The sleep tracking is performed using bio-impedance sensors. Itis claimed that the device can distinguish between light and deep sleep, althoughstandard actigraphy does not allow such distinction. Furthermore, it is claimed that
20 Chapter 2. Background
the device can allow the wearer to awaken at an optimal time via a smart-alarmfeature.
2.8.1.7 BodyMedia SenseWear armbandTM
This device (Figure 2.6(g)) employs several sensors such as the accelerometer,heat flux, temperature, a galvanic skin response to produce information about anindividual sleep. Variation in heart rate, body temperature, and other recordedmeasures are utilized to report wake and sleep onset, and total time of sleep.
2.8.1.8 HexoskinTM
This device (Figure 2.6(h)) is a smart shirt with integrated sensors to measure heartrate and heart rate variability, the total time of sleep, and body movement.
2.8.1.9 OURATM
This device (Figure 2.6(i)) is a smart ring integrated with three types of sensors,i.e., infrared LEDs, 3D accelerometer and gyroscope, and body temperature sensor.The ring can provide various information such as sleep stages, heart rate variability,and body temperature [de Zambotti 2017].
2.8.2 Sleep Tracking Apps on Smart-phones
Nowadays, smart-phones become a fundamental part of our daily life, includingthe healthcare domain. A lot of people are using mobile Apps to help improvetheir health and fitness. As a result, the healthcare mobile Apps have grownexponentially. For instance, hundreds of Apps have been developed for sleep andsleep hygiene monitoring, and this number is projected to continue to increase yearafter year. Most of these Apps aimed to serve several functions, including but notlimited to: a smart-alarm feature, sleep assistants, sound recording at the timeof sleep, light sensor data, the usage of the phone, and the microphone to decidesleep/wake [Kolla 2016, Ong 2016]. Additionally, other Apps have been developedto help healthcare providers in screening some specific health problems such asrepeated snoring and obstructive sleep apnea syndrome. It should be mentionedthat insufficient publications are available to support the suitability of these Apps[Kelly 2012, Kolla 2016] for patients with sleep complaints. Unlike wearable sensors,smart-phone Apps are inexpensive to most of the users. However, they are verysusceptible to motion artifacts because they need to be located on the subject’s bed.These motion artifacts might arise from a bed partner and/or interference fromblankets. As a result, the quality of the signal obtained by the phone’s accelerometercan potentially be degraded. To recapitulate, either wearable sensors or Appsinstalled on smart-phones they tend to use 3-axis accelerometers to measure the useractivity. The activity counts produced by the accelerometer are then used to decidewhether the user is waking or asleep. Most of the validation studies between these

2.8. Consumer Sleep Tracking Devices 21
(d) (e) (f)
(g) (h)
(a) (b) (c)
(i)
Figure 2.6: Examples of wearable sleep tracker devices; (a) Zeo, (b)
SleepImage, (c) Fitbit, (d) Lark, (e) WakeMate, (f) Jawbone, (g) Body-
Media SenseWear armband, (h) Hexoskin, and (i) OURA.
devices and the gold standard polysomnography or actigraphy have been performedagainst healthy people with no sleep problems. As a result, it is difficult to generalizetheir applicability to the patient suffered from sleep disorders. Overall, sleep trackerstend to overestimate total sleep time, sleep efficiency and underestimate wake uptime after the onset of sleep. Another principal issue which has to be considered inselecting a sleep activity tracker is the Battery life and the frequency of recharging.To give an example, smart-watches are useful fitness and heart rate trackers. However,they don’t have a long battery life that can last for the entire night. More specifically,smart-phones are not accurate enough to provide absolute sleep parameters andsleep staging, in addition, there is no proof that they can precisely awaken usersfrom light sleep [Kelly 2012, Russo 2015, Jeon 2015, Kolla 2016, Ong 2016]. Someof the available Apps are discussed in the ensuing subsections:
2.8.2.1 Sleep Cycle AlarmTM App
This App utilizes the embedded accelerometer of the iPhone to recognize movementsduring sleep. Usually, the iPhone is to be placed nearby a person’s headrest. TheApp can provide graphs representing total sleep time, a differentiation between light
22 Chapter 2. Background
sleep, deep sleep, and wake. Besides, it also has the smart-alarm feature.
2.8.2.2 Sleep TimeTMApp
This App can give a detailed information about wakefulness, light and deep sleep.Furthermore, it has the smart-alarm feature to help users wake up only during lightsleep.
2.8.2.3 Toss N TurnTMApp
This App can report information about sleep and wake time using the embeddedaccelerometer in the smart-phone in addition to light intensity, sound, details ofphone usage, and charging status as well.
2.8.2.4 ApneaAppTM: Sleep Apnea Detection on Smart-phones
This App uses the built-in microphone in a smart-phone to emit some kind ofinaudible wave, that serves as a sonar system to detect amplitude changes duringbreathing. The phone is usually placed on a regular sideboard same as if the personis charging his/her phone and getting ready for sleep. The App is designed to detectnormal breathing and abnormal breathing, which include hypopneas, obstructiveand central sleep apnea. Although this App showed a good correlation with the goldstandard polysomnography regarding the apnea-hypopnea index it has not beenvalidated in a home-based environment [Kolla 2016].
2.8.2.5 SleepRateTM
This App can support iPhones and Android phones. It can report information aboutthe wake, sleep, REM, light non-REM, and deep non-REM. The App needs to beconnected with a wearable polar heart sensor that can transmit up to 30 feet usinga Bluetooth low energy device.
2.8.3 Bed-Based Sleep Tracking Devices
As we mentioned in Section 2.7, the wearable devices might not be the optimalsolutions for older adults, since these devices need to be placed on some partsof the body, such as wrists, arms, etc. The elderly people might forget to wearthe devices. Other than that, these devices might annoy people that use them.Besides, it might be a sign of their condition defaming them in social communications[Kouroupetroglou 2014]. If we consider the educational background of the elderlypeople, it might also be difficult for them to use smart-phones. Alternatively,new sensors have been developed and become available for consumers that usenonintrusive technologies to detect subjects’ vital signs and sleep patterns. Thesesensors are designed and packaged in a way to make them invisible to the subjects.For example, they can be easily integrated into ambient assisted living environmentssuch as beds, pillows, chairs, or even in weighing scales [Zaunseder 2017].

2.8. Consumer Sleep Tracking Devices 23
In the following subsection, we discuss some examples of the commerciallyavailable devices, and more details will be provided in the next chapter (Chapter 3).
(a) (b)
(c) (d)
(e)
Figure 2.7: Examples of bed-sensor devices; (a) Emfit QS, (b) Beddit,
(c) EarlySense, (d) Sleepace Reston, (e) Withings Aura.
2.8.3.1 Emfit QSTM
Emfit QS1 depends on what is called ballistocardiography, i.e., the sudden ejection ofblood into the great vessels with each heartbeat, breathing and movement analysis.The Emfit QS (Figure 2.7(a)) has an integrated data acquisition and cellular mobiledata connectivity. The Emfit QS electronics consist of its own processor and memoryfor completely autonomous operation. The device has a web application that enablesthe users to track their sleep patterns. The user can place the device underneaththe bed mattress. Consequently, the user will not notice it is there. Furthermore,the Emfit QS claims to report all three sleep stages, i.e., light, deep, and REM sleep,
1Product website: https://www.emfitqs.com/

24 Chapter 2. Background
sleep time, in addition to a sleep score, which is a number consists of total sleeptime, amount of REM and deep sleep, and the number of times awakened.
2.8.3.2 BedditTM Smart Sleep Monitor
The Beddit2 device uses several sensors, including piezo force sensor, capacitive touchsensor, humidity sensor, temperature sensor, and microphone (in the smart-phone)to provide similar information as Emfit Qs. However, since the device uses the soundinformation, it can record the snoring and total duration of snoring. The deviceis also installed under the bed mattress. The Beddit device (Figure 2.7(b)) needsto be connected to an iPhone only device via a Bluetooth connection. It also hasthe smart-alarm feature. The sleep information can be viewed through the Bedditmobile App.
2.8.3.3 EarlySenseTM Mattress
The EarlySense3 device utilizes a piezoelectric sensor that can be placed underthe bed mattress. The system (Figure 2.7(c)) can report information about heartrate, respiration, snoring, coughing, and movement. A recent study showed a goodagreement between EarlySense and the gold standard polysomnography for sleepstaging [Tal 2017]. Furthermore, the device provided promising results for sleepapnea detection [Davidovich 2016].
2.8.3.4 Withings AuraTM
Withings Aura4 uses ballistocardiography to measure changes caused by respiratoryrate, heartbeats and the body’s movements during the night. It has been claimedthat the device achieves this with clinical accuracy to evaluate the structure of thesubject’s sleep, as well as the existence in the bed and the number of wake-ups pernight. It can discriminate an awake state from a sleep state, the periods in thebed sleeping - and awake, and measures the different sleep phases of your night.It uses the measurements from the sleep sensor to wake the subject at the bestmoment of his/her sleep cycle so that the subject wakes up refreshed. It providesthe subject with an overview of his/her cardiovascular fitness and how well he/sherecovered from stress and exercise by measuring your full-night resting heart rate.It also records his/her surrounding’s temperature, luminosity, and sound level toprovide he/she with full insights to enhance his/her sleep quality. The apparatus(Figure 2.7(e)) has two distinct parts. The first is a dock that transmits light andsound gradually along with sensors that measure temperature, luminosity and soundlevels. The second is a pneumatic sensor under the mattress which measures heartrate, respiratory rate, and body movements.
2Product website: https://www.beddit.com/3Product website: https://www.earlysense.com/digital-health/4Product website: https://support.health.nokia.com/
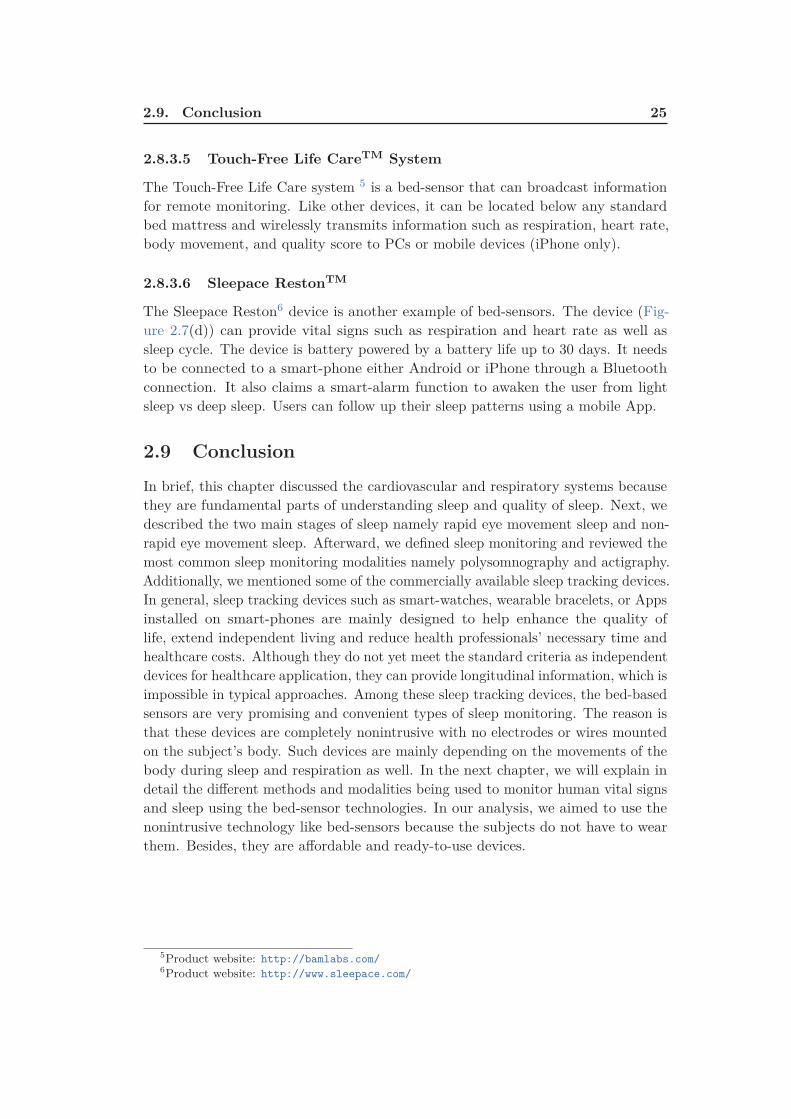
2.9. Conclusion 25
2.8.3.5 Touch-Free Life CareTM System
The Touch-Free Life Care system 5 is a bed-sensor that can broadcast informationfor remote monitoring. Like other devices, it can be located below any standardbed mattress and wirelessly transmits information such as respiration, heart rate,body movement, and quality score to PCs or mobile devices (iPhone only).
2.8.3.6 Sleepace RestonTM
The Sleepace Reston6 device is another example of bed-sensors. The device (Fig-ure 2.7(d)) can provide vital signs such as respiration and heart rate as well assleep cycle. The device is battery powered by a battery life up to 30 days. It needsto be connected to a smart-phone either Android or iPhone through a Bluetoothconnection. It also claims a smart-alarm function to awaken the user from lightsleep vs deep sleep. Users can follow up their sleep patterns using a mobile App.
2.9 Conclusion
In brief, this chapter discussed the cardiovascular and respiratory systems becausethey are fundamental parts of understanding sleep and quality of sleep. Next, wedescribed the two main stages of sleep namely rapid eye movement sleep and non-rapid eye movement sleep. Afterward, we defined sleep monitoring and reviewed themost common sleep monitoring modalities namely polysomnography and actigraphy.Additionally, we mentioned some of the commercially available sleep tracking devices.In general, sleep tracking devices such as smart-watches, wearable bracelets, or Appsinstalled on smart-phones are mainly designed to help enhance the quality oflife, extend independent living and reduce health professionals’ necessary time andhealthcare costs. Although they do not yet meet the standard criteria as independentdevices for healthcare application, they can provide longitudinal information, which isimpossible in typical approaches. Among these sleep tracking devices, the bed-basedsensors are very promising and convenient types of sleep monitoring. The reason isthat these devices are completely nonintrusive with no electrodes or wires mountedon the subject’s body. Such devices are mainly depending on the movements of thebody during sleep and respiration as well. In the next chapter, we will explain indetail the different methods and modalities being used to monitor human vital signsand sleep using the bed-sensor technologies. In our analysis, we aimed to use thenonintrusive technology like bed-sensors because the subjects do not have to wearthem. Besides, they are affordable and ready-to-use devices.
5Product website: http://bamlabs.com/6Product website: http://www.sleepace.com/

Chapter 3
Literature Review
Contents
3.1 Introduction . . . . . . . . . . . . . . . . . . . . . . . . . . . . 27
3.2 Ballistocardiography . . . . . . . . . . . . . . . . . . . . . . . 28
3.2.1 Piezoelectric Polyvinylidene Fluoride-Based Sensors . . . . . . 31
3.2.2 Electromechanical Film-Based Sensors . . . . . . . . . . . . . 35
3.2.3 Pneumatic-Based Sensors . . . . . . . . . . . . . . . . . . . . 40
3.2.4 Strain Gauges-Based Sensors . . . . . . . . . . . . . . . . . . 42
3.2.5 Hydraulic-Based Sensors . . . . . . . . . . . . . . . . . . . . . . 47
3.2.6 Fiber Optic-Based Sensors . . . . . . . . . . . . . . . . . . . . 50
3.3 Conclusion . . . . . . . . . . . . . . . . . . . . . . . . . . . . . 53
3.1 Introduction
Up until now in Chapter 2, we have discussed in some detail the various productson the market today that can be employed to track different perspectives of sleepsuch as duration and quality of sleep. These products can be either wearable sleeptrackers, such as smart watches and smart-phones or non-wearable sleep trackerssuch as in-bed sleep monitors. In this research, we prefer using the in-bed sleepmonitors to the wearable sleep trackers as they are more convenient for elderly people.The in-bed sleep monitors are more likely to be suitable for older adults due tomultiple reasons. For instance, as some of the older adults might have cognitive andmemory impairments, they might forget to wear the device, or they might removethe device. Hence, the monitoring system may not work as intended [Sanchez 2017].Additionally, the in-bed monitors are entirely nonintrusive, and they do not requireany invasive electrodes or wires to be connected to the subject’s body.
It is very important to monitor sleep and quality of sleep, especially for olderadults because they spend more time in bed compared to younger adults. Insufficientsleep for older adults might cause depression, attention and memory problems, exces-sive daytime sleepiness, and experience more nighttime falls [Cooke 2011]. Typically,in-bed sensor technology is based on recording body movements, respiratory move-ments, and ballistocardiographic movements representing the mechanical activity ofthe heart [Alihanka 1981]. As it was previously mentioned in Chapter 1, the record-ing of these physiological signals can be performed using multiple sensors, namely

28 Chapter 3. Literature Review
microbend fiber-optic sensors, piezo-resistive fabric sensors, electromechanical filmand polyvinylidene fluoride film based sensors, load cells, strain gauges, pneumatic,and hydraulic sensors [Inan 2015]. The first of these sensors was a static chargesensitive bed introduced by Alihanka et al. [Alihanka 1981]. The next sections willdiscuss, in more detail, ballistocardiography and the different techniques used inliterature to analyze and interpret ballistocardiogram signals.
3.2 Ballistocardiography
Ballistocardiography (BCG) is a noninvasive technique for creating a graphicalrepresentation of the heartbeat-induced repeated motions of the human body. Theserepeated motions happen due to the rapid acceleration of blood when it is ejected andmoved in the great vessels of the body during periods of relaxation and contraction,known as diastole and systole, respectively. In other words, BCG can provideinformation about the overall performance of the circulatory system; this is becauseBCG measures the mass movements, i.e., the mass of the circulating blood andthe heart during the cardiac cycle [Pinheiro 2010b]. During atrial systole, when the
(a) (b)
Figure 3.1: (a) Example of a typical BCG signal with letters used to
designate the waves. The arrow indicates the position of the beginning
of the electrical ventricular systole (QRS. complex of the electrocardio-
gram). Image adapted from [Starr 1939, Starr 1940, Pinheiro 2010b],
(b) Aortic arch and force vectors coming from blood ejection by the left
ventricle. Image adapted from [Eblen-Zajjur 2003].
blood is ejected into the large vessels, the center of mass of the body moves towardsthe head of the body. In other ways, when the blood moves towards the peripheralvessels and concentrates further away from the heart in the peripheral vessels, thecenter-of-mass moves towards the feet (Figure 3.1(b)). This shift comprises severalcomponents as a result of cardiac activity, respiration, and body movements. This

3.2. Ballistocardiography 29
shifting of the center of mass of the body generates the BCG waveform since theblood distribution changes during the cardiac cycle [Vogt 2012].
More than 100 years ago, BCG failed to prove its functionality, and it didnot start to be used in routine tasks for a few general reasons as follows. First,there had been insufficient standard measurement methods, i.e., different methodshad resulted in slightly different signals. Second, the exact physiologic origin ofthe BCG waveform had not been well-understood. Furthermore, there had beeninsufficient clear guidelines for interpretation of the results, and therefore the medicalcommunity was unwilling to take risks. Third, there had been a dominant focus onsome clinical diagnostic, for example, myocardial infarction, angina pectoris, coronary
heart disease; these applications need a high level of specificity and reliability that theBCG had not reached. Fourth, the emergence of ultrasound and echocardiographymethods that swiftly overhauled BCG and related methods for noninvasive cardiacand hemodynamic diagnostic [Giovangrandi 2011]. At the present time, BCG has
P
Q
R
S
T
ST
SegmentPRSegment
PR Interval
QT Interval
QRS
Complex
Figure 3.2: Example of a typical electrocardiogram signal.
been given a lot of interest thanks to the information technology revolution, includinghardware technology as well as software and services. As described in Chapter 1 andChapter 2, BCG sensors can be embedded in ambient environments without the needfor medical staff presence. Consequently, it has an outstanding impact in currente-health systems. Ultimately, BCG helps reduce checkups’ stress and the patientemotion and attention responses. Figure 3.1(a) shows an example of a typical BCG

30 Chapter 3. Literature Review
signal, while Figure 3.2(b) shows an example of a typical electrocardiogram signal.The BCG waveforms may be grouped into three main groups, i.e., the pre-systolic(frequently disregarded), the systolic and the diastolic as given in Table 3.1. TheI and J waves are also quoted as ejection waves [Pinheiro 2010b]. To this extent,
Table 3.1: Nomenclature of ballistocardiogram (normal displacement)
signal [Scarborough 1956, Pinheiro 2010b].
Pre-Systolic Group (See Figure 3.1(a))
• F wave: (rarely seen) headward wave preceding G,related to pre-systolic events, not an after-vibration.• G wave: small footward wave which at times precedes the H wave.
Systolic Waves (See Figure 3.1(a))
• H wave: headward deflection that begins close to the peak of the R wave,maximum peak synchronously or near the start of ejection.• I wave: footward deflection that follows the H wave, occurs early in systole.• J wave: largest headward wave that immediately follows the I wave,occurs late in systole.• K wave: footward wave following J, occurs before the end of systole.
Diastolic Waves (See Figure 3.1(a))
• L and N waves: two smaller headward deflections which usually follow K.• M wave: footward deflection between L and N.• Smaller subsequent waves may be visible and are named in sequence.
the definition, formal limitations, and nomenclature of ballistocardiography werediscussed. The formal limitations were mainly due to the complexity of the usedsystem and misinterpretation of the obtained signals and its deformations. The fieldof ballistocardiography has been revived as a result of the numerous technologicaladvancements, as, for example, the advent of microprocessors and laptop computers.All in all, ballistocardiography can be very useful in several applications such asmonitoring of cardiac function and performance in addition to monitoring of sleep andsleep-disordered breathing [Di Rienzo 2017, Inan 2018]. One of the most prominentfeatures of ballistocardiography is the accessibility and ready-availability, whichallows the system to be deployed in users’ homes without affecting the users’ privacyand daily activities. In what follows, we explain more in detail the various toolsand algorithms exist in the literature to analyze and interpret ballistocardiography,wherein we look at what types of sensors that can be used for signal acquisition andwhat types of software algorithms that can be used to extract vital information suchas heartbeat, respiration, and body movements.

3.2. Ballistocardiography 31
3.2.1 Piezoelectric Polyvinylidene Fluoride-Based Sensors
The piezoelectric effect is the ability of some materials to produce an electric chargein response to applied mechanical stress. The polyvinylidene fluoride (PVDF) isan exciting piezoelectric material and is usually developed as a very thin and easilybent film. If a pressure force is applied to the film, it creates a mechanical bendingand a shifting of positive and negative charge centers in the film, which then resultsin an external electrical field. The charge generated from PVDF is equivalent to theapplied pressure. Therefore, PVDF is one of the suitable candidates for detectingthe small fluctuations generated by different body parts [Xin 2016].
Wang et al. [Wang 2003] proposed to use a PVDF piezopolymer film sensor forunconstrained detection of respiration rhythm and pulse rate. The film sensor wasplaced under the bed-sheet at the location of the thorax to obtain the variations ofthe pressure on the bed attributable to respiratory movement and heartbeats. Theauthors used the wavelet multiresolution decomposition to compute the respirationand heartbeat. The output of the respiratory inductance plethysmography (RIP) andelectrocardiography (ECG) were used as a reference for respiration and heartbeat,respectively. The objective of the wavelet analysis was to decompose the rawsignal into low-frequency components and high-frequency components. Next, thecomponent presenting a good agreement with either the respiratory movement orthe heartbeat was selected. Afterward, the respiratory rate was computed directlybased on a time-varying adaptive threshold. On the other hand, the heartbeatcomponent was first squared to rectify it into unipolar, and then the envelope ofthe rectified signal was calculated using a moving average smoothing algorithm. Atlast, a time-varying adaptive threshold was also applied to the smoothed envelopeto compute the heart rate. It should be noted that heart rate detection was verychallenging because the pressure variations attributable to heartbeat on the bed wasvery weak, and the shape of the signal was not always uniform. Another study wasproposed by Wang et al. [Wang 2007] to detect respiration rhythm and pulse rateof premature infants using PVDF sensor array. The system was tested in clinicalenvironments on five premature infants (1 male and 4 females). The main challengeof the proposed system was frequent body movement of the infants and the weaknessof the heartbeat vibration.
Niizeki et al. [Niizeki 2005] suggested using a PVDF sensor array for uncon-strained monitoring of respiration and heart rate. The sensor array consisted ofeight PVDF cable sensors and they were horizontally integrated with a textile sheeton a bed surface covering the upper half of the body. The cardiorespiratory signals,i.e., BCG and respiration were obtained using infinite impulse response digitalfilters. After extracting the cardiorespiratory signals, an optimal sensor selectionsearch routine was applied to select the most appropriate sensor. The selectioncriterion was based on the magnitude of the power spectrum density (PSD). Theautocorrelation functions of the cardiac and respiratory signals were computed usinga 5-second and 15-second time segments for heartbeat and respiration, respectively.The outputs of the autocorrelation functions were smoothed and differentiated

32 Chapter 3. Literature Review
using a Savitzky-Golay (5 adjacent points) algorithm and finally, the heart rateand respiration were computed by measuring the intervals between the peaks forthe respective autocorrelation functions. A fixed threshold was used to determineif the subject changes posture during the measurement, in which the output fromthe PVDF cables was disturbed to a large extent. A charge-coupled device (CCD)camera was used to record the image of the body position during posture changeas a time stamp. The proposed system was tested against thirteen healthy malesubjects whose ages ranged from 21 to 49 years. ECG and pneumotachometer formeasuring respiratory flow were used as a reference during the study. The studyconsisted of two phases, i.e., short-term recording for 10 minutes and an overnightstudy for 2 hours. For the overnight recording, only 7 subjects were involved. Theproposed system had some limitations in particular susceptibility to motion artifactscaused by subject movements that might have led to the misidentification of thepeak for autocorrelation functions.
Paalasmaa and Ranta [Paalasmaa 2008] applied an unsupervised learning ap-proach on ballistocardiogram signals to compute heartbeat. The ballistocardiogramsignals were collected from three subjects using a piezoelectric pressure sensor over 5hours recording. To start with, feature vectors were extracted from the signal at pos-sible heartbeat positions, i.e., the local maxima of the signal. Then, a complete-linkclustering was applied to the feature vectors to look for a cluster with the highestdensity. The positions of the feature vectors of the densest cluster were found tomatch real heartbeat positions in the signal. An angular dissimilarity measure wasadopted since it omits the differences in feature vector amplitudes. The sensor waslocated close to the patient’s upper body so that it can register cardiac activity in aproper way.
Paalasmaa et al. [Paalasmaa 2012] introduced a sleep tracking web application,which was based on measurements from a piezoelectric film sensor placed underthe mattress topper. The raw data coming from the sensor was sent to a webserver for analysis and extracting information. This information includes heart rate,respiration, sleep staging, and stress reactions. The heart rate was computed bycreating a heartbeat template using complete-link clustering [Paalasmaa 2008], thenthe heart rate intervals were detected by selecting those intervals that minimizea predetermined residual error. The sleep staging was carried out by utilizingheart rate variation, respiration variation, and activity information. The proposedapproach was validated against a 40-patient group at a sleep clinic. The addedvalue of this work is the suitability of the system for long-term monitoring of sleepand the web application for sleep analysis at home. A more comprehensive studywas introduced by Paalasmaa et al. [Paalasmaa 2015] to compute heart rate fromballistocardiogram signals acquired with piezoelectric film sensor. At first, a modelfor the heartbeat shape was adaptively deduced from the signal using a hierarchicalclustering approach. Afterward, interbeat intervals were identified by detectingpositions where the heartbeat shape best matches the signal. The proposed methodwas verified with overnight recordings from 46 subjects in different settings, i.e.,sleep clinic, home, single bed, and double bed.

3.2. Ballistocardiography 33
Chen et al. [Chen 2009b] advised to use four piezoelectric sensors to detectheart rate and respiration. One sensor was placed under the pillow, whereas theother three were placed under the mattress close to the back, hip, and calf levelpositions. The data was collected from five healthy subjects at age of twenties duringa 2-hour’s nap in a sleep lab. ECG and nasal thermistor signal were employed asheart rate and respiration references. Heart rate and respiration were computedbased on the multiresolution analysis of the wavelet decomposition in which theCohen–Daubechies–Feauveau biorthogonal wavelet was selected as the basis functionto design the decomposition and reconstruction filters. The 6th level approximationwaveform was similar to the respiratory rhythm, while a combination of the 4th and5th scale coefficients were found to be suitable for heart rate detection. The authorswere able to measure both vital signs from the four positions. However, the overalloptimal position was found in the back. That makes sense because the more thesensor is closer to the thorax, the more accurate the recovered signals are.
A wheelchair-based system for monitoring the cardiac activity of its user wasproposed by Pinheiro et al. [Pinheiro 2012]. The signals were collected from piezo-electric film sensors and micro-electromechanical systems accelerometers installed inthe seat and backrest of the chair. The system also included photoplethysmography(PPG) sensors in the armrests. The data from the sensors were sent via Wi-Fi toa laptop with a data acquisition board for deeper analysis. ECG recordings wereused to validate the proposed system. The system was tested in different situations,namely unmoving wheelchair, tiled floor motion, and treadmill tests. In the last twosituations, the ballistocardiogram signals collected from the piezoelectric sensorswere completely corrupted by motion artifacts. On the other hand, the accelerometerwas much more insensitive to wheelchair motion. The analysis was done on sevensubjects using the fast Fourier transform. Subsequently, the prominent peak wasselected within a specific frequency range for heart rate estimation. In a summary,getting informative ballistocardiogram signals from the piezoelectric sensors in amotion situation was almost impossible. However, it was more convenient to getinformative signals from the accelerometers and the PPG sensors.
A multichannel approach was proposed by Kortelainen et al. [Kortelainen 2012]to extract heart rate and respiration information using eight PVDF sensor channelslocated in the upper position of the bed. The heart rate was estimated by averagingthe signal channels in the frequency domain, in which a sliding time window wasutilized to compute the cepstrum of each signal channel. However, the respiratoryrate was computed from the first principal component of a principal componentanalysis (PCA) model applied to the low-pass filtered bed sensor signal. Theassumption was that the first principal component will give the signal with themaximum variance, and as a result shall improve the sensitivity for the extractionof the respiration. Twenty-eight patients were recruited for the study and they weresuspected to have diverse kinds of sleep problems. Frequency domain averaging wasbetter than simple averaging over all the sensor channels. The extracted information,i.e., heart rate, respiration, and movement might have been used for further sleepanalysis.

34 Chapter 3. Literature Review
The same pressure bed sensor assembly with eight PVDF sensors was appliedfor sleep apnea detection in [Guerrero 2013]. The respiratory signal was computedby two methods. The first method was to apply a Hilbert transform to the bedsensor signal and then smooth the signal with a low pass filter. The second methodwas similar to Kortelainen et al. [Kortelainen 2012] by adopting the PCA approach.At last, the amplitude baseline of the respiratory signal was estimated as the meanvalue of the preceding 100 seconds. An apnea event was detected if the ratio withthe baseline was less than a selected percentage threshold value for a period of atleast 10 seconds. The authors applied their methodology to twenty-five patientsout of twenty-eight patients recruited in [Kortelainen 2012]. The system showed agood agreement with the reference polysomnography. However, the authors usedthe simplified reduced respiratory amplitude index (RRAI) instead of the standardapnea-hypopnea index (AHI). In another study, Brüser et al. [Brüser 2015] haveimplemented three different methods using the same sensor set to measure the heartrate in a nonintrusive way. Initially, the heart rate was computed using a slidingwindow cepstrum analysis [Kortelainen 2012]. Secondly, the heart rate was computedusing a Bayesian fusion approach, in which three estimators were calculated from eachsensor channel such as adaptive-window autocorrelation, adaptive-window averagemagnitude difference function, and maximum amplitude pairs. For each channel,these three estimator outputs were then combined using a Bayesian fusion methodto obtain an overall estimate. In other words, Bayesian fusion approach was appliedto 24 estimates. At last, the heart was estimated based on the aforementionedapproach. However, for each channel separately. In general, the multichannelbased approaches improved the robustness of heartbeat interval estimation over asingle sensor. More specifically, Bayesian-based method slightly outperformed thecepstrum-based method.
Martin-Yebra et al. [Martín-Yebra 2015] extracted heart rate variability in-dices from ballistocardiogram signals and then evaluated their correlation withelectrocardiogram-derived ones. The ballistocardiogram signals were acquired bya piezoelectric 3D-force plate in supine and standing positions, in a group of 18healthy subjects (11 females). For each position, the data collection was performedduring 5 minutes. Furthermore, subjects were asked to stay quiet to avoid anymotion artifacts. The ballistocardiogram waves, i.e., (H, I, J, K) were detected bysynchronizing ballistocardiogram signals with ECG signals. Although the proposedapproach provided a good match with the reference ECG, it is very difficult togeneralize this approach for real-life deployment as the data collection was conductedfor a very short time and the detection part was achieved by adapting informationfrom the ECG signals.
Katz et al. [Katz 2016] measured cardiac interbeat intervals using a contact-freepiezoelectric sensor placed beneath the mattress under the tested subjects. The datawas collected from 25 home sleep recordings of 14 healthy subjects in a two-in-bedsetting. The authors applied three algorithms to the collected ballistocardiogramsignals as follows. First, interbeat intervals were found by decomposing the signalinto multiple components using an empirical mode decomposition filter and then

3.2. Ballistocardiography 35
locating the candidate peaks within a localized search area. Second, after locatingpotential interbeat intervals, a binomial logistic regression model was applied toclassify each interbeat interval into one out of three groups based on morphologicalproperties of the ballistocardiogram signal. Finally, an additional algorithm wasimplemented to get discrete interbeat interval distribution maps during the nightrecording, considering interbeat interval data from overlapping 15 minutes windows.The preceding three algorithms demonstrated the effectiveness of the proposedsystem for heart rate variability analysis. Sela et al. [Sela 2016] used the samepiezoelectric sensor to detect left ventricular ejection for 10 subjects (6 males and 4females), where the lower body of each subject was enclosed in a negative pressurechamber. The negative pressure chamber regulates and controls the blood pressureof the participants. This study demonstrated the ability of the system to identifyinternal bleeding condition among patients at risk, namely individuals after anaccident or surgical operation.
Alvarado-Serrano et al. [Alvarado-Serrano 2016] measured beat-to-beat heartrate from subjects sitting in a common office chair. The authors used a piezoelectricsensor fixed to the bottom side of the seat to collect ballistocardiogram signals fromseven subjects (5 males and 2 females). Continuous wavelet transform with splineswas implemented to detect beat-to-beat intervals in which an optimal scale wasselected to reduce noise and mechanical interferences. Thenceforth, learning anddecision phases where applied to the selected scale to detect potential J-peaks. Inthe learning phase, the first four heartbeats in the ballistocardiogram signal werefound to define initial thresholds, search windows, and interval limits. The learnedparameters were then utilized to determine the next heartbeat and were readoptedafter each heartbeat detected to adhere to the heart rate and signal-amplitudechanges. A similar study was proposed by Liu et al. [Liu 2017a]. However, twoPVDF film sensors were installed in the seat cushion and foot insole.
Choe and Cho [Choe 2017] used a piezoelectric sensor installed between a bed-frame and a mattress for unconstrained monitoring of heart rate. The data wascollected from 7 male subjects sleeping in a supine sleeping position where the sensorwas placed under the subject’s back. In total, they collected ballistocardiogramsignals for about 5 hours from all subjects, in which subjects were not movingduring data acquisition. The data was first smoothed using a moving mean absolutedeviation, then the J-peaks were detected within a specific search region using anadaptive thresholding technique. The authors achieved satisfactory results with thereference ECG. However, this method may not be applicable in real-life applicationsbecause the data was not collected in a typical sleep sitting and the motion artifactswere not considered as well. Table 3.2 summarizes the unconstrained monitoring ofvital signs using the PVDF-based sensors.
3.2.2 Electromechanical Film-Based Sensors
The electromechanical film (EMFi) material is a plastic film that can transformmechanical energy into an electrical signal and the other way around. Basically, it

36
Ch
ap
ter
3.
Lite
ratu
reR
ev
iew
Table 3.2: Summary of unconstrained monitoring of vital signs using PVDF-based sensors. WT : wavelet trans-
form, N/A: not available, P. Infants: premature infants, M : male, F: female, HR: heart rate, HRV : heart rate
variability, RR: respiratory rate, ACF: autocorrelation function, Min: minutes, Hrs: hours, Sec: seconds, CLC :
complete-linkage clustering, TM : template matching, FREQ: frequency, CEP: cepstrum, PCA: principal compo-
nent analysis, MAP: maximum amplitude pairs, AMDF: adaptive-window average magnitude difference function,
ECG Sync: electrocardiogram synchronization, EMD: empirical mode decomposition, TH : threshold, CWT : con-
tinuous wavelet transform, Lab: laboratory.
Method Subjects (M, F) Deployment Duration Outcome[Wang 2003] WT N/A Lab N/A HR, RR
[Wang 2007] WT5 P. Infants(2 M and 3 F)
Hospital 10 Min HR, RR
[Niizeki 2005] ACF 13 M Home 10 Min, 2 Hrs HR, RR[Paalasmaa 2008] CLC 3 N/A Lab 330 Min HR[Paalasmaa 2012] CLC, TM 40 N/A Sleep clinic Overnight HR, RR[Paalasmaa 2015] CLC, TM 60 N/A Sleep clinic, home Overnight HR[Chen 2009b] WT 5 N/A Lab 2 Hrs HR, RR[Pinheiro 2012] FREQ 21 N/A Wheelchair 5 Min HR[Kortelainen 2012] CEP, PCA 6 N/A, 15 M, 13 F Hospital Overnight HR, RR[Guerrero 2013] PCA 15 M, 13 F Hospital Overnight Apneas[Brüser 2015] ACF, MAP, AMDF 15 M, 13 F Hospital Overnight HR[Martín-Yebra 2015] ECG Sync 17 M, 11 F Lab 5 Min HRV[Katz 2016] EMD 14 N/A Home Overnight HR[Sela 2016] N/A 6 M, 4 F Lab 84 Min LVET[Alvarado-Serrano 2016] CWT 5M, 2 F Chair 100 Sec HR[Liu 2017a] Adaptive TH 7 M Lab 45 Min HR[Choe 2017] CWT 6 N/A Lab 67 Min HR

3.2. Ballistocardiography 37
is a flexible and thin bi-axially oriented polypropylene film covered with electricallyconductive layers, which are enduringly polarized. EMFi has a static charge reachinghundreds of Volts. When a pressure is applied to the film, a charge is created onits electrically conductive surfaces and this charge can be measured as a current orvoltage signal, usually with a charge amplifier. As a result, the EMFi serves as asensitive motion sensor [Alametsä 2004]. Alametsä et al. [Alametsä 2004] suggestedto use EMFi sensors for obtaining ballistocardiogram signals from certain places ofthe body. The authors installed EMFi sensors in a chair and in smaller pieces in afew positions on the body (arm, leg, and chest). The ballistocardiogram signals werecollected from a few people and the duration of the recordings was relatively short.This study demonstrated the potential of the EMFi material in monitoring thechanges in cardiac function. In another study, Koivistoinen et al. [Koivistoinen 2004]evaluated the ability of the EMFi sensors for measuring ballistocardiogram signals.The authors installed two EMFi sensors in the seat and backrest of a normal chair,and the data was collected from two young subjects (1 male and 1 female) for 5minutes. After visual inspection versus the reference ECG, it was found that theacquired waveforms closely simulate those reported in the literature. Equivalentresults were also reported by Junnila et al. [Junnila 2005, Junnila 2006], whichpresented the suitability of the EMFi sensors for extracting ballistocardiogramsignals.
A smart mattress was developed by Koivistoinen et al [Kortelainen 2007] todetect interbeat intervals in a nonintrusive way from six male subjects. The mattressconsisted of 160 EMFi electrodes distributed throughout the mattress that enabledsignal acquisitions from multiple locations. Two methods were implemented todetect interbeat intervals, i.e., a pulse method and an adaptive window cepstrummethod. In the former, signals from all channel were high pass filtered and thensquared. After that, these squared values were averaged between all channels andlow-pass filtered the result. At last, the beginning of each heart rate was tracked inthe generate pulse train signal. In the latter, the window length of the cepstrumwas selected using the pulse method as the first estimator of the heart beats. Then,signals from all channels were averaged in the frequency domain. An interpolationwas used to detect more accurate location for the selected cepstrum maximum value.Moreover, the motion artifacts were eliminated based on the signal variance using asliding time window. Although the cepstrum-based method provided better resultsthan the pulse method, its computational efficiency was not as good as the adaptivewindow method.
Aubert et al. [Aubert 2008] adopted a single EMFi sensor to provide heart rate,breathing, and an activity index representing body movements. The recommendedsystem was validated utilizing data collected from 160 subjects (58 males and 102females) for a total of 740 hours. Part of the data was collected in a sleep laboratoryfrom patients (i.e., sleep apnea, insomnia, and other sleep disorders) who underwenta full polysomnography and the other part was collected at home from healthysubjects. Body movements were first isolated from the sensor data based on thesignal amplitudes and energy, and their time derivatives. Thereafter, heart rate

38 Chapter 3. Literature Review
was measured using a sliding window autocorrelation method, in which the optimalwindow length had to span 3 to 5 consecutive beats. The respiratory rate wasestimated based on the local peaks, troughs, and zero-crossings, constrained torules ensuring physiological validity in terms of duration and amplitude. Acrossthe 60 subjects, the vital signs were computed over epochs of 30 seconds and theaverage values were computed and compared to the reference ECG and thorax belt,respectively. The recommended system achieved satisfying results compared to thereference devices.
Kärki and Lekkala [Karki 2008] used EMFi and PVDF sensors in the measure-ments of heart rate and respiration. The objective of the study was to determineif there were differences between the results of both sensors. ECG was used asa reference for heart rate and a thermistor for respiration rate. Heart rate andrespiration were measured using power spectral density (PSD). The two sensorswere embedded inside a textile pocket and the pocket itself was integrated intoclothing. They were positioned underneath a commercial heart rate belt on the leftside of the sternum. Preliminary results showed that both sensors provided reliableresults in the measurements of heart and respiration rates. However, the PSD wasnot robust enough because the peak in the spectrum might get wider and multiplepeaks might have appeared. Another study was proposed by Kärki and Lekkala[Kärki 2009] to determine heart rate with EMFi and PVDF materials. The EMFiand PVDF sensors were grouped together to a form a single structure. The datawas collected from 10 subjects (5 males and 5 females) over 60 seconds recording(sitting and supine positions), where the sensor structure was placed under the legsof a chair and bed. These preliminary results demonstrated that the heart rate canbe measured at home just by sitting on a chair or lying in a bed.
Pinheiro et al. [Pinheiro 2009] introduced a low-cost system to measure bloodpressure variability and heart rate variability. A single EMFi sensor was installed inthe seat of a normal office chair to measure ballistocardiogram signals while a fingerPPG was used to estimate arterial oxygen saturation (SpO2). For validation, ECGwas acquired using three chest leads. Using LabVIEW, heart rate and heart ratevariability were determined by an adaptive peak detection algorithm. The pulsearrival time was estimated as the time difference between ECG and PPG maximumpeaks, and when considering BCG-PPG relation, the I-valley (Figure 3.1(a)) was thereference. The designed system was appraised using data collected from five healthyvolunteers over 10 minutes recording. The preliminary study demonstrated thatheart rate variability can be measured using the correlation between BCG and PPG.The PSD was exploited to measure the heart rate. In another study, Pinheiro et al.[Pinheiro 2010a] collected ballistocardiogram signals by placing an EMFi sensor inthe backrest of a wheelchair’s, beneath the lining. Two modulation-based schemeswere carried out for heart estimation, i.e., a sliding power window and an all-peakdetector. The objective was to find all local maxima and local minima, then a splineinterpolation and a moving power window were employed to compute a modulatingsignal. At last, a fast Fourier transform was applied to the output of each methodin order to measure the average heart rate from the signal’s fundamental frequency.

3.2. Ballistocardiography 39
This system was evaluated using data gathered from six normal subjects (4 malesand 2 females) during 125 seconds.
Brüser et al. [Brüser 2013] proposed an unsupervised approach to determineinter-beat intervals using an EMFi sensor. The sensor was fixed underside ofa thin foam overlay which was thus located on top of the mattress of a typicalbed. The system was evaluated on over-night recordings from 33 individuals (14males and 19 females). Three estimators were implemented, namely autocorrelationfunction, average magnitude difference function, Maximum amplitude pairs in orderto compute the local interval length using a sliding time window. Ideally, thiswindow contained two events of interest. The values of the local interval lengthwere constrained by two thresholds, i.e., Tmin and Tmax. The body movementswere detected based on the maximum amplitude range of each time-window. Theinformation from the three estimators was then applied to a probabilistic Bayesianmethod to estimate the inter-beat intervals in a continuous manner. Although theproposed method achieved very satisfactory results, the main limitation existed inthe implicit hypothesis that two successive heart beats in the BCG have an unknownbut similar morphology. This assumption may not always hold true.
In the same way, Zink et al. [Zink 2015] used an EMFi sensor to detect heartbeatcycle length in patients suffered from atrial fibrillation and sinus rhythm. Thesensor was placed under the bed-sheet and data was collected from 22 patients (15M, 7 F) during and after cardioversion. Cardioversion is a medical procedure thatreturns a normal heart rhythm in people with certain types of abnormal heartbeats,namely arrhythmias. In another study, Zink et al. [Zink 2017] employed the EMFisensor to measure heartbeat in patients suffered from sleep-disordered breathing.Twenty-one patients (19 males, 2 females) were recruited for the study and underwenta standard full-night polysomnography. A quality-index was proposed based onthe three estimators previously discussed in [Brüser 2013] that allowed to identifysegments with artifacts and to automatically exclude them from the analysis. Theproposed system provided good correlation of beat-to-beat cycle length detectionwith simultaneously recorded ECG.
Pino et al. [Pino 2015] used two EMFi sensors installed in the seat and backrestof a normal chair in order to measure heart rate. Ballistocardiogram data werecollected from 54 individuals, whereas 19 of them were measured in a laboratory (1minute) and the rest in a hospital waiting room (2 minutes). Firstly, empirical modedecomposition and wavelet analysis were (Deabuchie 6) implemented to reconstructballistocardiogram signal. Secondly, the J-peaks of the ballistocardiogram signal wasdetected using a length transform analysis. The body movements were eliminatedusing a moving time window. Then, for each time-window two thresholds werecomputed, i.e., T1 = (max + min)/2 and T2 = mean + 1.1 ∗ std, if T1 was greaterthan T2, the current window was marked as a body movement. The wavelet analysiswas preferred to reconstruct the signal as it produced a higher effective measurementtime. A similar approach was also proposed by Pino et al. [Pino 2016]. However,they increased the size of the dataset to 114 people. Of those, 21 were gathered in aschool (2 minutes), 42 in homes (2 minutes), and 51 in a hospital waiting area. It is
40 Chapter 3. Literature Review
difficult to assess the robustness of this system because the data was collected in avery short time and in a controlled environment as well.
In a recent study, Alametsä and Viik [Alametsä 2018] presented the stability ofballistocardiogram signal during 12 years’ time, on which the data was gatheredfrom a single person in a sitting position using EMFi sensors. Several other signalswere recorded as well such as ECG, ankle pulse signal, and the carotid pulse signalfrom the neck near the carotid artery. All measurements lasted about 2 to 3 minuteswith a sampling frequency of 500 Hz. In a conclusion, ballistocardiogram researchmay be recommended for examining long-term changes in heart operation and toreveal variations in it. Table 3.3 summarizes the unconstrained monitoring of vitalsigns using the EMFi-based sensors.
3.2.3 Pneumatic-Based Sensors
The idea of the pneumatic system is to deploy a thin air-sealed cushion between thebed and mattress. Thereafter, when a person rests in the bed, the forces originatedbecause of the heartbeat, respiration, snoring and body movements affects the air inthe cushion through the mattress. This slight human movement causes a pressureand therefore variations in pressure are measured by a supersensitive pressure sensor[Chow 2000, Watanabe 2004].
Watanabe et al. [Watanabe 2005] used the aforementioned pneumatic systemto measure heartbeat, respiration, snoring, and body movements in a noninvasivemanner. The three bio-signals, namely heartbeat, respiration, and snoring were de-tected using a band-pass filter with different cutoff frequencies. Following, windowedFast Fourier transform algorithm was applied to measure heart rate and respiration.However, the relative magnitude of snoring was calculated by the standard deviationof the filtered snoring signal and the relative magnitude of body movements wascalculated as the standard deviation of the envelope of the sensor output signal.The authors validated the proposed system using data collected from 15 subjects(12 males and 3 females) over 15 nights. Preliminary results showed good agreementagainst reference devices, namely ECG, belt-type respirometer, and a snoring de-tection microphone. The body movements were identified and recorded by a CCDcamera. In another study, Kurihara and Watanabe [Kurihara 2012] acquired datafrom 10 subjects (20 seconds each) to measure heart rate and respiration. In thisstudy, a condenser microphone was used as a reference for heart rate, respiration andsignal-to-noise ratio. Validation results demonstrated that the pneumatic systemwas more susceptible to environmental noise, for example, opening and closing thedoor than the reference condenser microphone.
Chee et al. [Chee 2005, Shin 2006] recommended to use a balancing tube betweentwo air cells to improve the effectiveness of posture changes during data collection.Balancing tube with a high air resistance aimed at equalizing the pressure of eachair cell within a certain time constant. More precisely, it performed the role of ahigh-pass filter to eliminate body motion. The air-mattress system consisted of19 air cells, in which measurements can be performed between any pair of cells.

3.2
.B
allisto
card
iog
rap
hy
41
Table 3.3: Summary of unconstrained monitoring of vital signs using EMFi-based sensors. WT : wavelet transform,
N/A: not available, M : male, F: female, HR: heart rate, RR: respiratory rate, ACF: autocorrelation function, Min:
minutes, Hrs: hours, Sec: seconds, CEP: cepstrum, MAP: maximum amplitude pairs, AMDF: adaptive-window
average magnitude difference function, EMD: empirical mode decomposition, TH : threshold, LT : linear transform,
Lab: laboratory.
Method Subjects (M, F) Deployment Duration Outcome[Kortelainen 2007] Visually 1 M, 1 F Lab 5 Min BCG[Kortelainen 2007] CEP 6 M Lab Overnight HR[Aubert 2008] Adaptive TH, ACF 58 M, 102 F sleep Lab, Home Overnight HR, RR[Karki 2008] PSD N/A Lab 60 Sec HR, RR[Kärki 2009] PSD 5 M, 5 F Lab 30 Sec HR, RR[Pinheiro 2009] PSD 5 N/A Lab 10 Min HR, BP[Pinheiro 2010a] PSD 4 M, 2 F Lab 125 Sec HR[Brüser 2013] ACF, MAP, AMDF 14 M, 19 F Clinic Overnight HR[Zink 2015] ACF, MAP, AMDF 15 M, 7 F Hospital N/A HRV[Zink 2017] ACF, MAP, AMDF 19 M, 2 F Hospital Overnight HR[Pino 2015] EMD, WA, LT 54 N/A Lab, Hospital 1 Min, 2 Min HR[Pino 2016] EMD, WA, LT 114 N/A Home, Hospital 2 Min, 2 Min HR

42 Chapter 3. Literature Review
However, the authors collected data from the two cells situated on the backside ofthe chest and abdominal region. Signal was collected from a single subject laying onthe air mattress where ECG and nasal airflow signal were collected simultaneously.Although the balancing tube helped eliminate body motion, it affected the sensitivityof the measurement. Heart rate was measured by finding the maximum peak of theBCG signal between the two R-R peaks of the ECG signal. On the other hand, therespiratory rate was measured by windowed fast Fourier transform, i.e., short-timeFourier transform (STFT). Preliminary results showed good match against referencedevices. Nevertheless, the proposed system might not be a preferred choice for large-scale deployment due to its complexity. In another study, Shin et al. [Shin 2010]applied the same air mattress for uncontaminated measurement of heart rate andrespiration. In which, a total of 13 healthy male subjects were involved in thevalidation study, i.e., four hours study. The authors measured the heart rate fromthe R-peaks of the ECG, while the respiratory rate was measured manually. Inaddition, the authors asked three subjects to simulate sleep apnea (breath-holding)five times each for 10 to 15 seconds. Thereafter, the apneas were detected based onthe variance of the respiratory signal with a moving window technique. Table 3.4summarizes the unconstrained monitoring of vital signs using the pneumatic-basedsensors.
3.2.4 Strain Gauges-Based Sensors
Brink et al. [Brink 2006] implemented four force sensors under bed-frames tounobtrusively record heartbeat, respiration activity, and body movements. Eachforce sensor consisted of a reflex light barrier sandwiched between two aluminumplates. When a force is applied to the sensor, the two aluminum plates are squeezedtogether slightly and the distance between them decreases. The reflex light barriersenses the distance between the two plates and converts it into a voltage signal,which is analogous to the ballistic forces of the heart. This voltage signal is thenpre-amplified and passed through a low-pass filter to eliminate ripple and noise. Inthis preliminary study, heartbeat and respiration were detected by finding localminima or maxima in the signal within a sliding window. To evaluate the robustnessof the force sensors, the signals were acquired from four subjects (2 males and 2females) and in different conditions, i.e., three types of single beds, three types offrames, two types of mattresses. In total, seventy-two conditions were evaluated. Ineach condition, subjects were asked to sleep in a relaxed supine position on the bed.The signals were collected during 5-minute recording from the four force sensors.Additionally, ECG signals were also collected as a reference. Preliminary resultsshowed that the proposed system can be an acceptable tool for computerized andunattended sleep-data collection over a lengthy period.
Inan et al. [Inan 2009] collected ballistocardiogram signals using strain gaugeswithin a modified commercial scale. The signals were collected from twenty-onesubjects (11 males and 10 females), on which participants were asked to stand asquiet as possible on the scale for 45 seconds while BCG and ECG were concurrently

3.2
.B
allisto
card
iog
rap
hy
43
Table 3.4: Summary of unconstrained monitoring of vital signs using Pneumatic-based sensors. N/A: not available,
M : male, F: female, HR: heart rate, RR: respiratory rate, Min: minutes, Hrs: hours, Sec: seconds, STFT : short-
time Fourier transform, Lab: laboratory.
Method Subjects (M, F) Deployment Duration Outcome[Watanabe 2005] STFT 12 M, 3 F Lab Overnight HR, RR, SI[Kurihara 2012] STFT 10 N/A Lab 20 Sec HR, RR[Chee 2005, Shin 2006] ECG Sync, STFT 1 N/A Lab N/A HR, RR[Shin 2010] ECG Sync, STFT 13 M Lab 4 Hrs HR, RR

44 Chapter 3. Literature Review
recorded. In this study, the measured ballistocardiogram signals from all subjectsclosely resemble those reported in the literature. Besides, the system was able toprovide beat-to-beat cardiac output monitoring. Additionally, ballistocardiogrammeasurements were found to be repeatable over 50 recordings collected from thesame subject over a three-week period. The proposed solution was more susceptibleto motion artifacts because the signals were acquired in a standing position. Hence,it might not be suitable for older adults who cannot stand as tranquil on the scale.In order to eliminate floor vibrations, Inan et al. [Inan 2010a] proposed a seismicsensor, i.e., geophone, located in proximity to the modified scale that served as thenoise reference. An adaptive algorithm was then implemented to filter the output ofthis sensor and cancel the vibrations from the measured ballistocardiogram signal.Signals were collected from a healthy volunteer while another person stomped aroundthe scale, hence producing increased floor vibrations. Furthermore, signals were alsocollected from another volunteer standing inside a parked bus while the engine wasfunctioning. This research established that ballistocardiogram recording is feasible inalmost all environments, including ambulances and other transport vehicles, as longas the vibrations are not so significant to rail the electronics or lead to a distortedversion of the ballistocardiogram force to be coupled to the scale.
In the same way, Inan et al. [Inan 2010b] evaluated the electromyogram signalcollected from the feet of the subject during ballistocardiogram recording as anoise reference for standing ballistocardiogram measurements. As the lower-bodyelectromyogram signal can be collected directly from the footpad of the modifiedscale, the proposed system is self-contained and can automatically eliminate motionartifacts. In another study, Wiard et al. [Wiard 2011] used a motion sensor insteadof electromyogram sensors to record body motions and to serve as a noise reference.The added value of the motion sensor was to provide a minimum delay between themotion-related noise in the measured signal and the noise detected by the motionsensor. This minimum delay provided the time resolution needed to flag singleheartbeat events, hence maximizing the refinement of the approach.
Brüser et al. [Bruser 2011] introduced an unsupervised learning approach tomeasuring heartbeat in a noninvasive manner. Ballistocardiogram signals wererecorded by strain gauges in a Wheatstone bridge configuration attached to theslat under the mattress of a hospital bed. A high-pass filter was applied to theraw data in order to remove low-frequency respiratory components. Next, a set offeatures, representing the fundamental morphology of the heartbeat, were extractedfrom a 30-second time segment. Afterward, the principal component analysis wasapplied in order to reduce the dimensionality of the feature vectors. Additionally,a k-means clustering algorithm was adopted to identify clusters of feature vectors.This training step resulted in a list of estimated heartbeat locations. The parametersobtained during the training step were thus manipulated to locate heartbeats inthe remaining ballistocardiogram signal by merging the results of three independentindicator functions, i.e., cross-correlation, Euclidean distance, and heart valve signal.Finally, the estimated heartbeat locations were exploited to provide an improvedlist of beat-to-beat periods. Signals were captured from sixteen healthy subjects
3.2. Ballistocardiography 45
(9 males and 7 females) during thirty minutes switching their positions every 7.5minutes (left lateral, supine, right lateral, prone). This method produced goodagreement with the reference ECG. However, the primary limitation was the trainingstep as it had to be repeated whenever subjects enter the bed or adjust their posturewith regard to the ballistocardiogram sensor.
Nukaya et al. [Nukaya 2012] provided a contact-free method for unobtrusivemeasuring of heartbeat, respiration, body movement, and position change. Theauthors collected the pressure data using four piezoceramics transducers set beneathbed supports. The proposed system was able to detect previous bio-signals withoutthe need for a preamplifier, accordingly without any voltage source. This is becausethe sensing devices were distortion sensors that operate without an electrical powersupply, i.e., they produce voltage according to the time derivative of the distortion.
Vehkaoja et al. [Vehkaoja 2013] introduced dynamic pressure sensors for detect-ing heartbeat intervals of an individual sleeping on a bed. The pressure sensorswere composed of EMFi material and located under the bed supports. In thisstudy, individual heartbeats were not observed. However, the intervals in whichthe correlation between two successive signals segment maximized. Ballistocardio-gram signals were collected from nine subjects (5 males, 4 females) during 1-hourrecording. The beat-to-beat intervals provided by this approach can be adopted indetermining frequency domain heart rate variability that is most frequently used inthe assessment of sleep quality.
Lee [Lee 2016] et al. proposed to use load cells, installed under bed supports, tomeasure heart rate and respiration for infants. Four infants (5 to 42 months) wereinvolved in the study and a total of 13 experiments were carried out between 10to 178.8 minutes. Initially, heart rate and respiratory components were extractedusing band-pass filters of various cutoff frequencies. For the heart rate component,a first-order differentiation filter was applied, thus a nonlinear transformation, i.e.,a Shannon entropy was applied to the differentiated signal to obtain only positivepeaks. Additionally, a moving average filter was employed to flatten out the spikesand noise bursts. At last, heart rate was measured by finding local peaks in anoptimum signal. For the respiration component, as the band-pass filtered signalcontained residual baseline drift, a detrending algorithm based on empirical modedecomposition was adopted to get rid of such unwanted trend. Similar to heart rate,local peaks were detected in the detrended signal and therefore the respiratory ratewas measured. A signal quality index was developed to choose the optimum signalout of the four load cells’ signals. The quality processing procedure was developedbased on calculating a threshold value computed from an autocorrelation functionand a power spectral density function. The proposed system achieved acceptableresults compared to the reference ECG and respiratory belt. Table 3.5 summarizesthe unconstrained monitoring of vital signs using the strain gauges-based sensors.

46
Ch
ap
ter
3.
Lite
ratu
reR
ev
iew
Table 3.5: Summary of unconstrained monitoring of vital signs using Pneumatic-based sensors. N/A: not available,
M : male, F: female, HR: heart rate, RR: respiratory rate, Min: minutes, Hrs: hours, Sec: seconds, SWM/M :
sliding window minimum/maximum, ECG Sync: electrocardiogram synchronization, PCA: principal component
analysis, CCF: cross-correlation function, ED: Euclidean distance, HVS: heart valve signal, ACF: autocorrelation
function, SE: Shannon entropy, EMD: empirical mode decomposition, Lab: laboratory.
Method Subjects (M, F) Deployment Duration Outcome[Brink 2006] SWM/M 2 M, 2 F Lab 5 Min HR, RR[Inan 2009] ECG Sync 11 M, 10 F Lab 45 Sec HR
[Bruser 2011]PCA, K-meansCCF, ED, HVS
9 M, 7 F Lab 30 Min HR
[Vehkaoja 2013] ACF 5 M, 4 F Lab 1 Hrs HR[Lee 2016] SE, EMD, SWM/M Infants (3 M, 1 F) Home 10 - 178.8 Min HR, RR
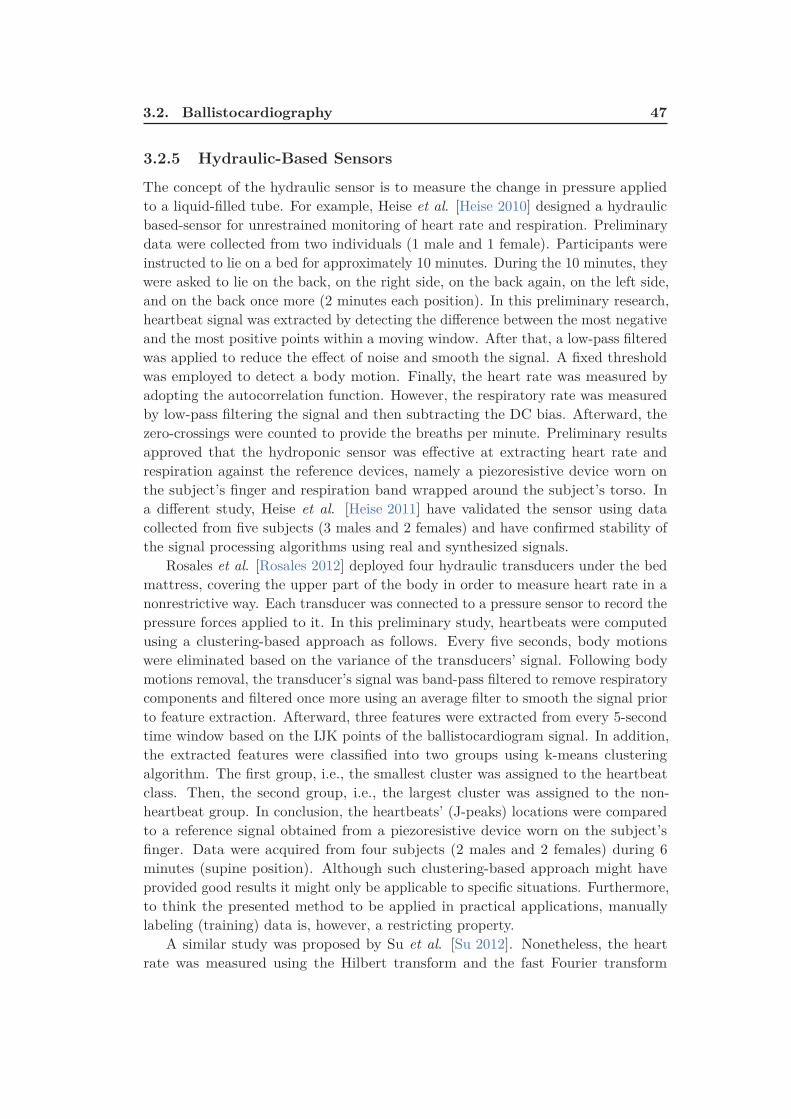
3.2. Ballistocardiography 47
3.2.5 Hydraulic-Based Sensors
The concept of the hydraulic sensor is to measure the change in pressure appliedto a liquid-filled tube. For example, Heise et al. [Heise 2010] designed a hydraulicbased-sensor for unrestrained monitoring of heart rate and respiration. Preliminarydata were collected from two individuals (1 male and 1 female). Participants wereinstructed to lie on a bed for approximately 10 minutes. During the 10 minutes, theywere asked to lie on the back, on the right side, on the back again, on the left side,and on the back once more (2 minutes each position). In this preliminary research,heartbeat signal was extracted by detecting the difference between the most negativeand the most positive points within a moving window. After that, a low-pass filteredwas applied to reduce the effect of noise and smooth the signal. A fixed thresholdwas employed to detect a body motion. Finally, the heart rate was measured byadopting the autocorrelation function. However, the respiratory rate was measuredby low-pass filtering the signal and then subtracting the DC bias. Afterward, thezero-crossings were counted to provide the breaths per minute. Preliminary resultsapproved that the hydroponic sensor was effective at extracting heart rate andrespiration against the reference devices, namely a piezoresistive device worn onthe subject’s finger and respiration band wrapped around the subject’s torso. Ina different study, Heise et al. [Heise 2011] have validated the sensor using datacollected from five subjects (3 males and 2 females) and have confirmed stability ofthe signal processing algorithms using real and synthesized signals.
Rosales et al. [Rosales 2012] deployed four hydraulic transducers under the bedmattress, covering the upper part of the body in order to measure heart rate in anonrestrictive way. Each transducer was connected to a pressure sensor to record thepressure forces applied to it. In this preliminary study, heartbeats were computedusing a clustering-based approach as follows. Every five seconds, body motionswere eliminated based on the variance of the transducers’ signal. Following bodymotions removal, the transducer’s signal was band-pass filtered to remove respiratorycomponents and filtered once more using an average filter to smooth the signal priorto feature extraction. Afterward, three features were extracted from every 5-secondtime window based on the IJK points of the ballistocardiogram signal. In addition,the extracted features were classified into two groups using k-means clusteringalgorithm. The first group, i.e., the smallest cluster was assigned to the heartbeatclass. Then, the second group, i.e., the largest cluster was assigned to the non-heartbeat group. In conclusion, the heartbeats’ (J-peaks) locations were comparedto a reference signal obtained from a piezoresistive device worn on the subject’sfinger. Data were acquired from four subjects (2 males and 2 females) during 6minutes (supine position). Although such clustering-based approach might haveprovided good results it might only be applicable to specific situations. Furthermore,to think the presented method to be applied in practical applications, manuallylabeling (training) data is, however, a restricting property.
A similar study was proposed by Su et al. [Su 2012]. Nonetheless, the heartrate was measured using the Hilbert transform and the fast Fourier transform
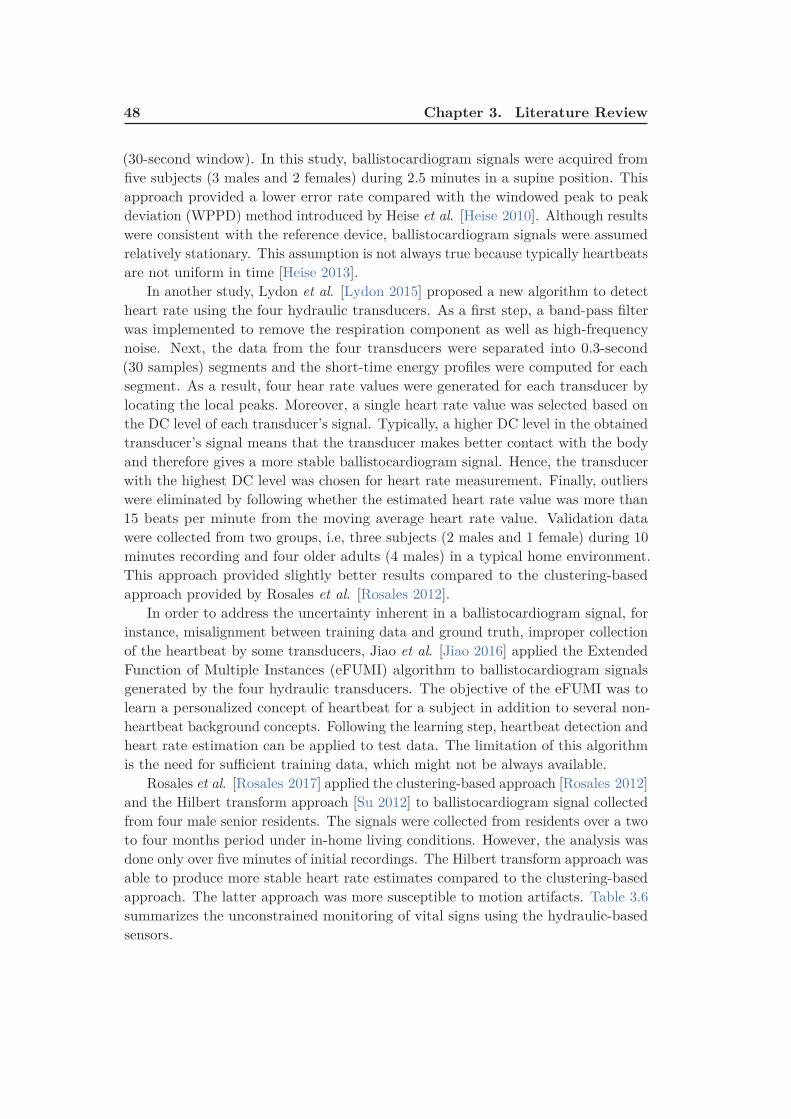
48 Chapter 3. Literature Review
(30-second window). In this study, ballistocardiogram signals were acquired fromfive subjects (3 males and 2 females) during 2.5 minutes in a supine position. Thisapproach provided a lower error rate compared with the windowed peak to peakdeviation (WPPD) method introduced by Heise et al. [Heise 2010]. Although resultswere consistent with the reference device, ballistocardiogram signals were assumedrelatively stationary. This assumption is not always true because typically heartbeatsare not uniform in time [Heise 2013].
In another study, Lydon et al. [Lydon 2015] proposed a new algorithm to detectheart rate using the four hydraulic transducers. As a first step, a band-pass filterwas implemented to remove the respiration component as well as high-frequencynoise. Next, the data from the four transducers were separated into 0.3-second(30 samples) segments and the short-time energy profiles were computed for eachsegment. As a result, four hear rate values were generated for each transducer bylocating the local peaks. Moreover, a single heart rate value was selected based onthe DC level of each transducer’s signal. Typically, a higher DC level in the obtainedtransducer’s signal means that the transducer makes better contact with the bodyand therefore gives a more stable ballistocardiogram signal. Hence, the transducerwith the highest DC level was chosen for heart rate measurement. Finally, outlierswere eliminated by following whether the estimated heart rate value was more than15 beats per minute from the moving average heart rate value. Validation datawere collected from two groups, i.e, three subjects (2 males and 1 female) during 10minutes recording and four older adults (4 males) in a typical home environment.This approach provided slightly better results compared to the clustering-basedapproach provided by Rosales et al. [Rosales 2012].
In order to address the uncertainty inherent in a ballistocardiogram signal, forinstance, misalignment between training data and ground truth, improper collectionof the heartbeat by some transducers, Jiao et al. [Jiao 2016] applied the ExtendedFunction of Multiple Instances (eFUMI) algorithm to ballistocardiogram signalsgenerated by the four hydraulic transducers. The objective of the eFUMI was tolearn a personalized concept of heartbeat for a subject in addition to several non-heartbeat background concepts. Following the learning step, heartbeat detection andheart rate estimation can be applied to test data. The limitation of this algorithmis the need for sufficient training data, which might not be always available.
Rosales et al. [Rosales 2017] applied the clustering-based approach [Rosales 2012]and the Hilbert transform approach [Su 2012] to ballistocardiogram signal collectedfrom four male senior residents. The signals were collected from residents over a twoto four months period under in-home living conditions. However, the analysis wasdone only over five minutes of initial recordings. The Hilbert transform approach wasable to produce more stable heart rate estimates compared to the clustering-basedapproach. The latter approach was more susceptible to motion artifacts. Table 3.6summarizes the unconstrained monitoring of vital signs using the hydraulic-basedsensors.

3.2
.B
allisto
card
iog
rap
hy
49
Table 3.6: Summary of unconstrained monitoring of vital signs using Hydraulic-based sensors. N/A: not available,
M : male, F: female, HR: heart rate, RR: respiratory rate, Min: minutes, Hrs: hours, Sec: seconds, WPPD:
windowed peak to peak deviation, CA: clustering approach: HT : Hilbert transform, STE: short-time energy,
eFUMI : extended function of multiple instances, Lab: laboratory.
Method Subjects (M, F) Deployment Duration Outcome[Heise 2010] WPPD 1 M, 1 F Lab 10 Min HR, RR[Heise 2011] WPPD 3 M, 2 F Lab 10 Min HR, RR[Rosales 2012] CA 2 M, 2 F Lab 6 Min HR[Su 2012] HT 3 M, 2 F Lab 2.5 Min HR
[Lydon 2015] STE2 M, 1F4M
LabHome
10 MinOvernight
HRHR
[Jiao 2016] eFUMI 4 N/A Lab 10 Min HR[Rosales 2017] CA, HT 4 M Home Overnight HR

50 Chapter 3. Literature Review
3.2.6 Fiber Optic-Based Sensors
In existing literature, unobtrusive vital signs monitoring is achieved either bymicrobend fiber-optic sensors (MFOS) or fiber Bragg grating sensors (FBGS). Theprinciple of the MFOS is that if an optical fiber is bent, insignificant amounts of lightare lost through the fiber walls. This reduces the amount of received light and is afunction of bend pressure [Lagakos 1987, Berthold 1995, Luo 1999, feng Hu 2016].The FBG is an optical fiber that serves as a filter for a specific wavelength of light.The principle of the FBGS is to detect the reflected Bragg wavelength shift owing tochanges in temperature, strain, or pressure [Moghadas 2010, Poeggel 2015]. FiberBragg gratings are commonly used optical fiber sensors for measuring temperatureand/or mechanical strain. Though, the excessive cost of the interrogation systems isthe most significant obstacle for their large commercial application [Díaz 2017].
Chen et al. [Chen 2009c, Chen 2012] described the effectiveness of the MFOSfor nonintrusive monitoring of heart rate and breathing rate. For heart rate,ballistocardiogram signals were gathered from several subjects in sitting positionand breathing normally. Preliminary results have proved that the ballistocardiogramwaveforms closely simulated those reported in the existing literature. For breathingrate, nine volunteers were involved in the study in which respiratory signals werecollected during sleep. The system has shown a good match with the referencerespiratory device. Deepu et al. [Deepu 2012] introduced a smart cushion integratedwith MFOS for real-time heart rate monitoring. The cushion can be placed onthe seat or back of a chair for data collection. In this study, five subjects wereinvolved, and signals were collected during 5-minutes. Several steps were appliedto the cushion’s signals in order to unobtrusively measure the heart rate. Initially,low and high-frequency noises were suppressed using a band-pass finite impulseresponse (FIR) filter. Next, a cubing operation was applied to the filtered signalto enhance the amplitude swing while keeping the signal sign intact. Afterward,momentary upswing or downswing was removed by applying a moving average filter.Furthermore, the resultant signal was smoothed by utilizing the absolute value andaveraging over a predefined time window. At last, the J-peaks were recognizedby using a cone detection and comparing to an adaptive threshold. The proposedsystem achieved satisfactory results compared to the reference pulse oximetry device.
Chen et al. [Chen 2013] studied the possibility of measuring blood pressureusing ballistocardiography and photoplethysmography (PPG). The concept wasto calculate the time delay between the peaks of the ballistocardiography and thecorresponding PPG peaks. Ballistocardiogram signals were collected from fivehealthy subjects in a sitting position using a cushion integrated with MFOS, whereasPPG signals were collected from a finger pulse oximeter. Preliminary results haveshown that blood pressure might be measured using optical devices. However, theproposed approach was very challenging because it required a calibration procedurefor each subject prior to measurement.
Lau et al. [Lau 2013] evaluated the effectiveness of the MFOS for respiratorymonitoring and respiratory gating in the magnetic resonance imaging (MRI) envi-

3.2. Ballistocardiography 51
ronment. Respiratory gating is the process of reducing cardiorespiratory artifactsby synchronizing magnetic resonance data acquisition to the cardiac or respiratorycycles. Unlike electrical sensors, fiber-optic sensors are immune to electromagneticand radio-frequency interference. Twenty healthy subjects (10 males and 10 females)were involved in the study and they underwent T2-weighted half-Fourier single-shotturbo spin-echo MRI of the liver with synchronous breathing rate monitoring on a1.5 Tesla magnetic resonance scanner. The breathing rate was detected by applyinga band-pass filter and hence detecting local peaks in the time domain. This studypresented that the MFOS were able to detect comparable breathing rate to thereference respiratory bellows and produce liver MRI images of good diagnostic qual-ity compared to the navigator-acquired scans. Chen et al. [Chen 2014b] reportedrelated results using data collected from eleven healthy subjects (6 males and 5females) during MRI.
A similar study was provided by Dziuda et al. [Dziuda 2013a]. However, authorsused FBG sensors rather than MFOS. Three healthy volunteers (2 males and 1female) were included in the study and physiological data were collected during95 minutes. Both heart rate and breathing rate were measured by finding localmaxima after applying band-pass filters of different cutoff frequencies to the sensordata. Similar to the MFOS, the FBG sensor did not introduce any artifacts intoMRI images. Furthermore, the system achieved comparable results to the referencedevices, i.e., carbon electrodes and pneumatic bellows, respectively. Dziuda et al.[Dziuda 2013b, Dziuda 2014, Krej 2015, Dziuda 2015] reported similar results usingdata collected during MRI examination.
Zhu et al. [Zhu 2013] demonstrated the effectiveness of the MFOS for unobtrusivemeasurement of heart rate in a headrest position. Three healthy individuals wereenrolled in the study in which an optical sensor mat was placed on the headrestof a massage chair. The participants were instructed to complete predefined seriesof tasks, i.e., rest, cognitive test battery, and relaxing massage session. In thispreliminary study, the analysis was done only during rest periods for a total of sixminutes. A band-pass filter was applied to the sensor data to remove low-frequencyrespiratory signals. Afterward, heart rate was computed using short-time Fouriertransform. The proposed system achieved a relatively good agreement against thereference ECG.
Chen et al. [Chen 2014a] reported the results of using the MFOS in a clinicaltrial for unobtrusive monitoring of heart rate and respiration during sleep. Duringthe study, data were collected from twenty-two subjects using the optical fiber sensorand also from the standard polysomnography as a reference. At the beginning,large body movements were eliminated using a moving time window. In which, asegment was identified as a body movement if the difference between the maximumand the minimum in the moving window was larger than a fixed threshold. Next,respiratory and heartbeat components were separated from the sensor’s signalsusing band-pass filters of different cutoff frequencies. In the former, the signalswere smoothed using a moving-average filter and hence the baseline was obtainedby another moving-average filter of a larger window size. After subtracting the
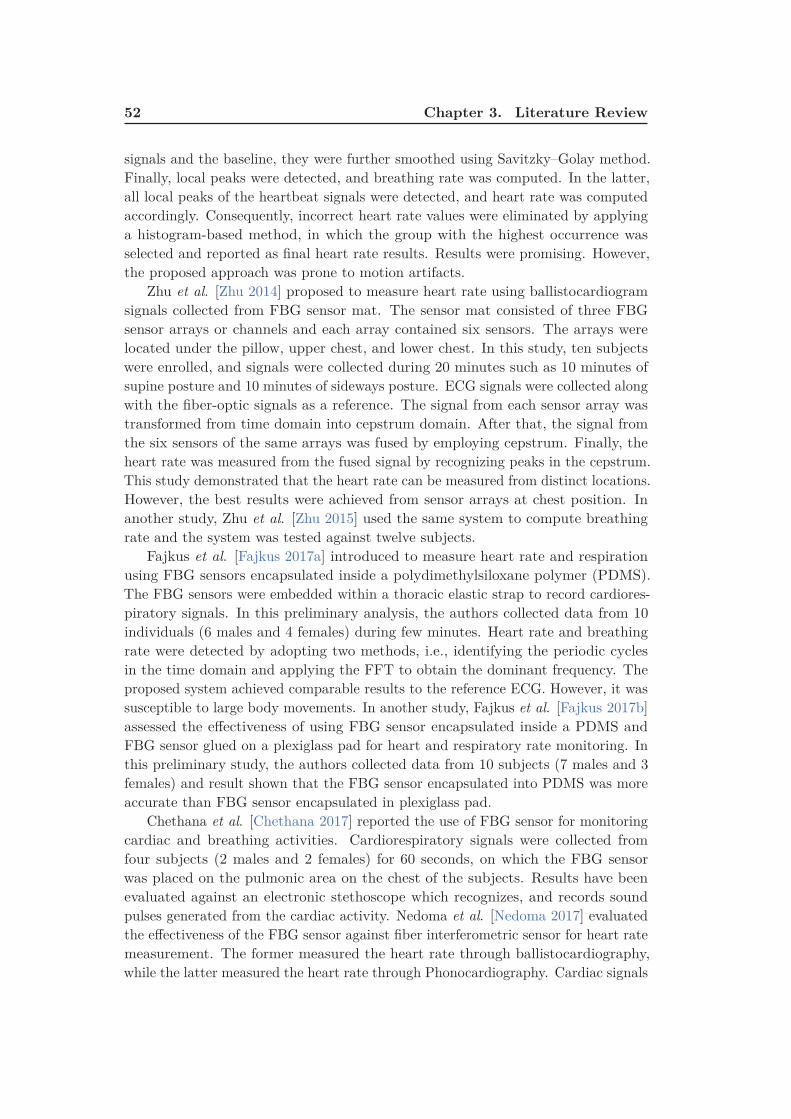
52 Chapter 3. Literature Review
signals and the baseline, they were further smoothed using Savitzky–Golay method.Finally, local peaks were detected, and breathing rate was computed. In the latter,all local peaks of the heartbeat signals were detected, and heart rate was computedaccordingly. Consequently, incorrect heart rate values were eliminated by applyinga histogram-based method, in which the group with the highest occurrence wasselected and reported as final heart rate results. Results were promising. However,the proposed approach was prone to motion artifacts.
Zhu et al. [Zhu 2014] proposed to measure heart rate using ballistocardiogramsignals collected from FBG sensor mat. The sensor mat consisted of three FBGsensor arrays or channels and each array contained six sensors. The arrays werelocated under the pillow, upper chest, and lower chest. In this study, ten subjectswere enrolled, and signals were collected during 20 minutes such as 10 minutes ofsupine posture and 10 minutes of sideways posture. ECG signals were collected alongwith the fiber-optic signals as a reference. The signal from each sensor array wastransformed from time domain into cepstrum domain. After that, the signal fromthe six sensors of the same arrays was fused by employing cepstrum. Finally, theheart rate was measured from the fused signal by recognizing peaks in the cepstrum.This study demonstrated that the heart rate can be measured from distinct locations.However, the best results were achieved from sensor arrays at chest position. Inanother study, Zhu et al. [Zhu 2015] used the same system to compute breathingrate and the system was tested against twelve subjects.
Fajkus et al. [Fajkus 2017a] introduced to measure heart rate and respirationusing FBG sensors encapsulated inside a polydimethylsiloxane polymer (PDMS).The FBG sensors were embedded within a thoracic elastic strap to record cardiores-piratory signals. In this preliminary analysis, the authors collected data from 10individuals (6 males and 4 females) during few minutes. Heart rate and breathingrate were detected by adopting two methods, i.e., identifying the periodic cyclesin the time domain and applying the FFT to obtain the dominant frequency. Theproposed system achieved comparable results to the reference ECG. However, it wassusceptible to large body movements. In another study, Fajkus et al. [Fajkus 2017b]assessed the effectiveness of using FBG sensor encapsulated inside a PDMS andFBG sensor glued on a plexiglass pad for heart and respiratory rate monitoring. Inthis preliminary study, the authors collected data from 10 subjects (7 males and 3females) and result shown that the FBG sensor encapsulated into PDMS was moreaccurate than FBG sensor encapsulated in plexiglass pad.
Chethana et al. [Chethana 2017] reported the use of FBG sensor for monitoringcardiac and breathing activities. Cardiorespiratory signals were collected fromfour subjects (2 males and 2 females) for 60 seconds, on which the FBG sensorwas placed on the pulmonic area on the chest of the subjects. Results have beenevaluated against an electronic stethoscope which recognizes, and records soundpulses generated from the cardiac activity. Nedoma et al. [Nedoma 2017] evaluatedthe effectiveness of the FBG sensor against fiber interferometric sensor for heart ratemeasurement. The former measured the heart rate through ballistocardiography,while the latter measured the heart rate through Phonocardiography. Cardiac signals

3.3. Conclusion 53
were obtained from six individuals (3 males and 3 females) using the two sensorsfor 60 minutes. Primary results have shown that the fiber interferometric sensorwas more accurate than the FBG sensor. Table 3.7 summarizes the unconstrainedmonitoring of vital signs using the fiber optic-based sensors.
3.3 Conclusion
This chapter provided the definition and the nomenclature of ballistocardiogra-phy. In addition, it discussed in detail the different modalities reported in existingliterature for unobtrusive monitoring of vital signs, namely heart rate, breathingrate, and body movements. These modalities include piezoelectric polyvinylidenefluoride sensors, electromechanical film sensors, pneumatic sensors, load cells, hy-draulic sensors, and fiber-optic sensors. In general, the output of these sensors is acomposite signal that is composed of cardiac activities, respiratory activities, andbody movements. Hence, these three signals should be separated from each otherso that vital signs can be measured. The separation process is usually performedby applying a band-pass filter of specific cutoff frequencies according to the signalof interest. In other cases, the separation process can be performed by adoptinga decomposition algorithm such as empirical mode decomposition algorithm andwavelet multiresolution analysis. It should be noted that, vital activities cannotbe detected during body movements and hence they should be eliminated prior tothe measurement process. Following the separation process, i.e., obtaining cardiacsignals and respiratory signals, several algorithms can then by implemented for vitalsmeasurements. As discussed in previous sections, these algorithms include but notlimited to simple peak detector, autocorrelation function, fast Fourier transform,cepstrum analysis, wavelet multiresolution analysis, empirical mode decomposition,power spectrum analysis, and clustering-based approaches. The clustering-basedapproaches are not very effective because the training step should be repeated when-ever the data collection protocol has been changed. Moreover, the ballistocardiogrammorphology varies between and within subjects, and the shape of the signal is highlydependent on subject’s postures, i.e., sleeping or sitting. Furthermore, the raw signalis noisy and nonstationary due to body movement, induced respiratory efforts, andthe characteristics of the sensing system itself. As previously mentioned in Chapter 1,the microbend fiber-optic sensor will be used to record cardiorespiratory signalsdue to its high sensitivity to ballistic forces of the heart as well as its immunity toelectrical and electromagnetic interference. The ensuing chapter will show in moredetail the theory of the microbend fiber-optic sensor in addition to the proposedsystem to analyze and interpret the cardiorespiratory signals obtained from theoptical fiber sensor.

54
Ch
ap
ter
3.
Lite
ratu
reR
ev
iew
Table 3.7: Summary of unconstrained monitoring of vital signs using Hydraulic-based sensors. N/A: not avail-
able, M : male, F: female, HR: heart rate, RR: respiratory rate, Min: minutes, Hrs: hours, Sec: seconds, BP:
blood pressure, PPG Sync: Photoplethysmography synchronization: STFT : short-time Fourier transform, CEPS:
cepstrum, Lab: laboratory.
Method Subjects (M, F) Deployment Duration Outcome[Chen 2009c][Chen 2012]
VisuallyVisually
N/A9 N/A
LabLab
N/AN/A
HRRR
[Deepu 2012] Peak Detector 5 N/A Lab 5 Min HR[Chen 2013] PPG Sync 5 N/A Lab N/A BR[Lau 2013][Chen 2014b]
Peak DetectorPeak Detector
10 M, 10 F6 M, 5 F
MRIMRI
N/AN/A
RRHR, RR
[Dziuda 2013a][Dziuda 2013b][Dziuda 2014][Krej 2015]
Peak DetectorPeak DetectorPeak DetectorPeak Detector
2 M, 1 F8 M, 4 F1 M6 M, 2 F
MRIMRIMRIMRI
95 Min60 Min19 Min82 Min
HR, RRHR, RRHRHR
[Zhu 2013] STFT 3 N/A Lab 6 Min HR[Chen 2014a] Peak Detector 22 N/A Hospital Overnight HR, RR[Zhu 2014, Zhu 2015] CEPS 10 N/A Lab 20 Min HR, RR[Fajkus 2017a] Peak Detector, FFT 6 M, 4 F Lab N/A HR, RR[Chethana 2017] Visually 2 M, 2 F Hospital 1 Min HR, RR[Nedoma 2017] Peak Detector 3 M, 3 F Lab 60 Min HR, RR
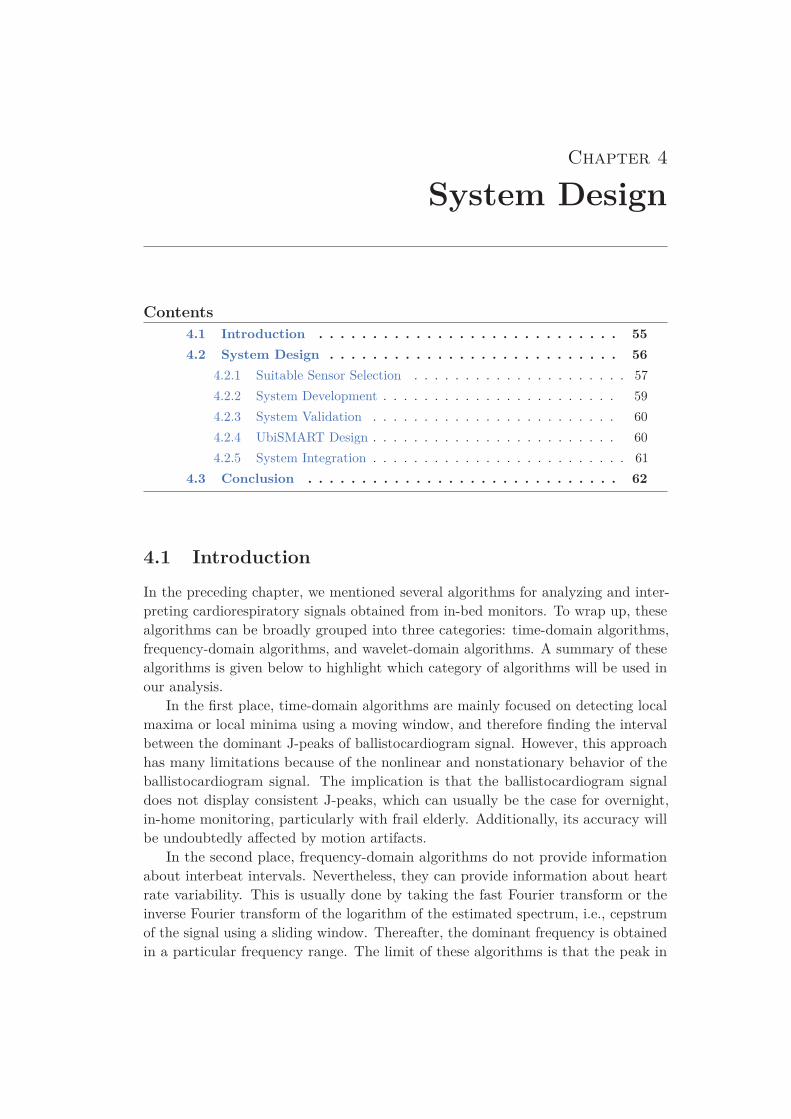
Chapter 4
System Design
Contents
4.1 Introduction . . . . . . . . . . . . . . . . . . . . . . . . . . . . 55
4.2 System Design . . . . . . . . . . . . . . . . . . . . . . . . . . . 56
4.2.1 Suitable Sensor Selection . . . . . . . . . . . . . . . . . . . . . 57
4.2.2 System Development . . . . . . . . . . . . . . . . . . . . . . . 59
4.2.3 System Validation . . . . . . . . . . . . . . . . . . . . . . . . 60
4.2.4 UbiSMART Design . . . . . . . . . . . . . . . . . . . . . . . . 60
4.2.5 System Integration . . . . . . . . . . . . . . . . . . . . . . . . . 61
4.3 Conclusion . . . . . . . . . . . . . . . . . . . . . . . . . . . . . 62
4.1 Introduction
In the preceding chapter, we mentioned several algorithms for analyzing and inter-preting cardiorespiratory signals obtained from in-bed monitors. To wrap up, thesealgorithms can be broadly grouped into three categories: time-domain algorithms,frequency-domain algorithms, and wavelet-domain algorithms. A summary of thesealgorithms is given below to highlight which category of algorithms will be used inour analysis.
In the first place, time-domain algorithms are mainly focused on detecting localmaxima or local minima using a moving window, and therefore finding the intervalbetween the dominant J-peaks of ballistocardiogram signal. However, this approachhas many limitations because of the nonlinear and nonstationary behavior of theballistocardiogram signal. The implication is that the ballistocardiogram signaldoes not display consistent J-peaks, which can usually be the case for overnight,in-home monitoring, particularly with frail elderly. Additionally, its accuracy willbe undoubtedly affected by motion artifacts.
In the second place, frequency-domain algorithms do not provide informationabout interbeat intervals. Nevertheless, they can provide information about heartrate variability. This is usually done by taking the fast Fourier transform or theinverse Fourier transform of the logarithm of the estimated spectrum, i.e., cepstrumof the signal using a sliding window. Thereafter, the dominant frequency is obtainedin a particular frequency range. The limit of these algorithms is that the peak in
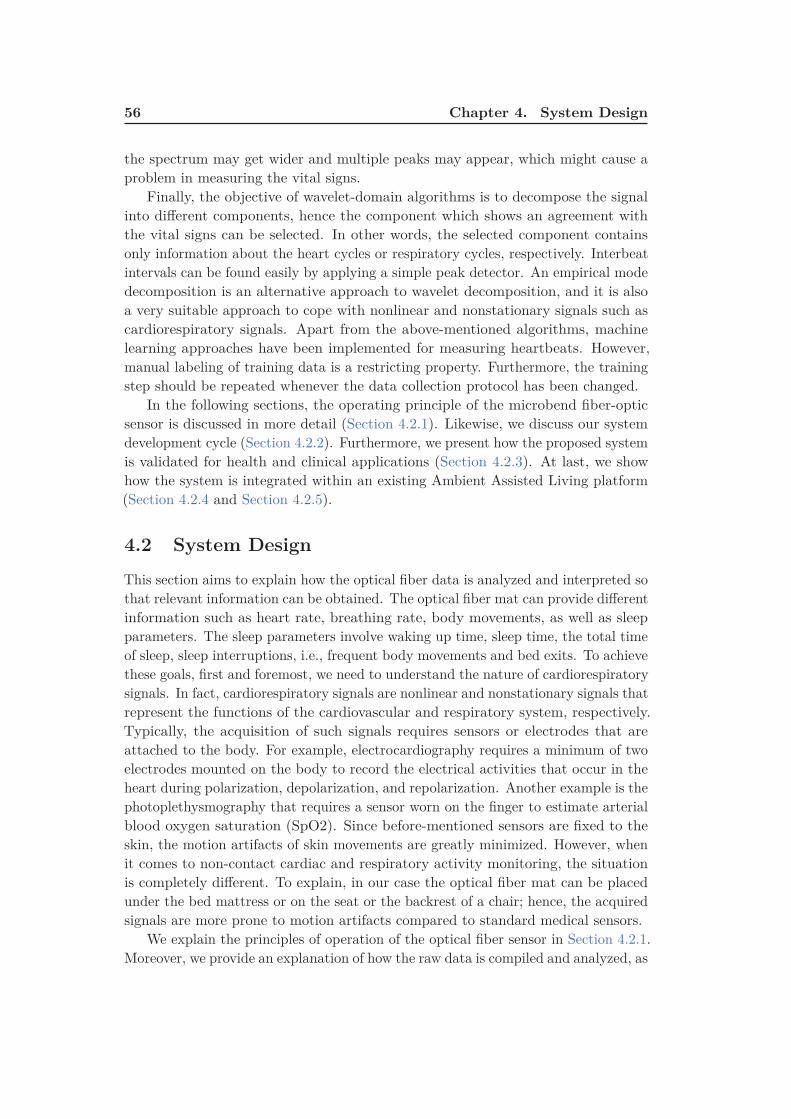
56 Chapter 4. System Design
the spectrum may get wider and multiple peaks may appear, which might cause aproblem in measuring the vital signs.
Finally, the objective of wavelet-domain algorithms is to decompose the signalinto different components, hence the component which shows an agreement withthe vital signs can be selected. In other words, the selected component containsonly information about the heart cycles or respiratory cycles, respectively. Interbeatintervals can be found easily by applying a simple peak detector. An empirical modedecomposition is an alternative approach to wavelet decomposition, and it is alsoa very suitable approach to cope with nonlinear and nonstationary signals such ascardiorespiratory signals. Apart from the above-mentioned algorithms, machinelearning approaches have been implemented for measuring heartbeats. However,manual labeling of training data is a restricting property. Furthermore, the trainingstep should be repeated whenever the data collection protocol has been changed.
In the following sections, the operating principle of the microbend fiber-opticsensor is discussed in more detail (Section 4.2.1). Likewise, we discuss our systemdevelopment cycle (Section 4.2.2). Furthermore, we present how the proposed systemis validated for health and clinical applications (Section 4.2.3). At last, we showhow the system is integrated within an existing Ambient Assisted Living platform(Section 4.2.4 and Section 4.2.5).
4.2 System Design
This section aims to explain how the optical fiber data is analyzed and interpreted sothat relevant information can be obtained. The optical fiber mat can provide differentinformation such as heart rate, breathing rate, body movements, as well as sleepparameters. The sleep parameters involve waking up time, sleep time, the total timeof sleep, sleep interruptions, i.e., frequent body movements and bed exits. To achievethese goals, first and foremost, we need to understand the nature of cardiorespiratorysignals. In fact, cardiorespiratory signals are nonlinear and nonstationary signals thatrepresent the functions of the cardiovascular and respiratory system, respectively.Typically, the acquisition of such signals requires sensors or electrodes that areattached to the body. For example, electrocardiography requires a minimum of twoelectrodes mounted on the body to record the electrical activities that occur in theheart during polarization, depolarization, and repolarization. Another example is thephotoplethysmography that requires a sensor worn on the finger to estimate arterialblood oxygen saturation (SpO2). Since before-mentioned sensors are fixed to theskin, the motion artifacts of skin movements are greatly minimized. However, whenit comes to non-contact cardiac and respiratory activity monitoring, the situationis completely different. To explain, in our case the optical fiber mat can be placedunder the bed mattress or on the seat or the backrest of a chair; hence, the acquiredsignals are more prone to motion artifacts compared to standard medical sensors.
We explain the principles of operation of the optical fiber sensor in Section 4.2.1.Moreover, we provide an explanation of how the raw data is compiled and analyzed, as

4.2. System Design 57
well as how the proposed methodology is validated in Section 4.2.2 and Section 4.2.3,respectively.
4.2.1 Suitable Sensor Selection
As we discussed in Chapter 1 and Chapter 3, the microbend fiber-optic sensor1
(MFOS) is selected for unobtrusive acquisition of cardiorespiratory signals. It isbecause the sensor is particularly sensitive to pressure fluctuations induced by theballistic forces of the heart, and it does not require close contact with the body. It isalso relatively small, lightweight, and affordable, and then it is a suitable candidatefor long-term monitoring of vital signs without disturbing patient’s comfort. Incontradistinction to electrical sensors, optical sensors are immune to electromagneticand radio frequency interference. Hence, they are useful for real-time monitoring ofphysiological signals during magnetic resonance imaging. The proposed optical fiber
50 cm
20 cm
Processing
Unit
Figure 4.1: The deployable sensor mat and processing unit (Mat dimen-
sions: 20 cm × 50 cm × 0.5 cm).
system consists of a sensor mat integrated with microbending multimode fiber anda processing unit as shown in Figure 4.1. The processing unit contains a Micro-SDcard, digital electronics for signal manipulation, and a Wi-Fi signal transmissionmodule. By way of introduction, the fundamental principle of the MFOS is basedon the light intensity modulation induced by microbending in multimode fibers,
1The system hardware is commercialized by Juvo Labs company in Singapore (patented by
A*STAR). Our contribution focused on the software part development by denoising and analyzing
raw data from the mat

58 Chapter 4. System Design
which is used as a transduction mechanism for detecting pressure. A 10-meterloop of graded-index multimode fiber is sandwiched between two layers of tunedgrating structures that subject the fiber to mechanical perturbation when there isa pressure applied as shown in Figure 4.2. The pressure causes the transmissionmodes in the multimode fiber to be coupled into the loss mode, reducing the amountof light received by the photodetector. Thereupon, the detected light is convertedto current by the photodetector, which is, in turn, converted into a voltage using atransimpedance amplifier. The signal is filtered via a 20 Hz low-pass filter and thendigitized by a 16-bit analog-to-digital converter with a sampling frequency of 50 Hz.
Pressure
Modulated
Light
Pressure Microbender
Light
Optical Fiber
Figure 4.2: Longitudinal section of the microbend fiber-optic sensor.
Secondly, the presented sensor is constructed by using a typical graded-indexmultimode fiber with a core diameter of 100 µm and numerical aperture (N.A.)of 0.272 as the sensing fiber [Chen 2012, Lau 2013, Chen 2014b]. The sensor matis manufactured to a dimension of (20 cm × 50 cm × 0.5 cm), which facilitatesits portability and inclusion into cushions, pillows, chairs, beds, etc. The sensormat applies a force ∆F or a pressure ∆P to the bent multimode fiber and causesthe amplitude of the fiber deformation X to change by an amount of ∆X. Thistakes place in response to breathing-generated body movement and heart rhythm-generated body movement. The transmission coefficient T for the light movingthrough the bent multimode fiber is altered by an amount ∆T as follows.
∆T =
(∆T
∆X
)∆F
(k +
AY
l
)(4.1)
where k is the force constant of the bent fiber, A is the cross-sectional area, Y isYoung’s modulus, and l is the microbender gap. Typically, detection of cardiores-

4.2. System Design 59
piratory signals is dependent on modulation in optical transmission. Regardinghigh-sensitivity pressure sensor application, Equation (4.1) is formulated as follows.
∆T ∼= ∆T
∆XAp k−1 ∆P (4.2)
where Ap is the area of the deformer and ∆P is the variation in pressure. In orderto achieve a maximum microbend sensitivity, the optical fiber should be constructedsuch that the spatial frequency Λ of the microbenders for graded-index multimodefiber complies with the following approximate relationship:
Λ =2π · a · n0
NA(4.3)
where a is the radius of the fiber core, n0 is the refractive index of the core, and NAis the numerical aperture of the fiber. The loss in microbending develops because theguided modes are coupled to radiation modes. Equation (4.3) applies to graded-indexmultimode fiber. Alternatively, step-index multimode fiber can also be employed forconstruction of the sensor mat. In this condition, the spatial frequency ∆ of themicrobenders is obtained as follows.
Λ =
√2π · a · n0
NA(4.4)
Efficient coupling between the guided modes and radiation modes can be accom-plished with the spatial frequency Λ provided by Equation (4.3) and Equation (4.4)for graded-index and step-index multimode fibers, respectively. Nonetheless, thefirst group, i.e., graded-index multimode fibers is better than the second group,i.e., step-index multimode fibers because the first group has resonance condition, inwhich the microbending loss is precisely peaked whereas the second group does nothave the resonance condition. As a result, the first group is decided for developmentof the sensor mat [Chen 2012, Lau 2013, Chen 2014b].
4.2.2 System Development
In light of the foregoing consideration, motion artifacts occurred due body move-ments or other environmental factors should be isolated and filtered out beforethe input signal is further processed. After that, cardiac and respiratory signalscan be extracted from the filtered signal using a band-pass filter of different cutofffrequencies. Once the two main signals are separated, appropriate algorithms shouldbe implemented so that heart and breathing rate can be measured.
In this research, various techniques have been adopted to analyze the datacollected from the optical fiber mat. Initially, we applied machine learning algorithmsto classify fiber-optic data into informative and non-informative signals based ontheir heart rate information. After that, we computed the heart rate from theinformative signals using Complete Ensemble Empirical Mode Decomposition withAdaptive Noise (CEEMDAN) algorithm. This algorithm is a modified, improvedalgorithm for the Empirical Mode Decomposition algorithm. Preliminary results

60 Chapter 4. System Design
were promising. However, the CEEMDAN algorithm required high processingtime. Therefore, this approach did not meet our needs, and it was not suitablefor real-life deployment. Secondly, instead of using machine learning algorithms toget informative signals, we designed a signal quality algorithm based on the signalvariance that can automatically isolate motion artifacts and bed-exit events. Themotion artifact is a large variation in the amplitude of the fiber-optic signal, whichis sufficient enough to destroy valuable information in the signal. However, thebed-exit event is the standard fiber-optic signal that originates when there is no anypressure applied to the sensor. Thirdly, we implemented the multiresolution analysisof the Maximal Overlap Discrete Wavelet Transform (MODWT) instead of theCEEMDAN algorithm to measure the heart rate. The MODWT provided slightlyinferior results to CEEMDAN algorithm. However, it required shorter processingtime, so that it was more suitable for our real-time applications. Fourthly andfinally, we tested the effectiveness of other algorithms such as fast Fourier transform,cepstrum, and autocorrelation function.
4.2.3 System Validation
We validated the proposed system for two different applications, i.e., health andwellness application as well as clinical application. In the former application, wecollected data from fifty subjects, where the optical fiber mat was placed on theheadrest of a massage chair. This application was very challenging because of themotion artifacts caused by movement of the chair and body movement as well. Theobjective of this study was to evaluate the effectiveness of the optical fiber mat todetect heart rate in a noisy environment. In the latter application, we collecteddata from ten subjects during a drug-induced sleep endoscopy. Data acquisition wascarried out in the operating theatre of Khoo Teck Puat Hospital (KTPH), Singapore.The objective of this study was to check the performance of the optical fiber matfor unobtrusive monitoring of heart and breathing rate for sleep apnea patients.Furthermore, we also assessed the capability of the mat for unobtrusive apneadetection. After the validation procedures were completed successfully, we deployedour system in a real-life environment, i.e., user’s home. The proposed system hasbeen successfully deployed in three apartments of senior female residents over thirtydays. Furthermore, the sleep monitoring system has been integrated within anexisting Ambient Assisted Living (AAL) platform, better known as UbiSMART(Ubiquitous Service MAnagement and Reasoning archiTecture) [Tiberghien 2011].
We briefly explain our AAL platform in Section 4.2.4, and we present theintegration of the fiber-optic sensor into the platform in Section 4.2.5.
4.2.4 UbiSMART Design
UbiSMART is a web-enabled AAL platform intended for large-scale deploymentsfollowing the approach presented by Bellmunt et al. [Bellmunt 2015]. Key fea-tures [Aloulou 2016] are plug & play ability, privacy protection as there is no sound
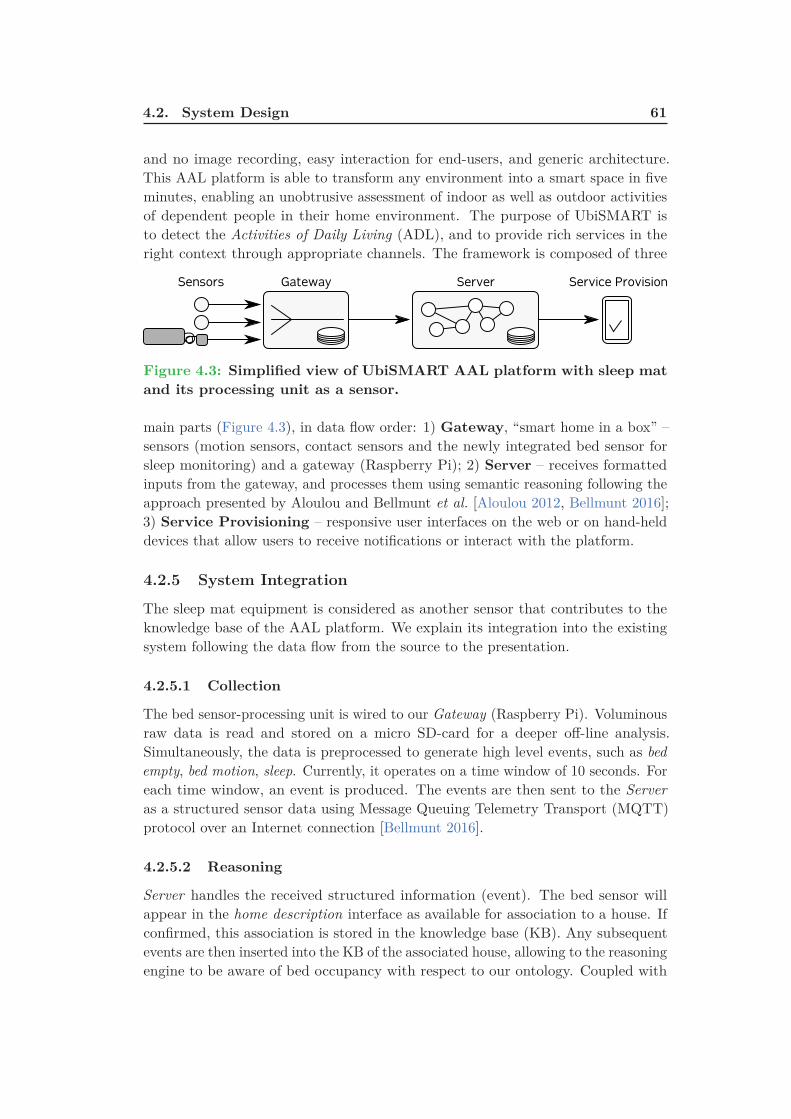
4.2. System Design 61
and no image recording, easy interaction for end-users, and generic architecture.This AAL platform is able to transform any environment into a smart space in fiveminutes, enabling an unobtrusive assessment of indoor as well as outdoor activitiesof dependent people in their home environment. The purpose of UbiSMART isto detect the Activities of Daily Living (ADL), and to provide rich services in theright context through appropriate channels. The framework is composed of three
Gateway Server Service ProvisionSensors
Figure 4.3: Simplified view of UbiSMART AAL platform with sleep mat
and its processing unit as a sensor.
main parts (Figure 4.3), in data flow order: 1) Gateway, “smart home in a box” –sensors (motion sensors, contact sensors and the newly integrated bed sensor forsleep monitoring) and a gateway (Raspberry Pi); 2) Server – receives formattedinputs from the gateway, and processes them using semantic reasoning following theapproach presented by Aloulou and Bellmunt et al. [Aloulou 2012, Bellmunt 2016];3) Service Provisioning – responsive user interfaces on the web or on hand-helddevices that allow users to receive notifications or interact with the platform.
4.2.5 System Integration
The sleep mat equipment is considered as another sensor that contributes to theknowledge base of the AAL platform. We explain its integration into the existingsystem following the data flow from the source to the presentation.
4.2.5.1 Collection
The bed sensor-processing unit is wired to our Gateway (Raspberry Pi). Voluminousraw data is read and stored on a micro SD-card for a deeper off-line analysis.Simultaneously, the data is preprocessed to generate high level events, such as bed
empty, bed motion, sleep. Currently, it operates on a time window of 10 seconds. Foreach time window, an event is produced. The events are then sent to the Server
as a structured sensor data using Message Queuing Telemetry Transport (MQTT)protocol over an Internet connection [Bellmunt 2016].
4.2.5.2 Reasoning
Server handles the received structured information (event). The bed sensor willappear in the home description interface as available for association to a house. Ifconfirmed, this association is stored in the knowledge base (KB). Any subsequentevents are then inserted into the KB of the associated house, allowing to the reasoningengine to be aware of bed occupancy with respect to our ontology. Coupled with
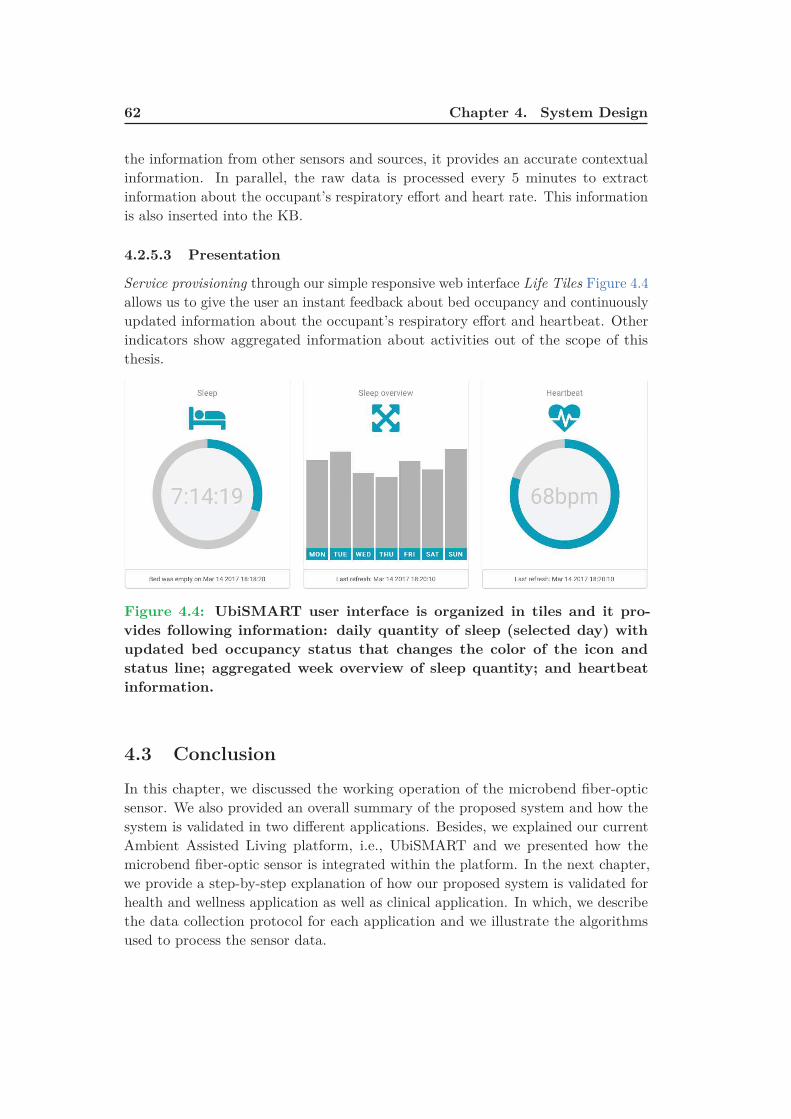
62 Chapter 4. System Design
the information from other sensors and sources, it provides an accurate contextualinformation. In parallel, the raw data is processed every 5 minutes to extractinformation about the occupant’s respiratory effort and heart rate. This informationis also inserted into the KB.
4.2.5.3 Presentation
Service provisioning through our simple responsive web interface Life Tiles Figure 4.4allows us to give the user an instant feedback about bed occupancy and continuouslyupdated information about the occupant’s respiratory effort and heartbeat. Otherindicators show aggregated information about activities out of the scope of thisthesis.
Figure 4.4: UbiSMART user interface is organized in tiles and it pro-
vides following information: daily quantity of sleep (selected day) with
updated bed occupancy status that changes the color of the icon and
status line; aggregated week overview of sleep quantity; and heartbeat
information.
4.3 Conclusion
In this chapter, we discussed the working operation of the microbend fiber-opticsensor. We also provided an overall summary of the proposed system and how thesystem is validated in two different applications. Besides, we explained our currentAmbient Assisted Living platform, i.e., UbiSMART and we presented how themicrobend fiber-optic sensor is integrated within the platform. In the next chapter,we provide a step-by-step explanation of how our proposed system is validated forhealth and wellness application as well as clinical application. In which, we describethe data collection protocol for each application and we illustrate the algorithmsused to process the sensor data.

Chapter 5
Methodology
Contents
5.1 Introduction . . . . . . . . . . . . . . . . . . . . . . . . . . . . 63
5.2 Health and Wellness Application . . . . . . . . . . . . . . . . 64
5.2.1 Quality Processing of Fiber Optic Sensor Data . . . . . . . . 65
5.2.2 Application Specific Signal Data Quality . . . . . . . . . . . . 66
5.2.3 Data Processing . . . . . . . . . . . . . . . . . . . . . . . . . . 67
5.3 Clinical Application . . . . . . . . . . . . . . . . . . . . . . . . 82
5.3.1 Experimental Setup and Data Collection . . . . . . . . . . . . 86
5.3.2 Data Processing . . . . . . . . . . . . . . . . . . . . . . . . . 88
5.4 Real-life Deployment . . . . . . . . . . . . . . . . . . . . . . . 92
5.4.1 Data Collection . . . . . . . . . . . . . . . . . . . . . . . . . . 93
5.4.2 Data Processing . . . . . . . . . . . . . . . . . . . . . . . . . . 94
5.5 Conclusion . . . . . . . . . . . . . . . . . . . . . . . . . . . . . 95
5.1 Introduction
Our aim in this chapter is to provide a detailed description of the methods usedto process the data collected from the microbend fiber-optic sensor. To startwith, we show how we validated the system using data acquired from a massagechair, in which several classifiers were adopted to label the data into informativeand non-informative classes based on their heart rate information, and then wemeasured the heart rate using Complete Ensemble Empirical Mode Decompositionwith Adaptive Noise algorithm (Section 5.2). Second, we illustrate the signalquality algorithm (Section 5.2.3.4), which substitutes the manual labeling process.Furthermore, we explain the multiresolution analysis of the Maximal Overlap DiscreteWavelet Transform as an alternative to the empirical mode decomposition algorithm(Section 5.2.3.5). Even more, we introduce the fast Fourier transform, cepstrum,and autocorrelation function for the sake of comparison with the wavelet approach(Sections 5.2.3.6 and 5.2.3.7). Third, we discuss how we validated the system in aclinical environment for unobtrusive monitoring of vital signs and sleep apnea eventsas well (Section 5.3). After all, we describe our real-life deployment, where threesenior female residents were involved in our study and the sleep data was collectedover a one-month period in a home-living situation (Section 5.4).

64 Chapter 5. Methodology
5.2 Health and Wellness Application
In several application domains, sensor networks provide enormous potential forinformation collection and processing [Kapadia 2009]. In this study, we focusedon a new kind of sensing technology known as Opportunistic Ambient Sensing1
(OAS). OAS can be used to provide applications and services that fit into theactive and healthy lifestyle of end users and to unobtrusively extract reliable andmeaningful data about their physiological parameters [Acampora 2013]. Althoughmobile phone-based applications are perhaps the most convenient, they lack thesensitivity and the proximity needed for the measurement of important vital signssuch as heart rate (HR) and breathing rate (BR). Ambient sensors that are placed inthe environment away from physical contact with the user, such as cameras, infraredmotion sensors and other types of electromagnetic sensing devices, lack the proximityor physical contact needed for reliable detection of vital signs [Sadek 2016].
The microbend fiber-optic sensor (FOS), thanks to its high sensitivity to ballisticeffects of human vital signs, is a sensor that is suitable for opportunistic ambientsensing. This sensor is a suitable option for nonintrusive long-term monitoring ofvital signs for its high sensitivity to pressure changes caused by body movement,and simultaneously not required to be in close contact with the body. A cushionwith embedded sensors, for example, is able to unobtrusively, yet with ampleaccuracy, capture vital signs of the user for those durations where the user isdirectly in contact with the sensor and motion artifacts are limited. A majorchallenge is dealing with the quality of the FOS signals. There are two basicapproaches to monitoring quality in physiological data obtained from sensors, i.e.,signal oriented and aggregate oriented. The first [Schumm 2010] is an exact approach,attempting to detect and track statistical properties of signal morphologies or eventoccurrences (or non-occurrences), and reporting these in a real-time fashion. Thesecond [Wang 2002, Lee 2012] is a statistical approach aimed at obtaining aggregatestatistical features in the time or frequency domain, through appropriate featureextraction. Since the former approach can lead to processing delay, especially inreal-time situations, in our work we adopted the statistical approach for qualityprocessing.
The goal of this study was to design a quality processing system to identify signalsof interest from noisy and nonstationary BCG signals. The quality process reducedthe computational and/or communications load significantly because only usefuldata was transmitted and processed for vital sign extraction. Thereafter, interbeatintervals were estimated using Complete Ensemble Empirical Mode Decompositionwith Adaptive Noise (CEEMDAN) algorithm. The following sections are summarizedas follows. Section 5.2.1 presents the generic algorithm for quality processing.Section 5.2.2 presents a definition of data quality relevant to the needs of theapplication at hand. Section 5.2.3 presents the data collection protocol, a labelingtool used to label datasets manually, and the proposed approach.
1“Opportunistic sensing is seen as a way to gather information about the physical world in the
absence of a stable and permanent networking infrastructure” [Scholten 2011].
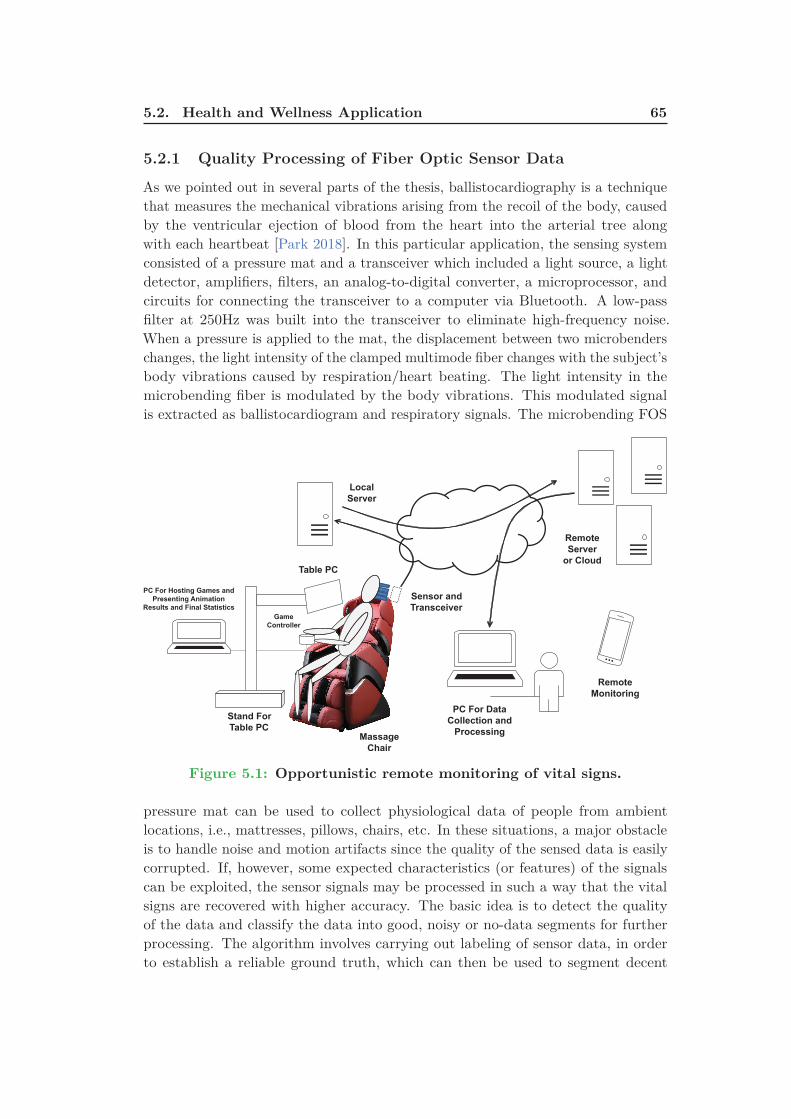
5.2. Health and Wellness Application 65
5.2.1 Quality Processing of Fiber Optic Sensor Data
As we pointed out in several parts of the thesis, ballistocardiography is a techniquethat measures the mechanical vibrations arising from the recoil of the body, causedby the ventricular ejection of blood from the heart into the arterial tree alongwith each heartbeat [Park 2018]. In this particular application, the sensing systemconsisted of a pressure mat and a transceiver which included a light source, a lightdetector, amplifiers, filters, an analog-to-digital converter, a microprocessor, andcircuits for connecting the transceiver to a computer via Bluetooth. A low-passfilter at 250Hz was built into the transceiver to eliminate high-frequency noise.When a pressure is applied to the mat, the displacement between two microbenderschanges, the light intensity of the clamped multimode fiber changes with the subject’sbody vibrations caused by respiration/heart beating. The light intensity in themicrobending fiber is modulated by the body vibrations. This modulated signalis extracted as ballistocardiogram and respiratory signals. The microbending FOS
Table PC
Stand For
Table PC
Game
Controller
PC For Hosting Games and
Presenting Animation
Results and Final Statistics
Local
Server
Remote
Server
or Cloud
Remote
Monitoring
Sensor and
Transceiver
PC For Data
Collection and
ProcessingMassage
Chair
Figure 5.1: Opportunistic remote monitoring of vital signs.
pressure mat can be used to collect physiological data of people from ambientlocations, i.e., mattresses, pillows, chairs, etc. In these situations, a major obstacleis to handle noise and motion artifacts since the quality of the sensed data is easilycorrupted. If, however, some expected characteristics (or features) of the signalscan be exploited, the sensor signals may be processed in such a way that the vitalsigns are recovered with higher accuracy. The basic idea is to detect the qualityof the data and classify the data into good, noisy or no-data segments for furtherprocessing. The algorithm involves carrying out labeling of sensor data, in orderto establish a reliable ground truth, which can then be used to segment decent

66 Chapter 5. Methodology
quality signals from real-time sensor data streams. This is a step towards improvingthe reliability of sensors used to monitor vital signs in diverse ambient settings.Figure 5.1 illustrates the manner in which the FOS pressure mat was deployed inwellness applications for the opportunistic monitoring of vital signs. The local serverwas optional and might be replaced with a direct connection to the remote server orcloud, with the appropriate 3G transceiver.
5.2.2 Application Specific Signal Data Quality
Sensor signal quality and data quality are important measures for medical devicesand health monitoring. In morphological analysis, a missed detection is characterizedby the absence of a particular waveform. The missing or erroneous waveform iscorrected and the feature (e.g., heartbeat) is then detected from the augmentedwaveform. In statistical analysis, the individual waveforms are not analyzed, butthe signal is processed, and feature detected (e.g., through peak detection) andthereafter the output statistic (e.g., HR) computed.
The statistical approach at data quality requires manual labeling of the renderingof the signal on a viewer with the help of a suitable tool. The waveforms are classified,sometimes with the help of logged information that supply details that may be usefulfor more accurate labeling. Since the fiber-optic sensor can be used in various settingsfor various applications, the statistical approach towards the study of quality is moremeaningful, as it may be used with parametric or algorithmic changes and appliedto various applications and indeed to various sensors as well. In this application, weconsidered the following definitions of quality:
Selected Window
GoodNoisy
Good
Correspnding Signal
Figure 5.2: Screen capture of the labeling tool.
• Informative signal: It included a good quality signal and a noisy signal.
5.2. Health and Wellness Application 67
The former signal was a data stream from which features might be extractedby standard algorithms, without any further filtering or processing to removenoise or any conflicting artifacts. The latter signal was a data stream thatcontained the observed signal mixed with other artifacts and noise, such thatmore processing was needed before algorithms might be used to extract thevital signs.
• Non-informative signal: It was a data stream where retrieval of physiologi-cal properties was impossible.
Because noise was introduced through activities of various kinds, in the experimentalstage we incorporated mechanisms to embed information into the data that indicatethe occurrence of events. These labels gave major cues, which served as a foothold inthe data, in order to analyze it further for quality processing. Note that even thoughour data was collected in the lab, it was unreasonable and impossible to label eachevent. This was the reason why we were required to undertake post-processing ofthe data through a manual labeling effort. From Figure 5.2, it can be seen that thereare certain periods when good data was expected (such as the rest periods), andcertain other periods where the data was expected to be noisy (such as the massageperiod when the massage chair is in motion). There are also periods when dueto non-contact there is no signal presented. This happens, for example, when thesubject is answering the questionnaire or undergoing some mental tasks involvingthe use of the computer. Once the subject leans forward the contact between thepillow sensor and the subject’s head is lost, and thus there is no signal.
5.2.3 Data Processing
5.2.3.1 Data Collection
The data was collected in a realistic setting from 50 human subjects sitting in amassage chair to assess their levels of stress at different moments. The data wascollected in a sitting position to explore the capability of the optical-fiber matfor heart rate measurement from different positions of the body (e.g., below thehead). This particular position was interesting as the optical-fiber mat could havebeen located in a pillow rather than below the bed mattress. Consent forms weresought from every human subject following the approval of the institutional reviewboard. Participants completed stress-inducing exercises, proceeded by rest and relieftherapy. During the process, subjects were instructed to complete well-suited surveyquestionnaires for gathering self-reported ground truth. Meanwhile, physiologicalparameters of subjects were recorded in real-time using a range of sensors. Thisincluded ballistocardiography, electroencephalography, galvanic skin response, andsome other sensors to measure electrocardiography and respiratory efforts.
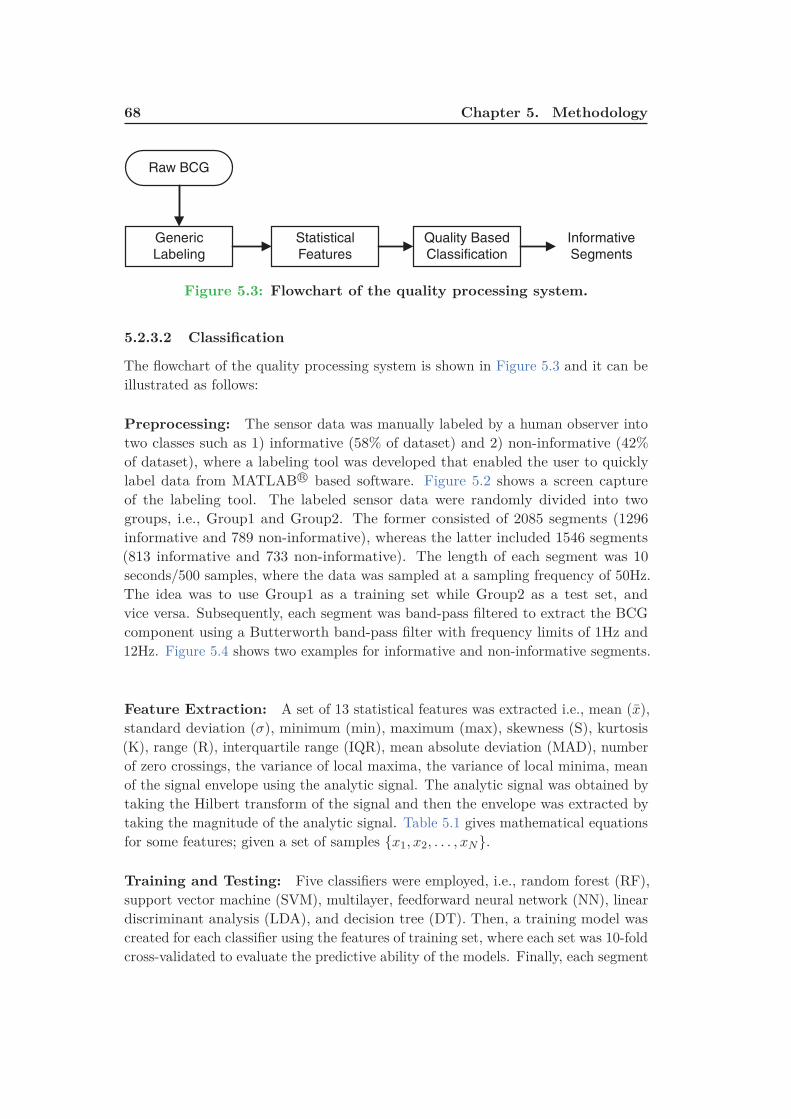
68 Chapter 5. Methodology
Generic
Labeling
Statistical
Features
Quality Based
Classification
Informative
Segments
Raw BCG
Figure 5.3: Flowchart of the quality processing system.
5.2.3.2 Classification
The flowchart of the quality processing system is shown in Figure 5.3 and it can beillustrated as follows:
Preprocessing: The sensor data was manually labeled by a human observer intotwo classes such as 1) informative (58% of dataset) and 2) non-informative (42%of dataset), where a labeling tool was developed that enabled the user to quicklylabel data from MATLAB R© based software. Figure 5.2 shows a screen captureof the labeling tool. The labeled sensor data were randomly divided into twogroups, i.e., Group1 and Group2. The former consisted of 2085 segments (1296informative and 789 non-informative), whereas the latter included 1546 segments(813 informative and 733 non-informative). The length of each segment was 10seconds/500 samples, where the data was sampled at a sampling frequency of 50Hz.The idea was to use Group1 as a training set while Group2 as a test set, andvice versa. Subsequently, each segment was band-pass filtered to extract the BCGcomponent using a Butterworth band-pass filter with frequency limits of 1Hz and12Hz. Figure 5.4 shows two examples for informative and non-informative segments.
Feature Extraction: A set of 13 statistical features was extracted i.e., mean (x),standard deviation (σ), minimum (min), maximum (max), skewness (S), kurtosis(K), range (R), interquartile range (IQR), mean absolute deviation (MAD), numberof zero crossings, the variance of local maxima, the variance of local minima, meanof the signal envelope using the analytic signal. The analytic signal was obtained bytaking the Hilbert transform of the signal and then the envelope was extracted bytaking the magnitude of the analytic signal. Table 5.1 gives mathematical equationsfor some features; given a set of samples {x1, x2, . . . , xN }.
Training and Testing: Five classifiers were employed, i.e., random forest (RF),support vector machine (SVM), multilayer, feedforward neural network (NN), lineardiscriminant analysis (LDA), and decision tree (DT). Then, a training model wascreated for each classifier using the features of training set, where each set was 10-foldcross-validated to evaluate the predictive ability of the models. Finally, each segment
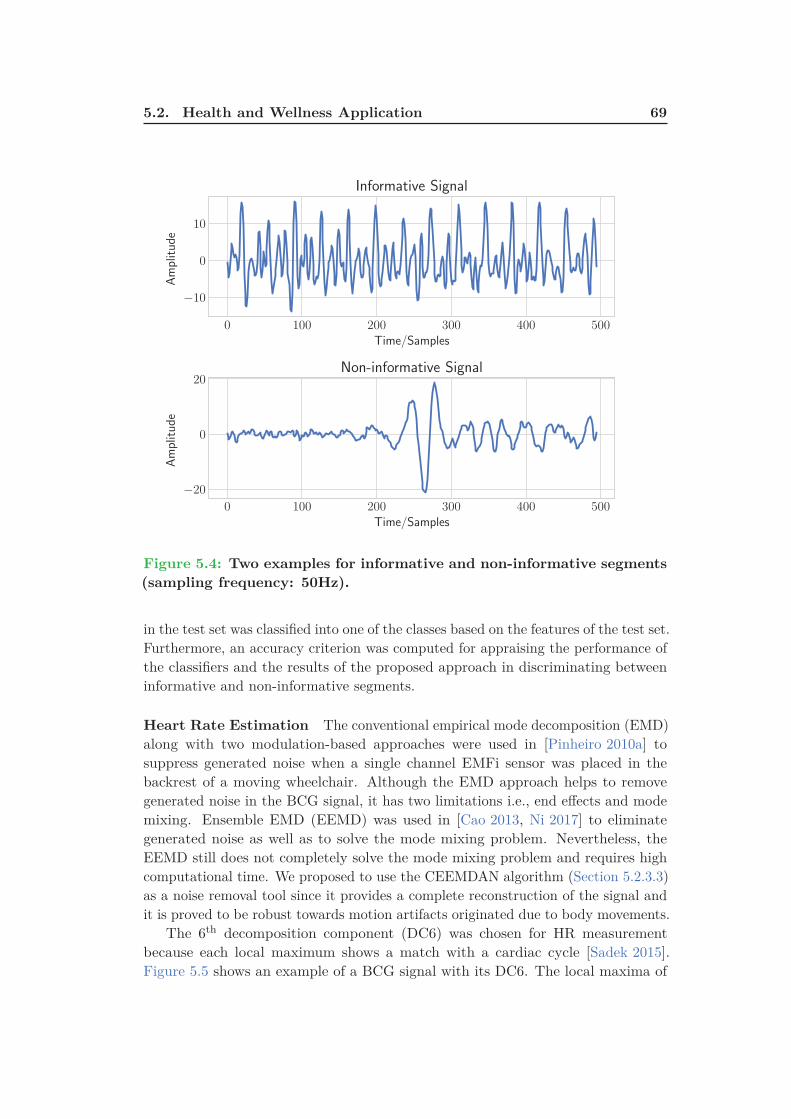
5.2. Health and Wellness Application 69
0 100 200 300 400 500
Time/Samples
−10
0
10
Amplitude
Informative Signal
0 100 200 300 400 500
Time/Samples
−20
0
20
Amplitude
Non-informative Signal
Figure 5.4: Two examples for informative and non-informative segments
(sampling frequency: 50Hz).
in the test set was classified into one of the classes based on the features of the test set.Furthermore, an accuracy criterion was computed for appraising the performance ofthe classifiers and the results of the proposed approach in discriminating betweeninformative and non-informative segments.
Heart Rate Estimation The conventional empirical mode decomposition (EMD)along with two modulation-based approaches were used in [Pinheiro 2010a] tosuppress generated noise when a single channel EMFi sensor was placed in thebackrest of a moving wheelchair. Although the EMD approach helps to removegenerated noise in the BCG signal, it has two limitations i.e., end effects and modemixing. Ensemble EMD (EEMD) was used in [Cao 2013, Ni 2017] to eliminategenerated noise as well as to solve the mode mixing problem. Nevertheless, theEEMD still does not completely solve the mode mixing problem and requires highcomputational time. We proposed to use the CEEMDAN algorithm (Section 5.2.3.3)as a noise removal tool since it provides a complete reconstruction of the signal andit is proved to be robust towards motion artifacts originated due to body movements.
The 6th decomposition component (DC6) was chosen for HR measurementbecause each local maximum shows a match with a cardiac cycle [Sadek 2015].Figure 5.5 shows an example of a BCG signal with its DC6. The local maxima of

70 Chapter 5. Methodology
Table 5.1: Features’ mathematical equations.
Feature Equation Notes
Mean x =1
n − 1
∑n
i=1xi
Variance σ2 =1
n − 1
∑n
i=1(xi − x)2 It is a measure used to quantify the amount
of variation of a set of data values.
Standard Deviation σ =
√1
n − 1
∑n
i=1(xi − x)2 It measures how far a set of numbers are
spread out from their average value.
Skewness S =
1
n
∑n
i=1(xi − x)3
(√1
n
∑n
i=1(xi − x)2
)3
It is a measure of the asymmetry of the data
around the sample mean.
• Zero → symmetric distribution
• Negative → spread out more to
the left of the mean.
• Positive → spread out more to
the right of the mean.
Kurtosis K =
1
n
∑n
i=1(xi − x)4
(1
n
∑n
i=1(xi − x)2
)2
It is a measure of how outlier-prone
a distribution is.
• Three → symmetric distribution
• > Three → more outlier-prone than
the normal distribution.
• < Three → less outlier-prone than
the normal distribution.
Range R = max − minIt is the difference between
the highest and lowest values.
Interquartile Range IQR = Q3 − Q1
It indicates how the central 50% of values
within the dataset are diffused.
• Q1 → median of the n smallest entries.
• Q3 → median of the n largest entries.
Mean Absolute
DeviationMAD = 1
n
∑n
i=1|(xi − x)|
It is the average distance between each
data value and the mean.
the DC6 were used for HR measurement, where the HR value at the time tn, atwhich the nth maximum occurred, was defined as follows:
HRn =60
tn − tn−1(5.1)
where tn is the time at nth local maxima and tn−1 is the time at (n − 1)th localmaxima in the DC6. In which, the HR was expressed as beats per minute (BPM).
5.2.3.3 Complete Ensemble EMD with Adaptive Noise
The Empirical Mode Decomposition (EMD) [Huang 1998] is an adaptive method,which can be used to break down a nonlinear and a nonstationary signal as acombination of amplitude and frequency modulated functions named intrinsic modefunctions (IMFs) without leaving the time domain. IMF should fulfill two conditions:
• In the entire dataset, the number of extrema and the number of zero crossingsmust be equal or vary at most by one.
• At any time instant, the mean value of the upper and lower envelope is zero,i.e., the signal has zero mean.

5.2. Health and Wellness Application 71
0 100 200 300 400 500
Time/Samples
−0.1
0.0
0.1
0.2
Amplitude
ECG Signal
R-Peaks
0 100 200 300 400 500
Time/Samples
−0.1
0.0
0.1
Amplitude
BCG Signal
J-Peaks
DC6
Figure 5.5: BCG signal with a reference ECG signal. ECG is shown in
1st row. However, BCG signal and its 6th decomposition component are
shown in 2nd row (sampling frequency: 50Hz).
Even though EMD proved to be applicable in several areas of research, such asbiomedical signal processing, it encounters some limitations as follows. First, endeffects that destroy the IMFs at its endpoints. Second, mode mixing, which causesvery similar oscillations to exist in different modes or oscillation of very dissimilaramplitudes to exist in a mode [Huang 2016]. In order to solve these problems, anew approach is introduced: Ensemble Empirical Mode Decomposition (EEMD)[Wu 2009a], the basic idea of the EEMD is to carry out the EMD over an ensembleof the signal besides white Gaussian noise (WGN). Adding WGN overcomes themode mixing problem by processing the entire time-frequency space to make useof the dyadic filter bank behavior of the EMD. Nonetheless, a different number ofmodes may be generated. Apart from that, the CEEMDAN can provide a precisereconstruction of the original signal in addition to reducing the computationalcomplexity [Torres 2011]. It further solves the boundary problems by mirrorizingextrema close to the edges [Rilling 2003]. Given a target signal x, assume w(l) isa WGN of zero mean and unit variance i.e., with N(0, 1), ε is the noise standarddeviation, and Ek(.) is an operator responsible for getting the kth mode of a givensignal by EMD. The algorithm for obtaining a kth mode by EMD can be explainedas follows [Huang 1998, Colominas 2014]:
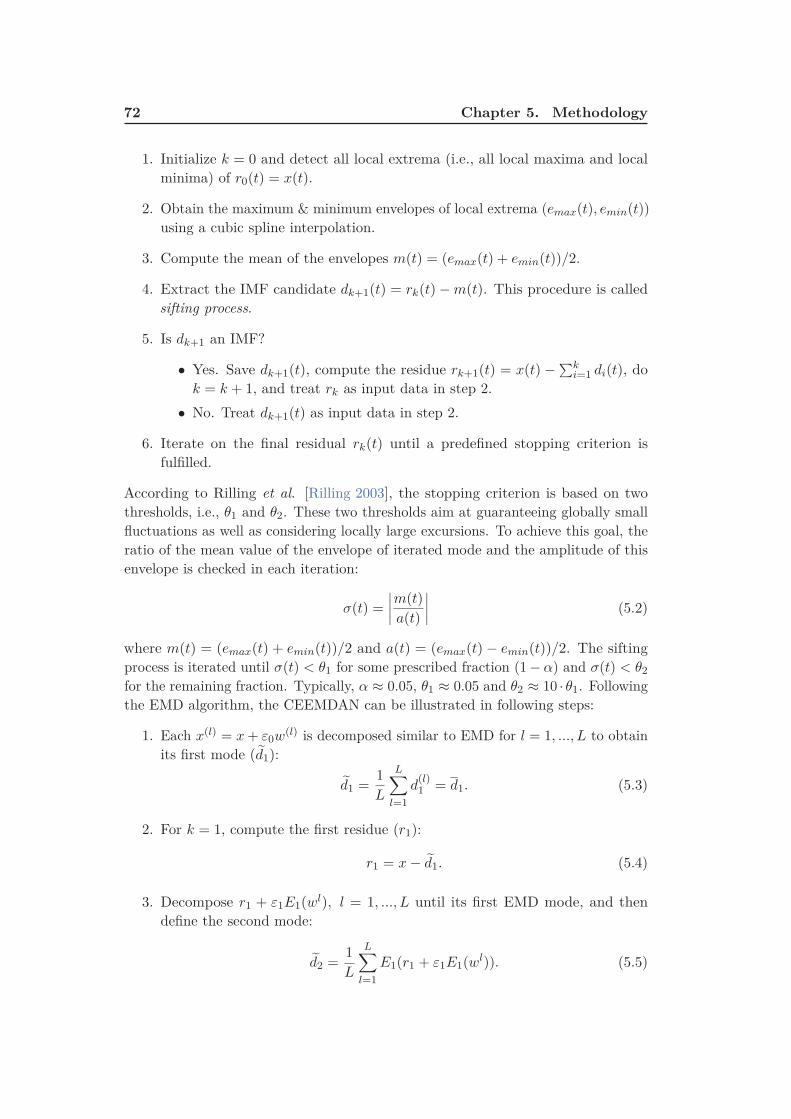
72 Chapter 5. Methodology
1. Initialize k = 0 and detect all local extrema (i.e., all local maxima and localminima) of r0(t) = x(t).
2. Obtain the maximum & minimum envelopes of local extrema (emax(t), emin(t))using a cubic spline interpolation.
3. Compute the mean of the envelopes m(t) = (emax(t) + emin(t))/2.
4. Extract the IMF candidate dk+1(t) = rk(t) − m(t). This procedure is calledsifting process.
5. Is dk+1 an IMF?
• Yes. Save dk+1(t), compute the residue rk+1(t) = x(t) − ∑ki=1 di(t), do
k = k + 1, and treat rk as input data in step 2.
• No. Treat dk+1(t) as input data in step 2.
6. Iterate on the final residual rk(t) until a predefined stopping criterion isfulfilled.
According to Rilling et al. [Rilling 2003], the stopping criterion is based on twothresholds, i.e., θ1 and θ2. These two thresholds aim at guaranteeing globally smallfluctuations as well as considering locally large excursions. To achieve this goal, theratio of the mean value of the envelope of iterated mode and the amplitude of thisenvelope is checked in each iteration:
σ(t) =
∣∣∣∣m(t)
a(t)
∣∣∣∣ (5.2)
where m(t) = (emax(t) + emin(t))/2 and a(t) = (emax(t) − emin(t))/2. The siftingprocess is iterated until σ(t) < θ1 for some prescribed fraction (1 − α) and σ(t) < θ2
for the remaining fraction. Typically, α ≈ 0.05, θ1 ≈ 0.05 and θ2 ≈ 10 · θ1. Followingthe EMD algorithm, the CEEMDAN can be illustrated in following steps:
1. Each x(l) = x + ε0w(l) is decomposed similar to EMD for l = 1, ..., L to obtainits first mode (d1):
d1 =1
L
L∑
l=1
d(l)1 = d1. (5.3)
2. For k = 1, compute the first residue (r1):
r1 = x − d1. (5.4)
3. Decompose r1 + ε1E1(wl), l = 1, ..., L until its first EMD mode, and thendefine the second mode:
d2 =1
L
L∑
l=1
E1(r1 + ε1E1(wl)). (5.5)
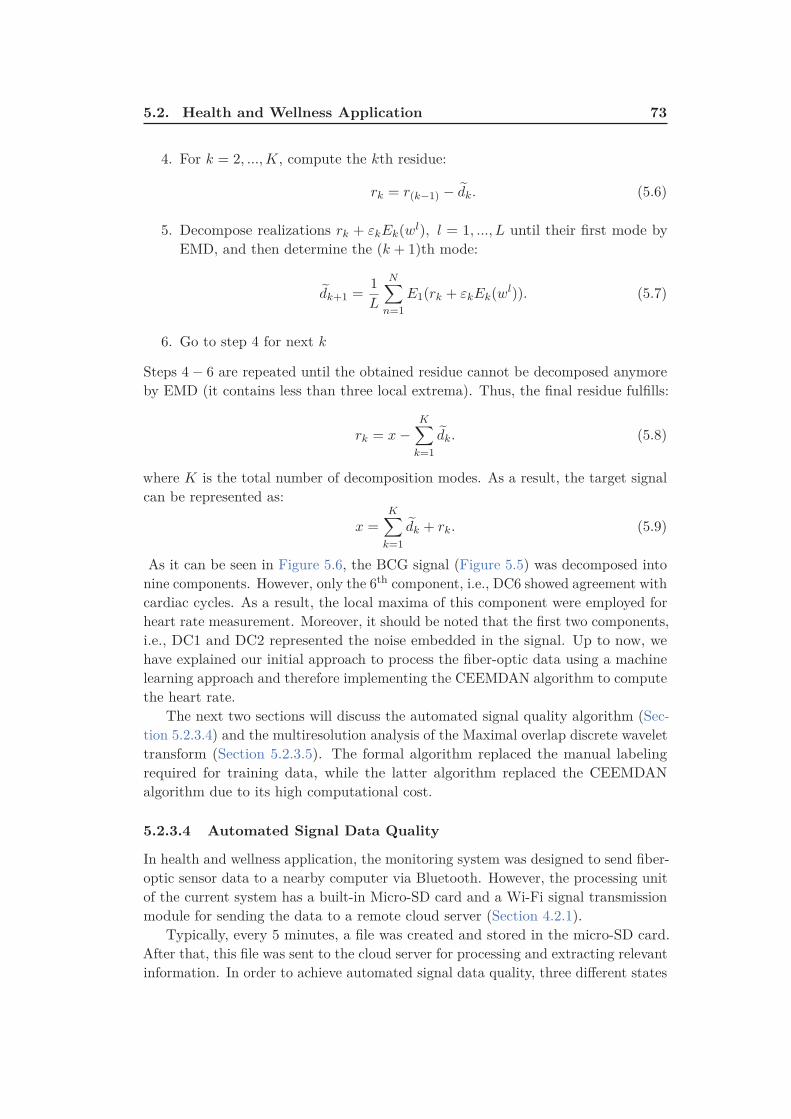
5.2. Health and Wellness Application 73
4. For k = 2, ..., K, compute the kth residue:
rk = r(k−1) − dk. (5.6)
5. Decompose realizations rk + εkEk(wl), l = 1, ..., L until their first mode byEMD, and then determine the (k + 1)th mode:
dk+1 =1
L
N∑
n=1
E1(rk + εkEk(wl)). (5.7)
6. Go to step 4 for next k
Steps 4 − 6 are repeated until the obtained residue cannot be decomposed anymoreby EMD (it contains less than three local extrema). Thus, the final residue fulfills:
rk = x −K∑
k=1
dk. (5.8)
where K is the total number of decomposition modes. As a result, the target signalcan be represented as:
x =K∑
k=1
dk + rk. (5.9)
As it can be seen in Figure 5.6, the BCG signal (Figure 5.5) was decomposed intonine components. However, only the 6th component, i.e., DC6 showed agreement withcardiac cycles. As a result, the local maxima of this component were employed forheart rate measurement. Moreover, it should be noted that the first two components,i.e., DC1 and DC2 represented the noise embedded in the signal. Up to now, wehave explained our initial approach to process the fiber-optic data using a machinelearning approach and therefore implementing the CEEMDAN algorithm to computethe heart rate.
The next two sections will discuss the automated signal quality algorithm (Sec-tion 5.2.3.4) and the multiresolution analysis of the Maximal overlap discrete wavelettransform (Section 5.2.3.5). The formal algorithm replaced the manual labelingrequired for training data, while the latter algorithm replaced the CEEMDANalgorithm due to its high computational cost.
5.2.3.4 Automated Signal Data Quality
In health and wellness application, the monitoring system was designed to send fiber-optic sensor data to a nearby computer via Bluetooth. However, the processing unitof the current system has a built-in Micro-SD card and a Wi-Fi signal transmissionmodule for sending the data to a remote cloud server (Section 4.2.1).
Typically, every 5 minutes, a file was created and stored in the micro-SD card.After that, this file was sent to the cloud server for processing and extracting relevantinformation. In order to achieve automated signal data quality, three different states

74 Chapter 5. Methodology
0 100 200 300 400 500
0.0
0.2
DC1
0 100 200 300 400 500
0.00
0.25
DC2
0 100 200 300 400 500
−0.1
0.0
0.1
DC3
0 100 200 300 400 500−0.1
0.0
0.1
DC4
0 100 200 300 400 500
−0.1
0.0
0.1
DC5
0 100 200 300 400 500
−0.1
0.0
0.1
DC6
0 100 200 300 400 500
−0.1
0.0
0.1
DC7
0 100 200 300 400 500
−0.1
0.0
0.1
DC8
0 100 200 300 400 500
−0.05
0.00
0.05
DC9
0 100 200 300 400 500
−0.1
0.0
Residual
Figure 5.6: Intrinsic mode functions (DC1-DC9) of a typical BCG sig-
nal (Figure 5.5); the 6th component shows a match with cardiac cycles
(sampling frequency: 50Hz).
were recognized for each 5-minutes recording using a sliding time-window (wi) witha size of 500 samples (10 seconds) as follows. First, if the standard deviation (SD)of the time-window was greater than twice the mean absolute deviation (MAD) ofall time-windows SD, the state was considered as a body movement (Figure 5.9).Second, if the SD of the time-window was lower than a fixed threshold of 15 mV, thestate was regarded as no activity (unoccupied mat sensor) (Figure 5.10). Finally, inother cases, the state was identified as asleep (Figure 5.8), where apneas and vitalscould be measured. This process was repeated for all the data-files on the MicroSD-Card, and the sleep data were then concatenated together to form a continuoustime series, i.e., excluding body movements and unoccupied bed events. Algorithm 1illustrates the sleep data processing of a resident’s bed state.
Figure 5.7 gives an example of a signal data quality processing for a 20-minutefiber-optic data recording. The data was collected from a healthy young male subjectand the optical fiber mat was placed underneath the mattress covering the upperhalf of the subject. In this example, folly color defines segments of body movements,aqua color defines segments of sleep and blond color defines segments of bed-exits.The two folly colored regions indicate the time when the subject entered and exitedthe bed. On the other hand, Figures 5.8 to 5.10 show one example for each bedstate, i.e., sleep, body movement, and bed-exit.

5.2. Health and Wellness Application 75
Algorithm 1 Sleep Data Processing
Input:
1: W ← {w1, w2, . . . , wN }2: Tr ← 15
Output:
3: state4: for i = 1, . . . , N do
5: S(i) ← SD(wi)
6: end for
7: M ← MAD(S)
8: for j = 1, . . . , N do
9: if SD(wj) > 2 ∗ M then
10: state ← bed movement11: else if SD(wj) < Tr then
12: state ← bed empty13: else
14: state ← sleep15: end if
16: end for
5.2.3.5 Maximal Overlap Discrete Wavelet Transform
In healthy subjects, ECG signal, which is considered as a reference to measureinterbeat intervals has a uniform and repeated template known as PQRST complex,i.e., the pattern of electrical activity of the heart during one cardiac cycle (Figure 3.2).Thus, this property facilitates the measurement of the subject’s heart rate. UnlikeECG signals, the BCG morphology varies between and within subjects, and theshape of the signal is highly dependent on the subject’s positions, i.e., sleepingor sitting. In addition, the raw signal is noisy and nonstationary owing to bodymovement, induced respiratory efforts, and the characteristics of the sensing systemitself, therefore, estimating interbeat intervals from BCG signals is a troublesomeprocedure.
In [Jin 2009] a translation-invariant adaptive discrete wavelet transform (DWT)was proposed to denoise BCG signals. Then, the heart rate was computed using apseudo-period detection approach. In [Noh 2010] DWT was implemented to cancelrelated BCG artifacts and a template matching for interbeat intervals detection.The BCG data were collected from five healthy subjects in a sitting position usingan electromechanical film sensor. In [Gilaberte 2010] continuous wavelet transform(CWT) was introduced for HR and respiratory rate measurements. Where, in eachcase, the scale which presented an agreement with the periodicity of the signalwas selected. The proposed approach was applied to six healthy subjects standingon a bathroom scale equipped with multiple strain gauges. A similar approachwas proposed in [Alvarado-Serrano 2016], where authors used CWT with splines
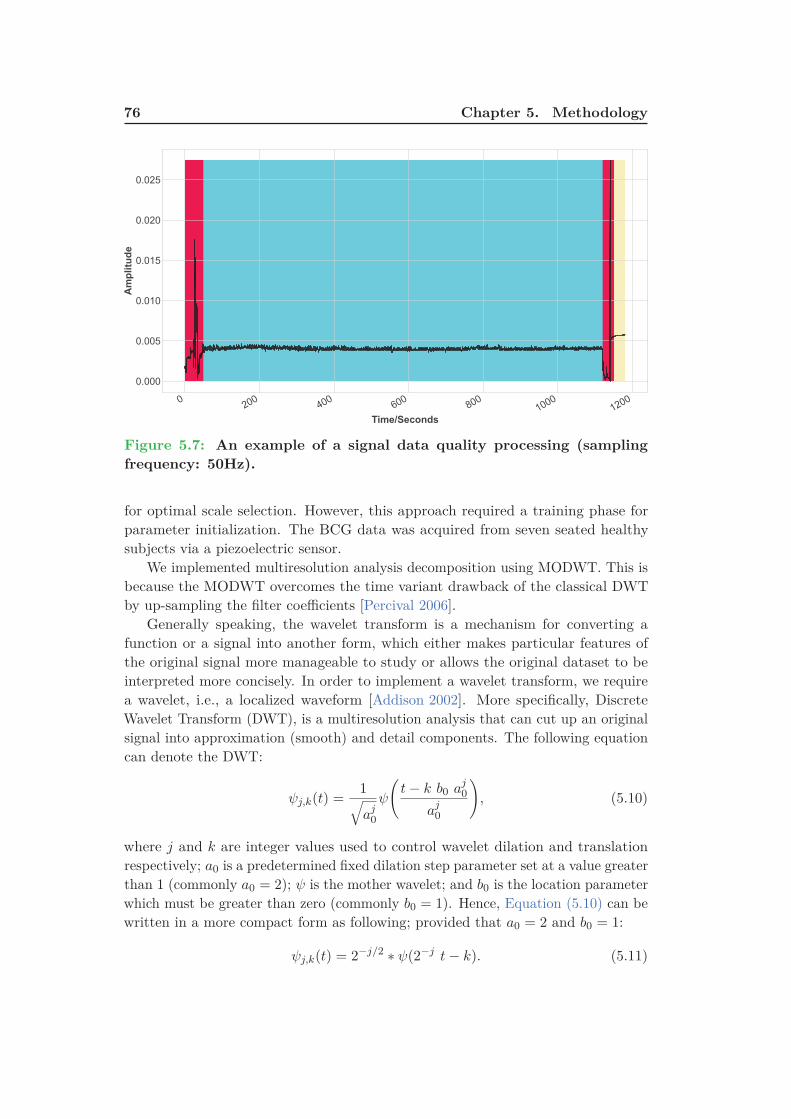
76 Chapter 5. Methodology
0200
400
600
800
1000
1200
Time/Seconds
0.000
0.005
0.010
0.015
0.020
0.025
Amplitude
Figure 5.7: An example of a signal data quality processing (sampling
frequency: 50Hz).
for optimal scale selection. However, this approach required a training phase forparameter initialization. The BCG data was acquired from seven seated healthysubjects via a piezoelectric sensor.
We implemented multiresolution analysis decomposition using MODWT. This isbecause the MODWT overcomes the time variant drawback of the classical DWTby up-sampling the filter coefficients [Percival 2006].
Generally speaking, the wavelet transform is a mechanism for converting afunction or a signal into another form, which either makes particular features ofthe original signal more manageable to study or allows the original dataset to beinterpreted more concisely. In order to implement a wavelet transform, we requirea wavelet, i.e., a localized waveform [Addison 2002]. More specifically, DiscreteWavelet Transform (DWT), is a multiresolution analysis that can cut up an originalsignal into approximation (smooth) and detail components. The following equationcan denote the DWT:
ψj,k(t) =1√aj
0
ψ
(t − k b0 aj
0
aj0
), (5.10)
where j and k are integer values used to control wavelet dilation and translationrespectively; a0 is a predetermined fixed dilation step parameter set at a value greaterthan 1 (commonly a0 = 2); ψ is the mother wavelet; and b0 is the location parameterwhich must be greater than zero (commonly b0 = 1). Hence, Equation (5.10) can bewritten in a more compact form as following; provided that a0 = 2 and b0 = 1:
ψj,k(t) = 2−j/2 ∗ ψ(2−j t − k). (5.11)

5.2. Health and Wellness Application 77
300 310 320 330 340 350 360
Time/Seconds
0.0036
0.0037
0.0038
0.0039
0.0040
0.0041
0.0042
0.0043
0.0044
Amplitude
Figure 5.8: An example of a 60-second sleep signal (sampling frequency:
50Hz).
For a discrete signal X = {Xt, t = 0, 1, . . . , N − 1}, the DWT computes the waveletcoefficient for the discrete wavelet of dilation 2j and translation 2jk using thefollowing equation:
WX(j, k) =N−1∑
t=0
Xt ψj,k(t), (5.12)
where WX(j, k) is the wavelet coefficient and N is an integer power of two (arestrictive property). In practice, Mallat’s algorithm [Mallat 1989] is used forimplementation of DWT. The idea of the algorithm is to apply low-pass and high-passfilters instead of wavelets, and hence decompose the signal into details componentsand an approximation component. It should be noted that the decomposition levelL should be determined in advance and it has to be less than or equal log2(N)
[Seo 2017]. Although DWT is a powerful tool for signal analysis, it has somelimits. These limits include shift sensitivity, poor directionality, and lack of phaseinformation [Fernandes 2003]. On the other hand, the Maximal Overlap DiscreteWavelet Transform (MODWT) introduced by Percival and Walden [Percival 2006]offers more advantages over the typical DWT, even though it does not provide anorthogonal decomposition. The properties that distinguish the MODWT from theDWT can be explained as follows:
• The MODWT is a translation-invariant process.
• The MODWT can manipulate any sample size n, which is not required to bedivisible by 2.
• The smooth and detail coefficients of the MODWT are affiliated with zero-phase

78 Chapter 5. Methodology
0 10 20 30 40 50 60
Time/Seconds
0.0000
0.0025
0.0050
0.0075
0.0100
0.0125
0.0150
0.0175
Amplitude
Figure 5.9: An example of a 60-second body movement signal (sampling
frequency: 50Hz).
filters, and therefore making it easy to line up features in a multiresolutionanalysis with the original time series in a meaningful way. In other words,extracted features will be time-aligned with the original time-series.
Given a discrete time signal X = {Xt, t = 0, 1, . . . , N − 1}, the jth level MODWTwavelet and scaling coefficients, i.e., Wk,t and Vk,t can be computed as indicated byEquation (5.13) and Equation (5.14), respectively.
Wj,t =N−1∑
l=0
h◦j,l
Xt−l mod N , (5.13)
Vj,t =N−1∑
l=0
g◦j,l
Xt−l mod N , (5.14)
where j = 1, 2, . . . , L; Wj,t is the tth element of the jth level MODWT waveletcoefficient; Vj,t is the tth element of the jth level MODWT scaling coefficient; h◦
j,l
and g◦j,l
are the jth level MODWT high- and lows-pass filters, i.e., wavelet and
scaling filters produced by periodizing (i.e., adding zeros) hj,l and gj,l to length N ,respectively; hj,l and gj,l are the jth level MODWT high-pass filter (hj,l = hj,l/2j/2)
and low-pass filter (gj,l = gj,l/2j/2); hj,l and gj,l are the jth level DWT high- andlow-pass filters; and L is the highest decomposition level.
On the other hand, the multiresolution analysis decomposes an original signal X
into a low-pass filtered approximation (smooth) component and high-pass filtereddetail components [Percival 2006]. Typically, the multiresolution analysis of theMODWT can be formulated as provided by Equations (5.15) to (5.17):

5.2. Health and Wellness Application 79
1170 1172 1174 1176 1178 1180 1182
Time/Seconds
0.00570
0.00571
0.00572
0.00573
0.00574
0.00575
Amplitude
Figure 5.10: An example of a 60-second bed-exit signal (sampling fre-
quency: 50Hz).
X =J0∑
j=1
Dj + SJ0, J0 ≥ 1 (5.15)
Dj,t =N−1∑
l=0
h◦j,l
Wj, t+l mod n, (5.16)
Sj,t =N−1∑
l=0
g◦j,l
Vj, t+l mod n, (5.17)
where Dj is the detail components and Sj,t is the smooth component. Figure 5.11gives an example of a three-level MODWT. After explaining automated signal dataquality algorithm and MODWT approach, the following steps can be used to measurethe heart rate (Figure 5.12).
1. BCG Signal Extraction: First, motion artifacts were excluded using Algo-rithm 1. Second, the BCG signal was retrieved by performing a Butterworthband-pass filter with frequency limits between 1Hz and 10Hz.
2. Decomposition: A sliding time-window of a length (10 seconds/500 samples)was used to measure the heart rate for BCG and ECG signals. Therefore,for each 10-second of the BCG signal, a multiresolution analysis based onMODWT was employed to decompose the signal into approximation and detailcoefficients.
3. Suitable Level Selection: The 4th level smooth coefficient was preferred forHR computation because the periodicity of the maxima showed an agreementwith the heartbeats as presented in Figure 5.13.

80 Chapter 5. Methodology
X
h1
g1
W1
V1
h2
g2
W2
V2
h3
g3
W3
V3
D1
D2
D3
S3
Level 1
Level 2
Level 3
Figure 5.11: Example for three-level MODWT; h{.} is a high-pass filter,
g{.} is a low-pass filter, W{.} is a wavelet coefficient, and V{.} is a scaling
coefficients.
BCG Extraction:
BM & RR Removal
Decomposition:
MRA - MODWTLevel Selection Heart Rate
Microbend FOS
Figure 5.12: The flowchart of the proposed heart rate estimation method;
BM: Body Movement, RR: Respiratory Rate, and MRA: Multiresolution
Analysis.
To this end, we have addressed how ballistocardiogram signals were acquired duringhealth and wellness application. Other than that, we have explained the proposedmethodology to analyze and interpret ballistocardiogram signals in order to measureinterbeat intervals. In the subsequent section (Section 5.3), we discuss our clinicalvalidation approach.
5.2.3.6 Cepstral Transform
The cepstrum is defined as the inverse discrete Fourier transform (DFT) of the log-magnitude of the DFT of a signal, i.e., spectrum [Oppenheim 2004]. The cepstrumc of a signal x can be denoted as follows:
c[n] = F−1{log |F{x[n]}|}, (5.18)
where F is the DFT and F−1 is the inverse DFT. Since ballistocardiogram signalis nonlinear and nonstationary, the DFT was implemented by applying a windowor a.k.a, “windowing”. The windowing process consists of multiplying a portionof a signal by a finite-length window with an amplitude that varies smoothly andgradually toward zero at the edges. By doing this, the effect of the leakage that occursduring an FFT of the signal is reduced. Leakage consists of spectral information

5.2. Health and Wellness Application 81
0 100 200 300 400 500
−5
0
5
10
15BCGSignal
0 100 200 300 400 500
−0.4
−0.2
0.0
0.2
0.4Level1Details
0 100 200 300 400 500
−0.10
−0.05
0.00
0.05
0.10
Level2Details
0 100 200 300 400 500
−0.10
−0.05
0.00
0.05
0.10
Level3Details
0 100 200 300 400 500
−0.10
−0.05
0.00
0.05
0.10
Level4Details
0 100 200 300 400 500
−0.10
−0.05
0.00
0.05
0.10
Level4Smooth
Figure 5.13: Symlet-8 MODWT multiresolution decomposition of a BCG
signal (sampling frequency: 50Hz).
from an FFT showing up at the wrong frequencies. For a windowed portion ofballistocardiogram signal y[n], the cepstrum is computed as follows:
c[n] =N−1∑
n=0
log
( ∣∣∣∣∣
N−1∑
n=0
x[n]e−j 2π
Nkn
∣∣∣∣∣
)ej 2π
Nkn, (5.19)
where n is the time index; k is the frequency index; and N is the number ofsamples (N must be of power two, e.g., 256, 512, 1024, . . .). For ballistocardiogramheartbeat signal, the spectrum consists of the peaks at the harmonic frequencies ofthe fundamental heartbeat frequency. This periodicity in the spectrum is presentedas a peak value in the spectrum located at the corresponding ballistocardiograminterbeat interval lag-time value [Kortelainen 2007, Kortelainen 2012, Brüser 2015].In our case, the lag-time range is from 0.4 second (= 2.5Hz) to 1.5 seconds (=0.67Hz), i.e., the normal human heartbeat duration [Zhu 2014]. Figure 5.14 showsthe cepstrum of a 30-second ballistocardiogram signal, in which the Fourier transformis computed by applying a Hanning window.
5.2.3.7 Autocorrelation
The autocorrelation function (ACF) measures the correlation between yt and yt+k,where k = 0, . . . , K. The formula for the autocorrelation for lag k is given by

82 Chapter 5. Methodology
0.4 0.6 0.8 1.0 1.2 1.4
Lag Time [s]
0.000
0.005
0.010
0.015
0.020
0.025
Cepstrum
c[n] = F−1{log |F{x[n]}|}
HBI = 1.02
Figure 5.14: The cepstrum of a 30-second ballistocardiogram signal; the
heart beat interval (HBI) is 1.02 seconds.
Equations (5.20) and (5.21):rk =
ck
c0, (5.20)
ck =1
T
T −k∑
t=1
(yt − y)(yt+k − y), (5.21)
where c0 is the sample variance of the time series, and T is the total number ofsamples in the window for the ACF calculation. As mentioned above, the lag-timerange is from 0.4 second (= 2.5Hz) to 1.5 seconds (= 0.67Hz). Figure 5.14 showsthe autocorrelation of a 30-second ballistocardiogram signal. The ACF is symmetricaround lag zero, thus the function is normally plotted one-sidedly for positive lag.
5.3 Clinical Application
In this application, we aimed at validating our system for nonintrusive monitoring ofvital signs (heart rate, respiratory rate, and body movements) during sleep as wellas monitoring of sleep apnea. As a beginning, sleep is one of the most importantelements every human needs similar to oxygen, water, and food. Nevertheless, most

5.3. Clinical Application 83
0 200 400 600 800 1000 1200 1400
Lag
−400000
−200000
0
200000
400000
600000
800000
1000000
Autocorrelation
rk =1
T
∑T−kt=1
(yt − y)(yt+k − y)/c0
HBI = 1.64
Figure 5.15: The autocorrelation of a 30-second ballistocardiogram sig-
nal; the heart beat interval (HBI) is 1.64 seconds.
people do not realize the importance of getting enough quality sleep. As stated bythe U.S. National Sleep Foundation (NSF), millions of people do not have sufficientsleep, and many may experience a lack of sleep.
To give an example, an individual might have the condition of sleep-disorderedbreathing (SDB). The SDB or a.k.a., obstructive sleep apnea syndrome (OSAS)is the most common sleep-related breathing disorders. The estimated prevalenceof moderate-to-severe OSAS is reported to be 6 to 17% in the general population,being as high as 49% in the elderly [Senaratna 2017]. The OSAS is described byrecurrent events, usually longer than 10 seconds of a complete (apnea) or partial(hypopnea) closure of the airflow throughout sleep (Figure 5.16). These episodes aretypically joined with blood oxygen desaturation and arousals from sleep. OSAS cannegatively affect the patient’s cognitive function, mode, and quality of life. Besides,patients affected with OSAS are at a considerable risk of developing cardiovascularmorbidity, and mortality [Peppard 2013, Kimoff 2016, Senaratna 2017].
In-lab polysomnography (PSG) is currently the most reliable approach to assessOSAS severity. The PSG test involves multiple physiological sensors attached tothe body to record several body functions during sleep, i.e., brain wave activi-
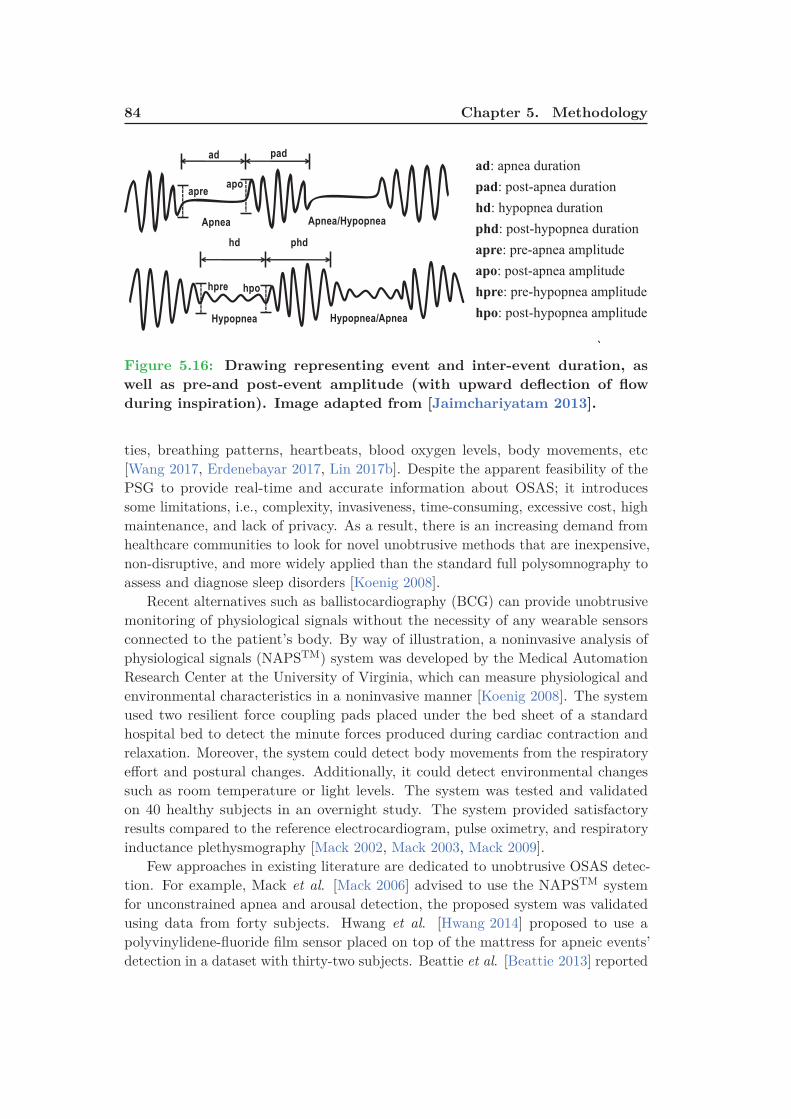
84 Chapter 5. Methodology
Apnea Apnea/Hypopnea
ad pad
hd phd
Hypopnea Hypopnea/Apnea
apreapo
hpre hpo
ad: apnea duration
pad: post-apnea duration
hd: hypopnea duration
phd: post-hypopnea duration
apre: pre-apnea amplitude
apo: post-apnea amplitude
hpre: pre-hypopnea amplitude
hpo: post-hypopnea amplitude
`
Figure 5.16: Drawing representing event and inter-event duration, as
well as pre-and post-event amplitude (with upward deflection of flow
during inspiration). Image adapted from [Jaimchariyatam 2013].
ties, breathing patterns, heartbeats, blood oxygen levels, body movements, etc[Wang 2017, Erdenebayar 2017, Lin 2017b]. Despite the apparent feasibility of thePSG to provide real-time and accurate information about OSAS; it introducessome limitations, i.e., complexity, invasiveness, time-consuming, excessive cost, highmaintenance, and lack of privacy. As a result, there is an increasing demand fromhealthcare communities to look for novel unobtrusive methods that are inexpensive,non-disruptive, and more widely applied than the standard full polysomnography toassess and diagnose sleep disorders [Koenig 2008].
Recent alternatives such as ballistocardiography (BCG) can provide unobtrusivemonitoring of physiological signals without the necessity of any wearable sensorsconnected to the patient’s body. By way of illustration, a noninvasive analysis ofphysiological signals (NAPSTM) system was developed by the Medical AutomationResearch Center at the University of Virginia, which can measure physiological andenvironmental characteristics in a noninvasive manner [Koenig 2008]. The systemused two resilient force coupling pads placed under the bed sheet of a standardhospital bed to detect the minute forces produced during cardiac contraction andrelaxation. Moreover, the system could detect body movements from the respiratoryeffort and postural changes. Additionally, it could detect environmental changessuch as room temperature or light levels. The system was tested and validatedon 40 healthy subjects in an overnight study. The system provided satisfactoryresults compared to the reference electrocardiogram, pulse oximetry, and respiratoryinductance plethysmography [Mack 2002, Mack 2003, Mack 2009].
Few approaches in existing literature are dedicated to unobtrusive OSAS detec-tion. For example, Mack et al. [Mack 2006] advised to use the NAPSTM systemfor unconstrained apnea and arousal detection, the proposed system was validatedusing data from forty subjects. Hwang et al. [Hwang 2014] proposed to use apolyvinylidene-fluoride film sensor placed on top of the mattress for apneic events’detection in a dataset with thirty-two subjects. Beattie et al. [Beattie 2013] reported

5.3. Clinical Application 85
the use of load cells located below the supports of bed to detect apneic events forforty-five subjects, where the apneic detection is done manually by an expert. Finally,Waltisberg et al. [Waltisberg 2017] introduced a sensor with integrated strain gaugesinstalled below the bed mattress to detect apneic and limb movement events for ninesubjects. An ongoing study between Personal Health Analytics Company Zansors2
and researchers at the University of Michigan, could bring to market the first-everlow-priced, US Food and Drug Administration (FDA)–approved over-the-countersleep apnea sensor for in-home use next year. The small, wireless wearable patchdetects sleep breathing patterns using microphone and accelerometer data. Therechargeable battery-powered device transmits the data to the patient’s smart-phonevia Bluetooth. It will be distributed for about $70 to $150. The company aims attargeting 2018 for market availability [Jennifer 2017].
Figure 5.17: Sleep apnea sensor proposed by Zansors, LLC. Image
adapted from [Jennifer 2017]
PSG was used to assess the performance of aforementioned methods to identifyapneic events, and it is worth mentioning that a fair comparison between differentmethods is difficult to make because the BCG’s morphology is highly dependent onthe type of the sensor and its location.
The objective of this study was to present preliminary results of a nonintrusivevital sign (i.e., heart and respiratory rate) monitoring system for sleep apneapatients using a microbend fiber-optic sensor (MFOS). In addition, we assessed thecapacity of the proposed system for nonintrusive OSAS detection as compared tothe most commonly used portable monitoring device (ApneaLink, ResMed, SanDiego, California, USA). In the subsequent sections, we discuss the data collectionprotocol and the principles of the deployed sensors in Section 5.3.1. Afterward, weexplain the algorithms used to analyze the sleep data in Section 5.3.2.
2https://www.zansors.com/
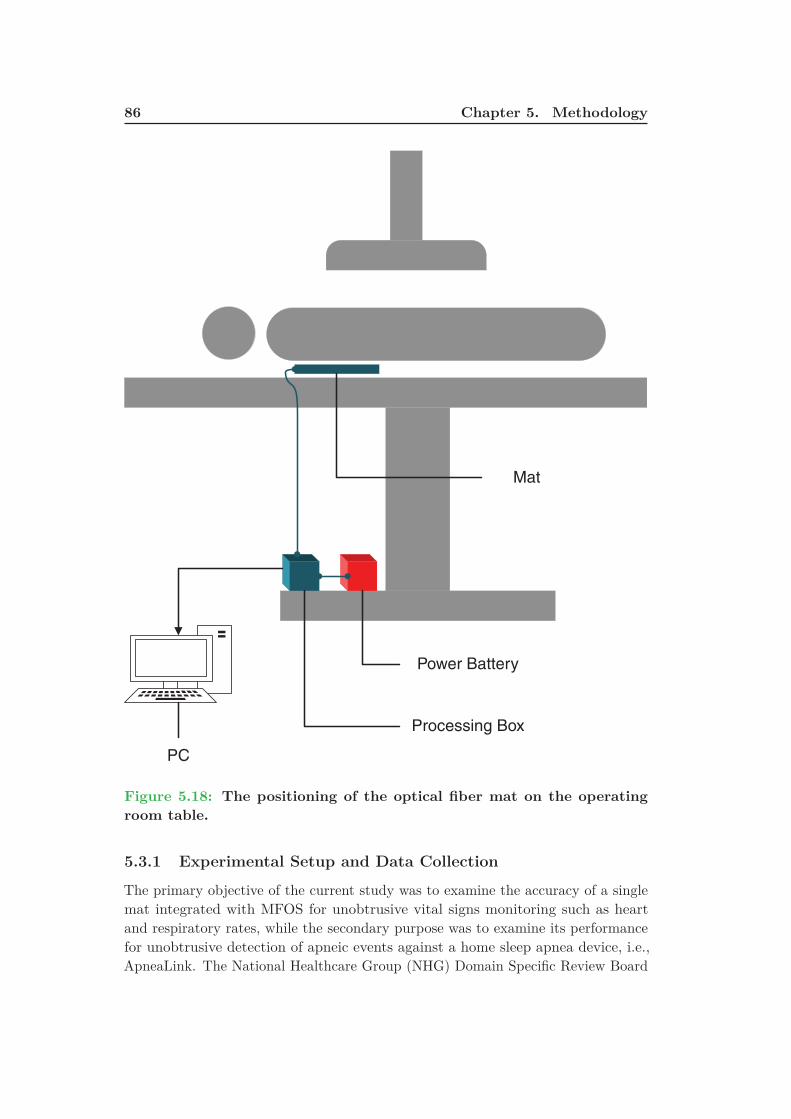
86 Chapter 5. Methodology
Power Battery
Processing Box
PC
Mat
Figure 5.18: The positioning of the optical fiber mat on the operating
room table.
5.3.1 Experimental Setup and Data Collection
The primary objective of the current study was to examine the accuracy of a singlemat integrated with MFOS for unobtrusive vital signs monitoring such as heartand respiratory rates, while the secondary purpose was to examine its performancefor unobtrusive detection of apneic events against a home sleep apnea device, i.e.,ApneaLink. The National Healthcare Group (NHG) Domain Specific Review Board
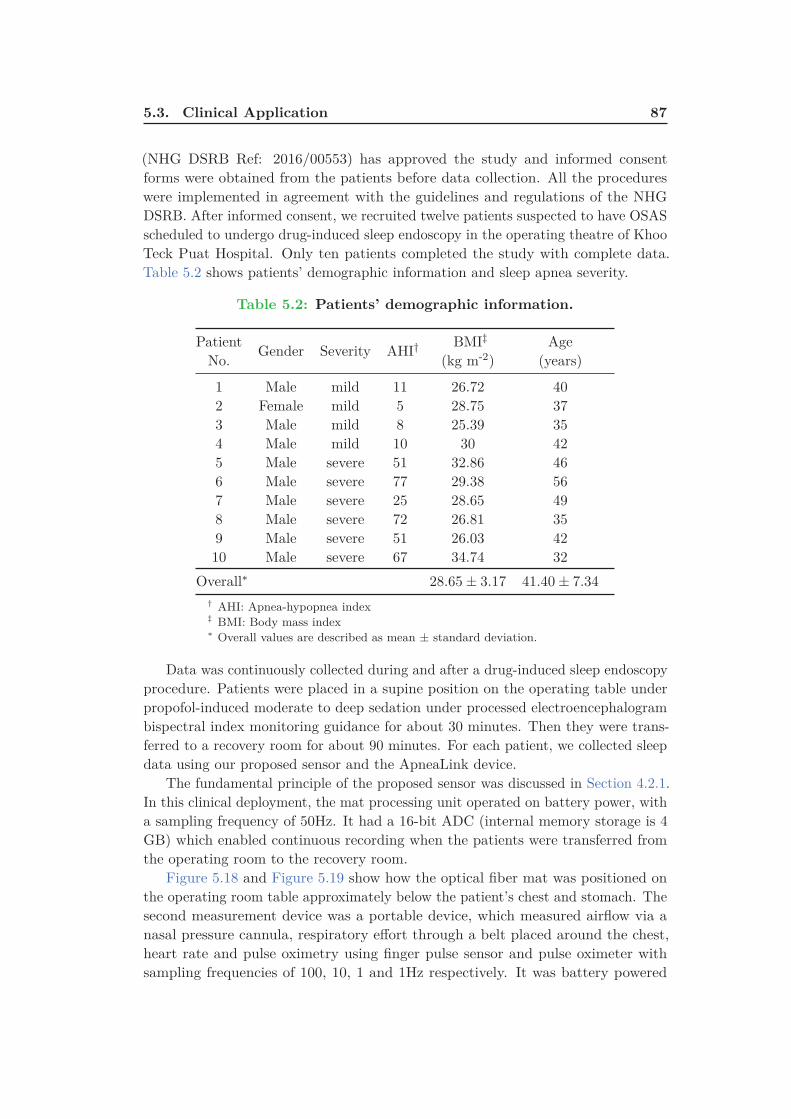
5.3. Clinical Application 87
(NHG DSRB Ref: 2016/00553) has approved the study and informed consentforms were obtained from the patients before data collection. All the procedureswere implemented in agreement with the guidelines and regulations of the NHGDSRB. After informed consent, we recruited twelve patients suspected to have OSASscheduled to undergo drug-induced sleep endoscopy in the operating theatre of KhooTeck Puat Hospital. Only ten patients completed the study with complete data.Table 5.2 shows patients’ demographic information and sleep apnea severity.
Table 5.2: Patients’ demographic information.
PatientNo.
Gender Severity AHI† BMI‡
(kg m-2)Age
(years)
1 Male mild 11 26.72 402 Female mild 5 28.75 373 Male mild 8 25.39 354 Male mild 10 30 425 Male severe 51 32.86 466 Male severe 77 29.38 567 Male severe 25 28.65 498 Male severe 72 26.81 359 Male severe 51 26.03 4210 Male severe 67 34.74 32
Overall∗ 28.65 ± 3.17 41.40 ± 7.34
† AHI: Apnea-hypopnea index‡ BMI: Body mass index∗ Overall values are described as mean ± standard deviation.
Data was continuously collected during and after a drug-induced sleep endoscopyprocedure. Patients were placed in a supine position on the operating table underpropofol-induced moderate to deep sedation under processed electroencephalogrambispectral index monitoring guidance for about 30 minutes. Then they were trans-ferred to a recovery room for about 90 minutes. For each patient, we collected sleepdata using our proposed sensor and the ApneaLink device.
The fundamental principle of the proposed sensor was discussed in Section 4.2.1.In this clinical deployment, the mat processing unit operated on battery power, witha sampling frequency of 50Hz. It had a 16-bit ADC (internal memory storage is 4GB) which enabled continuous recording when the patients were transferred fromthe operating room to the recovery room.
Figure 5.18 and Figure 5.19 show how the optical fiber mat was positioned onthe operating room table approximately below the patient’s chest and stomach. Thesecond measurement device was a portable device, which measured airflow via anasal pressure cannula, respiratory effort through a belt placed around the chest,heart rate and pulse oximetry using finger pulse sensor and pulse oximeter withsampling frequencies of 100, 10, 1 and 1Hz respectively. It was battery powered

88 Chapter 5. Methodology
Figure 5.19: Real deployment of the MFOS mat in the operating theatre
of Khoo Teck Puat Hospital.
by 16-bit ADC and 15MB internal storage. The apnea-hypopnea index (AHI), i.e.,the mean number of all apnea classes (unclassified, central, mixed, obstructive) andhypopneas per hour in the evaluation period was used in the analysis for our study,while the default parameters of the ApneaLink device for apneas and hypopneas wereused. The device is highly sensitive and specific in estimating AHI against the in-labPSG. “An apnea was identified as a decrease in airflow by 80% of baseline for at least
10 seconds. The ApneaLink default maximum apnea duration was set at 80 seconds.
A hypopnea was identified as a decrease in airflow by 50% of baseline for at least 10
seconds. The ApneaLink default maximum hypopnea duration was set at 100 seconds”[Erman 2007, Chen 2009a, Ng 2009, Crowley 2013, Chan 2014, Araújo 2018]. TheApneaLink results were also manually scored by a medical expert to avoid any shortevaluation period. In addition, they were stored in EDF format, while keeping thepatient’s data anonymized for further analysis with the proposed method. Figure 5.20shows the system components and operation of the ApneaLink device.
5.3.2 Data Processing
The raw data was stored in 5-minute chunks on a Micro SD-Card embedded inthe processing unit. Then all data-files were sent to a personal computer for data

5.3. Clinical Application 89
1- ApneaLink/ApneaLink Plus device recorder
2- E✁ort sensor (ApneaLink Plus only)
3- Belt (Single or multi-use)
4- ApneaLink nasal cannula
5- Pulse oximeter with ✂nger pulse sensor
6- USB cable
7- Computer with ApneaLink/ApneaLink Plus software installed
Figure 5.20: System components and operation of ApneaLink device
(ApneaLink, ResMed, San Diego, California, USA).
processing. In general, three signals can be extracted from the raw data includingbody movement, heartbeat, and respiration. One of the biggest challenges ofunobtrusive sensing is the body movement. Although it plays a vital role in sleepstage estimation [Watanabe 2004, Kortelainen 2010, Shin 2010, Lin 2017a], it hasan unfavorable impact on the quality of physiological signals. As a result, the firststep in our analysis was to identify and remove the body movement as explainedin Algorithm 1. After that, BCG and respiratory signals were extracted from thebandpass filtered data. At last, apneic and non-apneic events were detected basedon the respiratory signal. Figure 5.21 presents the overall flowchart of the suggested

90 Chapter 5. Methodology
system. To reach our goal, three different states were recognized for each 5-minutes
MFOS
Raw Data
BM
Removal
Source
Separation
Respiratory
Signal
BCG
Signal
Non-apneaApnea
Wavelet
DecompositionHR
4th Level
Smooth Coeff
RR3rd Order
Polynomial Fit
Savitzky-Golay
Smoothing
Adaptive
Thresholding
Figure 5.21: Overall system flowchart; BM: Body Movement, HR: Heart
Rate, and RR: Respiratory Rate.
recording, i.e., body movements, no activity, and sleep as provided by Algorithm 1.The BCG (2nd row of Figure 5.24) and respiratory (3rd row of Figure 5.24) signalswere extracted from the sleep data (1st row of Figure 5.24) using a Chebyshevtype I bandpass filter. The lower and upper cutoff frequencies of the filters were(a lower pass-band frequency of 2.5Hz, an upper pass-band frequency of 5Hz, anda pass-band ripple frequency 0.5dB) and (a lower pass-band frequency of 0.01Hz,an upper pass-band frequency of 0.4Hz, and a pass-band ripple frequency 0.5dB)respectively.
The maximal overlap discrete wavelet transform with the multiresolution analysisSection 5.2.3.5 was implemented for the heart rate (HR) estimation [Sadek 2017a].The BCG signal was cut up into approximation and detail information by passingthrough low-pass and high-pass filters, respectively without subsampling the filtercoefficients. The wavelet bi-orthogonal 3.9 (bior3.9) basis function with level 4 wasadopted for the decomposition process. The 4th level smooth coefficient (secondrow of Figure 5.24) was selected to measure the HR because the periodicity of themaxima showed an agreement with heart cycles. On the other hand, three stepswere applied to the respiratory signal to measure the respiratory rate (RR). First,second, and third, the nonlinear trend was eliminated by subtracting a 3rd orderpolynomial fit, the detrended signal was filtered using a Savitzky-Golay smoothingfilter (window length of 11 and polynomial order of 3), and a simple peak detectorwas utilized to detect the respiratory peaks. The local maxima of the respiratorysignal were used for RR measurement, where the RR value at the time tn, at whichthe nth maximum occurred, was defined as follows:
RRn =60
tn − tn−1(5.22)
where tn is the time at nth local maxima and tn−1 is the time at (n − 1)th local

5.3. Clinical Application 91
09:33:34 09:33:36 09:33:38 09:33:40 09:33:42 09:33:44Time
13000
14000
15000
16000
17000
18000
Amplitude[m
V]
Bed Movement
Raw Signal
Figure 5.22: An example of a 10-second body movement signal for patient
No. 4.
maxima in the respiratory signal. In which, the RR is expressed as breaths perminute (BPM).
The sleep apnea was identified using an adaptive threshold method based onthe SD of the respiratory signal. For each patient, the respiratory signal wasdivided into 30 seconds’ consecutive epochs, i.e., W 30
i = {W 301 , W 30
2 , . . . , W 30N }.
Then, every 30-second period was further divided into three 10 seconds’ periods,i.e., W 30
j = {w101 , w10
2 , w103 }. For every 30-second epoch, if the SD of a 10-second
epoch (W 10k ) was less than 30% of the maximum SD of the three 10-second epochs,
the current epoch was considered as an apneic event. Otherwise, it was consideredas a non-apneic event [Sadek 2018a]. The threshold was selected based on themean performance evaluation of all patients for apneic event detection. We selectedCohen’s Kappa coefficient as a mean performance [Hwang 2014] because it is thoughtto be a robust tool to evaluate the agreement between two raters.
In the previous two sections (Sections 5.2 and 5.3), we have demonstrated howour system was validated in health and wellness environment as well as the clinicalenvironment. In the next section (Section 5.4), we explain how we implemented oursleep monitoring system in real-life environments.
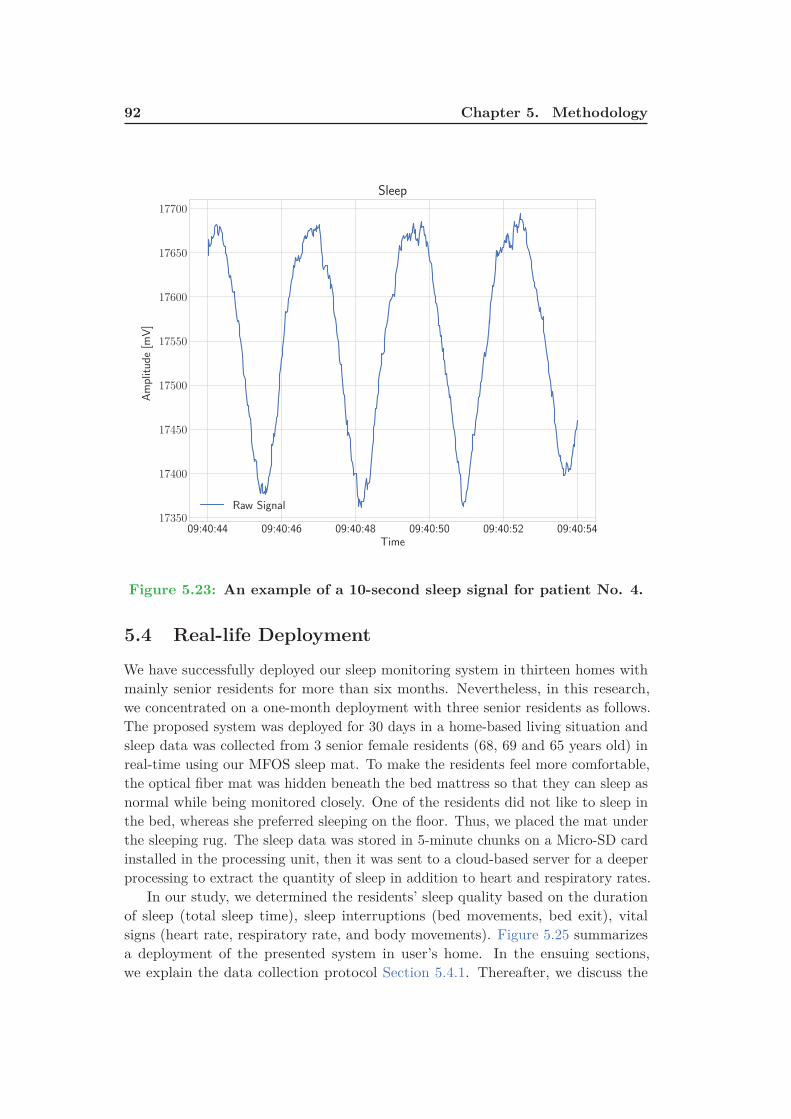
92 Chapter 5. Methodology
09:40:44 09:40:46 09:40:48 09:40:50 09:40:52 09:40:54Time
17350
17400
17450
17500
17550
17600
17650
17700
Amplitude[m
V]
Sleep
Raw Signal
Figure 5.23: An example of a 10-second sleep signal for patient No. 4.
5.4 Real-life Deployment
We have successfully deployed our sleep monitoring system in thirteen homes withmainly senior residents for more than six months. Nevertheless, in this research,we concentrated on a one-month deployment with three senior residents as follows.The proposed system was deployed for 30 days in a home-based living situation andsleep data was collected from 3 senior female residents (68, 69 and 65 years old) inreal-time using our MFOS sleep mat. To make the residents feel more comfortable,the optical fiber mat was hidden beneath the bed mattress so that they can sleep asnormal while being monitored closely. One of the residents did not like to sleep inthe bed, whereas she preferred sleeping on the floor. Thus, we placed the mat underthe sleeping rug. The sleep data was stored in 5-minute chunks on a Micro-SD cardinstalled in the processing unit, then it was sent to a cloud-based server for a deeperprocessing to extract the quantity of sleep in addition to heart and respiratory rates.
In our study, we determined the residents’ sleep quality based on the durationof sleep (total sleep time), sleep interruptions (bed movements, bed exit), vitalsigns (heart rate, respiratory rate, and body movements). Figure 5.25 summarizesa deployment of the presented system in user’s home. In the ensuing sections,we explain the data collection protocol Section 5.4.1. Thereafter, we discuss the

5.4. Real-life Deployment 93
10:01:34 10:01:36 10:01:38 10:01:40 10:01:42 10:01:44Time
0.00217
0.00218
Amplitude
Raw Signal
10:01:34 10:01:36 10:01:38 10:01:40 10:01:42 10:01:44Time
0.000
0.001
Amplitude
BCG Signal
Level 4 Smooth
10:01:34 10:01:36 10:01:38 10:01:40 10:01:42 10:01:44Time
−0.0002
−0.0001
0.0000
Amplitude
Respiratory Signal
Figure 5.24: The first, second, and third rows represent a typical 10-
second time-window of the raw signal, the BCG signal along with the
4th wavelet smooth coefficient, and the respiratory signal respectively;
amplitude values were normalized between -1 and 1.
algorithms used to analyze the sleep data in Section 5.4.2.
5.4.1 Data Collection
The proposed solution was deployed in real conditions for 30 days in order to validateour approach. During the deployment in participants’ homes, our system recordeddata, and they were post-processed and evaluated. The objective of this validationwas to study the reliability of the sleep monitoring and the performance of the entiresystem in a distant real deployment. At the same time, this deployment allowed usto validate the inter-connectivity of different sensors, the communication betweenthe gateway and the server, and presentation of results in real time.
The sleep signals were continuously acquired from three HDB3 flats with elderlyfemale residents, where the MFOS sleep mat shown in Figure 4.1 was placed under
3 http://www.hdb.gov.sg Housing & Development Board is a Singaporean governmental orga-
nization responsible for public housing, on their website, HDB claims: "HDB flats are home to over
80% of Singapore’s resident population"

94 Chapter 5. Methodology
Gateway
AAL platform ServerSleep mat
Personal computer
smartphone, ...
Sensors door and motion
Sleep mat unit
Figure 5.25: Overview of our unobtrusive monitoring in a living space.
the bed mattress. However, one of the residents prefers to sleep on the floor thusthe sleep mat was placed under the sleeping rug (bamboo sleeping mat). Prior todata collection, written informed consent was thought from all residents involved inthe study. In addition, a survey was obtained from the residents to summarize theirliving situation, sleeping and waking-up time, and napping time. We used the survey(Table 5.3) as a reference to validate the capability of the proposed system to detectdifferent sleep patterns. Figure 5.26 (a), (b), (c) show the sleep mat deployment inthe three HDB apartments.
5.4.2 Data Processing
In our real-life deployment, vital signs and sleep parameters, i.e., waking-up time,sleeping time, sleep interruptions, and total sleep time were computed based onSection 5.3.2. However, we implemented a moving time window (wi) of 30-secondlength to get information about sleep, movement, and bed-empty events. Moreover,it should be mentioned that during the deployment, the residents were living asnormal without any constraints, i.e., they could sleep on the bed at any time theyprefer. Figure 5.27 shows a representation of a participant’s night from our real-lifedeployment. As mentioned previously in Chapter 4, the sleep monitoring systemwas being deployed along with other sensors such as motion and contact sensors, andtherefore we can predict the activities of daily living of the residents and to providerich services in the right context through appropriate channels. Typically, motionsensors are installed in the lounge, living room, kitchen, and bathroom. Whereas,contact sensors can be attached to main door, fridges, and kitchen drawers.

5.5. Conclusion 95
Table 5.3: Home situation and sleep habits of each resident.
Home Situation Sleeping Time Waking-up Time Napping Time
Res1 Alone 23 : 00 − 00 : 00
07:00Sometimesat 05 : 30
1 − 2 times13 : 00 − 15 : 00
30 − 60 min
Res2 Family 21 : 00 − 23 : 00
07 : 00
Wednesdayat 04 : 00
N/A
Res3 Family18 : 30 − 19 : 30
Sometimesat 22 : 00
02 : 30
2 − 3 times13 : 00 − 15 : 00
30 min
• According to the residents, the reported time is approximate.• Residents do not report chronic diseases or disabilities.• Resident No. 1 sleeps on the floor, resident No. 2 sleeps in a double bed.However, she always sleeps on one side of the bed, and resident No. 3 sleeps ina single bed.
(a) (b) (c)
Figure 5.26: Sleep mat integration at the three HDB apartments; (a) 1st
home with mat under sleeping rug, (b) 2nd home with mat under bed
mattress, (c) 3rd home with mat under bed mattress.
5.5 Conclusion
This chapter discusses the two different applications we have implemented to evaluateour non-obstructive vital signs monitoring system. The first application aimed atmeasuring heart rate in a sitting position using data collected from 50 individualsduring a massage session. This application simulated real-life deployment because ofthe movement of the chair, as well as the movement of the body. These movementshad a strong impact on the quality of the signal, and therefore the proposed qualitydata processing can be evaluated properly. Other than that, the second applicationaimed at validating the proposed system for unobtrusive vital signs monitoring aswell as unobtrusive sleep apnea detection. In this application, the data was collectedfrom 10 patients in a clinical setting during a drug-induced sleep endoscopy. Inconclusion, the data quality processing algorithm, which is based on the signal’s

96 Chapter 5. Methodology
variance removes non-informative signals, i.e., motion artifacts and no-activitysegments. Subsequently, the multiresolution analysis of the MODWT can be appliedto detect heart cycles. Furthermore, the respiratory cycles can also be detectedafter removing the nonlinear trend in the band-pass filtered signal. Then, thelocal peaks of the respiratory signal can be utilized to measure the respiratoryrate. Additionally, the system has been evaluated for unobtrusive monitoring ofsleep-disordered breathing, in particular, obstructive sleep apnea. At last, we havedescribed our real-life deployment and how the sleep data was collected for severalnights from three senior residents in a home-based situation. The next section willdiscuss in detail the results achieved in each of aforementioned applications.
Mon 29 Aug 18:00 Mon 29 Aug 21:00 Tue 30 Aug 00:00 Tue 30 Aug 03:00 Tue 30 Aug 06:00 T
no motionin bedroom
sleep
bed motion
bed empty
bedroomactivity
survey
B
M
S
sleepbed motionbed empty
Figure 5.27: Representation of a participant’s night from our real-life
deployment. Three typical signal shapes are labeled according to rec-
ognized conditions: bed empty, bed motion, sleep. Gantt diagram: Row
“B” is the result of the signal processing from the bed sensor. Row “M”
shows a very inaccurate detection using motion sensors (blank space indi-
cates activity detection in other rooms out of scope). Row “S” indicates
the participant’s answer in the survey Table 5.3 about their waking and
sleeping habits.

Chapter 6
Results and Discussion
Contents
6.1 Introduction . . . . . . . . . . . . . . . . . . . . . . . . . . . . 97
6.2 Results of Health and Wellness Application . . . . . . . . . 97
6.2.1 Wavelet Analysis Versus CEEMDAN Algorithm . . . . . . . 102
6.3 Results of Clinical Application . . . . . . . . . . . . . . . . . 105
6.3.1 Heart and Respiratory Rate Estimation . . . . . . . . . . . . 105
6.3.2 Sleep Apnea Event Detection . . . . . . . . . . . . . . . . . . . 107
6.4 Results of Real-life Deployment . . . . . . . . . . . . . . . . . 111
6.5 Conclusion . . . . . . . . . . . . . . . . . . . . . . . . . . . . . 117
6.1 Introduction
This chapter discusses thoroughly the results of our two validation procedures, i.e.,health and wellness application (Section 5.2) besides clinical application (Section 5.3).In the former, we explain how the heart rate estimation is enhanced by implementingthe classification process. In addition, we provide a comparative study of variousmethods to measure the heart rate. These methods include Complete EnsembleEMD with Adaptive Noise (CEEMDAN) algorithm, the multiresolution analysis ofthe MODWT, fast Fourier transform (FFT), cepstrum, and autocorrelation approach.In the latter, we present the suitability of the proposed sleep monitoring system forunobtrusive vital signs monitoring in a clinical setting. The chapter also provides indetail the results of our real-life deployment (Section 5.4) in three users’ homes inone month’s time.
6.2 Results of Health and Wellness Application
As we deliberated before in Section 5.2.3.2, the goal was to use a cross-datasettesting in which Group1 was to be used as a training set while Group2 as a testset and vice versa. Therefore, the selected classifier should be able to correctlyclassify the data of Group2 based on Group1 and the other way around. Followingthe 10-fold cross-validation of each group, the optimal parameters of the classifierswere identified, and the mean accuracy of each classifier was determined. In general,the cross-validation is an approach to assess predictive models by subdividing the

98 Chapter 6. Results and Discussion
initial sample into a training set to train the model, and a test set to assess it. Moreprecisely, in 10-fold cross-validation, the initial sample is randomly subdivided into10 equal size sub-samples. Of the 10 sub-samples, a single sub-sample is maintainedas the validation data for testing the model, and the remaining 9 sub-samples areimplemented as training data. The cross-validation process is thus repeated 10times, i.e., the folds, with each of the 10 sub-samples applied exactly once as thevalidation data. The 10 results from the folds can thus be averaged to provide anindividual estimation. The added-value of this approach is that all measurementsare employed for both training and validation, and each measurement is adopted forvalidation exactly once.
Table 6.1 presents the mean accuracy of the 10-fold cross validation for eachclassifier. For random forest classifier (RF), the optimal number of trees or a.k.a.,ntree was 50 trees. For support vector machine (SVM), the radial basis functionkernel (RBF) provided better results than other kernel functions. For feedforwardneural network (NN), the number of hidden layers was 50 layers.
Table 6.1: 10-fold cross validation mean accuracy for Group1 and
Group2, (RF: ntrees = 50, SVM: RBF kernel, NN: 50 hidden neuron).
RF SVM NN LDA DTGroup1 98.13% 93.38% 91.61% 89.26% 97.51%Group2 92.30% 90.49% 85.89% 79.37% 89.39%
In both groups mentioned above, random forest classifier showed superior per-formance over the other classifiers with a mean accuracy of 98.13% and 92.30% forGroup1 and Group2 respectively. Using the same classifier, comparable results wereachieved when Group2 was tested versus Group1 and the other way around with anaccuracy of 90.75% and 97.99% for Experiment1 and Experiment2 accordingly aspresented in Table 6.2.
Table 6.3 shows the confusion matrix of random forest for Experiment2. Moreover,it can be included that the percentage of recovered informative data was 57.37%,which can be calculated as follows. Percentage = (1270 + 813)/(2085 + 1546).Decision tree and support vector machine classifiers attained relatively similarresults to the random forest with accuracy results of (88.10% & 97.41%) and (84.54%& 97.46%) for Experiment1 and Experiment2, respectively.
Table 6.2: Accuracy results for testing Group2 Vs. Group1 (Experi-
ment1) and testing Group1 Vs. Group2 (Experiment2).
RF SVM NN LDA DTExperiment1 90.75% 84.54% 82.34% 73.29% 88.1%Experiment2 97.99% 97.46% 87.10% 90.26% 97.41%

6.2. Results of Health and Wellness Application 99
Table 6.3: Confusion Matrix of random forest classifier for testing
Group1 Vs. Group2 (Experiment2).
Actual
Informative Non-Informative
PredictedInformative 1270 26
Non-Informative 18 771
On the other hand, the CEEMDAN algorithm (Section 5.2.3.3) was applied toBCG signals following a noise standard deviation of 0.35, an ensemble size of 100,and a maximum number of iterations of 30 to obtain interbeat intervals. Referring tothe amplitude of the added noise, Wu and Huang [Wu 2009b] recommended to applysmall amplitude values for data influenced by high-frequency signals, and likewise. Inaddition, a smaller ensemble size can be employed. This is because the CEEMDANadds a specific noise at each stage and produces a complete decomposition withno reconstruction error [Colominas 2012]. Furthermore, a balance between theamplitude of the added noise and the ensemble size should be considered. This isdue to the fact that, if the added noise amplitude is too small, therefore it maynot produce the change of extrema that the EMD depends on. Nevertheless, byincreasing the ensemble size, the effect of the added white noise will always beable to be reduced to a minimally small level [Wu 2009b]. For ECG and BCGsegments, the heart rate was estimated in beats per minute (BPM). Additionally,the mean absolute error (MAE) was implemented to evaluate the performance ofthe CEEMDAN algorithm for heart rate estimation with respect to the referenceECG. The MAE (Equation (6.1)), as the name suggests is the mean of the absoluteerrors, in which the absolute error is the absolute value of the difference betweenthe forecasted value and the actual value.
MAE =
∑ni=1 |Ri − Mi|
n, (6.1)
where M , R, and n refer to measured data, reference data, and number of samples.
Table 6.4: The MAE for Group1 and Group2 before and after classifica-
tion regarding the average beats per minute.
MAE (before) MAE (after)
Group1 11.16 7.26Group2 15.24 9.68Average 13.2 8.47
In order to estimate the effectiveness of the quality processing system, the HRwas estimated before and after applying the classification process. From Table 6.4,

100 Chapter 6. Results and Discussion
it can be noted that, the MAE was largely reduced from (G1: 11.16 and G2:15.24) to (G1: 7.26 and G2: 9.68) after the classification process. As a result, thequality processing system can effectively increase robustness of the system for vitalsigns monitoring. Figure 6.1 shows the Bland-Altman plot between the reference
60 70 80 90
Average Rate of Two Methods
−30
−20
−10
0
10
20
30
40
Rate
Difference
Mean
+1.96 SD
-1.96 SD
Figure 6.1: Bland-Altman plot between the reference ECG-derived
heartbeat intervals to associated BCG-derived heartbeat intervals for
Group1.
ECG-derived heartbeat intervals to associated BCG-derived heartbeat intervalsfor Group1. The limit of agreement was [−18.82, 16.89] beats/minute (standarddeviation σ = 9.11 beats/minute). Figure 6.2 shows the Bland-Altman plot betweenthe reference ECG-derived heartbeat intervals to associated BCG-derived heartbeatintervals for Group2. The limit of agreement was [−25.2, 18.99] beats/minute(standard deviation σ = 11.27 beats/minute). There were a few reasons, whichmight have increased measurement deviation between the reference ECG and theproposed device as follows. During the massage session, ECG electrodes mightnot have been attached correctly to the subject’s body. As a result, incorrectsynchronization between both signals has occurred [Hoog Antink 2018]. Althoughthe microbend fiber-optic sensor can detect the heart rate from various locationssuch as under the head; under the chest; under chest and abdomen; and under
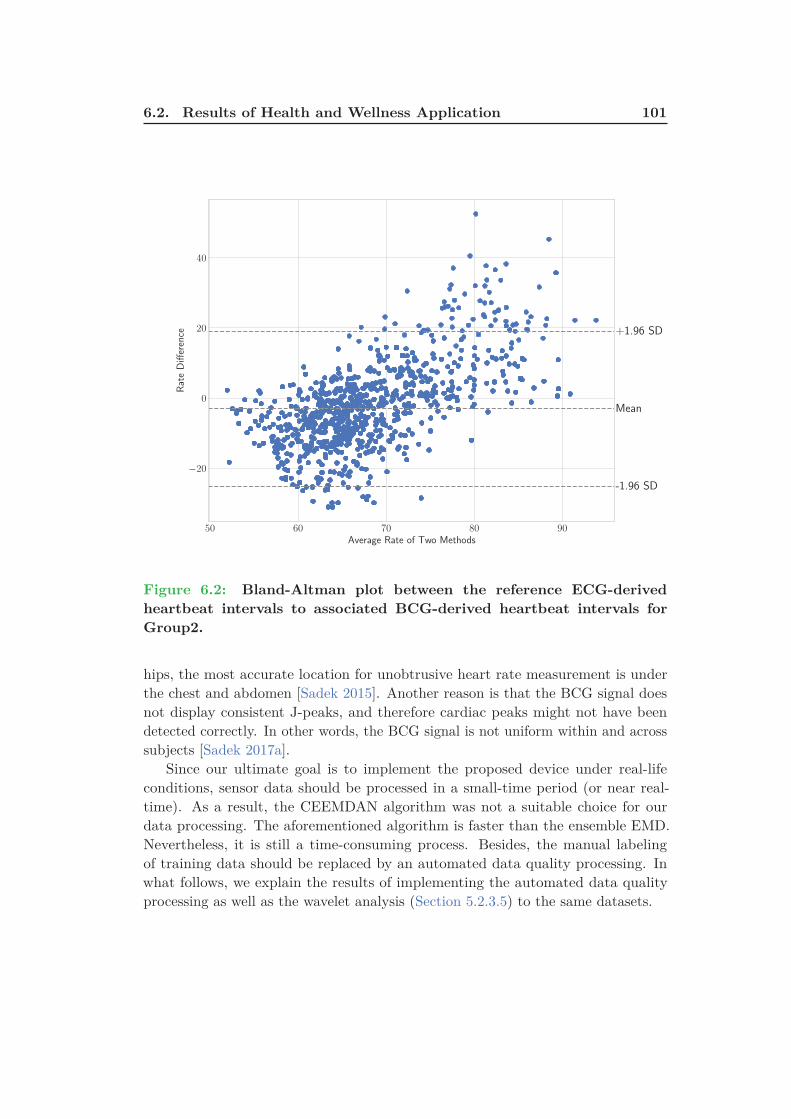
6.2. Results of Health and Wellness Application 101
50 60 70 80 90
Average Rate of Two Methods
−20
0
20
40
Rate
Difference
Mean
+1.96 SD
-1.96 SD
Figure 6.2: Bland-Altman plot between the reference ECG-derived
heartbeat intervals to associated BCG-derived heartbeat intervals for
Group2.
hips, the most accurate location for unobtrusive heart rate measurement is underthe chest and abdomen [Sadek 2015]. Another reason is that the BCG signal doesnot display consistent J-peaks, and therefore cardiac peaks might not have beendetected correctly. In other words, the BCG signal is not uniform within and acrosssubjects [Sadek 2017a].
Since our ultimate goal is to implement the proposed device under real-lifeconditions, sensor data should be processed in a small-time period (or near real-time). As a result, the CEEMDAN algorithm was not a suitable choice for ourdata processing. The aforementioned algorithm is faster than the ensemble EMD.Nevertheless, it is still a time-consuming process. Besides, the manual labelingof training data should be replaced by an automated data quality processing. Inwhat follows, we explain the results of implementing the automated data qualityprocessing as well as the wavelet analysis (Section 5.2.3.5) to the same datasets.

102 Chapter 6. Results and Discussion
6.2.1 Wavelet Analysis Versus CEEMDAN Algorithm
As we mentioned in Section 5.2.3.4, the variance of the data was utilized to classifyevery 10-second time window into body movement, unoccupied, or sleep signal. Forbody movement signals, the magnitude of the pressure force was large enough todestroy any vital information. In other words, retrieval of any vital information wasimpossible. For unoccupied signals, the amplitude of the signal was always lowerthan a predetermined value, i.e., there was no any pressure force applied to theoptical sensor mat. At last, for sleep signals, there was a uniform pressure appliedto the optical sensor mat, i.e., the force applied to the mat is originated from thecardiac circulation as well as the movement of other body organs. Subsequently,for each subject, we first applied the automated data quality processing to excludebody movements and unoccupied events. Afterward, we implemented the waveletanalysis to detect the heart rate.
Table 6.5: The mean and standard deviation (SD) of the MAE for
MODWT and CEEMDAN regarding the average beats per minute across
all 50 subjects.
CEEMDAN db1 sym2 coif1 bior3.9 rbio3.1Mean 9.4 12.64 14.11 14.17 10.12 10.13SD 6.16 6.36 7.4 7.42 4.69 4.79
In order to achieve satisfactory results, several different families of wavelets havebeen evaluated such as Daubechies, Symlet, Coiflets, Biorthogonal, and ReverseBiorthogonal. Since every wavelet family has different numbers of vanishing mo-ments, for our analysis we selected the vanishing moment yielding the lowest meanabsolute error. We used Daubechies-1 (db1), Symlet-2 (sym2), Coiflets-1 (coif1),Biorthogonal-3.1 (bior3.9), and Reverse Biorthogonal-3.1 (rbio3.1) bases with 4-leveldecomposition. For each wavelet, the 4th level smooth coefficient was selected forheart rate measurement. This was because the periodicity of the local maximapresented an agreement with cardiac cycles.
As we can see in Table 6.5, the Biorthogonal-3.9 basis function produced thelowest MAE (10.12 ± 4.69) among other wavelet basis functions. The ReverseBiorthogonal-3.1 achieved proportional results to Biorthogonal-3.9 basis function(10.13 ± 4.79). The Daubechies-1, Symlet-2, and Coiflets-1 achieved higher errorrates such as 12.64 ± 6.36, 14.11 ± 7.4, and 14.17 ± 7.42, respectively. Figure 6.3shows the box plots of the average MAE for CEEMDAN algorithm and waveletmethods regarding the average beats per minute across all 50 subjects. We can alsosee that, the CEEMDAN algorithm achieved slightly better results (9.4 ± 6.16) thanthe best wavelet, i.e., Biorthogonal-3.9. However, this algorithm is time consumingcompared with wavelet transform (Section 4.2.2). To explain, the run-time of a10-second signal was approximately 20 seconds and 0.04 seconds for CEEMDANand wavelet transform, receptively. This happened when the algorithm was testedon a Windows-based laptop computer with Intel Core i5-4200U, 2.4GHz CPU clock

6.2. Results of Health and Wellness Application 103
CEEMDAN db1 sym2 coif1 bior3.9 rbio3.1
Methods
5
10
15
20
25
30
Average
MeanAbsoluteError
(MAE)
Median
Mean
Figure 6.3: Box plots of the average MAE for CEEMDAN algorithm
and wavelet methods regarding the average beats per minute across all
50 subjects.
and 6GB of RAM. As a result, the wavelet analysis was more suitable for ourreal-time applications. In many situations, the MODWT was able to handle themotion artifacts originated during the massage session. As shown in Figure 6.4, thealgorithm managed to detect all the corresponding J-Peaks in the noisy BCG signal.
So far, we have shown the superiority of the wavelet analysis over the CEEMDANalgorithm considering real-time data processing. Next, we compared the best wavelet,i.e., Biorthogonal-3.9 with FFT, cepstrum, and autocorrelation methods. In thesethree methods, the heart rate was computed using a sliding time-window of alength 10-seconds (i.e., 500 samples) with 50% overlap between consecutive windows.After detecting the heartbeat interval (HBI) in each window, the heart rate wascomputed such as HR = 60 ∗ HBI. As we can see from Table 6.6 and Figure 6.5,
Table 6.6: The mean and standard deviation (SD) of the MAE for best
wavelet, FFT, cepstrum, and autocorrelation methods considering the
average beats per minute across all 50 subjects.
FFT Cepstrum Autocorrelation bior3.9Average 29.99 58.36 76.54 10.12
SD 12.21 8.08 22.58 4.69
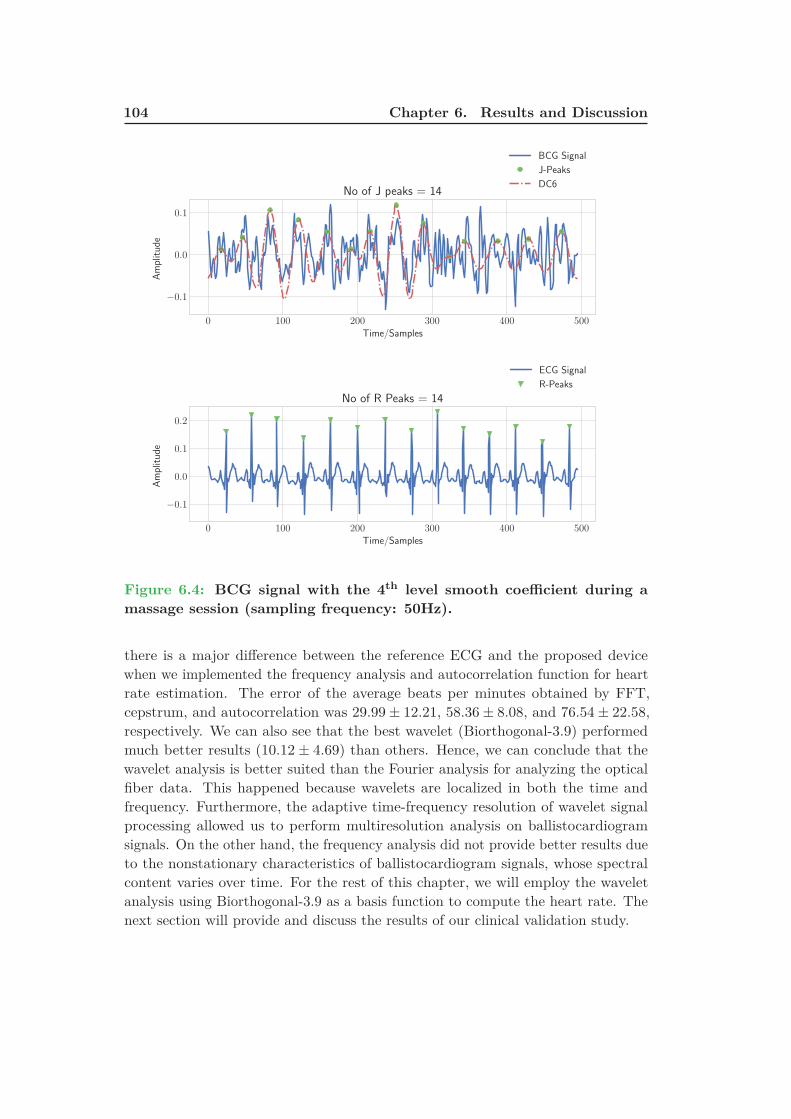
104 Chapter 6. Results and Discussion
0 100 200 300 400 500
Time/Samples
−0.1
0.0
0.1
Amplitude
No of J peaks = 14
BCG Signal
J-Peaks
DC6
0 100 200 300 400 500
Time/Samples
−0.1
0.0
0.1
0.2
Amplitude
No of R Peaks = 14
ECG Signal
R-Peaks
Figure 6.4: BCG signal with the 4th level smooth coefficient during a
massage session (sampling frequency: 50Hz).
there is a major difference between the reference ECG and the proposed devicewhen we implemented the frequency analysis and autocorrelation function for heartrate estimation. The error of the average beats per minutes obtained by FFT,cepstrum, and autocorrelation was 29.99 ± 12.21, 58.36 ± 8.08, and 76.54 ± 22.58,respectively. We can also see that the best wavelet (Biorthogonal-3.9) performedmuch better results (10.12 ± 4.69) than others. Hence, we can conclude that thewavelet analysis is better suited than the Fourier analysis for analyzing the opticalfiber data. This happened because wavelets are localized in both the time andfrequency. Furthermore, the adaptive time-frequency resolution of wavelet signalprocessing allowed us to perform multiresolution analysis on ballistocardiogramsignals. On the other hand, the frequency analysis did not provide better results dueto the nonstationary characteristics of ballistocardiogram signals, whose spectralcontent varies over time. For the rest of this chapter, we will employ the waveletanalysis using Biorthogonal-3.9 as a basis function to compute the heart rate. Thenext section will provide and discuss the results of our clinical validation study.
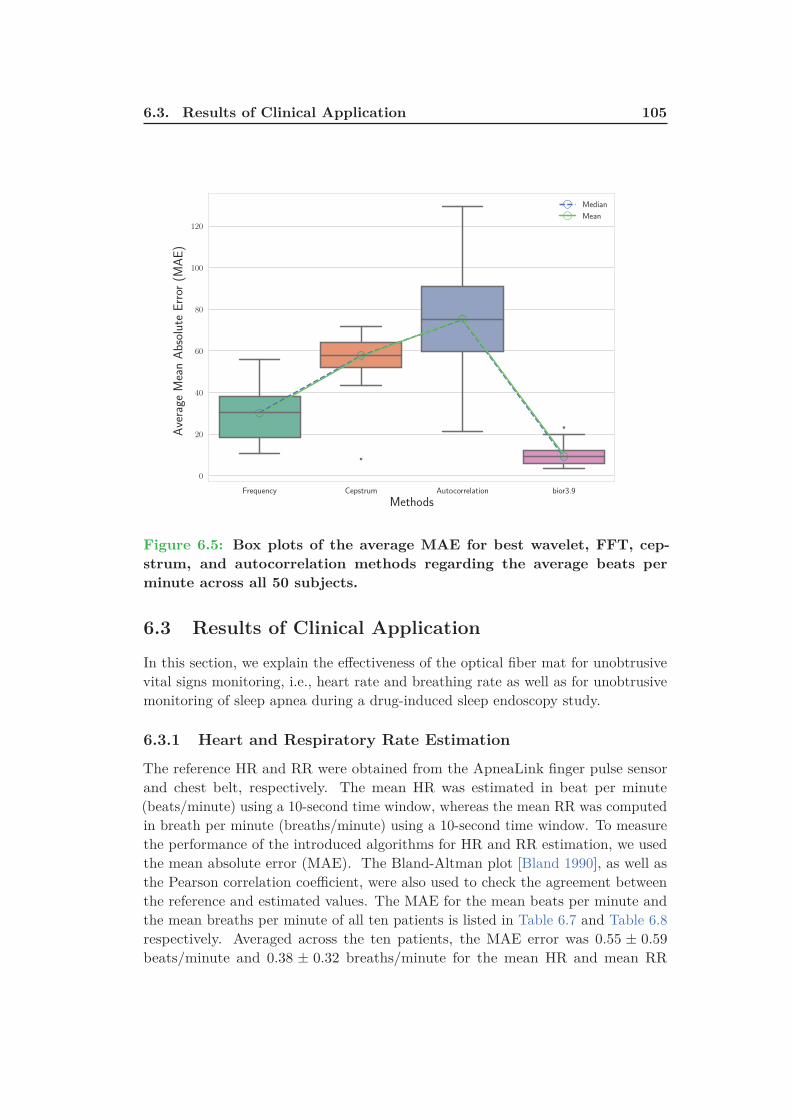
6.3. Results of Clinical Application 105
Frequency Cepstrum Autocorrelation bior3.9
Methods
0
20
40
60
80
100
120
Average
MeanAbsoluteError
(MAE)
Median
Mean
Figure 6.5: Box plots of the average MAE for best wavelet, FFT, cep-
strum, and autocorrelation methods regarding the average beats per
minute across all 50 subjects.
6.3 Results of Clinical Application
In this section, we explain the effectiveness of the optical fiber mat for unobtrusivevital signs monitoring, i.e., heart rate and breathing rate as well as for unobtrusivemonitoring of sleep apnea during a drug-induced sleep endoscopy study.
6.3.1 Heart and Respiratory Rate Estimation
The reference HR and RR were obtained from the ApneaLink finger pulse sensorand chest belt, respectively. The mean HR was estimated in beat per minute(beats/minute) using a 10-second time window, whereas the mean RR was computedin breath per minute (breaths/minute) using a 10-second time window. To measurethe performance of the introduced algorithms for HR and RR estimation, we usedthe mean absolute error (MAE). The Bland-Altman plot [Bland 1990], as well asthe Pearson correlation coefficient, were also used to check the agreement betweenthe reference and estimated values. The MAE for the mean beats per minute andthe mean breaths per minute of all ten patients is listed in Table 6.7 and Table 6.8respectively. Averaged across the ten patients, the MAE error was 0.55 ± 0.59
beats/minute and 0.38 ± 0.32 breaths/minute for the mean HR and mean RR

106 Chapter 6. Results and Discussion
Table 6.7: The mean absolute error of all 10 pa-
tients for the average beats per minute computed
during the entire study.
Patient # Mean HR (beats/minute)
ApneaLink MFOS Mat Absolute Error1 70.67 70.87 0.22 81.43 81.5 0.073 79.35 79.6 0.254 77.32 77.83 0.515 70.22 72.34 2.126 72.52 72.41 0.117 66.72 67.4 0.688 72.84 72.49 0.359 71.09 71.6 0.5110 90.57 89.95 0.62
Overall∗ 0.55 ± 0.59
∗ Overall values are described as mean ± standard deviation.
Table 6.8: The mean absolute error of all 10 pa-
tients for the average breaths per minute com-
puted during the entire study.
Patient # Mean RR (breaths/minute)
ApneaLink MFOS Mat Absolute Error1 15.05 14.85 0.22 19.47 19.63 0.163 16.66 17.59 0.934 17.38 17.96 0.585 18.98 19.06 0.086 19 18.57 0.437 20.42 20.21 0.218 19.52 20.38 0.869 17.44 17.72 0.2810 20.02 20.07 0.05
Overall∗ 0.38 ± 0.32
∗ Overall values are described as mean ± standard deviation.

6.3. Results of Clinical Application 107
respectively. Figure 6.6(a) and Figure 6.6(b) show the Bland-Altman plot and thePearson correlation plot of the HR between the two methods. The limit of agreementwas [−5.12, 4.92] beats/minute (standard deviation σ = 3.07 beats/minute). ThePearson correlation coefficient was 0.96.
In the same manner, Figure 6.7(a) and Figure 6.7(b) give the Bland-Altmanplot and the Pearson correlation plot of the RR between the two methods. Thelimit of agreement was [−5.13, 4.98] breaths/minute (standard deviation σ = 2.56
breaths/minute). The Pearson correlation coefficient was 0.78. In conclusion, thesystem achieved very close results to the ApneaLink device (finger pulse sensor andrespiratory belt). The average error was very small for both vital signs as shown inthe overall results of Table 6.7 and Table 6.8. Furthermore, the agreement betweenthe reference ApneaLink and the sleeping mat was assessed using the Bland-Altmanplot and the Pearson correlation coefficient, which revealed a very good agreementfor both vital signs.
Broadly speaking, the estimation of the respiratory rate for normal subjectswas easier than the heart rate. This is because the amplitude of the dominantJ-peak (equivalent to the R-peak of the electrocardiogram signal) of the BCG signalwas not uniform throughout the entire signal. However, for sleep apnea patients,the estimation of respiratory rate was very challenging. This is because, for sleepapnea patients, the morphology of the respiratory signal varies quite a lot duringtime due to the absence or decrease of breathing that makes the respiratory ratedifficult to compute. As shown in Figure 6.8, all the J-peaks of the BCG signal(1st row) can be easily detected. However, the respiratory cycles (inhalations andexhalations) are difficult to detect from the signal (2nd row). Thereafter, sometimesthe respiratory peaks may not be detected correctly. It also can be noted that thePearson correlation coefficient was 0.96 (Figure 6.6(b)) for heart rate estimation,while the value was 0.79 (Figure 6.7(b)) for respiratory rate estimation.
6.3.2 Sleep Apnea Event Detection
We correlated the AHI provided by the ApneaLink device (flow signal) with theAHI obtained from the optical fiber mat. The AHI derived from both systems wasdepending on the total time of the study. The severity of the apnea was gradedbased on the AHI value, i.e., mild (5 ≤ AHI < 15), moderate (15 ≤ AHI < 30),severe (AHI ≥ 30). The sensitivity and specificity were employed to appraise theperformance of the sleeping mat against the ApneaLink device. In this research, thesensitivity represented the proportion of correctly identified apnea events, whereasthe specificity represented the proportion of correctly identified non-apnea events.The results of the sleep apnea detection algorithm are presented in Table 6.9. Thestatistical values were computed based on the severity of the apnea at 30% thresholdvalue. The sensitivity and specificity were 24.24 ± 12.81%, 85.88 ± 6.01% forsleep apnea detection. The source code of the proposed methodology, in Python, isavailable at [Sadek 2018b]. In summation, the reference ApneaLink device measuresthe sleep apnea using the flow signal through a nasal cannula, which may not be

108 Chapter 6. Results and Discussion
60 70 80 90 100 110
Average Rate of Two Methods
−4
−2
0
2
4
Rate
Difference
Mean
+1.96 SD
-1.96 SD
(a)
60 70 80 90 100 110
Heart Rate (beats/minute) - Finger Pulse Sensor
60
70
80
90
100
110
Heart
Rate(beats/m
inute)-Mattress
Pearson = 0.96
(b)
Figure 6.6: (a) Bland-Altman plot and (b) Pearson correlation plot of
all patients regarding the HR measurement.
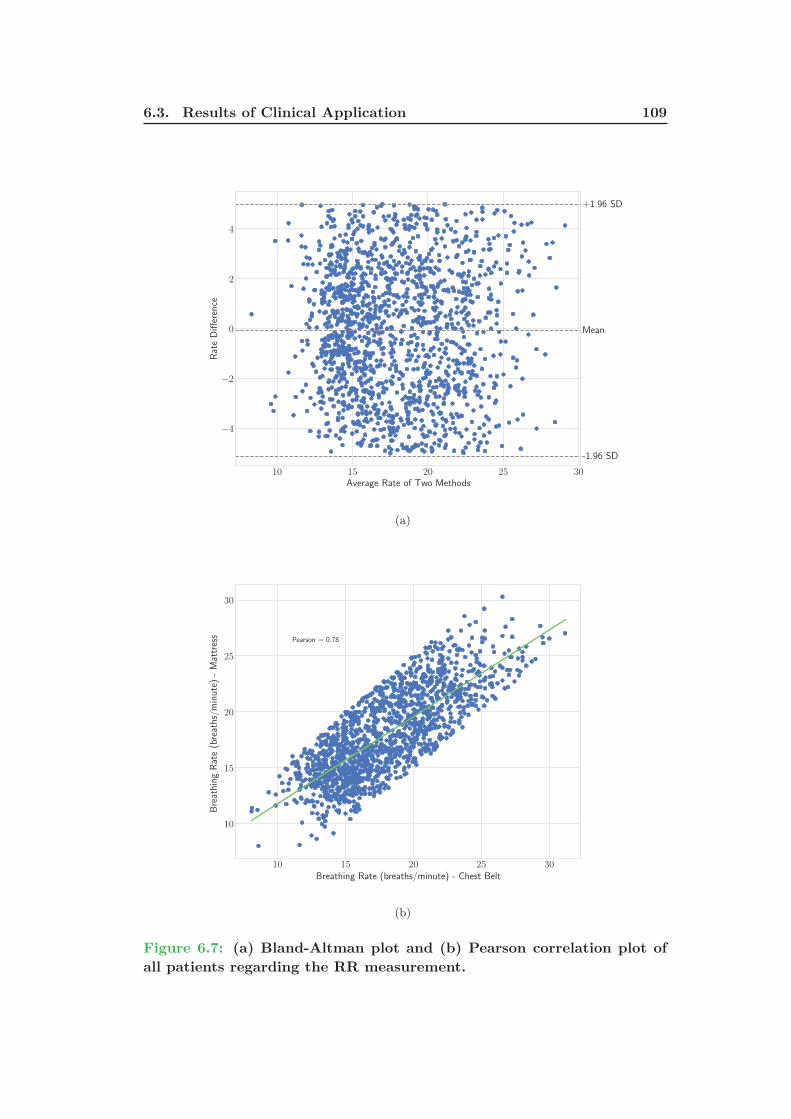
6.3. Results of Clinical Application 109
10 15 20 25 30
Average Rate of Two Methods
−4
−2
0
2
4
Rate
Difference
Mean
+1.96 SD
-1.96 SD
(a)
10 15 20 25 30
Breathing Rate (breaths/minute) - Chest Belt
10
15
20
25
30
BreathingRate(breaths/minute)-Mattress Pearson = 0.78
(b)
Figure 6.7: (a) Bland-Altman plot and (b) Pearson correlation plot of
all patients regarding the RR measurement.
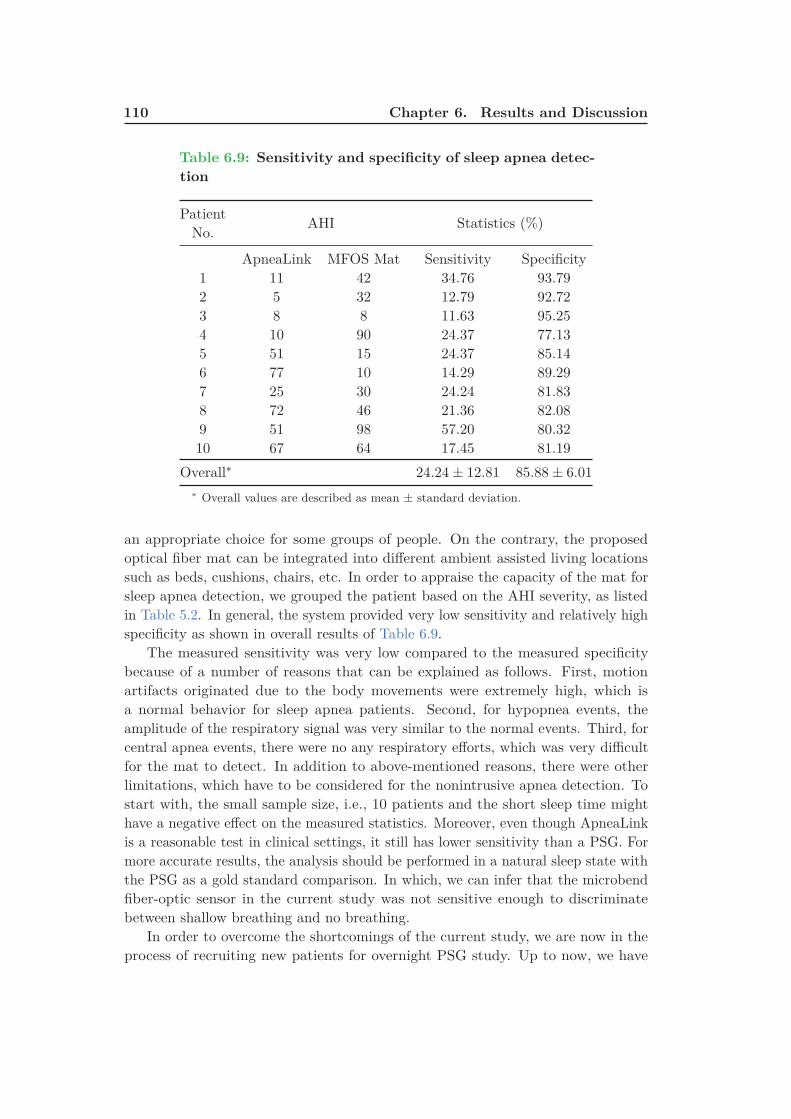
110 Chapter 6. Results and Discussion
Table 6.9: Sensitivity and specificity of sleep apnea detec-
tion
PatientNo.
AHI Statistics (%)
ApneaLink MFOS Mat Sensitivity Specificity1 11 42 34.76 93.792 5 32 12.79 92.723 8 8 11.63 95.254 10 90 24.37 77.135 51 15 24.37 85.146 77 10 14.29 89.297 25 30 24.24 81.838 72 46 21.36 82.089 51 98 57.20 80.3210 67 64 17.45 81.19
Overall∗ 24.24 ± 12.81 85.88 ± 6.01
∗ Overall values are described as mean ± standard deviation.
an appropriate choice for some groups of people. On the contrary, the proposedoptical fiber mat can be integrated into different ambient assisted living locationssuch as beds, cushions, chairs, etc. In order to appraise the capacity of the mat forsleep apnea detection, we grouped the patient based on the AHI severity, as listedin Table 5.2. In general, the system provided very low sensitivity and relatively highspecificity as shown in overall results of Table 6.9.
The measured sensitivity was very low compared to the measured specificitybecause of a number of reasons that can be explained as follows. First, motionartifacts originated due to the body movements were extremely high, which isa normal behavior for sleep apnea patients. Second, for hypopnea events, theamplitude of the respiratory signal was very similar to the normal events. Third, forcentral apnea events, there were no any respiratory efforts, which was very difficultfor the mat to detect. In addition to above-mentioned reasons, there were otherlimitations, which have to be considered for the nonintrusive apnea detection. Tostart with, the small sample size, i.e., 10 patients and the short sleep time mighthave a negative effect on the measured statistics. Moreover, even though ApneaLinkis a reasonable test in clinical settings, it still has lower sensitivity than a PSG. Formore accurate results, the analysis should be performed in a natural sleep state withthe PSG as a gold standard comparison. In which, we can infer that the microbendfiber-optic sensor in the current study was not sensitive enough to discriminatebetween shallow breathing and no breathing.
In order to overcome the shortcomings of the current study, we are now in theprocess of recruiting new patients for overnight PSG study. Up to now, we have
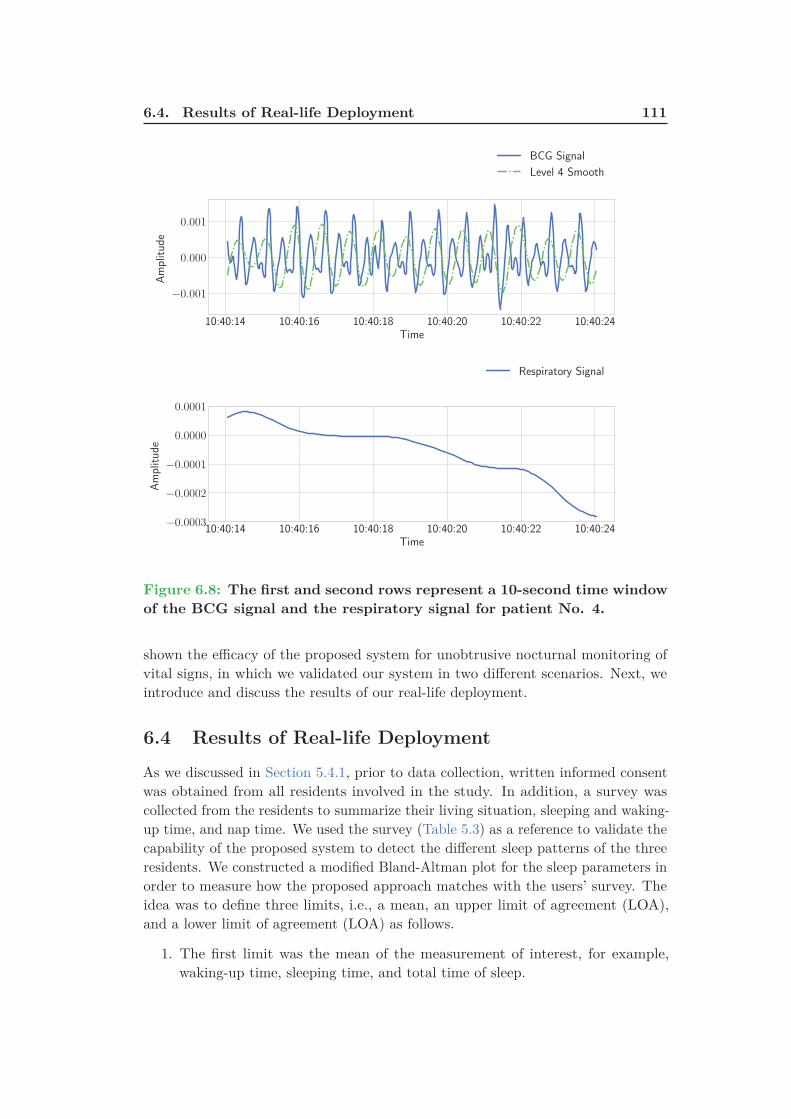
6.4. Results of Real-life Deployment 111
10:40:14 10:40:16 10:40:18 10:40:20 10:40:22 10:40:24Time
−0.001
0.000
0.001
Amplitude
BCG Signal
Level 4 Smooth
10:40:14 10:40:16 10:40:18 10:40:20 10:40:22 10:40:24Time
−0.0003
−0.0002
−0.0001
0.0000
0.0001
Amplitude
Respiratory Signal
Figure 6.8: The first and second rows represent a 10-second time window
of the BCG signal and the respiratory signal for patient No. 4.
shown the efficacy of the proposed system for unobtrusive nocturnal monitoring ofvital signs, in which we validated our system in two different scenarios. Next, weintroduce and discuss the results of our real-life deployment.
6.4 Results of Real-life Deployment
As we discussed in Section 5.4.1, prior to data collection, written informed consentwas obtained from all residents involved in the study. In addition, a survey wascollected from the residents to summarize their living situation, sleeping and waking-up time, and nap time. We used the survey (Table 5.3) as a reference to validate thecapability of the proposed system to detect the different sleep patterns of the threeresidents. We constructed a modified Bland-Altman plot for the sleep parameters inorder to measure how the proposed approach matches with the users’ survey. Theidea was to define three limits, i.e., a mean, an upper limit of agreement (LOA),and a lower limit of agreement (LOA) as follows.
1. The first limit was the mean of the measurement of interest, for example,waking-up time, sleeping time, and total time of sleep.

112 Chapter 6. Results and Discussion
2. The second limit was computed as follows:
mean[measurement] + 2 × SD[measurement]. (6.2)
3. The third limit was computed as follows:
mean[measurement] − 2 × SD[measurement]. (6.3)
By doing that, we can search for systematic bias or mean and also identify anypossible outliers outside the two limits of agreements. To go into detail, as we cansee in Figure 6.9, on most occasions, resident No. 2 wakes up around 07 : 15 withan upper LOA of 09 : 45 and a lower LOA of 04 : 52. However, on Wednesday theresident wakes up around 04 : 30. These results agree with the user’s survey becauseshe usually wakes up around 07 : 00. Nevertheless, on Wednesday she wakes uparound 04 : 00.
2016-08
-22
2016-08
-29
2016-09
-05
2016-09
-12
2016-09
-19
2016-09
-26
Dates
04:10:00
04:51:40
05:33:20
06:15:00
06:56:40
07:38:20
08:20:00
09:01:40
09:43:20
Wake
upTim
e
04:33:29 04:28:2904:39:29 04:40:29
04:47:59
04:23:59
Upper LOA = 09:45:49
Lower LOA = 04:52:01
Bias = 07:18:55
Figure 6.9: Bland-Altman plot of waking-up time for resident No. 2;
green bigotimes symbols represent Wednesday.
Another example representing the time of sleep for resident No. 3 is shown inFigure 6.10 . It may be noted that most of the time the resident sleeps around18 : 30. On two occasions, the resident went to bed before 14 : 30. This situationmight occur when the resident stays on the bed for the entire day instead of sittingin a chair to watch television. We can also notice that on two other occasions theresident went to bed after 22 : 00 which agrees with user’s survey.

6.4. Results of Real-life Deployment 113
On the other hand, the resident reported having a nap two to three times between13 : 00 and 15 : 00. This also agrees with our results presented in Table 6.10, inwhich the average time of starting the nap is 13 : 34 : 14 and the average time ofending the nap is 15 : 09 : 59. In addition, the average napping duration is aboutone and half hour. The waking-up time for this particular user was very surprising
2016-08
-24
2016-08
-31
2016-09
-07
2016-09
-14
2016-09
-21
Dates
13:53:20
15:16:40
16:40:00
18:03:20
19:26:40
20:50:00
22:13:20
Sleep
Tim
e
Upper LOA = 22:02:39
Lower LOA = 14:46:40
Bias = 18:24:40
Figure 6.10: Bland-Altman plot of sleep time for resident No. 3 over
deployment time.
to us. This was because according to our sleep monitoring system, the residentused to wake up around 03 : 30, which is very early in the morning (Figure 6.11).However, when we double checked with the resident, she confirmed the outcome asshe used to practice some religious traditions at this specific time.
Table 6.10: Starting and ending of napping time for resident No. 3.
Days Start Napping Last Napping Difference
8/19/2016 13 : 16 : 29 15 : 42 : 29 2 : 26 : 00
8/22/2016 13 : 52 : 29 15 : 47 : 59 1 : 55 : 30
8/27/2016 12 : 37 : 59 14 : 49 : 29 2 : 11 : 30
8/29/2016 13 : 09 : 29 14 : 40 : 29 1 : 31 : 00
9/5/2016 13 : 40 : 59 14 : 30 : 59 0 : 50 : 00
9/7/2016 14 : 47 : 59 15 : 28 : 29 0 : 40 : 30
Mean 13 : 34 : 14 15 : 09 : 59 1 : 35 : 45

114 Chapter 6. Results and Discussion
2016-08
-24
2016-08
-31
2016-09
-07
2016-09
-14
2016-09
-21
Dates
01:23:20
02:05:00
02:46:40
03:28:20
04:10:00
04:51:40
05:33:20
06:15:00
06:56:40
Wake
upTim
e
Upper LOA = 05:44:16
Lower LOA = 01:26:33
Bias = 03:35:24
Figure 6.11: Bland-Altman plot of waking-up time for resident No. 3
over deployment time.
For resident No. 2, we have noticed that her average sleep time is about 12hours (Figure 6.12), which is longer compared to other residents (9 hours for residentNo. 2 and resident No. 3). The resident preferred to sleep on a sleeping rug(Figure 5.26(b)) located on the floor, this was because sleeping on the floor wascooler to her than sleeping on the bed. We advised the resident to change her sleephygiene because she spent a lot of the time laying down on the sleeping rug whilewatching television.
With respect to vital signals, the BCG signal was utilized to monitor the heartrate while the respiratory signal was being used to monitor the breathing rate. Therespiratory signal represents the movements of the chest wall and stomach.
To get more accurate results we tried to place the mat approximately near tothe chest and stomach area of the residents. During sleep time, we might adjustour sleeping positions from one time to another. However, increasing the onsetsof body movements could be an indicator of a sleep disorder such as the periodicleg movement disorder. Even though body movements reduce the quality of themeasured signal, they are very important to predict the quality of sleep. Besides,they play a key role in sleep stage estimation. Generally speaking, If the magnitudeof the body movement is small, we still can compute the vitals. However, a largebody movement completely destroys the signal.
As given by Figure 6.15, the average duration of disturbed sleep per night rangesbetween 50 to 80 minutes for all deployment days. Further, all points are within the
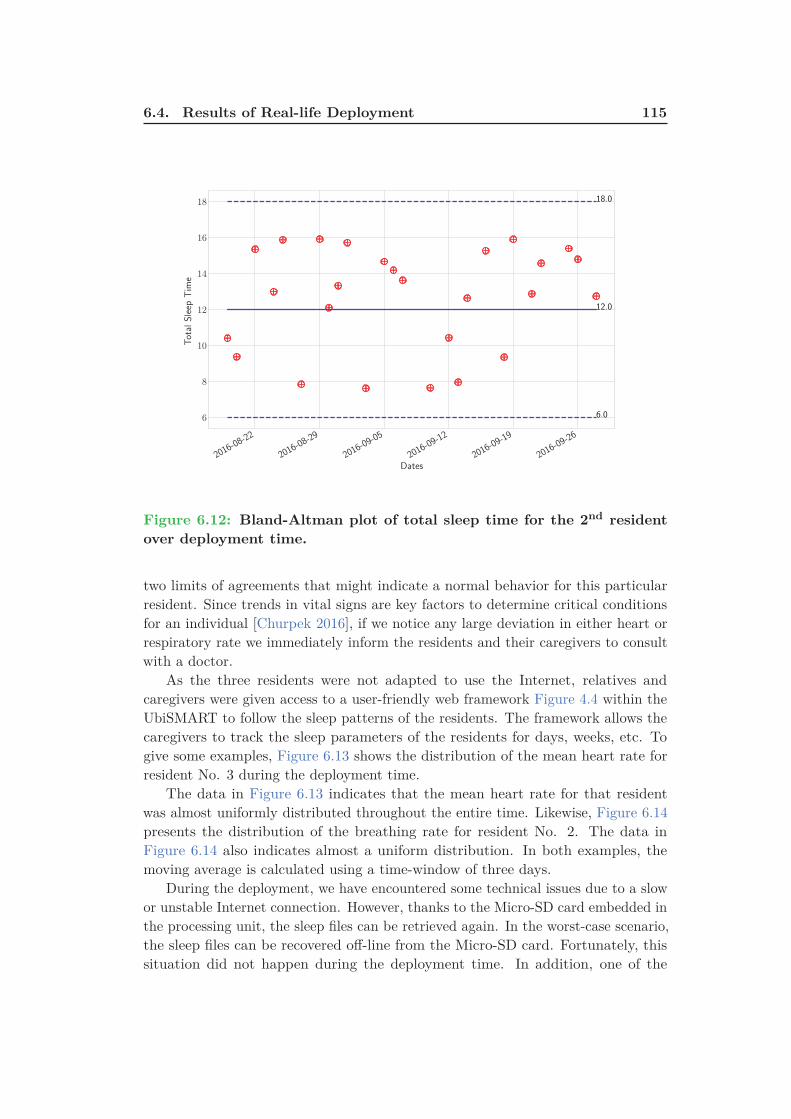
6.4. Results of Real-life Deployment 115
2016-08
-22
2016-08
-29
2016-09
-05
2016-09
-12
2016-09
-19
2016-09
-26
Dates
6
8
10
12
14
16
18
TotalSleep
Tim
e
18.0
6.0
12.0
Figure 6.12: Bland-Altman plot of total sleep time for the 2nd resident
over deployment time.
two limits of agreements that might indicate a normal behavior for this particularresident. Since trends in vital signs are key factors to determine critical conditionsfor an individual [Churpek 2016], if we notice any large deviation in either heart orrespiratory rate we immediately inform the residents and their caregivers to consultwith a doctor.
As the three residents were not adapted to use the Internet, relatives andcaregivers were given access to a user-friendly web framework Figure 4.4 within theUbiSMART to follow the sleep patterns of the residents. The framework allows thecaregivers to track the sleep parameters of the residents for days, weeks, etc. Togive some examples, Figure 6.13 shows the distribution of the mean heart rate forresident No. 3 during the deployment time.
The data in Figure 6.13 indicates that the mean heart rate for that residentwas almost uniformly distributed throughout the entire time. Likewise, Figure 6.14presents the distribution of the breathing rate for resident No. 2. The data inFigure 6.14 also indicates almost a uniform distribution. In both examples, themoving average is calculated using a time-window of three days.
During the deployment, we have encountered some technical issues due to a slowor unstable Internet connection. However, thanks to the Micro-SD card embedded inthe processing unit, the sleep files can be retrieved again. In the worst-case scenario,the sleep files can be recovered off-line from the Micro-SD card. Fortunately, thissituation did not happen during the deployment time. In addition, one of the

116 Chapter 6. Results and Discussion
69
70
71
72
73
74
75
76
77
78
79
Heart Rate Resident #3
Heart Rate Moving Average Upper LOA Lower LOA
Figure 6.13: Bland-Altman plot of heart rate representation of resident
No. 3 over deployment time.
0
5
10
15
20
25
08/1
8/1
6
08/1
9/1
6
08/2
0/1
6
08/2
1/1
6
08/2
2/1
6
08/2
3/1
6
08/2
4/1
6
08/2
5/1
6
08/2
6/1
6
08/2
7/1
6
08/2
8/1
6
08/2
9/1
6
08/3
0/1
6
08/3
1/1
6
09/0
1/1
6
09/0
2/1
6
09/0
3/1
6
09/0
4/1
6
09/0
5/1
6
09/0
6/1
6
09/0
7/1
6
09/0
8/1
6
09/0
9/1
6
09/1
0/1
6
09/1
1/1
6
09/1
2/1
6
09/1
3/1
6
Breathing Rate Resident #2
Breathing Rate Moving Average Upper LOA Lower LOA
Figure 6.14: Bland-Altman plot of breathing rate representation of resi-
dent No. 2 over deployment time.
residents complained that the bed become warmer because of the presence of themat underneath the bed mattress.
Technically speaking, this situation cannot happen as we are using fiber-optictechnology. When we approached the resident, and discussed with the caregiver, wefound out that this feeling occurred as the resident was a little bit afraid of the newsystem. After explaining again, the safety of the system to the resident, she becamemore comfortable and she did not complain again about the mat.

6.5. Conclusion 117
Figure 6.15: Sleep disturbance distribution for resident No. 2 over de-
ployment time; the moving average is computed using a time-window of
three days.
To summarize, the proposed sleep monitoring system does not require any closecontact with the human body. This feature was very suitable for the residentsbecause they did not agree to put on any wearable devices. Although wearabledevices like smart-watches can provide more accurate and continuous monitoring ofdifferent body functions, they might be more suitable for young people. This is notalways true, it depends on the level of education and the ability to learn and acceptmodern technologies. Based on the total time of sleep, frequent body movements,bed exit activities, vital signs, i.e., heart rate and respiratory rate, we can infer thesleep quality of the residents.
6.5 Conclusion
In this chapter, we have reported the results of our health and wellness validationas well as clinical validation. Various approaches have been implemented to detectinterbeat intervals for noisy and nonstationary ballistocardiogram signals. Thewavelet analysis among other methods was able to provide satisfactory results inreasonable running time. In consideration of the foregoing, the frequency-domainapproaches do not yield satisfactory results due to the characteristics of ballistocar-diogram signals. In other words, the interbeat intervals are not uniform within thetime. Further, interbeat interval measures are very susceptible to surrounding noise.Therefore, locating the fundamental heartbeat frequency is very challenging, whichresults in imprecise heartbeats. Considering the clinical validation, the proposednonintrusive sleep monitoring system provided very reasonable results compared

118 Chapter 6. Results and Discussion
with a home sleep testing device, i.e., ResMed’s ApneaLink despite the large bodymovements originated during apnea events. Nonetheless, nonintrusive sleep apneadetection is a very challenging task because the same signs and symptoms of sleepapnea might also occur in healthy people. With respect to real-life deployment, theproposed system presented very good results for identifying various sleep parameterssuch as waking-up time, sleeping time, the total time of sleep, and physiologicalsigns, i.e., heartbeat and respiration. Moreover, the residents were very interestedin the system because they feel more safe and comfortable. In the future, we areaiming at extending the indoor monitoring to an outdoor monitoring using beaconsplaced near to areas of interest such as food courts, sports facilities, bus stops, senioractivity centers where the elderly used to go. The next section will conclude thethesis and outlines directions for future research.
Chapter 7
Conclusion and Future
Directions
Contents
7.1 Conclusion . . . . . . . . . . . . . . . . . . . . . . . . . . . . . 119
7.2 Future Directions . . . . . . . . . . . . . . . . . . . . . . . . . 121
In this last chapter, we present conclusions about our proposed work. Further-more, we describe possible research directions to continue the work described in thisthesis.
7.1 Conclusion
In this thesis, we have presented a unique nonintrusive vital sign monitoring systemusing a mat embedded with microbend fiber-optic sensors. The fundamental principleof the proposed system is to record the mechanical vibrations of the body caused bycardiac activity as well as the chest and abdominal movements.
The heartbeat intervals, i.e., the millisecond interval between two consecutiveheartbeats can be computed from the vibrational activity of the heart whereas thebreathing rate can compute from the movements of the chest and abdomen.
The microbend fiber-optic sensor is a very suitable choice for nonintrusivemonitoring of vital signs, i.e., heart rate and breathing as it is highly sensitive topressure variations produced by the ballistic forces of the heart and it does not requireclose contact with the body. Furthermore, it is relatively small, lightweight, andaffordable. In other words, we only need to locate the optical fiber mat underneaththe subject’s mattress, therefore, we can measure his/her vital signs.
The proposed system can also be used to monitor the sleep quality of the subjectsas the system can provide information about physiological signals such as heartrate, breathing rate, and body movements. Based on this information, various sleepparameters can be measured, namely waking-up time, sleeping time, the total timeof sleep, and sleep interruptions.
Since the optical fiber mat can be located underneath the subject mattress, theacquired signal is very susceptible to motion artifacts. Hence, extracting heartbeatintervals is a very challenging task. In existing literature, different methods havebeen employed to detect heart and breathing rate non-intrusively. Nevertheless,
120 Chapter 7. Conclusion and Future Directions
most of these methods have been deployed in a controlled laboratory environment.As a result, they might not be applicable for real-life environments such as users’homes.
In this research, we have proposed to use the multiresolution analysis of themaximal overlap discrete wavelet transform to measure heart rate. To begin with,an automated signal data quality algorithm based on the signal variance has beenimplemented to eliminate unwanted body movements that might destroy the vitalinformation in the signal. Afterward, a band-pass filter with specific frequency limitsequivalent to human heart rate was applied to the clean signal to extract cardiacsignal or as known as ballistocardiogram. Next, the wavelet analysis was employedto analyze the cardiac signal into detail and smooth components. Additionally, thesmooth component was selected for heart rate estimation since their local maximashow an agreement with cardiac cycles. At last, interbeat intervals were computedby finding the distance between successive local peaks of the smooth component.
On the other hand, the respiratory rate, representing the chest and abdominalmovements, was computed by applying a band-pass filter with specific frequencylimits equivalent to human breathing rate. Thereafter, the nonlinear trend waseliminated by subtracting a 3rd order polynomial fit, the detrended signal was filteredusing a Savitzky-Golay smoothing filter (window length of 11 and polynomial orderof 3), and a peak detector was applied to detect the respiratory peaks.
The proposed system has been validated in a health and wellness environment aswell as a clinical environment. In the first, the data was acquired from 50 subjectssitting in a massages chair where the sensor was embedded in the headrest of thechair. The electrocardiogram sensor was used as a reference to assess the qualityof the system for heart rate estimation. In the second, the data was collected in aclinical setting from a small cohort of subjects during a drug-induced sleep endoscopystudy. The system was evaluated against a commercially available home-based sleepapnea monitoring device known as ApneaLink. In both applications, the proposedsystem achieved promising results compared with the reference devices. We alsoevaluated the capability of the proposed sensor for unobtrusive monitoring of sleepapnea during the clinical study. However, the system achieved lower sensitivitycompared with airflow sensor of the ApneaLink device.
Considering heart rate estimation, the wavelet analysis has shown superior resultscompared with fast Fourier transform, cepstrum, and autocorrelation function. Theempirical mode decomposition has been also implemented. Although it providedslightly better results than the wavelet analysis, it is a time-consuming process,therefore, it is not applicable for real-time analysis.
Following satisfactory results obtained during the two phases of validation, thesystem has been deployed in thirteen homes with mainly senior residents for morethan six months. In this research, we analyzed the sleep data collected from threesenior female residents during a one-month period. The proposed system has shownvery good agreement with a user’s survey collected before the study. Moreover, thesleep monitoring system has been integrated within an existing Ambient AssistedLiving (AAL) platform, better known as UbiSMART. As a result, relatives and

7.2. Future Directions 121
caregivers could track the residents’ sleep quality using a user-friendly interfacewithin the UbiSMART. Likewise, the residents were very interested in the systembecause they feel more safe and comfortable. Along with the sleep monitoringsystem, the UbiSMART system collected other activities of daily living using motionand contact sensors. Combining of all sensory data can have a positive impact toenhance the quality of life and social well-being of the seniors.
7.2 Future Directions
In the future work, new directions might be included to improve the proposed systemas follows.
In order to provide continuous vital sign monitoring, a multimodal sensingapproach should be implemented. In other words, wearable devices such as smart-watches and smart-phones should be employed to enable continuous monitoringof vital activities. Thanks to the accelerometer, the wearable devices can monitorand record real-time information about one’s physiological condition and motionactivities. The outcome of our proposed sensor and other wearable devices canbe fused together to yield more robust and accurate information about the healthstatus of individuals. In addition, wearable devices can also be used as a referenceto segment unwanted body movements during sleep which might have a negativeeffect on the signal quality.
Considering nonintrusive monitoring of sleep apnea, we can also use anothersensor such as finger pulse oximeter to get more accurate information about obstruc-tive apnea events. Our ultimate goal is to reduce as much as possible the numberof sensors/electrodes need to be attached to the human body. However, in case ofapnea detection, the polysomnography is still the gold-standard approach to deter-mine the apnea severity for individuals. This is because several electrodes are usedto detect several physiological signals. Our proposed device might have providedlower sensitivity for sleep apnea detection. However, it can provide long-term datamonitoring which is not possible in a hospital environment.
We are also preparing a second phase for sleep apnea detection and the sleepmonitoring system will be deployed during an overnight polysomnography study.This means that we can have more informative data that will help improve ourcurrent results.


Bibliography
[Acampora 2013] G. Acampora, D.J. Cook, P. Rashidi and A.V. Vasilakos. A Survey
on Ambient Intelligence in Healthcare. Proceedings of the IEEE, vol. 101,no. 12, pages 2470–2494, Dec 2013. (Cited on page 64.)
[Addison 2002] P.S. Addison. The illustrated wavelet transform handbook: Intro-ductory theory and applications in science, engineering, medicine and finance.Taylor & Francis, 2002. (Cited on page 76.)
[Alametsä 2004] Jarmo Alametsä, Alpo Värri, Mikko Koivuluoma and LaurentiuBarna. The potential of EMFi sensors in heart activity monitoring. In2nd OpenECG Workshop Integration of the ECG into the EHR and In-teroperability of ECG Device Systems, Berlin, Germany, 2004. (Cited onpage 37.)
[Alametsä 2018] Jarmo Alametsä and Jari Viik. Twelve years follow-up of ballisto-cardiography, pages 1117–1120. Springer Singapore, Singapore, 2018. (Citedon page 40.)
[Alihanka 1981] J. Alihanka, K. Vaahtoranta and I. Saarikivi. A new method for
long-term monitoring of the ballistocardiogram, heart rate, and respiration.American Journal of Physiology - Regulatory, Integrative and ComparativePhysiology, vol. 240, no. 5, pages R384–R392, 1981. (Cited on pages 27and 28.)
[Aloulou 2012] Hamdi Aloulou, Mounir Mokhtari, Thibaut Tiberghien, Jit Biswasand Lin Jin Hong Kenneth. A semantic plug&play based framework forambient assisted living, pages 165–172. Springer Berlin Heidelberg, Berlin,Heidelberg, 2012. (Cited on page 61.)
[Aloulou 2016] Hamdi Aloulou, Bessam Abdulrazak, Romain Endelin, João Bentes,Thibaut Tiberghien and Joaquim Bellmunt. Simplifying installation andmaintenance of ambient intelligent solutions toward large scale deployment,pages 121–132. Springer International Publishing, Cham, 2016. (Cited onpage 60.)
[Alvarado-Serrano 2016] Carlos Alvarado-Serrano, Pablo Samuel Luna-Lozano andRamon Pallàs-Areny. An algorithm for beat-to-beat heart rate detection from
the BCG based on the continuous spline wavelet transform. Biomedical SignalProcessing and Control, vol. 27, no. Supplement C, pages 96 – 102, 2016.(Cited on pages 35, 36 and 75.)
[Araújo 2018] Inês Araújo, Filipa Marques, Sandra André, Manuel Araújo, SaraMarques, Rita Ferreira, Patrícia Moniz, Margarida Proença, Pedro Borrego
124 Bibliography
and Cândida Fonseca. Diagnosis of sleep apnea in patients with stable chronic
heart failure using a portable sleep test diagnostic device. Sleep and Breathing,Jan 2018. (Cited on page 88.)
[Aubert 2008] X. L. Aubert and A. Brauers. Estimation of vital signs in bed from
a single unobtrusive mechanical sensor: Algorithms and real-life evaluation.In 2008 30th Annual International Conference of the IEEE Engineering inMedicine and Biology Society, pages 4744–4747, Aug 2008. (Cited on pages 37and 41.)
[Basner 2012] Robert C Basner. Case studies in polysomnography interpretation.Cambridge University Press, 2012. (Cited on pages xv and 17.)
[Battle 2009] C.U. Battle. Essentials of public health biology: A guide for the studyof pathophysiology. Essential public health. Jones & Bartlett Learning, 2009.(Cited on pages 13 and 14.)
[Beattie 2013] Zachary T. Beattie, Tamara L. Hayes, Christian Guilleminault andChad C. Hagen. Accurate scoring of the apnea–hypopnea index using a simple
non-contact breathing sensor. Journal of Sleep Research, vol. 22, no. 3, pages356–362, 2013. (Cited on page 84.)
[Bellmunt 2015] Joaquim Bellmunt, Thibaut Tiberghien, Mounir Mokhtari, HamdiAloulou and Romain Endelin. Technical challenges towards an aal large scaledeployment, pages 3–14. Springer International Publishing, Cham, 2015.(Cited on page 60.)
[Bellmunt 2016] Joaquim Bellmunt, Mounir Mokhtari, Bessam Abdulzarak andHamdi Aloulou. Agile Framework for Rapid Deployment in Ambient Assisted
Living Environments. In Proceedings of the 18th International Conferenceon Information Integration and Web-based Applications and Services, iiWAS’16, pages 410–413, New York, NY, USA, 2016. ACM. (Cited on page 61.)
[Berthold 1995] J. W. Berthold. Historical review of microbend fiber-optic sensors.Journal of Lightwave Technology, vol. 13, no. 7, pages 1193–1199, Jul 1995.(Cited on page 50.)
[Bland 1990] J.M. Bland and D.G. Altman. A note on the use of the intraclass
correlation coefficient in the evaluation of agreement between two methods of
measurement. Computers in Biology and Medicine, vol. 20, no. 5, pages 337 –340, 1990. (Cited on page 105.)
[Brink 2006] Mark Brink, Christopher H. Müller and Christoph Schierz. Contact-
free measurement of heart rate, respiration rate, and body movements during
sleep. Behavior Research Methods, vol. 38, no. 3, pages 511–521, Aug 2006.(Cited on pages 42 and 46.)

Bibliography 125
[Bruser 2011] C. Bruser, K. Stadlthanner, S. de Waele and S. Leonhardt. Adaptive
Beat-to-Beat Heart Rate Estimation in Ballistocardiograms. IEEE Trans-actions on Information Technology in Biomedicine, vol. 15, no. 5, pages778–786, Sept 2011. (Cited on pages 44 and 46.)
[Brüser 2013] C Brüser, S Winter and S Leonhardt. Robust inter-beat interval
estimation in cardiac vibration signals. Physiological Measurement, vol. 34,no. 2, page 123, 2013. (Cited on pages 39 and 41.)
[Brüser 2015] C. Brüser, J. M. Kortelainen, S. Winter, M. Tenhunen, J. Pärkkä andS. Leonhardt. Improvement of Force-Sensor-Based Heart Rate Estimation
Using Multichannel Data Fusion. IEEE Journal of Biomedical and HealthInformatics, vol. 19, no. 1, pages 227–235, Jan 2015. (Cited on pages 34, 36and 81.)
[Cao 2013] Xinrong Cao, Hong Guo and Jintian Tang. Heart Rate Extraction of
Ballistocardiogram Based on Hilbert-Huang Transformation. In Mian Long,editor, World Congress on Medical Physics and Biomedical Engineering May26-31, 2012, Beijing, China, volume 39 of IFMBE Proceedings, pages 619–622.Springer Berlin Heidelberg, 2013. (Cited on page 69.)
[Chan 2014] Matthew T V Chan, Chew-Yin Wang, Edwin Seet, Stanley Tam,Hou-Yee Lai, Stuart Walker, Timothy G Short, Richard Halliwell andFrances Chung. Postoperative vascular complications in unrecognised Ob-
structive Sleep apnoea (POSA) study protocol: an observational cohort study
in moderate-to-high risk patients undergoing non-cardiac surgery. BMJ Open,vol. 4, no. 1, 2014. (Cited on page 88.)
[Chee 2005] Yongjoon Chee, Jooman Han, Jaewoong Youn and Kwangsuk Park. Air
mattress sensor system with balancing tube for unconstrained measurement
of respiration and heart beat movements. Physiological Measurement, vol. 26,no. 4, page 413, 2005. (Cited on pages 40 and 43.)
[Chen 2009a] Hui Chen, Alan A. Lowe, Yuxing Bai, Peter Hamilton, John A.Fleetham and Fernanda R. Almeida. Evaluation of a portable recording
device (ApneaLinkTM) for case selection of obstructive sleep apnea. Sleepand Breathing, vol. 13, no. 3, pages 213–219, Aug 2009. (Cited on page 88.)
[Chen 2009b] W. Chen, X. Zhu and T. Nemoto. A new sensory device and optimalposition for monitoring hr/rr during sleep, pages 126–129. Springer BerlinHeidelberg, Berlin, Heidelberg, 2009. (Cited on pages 33 and 36.)
[Chen 2009c] Zhihao Chen, Ju Teng Teo and Xiufeng Yang. In-bed fibre optic
breathing and movement sensor for non-intrusive monitoring. In Proc.SPIE,volume 7173, pages 7173 – 7173 – 6, 2009. (Cited on pages 50 and 54.)
126 Bibliography
[Chen 2012] Zhihao Chen, Ju Teng Teo, Soon Huat Ng and Xiufeng Yang. Portable
fiber optic ballistocardiogram sensor for home use. In Proc.SPIE, volume8218, pages 8218 – 8218 – 7, 2012. (Cited on pages 50, 54, 58 and 59.)
[Chen 2013] Z. Chen, X. Yang, J. T. Teo and S. H. Ng. Noninvasive monitoring of
blood pressure using optical Ballistocardiography and Photoplethysmograph
approaches. In 2013 35th Annual International Conference of the IEEEEngineering in Medicine and Biology Society (EMBC), pages 2425–2428,July 2013. (Cited on pages 50 and 54.)
[Chen 2014a] Z. Chen, J. T. Teo, S. H. Ng, X. Yang, B. Zhou, Y. Zhang, H. P.Loo, H. Zhang and M. Thong. Monitoring respiration and cardiac activity
during sleep using microbend fiber sensor: A clinical study and new algorithm.In 2014 36th Annual International Conference of the IEEE Engineering inMedicine and Biology Society, pages 5377–5380, Aug 2014. (Cited on pages 51and 54.)
[Chen 2014b] Zhihao Chen, Doreen Lau, Ju Teng Teo, Soon Huat Ng, Xiufeng Yangand Pin Lin Kei. Simultaneous measurement of breathing rate and heart
rate using a microbend multimode fiber optic sensor. Journal of BiomedicalOptics, vol. 19, pages 19 – 19 – 11, 2014. (Cited on pages 51, 54, 58 and 59.)
[Chethana 2017] K Chethana, AS Guru Prasad, SN Omkar and S Asokan. Fiber
bragg grating sensor based device for simultaneous measurement of respiratory
and cardiac activities. Journal of biophotonics, vol. 10, no. 2, pages 278–285,2017. (Cited on pages 52 and 54.)
[Choe 2017] Sun-Taag Choe and We-Duke Cho. Simplified real-time heartbeat detec-
tion in ballistocardiography using a dispersion-maximum method. BiomedicalResearch, vol. 28, no. 9, 2017. (Cited on pages 35 and 36.)
[Chow 2000] Patrick Chow, Gangadharan Nagendra, John Abisheganaden and Y TWang. Respiratory monitoring using an air-mattress system. PhysiologicalMeasurement, vol. 21, no. 3, page 345, 2000. (Cited on page 40.)
[Churpek 2016] Matthew M. Churpek, Richa Adhikari and Dana P. Edelson. The
value of vital sign trends for detecting clinical deterioration on the wards.Resuscitation, vol. 102, pages 1 – 5, 2016. (Cited on page 115.)
[Colominas 2012] Marcelo A Colominas, Gastón Schlotthauer, MARÍA E TORRESand Patrick Flandrin. Noise-assisted EMD methods in action. Advancesin Adaptive Data Analysis, vol. 4, no. 04, page 1250025, 2012. (Cited onpage 99.)
[Colominas 2014] Marcelo A. Colominas, Gastón Schlotthauer and María E. Torres.Improved complete ensemble EMD: A suitable tool for biomedical signal
processing. Biomedical Signal Processing and Control, vol. 14, no. SupplementC, pages 19 – 29, 2014. (Cited on page 71.)

Bibliography 127
[Cooke 2011] Jana R Cooke and Sonia Ancoli-Israel. Normal and abnormal sleep in
the elderly. Handbook of clinical neurology/edited by PJ Vinken and GWBruyn, vol. 98, page 653, 2011. (Cited on page 27.)
[Crowley 2013] Kate E Crowley, SM Rajaratnam, Steven A Shea, Lawrence JEpstein, Charles A Czeisler, Steven W Lockleyet al. Evaluation of a single-
channel nasal pressure device to assess obstructive sleep apnea risk in labora-
tory and home environments. J Clin Sleep Med, vol. 9, no. 2, pages 109–116,2013. (Cited on page 88.)
[Davidovich 2016] M. L. Y. Davidovich, R. Karasik, A. Tal and Z. Shinar. Sleep
apnea screening with a contact-free under-the-mattress sensor. In 2016Computing in Cardiology Conference (CinC), pages 849–852, Sept 2016.(Cited on page 24.)
[de Zambotti 2017] Massimiliano de Zambotti, Leonardo Rosas, Ian M. Colrain andFiona C. Baker. The Sleep of the Ring: Comparison of the OURA Sleep
Tracker Against Polysomnography. Behavioral Sleep Medicine, vol. 0, no. 0,pages 1–15, 2017. PMID: 28323455. (Cited on page 20.)
[Deepu 2012] C. J. Deepu, Z. Chen, J. T. Teo, S. H. Ng, X. Yang and Y. Lian. A
smart cushion for real-time heart rate monitoring. In 2012 IEEE BiomedicalCircuits and Systems Conference (BioCAS), pages 53–56, Nov 2012. (Citedon pages 50 and 54.)
[Di Rienzo 2017] Marco Di Rienzo, Emanuele Vaini and Prospero Lombardi. An
algorithm for the beat-to-beat assessment of cardiac mechanics during sleep
on Earth and in microgravity from the seismocardiogram. Scientific Reports,vol. 7, no. 1, page 15634, 2017. (Cited on page 30.)
[Díaz 2017] Camilo AR Díaz, Cátia Leitão, Carlos A Marques, M Fátima Domingues,Nélia Alberto, Maria José Pontes, Anselmo Frizera, Moisés Ribeiro, Paulo SBAndré and Paulo FC Antunes. Low-Cost Interrogation Technique for Dynamic
Measurements with FBG-Based Devices. Sensors, vol. 17, no. 10, page 2414,2017. (Cited on page 50.)
[Dimitrov 2016] Dimiter V Dimitrov. Medical internet of things and big data in
healthcare. Healthcare informatics research, vol. 22, no. 3, pages 156–163,2016. (Cited on page 5.)
[Dziuda 2013a] Ł. Dziuda, M. Krej and F. W. Skibniewski. Fiber Bragg Grating
Strain Sensor Incorporated to Monitor Patient Vital Signs During MRI.IEEE Sensors Journal, vol. 13, no. 12, pages 4986–4991, Dec 2013. (Cited onpages 51 and 54.)
[Dziuda 2013b] Łukasz Dziuda, Franciszek W. Skibniewski, Mariusz Krej andPaulina M. Baran. Fiber Bragg grating-based sensor for monitoring res-
piration and heart activity during magnetic resonance imaging examinations.

128 Bibliography
Journal of Biomedical Optics, vol. 18, pages 18 – 18 – 15, 2013. (Cited onpages 51 and 54.)
[Dziuda 2014] Łukasz Dziuda and Franciszek W. Skibniewski. A new approach to
ballistocardiographic measurements using fibre Bragg grating-based sensors.Biocybernetics and Biomedical Engineering, vol. 34, no. 2, pages 101 – 116,2014. (Cited on pages 51 and 54.)
[Dziuda 2015] Łukasz Dziuda. Fiber-optic sensors for monitoring patient physio-
logical parameters: a review of applicable technologies and relevance to use
during magnetic resonance imaging procedures. Journal of Biomedical Optics,vol. 20, pages 20 – 20 – 23, 2015. (Cited on page 51.)
[Eblen-Zajjur 2003] Antonio Eblen-Zajjur. A simple ballistocardiographic system
for a medical cardiovascular physiology course. Advances in PhysiologyEducation, vol. 27, no. 4, pages 224–229, 2003. (Cited on pages xv and 28.)
[Erdenebayar 2017] Urtnasan Erdenebayar, Jong-Uk Park, Pilsoo Jeong andKyoung-Joung Lee. Obstructive Sleep Apnea Screening Using a Piezo-Electric
Sensor. Journal of Korean medical science, vol. 32, no. 6, pages 893–899,2017. (Cited on page 84.)
[Erman 2007] Milton K Erman, Deirdre Stewart, Daniel Einhorn, Nancy Gordonand Eileen Casal. Validation of the ApneaLink for the screening of sleep
apnea: a novel and simple single-channel recording device. J Clin Sleep Med,vol. 3, no. 4, pages 387–392, 2007. (Cited on page 88.)
[Fajkus 2017a] Marcel Fajkus, Jan Nedoma, Radek Martinek, Vladimir Vasinek,Homer Nazeran and Petr Siska. A non-invasive multichannel hybrid fiber-
optic sensor system for vital sign monitoring. Sensors, vol. 17, no. 1, page111, 2017. (Cited on pages 52 and 54.)
[Fajkus 2017b] Marcel Fajkus, Jan Nedoma, Radek Martinek and Wojciech Wal-endziuk. Comparison of the FBG sensor encapsulated into PDMS and FBG
sensor glued on the plexiglass pad for respiratory and heart rate monitor-
ing. In Photonics Applications in Astronomy, Communications, Industry,and High Energy Physics Experiments 2017, volume 10445, page 104450B.International Society for Optics and Photonics, 2017. (Cited on page 52.)
[feng Hu 2016] Hai feng Hu, Si jia Sun, Ri qing Lv and Yong Zhao. Design and
experiment of an optical fiber micro bend sensor for respiration monitoring.Sensors and Actuators A: Physical, vol. 251, no. Supplement C, pages 126 –133, 2016. (Cited on page 50.)
[Fernandes 2003] F. C. A. Fernandes, R. L. C. van Spaendonck and C. S. Burrus. A
new framework for complex wavelet transforms. IEEE Transactions on SignalProcessing, vol. 51, no. 7, pages 1825–1837, July 2003. (Cited on page 77.)

Bibliography 129
[Gilaberte 2010] S. Gilaberte, J. Gómez-Clapers, R. Casanella and R. Pallas-Areny.Heart and respiratory rate detection on a bathroom scale based on the ballis-
tocardiogram and the continuous wavelet transform. In 2010 Annual Interna-tional Conference of the IEEE Engineering in Medicine and Biology, pages2557–2560, Aug 2010. (Cited on page 75.)
[Giovangrandi 2011] L. Giovangrandi, O. T. Inan, R. M. Wiard, M. Etemadi andG. T. A. Kovacs. Ballistocardiography – A method worth revisiting. In 2011Annual International Conference of the IEEE Engineering in Medicine andBiology Society, pages 4279–4282, Aug 2011. (Cited on page 29.)
[Guerrero 2013] G. Guerrero, J. M. Kortelainen, E. Palacios, A. M. Bianchi,G. Tachino, M. Tenhunen, M. O. Méndez and M. van Gils. Detection
of sleep-disordered breating with Pressure Bed Sensor. In 2013 35th AnnualInternational Conference of the IEEE Engineering in Medicine and BiologySociety (EMBC), pages 1342–1345, July 2013. (Cited on pages 34 and 36.)
[Heise 2010] D. Heise and M. Skubic. Monitoring pulse and respiration with a
non-invasive hydraulic bed sensor. In 2010 Annual International Conferenceof the IEEE Engineering in Medicine and Biology, pages 2119–2123, Aug2010. (Cited on pages 47, 48 and 49.)
[Heise 2011] D. Heise, L. Rosales, M. Skubic and M. J. Devaney. Refinement and
evaluation of a hydraulic bed sensor. In 2011 Annual International Conferenceof the IEEE Engineering in Medicine and Biology Society, pages 4356–4360,Aug 2011. (Cited on pages 47 and 49.)
[Heise 2013] D. Heise, L. Rosales, M. Sheahen, B. Y. Su and M. Skubic. Non-
invasive measurement of heartbeat with a hydraulic bed sensor Progress,
challenges, and opportunities. In 2013 IEEE International Instrumentationand Measurement Technology Conference (I2MTC), pages 397–402, May2013. (Cited on page 48.)
[Hoog Antink 2018] Christoph Hoog Antink, Florian Schulz, Steffen Leonhardtand Marian Walter. Motion Artifact Quantification and Sensor Fusion for
Unobtrusive Health Monitoring. Sensors, vol. 18, no. 1, 2018. (Cited onpage 100.)
[Huang 1998] Norden E Huang, Zheng Shen, Steven R Long, Manli C Wu, Hsing HShih, Quanan Zheng, Nai-Chyuan Yen, Chi Chao Tung and Henry H Liu.The empirical mode decomposition and the Hilbert spectrum for nonlinear
and non-stationary time series analysis. Proceedings of the Royal Societyof London A: Mathematical, Physical and Engineering Sciences, vol. 454,no. 1971, pages 903–995, 1998. (Cited on pages 70 and 71.)
[Huang 2016] Norden E. Huang, Kun Hu, Albert C. C. Yang, Hsing-Chih Chang,Deng Jia, Wei-Kuang Liang, Jia Rong Yeh, Chu-Lan Kao, Chi-Hung Juan,
130 Bibliography
Chung Kang Peng, Johanna H. Meijer, Yung-Hung Wang, Steven R. Longand Zhauhua Wu. On Holo-Hilbert spectral analysis: a full informational
spectral representation for nonlinear and non-stationary data. PhilosophicalTransactions of the Royal Society of London A: Mathematical, Physical andEngineering Sciences, vol. 374, no. 2065, 2016. (Cited on page 71.)
[Hwang 2014] S. H. Hwang, H. J. Lee, H. N. Yoon, D. W. Jung, Y. J. G. Lee, Y. J.Lee, D. U. Jeong and K. S. Park. Unconstrained Sleep Apnea Monitoring
Using Polyvinylidene Fluoride Film-Based Sensor. IEEE Transactions onBiomedical Engineering, vol. 61, no. 7, pages 2125–2134, July 2014. (Citedon pages 84 and 91.)
[Inan 2009] O T Inan, M Etemadi, R M Wiard, L Giovangrandi and G T A Kovacs.Robust ballistocardiogram acquisition for home monitoring. PhysiologicalMeasurement, vol. 30, no. 2, page 169, 2009. (Cited on pages 42 and 46.)
[Inan 2010a] O. T. Inan, M. Etemadi, B. Widrow and G. T. A. Kovacs. Adaptive
Cancellation of Floor Vibrations in Standing Ballistocardiogram Measure-
ments Using a Seismic Sensor as a Noise Reference. IEEE Transactions onBiomedical Engineering, vol. 57, no. 3, pages 722–727, March 2010. (Citedon page 44.)
[Inan 2010b] O. T. Inan, G. T. A. Kovacs and L. Giovangrandi. Evaluating the
Lower-Body Electromyogram Signal Acquired From the Feet As a Noise
Reference for Standing Ballistocardiogram Measurements. IEEE Transactionson Information Technology in Biomedicine, vol. 14, no. 5, pages 1188–1196,Sept 2010. (Cited on page 44.)
[Inan 2015] O. T. Inan, P. F. Migeotte, K. S. Park, M. Etemadi, K. Tavakolian,R. Casanella, J. Zanetti, J. Tank, I. Funtova, G. K. Prisk and M. Di Rienzo.Ballistocardiography and Seismocardiography: A Review of Recent Advances.IEEE Journal of Biomedical and Health Informatics, vol. 19, no. 4, pages1414–1427, July 2015. (Cited on pages 6 and 28.)
[Inan 2018] Omer T. Inan, Maziyar Baran Pouyan, Abdul Q. Javaid, Sean Dowling,Mozziyar Etemadi, Alexis Dorier, J. Alex Heller, A. Ozan Bicen, Shuvo Roy,Teresa De Marco and Liviu Klein. Novel Wearable Seismocardiography and
Machine Learning Algorithms Can Assess Clinical Status of Heart Failure
Patients. Circulation: Heart Failure, vol. 11, no. 1, 2018. (Cited on page 30.)
[Islam 2015] S. M. R. Islam, D. Kwak, M. H. Kabir, M. Hossain and K. S. Kwak.The Internet of Things for Health Care: A Comprehensive Survey. IEEEAccess, vol. 3, pages 678–708, 2015. (Cited on page 5.)
[Jaimchariyatam 2013] Nattapong Jaimchariyatam, Raed A Dweik, Roop Kaw andLoutfi S Aboussouan. Polysomnographic determinants of nocturnal hypercap-
nia in patients with sleep apnea. Journal of clinical sleep medicine: JCSM:

Bibliography 131
official publication of the American Academy of Sleep Medicine, vol. 9, no. 3,page 209, 2013. (Cited on pages xvi and 84.)
[Jennifer 2017] Abbasi Jennifer. In-home, over-the-counter sleep apnea sensor on
the horizon. JAMA, vol. 317, no. 22, page 2271, 2017. (Cited on pages xviand 85.)
[Jeon 2015] LEE Jeon and Joseph Finkelstein. Consumer sleep tracking devices: a
critical review. Digital Healthcare Empowering Europeans: Proceedings ofMIE2015, vol. 210, page 458, 2015. (Cited on pages 19 and 21.)
[Jiao 2016] C. Jiao, P. Lyons, A. Zare, L. Rosales and M. Skubic. Heart beat
characterization from ballistocardiogram signals using extended functions of
multiple instances. In 2016 38th Annual International Conference of theIEEE Engineering in Medicine and Biology Society (EMBC), pages 756–760,Aug 2016. (Cited on pages 48 and 49.)
[Jin 2009] J. Jin, X. Wang, S. Li and Y. Wu. A Novel Heart Rate Detection Algorithm
in Ballistocardiogram Based on Wavelet Transform. In Knowledge Discoveryand Data Mining, 2009. WKDD 2009. Second International Workshop on,pages 76–79, Jan 2009. (Cited on page 75.)
[Junnila 2005] S. Junnila, A. Akhbardeh, A. Varri and T. Koivistoinen. An EMFi-
film sensor based ballistocardiographic chair: performance and cycle extrac-
tion method. In IEEE Workshop on Signal Processing Systems Design andImplementation, 2005., pages 373–377, Nov 2005. (Cited on page 37.)
[Junnila 2006] S. Junnila, A. Akhbardeh, L. C. Barna, I. Defee and A. Varri. A
Wireless Ballistocardiographic Chair. In 2006 International Conference of theIEEE Engineering in Medicine and Biology Society, pages 5932–5935, Aug2006. (Cited on page 37.)
[Kapadia 2009] A. Kapadia, D. Kotz and N. Triandopoulos. Opportunistic sensing:
Security challenges for the new paradigm. In 2009 First International Com-munication Systems and Networks and Workshops, pages 1–10, Jan 2009.(Cited on page 64.)
[Kapur 2017] Vishesh K Kapur, Dennis H Auckley, Susmita Chowdhuri, David CKuhlmann, Reena Mehra, Kannan Ramar and Christopher G Harrod. Clinical
practice guideline for diagnostic testing for adult obstructive sleep apnea: an
American Academy of Sleep Medicine clinical practice guideline. J Clin SleepMed, vol. 13, no. 3, pages 479–504, 2017. (Cited on page 5.)
[Karki 2008] S. Karki and J. Lekkala. Film-type transducer materials PVDF and
EMFi in the measurement of heart and respiration rates. In 2008 30th AnnualInternational Conference of the IEEE Engineering in Medicine and BiologySociety, pages 530–533, Aug 2008. (Cited on pages 38 and 41.)

132 Bibliography
[Kärki 2009] S. Kärki and J. Lekkala. A new method to measure heart rate with
EMFi and PVDF materials. Journal of Medical Engineering & Technology,vol. 33, no. 7, pages 551–558, 2009. (Cited on pages 38 and 41.)
[Katz 2016] Y. Katz, R. Karasik and Z. Shinar. Contact-free piezo electric sensor
used for real-time analysis of inter beat interval series. In 2016 Computing inCardiology Conference (CinC), pages 769–772, Sept 2016. (Cited on pages 34and 36.)
[Kelly 2012] Jessica M Kelly, Robert E Strecker and Matt T Bianchi. Recent
developments in home sleep-monitoring devices. ISRN neurology, vol. 2012,2012. (Cited on pages 19, 20 and 21.)
[Kimoff 2016] R. John Kimoff. 88 - Obstructive Sleep Apnea. In V. CourtneyBroaddus, Robert J. Mason, Joel D. Ernst, Talmadge E. King, Stephen C.Lazarus, John F. Murray, Jay A. Nadel, Arthur S. Slutsky and Michael B.Gotway, editors, Murray and Nadel’s Textbook of Respiratory Medicine(Sixth Edition), pages 1552 – 1568.e9. W.B. Saunders, Philadelphia, 2016.(Cited on pages 5 and 83.)
[Koenig 2008] Steven M. Koenig, David Mack and Majd Alwan. Sleep and sleepassessment technologies, pages 77–120. Humana Press, Totowa, NJ, 2008.(Cited on pages 2, 15, 18 and 84.)
[Koivistoinen 2004] T. Koivistoinen, S. Junnila, A. Varri and T. Koobi. A new
method for measuring the ballistocardiogram using EMFi sensors in a normal
chair. In The 26th Annual International Conference of the IEEE Engineeringin Medicine and Biology Society, volume 1, pages 2026–2029, Sept 2004.(Cited on page 37.)
[Kolla 2016] Bhanu Prakash Kolla, Subir Mansukhani and Meghna P. Mansukhani.Consumer sleep tracking devices: a review of mechanisms, validity and utility.Expert Review of Medical Devices, vol. 13, no. 5, pages 497–506, 2016. PMID:27043070. (Cited on pages 19, 20, 21 and 22.)
[Korhonen 2003] I. Korhonen, J. Parkka and M. Van Gils. Health monitoring in the
home of the future. IEEE Engineering in Medicine and Biology Magazine,vol. 22, no. 3, pages 66–73, May 2003. (Cited on page 4.)
[Kortelainen 2007] J. M. Kortelainen and J. Virkkala. FFT averaging of multichan-
nel BCG signals from bed mattress sensor to improve estimation of heart
beat interval. In 2007 29th Annual International Conference of the IEEEEngineering in Medicine and Biology Society, pages 6685–6688, Aug 2007.(Cited on pages 37, 41 and 81.)
[Kortelainen 2010] J. M. Kortelainen, M. O. Mendez, A. M. Bianchi, M. Matteucciand S. Cerutti. Sleep Staging Based on Signals Acquired Through Bed Sensor.
Bibliography 133
IEEE Transactions on Information Technology in Biomedicine, vol. 14, no. 3,pages 776–785, May 2010. (Cited on page 89.)
[Kortelainen 2012] J. M. Kortelainen, M. van Gils and J. Pärkkä. Multichannel
bed pressure sensor for sleep monitoring. In 2012 Computing in Cardiology,pages 313–316, Sept 2012. (Cited on pages 33, 34, 36 and 81.)
[Kouroupetroglou 2014] C. Kouroupetroglou. Enhancing the human experiencethrough assistive technologies and e-accessibility. Advances in Medical Tech-nologies and Clinical Practice:. IGI Global, 2014. (Cited on page 22.)
[Krej 2015] M. Krej, Ł. Dziuda and F. W. Skibniewski. A Method of Detecting
Heartbeat Locations in the Ballistocardiographic Signal From the Fiber-Optic
Vital Signs Sensor. IEEE Journal of Biomedical and Health Informatics,vol. 19, no. 4, pages 1443–1450, July 2015. (Cited on pages 51 and 54.)
[Kurihara 2012] Y. Kurihara and K. Watanabe. Development of Unconstrained
Heartbeat and Respiration Measurement System With Pneumatic Flow. IEEETransactions on Biomedical Circuits and Systems, vol. 6, no. 6, pages 596–604,Dec 2012. (Cited on pages 40 and 43.)
[Lagakos 1987] Nicholas Lagakos, J. H. Cole and J. A. Bucaro. Microbend fiber-optic
sensor. Appl. Opt., vol. 26, no. 11, pages 2171–2180, Jun 1987. (Cited onpage 50.)
[Lau 2013] D. Lau, Z. Chen, J. T. Teo, S. H. Ng, H. Rumpel, Y. Lian, H. Yang andP. L. Kei. Intensity-Modulated Microbend Fiber Optic Sensor for Respiratory
Monitoring and Gating During MRI. IEEE Transactions on BiomedicalEngineering, vol. 60, no. 9, pages 2655–2662, Sept 2013. (Cited on pages 50,54, 58 and 59.)
[Lee 2012] S.I. Lee, C. Ling, A. Nahapetian and M. Sarrafzadeh. A mechanism for
data quality estimation of on-body cardiac sensor networks. In ConsumerCommunications and Networking Conference (CCNC), 2012 IEEE, pages194–198, Jan 2012. (Cited on page 64.)
[Lee 2016] Won Kyu Lee, Heenam Yoon, Chungmin Han, Kwang Min Joo andKwang Suk Park. Physiological signal monitoring bed for infants based on
load-cell sensors. Sensors, vol. 16, no. 3, page 409, 2016. (Cited on pages 45and 46.)
[Lin 2017a] F. Lin, Y. Zhuang, C. Song, A. Wang, Y. Li, C. Gu, C. Li and W. Xu.SleepSense: A Noncontact and Cost-Effective Sleep Monitoring System. IEEETransactions on Biomedical Circuits and Systems, vol. 11, no. 1, pages 189–202, Feb 2017. (Cited on page 89.)
[Lin 2017b] Y. Y. Lin, H. T. Wu, C. A. Hsu, P. C. Huang, Y. H. Huang and Y. L.Lo. Sleep Apnea Detection Based on Thoracic and Abdominal Movement
134 Bibliography
Signals of Wearable Piezoelectric Bands. IEEE Journal of Biomedical andHealth Informatics, vol. 21, no. 6, pages 1533–1545, Nov 2017. (Cited onpage 84.)
[Liu 2016] Lili Liu, Eleni Stroulia, Ioanis Nikolaidis, Antonio Miguel-Cruz andAdriana Rios Rincon. Smart homes and home health monitoring technologies
for older adults: A systematic review. International Journal of MedicalInformatics, vol. 91, no. Supplement C, pages 44 – 59, 2016. (Cited onpage 4.)
[Liu 2017a] Mengxing Liu, Feng Jiang, He Jiang, Shuming Ye and Hang Chen. Low-
power, noninvasive measurement system for wearable ballistocardiography in
sitting and standing positions. Computers in Industry, vol. 91, no. SupplementC, pages 24 – 32, 2017. (Cited on pages 35 and 36.)
[Liu 2017b] Yuhao Liu, Matt Pharr and Giovanni Antonio Salvatore. Lab-on-Skin: A
Review of Flexible and Stretchable Electronics for Wearable Health Monitoring.ACS Nano, vol. 11, no. 10, pages 9614–9635, 2017. PMID: 28901746. (Citedon page 18.)
[Luo 1999] Fei Luo, Jingyuan Liu, Naibing Ma and T.F. Morse. A fiber optic
microbend sensor for distributed sensing application in the structural strain
monitoring. Sensors and Actuators A: Physical, vol. 75, no. 1, pages 41 – 44,1999. (Cited on page 50.)
[Lydon 2015] K. Lydon, B. Y. Su, L. Rosales, M. Enayati, K. C. Ho, M. Rantzand M. Skubic. Robust heartbeat detection from in-home ballistocardiogram
signals of older adults using a bed sensor. In 2015 37th Annual InternationalConference of the IEEE Engineering in Medicine and Biology Society (EMBC),pages 7175–7179, Aug 2015. (Cited on pages 48 and 49.)
[Mack 2002] David C. Mack, Steve W. Kell, Majd Alwan, Beverely Turner andRobin A. Felder. Non-Invasive Analysis of Physiological Signals (NAPS): A
Low-Cost, Passive Monitor for Sleep Quality and Related Applications. InCarillion Biomedical Institute Steps to Success Conference, Roanoke, VA:Carillion Biomedical Institute, October 2002. (Cited on page 84.)
[Mack 2003] D Mack, S Kell, Majd Alwan, Beverely Turner and R Felder. Non-
invasive analysis of physiological signals (naps): A vibration sensor that
passively detects heart and respiration rates as part of a sensor suite for
medical monitoring. In Summer Bioengineering Conference, pages 25–29,2003. (Cited on page 84.)
[Mack 2006] D. C. Mack, M. Alwan, B. Turner, P. Suratt and R. A. Felder. A Passive
and Portable System for Monitoring Heart Rate and Detecting Sleep Apnea
and Arousals: Preliminary Validation. In 1st Transdisciplinary Conference

Bibliography 135
on Distributed Diagnosis and Home Healthcare, 2006. D2H2., pages 51–54,April 2006. (Cited on page 84.)
[Mack 2009] D. C. Mack, J. T. Patrie, P. M. Suratt, R. A. Felder and M. Alwan.Development and Preliminary Validation of Heart Rate and Breathing Rate
Detection Using a Passive, Ballistocardiography-Based Sleep Monitoring
System. IEEE Transactions on Information Technology in Biomedicine,vol. 13, no. 1, pages 111–120, Jan 2009. (Cited on page 84.)
[Mallat 1989] S. G. Mallat. A theory for multiresolution signal decomposition: the
wavelet representation. IEEE Transactions on Pattern Analysis and MachineIntelligence, vol. 11, no. 7, pages 674–693, Jul 1989. (Cited on page 77.)
[Martín-Yebra 2015] A. Martín-Yebra, F. Landreani, C. Casellato, E. Pavan,C. Frigo, P. F. Migeotte and E. G. Caiani. Studying heart rate variability from
ballistocardiography acquired by force platform: Comparison with conventional
ECG. In 2015 Computing in Cardiology Conference (CinC), pages 929–932,Sept 2015. (Cited on pages 34 and 36.)
[Mihailidis 2011] Alex Mihailidis, Jennifer Boger, Jesse Hoey and Tizneem Jiancaro.Zero effort technologies: Considerations, challenges, and use in health, well-
ness, and rehabilitation. Synthesis Lectures on Assistive, Rehabilitative, andHealth-Preserving Technologies, vol. 1, no. 2, pages 1–94, 2011. (Cited onpage 1.)
[Moghadas 2010] Amin A. Moghadas and Mehdi Shadaram. Fiber Bragg Grat-
ing Sensor for Fault Detection in Radial and Network Transmission Lines.Sensors, vol. 10, no. 10, pages 9407–9423, 2010. (Cited on page 50.)
[Nedoma 2017] Jan Nedoma, Marcel Fajkus, Radek Martinek, Stanislav Kepak,Jakub Cubik, Stanislav Zabka and Vladimir Vasinek. Comparison of BCG,
PCG and ECG signals in application of heart rate monitoring of the human
body. In Telecommunications and Signal Processing (TSP), 2017 40th In-ternational Conference on, pages 420–424. IEEE, 2017. (Cited on pages 52and 54.)
[Ng 2009] SSS Ng, T-O Chan, K-W To, J Ngai, A Tung, FWS Ko and DSC Hui.Validation of a portable recording device (ApneaLink) for identifying patients
with suspected obstructive sleep apnoea syndrome. Internal medicine journal,vol. 39, no. 11, pages 757–762, 2009. (Cited on page 88.)
[Ni 2017] Hongbo Ni, Mingjie He, Guoxing Xu, Yalong Song and Xingshe Zhou.Extracting heartbeat intervals using self-adaptive method based on ballisto-cardiography(bcg), pages 37–47. Springer International Publishing, Cham,2017. (Cited on page 69.)
136 Bibliography
[Niewolny 2013] David Niewolny. How the Internet of Things Is Revolutionizing
Healthcare. Healthcare Segment Manager, Freescale Semiconductor, October2013. (Cited on pages 2 and 5.)
[Niizeki 2005] K. Niizeki, I. Nishidate, K. Uchida and M. Kuwahara. Unconstrained
cardiorespiratory and body movement monitoring system for home care. Med-ical and Biological Engineering and Computing, vol. 43, no. 6, pages 716–724,Nov 2005. (Cited on pages 31 and 36.)
[Noh 2010] Yun-Hong Noh, Soo-Young Ye and Do-Un Jeong. Development of
the BCG feature extraction methods for unconstrained heart monitoring.In Computer Sciences and Convergence Information Technology (ICCIT),2010 5th International Conference on, pages 923–928, Nov 2010. (Cited onpage 75.)
[Nukaya 2012] S. Nukaya, T. Shino, Y. Kurihara, K. Watanabe and H. Tanaka.Noninvasive Bed Sensing of Human Biosignals Via Piezoceramic Devices
Sandwiched Between the Floor and Bed. IEEE Sensors Journal, vol. 12, no. 3,pages 431–438, March 2012. (Cited on page 45.)
[Ong 2016] Adrian A. Ong and M. Boyd Gillespie. Overview of smartphone ap-
plications for sleep analysis. World Journal of Otorhinolaryngology-Headand Neck Surgery, vol. 2, no. 1, pages 45 – 49, 2016. (Cited on pages 19, 20and 21.)
[Oppenheim 2004] A. V. Oppenheim and R. W. Schafer. From frequency to que-
frency: a history of the cepstrum. IEEE Signal Processing Magazine, vol. 21,no. 5, pages 95–106, Sept 2004. (Cited on page 80.)
[Paalasmaa 2008] Joonas Paalasmaa and Mika Ranta. Detecting heartbeats in the
ballistocardiogram with clustering. In Proceedings of the ICML/UAI/COLT2008 Workshop on Machine Learning for Health-Care Applications, Helsinki,Finland, volume 9, 2008. (Cited on pages 32 and 36.)
[Paalasmaa 2012] J. Paalasmaa, M. Waris, H. Toivonen, L. Leppäkorpi and M. Parti-nen. Unobtrusive online monitoring of sleep at home. In 2012 Annual In-ternational Conference of the IEEE Engineering in Medicine and BiologySociety, pages 3784–3788, Aug 2012. (Cited on pages 32 and 36.)
[Paalasmaa 2015] J. Paalasmaa, H. Toivonen and M. Partinen. Adaptive Heartbeat
Modeling for Beat-to-Beat Heart Rate Measurement in Ballistocardiograms.IEEE Journal of Biomedical and Health Informatics, vol. 19, no. 6, pages1945–1952, Nov 2015. (Cited on pages 32 and 36.)
[Park 2018] Kwang Suk Park and Heenam Yoon. Ballistocardiography, pages 127–155. Springer International Publishing, Cham, 2018. (Cited on pages 6and 65.)
Bibliography 137
[Peppard 2013] Paul E. Peppard, Terry Young, Jodi H. Barnet, Mari Palta, Erika W.Hagen and Khin Mae Hla. Increased Prevalence of Sleep-Disordered Breathing
in Adults. American Journal of Epidemiology, vol. 177, no. 9, pages 1006–1014,2013. (Cited on page 83.)
[Percival 2006] Donald B Percival and Andrew T Walden. Wavelet methods fortime series analysis, volume 4. Cambridge university press, 2006. (Cited onpages 76, 77 and 78.)
[Pinheiro 2009] Eduardo Pinheiro, Octavian Postolache and Pedro Girão. Blood
pressure and heart rate variabilities estimation using ballistocardiography. InProceedings of the 7th Conf. on. Telecom, pages 125–128, 2009. (Cited onpages 38 and 41.)
[Pinheiro 2010a] E. C. Pinheiro, O. A. Postolache and P. S. Girão. Online heart
rate estimation in unstable ballistocardiographic records. In 2010 AnnualInternational Conference of the IEEE Engineering in Medicine and Biology,pages 939–942, Aug 2010. (Cited on pages 38, 41 and 69.)
[Pinheiro 2010b] Eduardo Pinheiro, Octavian Postolache and Pedro Girão. Theory
and developments in an unobtrusive cardiovascular system representation:
ballistocardiography. The open biomedical engineering journal, vol. 4, page201, 2010. (Cited on pages xv, xix, 28 and 30.)
[Pinheiro 2012] Eduardo Pinheiro, Octavian Postolache and Pedro Girão. Study on
ballistocardiogram acquisition in a moving wheelchair with embedded sensors.Metrology and Measurement Systems, vol. 19, no. 4, pages 739–750, 2012.(Cited on pages 33 and 36.)
[Pino 2015] E. J. Pino, J. A. P. Chávez and P. Aqueveque. Noninvasive ambulatory
measurement system of cardiac activity. In 2015 37th Annual InternationalConference of the IEEE Engineering in Medicine and Biology Society (EMBC),pages 7622–7625, Aug 2015. (Cited on pages 39 and 41.)
[Pino 2016] E. J. Pino, C. Larsen, J. Chavez and P. Aqueveque. Non-invasive BCG
monitoring for non-traditional settings. In 2016 38th Annual InternationalConference of the IEEE Engineering in Medicine and Biology Society (EMBC),pages 4776–4779, Aug 2016. (Cited on pages 39 and 41.)
[Poeggel 2015] Sven Poeggel, Daniele Tosi, DineshBabu Duraibabu, Gabriel Leen,Deirdre McGrath and Elfed Lewis. Optical Fibre Pressure Sensors in Medical
Applications. Sensors, vol. 15, no. 7, pages 17115–17148, 2015. (Cited onpage 50.)
[Rashidi 2013] P. Rashidi and A. Mihailidis. A Survey on Ambient-Assisted Living
Tools for Older Adults. IEEE Journal of Biomedical and Health Informatics,vol. 17, no. 3, pages 579–590, May 2013. (Cited on page 4.)

138 Bibliography
[Ricart 2017] Ender Ricart, Thomas F. Osborne, Leonid A. Gavrilov and Gavin W.Hougham. Current Major Challenges in Aging and Targets for Technology.In Diane Chau and Thomas Osborne, editors, Using Technology to ImproveCare of Older Adults, chapter 1, pages 1–18. Springer Publishing Company,New York, 1 édition, 2017. (Cited on pages 3, 4 and 5.)
[Rilling 2003] G. Rilling, P. Flandrin and P. Gonçalves. On empirical mode decom-
position and its algorithms. In Proceedings of IEEE-EURASIP Workshop onNonlinear Signal and Image Processing NSIP-03, Grado (Italy), June 2003.(Cited on pages 71 and 72.)
[Rogers 2010] K. Rogers. The respiratory system. Human body. Britannica Educa-tional Pub., 2010. (Cited on page 12.)
[Rosales 2012] L. Rosales, M. Skubic, D. Heise, M. J. Devaney and M. Schaumburg.Heartbeat detection from a hydraulic bed sensor using a clustering approach.In 2012 Annual International Conference of the IEEE Engineering in Medicineand Biology Society, pages 2383–2387, Aug 2012. (Cited on pages 47, 48and 49.)
[Rosales 2017] Licet Rosales, Bo Yu Su, Marjorie Skubic and KC Ho. Heart rate
monitoring using hydraulic bed sensor ballistocardiogram1. Journal of AmbientIntelligence and Smart Environments, vol. 9, no. 2, pages 193–207, 2017.(Cited on pages 48 and 49.)
[Russo 2015] Kathryn Russo, Balaji Goparaju and Matt T Bianchi. Consumer sleep
monitors: is there a baby in the bathwater? Nature and science of sleep,vol. 7, page 147, 2015. (Cited on pages 19 and 21.)
[Sadek 2015] I. Sadek, J. Biswas, V. F. S. Fook and M. Mokhtari. Automatic heart
rate detection from FBG sensors using sensor fusion and enhanced empirical
mode decomposition. In 2015 IEEE International Symposium on SignalProcessing and Information Technology (ISSPIT), pages 349–353, Dec 2015.(Cited on pages 69 and 101.)
[Sadek 2016] I. Sadek, J. Biswas, Z. Yongwei, Z. Haihong, J. Maniyeri, C. Zhihao,T. J. Teng, N. S. Huat and M. Mokhtari. Sensor data quality processing
for vital signs with opportunistic ambient sensing. In 2016 38th AnnualInternational Conference of the IEEE Engineering in Medicine and BiologySociety (EMBC), pages 2484–2487, Aug 2016. (Cited on page 64.)
[Sadek 2017a] I. Sadek, J. Biswas, B. Abdulrazak, Z. Haihong and M. Mokhtari.Continuous and unconstrained vital signs monitoring with ballistocardiogram
sensors in headrest position. In 2017 IEEE EMBS International Conferenceon Biomedical Health Informatics (BHI), pages 289–292, Feb 2017. (Citedon pages 7, 90 and 101.)

Bibliography 139
[Sadek 2017b] Ibrahim Sadek, Joaquim Bellmunt, Martin Kodyš, Bessam Abdul-razak and Mounir Mokhtari. Novel unobtrusive approach for sleep monitoringusing fiber optics in an ambient assisted living platform, pages 48–60. SpringerInternational Publishing, Cham, 2017. (Cited on page 1.)
[Sadek 2018a] I. Sadek, E. Seet, J. Biswas, B. Abdulrazak and M. Mokhtari. Non-
intrusive Vital Signs Monitoring for Sleep Apnea Patients: A Preliminary
Study. IEEE Access, vol. 6, pages 2506–2514, 2018. (Cited on page 91.)
[Sadek 2018b] Ibrahim Sadek. Nonintrusive Vital Signs Monitoring for Sleep Apnea
Patients: A Preliminary Study. https://www.codeocean.com/, January2018. (Cited on page 107.)
[Sanchez 2017] Veralia Gabriela Sanchez, Carlos F Pfeiffer and Nils-Olav Skeie. A
Review of Smart House Analysis Methods for Assisting Older People Living
Alone. Journal of Sensor and Actuator Networks, vol. 6, no. 3, page 11, 2017.(Cited on page 27.)
[Scarborough 1956] William R Scarborough, Samuel A Talbot, John R Braunstein,Maurice B Rappaport, William Dock, WF Hamilton, John E Smith, John LNickerson and Isaac Starr. Proposals for ballistocardiographic nomenclature
and conventions: revised and extended. Circulation, vol. 14, no. 3, pages435–450, 1956. (Cited on pages xix and 30.)
[Scholten 2011] Johan Scholten and Pascal Bakker. Opportunistic Sensing in Train
Safety Systems. International journal on advances in networks and services,vol. 4, no. 3-4, pages 353–362, 2011. (Cited on page 64.)
[Schumm 2010] Johannes Schumm. Quality assessment of physiological signalsduring ambulatory measurements. Ph.D. dissertation, ETH Zurich, 2010.(Cited on page 64.)
[Seebo 2017] Seebo. Smart Sleep: Using Smart Technology to Monitor and Improve
Sleep. https://blog.seebo.com/smart-sleep-monitor-tracking/, Octo-ber 2017. (Accessed on 10/10/2017). (Cited on page 15.)
[Sela 2016] I. Sela, Z. Shinar and K. Tavakolian. Measuring left ventricular ejection
time using under-the-mattress sensor. In 2016 Computing in CardiologyConference (CinC), pages 665–668, Sept 2016. (Cited on pages 35 and 36.)
[Senaratna 2017] Chamara V. Senaratna, Jennifer L. Perret, Caroline J. Lodge,Adrian J. Lowe, Brittany E. Campbell, Melanie C. Matheson, Garun S.Hamilton and Shyamali C. Dharmage. Prevalence of obstructive sleep apnea
in the general population: A systematic review. Sleep Medicine Reviews,vol. 34, pages 70 – 81, 2017. (Cited on page 83.)
[Seo 2017] Youngmin Seo, Yunyoung Choi and Jeongwoo Choi. River Stage Modeling
by Combining Maximal Overlap Discrete Wavelet Transform, Support Vector

140 Bibliography
Machines and Genetic Algorithm. Water, vol. 9, no. 7, page 525, 2017. (Citedon page 77.)
[Shin 2006] Jaehyuk Shin, Youngjoon Chee and Kwangsuk Park. Long-term sleep
monitoring system and long-term sleep parameters using unconstrained
method. In Intl. Special Topic Conf. on Info. Tech. in BME, Ioannina-Epirus,Greece, 2006. (Cited on pages 40 and 43.)
[Shin 2010] J. H. Shin, Y. J. Chee, D. U. Jeong and K. S. Park. Nonconstrained
Sleep Monitoring System and Algorithms Using Air-Mattress With Balancing
Tube Method. IEEE Transactions on Information Technology in Biomedicine,vol. 14, no. 1, pages 147–156, Jan 2010. (Cited on pages 42, 43 and 89.)
[Starr 1939] Isaac Starr, AJ Rawson, HA Schroeder and NR Joseph. Studies on the
estimation of cardiac output in man, and of abnormalities in cardiac func-
tion, from the heart9s recoil and the blood9s impacts; the ballistocardiogram.American Journal of Physiology–Legacy Content, vol. 127, no. 1, pages 1–28,1939. (Cited on pages xv and 28.)
[Starr 1940] Isaac Starr and Henry A Schroeder. Ballistocardiogram. II. Normal
standards, abnormalities commonly found in diseases of the heart and circu-
lation, and their significance. Journal of Clinical Investigation, vol. 19, no. 3,page 437, 1940. (Cited on pages xv and 28.)
[Story 2017] L. Story. Pathophysiology: A practical approach. Jones & BartlettLearning, 2017. (Cited on page 11.)
[Su 2012] B. Y. Su, K. C. Ho, M. Skubic and L. Rosales. Pulse rate estimation
using hydraulic bed sensor. In 2012 Annual International Conference of theIEEE Engineering in Medicine and Biology Society, pages 2587–2590, Aug2012. (Cited on pages 47, 48 and 49.)
[Tal 2017] Asher Tal, Zvika Shinar, David Shaki, Shlomi Codish and Aviv Gold-bart. Validation of contact-free sleep monitoring device with comparison to
polysomnography. J Clin Sleep Med, vol. 13, no. 3, pages 517–522, 2017.(Cited on page 24.)
[Tiberghien 2011] Thibaut Tiberghien, Mounir Mokhtari, Hamdi Aloulou, JitBiswas, Jiaqi Zhu and Vwen Yen Lee. Handling User Interface Plasticity
in Assistive Environment: UbiSMART Framework. In Bessam Abdulrazak,Sylvain Giroux, Bruno Bouchard, Hélène Pigot and Mounir Mokhtari, editors,Toward Useful Services for Elderly and People with Disabilities: 9th Inter-national Conference on Smart Homes and Health Telematics, ICOST 2011,Montreal, Canada, June 20-22, 2011. Proceedings, pages 256–260. SpringerBerlin Heidelberg, Berlin, Heidelberg, 2011. (Cited on page 60.)
[Torres 2011] M.E. Torres, M.A. Colominas, G. Schlotthauer and P. Flandrin. A
complete ensemble empirical mode decomposition with adaptive noise. In
Bibliography 141
Acoustics, Speech and Signal Processing (ICASSP), 2011 IEEE InternationalConference on, pages 4144–4147, May 2011. (Cited on page 71.)
[Tortora 2008] G.J. Tortora and B.H. Derrickson. Principles of anatomy and physi-ology. John Wiley & Sons, 2008. (Cited on pages 10 and 11.)
[United Nations 2017] Department of Economic United Nations and Population Di-vision (2017) Social Affairs. World Population Prospects: The 2017 Revision,
Key Findings and Advance Tables. ESA/P/WP/248, 2017. (Cited on page 2.)
[van Hoof 2011] J. van Hoof, H.S.M. Kort, P.G.S. Rutten and M.S.H. Duijnstee.Ageing-in-place with the use of ambient intelligence technology: Perspectives
of older users. International Journal of Medical Informatics, vol. 80, no. 5,pages 310 – 331, 2011. (Cited on page 4.)
[Vehkaoja 2013] Antti Vehkaoja, Satu Rajala, Pekka Kumpulainen and JukkaLekkala. Correlation approach for the detection of the heartbeat intervals
using force sensors placed under the bed posts. Journal of Medical Engineering& Technology, vol. 37, no. 5, pages 327–333, 2013. (Cited on pages 45 and 46.)
[Vogt 2012] Emelie Vogt, David MacQuarrie and John Patrick Neary. Using ballis-
tocardiography to measure cardiac performance: a brief review of its history
and future significance. Clinical Physiology and Functional Imaging, vol. 32,no. 6, pages 415–420, 2012. (Cited on page 29.)
[Waltisberg 2017] D. Waltisberg, O. Amft, D. P. Brunner and G. Tröster. Detecting
Disordered Breathing and Limb Movement Using In-Bed Force Sensors. IEEEJournal of Biomedical and Health Informatics, vol. 21, no. 4, pages 930–938,July 2017. (Cited on page 85.)
[Wang 2002] J.Y. Wang. A new method for evaluating ECG signal quality for multi-
lead arrhythmia analysis. In Computers in Cardiology, 2002, pages 85–88,Sept 2002. (Cited on page 64.)
[Wang 2003] Feng Wang, Mami Tanaka and Seiji Chonan. Development of a PVDF
Piezopolymer Sensor for Unconstrained In-Sleep Cardiorespiratory Monitor-
ing. Journal of Intelligent Material Systems and Structures, vol. 14, no. 3,pages 185–190, 2003. (Cited on pages 31 and 36.)
[Wang 2007] Feng Wang, Yanhui Zou, Mami Tanaka, Tadashi Matsuda and SeijiChonan. Unconstrained cardiorespiratory monitor for premature infants.International Journal of Applied Electromagnetics and Mechanics, vol. 25,no. 1-4, pages 469–475, 2007. (Cited on pages 31 and 36.)
[Wang 2017] Zhu Wang, Xingshe Zhou, Weichao Zhao, Fan Liu, Hongbo Ni andZhiwen Yu. Assessing the severity of sleep apnea syndrome based on bal-
listocardiogram. PloS one, vol. 12, no. 4, page e0175351, 2017. (Cited onpage 84.)
142 Bibliography
[Watanabe 2004] T. Watanabe and K. Watanabe. Noncontact method for sleep
stage estimation. IEEE Transactions on Biomedical Engineering, vol. 51,no. 10, pages 1735–1748, Oct 2004. (Cited on pages 40 and 89.)
[Watanabe 2005] K. Watanabe, T. Watanabe, H. Watanabe, H. Ando, T. Ishikawaand K. Kobayashi. Noninvasive measurement of heartbeat, respiration, snor-
ing and body movements of a subject in bed via a pneumatic method. IEEETransactions on Biomedical Engineering, vol. 52, no. 12, pages 2100–2107,Dec 2005. (Cited on pages 40 and 43.)
[Wiard 2011] Richard M. Wiard, Omer T. Inan, Brian Argyres, Mozziyar Etemadi,Gregory T. A. Kovacs and Laurent Giovangrandi. Automatic detection of
motion artifacts in the ballistocardiogram measured on a modified bathroom
scale. Medical & Biological Engineering & Computing, vol. 49, no. 2, pages213–220, Feb 2011. (Cited on page 44.)
[Wiles 2012] Janine L. Wiles, Annette Leibing, Nancy Guberman, Jeanne Reeveand Ruth E. S. Allen. The Meaning of “Aging in Place” to Older People.The Gerontologist, vol. 52, no. 3, pages 357–366, 2012. (Cited on page 3.)
[Wu 2009a] Zhaohua Wu and Norden E Huang. Ensemble empirical mode decom-
position: a noise-assisted data analysis method. Advances in adaptive dataanalysis, vol. 1, no. 01, pages 1–41, 2009. (Cited on page 71.)
[Wu 2009b] Zhaohua Wu and Norden E Huang. Ensemble empirical mode decom-
position: a noise-assisted data analysis method. Advances in adaptive dataanalysis, vol. 1, no. 01, pages 1–41, 2009. (Cited on page 99.)
[Xin 2016] Yi Xin, Chao Guo, Xiaohui Qi, Hongying Tian, Xiang Li, Qiang Dai,Shuhong Wang and Cheng Wang. Wearable and unconstrained systems
based on PVDF sensors in physiological signals monitoring: A brief review.Ferroelectrics, vol. 500, no. 1, pages 291–300, 2016. (Cited on page 31.)
[Zaunseder 2017] S. Zaunseder, A. Henning, D. Wedekind, A. Trumpp and H. Mal-berg. Unobtrusive acquisition of cardiorespiratory signals. Somnologie, vol. 21,no. 2, pages 93–100, Jun 2017. (Cited on page 22.)
[Zheng 2014] Y. L. Zheng, X. R. Ding, C. C. Y. Poon, B. P. L. Lo, H. Zhang, X. L.Zhou, G. Z. Yang, N. Zhao and Y. T. Zhang. Unobtrusive Sensing and
Wearable Devices for Health Informatics. IEEE Transactions on BiomedicalEngineering, vol. 61, no. 5, pages 1538–1554, May 2014. (Cited on page 5.)
[Zhu 2013] Y. Zhu, H. Zhang, M. Jayachandran, A. K. Ng, J. Biswas and Z. Chen.Ballistocardiography with fiber optic sensor in headrest position: A feasibility
study and a new processing algorithm. In 2013 35th Annual InternationalConference of the IEEE Engineering in Medicine and Biology Society (EMBC),pages 5203–5206, July 2013. (Cited on pages 51 and 54.)
Bibliography 143
[Zhu 2014] Y. Zhu, V. F. S. Fook, E. H. Jianzhong, J. Maniyeri, C. Guan, H. Zhang,E. P. Jiliang and J. Biswas. Heart rate estimation from FBG sensors using
cepstrum analysis and sensor fusion. In 2014 36th Annual InternationalConference of the IEEE Engineering in Medicine and Biology Society, pages5365–5368, Aug 2014. (Cited on pages 52, 54 and 81.)
[Zhu 2015] Y. Zhu, J. Maniyeri, V. F. S. Fook and H. Zhang. Estimating respiratory
rate from FBG optical sensors by using signal quality measurement. In 201537th Annual International Conference of the IEEE Engineering in Medicineand Biology Society (EMBC), pages 853–856, Aug 2015. (Cited on pages 52and 54.)
[Zink 2015] Matthias Daniel Zink, Christoph Brüser, Patrick Winnersbach, AndreasNapp, Steffen Leonhardt, Nikolaus Marx, Patrick Schauerte and Karl Mischke.Heartbeat cycle length detection by a ballistocardiographic sensor in atrial
fibrillation and sinus rhythm. BioMed research international, vol. 2015, 2015.(Cited on pages 39 and 41.)
[Zink 2017] Matthias Daniel Zink, Christoph Brüser, Björn-Ole Stüben, AndreasNapp, Robert Stöhr, Steffen Leonhardt, Nikolaus Marx, Karl Mischke, Jörg BSchulz and Johannes Schiefer. Unobtrusive Nocturnal Heartbeat Monitoring
by a Ballistocardiographic Sensor in Patients with Sleep Disordered Breathing.Scientific Reports, vol. 7, no. 1, page 13175, 2017. (Cited on pages 39 and 41.)
Copyright © 2022 FDOKUMEN