Nonintrusive Nocturnal Remote Monitoring of Vital Signs in ...
Upload
independentCategory
view
1download
0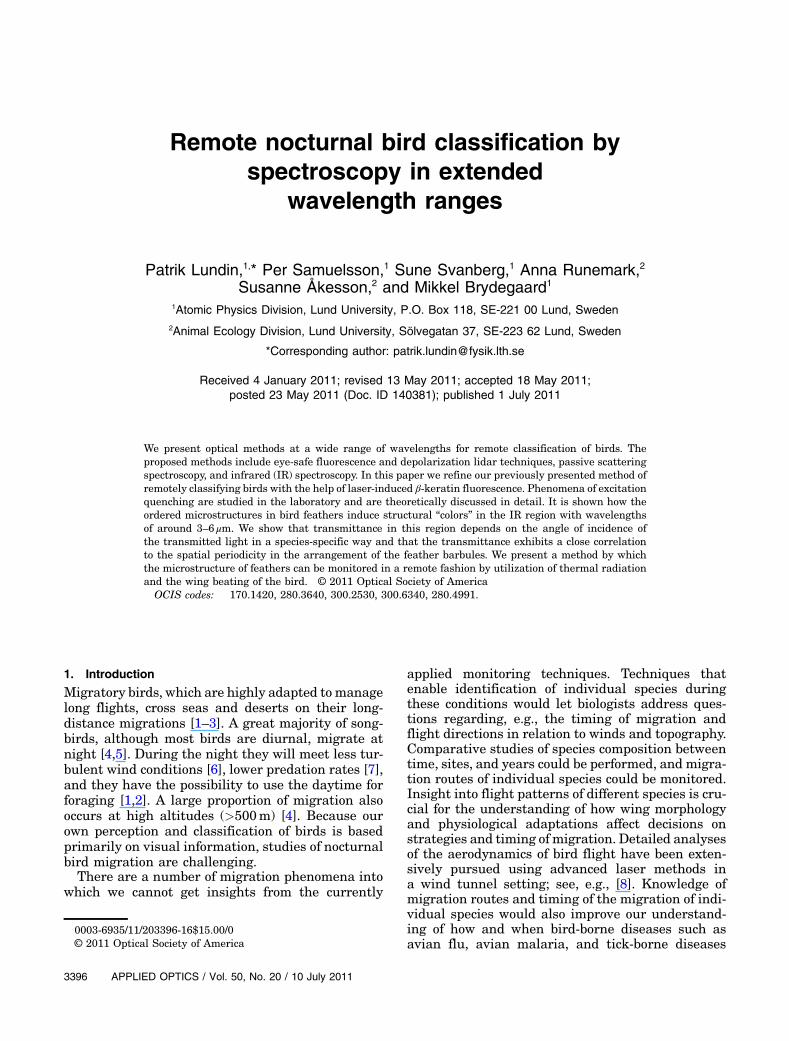
Remote nocturnal bird classification byspectroscopy in extended
wavelength ranges
Patrik Lundin,1,* Per Samuelsson,1 Sune Svanberg,1 Anna Runemark,2
Susanne Åkesson,2 and Mikkel Brydegaard1
1Atomic Physics Division, Lund University, P.O. Box 118, SE-221 00 Lund, Sweden2Animal Ecology Division, Lund University, Sölvegatan 37, SE-223 62 Lund, Sweden
*Corresponding author: [email protected]
Received 4 January 2011; revised 13 May 2011; accepted 18 May 2011;posted 23 May 2011 (Doc. ID 140381); published 1 July 2011
We present optical methods at a wide range of wavelengths for remote classification of birds. Theproposed methods include eye-safe fluorescence and depolarization lidar techniques, passive scatteringspectroscopy, and infrared (IR) spectroscopy. In this paper we refine our previously presented method ofremotely classifying birds with the help of laser-induced β-keratin fluorescence. Phenomena of excitationquenching are studied in the laboratory and are theoretically discussed in detail. It is shown how theordered microstructures in bird feathers induce structural “colors” in the IR region with wavelengthsof around 3–6 μm. We show that transmittance in this region depends on the angle of incidence ofthe transmitted light in a species-specific way and that the transmittance exhibits a close correlationto the spatial periodicity in the arrangement of the feather barbules. We present a method by whichthe microstructure of feathers can be monitored in a remote fashion by utilization of thermal radiationand the wing beating of the bird. © 2011 Optical Society of AmericaOCIS codes: 170.1420, 280.3640, 300.2530, 300.6340, 280.4991.
1. Introduction
Migratory birds, which are highly adapted to managelong flights, cross seas and deserts on their long-distance migrations [1–3]. A great majority of song-birds, although most birds are diurnal, migrate atnight [4,5]. During the night they will meet less tur-bulent wind conditions [6], lower predation rates [7],and they have the possibility to use the daytime forforaging [1,2]. A large proportion of migration alsooccurs at high altitudes (>500m) [4]. Because ourown perception and classification of birds is basedprimarily on visual information, studies of nocturnalbird migration are challenging.
There are a number of migration phenomena intowhich we cannot get insights from the currently
applied monitoring techniques. Techniques thatenable identification of individual species duringthese conditions would let biologists address ques-tions regarding, e.g., the timing of migration andflight directions in relation to winds and topography.Comparative studies of species composition betweentime, sites, and years could be performed, and migra-tion routes of individual species could be monitored.Insight into flight patterns of different species is cru-cial for the understanding of how wing morphologyand physiological adaptations affect decisions onstrategies and timing of migration. Detailed analysesof the aerodynamics of bird flight have been exten-sively pursued using advanced laser methods ina wind tunnel setting; see, e.g., [8]. Knowledge ofmigration routes and timing of the migration of indi-vidual species would also improve our understand-ing of how and when bird-borne diseases such asavian flu, avian malaria, and tick-borne diseases
0003-6935/11/203396-16$15.00/0© 2011 Optical Society of America
3396 APPLIED OPTICS / Vol. 50, No. 20 / 10 July 2011
are expected to be spread, as well as how seeds willbe dispersed [3,4,9].
In addition to identifying new species, automaticmonitoring techniques not requiring continuoussurveillance from field assistants would allow formore efficient studies during daytime and for speciesmigrating at high altitudes. Scattering spectroscopyof a well-defined section of the sky would allow fora more quantitative evaluation with time-resolveddata on the number of passing birds. Such an ap-proach could be a good complement to existing man-ual observation techniques and enable biologists toaddress questions such as how densities of differentspecies vary during the day and with the ambientconditions. In addition to species identification, clas-sification of sexes, age classes, and ultimately esti-mation of the condition of individual birds, oftenreflected in the plumage, would be desirable.
The undoubtedly most traditional way to studybirds and bird migration is visual observation withthe aid of a pair of binoculars or a telescope, wherethe light from the Sun is used as light source andthe bird can be identified based on appearance andplumage characteristics. The size, shape, and reflec-tance spectrum (color) of the bird, filtered throughthe human visual system, provide information aboutposition, flight direction and species of the bird. Aslong as the light level is high enough and the distanceshort enough, this approach is very powerful. How-ever, during the night and at longer distances, otherapproaches are needed.
In the discipline of remote sensing, information isretrieved from far distances. Typically, the methodsrely on several regions of the electromagnetic spec-trum, e.g., radio frequency (RF), infrared (IR), visible(VIS), and ultraviolet (UV) to transfer the infor-mation. Both active backscattering geometries, pas-sive scattering, obscuration, and thermal emissionschemes exist. Previously, a number of such methodshave been applied to study the nocturnal migrationof birds. Tracking and surveillance radars [10–15],IR cameras [5,15], ceilometers [16,17], and lunarobscuration [18,19] have been applied to study theflight altitudes and flight directions of night migrat-ing birds as well as the number of migrants passing.A couple of studies [20,21] designed to compare dif-ferent methods have drawn conclusions on the ad-vantages and disadvantages of the tested existingmethods. Detection of migrating birds from theircalls has also been applied [22,23]. The call countswere significantly correlated with radar counts, buta great deal of the variation in vocalization countsremains unexplained, suggesting that factors otherthan bird density might influence call counts [22].Although many migratory songbirds produce differ-ent flight calls [23], these calls might not enableidentification of all species, and fluctuations in callfrequencies due to variables other than bird densitiesmight also confuse estimates from this method. An-other way to study migratory routes and behavior ofbirds is to mount archival light loggers (geolocators)
[24] or global positioning system loggers [25] on in-dividual birds. These methods give very informativedata but are costly and require capture and recap-ture of specific individuals. Furthermore, geolocatorsdo not enable detailed studies of the flight behavior ofbirds relative to topography because the precision ofthe positional information is limited.
Although existing methods have proven valuablefor detection of nocturnal migrants, no method hasso far enabled general determination of the speciesof birds. Information on wing-beat frequency andflight speed from tracking radar makes it possibleto group migrants into size groups, because wing-beat frequency and flight speed are similar for birdswith similar body sizes [26]. Only a very limitednumber of species with very characteristic wing-beatfrequencies, for example, the common swift Apusapus, can be identified by tracking radar [27,28].
While bird coloration in the human visual spec-trum and more recently also in the UV region above300nm has been studied extensively [29,30], little isknown about the plumage properties in the deeperUV, parts of the near-IR (NIR) and mid-IR (MIR), in-formation which might not be relevant for classicalbird–bird interaction studies, but might still provevaluable for remote sensing purposes. In the presentstudy we explore three new optical schemes using abroad range of the electromagnetic spectrum, includ-ing deep-UV, the full bird-VIS range, NIR, and MIRwith the purpose of detection and species identifica-tion of night migrating birds. We present the mostinteresting results from each of the techniques anddemonstrate several new opportunities.
2. Materials and Methods
The methods used, including light detection andranging (lidar), IR studies, and passive reflectance,were partly pursued at Lund University. Both refer-ence measurements and some of the test-range lidarmeasurements were performed in the university la-ser laboratories. In addition, field studies were madeat a field site at the Kullaberg nature reserve close toMölle in the southwest of Sweden (N 56° 180, E 12°260). The site is situated on a northwest-pointingpeninsula that is a main migration point during thespring migration. Kullaberg is a protected area, andat this location many nocturnal passerine migrantsusually pass, arriving from Denmark in the west tosouthwest after a short sea crossing in the spring andcontinuing toward breeding areas in the north tonortheast. The lidar was strategically positionednear the outermost point of the peninsula, whichshould give the opportunity to test the techniqueon any birds passing by. The near-coastal site wouldenable us to test the lidar technique on coastal birdsand locally foraging swallows and martins. Foran overview of the field site, see Fig. 1. The workwas performed with general ethical permits(nos. M172-06 and M204-06).
10 July 2011 / Vol. 50, No. 20 / APPLIED OPTICS 3397
A. Elastic and Inelastic Reference Measurements atMultiple Excitation Wavelengths
To understand what phenomena to expect in long-range experiments during lidar measurements inthe field, effects of, e.g., excitation quenching werestudied in detail in the laboratory. The spectral ab-sorption properties of β-keratin are very important,e.g., when choosing the laser source for fluorescencestudies. The reflectance and fluorescence at differentexcitation wavelengths were therefore studied in thefollowing way: a number of museum samples of dif-ferent bird species containing a diversity of pigmentsincluding eumelanin, pheomelanin, various carote-noids, as well as exhibiting structural colors wereanalyzed using a combined fluoresceins similar tothat presented in [31]; modified with an extensionfurther down in the UV and without a GG420 long-pass filter. Moreover, the sensor now also includedLEDs with emission at 250 and 300nm (RoithnerLaser, UVTOP250 and UVTOP300). Reflectances forthe plumage of the sample birds were obtained from240 to 740nm.
All observed reflectance spectra were naturallylimited by the reflectance of pure β-keratin (whitebelly of an adult herring gull, Larus argentatus).The observed reflectance of pure β-keratin plumagecan accurately be described by a (biased Gompertz)function of the form presented in Eq. (1):
RkeratinðλÞ ¼ A · exp�− exp
�λ − λ0d
��þ S; ð1Þ
where R is the reflectance; A is a value between zeroand one (minus S), in our case 68%; λ is the wave-length valid between 240 and 740nm; λ0 is the riseposition equal to 365nm; d is a measure of the steep-ness, in this case with the value 63nm; and S is thespecular reflection of roughly 4%.
The value of S greatly depends on the illuminationand observation angles as well as the orientation ofthe feather barbules. A represents the reflectanceat NIR and is a result of the incident photons escap-ing the field-of-view (FOV) of the detector; thus, itis unrelated to the absorption of β-keratin. A can beexpected to vary considerably between differentschemes for reflection measurements [32].
To verify the relation between plumage reflectanceand fluorescence, presented in Eq. 1 in [31], the re-lative elastic light as well as fluorescence emissionsgenerated from several excitation wavelengths wereevaluated for a variety of pigments. The relation ishighly sensitive to errors in the dark spectrum esti-mation, and any offset will cause the spectrum to tiltslightly in one or the other way. In a case study, wereview the golden oriole (Oriolus oriolus), pigmentedby the carotenoid lutein. The plumage of the birdwas excited with three wavelengths, 266, 308, and355nm—all important in the lidar community—and the relative fluorescence shapes were measured.
B. Lidar
In a previous paper [31], we introduced laser-inducedfluorescence (LIF) lidar to bird studies. We have de-monstrated that remote retrieval of chemical infor-mation by measuring the chromophore compositionfrom bird fluorescence spectra is a feasible alterna-tive for remote classification of migrating birds. Inthat paper we discussed in detail various optical phe-nomena in feathers, such as scattering, absorption,fluorescence, polarization, and interference effects.The phenomena were experimentally studied in la-boratory setups; fluorescence and reflectance studieswere also performed in a remote fashion, both onmuseum bird samples and on live European star-lings (Sturnus vulgaris) in the field [31].
The lidar technique, employing pulsed laser lightsent out into the atmosphere, has, ever since thelaser’s invention, successfully been used in differentforms. Examples of standard applications are themapping of aerosols [33], clouds [34], temperature[35], and wind speed [36] in the atmosphere. Lidaris also used for gas concentration measurements[37–39] and fluorescence studies of, e.g., aerosols[40] and hard targets such as buildings, water com-pounds, and plants [41,42]. The technique is welldocumented, and overviews can be found in e.g.,[43,44]. Lidar techniques have previously been suc-cessfully used for studying the presence and densityof birds and diversity of bird species communities inrelation to vegetation structure [45–47]. However,with the exception of our feasibility study [31], lidarhas so far not been developed for species classifica-tion of birds migrating at night. In the present studywe have improved the performance of the lidar setup,and we have also performed a detailed investigationof excitation quenching mechanisms and elastic de-polarizing ratios.
The Lund University lidar system used has,in general, been extensively described in several
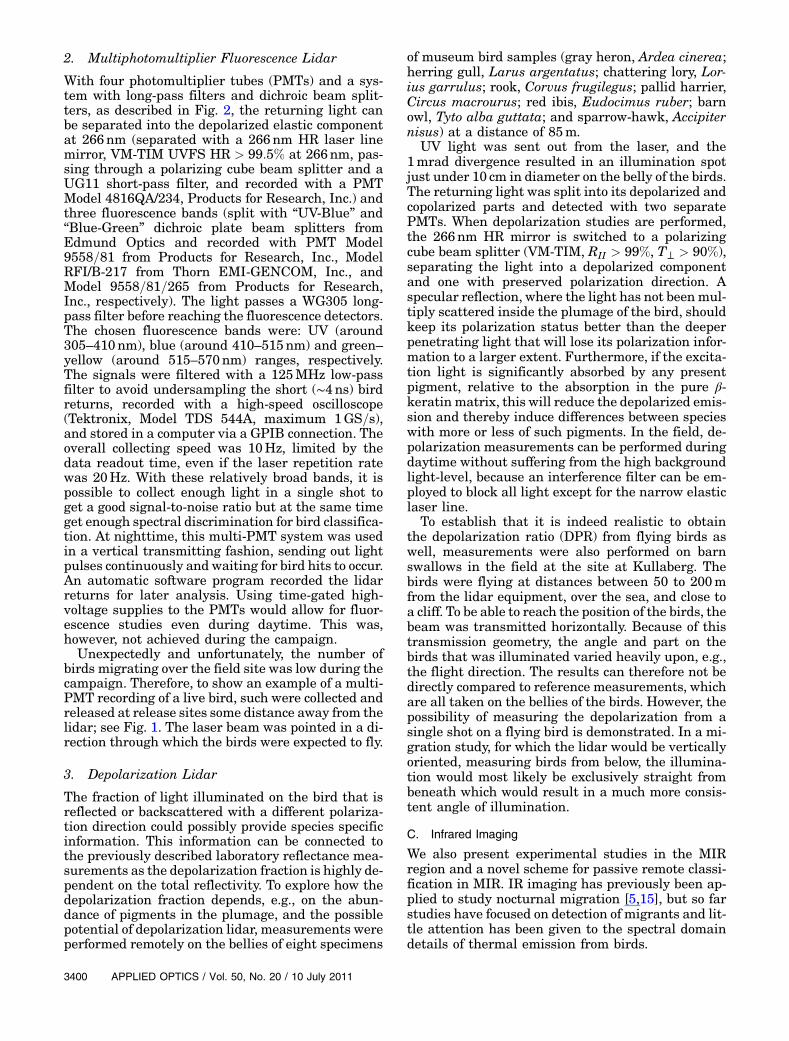
Fig. 1. (Color online) Photographic setup overview of the fieldsite at Kullaberg and its location in Sweden. The site has the co-ordinates N 56° 180, E 12° 260. Shown are the locations of the lidarequipment, the center dome in which the IR cameras were in-stalled, the east dome with the passive telescope, and a weatherstation. Also shown are two directions in which different lidarmeasurements were performed.
3398 APPLIED OPTICS / Vol. 50, No. 20 / 10 July 2011
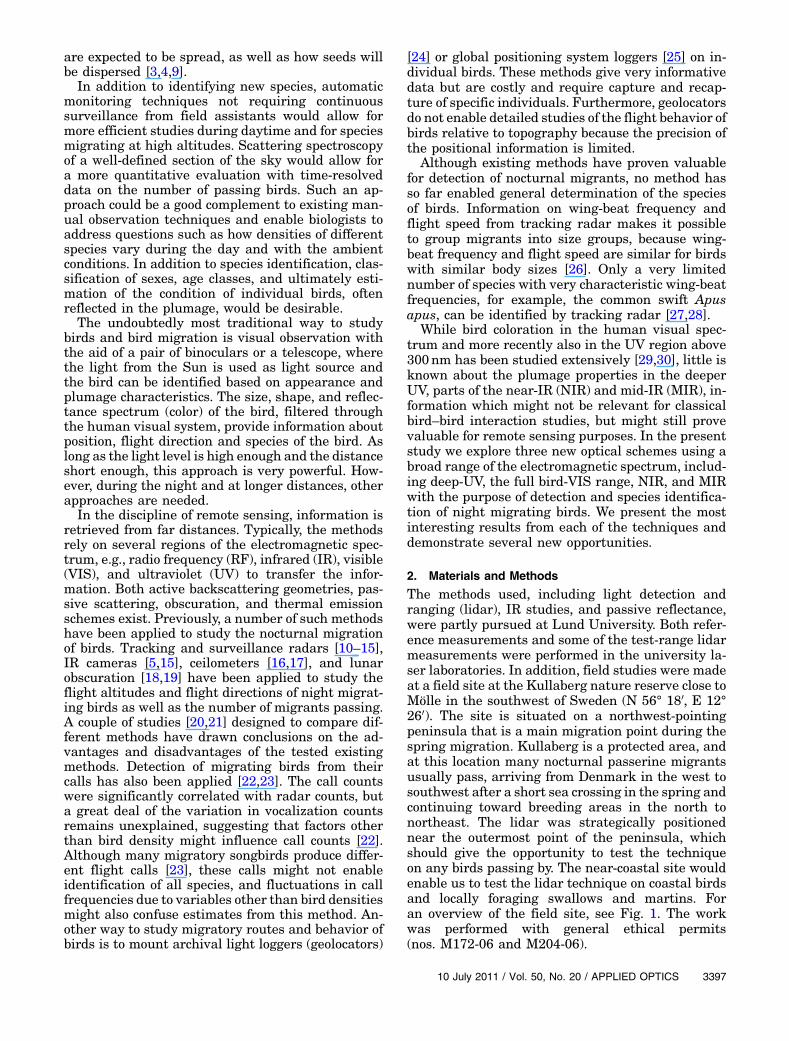
previous papers (e.g., [48]) and the bird fluorescencelidar variety in an earlier version in [31]. Some im-portant changes have, however, been implemented toimprove the bird classification potential, and themost important features of the fluorescence lidarsystem are therefore presented in Fig. 2. The mainimprovements of the system are the implementa-tion of one more fluorescence channel and the use ofthe more suitable, bird eye-safe, excitation wave-length, 266nm.
Light pulses with a duration of around 4ns, awavelength of 266nm, and pulse energies of around10mJ, are obtained by generating the fourth harmo-nic of a Q-switched Nd:YAG laser (Spectra Physics,Model PRO-200). The light is transmitted into thesky after passing through a Galilean quartz lensexpander with the purpose to expand and (variably)set the divergence of the laser beam. The light canbe transmitted vertically without any further optics(a tilt-angle quartz window can still be used forweather protection); alternatively, it can be sent outhorizontally or with an angle of inclination between−10° to þ55° with 0:011° angular resolution withthe help of a motor-controlled folding mirror (40 cm×70 cm), also providing the possibility of horizontalangular scanning (360°, 0:0035° resolution).
When light illuminates a bird, part of that lightwill be reflected, specularly or after several scatter-ing events within the plumage, and part of it willbe absorbed, and thus has the possibility to inducefluorescence. A small fraction of the fluorescence andreflected light will return to the lidar and can be fo-cused onto the detecting system by a 40 cm diameterNewtonian telescope. The light passes through avariable aperture, used to control the FOVof the tele-scope. It is especially important to match the illumi-nation profile and telescope FOV during daytimefluorescence studies when spectrally broad retriev-al channels are usually employed. The background
light levels from the scattered sunlight can, underthese conditions, heavily compete with the LIF sig-nal, even if the necessary high voltage for the photo-multipliers is time gated. Depending on the studies,there are several possible ways to analyze the lidarreturn. We have in these studies used three differentapproaches. An image-intensified optical multichan-nel analyzer (OMA) can record the full spectrum ofthe light, or a system with a polarizing beam splittercan separate the light into its polarized and depolar-ized components. The approach mainly used is, how-ever, a four-channel time-resolving detector schemeseparating the light into one depolarized elastic laserline channel and three broad wavelength bands, uti-lizing dichroic beam splitters; see Fig. 2.
1. Optical Multichannel Analyzer Lidar
With the OMA (crossed Czerny–Turner grating spec-trometer ORIEL instruments, Model 77400, con-nected to an image intensified and down to 10nstime gateable charge-coupled device, ANDORTechnology, Model DH501-25U-01), the full spectrumof the fluorescence from around 300 to 600nm can beobtained (the range is limited by the second-orderdiffraction). However, the β-keratin fluorescenceintensity rapidly decreases around 600nm, and notmuch light is therefore expected at longer wave-lengths. The OMA was employed by letting the light,instead of passing through the iris in Fig. 2, befocused into an optical fiber connected to the spectro-meter. Even intensified, the sensitivity of the spec-trometer is low compared to that of PMTs, andthus this approach is unfavorable in a single-shotsituation, which is to be expected when no trackingis utilized and a bird passes by at migrating speed.The OMA system is however very suitable to performlaboratory studies with museum birds when signalaveraging can be utilized. This setup was thus usedat a docking position of the mobile laboratory inLund, where light was transmitted to a rooftop some80m away, where museum sample birds were posi-tioned, to record the full spectra of their bellies.The laser beam had a spot size diameter of around6 cm at this distance, and the return collection effi-ciency of the fiber-coupled spectrometer was opti-mized by transmitting the 266nm laser light, andsimultaneous to that, sending continuous light froma high-pressure Hg(Xe) arc discharge lamp (New-port, Model 71226) backward through the collectingfiber and overlapping the corresponding spots. Thefiber had a diameter of 1mm, which, together withthe focal length of the telescope of 1m, gives a roughestimate of its collection angle of 1mrad, equal to aspot size of 8 cm at a distance of 80m—thus reason-ably well matched to the spot size of the laser beam.The fiber was then moved to the spectrometer, andspectra were recorded and averaged for 250 shotsfor each bird.
Fig. 2. (Color online) Schematic overview of the fluorescence andpolarizing lidar system. The light from the laser is expanded andvariably diverged before it is sent out vertically or in other inclina-tions. The returning light is focused onto the detector system witha 40 cm diameter telescope. Here it is separated into different spec-tral bands or two polarization directions, or it is sent through afiber to an OMA.
10 July 2011 / Vol. 50, No. 20 / APPLIED OPTICS 3399
2. Multiphotomultiplier Fluorescence Lidar
With four photomultiplier tubes (PMTs) and a sys-tem with long-pass filters and dichroic beam split-ters, as described in Fig. 2, the returning light canbe separated into the depolarized elastic componentat 266nm (separated with a 266nm HR laser linemirror, VM-TIM UVFS HR > 99:5% at 266nm, pas-sing through a polarizing cube beam splitter and aUG11 short-pass filter, and recorded with a PMTModel 4816QA/234, Products for Research, Inc.) andthree fluorescence bands (split with “UV-Blue” and“Blue-Green” dichroic plate beam splitters fromEdmund Optics and recorded with PMT Model9558=81 from Products for Research, Inc., ModelRFI/B-217 from Thorn EMI-GENCOM, Inc., andModel 9558=81=265 from Products for Research,Inc., respectively). The light passes a WG305 long-pass filter before reaching the fluorescence detectors.The chosen fluorescence bands were: UV (around305–410nm), blue (around 410–515nm) and green–yellow (around 515–570nm) ranges, respectively.The signals were filtered with a 125MHz low-passfilter to avoid undersampling the short (∼4ns) birdreturns, recorded with a high-speed oscilloscope(Tektronix, Model TDS 544A, maximum 1GS=s),and stored in a computer via a GPIB connection. Theoverall collecting speed was 10Hz, limited by thedata readout time, even if the laser repetition ratewas 20Hz. With these relatively broad bands, it ispossible to collect enough light in a single shot toget a good signal-to-noise ratio but at the same timeget enough spectral discrimination for bird classifica-tion. At nighttime, this multi-PMT system was usedin a vertical transmitting fashion, sending out lightpulses continuously and waiting for bird hits to occur.An automatic software program recorded the lidarreturns for later analysis. Using time-gated high-voltage supplies to the PMTs would allow for fluor-escence studies even during daytime. This was,however, not achieved during the campaign.
Unexpectedly and unfortunately, the number ofbirds migrating over the field site was low during thecampaign. Therefore, to show an example of a multi-PMT recording of a live bird, such were collected andreleased at release sites some distance away from thelidar; see Fig. 1. The laser beam was pointed in a di-rection through which the birds were expected to fly.
3. Depolarization Lidar
The fraction of light illuminated on the bird that isreflected or backscattered with a different polariza-tion direction could possibly provide species specificinformation. This information can be connected tothe previously described laboratory reflectance mea-surements as the depolarization fraction is highly de-pendent on the total reflectivity. To explore how thedepolarization fraction depends, e.g., on the abun-dance of pigments in the plumage, and the possiblepotential of depolarization lidar, measurements wereperformed remotely on the bellies of eight specimens
of museum bird samples (gray heron, Ardea cinerea;herring gull, Larus argentatus; chattering lory, Lor-ius garrulus; rook, Corvus frugilegus; pallid harrier,Circus macrourus; red ibis, Eudocimus ruber; barnowl, Tyto alba guttata; and sparrow-hawk, Accipiternisus) at a distance of 85m.
UV light was sent out from the laser, and the1mrad divergence resulted in an illumination spotjust under 10 cm in diameter on the belly of the birds.The returning light was split into its depolarized andcopolarized parts and detected with two separatePMTs. When depolarization studies are performed,the 266nm HR mirror is switched to a polarizingcube beam splitter (VM-TIM, RII > 99%, T⊥ > 90%),separating the light into a depolarized componentand one with preserved polarization direction. Aspecular reflection, where the light has not beenmul-tiply scattered inside the plumage of the bird, shouldkeep its polarization status better than the deeperpenetrating light that will lose its polarization infor-mation to a larger extent. Furthermore, if the excita-tion light is significantly absorbed by any presentpigment, relative to the absorption in the pure β-keratin matrix, this will reduce the depolarized emis-sion and thereby induce differences between specieswith more or less of such pigments. In the field, de-polarization measurements can be performed duringdaytime without suffering from the high backgroundlight-level, because an interference filter can be em-ployed to block all light except for the narrow elasticlaser line.
To establish that it is indeed realistic to obtainthe depolarization ratio (DPR) from flying birds aswell, measurements were also performed on barnswallows in the field at the site at Kullaberg. Thebirds were flying at distances between 50 to 200mfrom the lidar equipment, over the sea, and close toa cliff. To be able to reach the position of the birds, thebeam was transmitted horizontally. Because of thistransmission geometry, the angle and part on thebirds that was illuminated varied heavily upon, e.g.,the flight direction. The results can therefore not bedirectly compared to reference measurements, whichare all taken on the bellies of the birds. However, thepossibility of measuring the depolarization from asingle shot on a flying bird is demonstrated. In a mi-gration study, for which the lidar would be verticallyoriented, measuring birds from below, the illumina-tion would most likely be exclusively straight frombeneath which would result in a much more consis-tent angle of illumination.
C. Infrared Imaging
We also present experimental studies in the MIRregion and a novel scheme for passive remote classi-fication in MIR. IR imaging has previously been ap-plied to study nocturnal migration [5,15], but so farstudies have focused on detection of migrants and lit-tle attention has been given to the spectral domaindetails of thermal emission from birds.
3400 APPLIED OPTICS / Vol. 50, No. 20 / 10 July 2011
Colors arising from interference effects, ratherthan solely from pure spectral differential absorp-tion, are commonly present in various objects in nat-ure [49]. The periodic structures in some materials,with dominant spatial frequencies, induce interfer-ence effects, transmitting some colors and reflectingothers. The presence of structural colors in insectsand bird plumage has been extensively studied, andit has been known long since that some colors areproduced by dominant spatial frequencies in refrac-tive index variations rather than by differentiallyabsorbing chemical pigments [49,50]. Bluish andgreenish structural colors with wavelengths around400–550nm have been correlated with spatial fre-quencies from transmission electron microscopy(TEM) on nanosized arrays, typically containing sub-micrometer features [49]. Based on the informationthat bird feather barbules [the secondary branchesof the rachis (trunk), considering that a feather isconstructed by the main rachis, barbs, barbules, andhamuli] are well ordered with thicknesses in the or-der of 2 μm, thus about ten times larger than thestructures inducing colors in the blue-green region,one might expect additional structural signatures inthe MIR at wavelengths around 4 μm. Studies in thetwo atmospheric windows, on either side of a CO2 ab-sorption band in the 3–5 μm region could thereforeprovide valuable information. To our knowledge,no studies of the structural bird “colors” in the MIR–thermal IR range have been performed so far. Herewe present a novel MIR-based method capable of re-motely retrieving information on the microstructureof the plumage.
Further, structural colors are known to often shiftupward and downward in the spectral domain de-pending on the angle of observation with respect toillumination and the ordered matrix [30]. This can beexplained geometrically as the effective distances(or spatial frequencies) depend on the angle of ob-servation. If, e.g., the wings of a bird, constitutinga substantial part of the area seen from beneath, areconsidered, the observer angle of view with respect tosome feather structures will depend on the wingcycle phase. Observing (tracking) a bird over a com-plete wing cycle (preferably several) could then re-sult in, e.g., a periodic shift of the MIR wavelengthof maximum transmittance of body heat radiation.The features of such shift over time (amplitude, fre-quency, and bias) could, provide detailed informationabout the feather microstructures. The ability to re-trieve information on the microscopic level over fardistances by spectral analysis of the thermal emis-sion could be thought of as remote microscopy. Theinformation is, however, a statistical spatial average.
The potential for spectroscopy in the IR region wasstudied on sample feathers in the laboratory. Feath-ers from the outer (dorsal) side of the wings of sevendifferent museum bird species were fixed in reversalfilm slide mounts. Each slide mount was then fixed toa rotation stage so that the feather could be rotatedaround the base trunk. For angles of incidence
ranging from −45° to þ45° in increments of 5° (zerodegrees corresponding to normal incidence), thetransmittances of the feathers were measured in therange between 2.5 and 25 μm using a Fourier trans-form IR (FTIR) spectrometer (ATI Mattson, ModelInfinity AR60). In general, the spectra will changeaccording to all three rotations in space, very simi-larly to what is encountered in crystallography (see,e.g., [51]). The IR source was located on the ventralside of the feather.
To find a connection between the transmittanceproperties and the spatial structure of the feathers,a transmission microscope (Brunel Microscopes,Ltd., Model SP80, with an AVT Guppy-503 B/CCMOS camera, 810nm LED illumination) was usedto study the features of a number of feathers.
To further explore the feasibility of using thepossible spectral information in the IR region, weconsider a realistic case. The high metabolism of theflying bird results in an internal body temperature ofaround 41 °C and causes thermal radiation to beemitted and filtered through the feathers in the birdplumage, as well as through atmospheric absorption.The radiation can then be detected with IR cameraswith different detection bands selected by optical fil-ters, preferably on each side of the CO2 absorptionband at around 4:3 μm. Laboratory measurementsshow that the relative amount of radiation from thebird in each of these bands will differ depending onthe transmittance properties of the plumages of dif-ferent bird species. The relative contribution to eachband in the two atmospheric transmittance windowswas simulated for a number of birds based on theresults from the laboratory spectrometer measure-ments. The simulation was done by integrating theproduct of blackbody emission, transmittance forplumage and atmosphere, the normalized detectorresponsivity of InSb, and optimal transmittancefilters for each band. Further, this was done as afunction of incidence angle, as described above, to in-vestigate if different birds show any differences inwing-beat-induced dependence on the transmittance.
D. Passive Scattering Measurements
Telescopes have long since been used within thebird research community, but for enhanced visualobservation without automation. We implement atelescope connected to a spectrometer for automaticrecording and storage of events of spectral intensitychange when birds pass through the FOV of the tele-scope. The sudden difference in the otherwise semi-static spectrum from the sky is recorded, providinginformation about the coloration of the bird. Thesame approach can be implemented in moonlightobscuration (so-called moon watching). A Newtoniantelescope with an 800 aperture and 800mm focallength (Bresser) mounted on an equatorial motorizedstage (Messier Model LXD75 GoTo) was installed inthe southeast dome of the location at Kullaberg, asindicated in Fig. 1. Clear view to the horizon wasachieved in all directions except toward the east.
10 July 2011 / Vol. 50, No. 20 / APPLIED OPTICS 3401
In the daytime, the telescope was directed towardthe star Polaris; thus, in this mode we always hadthe Sun roughly perpendicular to the optical axisof the telescope. At nighttime, the moon was trackedusing the motorized stage included in the telescopesetup. In the focal plane of the telescope, a 1000 μmdiameter UV collection fiber (Edmund Optics) wasinstalled feeding the light to a compact spectrometer(Ocean Optics, USB4000). In the daytime we em-ployed a spectrometer slit width of 25 μm, yielding1:5nm resolution, and at nighttime a 100 μm slit,yielding 6nm spectral resolution. Cylindrical lensesand second-order rejection filters were installed onthe spectrometers. The light was detected by un-cooled CCDs. In the daytime we were able to exploitthe dynamical range by sample rates of 50Hz, whilein the moon tracking mode at nighttime, we achieveda 100Hz sample rate, however, with a lower spectralresolution.
3. Analysis and Results
A. Elastic and Inelastic Reference Measurements atMultiple Excitation Wavelengths
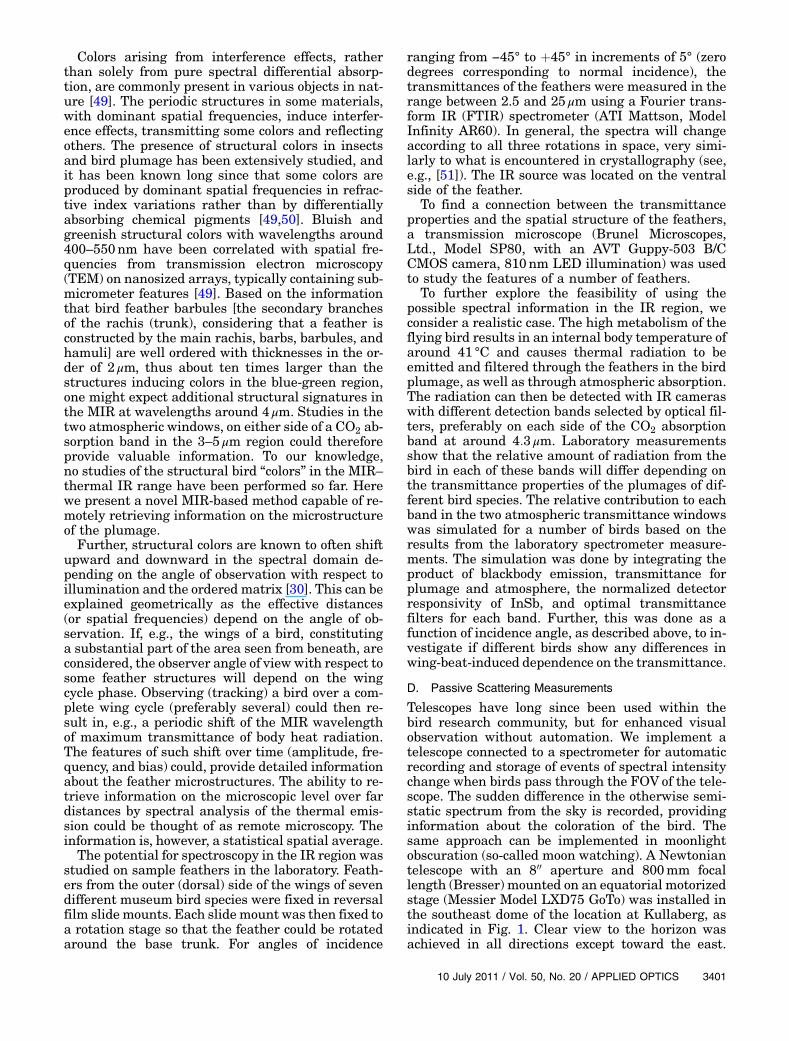
The results of the reflectance measurements for thedifferent bird species are shown in Fig. 3. Of particu-lar interest in laser-based remote sensing of airborneβ-keratin are certain laser lines. A 95% light ab-sorption by β-keratin can be expected at 266nm(quadrupled Nd:YAG radiation found in many lidarsystems) and some 85% at 308nm (XeCl excimerlasers typically used in ozone lidars). Although notvery powerful, nitrogen lasers emitting at 337nmmight be used where roughly 75% of the light wouldbe absorbed; however, several bird corneas andlenses start to become transparent at 337nm, thusthis choice could be harmful. The tripled Nd:YAG
line at 355nm is potentially harmful for most birdvision systems, but could be applied for bats or sce-narios with limited species involved. Some 65% ab-sorption can be expected at 355nm. Continuouswave emitting diode lasers at 375 and 405nm mightbe used for small-scale experiments without rangeresolution with some 50% and 40% energy deposi-tion, respectively. The three last-mentioned choiceswould, however, largely influence the birds and,further, many of the pigments would not be coveredwithin the fluorescence emission range.
Reflectance at 266nm is dominated by the specu-lar contribution and is therefore highly dependenton the orientation of the feather structures. Becausethe reflectance is low, the relative accuracy is poor.Because the reference sensor was originally designedfor nonordered samples and because of the cylindri-cally symmetric geometry [31], the reflectancesat the various wavelength regions are difficult tocombine. With respect to lidar measurements, thisfact suggests that the depolarized elastic part ispreferred in terms of normalizing the fluorescence.Within the group of diversely reflecting species, allof the reflectance data at 266nm were nicely de-scribed by a β-distribution with mean of 34 per thou-sand and variance of 0.3 per thousand. Only a weakcorrelation between 266nm and the reflectance at308nm of 33% was found, and 40% with 355nm.Possibly the correlations are higher if the specularreflectance is rejected by observing only the depolar-ized contribution. The reflectance at 308nm corre-lated 75% with the reflectance at 355nm. Thus,normalizing fluorescence with the elastic signal atthis excitation wavelength is slightly less favorablein terms of stability.
The data from the fluorescence measurements arenot included here, but the combined case study mea-surements of reflectance and fluorescence at threeexcitation wavelengths for the golden oriole are pre-sented in the bottom part of Fig. 3. The dark currentsfor each spectrum were compensated for so that thepart of the spectrum between 550 and 650nm thatis not affected by lutein chromophores remains flat.The ratio spectra (see Eq. 1 in [31]) were scaled tomatch the elastic ratio for the unpigmented part. Thedouble absorption dip of lutein indicates that greatercontrast, between the spectral part affected by thechromophore and the unaffected part, is achievedfor the lower excitation wavelength. We further notethat the contrast in the 266nm excited fluorescenceratio is better than that for the relative elastic light.This could be explained by the fact that the lightis produced internally in the β-keratin matrix; thus,there is no specular contribution, which typicallyworsens the contrast in the elastic reflectance case.
A surprising result from the fluorescence measure-ments was that the gray heron showed even strongerfluorescence intensity in the UV than the unpig-mented white herring gull. The same results werefound from the lidar OMAmeasurements (results de-scribed in next section) and the bird was therefore
Fig. 3. (Color online) a) Reflectance spectra for different birds atlocations specified in the legend. All of the birds are specified else-where except for the budgerigar, the hummingbird, and the turacowith Latin names Melopsittacus undulates, Colibri thalassinus,and Tauraco erythrolophus, respectively. b) Fluorescence spectraratios for the golden oriole. The fluorescence is given relative tounpigmented β-keratin. Excitation at 266, 308, and 355nm.
3402 APPLIED OPTICS / Vol. 50, No. 20 / 10 July 2011
investigated in more detail. It was seen that thechest showed spotwise higher reflectance than un-pigmented β-keratin in the region 240nm–340nm.Consequently, even the fluorescence induced by266nm is higher in that region.
B. Lidar
1. Optical Multichannel Analyzer Lidar
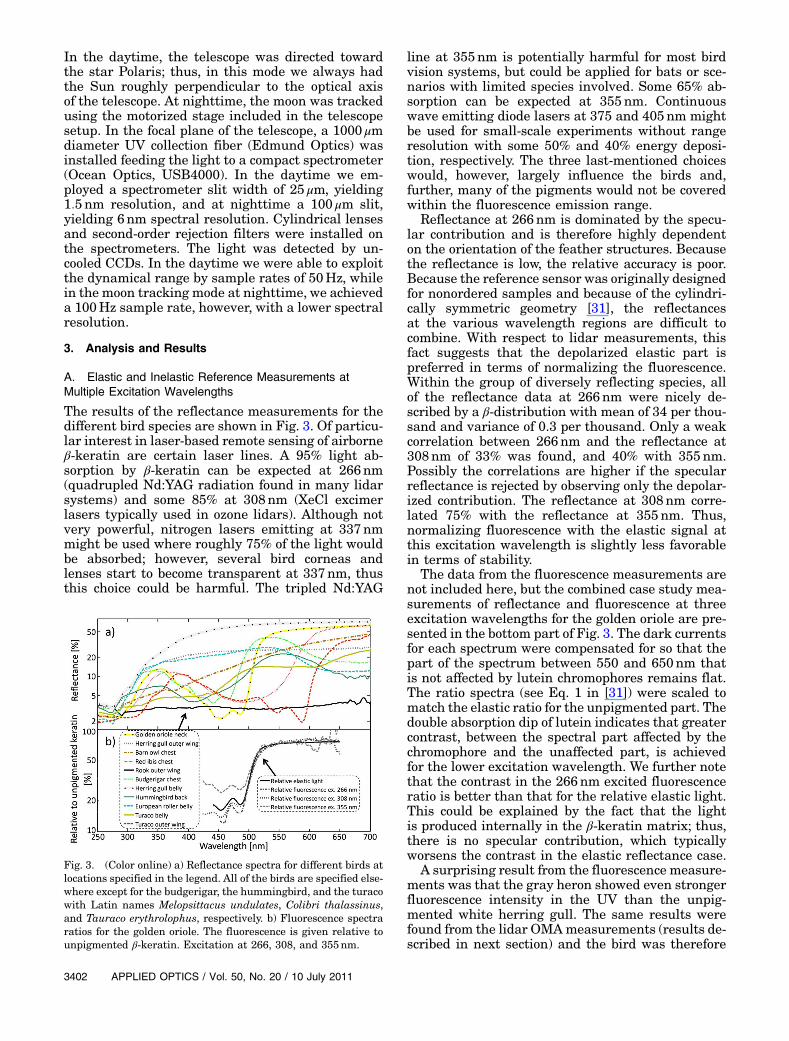
The lidar fluorescence returns from six museum birdsamples were recorded, and their spectra averagedover 250 shots. The raw spectra of the birds areshown in Fig. 4a). Included in the figure is also theoverall spectral transmittance for the bands thatwere chosen for the multi-PMT setup. The bandsare chosen to maximize the classification possibilitybased on differences in spectra between birds. Thenatural way to choose the positions of the bandswould be to match the visual bands of the birds. Inthese experiments we have, however, limited our-selves to three fluorescence bands. The positions ofthese bands are matching reasonably with the visualbands of the birds. The UV band goes from 305 to410nm while, as an example, the starling’s (Sturnusvulgaris) UV band is centered at 362nm; the blue
band is between 410 and 515nm while the starling’stwo middle bands are centered at 449 and 504nm,respectively; the green band is from 515 to 570nmand the corresponding band of the bird is centeredat 563nm [52]. The white plumage from the herringgull belly was chosen as a reference, due to its gen-eral lack of pigments. In order to more clearly revealdifferences between the birds, their spectra are di-vided with the one from the herring gull, as shownin Fig. 4b). From previous studies, [31], we know thatthe fluorescence color is, in general, well correlatedwith the reflectance color and the same conclusioncan be drawn from Fig. 4. The UV light of the laserinduces fluorescence in the β-keratin in the feathers.This actual fluorescence spectrum does not varymuch between birds, but when this “white” light isfiltered through the plumage, it gets a bird-specificfingerprint through reabsorption. It can be men-tioned that the black rook, absorbing much of thefluorescence, shows a very low light level throughoutthe spectrum. The red ibis and chattering lory, whichare both red, show very similar and quite weakfluorescence spectra with a tendency of increased in-tensity toward the red side of the spectrum. Thelight-brown pallid harrier belly is also shifted towardthe red compared to the herring gull. The increase ofits spectrum, however, starts at lower wavelengths,which, combined with our higher visual sensitivityin the green region, makes this bird look brown andnot red (what we see is, of course, reflectance, but wehere assume that the fluorescence and reflectanceare well correlated). The gray heron shows strongsignal to the red, but its very strong signal in theUV was especially remarkable.
2. Multiphotomultiplier Fluorescence Lidar
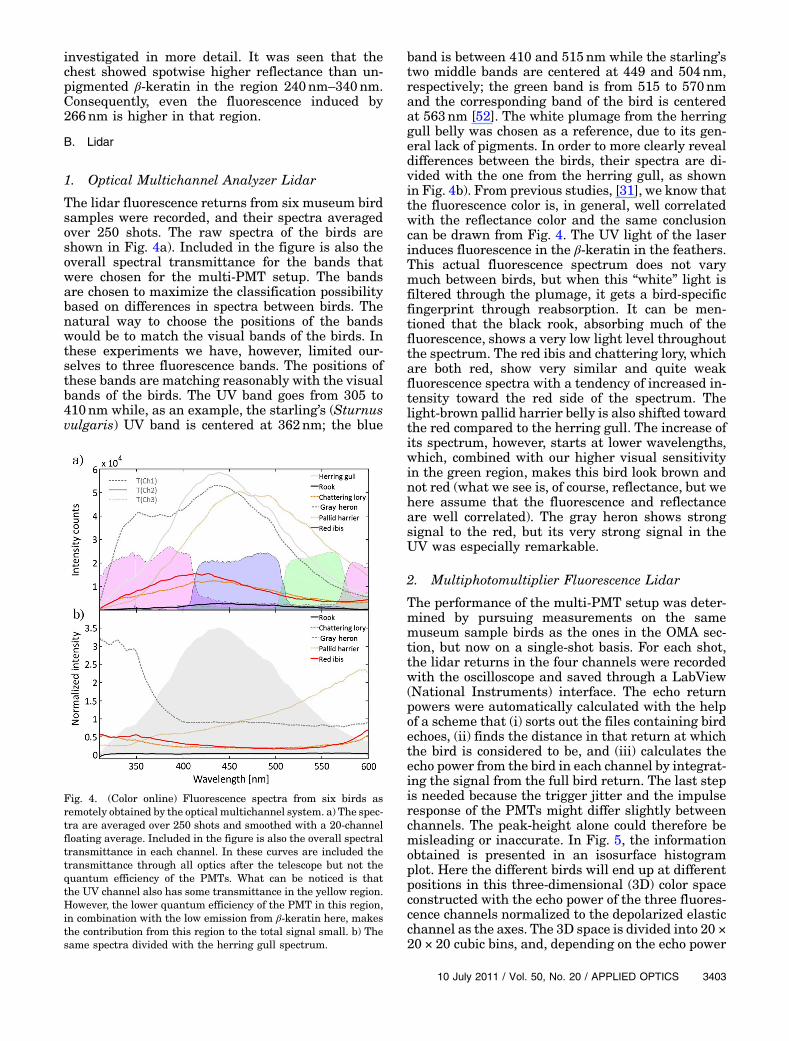
The performance of the multi-PMT setup was deter-mined by pursuing measurements on the samemuseum sample birds as the ones in the OMA sec-tion, but now on a single-shot basis. For each shot,the lidar returns in the four channels were recordedwith the oscilloscope and saved through a LabView(National Instruments) interface. The echo returnpowers were automatically calculated with the helpof a scheme that (i) sorts out the files containing birdechoes, (ii) finds the distance in that return at whichthe bird is considered to be, and (iii) calculates theecho power from the bird in each channel by integrat-ing the signal from the full bird return. The last stepis needed because the trigger jitter and the impulseresponse of the PMTs might differ slightly betweenchannels. The peak-height alone could therefore bemisleading or inaccurate. In Fig. 5, the informationobtained is presented in an isosurface histogramplot. Here the different birds will end up at differentpositions in this three-dimensional (3D) color spaceconstructed with the echo power of the three fluores-cence channels normalized to the depolarized elasticchannel as the axes. The 3D space is divided into 20 ×20 × 20 cubic bins, and, depending on the echo power
Fig. 4. (Color online) Fluorescence spectra from six birds asremotely obtained by the optical multichannel system. a) The spec-tra are averaged over 250 shots and smoothed with a 20-channelfloating average. Included in the figure is also the overall spectraltransmittance in each channel. In these curves are included thetransmittance through all optics after the telescope but not thequantum efficiency of the PMTs. What can be noticed is thatthe UV channel also has some transmittance in the yellow region.However, the lower quantum efficiency of the PMT in this region,in combination with the low emission from β-keratin here, makesthe contribution from this region to the total signal small. b) Thesame spectra divided with the herring gull spectrum.
10 July 2011 / Vol. 50, No. 20 / APPLIED OPTICS 3403
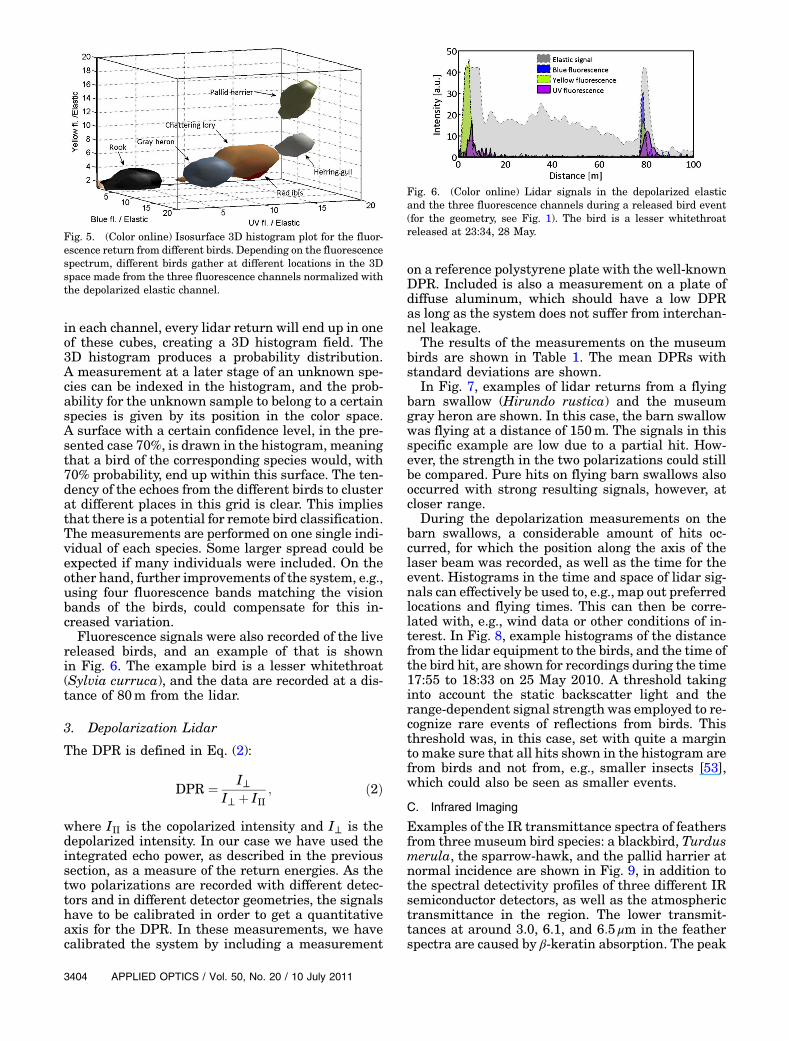
in each channel, every lidar return will end up in oneof these cubes, creating a 3D histogram field. The3D histogram produces a probability distribution.A measurement at a later stage of an unknown spe-cies can be indexed in the histogram, and the prob-ability for the unknown sample to belong to a certainspecies is given by its position in the color space.A surface with a certain confidence level, in the pre-sented case 70%, is drawn in the histogram, meaningthat a bird of the corresponding species would, with70% probability, end up within this surface. The ten-dency of the echoes from the different birds to clusterat different places in this grid is clear. This impliesthat there is a potential for remote bird classification.The measurements are performed on one single indi-vidual of each species. Some larger spread could beexpected if many individuals were included. On theother hand, further improvements of the system, e.g.,using four fluorescence bands matching the visionbands of the birds, could compensate for this in-creased variation.
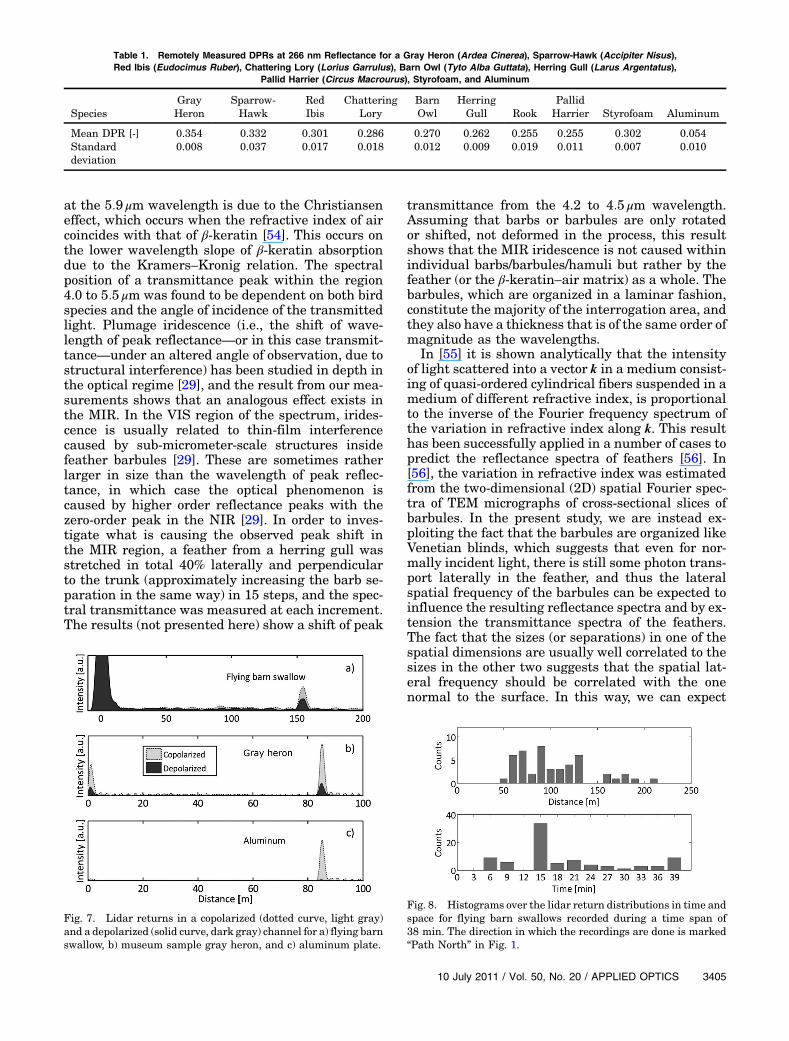
Fluorescence signals were also recorded of the livereleased birds, and an example of that is shownin Fig. 6. The example bird is a lesser whitethroat(Sylvia curruca), and the data are recorded at a dis-tance of 80m from the lidar.
3. Depolarization Lidar
The DPR is defined in Eq. (2):
DPR ¼ I⊥I⊥ þ III
; ð2Þ
where III is the copolarized intensity and I⊥ is thedepolarized intensity. In our case we have used theintegrated echo power, as described in the previoussection, as a measure of the return energies. As thetwo polarizations are recorded with different detec-tors and in different detector geometries, the signalshave to be calibrated in order to get a quantitativeaxis for the DPR. In these measurements, we havecalibrated the system by including a measurement
on a reference polystyrene plate with the well-knownDPR. Included is also a measurement on a plate ofdiffuse aluminum, which should have a low DPRas long as the system does not suffer from interchan-nel leakage.
The results of the measurements on the museumbirds are shown in Table 1. The mean DPRs withstandard deviations are shown.
In Fig. 7, examples of lidar returns from a flyingbarn swallow (Hirundo rustica) and the museumgray heron are shown. In this case, the barn swallowwas flying at a distance of 150m. The signals in thisspecific example are low due to a partial hit. How-ever, the strength in the two polarizations could stillbe compared. Pure hits on flying barn swallows alsooccurred with strong resulting signals, however, atcloser range.
During the depolarization measurements on thebarn swallows, a considerable amount of hits oc-curred, for which the position along the axis of thelaser beam was recorded, as well as the time for theevent. Histograms in the time and space of lidar sig-nals can effectively be used to, e.g., map out preferredlocations and flying times. This can then be corre-lated with, e.g., wind data or other conditions of in-terest. In Fig. 8, example histograms of the distancefrom the lidar equipment to the birds, and the time ofthe bird hit, are shown for recordings during the time17:55 to 18:33 on 25 May 2010. A threshold takinginto account the static backscatter light and therange-dependent signal strength was employed to re-cognize rare events of reflections from birds. Thisthreshold was, in this case, set with quite a marginto make sure that all hits shown in the histogram arefrom birds and not from, e.g., smaller insects [53],which could also be seen as smaller events.
C. Infrared Imaging
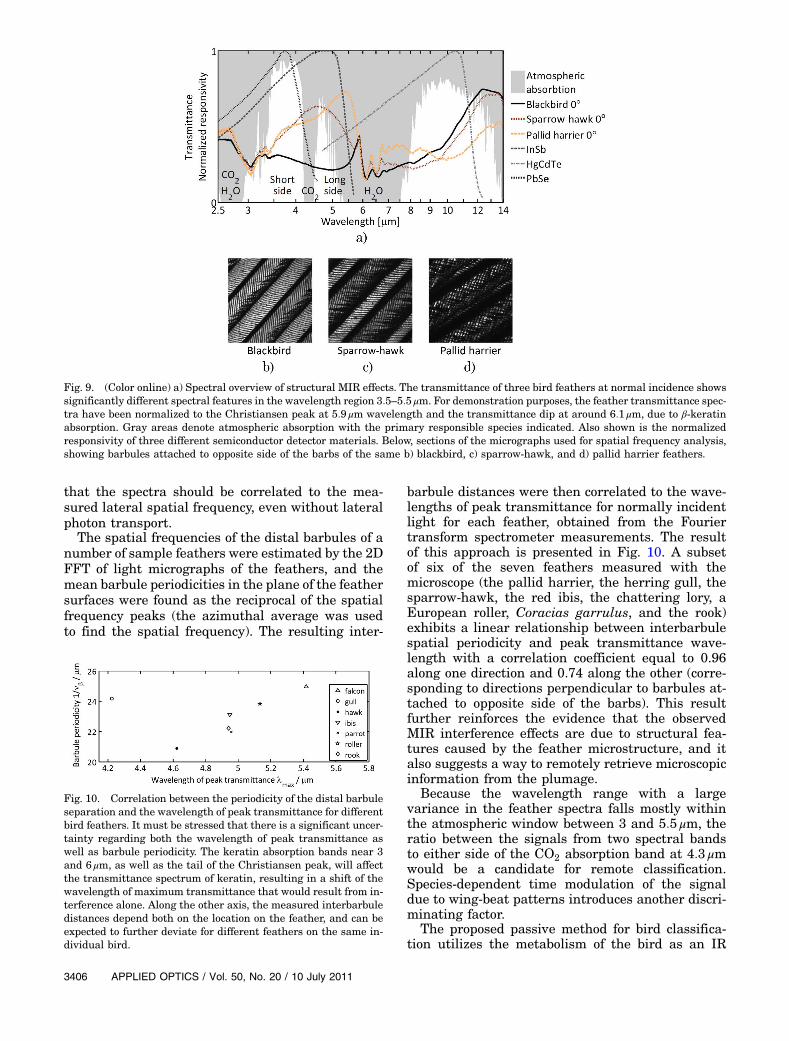
Examples of the IR transmittance spectra of feathersfrom three museum bird species: a blackbird, Turdusmerula, the sparrow-hawk, and the pallid harrier atnormal incidence are shown in Fig. 9, in addition tothe spectral detectivity profiles of three different IRsemiconductor detectors, as well as the atmospherictransmittance in the region. The lower transmit-tances at around 3.0, 6.1, and 6:5 μm in the featherspectra are caused by β-keratin absorption. The peak
Fig. 6. (Color online) Lidar signals in the depolarized elasticand the three fluorescence channels during a released bird event(for the geometry, see Fig. 1). The bird is a lesser whitethroatreleased at 23:34, 28 May.Fig. 5. (Color online) Isosurface 3D histogram plot for the fluor-
escence return from different birds. Depending on the fluorescencespectrum, different birds gather at different locations in the 3Dspace made from the three fluorescence channels normalized withthe depolarized elastic channel.
3404 APPLIED OPTICS / Vol. 50, No. 20 / 10 July 2011
at the 5:9 μm wavelength is due to the Christianseneffect, which occurs when the refractive index of aircoincides with that of β-keratin [54]. This occurs onthe lower wavelength slope of β-keratin absorptiondue to the Kramers–Kronig relation. The spectralposition of a transmittance peak within the region4.0 to 5:5 μm was found to be dependent on both birdspecies and the angle of incidence of the transmittedlight. Plumage iridescence (i.e., the shift of wave-length of peak reflectance—or in this case transmit-tance—under an altered angle of observation, due tostructural interference) has been studied in depth inthe optical regime [29], and the result from our mea-surements shows that an analogous effect exists inthe MIR. In the VIS region of the spectrum, irides-cence is usually related to thin-film interferencecaused by sub-micrometer-scale structures insidefeather barbules [29]. These are sometimes ratherlarger in size than the wavelength of peak reflec-tance, in which case the optical phenomenon iscaused by higher order reflectance peaks with thezero-order peak in the NIR [29]. In order to inves-tigate what is causing the observed peak shift inthe MIR region, a feather from a herring gull wasstretched in total 40% laterally and perpendicularto the trunk (approximately increasing the barb se-paration in the same way) in 15 steps, and the spec-tral transmittance was measured at each increment.The results (not presented here) show a shift of peak
transmittance from the 4.2 to 4:5 μm wavelength.Assuming that barbs or barbules are only rotatedor shifted, not deformed in the process, this resultshows that the MIR iridescence is not caused withinindividual barbs/barbules/hamuli but rather by thefeather (or the β-keratin–air matrix) as a whole. Thebarbules, which are organized in a laminar fashion,constitute the majority of the interrogation area, andthey also have a thickness that is of the same order ofmagnitude as the wavelengths.
In [55] it is shown analytically that the intensityof light scattered into a vector k in a medium consist-ing of quasi-ordered cylindrical fibers suspended in amedium of different refractive index, is proportionalto the inverse of the Fourier frequency spectrum ofthe variation in refractive index along k. This resulthas been successfully applied in a number of cases topredict the reflectance spectra of feathers [56]. In[56], the variation in refractive index was estimatedfrom the two-dimensional (2D) spatial Fourier spec-tra of TEM micrographs of cross-sectional slices ofbarbules. In the present study, we are instead ex-ploiting the fact that the barbules are organized likeVenetian blinds, which suggests that even for nor-mally incident light, there is still some photon trans-port laterally in the feather, and thus the lateralspatial frequency of the barbules can be expected toinfluence the resulting reflectance spectra and by ex-tension the transmittance spectra of the feathers.The fact that the sizes (or separations) in one of thespatial dimensions are usually well correlated to thesizes in the other two suggests that the spatial lat-eral frequency should be correlated with the onenormal to the surface. In this way, we can expect
Fig. 8. Histograms over the lidar return distributions in time andspace for flying barn swallows recorded during a time span of38 min. The direction in which the recordings are done is marked“Path North” in Fig. 1.
Fig. 7. Lidar returns in a copolarized (dotted curve, light gray)and a depolarized (solid curve, dark gray) channel for a) flying barnswallow, b) museum sample gray heron, and c) aluminum plate.
Table 1. Remotely Measured DPRs at 266 nm Reflectance for a Gray Heron (Ardea Cinerea), Sparrow-Hawk (Accipiter Nisus),Red Ibis (Eudocimus Ruber), Chattering Lory (Lorius Garrulus), Barn Owl (Tyto Alba Guttata), Herring Gull (Larus Argentatus),
Pallid Harrier (Circus Macrourus), Styrofoam, and Aluminum
SpeciesGrayHeron
Sparrow-Hawk
RedIbis
ChatteringLory
BarnOwl
HerringGull Rook
PallidHarrier Styrofoam Aluminum
Mean DPR [-] 0.354 0.332 0.301 0.286 0.270 0.262 0.255 0.255 0.302 0.054Standarddeviation
0.008 0.037 0.017 0.018 0.012 0.009 0.019 0.011 0.007 0.010
10 July 2011 / Vol. 50, No. 20 / APPLIED OPTICS 3405
that the spectra should be correlated to the mea-sured lateral spatial frequency, even without lateralphoton transport.
The spatial frequencies of the distal barbules of anumber of sample feathers were estimated by the 2DFFT of light micrographs of the feathers, and themean barbule periodicities in the plane of the feathersurfaces were found as the reciprocal of the spatialfrequency peaks (the azimuthal average was usedto find the spatial frequency). The resulting inter-
barbule distances were then correlated to the wave-lengths of peak transmittance for normally incidentlight for each feather, obtained from the Fouriertransform spectrometer measurements. The resultof this approach is presented in Fig. 10. A subsetof six of the seven feathers measured with themicroscope (the pallid harrier, the herring gull, thesparrow-hawk, the red ibis, the chattering lory, aEuropean roller, Coracias garrulus, and the rook)exhibits a linear relationship between interbarbulespatial periodicity and peak transmittance wave-length with a correlation coefficient equal to 0.96along one direction and 0.74 along the other (corre-sponding to directions perpendicular to barbules at-tached to opposite side of the barbs). This resultfurther reinforces the evidence that the observedMIR interference effects are due to structural fea-tures caused by the feather microstructure, and italso suggests a way to remotely retrieve microscopicinformation from the plumage.
Because the wavelength range with a largevariance in the feather spectra falls mostly withinthe atmospheric window between 3 and 5:5 μm, theratio between the signals from two spectral bandsto either side of the CO2 absorption band at 4:3 μmwould be a candidate for remote classification.Species-dependent time modulation of the signaldue to wing-beat patterns introduces another discri-minating factor.
The proposed passive method for bird classifica-tion utilizes the metabolism of the bird as an IR
Fig. 10. Correlation between the periodicity of the distal barbuleseparation and the wavelength of peak transmittance for differentbird feathers. It must be stressed that there is a significant uncer-tainty regarding both the wavelength of peak transmittance aswell as barbule periodicity. The keratin absorption bands near 3and 6 μm, as well as the tail of the Christiansen peak, will affectthe transmittance spectrum of keratin, resulting in a shift of thewavelength of maximum transmittance that would result from in-terference alone. Along the other axis, the measured interbarbuledistances depend both on the location on the feather, and can beexpected to further deviate for different feathers on the same in-dividual bird.
Fig. 9. (Color online) a) Spectral overview of structural MIR effects. The transmittance of three bird feathers at normal incidence showssignificantly different spectral features in the wavelength region 3:5–5:5 μm. For demonstration purposes, the feather transmittance spec-tra have been normalized to the Christiansen peak at 5:9 μm wavelength and the transmittance dip at around 6:1 μm, due to β-keratinabsorption. Gray areas denote atmospheric absorption with the primary responsible species indicated. Also shown is the normalizedresponsivity of three different semiconductor detector materials. Below, sections of the micrographs used for spatial frequency analysis,showing barbules attached to opposite side of the barbs of the same b) blackbird, c) sparrow-hawk, and d) pallid harrier feathers.
3406 APPLIED OPTICS / Vol. 50, No. 20 / 10 July 2011
source, with an intensity distribution assumed to bethat of a blackbody, and the cold sky as background.Spectral emissivity within an atmospheric windowis low by definition, and the radiation emitted alongthe atmospheric path can therefore be neglected.Observations at elevation angles close to vertical willminimize the atmospheric path length and radiance.The choice of wavelength region also means thatthe resulting atmospheric scattering will be low com-pared to shorter wavelengths, further increasing thesignal-to-noise ratio.
In a simplified model, the detector signal fromlight transmitted in a spectral band, b, is given byEq. (3):
Lb ¼Z
LðλÞTðλÞSbðλÞdλ; ð3Þ
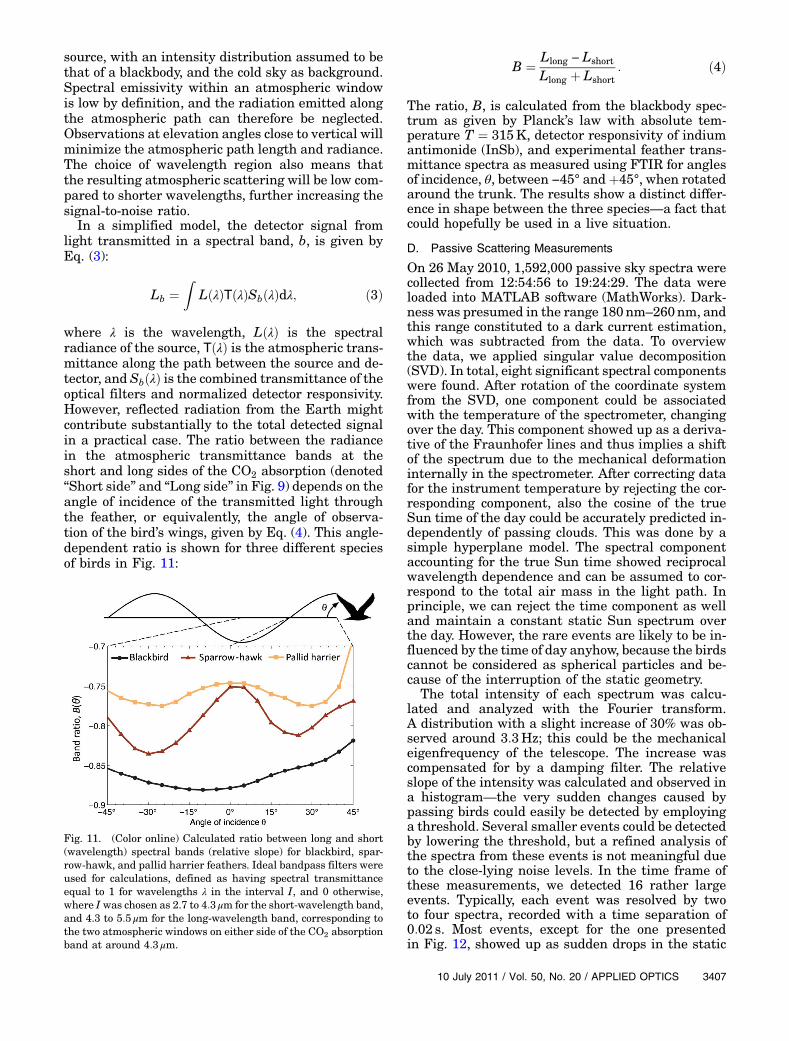
where λ is the wavelength, LðλÞ is the spectralradiance of the source, TðλÞ is the atmospheric trans-mittance along the path between the source and de-tector, and SbðλÞ is the combined transmittance of theoptical filters and normalized detector responsivity.However, reflected radiation from the Earth mightcontribute substantially to the total detected signalin a practical case. The ratio between the radiancein the atmospheric transmittance bands at theshort and long sides of the CO2 absorption (denoted“Short side” and “Long side” in Fig. 9) depends on theangle of incidence of the transmitted light throughthe feather, or equivalently, the angle of observa-tion of the bird’s wings, given by Eq. (4). This angle-dependent ratio is shown for three different speciesof birds in Fig. 11:
B ¼ Llong − Lshort
Llong þ Lshort: ð4Þ
The ratio, B, is calculated from the blackbody spec-trum as given by Planck’s law with absolute tem-perature T ¼ 315K, detector responsivity of indiumantimonide (InSb), and experimental feather trans-mittance spectra as measured using FTIR for anglesof incidence, θ, between −45° and þ45°, when rotatedaround the trunk. The results show a distinct differ-ence in shape between the three species—a fact thatcould hopefully be used in a live situation.
D. Passive Scattering Measurements
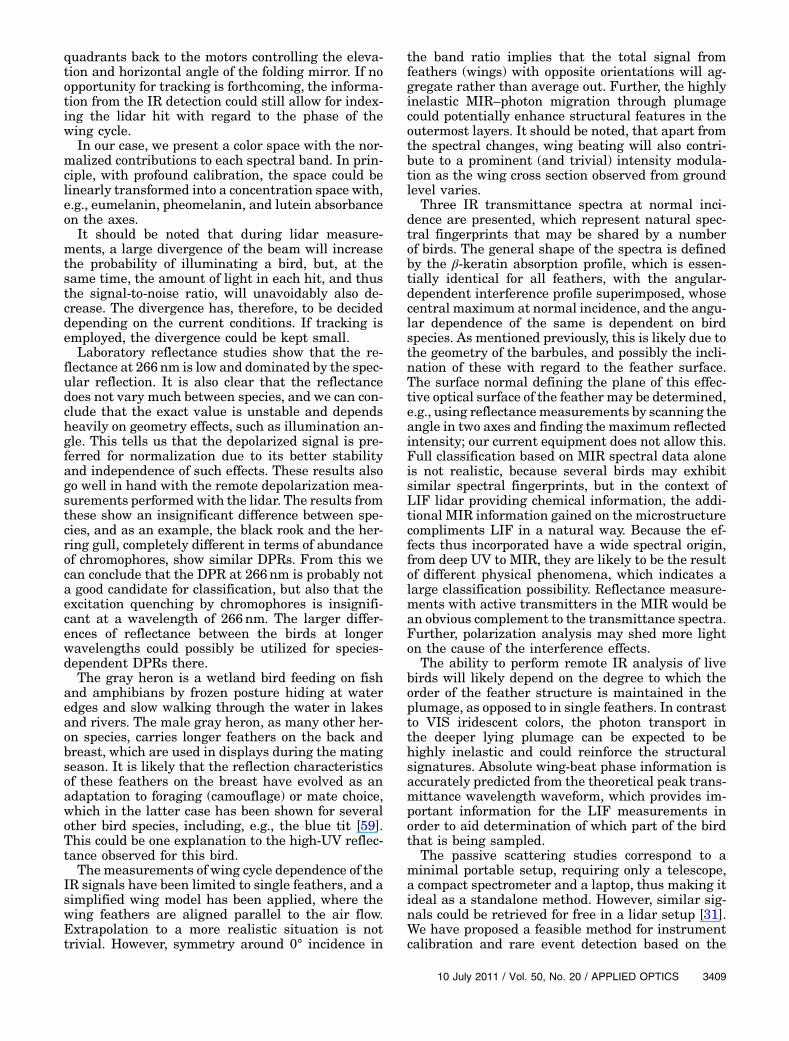
On 26 May 2010, 1,592,000 passive sky spectra werecollected from 12:54:56 to 19:24:29. The data wereloaded into MATLAB software (MathWorks). Dark-ness was presumed in the range 180nm–260nm, andthis range constituted to a dark current estimation,which was subtracted from the data. To overviewthe data, we applied singular value decomposition(SVD). In total, eight significant spectral componentswere found. After rotation of the coordinate systemfrom the SVD, one component could be associatedwith the temperature of the spectrometer, changingover the day. This component showed up as a deriva-tive of the Fraunhofer lines and thus implies a shiftof the spectrum due to the mechanical deformationinternally in the spectrometer. After correcting datafor the instrument temperature by rejecting the cor-responding component, also the cosine of the trueSun time of the day could be accurately predicted in-dependently of passing clouds. This was done by asimple hyperplane model. The spectral componentaccounting for the true Sun time showed reciprocalwavelength dependence and can be assumed to cor-respond to the total air mass in the light path. Inprinciple, we can reject the time component as welland maintain a constant static Sun spectrum overthe day. However, the rare events are likely to be in-fluenced by the time of day anyhow, because the birdscannot be considered as spherical particles and be-cause of the interruption of the static geometry.
The total intensity of each spectrum was calcu-lated and analyzed with the Fourier transform.A distribution with a slight increase of 30% was ob-served around 3:3Hz; this could be the mechanicaleigenfrequency of the telescope. The increase wascompensated for by a damping filter. The relativeslope of the intensity was calculated and observed ina histogram—the very sudden changes caused bypassing birds could easily be detected by employinga threshold. Several smaller events could be detectedby lowering the threshold, but a refined analysis ofthe spectra from these events is not meaningful dueto the close-lying noise levels. In the time frame ofthese measurements, we detected 16 rather largeevents. Typically, each event was resolved by twoto four spectra, recorded with a time separation of0:02 s. Most events, except for the one presentedin Fig. 12, showed up as sudden drops in the static
Fig. 11. (Color online) Calculated ratio between long and short(wavelength) spectral bands (relative slope) for blackbird, spar-row-hawk, and pallid harrier feathers. Ideal bandpass filters wereused for calculations, defined as having spectral transmittanceequal to 1 for wavelengths λ in the interval I, and 0 otherwise,where I was chosen as 2.7 to 4:3 μm for the short-wavelength band,and 4.3 to 5:5 μm for the long-wavelength band, corresponding tothe two atmospheric windows on either side of the CO2 absorptionband at around 4:3 μm.
10 July 2011 / Vol. 50, No. 20 / APPLIED OPTICS 3407
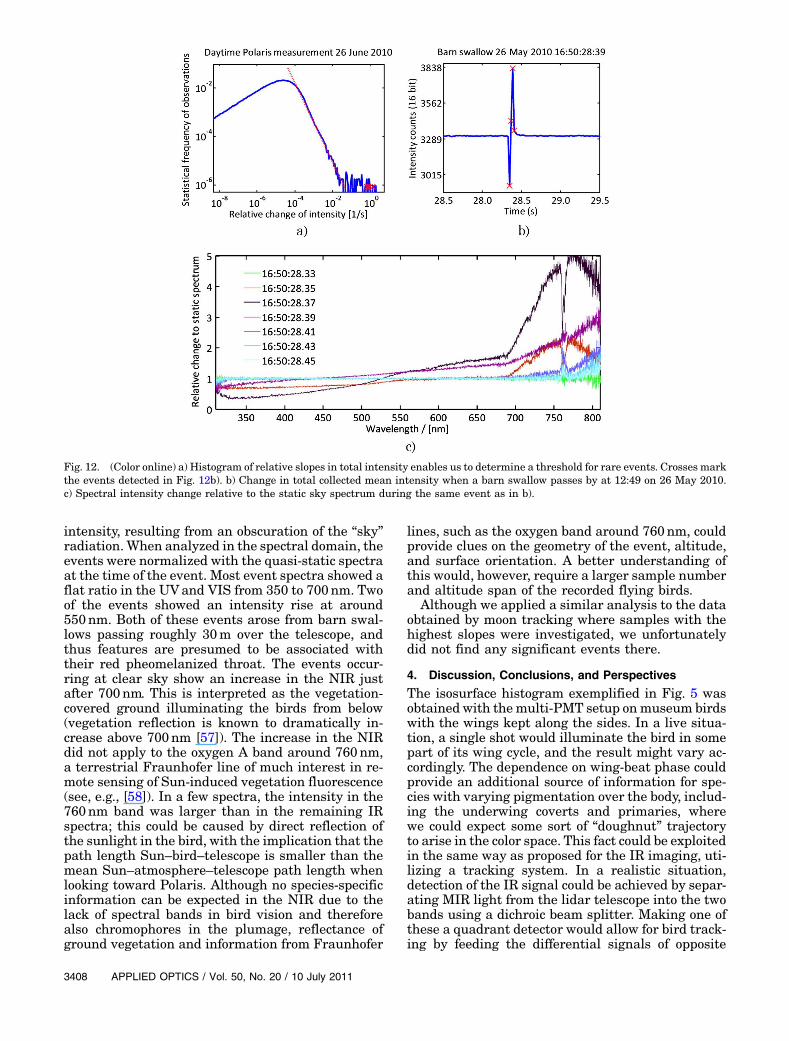
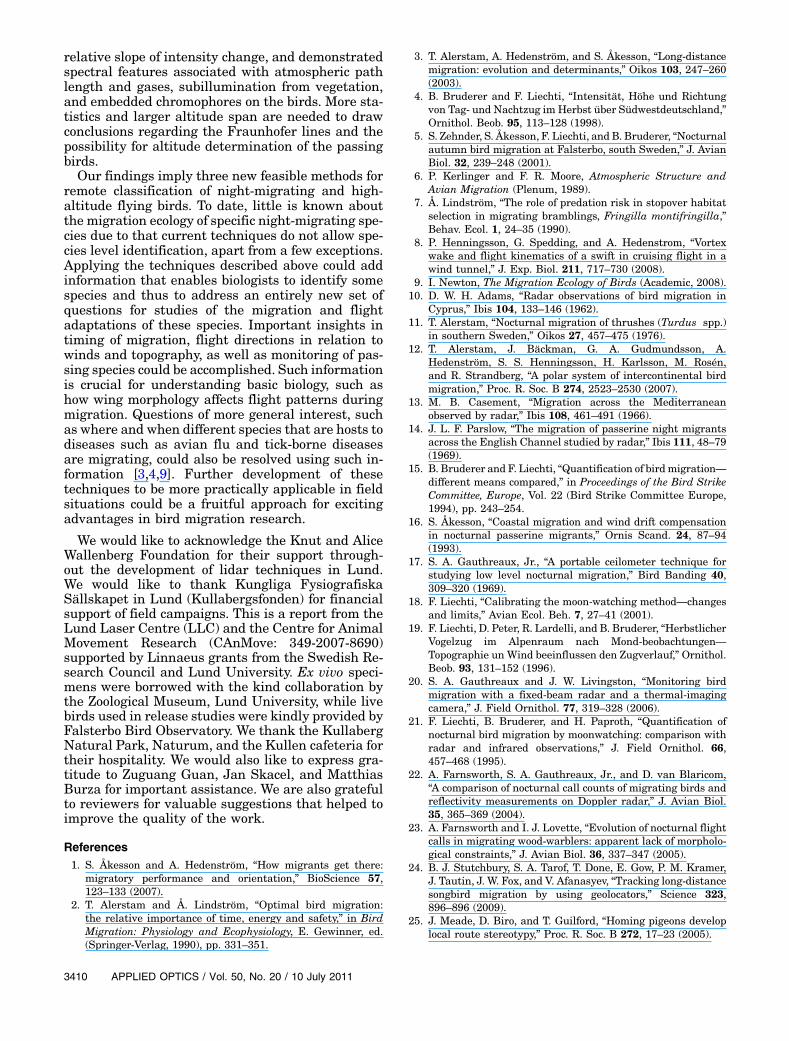
intensity, resulting from an obscuration of the “sky”radiation. When analyzed in the spectral domain, theevents were normalized with the quasi-static spectraat the time of the event. Most event spectra showed aflat ratio in the UVand VIS from 350 to 700nm. Twoof the events showed an intensity rise at around550nm. Both of these events arose from barn swal-lows passing roughly 30m over the telescope, andthus features are presumed to be associated withtheir red pheomelanized throat. The events occur-ring at clear sky show an increase in the NIR justafter 700nm. This is interpreted as the vegetation-covered ground illuminating the birds from below(vegetation reflection is known to dramatically in-crease above 700nm [57]). The increase in the NIRdid not apply to the oxygen A band around 760nm,a terrestrial Fraunhofer line of much interest in re-mote sensing of Sun-induced vegetation fluorescence(see, e.g., [58]). In a few spectra, the intensity in the760nm band was larger than in the remaining IRspectra; this could be caused by direct reflection ofthe sunlight in the bird, with the implication that thepath length Sun–bird–telescope is smaller than themean Sun–atmosphere–telescope path length whenlooking toward Polaris. Although no species-specificinformation can be expected in the NIR due to thelack of spectral bands in bird vision and thereforealso chromophores in the plumage, reflectance ofground vegetation and information from Fraunhofer
lines, such as the oxygen band around 760nm, couldprovide clues on the geometry of the event, altitude,and surface orientation. A better understanding ofthis would, however, require a larger sample numberand altitude span of the recorded flying birds.
Although we applied a similar analysis to the dataobtained by moon tracking where samples with thehighest slopes were investigated, we unfortunatelydid not find any significant events there.
4. Discussion, Conclusions, and Perspectives
The isosurface histogram exemplified in Fig. 5 wasobtained with themulti-PMT setup onmuseum birdswith the wings kept along the sides. In a live situa-tion, a single shot would illuminate the bird in somepart of its wing cycle, and the result might vary ac-cordingly. The dependence on wing-beat phase couldprovide an additional source of information for spe-cies with varying pigmentation over the body, includ-ing the underwing coverts and primaries, wherewe could expect some sort of “doughnut” trajectoryto arise in the color space. This fact could be exploitedin the same way as proposed for the IR imaging, uti-lizing a tracking system. In a realistic situation,detection of the IR signal could be achieved by separ-ating MIR light from the lidar telescope into the twobands using a dichroic beam splitter. Making one ofthese a quadrant detector would allow for bird track-ing by feeding the differential signals of opposite
Fig. 12. (Color online) a) Histogram of relative slopes in total intensity enables us to determine a threshold for rare events. Crosses markthe events detected in Fig. 12b). b) Change in total collected mean intensity when a barn swallow passes by at 12:49 on 26 May 2010.c) Spectral intensity change relative to the static sky spectrum during the same event as in b).
3408 APPLIED OPTICS / Vol. 50, No. 20 / 10 July 2011
quadrants back to the motors controlling the eleva-tion and horizontal angle of the folding mirror. If noopportunity for tracking is forthcoming, the informa-tion from the IR detection could still allow for index-ing the lidar hit with regard to the phase of thewing cycle.
In our case, we present a color space with the nor-malized contributions to each spectral band. In prin-ciple, with profound calibration, the space could belinearly transformed into a concentration space with,e.g., eumelanin, pheomelanin, and lutein absorbanceon the axes.
It should be noted that during lidar measure-ments, a large divergence of the beam will increasethe probability of illuminating a bird, but, at thesame time, the amount of light in each hit, and thusthe signal-to-noise ratio, will unavoidably also de-crease. The divergence has, therefore, to be decideddepending on the current conditions. If tracking isemployed, the divergence could be kept small.
Laboratory reflectance studies show that the re-flectance at 266nm is low and dominated by the spec-ular reflection. It is also clear that the reflectancedoes not vary much between species, and we can con-clude that the exact value is unstable and dependsheavily on geometry effects, such as illumination an-gle. This tells us that the depolarized signal is pre-ferred for normalization due to its better stabilityand independence of such effects. These results alsogo well in hand with the remote depolarization mea-surements performed with the lidar. The results fromthese show an insignificant difference between spe-cies, and as an example, the black rook and the her-ring gull, completely different in terms of abundanceof chromophores, show similar DPRs. From this wecan conclude that the DPR at 266nm is probably nota good candidate for classification, but also that theexcitation quenching by chromophores is insignifi-cant at a wavelength of 266nm. The larger differ-ences of reflectance between the birds at longerwavelengths could possibly be utilized for species-dependent DPRs there.
The gray heron is a wetland bird feeding on fishand amphibians by frozen posture hiding at wateredges and slow walking through the water in lakesand rivers. The male gray heron, as many other her-on species, carries longer feathers on the back andbreast, which are used in displays during the matingseason. It is likely that the reflection characteristicsof these feathers on the breast have evolved as anadaptation to foraging (camouflage) or mate choice,which in the latter case has been shown for severalother bird species, including, e.g., the blue tit [59].This could be one explanation to the high-UV reflec-tance observed for this bird.
The measurements of wing cycle dependence of theIR signals have been limited to single feathers, and asimplified wing model has been applied, where thewing feathers are aligned parallel to the air flow.Extrapolation to a more realistic situation is nottrivial. However, symmetry around 0° incidence in
the band ratio implies that the total signal fromfeathers (wings) with opposite orientations will ag-gregate rather than average out. Further, the highlyinelastic MIR–photon migration through plumagecould potentially enhance structural features in theoutermost layers. It should be noted, that apart fromthe spectral changes, wing beating will also contri-bute to a prominent (and trivial) intensity modula-tion as the wing cross section observed from groundlevel varies.
Three IR transmittance spectra at normal inci-dence are presented, which represent natural spec-tral fingerprints that may be shared by a numberof birds. The general shape of the spectra is definedby the β-keratin absorption profile, which is essen-tially identical for all feathers, with the angular-dependent interference profile superimposed, whosecentral maximum at normal incidence, and the angu-lar dependence of the same is dependent on birdspecies. As mentioned previously, this is likely due tothe geometry of the barbules, and possibly the incli-nation of these with regard to the feather surface.The surface normal defining the plane of this effec-tive optical surface of the feather may be determined,e.g., using reflectancemeasurements by scanning theangle in two axes and finding the maximum reflectedintensity; our current equipment does not allow this.Full classification based on MIR spectral data aloneis not realistic, because several birds may exhibitsimilar spectral fingerprints, but in the context ofLIF lidar providing chemical information, the addi-tional MIR information gained on the microstructurecompliments LIF in a natural way. Because the ef-fects thus incorporated have a wide spectral origin,from deep UV to MIR, they are likely to be the resultof different physical phenomena, which indicates alarge classification possibility. Reflectance measure-ments with active transmitters in the MIR would bean obvious complement to the transmittance spectra.Further, polarization analysis may shed more lighton the cause of the interference effects.
The ability to perform remote IR analysis of livebirds will likely depend on the degree to which theorder of the feather structure is maintained in theplumage, as opposed to in single feathers. In contrastto VIS iridescent colors, the photon transport inthe deeper lying plumage can be expected to behighly inelastic and could reinforce the structuralsignatures. Absolute wing-beat phase information isaccurately predicted from the theoretical peak trans-mittance wavelength waveform, which provides im-portant information for the LIF measurements inorder to aid determination of which part of the birdthat is being sampled.
The passive scattering studies correspond to aminimal portable setup, requiring only a telescope,a compact spectrometer and a laptop, thus making itideal as a standalone method. However, similar sig-nals could be retrieved for free in a lidar setup [31].We have proposed a feasible method for instrumentcalibration and rare event detection based on the
10 July 2011 / Vol. 50, No. 20 / APPLIED OPTICS 3409
relative slope of intensity change, and demonstratedspectral features associated with atmospheric pathlength and gases, subillumination from vegetation,and embedded chromophores on the birds. More sta-tistics and larger altitude span are needed to drawconclusions regarding the Fraunhofer lines and thepossibility for altitude determination of the passingbirds.
Our findings imply three new feasible methods forremote classification of night-migrating and high-altitude flying birds. To date, little is known aboutthe migration ecology of specific night-migrating spe-cies due to that current techniques do not allow spe-cies level identification, apart from a few exceptions.Applying the techniques described above could addinformation that enables biologists to identify somespecies and thus to address an entirely new set ofquestions for studies of the migration and flightadaptations of these species. Important insights intiming of migration, flight directions in relation towinds and topography, as well as monitoring of pas-sing species could be accomplished. Such informationis crucial for understanding basic biology, such ashow wing morphology affects flight patterns duringmigration. Questions of more general interest, suchas where and when different species that are hosts todiseases such as avian flu and tick-borne diseasesare migrating, could also be resolved using such in-formation [3,4,9]. Further development of thesetechniques to be more practically applicable in fieldsituations could be a fruitful approach for excitingadvantages in bird migration research.
We would like to acknowledge the Knut and AliceWallenberg Foundation for their support through-out the development of lidar techniques in Lund.We would like to thank Kungliga FysiografiskaSällskapet in Lund (Kullabergsfonden) for financialsupport of field campaigns. This is a report from theLund Laser Centre (LLC) and the Centre for AnimalMovement Research (CAnMove: 349-2007-8690)supported by Linnaeus grants from the Swedish Re-search Council and Lund University. Ex vivo speci-mens were borrowed with the kind collaboration bythe Zoological Museum, Lund University, while livebirds used in release studies were kindly provided byFalsterbo Bird Observatory. We thank the KullabergNatural Park, Naturum, and the Kullen cafeteria fortheir hospitality. We would also like to express gra-titude to Zuguang Guan, Jan Skacel, and MatthiasBurza for important assistance. We are also gratefulto reviewers for valuable suggestions that helped toimprove the quality of the work.
References1. S. Åkesson and A. Hedenström, “How migrants get there:
migratory performance and orientation,” BioScience 57,123–133 (2007).
2. T. Alerstam and Å. Lindström, “Optimal bird migration:the relative importance of time, energy and safety,” in BirdMigration: Physiology and Ecophysiology, E. Gewinner, ed.(Springer-Verlag, 1990), pp. 331–351.
3. T. Alerstam, A. Hedenström, and S. Åkesson, “Long-distancemigration: evolution and determinants,” Oikos 103, 247–260(2003).
4. B. Bruderer and F. Liechti, “Intensität, Höhe und Richtungvon Tag- und Nachtzug im Herbst über Südwestdeutschland,”Ornithol. Beob. 95, 113–128 (1998).
5. S. Zehnder, S. Åkesson, F. Liechti, and B. Bruderer, “Nocturnalautumn bird migration at Falsterbo, south Sweden,” J. AvianBiol. 32, 239–248 (2001).
6. P. Kerlinger and F. R. Moore, Atmospheric Structure andAvian Migration (Plenum, 1989).
7. Å. Lindström, “The role of predation risk in stopover habitatselection in migrating bramblings, Fringilla montifringilla,”Behav. Ecol. 1, 24–35 (1990).
8. P. Henningsson, G. Spedding, and A. Hedenstrom, “Vortexwake and flight kinematics of a swift in cruising flight in awind tunnel,” J. Exp. Biol. 211, 717–730 (2008).
9. I. Newton, The Migration Ecology of Birds (Academic, 2008).10. D. W. H. Adams, “Radar observations of bird migration in
Cyprus,” Ibis 104, 133–146 (1962).11. T. Alerstam, “Nocturnal migration of thrushes (Turdus spp.)
in southern Sweden,” Oikos 27, 457–475 (1976).12. T. Alerstam, J. Bäckman, G. A. Gudmundsson, A.
Hedenström, S. S. Henningsson, H. Karlsson, M. Rosén,and R. Strandberg, “A polar system of intercontinental birdmigration,” Proc. R. Soc. B 274, 2523–2530 (2007).
13. M. B. Casement, “Migration across the Mediterraneanobserved by radar,” Ibis 108, 461–491 (1966).
14. J. L. F. Parslow, “The migration of passerine night migrantsacross the English Channel studied by radar,” Ibis 111, 48–79(1969).
15. B. Bruderer and F. Liechti, “Quantification of birdmigration—different means compared,” in Proceedings of the Bird StrikeCommittee, Europe, Vol. 22 (Bird Strike Committee Europe,1994), pp. 243–254.
16. S. Åkesson, “Coastal migration and wind drift compensationin nocturnal passerine migrants,” Ornis Scand. 24, 87–94(1993).
17. S. A. Gauthreaux, Jr., “A portable ceilometer technique forstudying low level nocturnal migration,” Bird Banding 40,309–320 (1969).
18. F. Liechti, “Calibrating the moon-watching method—changesand limits,” Avian Ecol. Beh. 7, 27–41 (2001).
19. F. Liechti, D. Peter, R. Lardelli, and B. Bruderer, “HerbstlicherVogelzug im Alpenraum nach Mond-beobachtungen—Topographie un Wind beeinflussen den Zugverlauf,” Ornithol.Beob. 93, 131–152 (1996).
20. S. A. Gauthreaux and J. W. Livingston, “Monitoring birdmigration with a fixed-beam radar and a thermal-imagingcamera,” J. Field Ornithol. 77, 319–328 (2006).
21. F. Liechti, B. Bruderer, and H. Paproth, “Quantification ofnocturnal bird migration by moonwatching: comparison withradar and infrared observations,” J. Field Ornithol. 66,457–468 (1995).
22. A. Farnsworth, S. A. Gauthreaux, Jr., and D. van Blaricom,“A comparison of nocturnal call counts of migrating birds andreflectivity measurements on Doppler radar,” J. Avian Biol.35, 365–369 (2004).
23. A. Farnsworth and I. J. Lovette, “Evolution of nocturnal flightcalls in migrating wood-warblers: apparent lack of morpholo-gical constraints,” J. Avian Biol. 36, 337–347 (2005).
24. B. J. Stutchbury, S. A. Tarof, T. Done, E. Gow, P. M. Kramer,J. Tautin, J. W. Fox, and V. Afanasyev, “Tracking long-distancesongbird migration by using geolocators,” Science 323,896–896 (2009).
25. J. Meade, D. Biro, and T. Guilford, “Homing pigeons developlocal route stereotypy,” Proc. R. Soc. B 272, 17–23 (2005).
3410 APPLIED OPTICS / Vol. 50, No. 20 / 10 July 2011
26. T. Alerstam, M. Rosén, J. Bäckman, P. G. Ericson, andO. Hellgren, “Flight speeds among bird species: allometricand phylogenetic effects,” PLos Biol. 5, 1656–1662 (2007).
27. J. Bäckman and T. Alerstam, “Confronting the winds: orienta-tion and flight behaviour of roosting swifts, Apus apus,” Proc.R. Soc. B 268, 1081–1087 (2001).
28. B. Bruderer and E. Weitnauer, “Radarbeobachtungen überZug und Nachtflüge des Mauerseglers (Apus Apus),” Rev.Suisse Zool. 79, 1190–1200 (1972).
29. G. E. Hill and K. J. McGraw, Bird Coloration, Mechanismsand Measurements, Vol. 1 (Harvard University Press, 2006).
30. H. Noh, S. F. Liew, V. Saranathan, S. G. J. Mochrie, R. O. Prum,E. R. Dufresne, and H. Cao, “How noniridescent colors aregenerated by quasi-ordered structures of bird feathers,”Adv. Mat. 22, 2871–288 (2010).
31. M. Brydegaard, P. Lundin, Z. G. Guan, A. Runemark, S.Åkesson, and S. Svanberg, “Feasibility study: fluorescencelidar for remote bird classification,” Appl. Opt. 49, 4531–4544(2010).
32. M. A. Mycek and B. W. Pogue, eds., Handbook of BiomedicalFluorescence (CRC Press, 2003).
33. N. Takeuchi, “Elastic lidar measurement of the troposphere,”in Laser Remote Sensing, T. Fujii and T. Fukuchi, eds. (CRCPress, 2005), pp. 63–122.
34. C. M. R. Platt, J. C. Scott, and A. C. Dilley, “Remote soundingof high clouds. part VI: optical properties of mid-latitude andtropical cirrus,” J. Atmos. Sci. 44, 729–747 (1987).
35. R. G. Strauch, V. E. Derr, and R. E. Cupp, “Atmospherictemperature measurement using Raman backscatter,” Appl.Opt. 10, 2665–2669 (1971).
36. G. Benedetti-Michelangeli, F. Gongeduti, and G. Fiocco,“Measurement of aerosol motion and wind velocity in thelower troposphere by Doppler optical radar,” J. Atmos. Sci. 29,906–910 (1972).
37. R. Grönlund, M. Sjöholm, P. Weibring, H. Edner, and S.Svanberg, “Elemental mercury emissions from chlor-alkaliplants measured by lidar techniques,” Atmos. Environ. 39,7474–7480 (2005).
38. N. Menyuk, D. K. Killinger, andW. E. DeFeo, “Remote sensingof NO using a differential lidar,” Appl. Opt. 19, 3282–3286(1980).
39. Z. G. Guan, P. Lundin, L. Mei, G. Somesfalean, and S.Svanberg, “Vertical lidar sounding of atomic mercury andnitric oxide in a major Chinese city,” Appl. Phys. B 101,465–470 (2010).
40. J. Gelbwachs and M. Birnbaum, “Fluorescence of atmosphericaerosols and lidar implications,” Appl. Opt. 12, 2442–2447(1973).
41. P. Weibring, T. Johansson, H. Edner, S. Svanberg, B. Sundnér,V. Raimondi, G. Cecchi, and L. Pantani, “Fluorescence lidarimaging of historical monuments,” Appl. Opt. 40, 6111–6120(2001).
42. A. Ounis, Z. G. Cerovic, J. M. Briantais, and I. Moya, “DE-FLIDAR: a new remote sensing instrument for estimationof epidermal UV absorption in leaves and canopies,” inProceedings of the European Association of Remote
Sensing Laboratories (EARSeL)-SIGWorkshop LIDAR, Vol. 1(EARSeL, 2000), pp. 196–204.
43. S. Svanberg, “LIDAR,” in Springer Handbook of Lasers andOptics, F. Träger, ed. (Springer-Verlag, 2007), pp. 1031–1052.
44. T. Fujii and T. Fukuchi, eds., Laser Remote Sensing (CRCPress, 2005).
45. R. B. Bradbury, R. A. Hill, D. C. Mason, S. A. Hinsley, J. D.Wilson, H. Balzter, G. Q. A. Anderson, M. J. Whittingham,I. J. Davenport, and P. E. Bellamy, “Modelling relationshipsbetween birds and vegetation structure using airborne lidardata: a review with case studies from agricultural and wood-land environments,” Ibis 147, 443–452 (2005).
46. R. Clawges, K. Vierling, L. Vierling, and E. Rowell, “The use ofairborne lidar to assess avian species diversity, density, andoccurrence in a pine/aspen forest,” Remote Sens. Environ.112, 2064–2073 (2008).
47. N. E. Seavy, J. H. Viers, and J. K. Wood, “Riparian birdresponse to vegetation structure: a multiscale analysisusing lidar measurements of canopy height,” Ecol. Appl. 19,1848–1857 (2009).
48. P. Weibring, H. Edner, and S. Svanberg, “Versatile mobilelidar system for environmental monitoring,” Appl. Opt. 42,3583–3594 (2003).
49. R. O. Prum, “Anatomy, physics and evolution of structuralcolors,” in Bird Coloration, Mechanisms and Measurements,G. E. Hill and K. J. McGraw, eds., Vol. 1 (Harvard UniversityPress, 2006), pp. 295–354.
50. M. Srinivasarau, “Nano-optics in the biological world,” Chem.Rev. 99, 1935–1961 (1999).
51. C. Giacovazzo, H. L. Monaco, G. Artioli, D. Viterbo, G.Ferraris, G. Gilli, G. Zanotti, and M. Catti, Fundamentalsof Crystallography (Oxford University Press, 2002).
52. N. S. Hart, J. C. Partridge, and I. C. Cuthill, “Visual pigments,cone oil droplets and cone photoreceptor distribution inthe European starling (Sturnus vulgaris),” J. Exp. Biol. 201,1433–1446 (1998).
53. Z. G. Guan, M. Brydegaard, P. Lundin, M. Wellenreuther,A. Runemark, E. I. Svensson, and S. Svanberg, “Insect mon-itoring with fluorescence lidar techniques: field experiments,”Appl. Opt. 49, 5133–5142 (2010).
54. C.V. Raman, “The theory of the Christiansen experiment,”Proc. Indian Acad. Sci. A29, 381–390 (1949).
55. G. B. Benedek, “Theory of transparency of the eye,” Appl. Opt.10, 459–473 (1971).
56. R. O. Prum and R. H. Torres, “A Fourier tool for the analysisof coherent light scattering by bio-optical nanostructures,”Integr. Comp. Biol. 43, 591–602 (2003).
57. S. Svanberg, Atomic and Molecular Spectroscopy—BasicAspects and Practical Applications, 4th ed. (Springer-Verlag,2004).
58. U. Rascher, B. Gioli, and F.Miglietta, “FLEX—fluorescence ex-plorer: a remote sensing approach to quantify spatio-temporalvariations of photosynthetic efficiency from space,” Photo-synth. Res. 91, 293–294 (2007).
59. S. Hunt, A. T. Bennett, I. C. Cuthill, and R. Griffiths, “Blue titsare ultraviolet tits,” Proc. R. Soc. Lond. B 265, 451–455 (1998).
10 July 2011 / Vol. 50, No. 20 / APPLIED OPTICS 3411
Copyright © 2022 FDOKUMEN